Article

Re–Os and Sr Isotopic Study of Permian–Triassic Sedimentary Rocks from the Himalaya: Shale Chronology and Carbonate Diagenesis

1
Department of Earth and Climate Science, Indian Institute of Science Education and Research (IISER), Dr. Homi Bhabha Road, Pune 411008, India
2
Physical Research Laboratory, Navarangpura, Ahmedabad 380009, India
3
Institute of Geology of The Czech Academy of Sciences, 165 00 Prague, Czech Republic
4
Wadia Institute of Himalayan Geology, 33 GMS Road, Dehradun 248001, India
5
Department of Geology, University of Ladakh, Leh 194101, India
*
Author to whom correspondence should be addressed.
Minerals 2021, 11(4), 417; https://doi.org/10.3390/min11040417
Submission received: 22 February 2021 / Revised: 5 April 2021 / Accepted: 6 April 2021 / Published: 15 April 2021
(This article belongs to the Special Issue Timing, Duration, and Causes of Mass Extinctions)

Abstract

:
Sedimentary rocks from the Himalayas are well-preserved archives of the Neo-Tethys oceanic conditions. In this contribution, Re–Os isotopic systematics of black shales from the Gungri Formation, Spiti valley and siltstones from the Khunamuh Formation, Guryul Ravine have been investigated to constrain their depositional ages. The Re–Os isochron for the Gungri shales yields a depositional age of 255 ± 22 Ma (2σ; n = 8; MSWD (Mean Square Weighted Deviation) = 5.7), consistent with available biostratigraphic information. The initial 187Os/188Os ratio (0.60 ± 0.13) is similar to that reported for the Late Permian shales, indicating the connection of the Neo-Tethys with the global ocean. In contrast, the Re–Os systematic is found to be non-isochronous for the Guryul Ravine section, a proximal site with a strong influence of seismic/Tsunami events. Global compilation of 187Re/188Os ratios in Late Permian shales and bathymetric distribution of the Re/Os ratios point to strong role of Re/Os uptake by macroalgae, in addition to oceanic pH and redox state, in regulating the Re–Os systematic in shales. The 87Sr/86Sr ratios for the Induan carbonates from the Spiti (0.71551–0.71837) are higher than to that expected for the Lower Triassic ocean (~0.707). Co-variations of Sr and 87Sr/86Sr with Mn concentrations establish the diagenetic alteration of these carbonates.

1. Introduction

The Late Permian mass extinction (LPME) event was the largest biotic crisis on Earth, wiping out around 90% of marine and 75% of terrestrial species [1,2,3]. This extinction event, which possibly occurred in two episodes during the Late Permian (~252.28 Ma) and the early Triassic (~252.10 Ma; [4,5]) periods, was triggered by Siberian trap eruption and subsequent global warming and ocean anoxia [6,7,8,9,10]. In addition, bolide impact [11,12] and increased sediment fluxes [13,14] have also been invoked as possible causative factors for the LPME. Both extinction intensity and pattern show significant latitudinal variations, with higher impact in the high latitudinal zone than tropical ecotypes [15,16]. Greater extinction intensities at higher latitudes were linked to greater oceanic hypoxic stresses arising from high water temperature and low dissolved oxygen conditions. The regional extinction and environmental patterns led to a large number of regional studies to understand the global distribution and exact causation of the event. The global correlation of these regional studies requires the precise estimation of the depositional ages of sedimentary succession.
Sedimentary deposits in the Himalayan region (Kashmir and Spiti valley, India) pro-vide continuous and high-resolution records of Permian–Triassic (P–T) transitions in the Neo-Tethys ocean [12,17,18,19,20]. Chemical, sedimentological and isotopic analyses of these records have provided insights on sea-level changes, past erosion pattern, oceanic productivity, and redox state during Late Permian in these peri-Gondwana sections [18,21,22,23]. The P–T boundary in these sections is mainly constrained based on bio-stratigraphic information (such as the first appearance datum (FAD) of Hindeodus parvus; [24,25] while precise radiometric ages is lacking [12]. Radiometric dating of sedimentary rocks is a challenging task, mainly due to their provenance signatures and formation (sedimentary and transport) processes. Nevertheless, the 187Re–187Os systematics has been found successful in yielding reliable and precise depositional ages for organic-rich sedimentary rocks [8,26,27,28,29]. Re and Os in these rocks are primarily authigenic in nature, and hence, the radioactive growth of 187Os provides a reliable measure of depositional ages for these rock types [30,31]. Further, the Re–Os geochronometer has been found to be successful in providing precise depositional ages for the P–T shales from different regions [8,32,33,34]. In addition to the Re–Os age, changes in initial 187Os/188Os ratios (Osi) across the P–T boundary have provided clues about relative changes in continental Os supply to the ocean [35]. The P–T sedimentary deposits in the Himalaya are abundant in organic-rich shales and siltstones. In the present work, efforts are made to investigate the Re–Os systematics of organic-rich shales from the Spiti and siltstones from the Guryul Ravine sections to understand their Re–Os geochemistry and constrain their depositional ages. Further, we have also investigated Sr isotopic compositions of the Induan carbonates from the Spiti valley to try and find relative age information using global seawater 87Sr/86Sr stratigraphy [36].

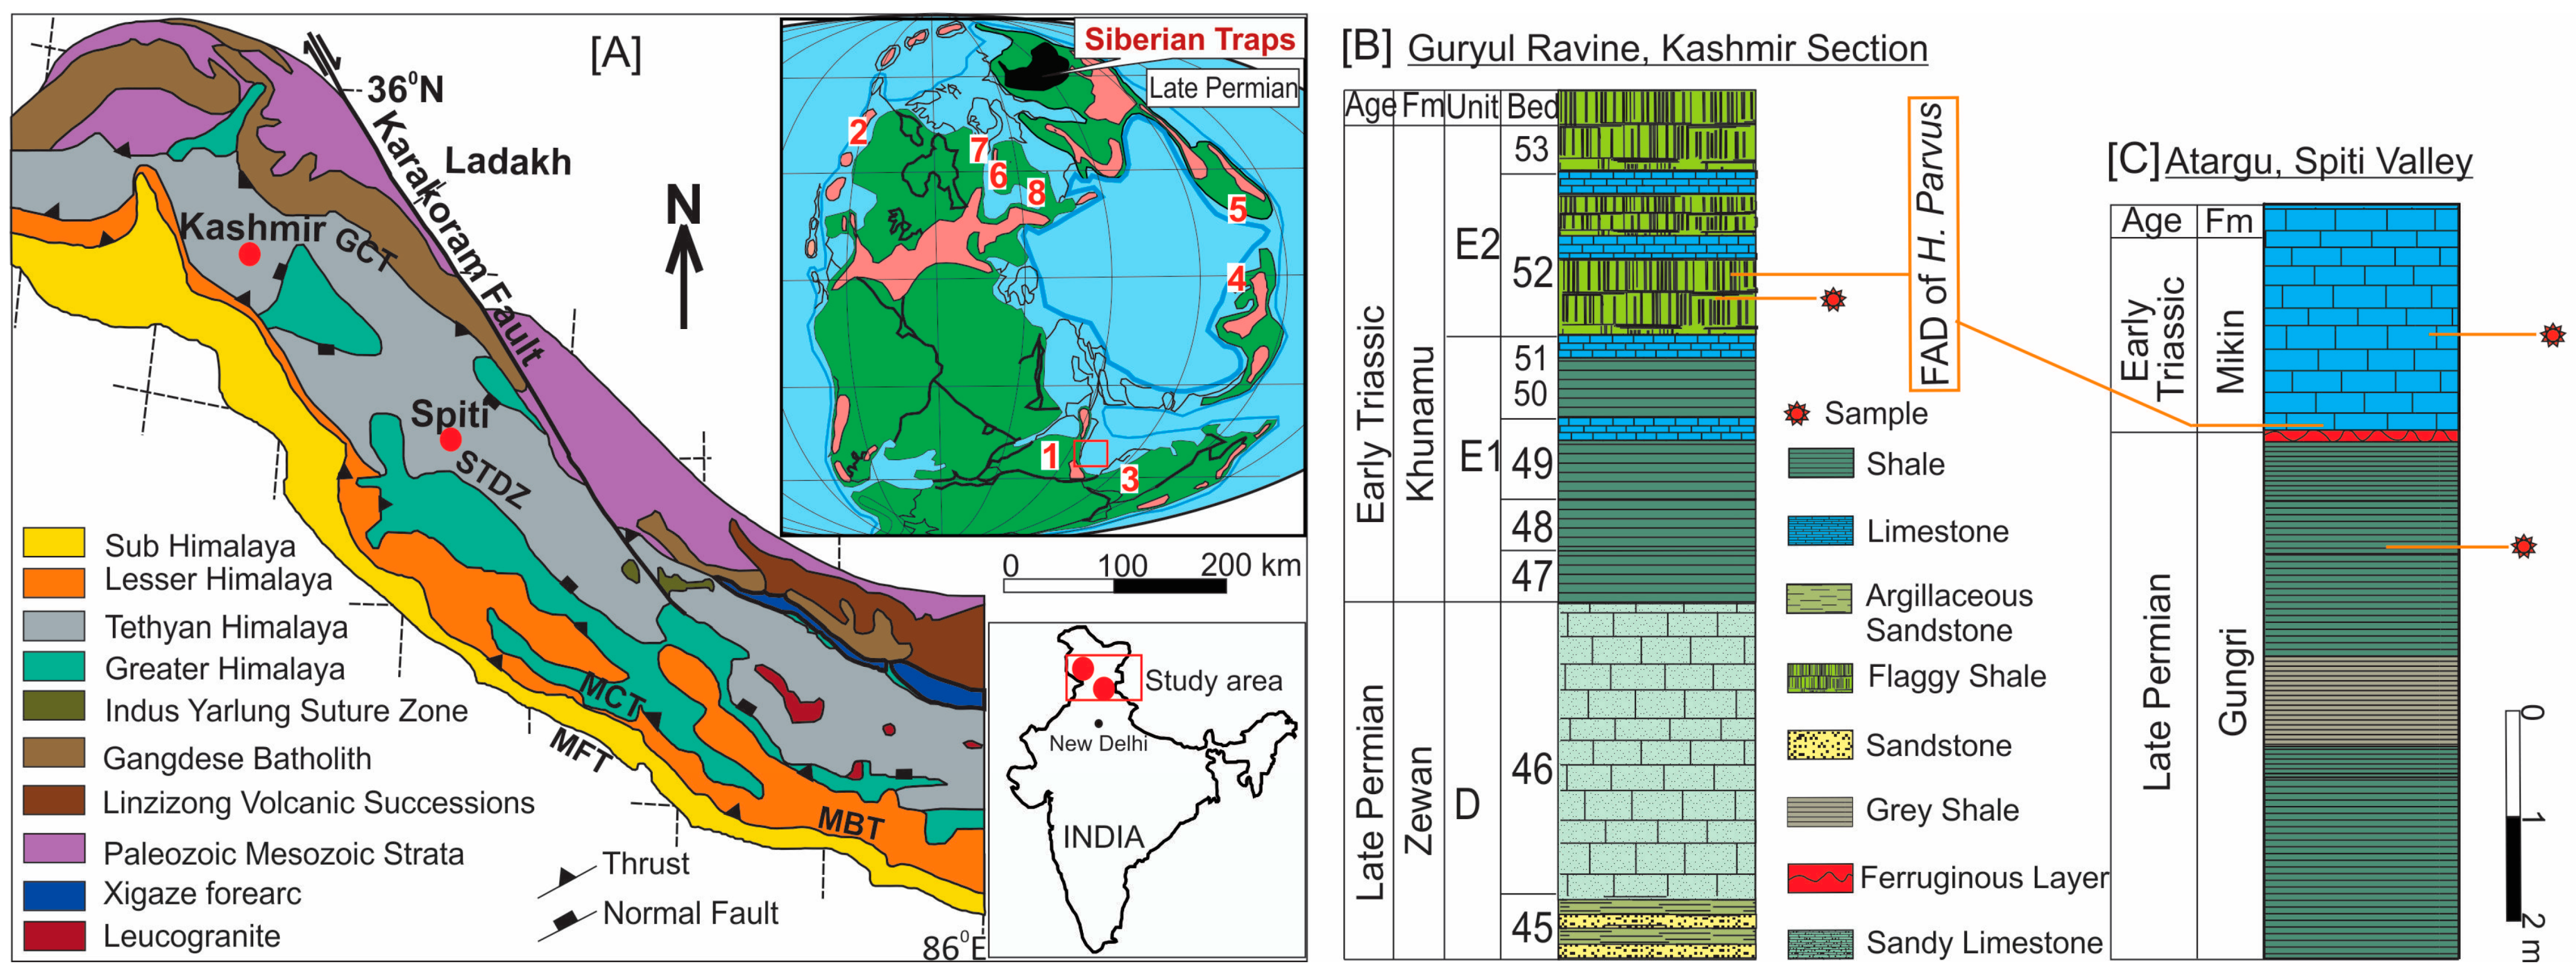
2. Geological Settings

Samples for this study were collected close to the P–T boundary from two different sedimentary sections (Spiti valley and Guryul Ravine) in the Himalayas (Figure 1). Details on the geology of these two sections are given elsewhere [12,17,18,25,37,38] and are presented only briefly here. These sections, which were part of southern side of the Neo-Tethys Ocean at a latitude of 35°S during the Late Permian, formed during rifting of northern Gondwanaland and its subsequent thermal subsidence. The Guryul Ravine section from Kashmir, India archives thick (~100 m) and continuous sedimentary sequences deposited at a moderate rate (~10–20 m/Myr) in outer shelf or deep-ramp settings during the Permian and Triassic periods. The Zewan Formation (bed D), a deep shelf facies, is mainly composed of bioturbated, well-sorted sandy limestones interbedded with quartz-rich sandstones and calcareous shales. The Khunamuh Formation, which overlies the Zewan Formation, is mainly composed of quieter-water shales and bioclastic limestone [21]. The basal part of the formation (bed E) comprises ~16 m thick calcareous shales and argillaceous limestone, which is overlain by >50 m thick limestones (bed F) ([18]; Figure 1). The base unit E1 is ~2.5 m thick succession of silty gray calcareous shales interbedded with fossil-rich limestones and fine-grained quartz siltstones. The index fossil for the base of the Triassic, Hindeodus parvus conodont, appears in bed 52 of unit E2 and ~2.7 m above the Khunamuh Formation base [39,40], which constrains the P–T boundary for the section. The lithology of unit E shows significant spatial variation indicating increasing sea level from Late Permian to early Triassic. In this study, siltstone samples from the bed 52 (unit E2; Figure 1) from the Guryul Ravine section have been analyzed. The Spiti valley samples for this study were collected from the Atargu section (Figure 1). This section is mainly comprised of Late Permian gray-to-black shales (Gungri Formation) and overlying limestone (Mikin Formation, Lilang Supergroup).
These two formations are separated by a thin (15–20 cm) ferruginous layer, which may have formed due to sub-aerial exposure or a limited time duration sedimentary hiatus [25]. The Gungri Formation (~2.5m thick) was deposited considerably below the wave base in an offshore shelf environment. This formation comprises alternating shale and shale–siltstone layers with episodic occurrences of phosphatic nodules and iron-rich concretions. Upgradation from gray to black shales indicates a temporal change in the oceanic redox state with the prevalence of anoxic phases towards the upper part of the formation. The occurrence of Wuchiapingian cephalopods in the lower and middle parts of the Gungri constrain their depositional age [12]. The assemblage of brachiopods and ammonoids in the upper part indicates an upper age of early Changhsingian for the Gungri Formation [25]. The Gungri Formation is overlain by the fossil and clay-rich limestone bed of the Mikin Formation. These lower Triassic carbonate deposits were formed in a deeper environment during marine regression and seawater inundation to the basin. The occurrence of index-fossil H. parvus and negative δ13C excursion in organic matter places the P–T boundary at the base of the Formation [12]. The Induan-Olenekian boundary has been placed about 1 m above the base of the Mikin [12], confirming the depositional age of this Formation to be Induan. Available data on total organic carbon (TOC)/total nitrogen (TN) and δ15N ratios of the Guryul Ravine shales reveal that the organic matter present in these rocks is predominately marine in nature [18]. The shales from the Spiti Valley are mostly thermally mature sediments with thermal alteration indices of ~3 [22]. Although no direct information on metamorphic grades of the sequences are available, the Tethyan sequences are mostly found to be metamorphosed up to greenschist facies [18].

3. Materials and Methods

In this study, eight shales from the Spiti valley and eight siltstones from the Guryul Ravine have been investigated for their Re–Os isotopic compositions (Figure 1). Additionally, chemical and Sr isotopic compositions of five carbonate samples from the Mikin Formation, Spiti valley were also analyzed. The Guryul Ravine samples were collected from the bed 52 (unit E2, Khunamuh Formation) where the index fossil for the P–T boundary (Hindeodus parvus) has been reported. The Spiti samples have been collected about 60 cm below the ferruginous layer, which has been suggested to be the P–T boundary for this location. The carbonate samples for this study belong to the lower part of the Mikin Formation, where the H. parvus fossil has been reported [24]. These outcrop samples were collected after discarding the top soil layer (a few tens of centimeters) to avoid any influence of surficial processes. The rock samples were chipped into 1–5 mm pieces after careful inspection to avoid intrusions, if any. About 100 g of these chips were powdered (up to 100 µm size) using agate mortar and pestle. The powdered samples were used for chemical and isotopic analyses. The mineralogy of two carbonate samples was constrained using an X-Ray diffraction (XRD) instrument (Bruker XRD from IISER Pune, India). For CaCO3 concentrations, about 10–30 mg of sample was treated with phosphoric acids at 80 °C, and the liberated CO2 gas was quantified using a UIC-coulometer facility at IISER, Pune. Concentrations of total organic carbon (TOC) in the shale samples were measured following the analytical methodology of [41]. Briefly, total carbon content of the samples was analyzed in a CHNS/O instrument by quantifying the amount of CO2 re-leased after sample combustion at 950 °C. The TOC concentrations of the shales were computed from the difference between measured total and inorganic carbon concentrations. The average accuracy and precision for the elemental carbon analyses were ~2%.
Re–Os elemental and isotopic compositions of these samples were determined using protocol described in detail in [42]. In brief, about 0.5–1.0 g of the samples, along with a known amount of 185Re–190Os tracer, were digested using a CrO3-H2SO4 mixture in a sealed Carius tube at 230 °C for 2–3 days [29,43]. Osmium was subsequently extracted using solvent (CHCl3) extraction [44] and micro-distillation [45]. Rhenium was extracted from the remaining solution by the combination of acetone–sodium hydroxide solution and the fraction was further cleaned by anion-exchange chromatography [43]. Osmium was loaded onto a Pt filament in the presence of Ba(OH)2 activator and its isotopic composition was measured on a Thermo Triton Plus thermal ionization mass spectrometer housed at the Institute of Geology of the Czech Academy of Sciences (IG CAS) operated in negative mode. The measured Os isotopic ratios were corrected for different oxygen mass isobaric interferences, mass fractionation and spike addition. The in-run precision of 187Os/188Os ratios was monitored through the analyses of UMCP (University of Maryland College Park) Os reference solution with a determined value of 0.11375 ± 0.00006 (2SD, n = 6). The Re isotopic compositions were determined using a sector field Element 2 ICP-MS housed at the IG CAS coupled with an Aridus II desolvation nebulizer with an in-run precision better than ±0.2% (2SD). The total procedural blanks for Re (1–12 pg) and Os (0.4–0.7 pg) acquired during the course were included in all calculation.
The Sr isotopic composition (87Sr/86Sr) of the carbonate samples was measured following the analytical methodology described by [46]. Briefly, the powdered samples were treated with 0.1 N HCl at 80 °C, and the leachate collected. Subsequently, the carbonate leach fraction was passed through a Sr-Spec column to extract pure Sr. To cross-check the efficacy of the acid leach procedure, an aliquot of these samples was also treated with a 10% acetic acid solution. The carbonate leach extracted using the 10% acetic acid was similarly passed through the Sr-spec column. To constrain the precision of Sr isotopic analyses, two samples were measured in replicates. The purified Sr fractions from both the leaching procedures were measured for Sr isotopes (87Sr/86Sr) using a Thermo Triton Plus Thermal Ionization Mass Spectrometer (TIMS) at the Physical Research Laboratory, India. The purified Sr fraction was loaded on a single outgassed and oxidized Ta filament with 0.1 M H3PO4. Finally, Sr isotopes were measured on Faraday cup detectors in static multi-collection mode. The measured 87Sr/86Sr ratios were corrected for instrumental mass fractionation by normalizing the measured 86Sr/88Sr ratios to 0.1194. The procedural Sr blank (~300 pg) was insignificant compared to the total Sr processed (~1 µg). To ascertain the accuracy of the isotopic analyses, we also measured the 87Sr/86Sr ratios of the NBS-987 standard along with the samples. The measured 87Sr/86Sr of NBS-987 (0.710246 ± 0.000013; 2σ; n = 12) was found to be consistent with its reported value (~0.710250; [47]. The measured 87Sr/86Sr ratios using the both leaching methods: 0.1 N HCl and 10% acetic acid were found to consistent with each other, ensuring negligible or minimal leaching of any silicate minerals. In addition to 87Sr/86Sr, we analyzed the carbonate samples for their Sr and Mn abundances. Towards this, the carbonate samples were completely digested using the HF-HNO3-HCl acids and their Sr and Mn concentrations were measured using the quadrupole inductively coupled plasma mass spectrometer (Q-ICPMS) instrument [48].

4. Results

Rhenium and Osmium elemental and isotopic data for Permian–Triassic shales/siltstones from the Spiti valley and Guryul Ravine sections, India are listed in Table 1. As mentioned earlier, the Spiti shales belong to the upper part of the Gungri Formation, whereas the Guryul siltstones belong to the lower part (Bed 52, E2 unit) of the Khunamuh Formation (Figure 1). The TOC concentrations of these organic-rich Himalayan rocks vary widely from 0.52 to 1.57 wt% (avg. 1.2 ± 0.3 wt%; n = 16), with relatively higher TOC content being observed for the Spiti samples (1.41 ± 0.08 wt%) than that for the Guryul Ravine samples (0.9 ± 0.2 wt%). The CaCO3 concentrations were found low for the Spiti shales (0.5 ± 0.3 wt%) and negligible for the Guryul siltstones (Table 1). The Re concentrations in the Spiti (4.27–10.08 ng/g) and Guryul (0.73–2.86 ng/g) samples show wide variations. The average Re concentrations of these samples (4 ± 2 ng/g; n =16) are higher by an order of magnitude than that for the upper continental crust (UCC; ~200 pg/g; [49]). The Os concentrations of the samples vary between 66 and 151 pg/g (92 ± 21pg/g), which is about 2–5 times higher than the mean Os UCC concentrations (~31 pg/g; [49]). Similar to their TOC concentrations, both Re and Os concentrations for the Spiti samples are enriched than those for the Guryul samples (Table 1; Figure 2). The Re and concentrations show a significant (p < 0.01) correlation with corresponding TOC values (Figure 2). These linear covariation trend yield average Re/TOC (7.1 ppb/wt%) ratios typical of organic-rich marine shales [50,51]. Further, the Re and Os concentrations show a significant correlation (Figure 2B). The Re/Os ratio for these samples is found intermediate to UCC ([46] and modern-day seawater [51].
The 187Os/188Os ratios of these organic-rich marine deposits range between 1.05 and 2.62 with an average value of 1.7 ± 0.5 (n =16). The 187Re/188Os ratios for the Spiti shales (range 257–473) co-vary with their corresponding 187Os/188Os (1.67–2.62) ratios. Bidirectional-uncertainty weighted regression analyses of 187Re/188Os and 187Os/188Os ratios for the Spiti shales were carried out using the Isoplot Ex v. 4.15 [52], yielding a Model 3 isochron age of 255 ± 22 Ma (2σ, n = 8; MSWD = 5.7) and an initial 187Os/188Os (Osi) ratio of 0.60 ± 0.13 (Figure 3). Unlike the Spiti samples, the 187Re/188Os ratios of the Guryul samples do not show any discernible trend with their 187Os/188Os ratios (Figure 4), precluding the use of Re–Os data to constrain depositional age at this proximal site. Geochemical (CaCO3, Sr, Mn abundances) and isotopic (87Sr/86Sr) data for Early Triassic carbonate samples from the Mikin Formation have been provided in Table 2. The XRD analyses of the carbonate samples from the Mikin Formation confirm their dolomitic nature. The inorganic carbonate content in these samples show wide variation (52.1 to 90.4 wt%). The average Sr (807 ± 253 µg/g; n = 5) and Mn (8983 ± 2546 µg/g; n = 5) concentrations for these carbonates (Table 2) are higher than those reported for the UCC (320 µg/g and 774.5 µg/g, respectively; [53]). The 87Sr/86Sr ratios vary between 0.715508 and 0.718374. These isotopic values are significantly higher than the reported Sr isotopic values for the Phanerozoic (0.70668–0.70966; [36]), pointing to post-depositional alteration of these carbonate samples.

5. Discussion

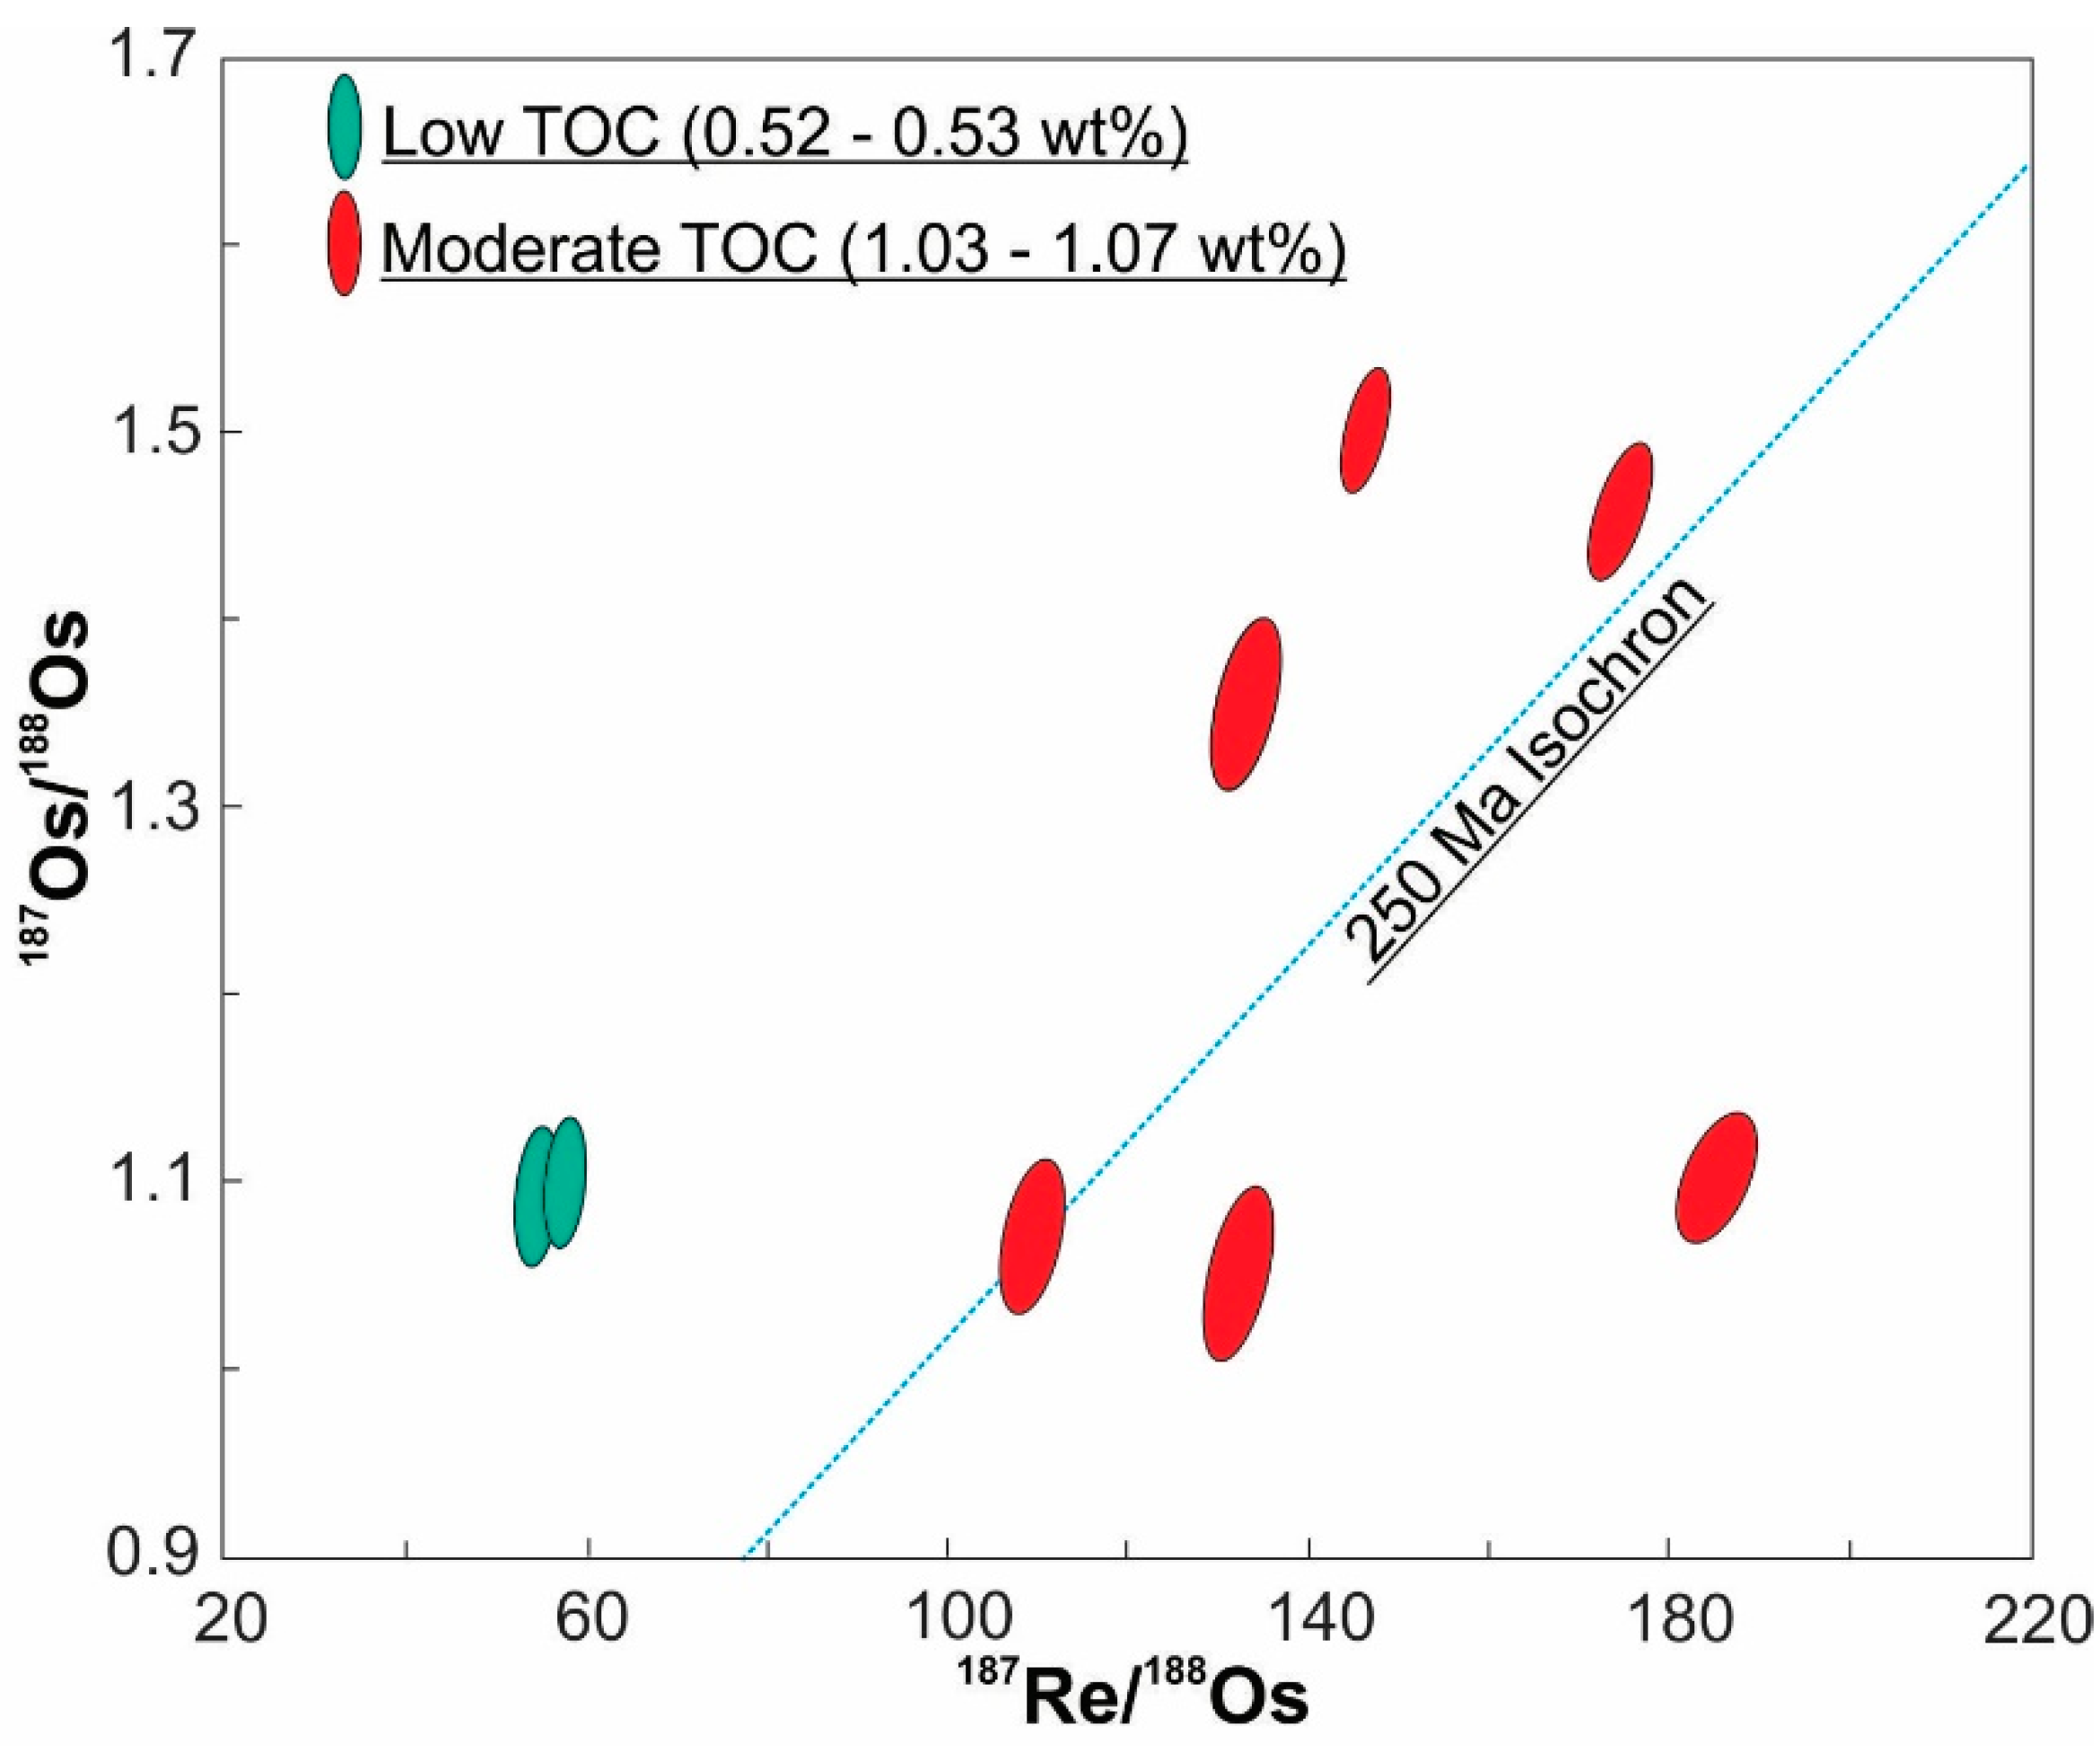
5.1. Re–Os Depositional Age

The Re–Os isochron of shale samples from the Spiti valley, which were collected about 60 cm below the suggested P–T boundary, yields a depositional age of 255 ± 22 Ma (2σ; MSWD: 5.7; n = 8; Figure 3). This first radiometric age for the P–T section from the Himalaya is consistent with its suggested Late Permian age deduced from biostratigraphy (Figure 1; cf. Section 2). Further, the Re–Os age of the Spiti samples is consistent with the suggested age for the base of the Triassic (251.902 ± 0.024 Ma; ICS, 2020) globally. Although our Re–Os age seems to yield an accurate depositional age for the location, the estimated age is associated with larger uncertainty than expected for Re–Os geochronometer. Based on a bidirectional uncertainty-weighted linear regression, the Isoplot software has computed a Model 3 age for these samples. A Model 3 age indicates that the obtained error on age is not only linked to analytical uncertainty but other geological factors (e.g., variation in initial Os isotopic composition, post-depositional alterations, etc.) may also contribute towards these data variations. Earlier studies have confirmed the minimal impact of post-depositional thermal events on the Late Permian shales from the Spiti Valley [12]. The outcrop samples from the section were collected from ~60 cm below the surface, and samples with no visible impact of weathering were processed in this study. These observations rule out any impact of metamorphism, hydrothermal fluid interaction, and weathering process on the observed high MSWD values and hence, in explaining the high errors associated with the Re–Os age [28]. We, therefore, hypothesize that the observed high MSWD (~5.7; Figure 3) is mainly due to non-homogenous initial 187Os/188Os during the deposition of these shales. Consistently, the Re–Os isochron yields an initial 187Os/188Os, which is also associated with significant uncertainty. One possible explanation for this high uncertainty, compared to previous Re–Os studies on P–T sections, is low to moderate TOC content in these samples (Table 1) and related limited scavenging of seawater Re and Os to the underlying sediments. The large spread on initial ratios indicates that temporal changes in the basinal 187Os/188Os ratio during the sediment deposition period, which in turn may yield to high MSWD values of the Re–Os isochron [54]. Interestingly, the initial 187Os/188Os ratio for the Spiti valley (0.60 ± 0.13) is found to be similar to that reported for other global P–T sections (~0.6; [8]). This consistency in initial Os isotopic ratios ensures reliability of the Re–Os age for the Spiti valley and confirms that this Neo-Tethys section was well connected with the global ocean.
In contrast to the Spiti shales, the 187Re–187Os systematics of the Guryul Ravine samples do not yield any meaningful age information. However, the exact cause behind this non-isochron trend (Figure 4) at Guryul Ravine site is not clear. This discrepancy may have arisen either due to post-depositional metamorphism [28], hydrothermal fluid interaction [41], surficial weathering [55] and/or variability in initial 187Os/188Os ratios at this location. A candidate for the Permian–Triassic GSSP (Global boundary Stratotype section and points), the Kashmir section comprises a well-preserved sedimentary sequence that was not disturbed by any post-depositional metamorphism/hydrothermal fluid interaction. Further, a physical inspection of the samples shows an insignificant impact of chemical weathering at this location. This observation is consistent with similar Re-TOC and Os-TOC trends for the Spiti and Guryul Ravine sections (Figure 2). On the other hand, the sediments in the Kashmir sections were deposited in a disturbed condition with strong seismic/tsunami events [18]. These events may lead to fluctuation in riverine influxes and likewise reflect variable initial 187Os/188Os ratios at this location. To assess this proposition, we have computed the initial 187Os/188Os ratios for the Guryul samples assuming a depositional age of 252 Ma. These calculated ratios show considerable variations ranging between 0.31 and 0.88. These large fluctuations in the initial isotopic ratios are likely to be regulated by relative Os supply by freshwater influxes to this proximal site due to dynamic (seismic/tsunami) hydrodynamic conditions, which in turn caused the non-isochronous relationship of these samples. It is worth mentioning here that these deviations of samples from the expected P–T isochron are regulated by the organic matter content of the samples. Figure 4 shows that two samples with extremely low TOC (~0.5 wt%) fall far from the expected isochron line for 252 Ma, whereas the other samples show no significant TOC variation (1.05 ± 0.01 wt%; n = 6). Therefore, it is likely that the source of TOC and degree of authigenic Re and Os with TOC regulates the success of Re–Os isotopic systematic in constraining the age information [56].

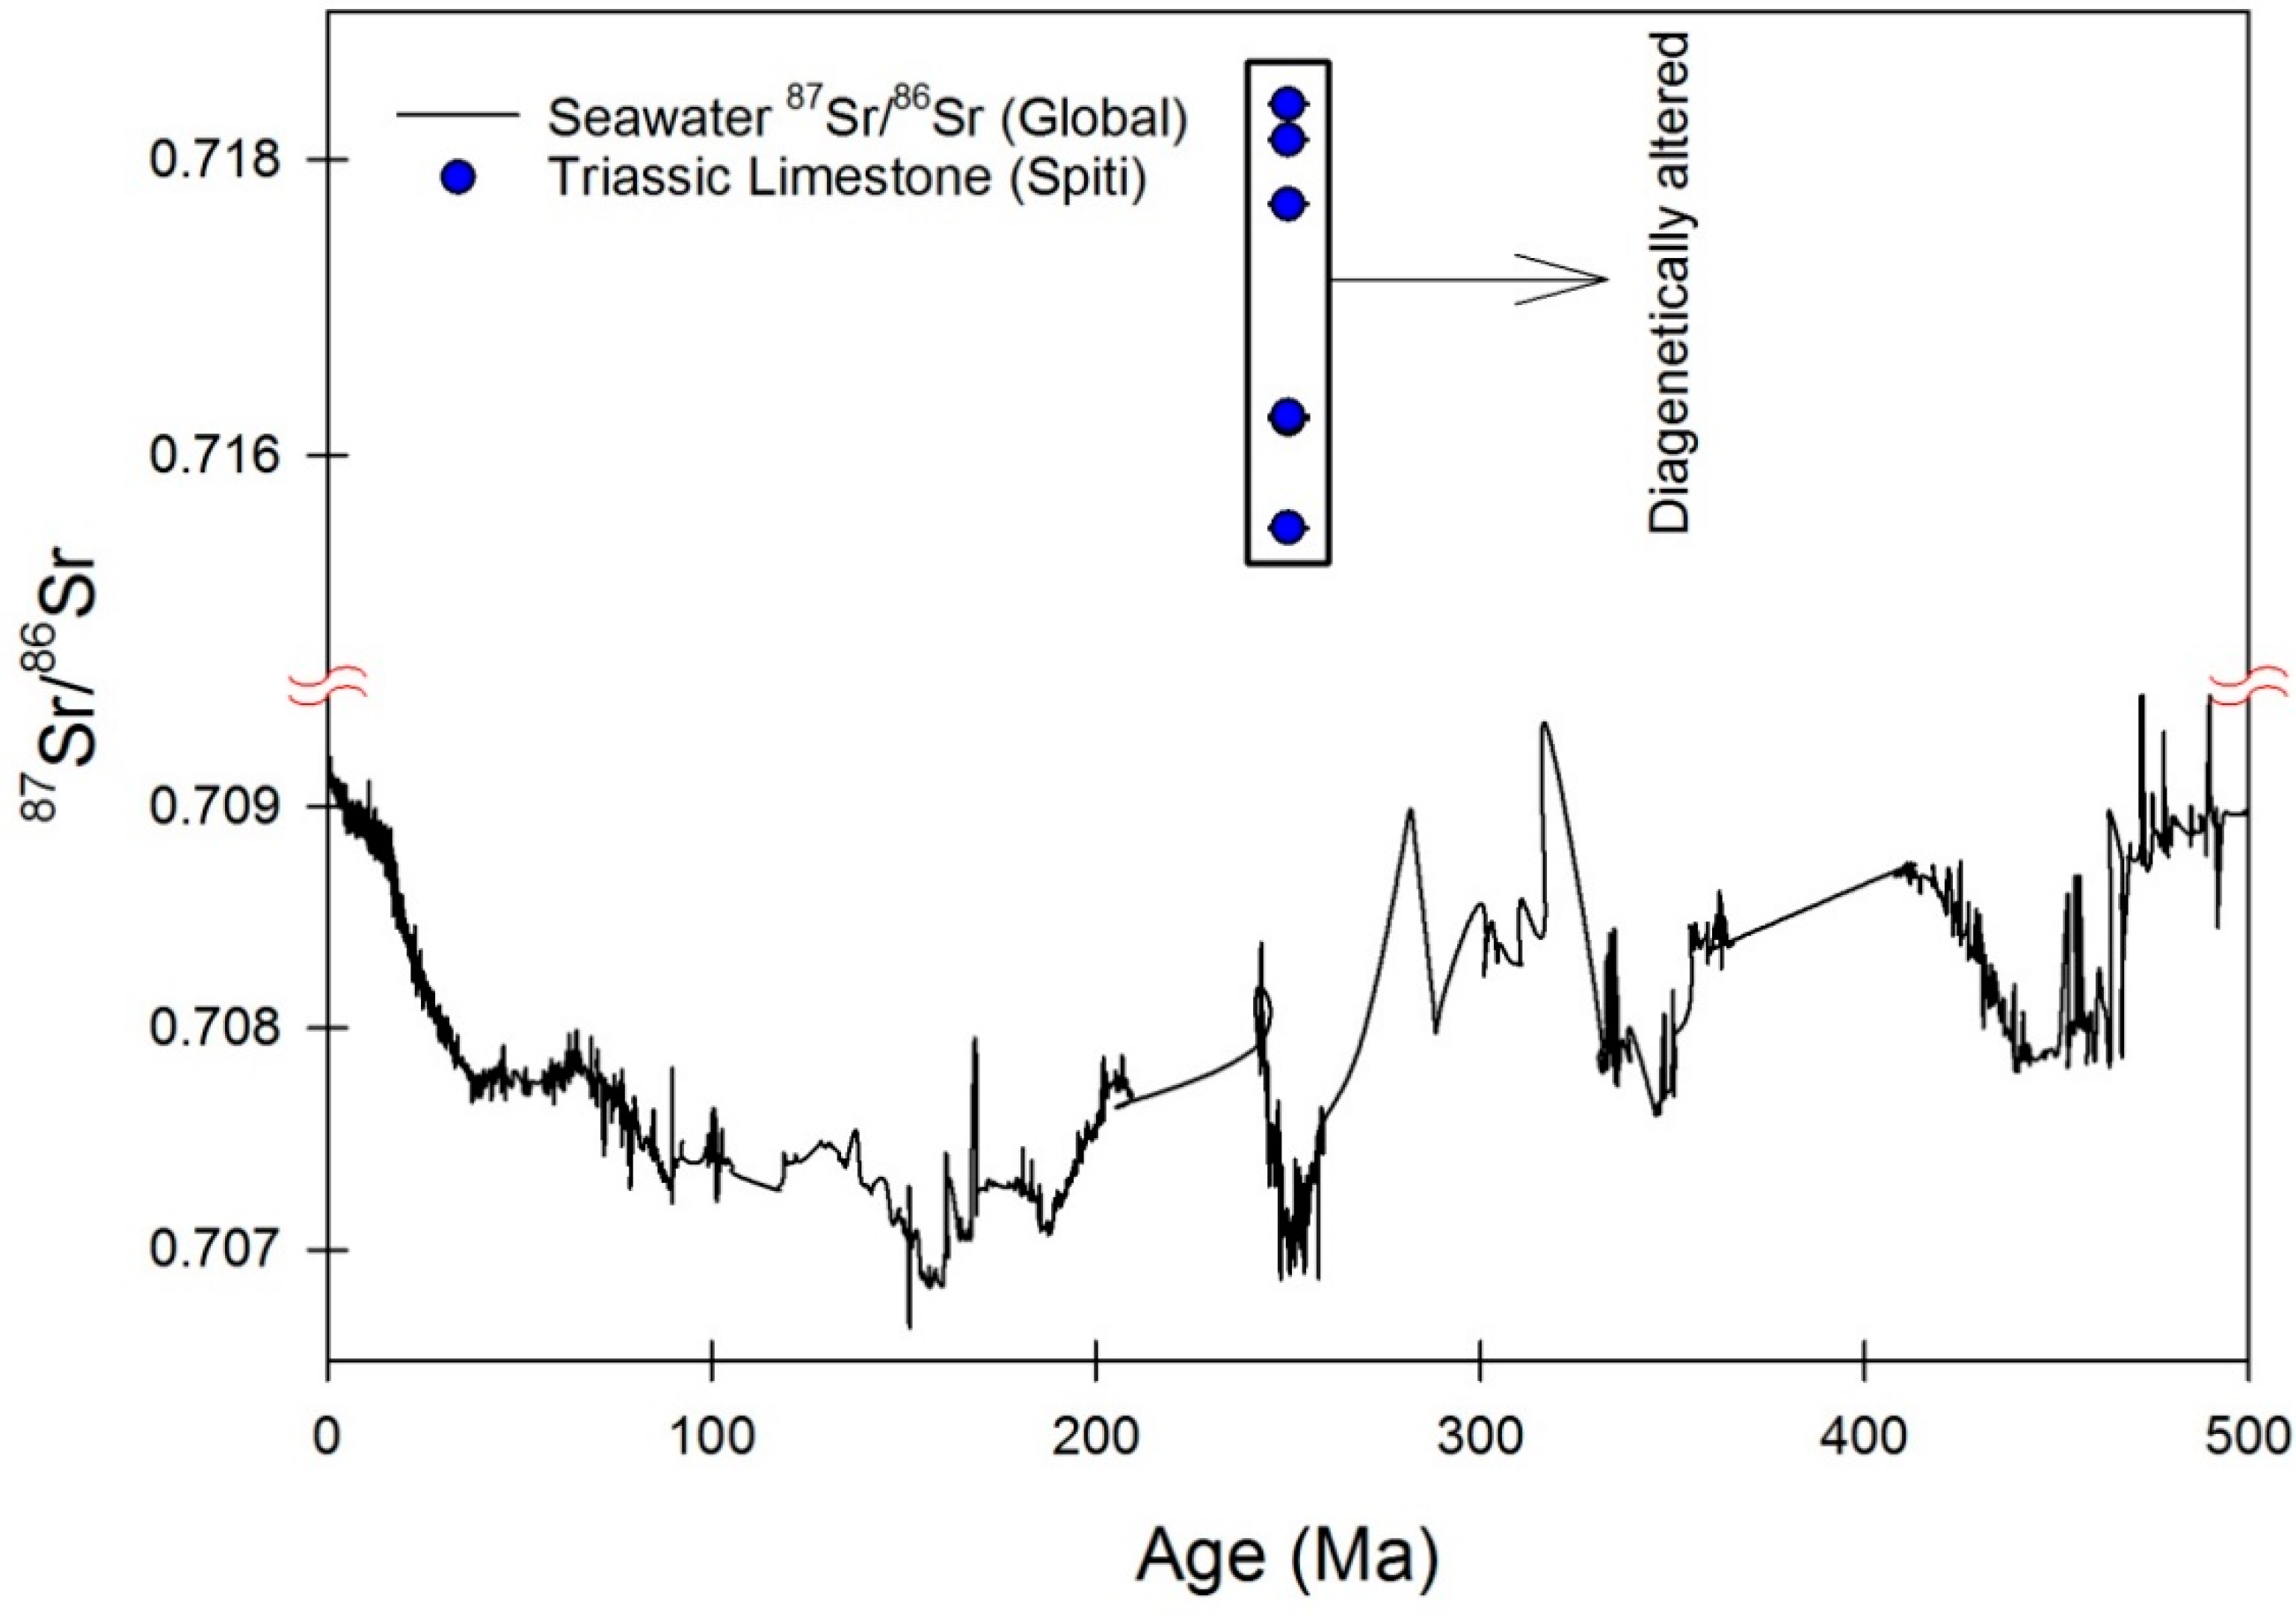
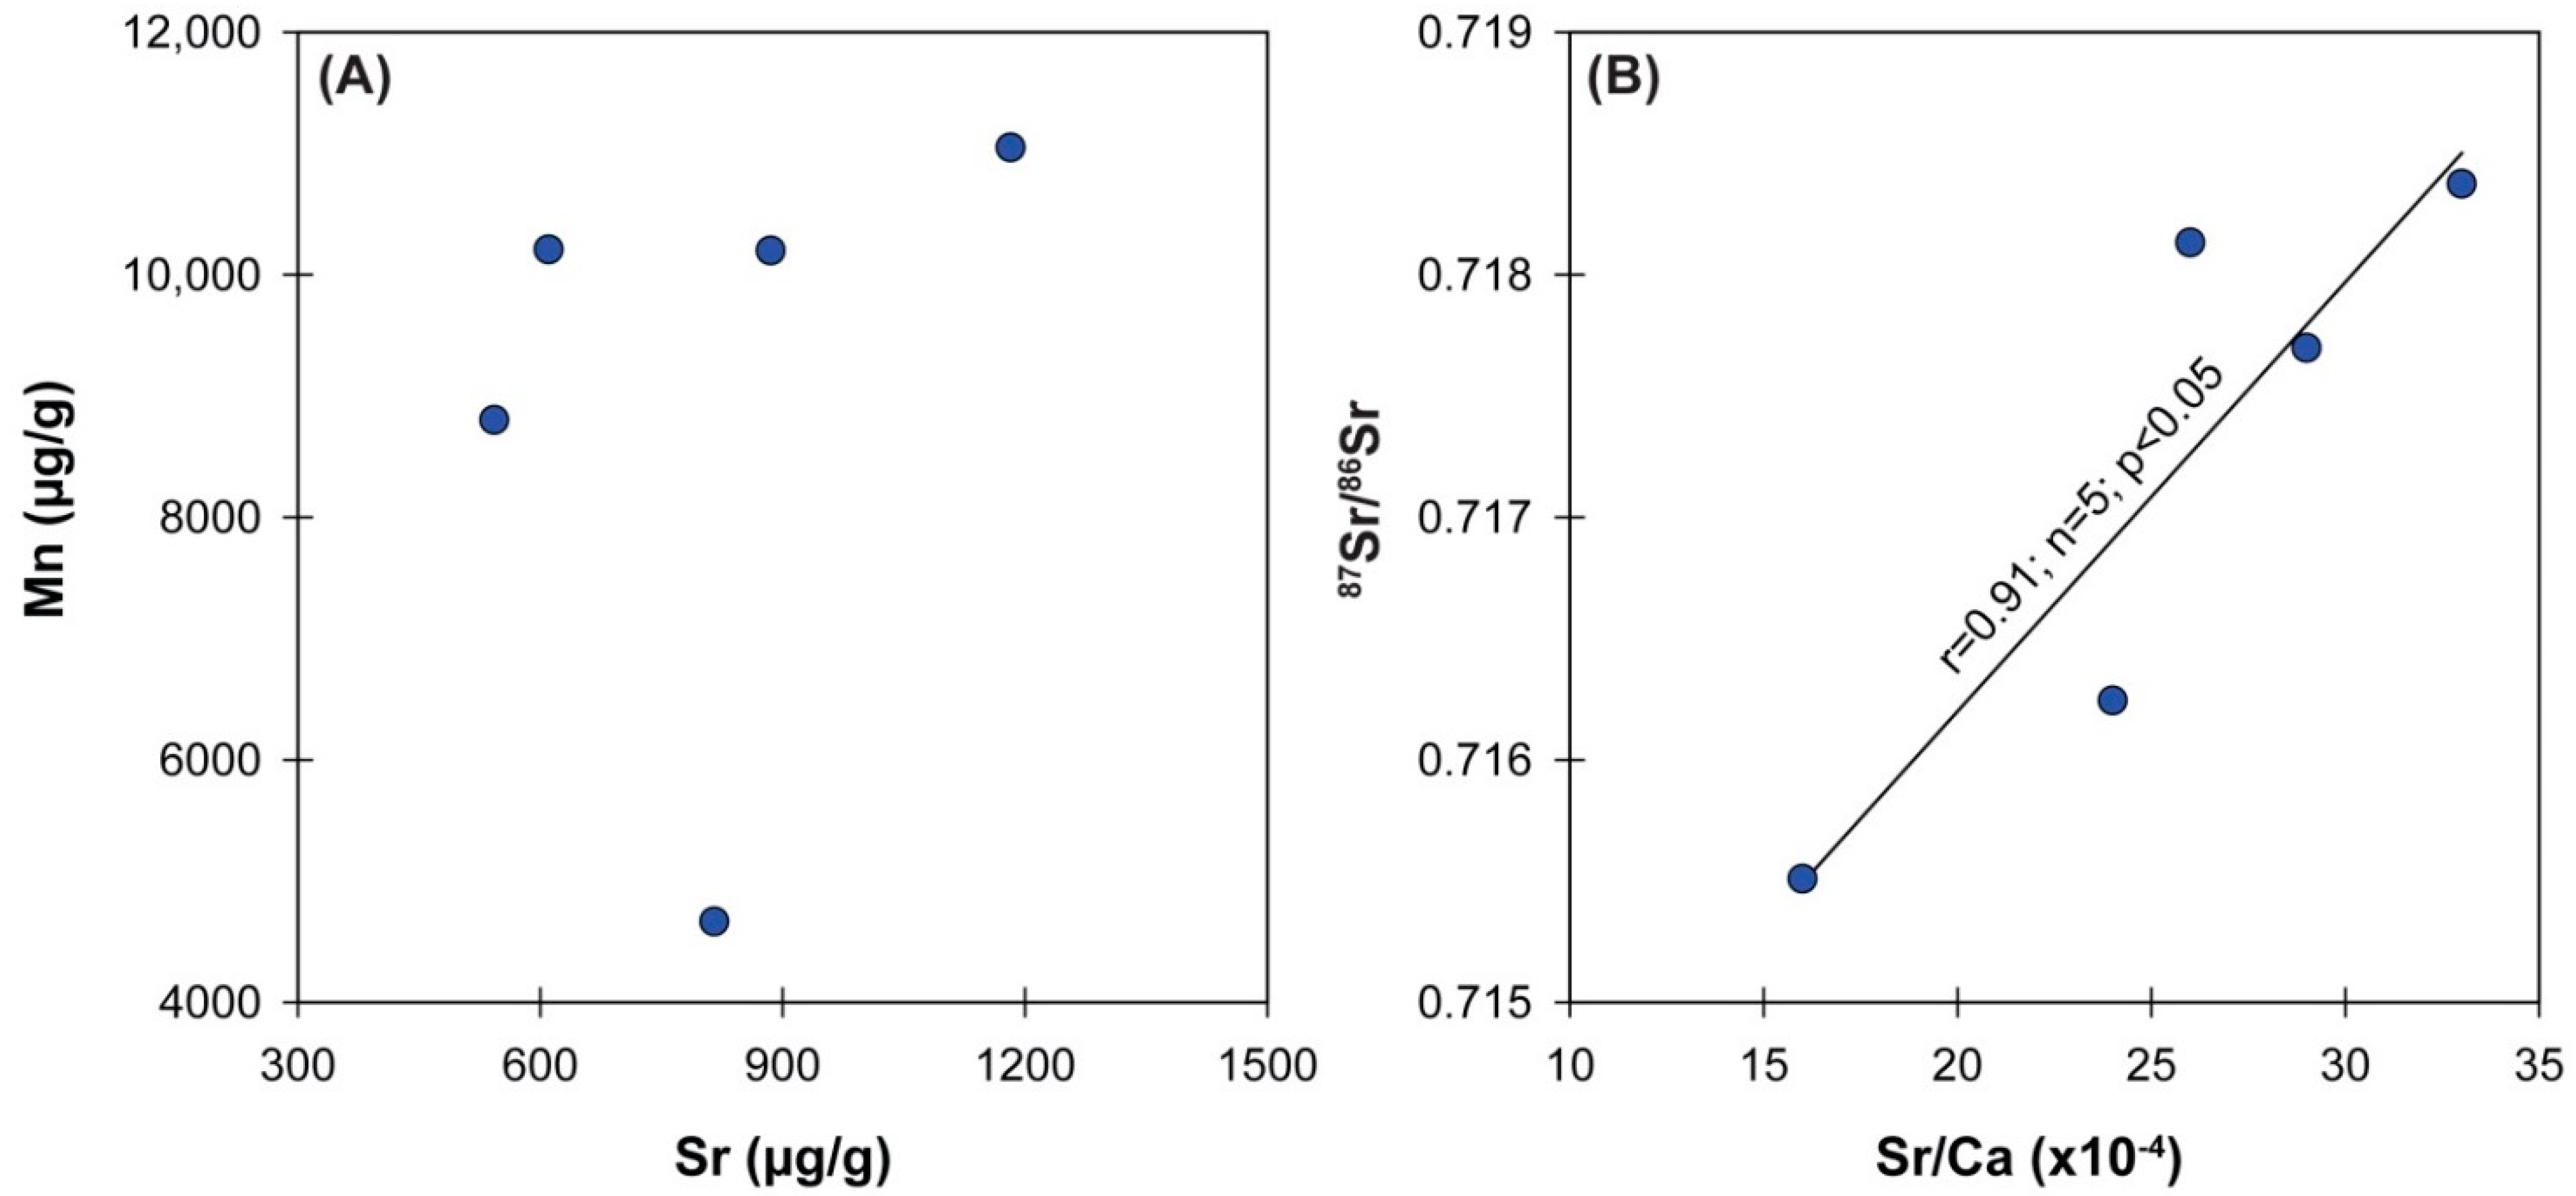
5.2. 87Sr/86Sr of Early Triassic (Induan) Carbonates, Mikin Formation Post-Depositional Diagenesis

In addition to the Re–Os chronometry, Sr isotopic values of marine carbonates can also provide reliable age information for sedimentary sequences [36]. Authigenic/biogenic carbonate precipitates from seawater efficiently retains the aqueous 87Sr/86Sr signature. Further, the captured 87Sr/86Sr signature by carbonate phases remains time-invariant due to the lack of parent 87Rb in these sedimentary deposits. Comparison of carbonate 87Sr/86Sr values with global marine Sr isotopic signatures [36,57], therefore, can provide relative age information on the carbonate deposition. Therefore, we have determined the 87Sr/86Sr ratios for the Mikin carbonate samples overlying the P–T boundary at the Spiti valley. However, the Sr isotopic values for these samples yielded highly radiogenic values for both type of leachates (0.71551–0.71837) compared to that expected for the P–T boundary and throughout the Phanerozoic ocean (0.70668–0.70966; Figure 5). Consequently, we cannot extract any meaningful age information. This radiogenic Sr isotopic value for carbonate is in contrast to the one Sr isotopic data reported for gypsum from the Spiti valley (~0.7082; [58]). Although the exact cause for this dissimilar isotopic behavior for dolomite and gypsum phases is not clear, the carbonate deposits seem to be more susceptible than the evaporites during any post-depositional processes. The post-depositional alteration of carbonates was also evident in one of the earlier studies on U-Th systematics from this section [12]. The carbonate deposits may obtain diagenetic alteration through several geological pathways, which includes cementation, dissolution, compaction, dolomitization, surface weathering and subsurface fluid interaction [59,60]. All these processes may have significant impacts on carbonate 87Sr/86Sr ratios. For instance, the multiphase alteration of pre-existing carbonates during dolomitization through micro-textural changes generates different Sr isotopic ratios [60]. Considering the dolomitic mineralogy for these samples, post-depositional dolomitization of these samples may influence their Sr isotopic composition [61]. However, in this case, the Sr concentration should decrease due to smaller distribution coefficient for Sr in dolomite (0.0118) comparing to calcite (~0.03; [62]), which is clearly not the case. In fact, the average Sr concentrations in these samples (~850 µg/g) have been observed to be higher than that expected for dolomite precipitates from modern oceans (470–550 µg/g; [60]). Overall, the Sr concentrations in the Mikin carbonates show an increasing trend with Mn concentrations (Figure 6A). The diagenesis of carbonates generally leads to Sr removal and Mn incorporation [63,64]. However, the Spiti carbonates show a positive correlation between these two parameters, which may have resulted from Sr gain from diagenetic fluids [65]. The influx of subsurface fluids and their interaction with carbonate deposits are also likely to alter uplifted and exhumed rocks from the Himalayas [66]. To assess this, correlation between Sr/Ca and 87Sr/86Sr ratios of the Spiti carbonates have been assessed (Figure 6B). This positive trend shows that the additional Sr supply have higher Sr isotopic ratios than the seawater isotopic values. The additional Sr incorporation, therefore, into the Spiti carbonates cannot be linked to recycled seawater which is expected to have same 87Sr/86Sr ratio as that of the “pristine” carbonates. Thus, highly radiogenic Sr isotopic values may be originated by percolative fluids that were in interaction with surrounding rocks. This suggestion is supported by high 87Sr/86Sr ratios (~0.74; unpublished data) observed for the clastic sediments for the Atargu section. In addition, high 87Sr/86Sr ratios in Himalayan carbonates have often been linked to their metamorphism and incorporation of radiogenic 87Sr/86Sr from silicates during the thermal events [67]. This possibility for the Spiti valley samples seems less likely as the deposits are not metamorphosed.

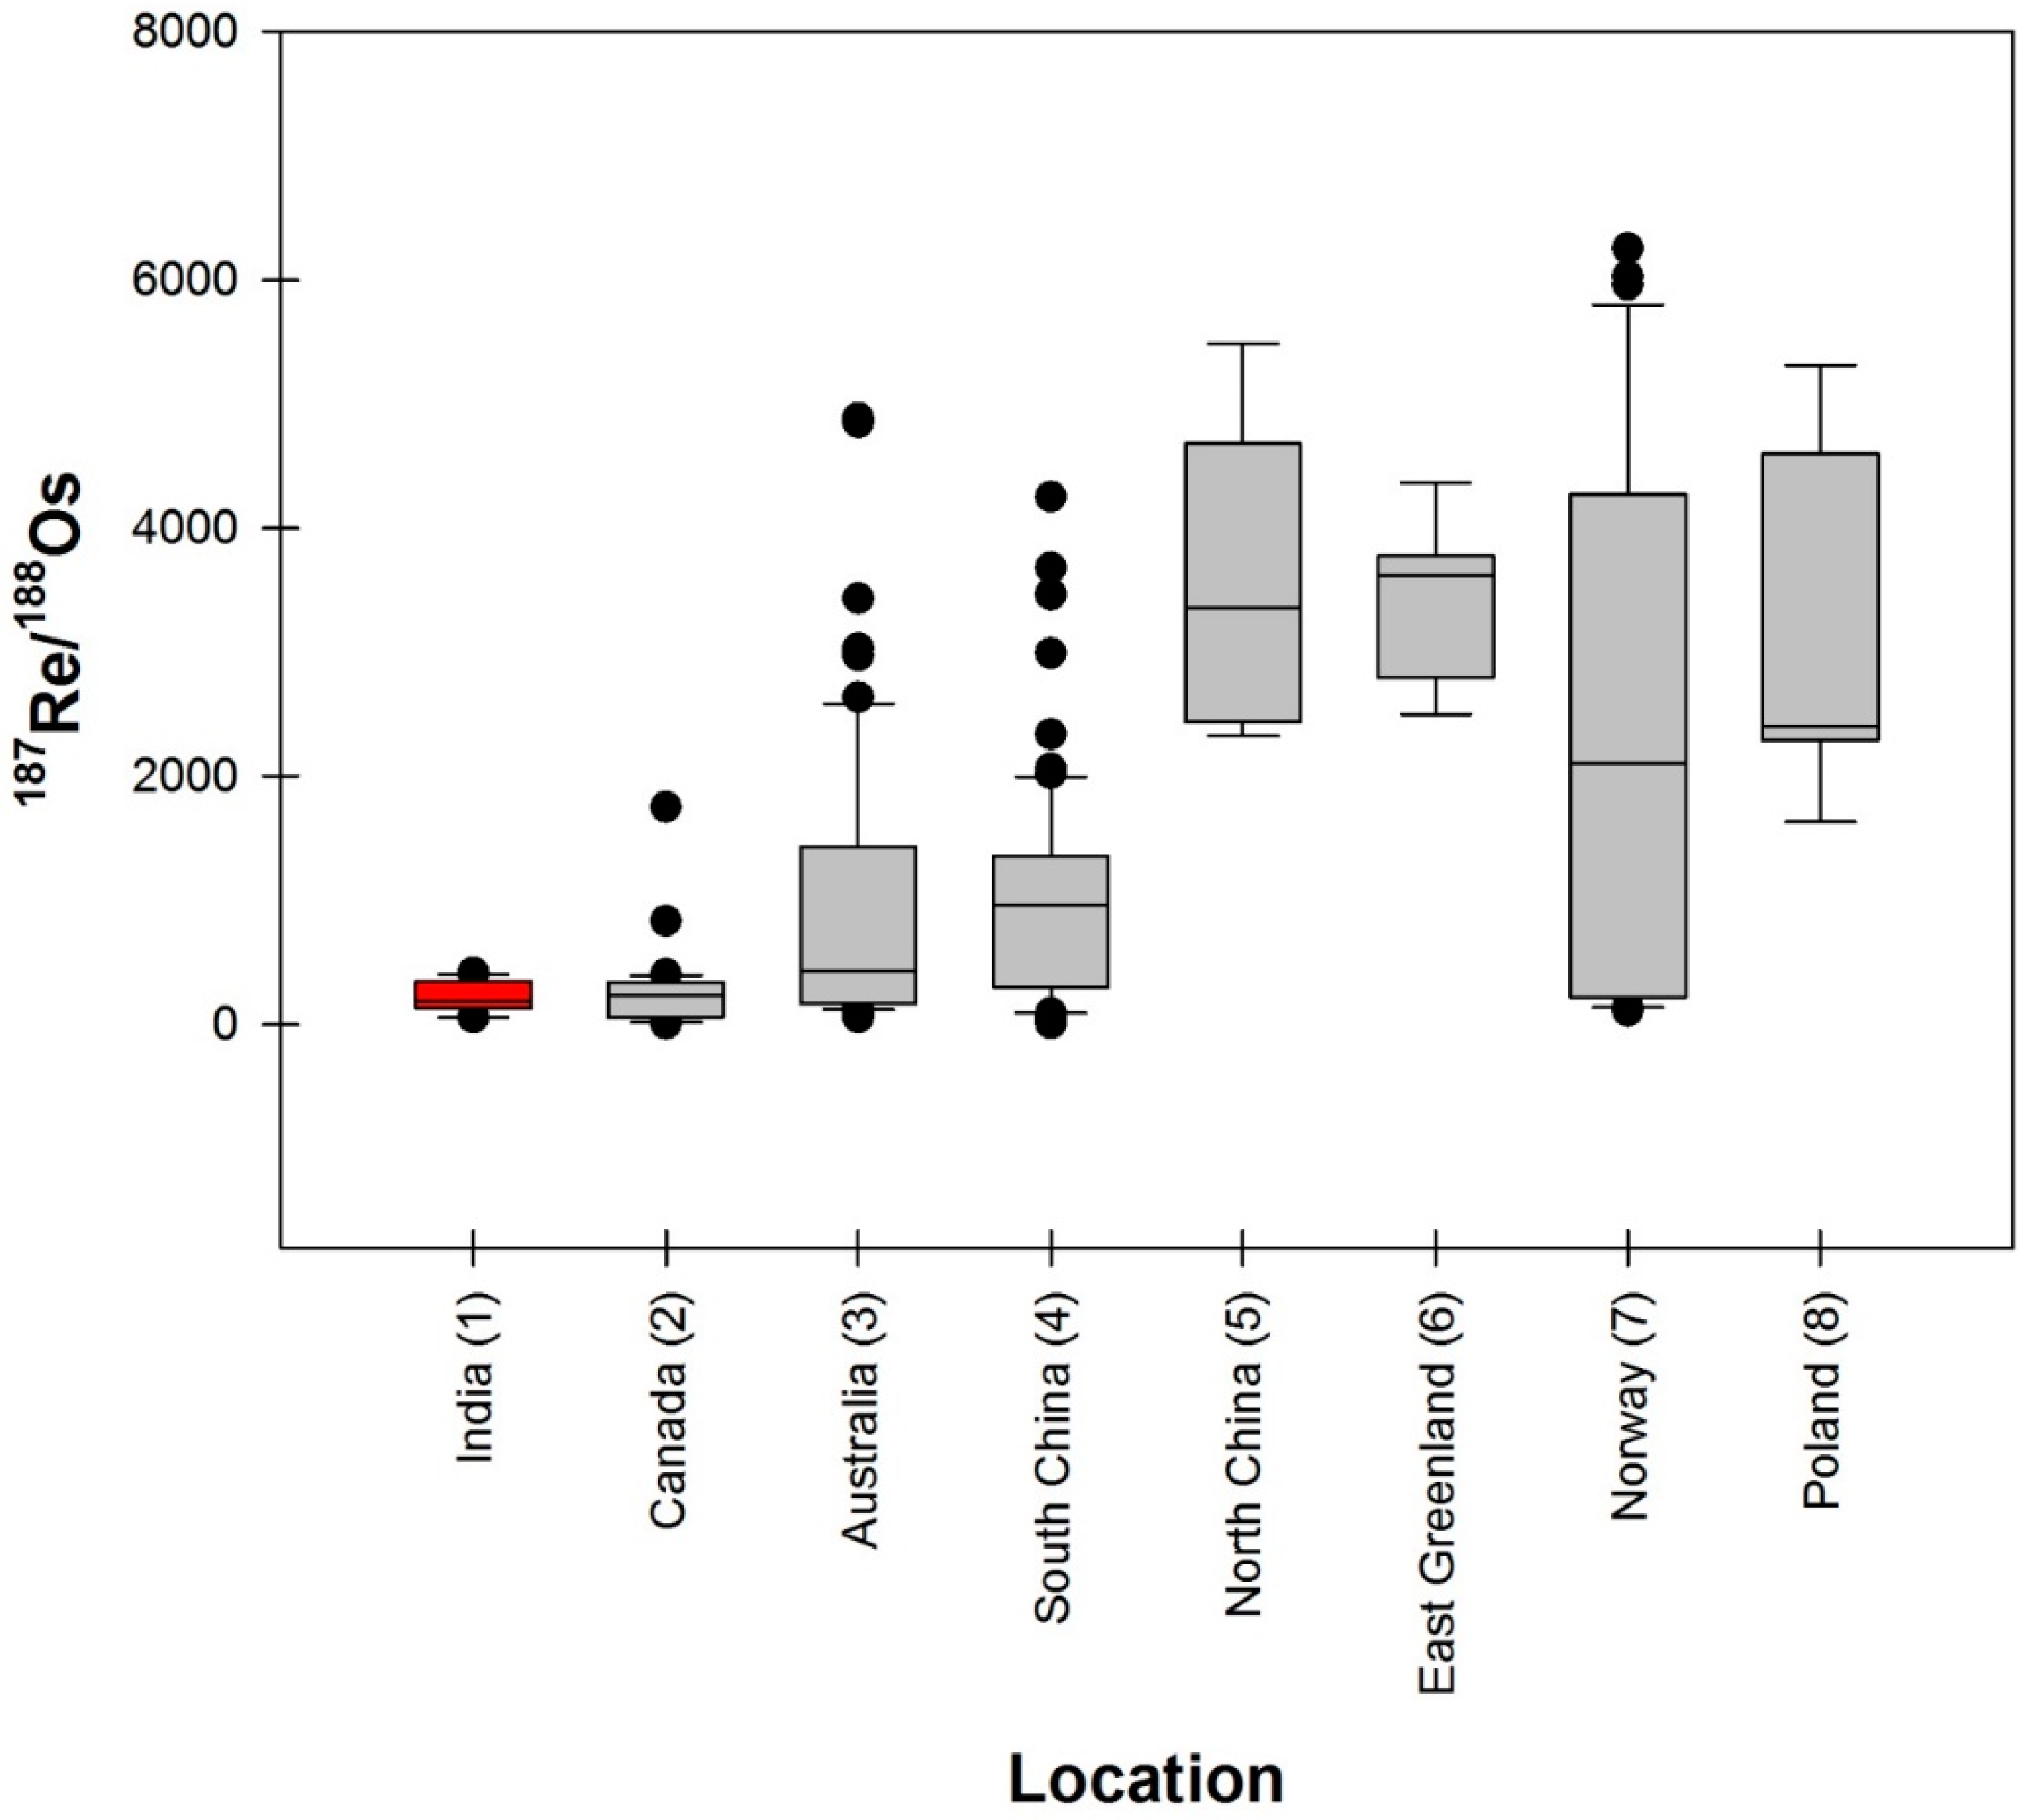
5.3. Global Distribution of 187Re/188Os during the Late Permian

Earlier studies have reported anomalously high 187Re/188Os ratios for sedimentary rocks from the Late Permian [8]. These values reach up to ~6250, significantly higher than that reported for the UCC (227), modern-day Black sea sediments (~750) and present-day seawater (4270) [68,69]. These high 187Re/188Os ratios have been attributed to the preferential scavenging of Re over Os due to environmental (temperature and pH) changes during the Late Permian. In contrast to these observations, the 187Re/188Os data for the Himalayan sedimentary deposits are found to be “normal” (54-473; 239 ± 132 (n = 16); Table 1). Figure 7 depicts the global distribution of 187Re/188Os ratios for the Late Permian sediments. The Late Permian 187Re/188Os distribution shows relatively higher values from different locations (paleo-geographic position of North China [70], East Greenland, Norway [8], and Poland [32] compared to those at India (our study), Australia [33], Canada [71] and southern China [34]. It is interesting to note that spatial variation in the 187Re/188Os ratio exists at south and North China, which are paleo-geographically closer and expected to have similar environmental conditions [72]. In addition to environmental factors, a study by [71] invoked the possible impact of cyclonic (Tsunami/seismic) events on oceanic upwelling to explain the lower 187Re/188Os ratios at the Opal Creek section in Canada, while studies on the coastal behavior of rhenium have identified the dominant role of macroalgae in regulating the oceanic Re–Os isotopic values [73]. These organisms preferentially uptake Re over Os and are characterized with high 187Re/188Os ratios. The 187Re/188Os ratios in the macroalgae, mainly in brown algae, are characterized to mimic the seawater values and show higher Re/Os ratios in higher saline waters [73,74]. We hypothesize that significant biological uptake of Re and Os by macroalgae [75] may explain the observed 187Re/188Os distribution during the Late Permian. Support for this proposition comes from relatively higher 187Re/188Os ratio at the inner shelf (Spiti: 353 ± 73) than at the proximal settings (Guryul: 124 ± 48; Table 1), as expected for macro-algal uptake of Re and Os. Consistently, [34] showed similar bathymetric variation with increasing 187Re/188Os trend from the proximal inner shelf to deeper sections of a basin from China. Based on high 187Re/188Os ratios globally and their bathymetrical changes, the biological uptake of Re and Os by macroalgae seems a more likely factor to explain the observed variability in 187Re/188Os ratios during the Late Permian. The observed high 187Re/188Os only during this period may be related to high mortality rate of the organisms during this biotic crisis. Outcomes of this study point to significant role of marine macroalgae in regulating the oceanic Re–Os budget and warrant the need to revisit oceanic Re–Os budget to incorporate this biological sink into the account.

6. Conclusions

The 187Re–187Os systematic of black shales from the Gungri Formation, Spiti valley yields a depositional age of 255 ± 22 Ma (2σ; n = 8; MSWD = 5.7). This first radiometric age for the Himalayan section is consistent with available bio-stratigraphic information. The obtained initial 187Os/188Os ratio (0.60 ± 0.13) for this section is similar to that reported earlier for Late Permian sections globally, indicating that this Neo-Tethys section was well-connected with global ocean. Additionally, a Sr isotopic study of overlying carbonates from the Mikin Formation (Induan Age) was also carried out for the possible chronological control of the Himalayan P–T boundary. The observed 87Sr/86Sr ratios for these Induan carbonates (0.717 ± 0.001) are found to be significantly higher than the expected seawater ratio during this period (~0.707). Highly radiogenic Sr isotopic composition and elemental correlation between Mn and Sr of these carbonates indicate significant post-depositional diagenetic alteration. In addition to the Spiti section, the Re–Os isotopic investigation of siltstones from Guryul Ravine section was also carried out. These data provided no meaningful age information for these samples near the P–T boundary. This non-isochronous relationship may be linked to dynamic hydrodynamics of this proximal site with strong seismic/tsunamic influences. The 187Re/188Os ratios for the Neo-Tethys sequences (239 ± 132) are found to be lower than that observed from other successions from different paleo-latitudinal locations during the Late Permian. Comparisons of available 187Re/188Os ratios across different paleo-latitudes and their bathymetric positions point to the importance of biological (macroalgae) uptake on Re and Os elemental and isotopic systematics.

Author Contributions

Conceptualization, G.R.T. and A.M.; methodology, A.M., V.G. and L.A.; Sample collection, A.M., G.R.T., S.K.P. and R.C.; resources, G.R.T.; writing—original draft preparation, A.M. and G.R.T.; writing—review and editing, A.M., G.R.T., V.G., L.A., S.K.P. and R.C. All authors have read and agreed to the published version of the manuscript. Please turn to the CRediT taxonomy for the term explanation.

Funding

This research was funded by IISER, Pune.

Data Availability Statement

All data used in this study are provided in Table 1 and Table 2 of this manuscript.

Acknowledgments

A.M. thanks DST-INSPIRE for research fellowship. The help of Mohd Danish, IISER, Pune and Santosh K Rai, WIHG during the field trips is highly appreciated. L.A. thanks Jan Rejšek for the maintenance of TIMS lab at the IG CAS and also acknowledges the Scientific Program RVO67985831 of the Institute of Geology of the CAS. We thank the Guest Editors (Holly Stein and Svetoslav Georgiev), and Academic Editor (Leszek Marynowski), and four anonymous reviewers for their constructive suggestions.

Conflicts of Interest

The authors declare no conflict of interest.

References

  1. Erwin, D.H. The Great Paleozoic Crisis: Life and Death in the Permian; Columbia University Press: New York, NY, USA, 1993; p. 327. [Google Scholar]
  2. Erwin, D.H. Impact at the Permo-Triassic Boundary: A Critical Evaluation. Astrobiology 2003, 3, 67–74. [Google Scholar] [CrossRef]
  3. Knoll, A.H.; Bambach, R.K.; Canfield, D.E.; Grotzinger, J.P. Comparative Earth History and Late Permian Mass Extinction. Science 1996, 273, 452–457. [Google Scholar] [CrossRef]
  4. Xie, S.; Pancost, R.D.; Huang, J.; Wignall, P.B.; Yu, J.; Tang, X.; Chen, L.; Huang, X.; Lai, X. Changes in the global carbon cycle occurred as two episodes during the Permian–Triassic crisis. Geology 2007, 35, 1083. [Google Scholar] [CrossRef]
  5. Song, H.; Wignall, P.B.; Tong, J.; Yin, H. Two pulses of extinction during the Permian-Triassic crisis. Nat. Geosci. 2012, 6, 52–56. [Google Scholar] [CrossRef]
  6. Renne, P.R.; Black, M.T.; Zichao, Z.; Richards, M.A.; Basu, A.R. Synchrony and Causal Relations Between Permian-Triassic Boundary Crises and Siberian Flood Volcanism. Science 1995, 269, 1413–1416. [Google Scholar] [CrossRef] [Green Version]
  7. Payne, J.; Kump, L. Evidence for recurrent Early Triassic massive volcanism from quantitative interpretation of carbon isotope fluctuations. Earth Planet. Sci. Lett. 2007, 256, 264–277. [Google Scholar] [CrossRef]
  8. Georgiev, S.; Stein, H.J.; Hannah, J.L.; Bingen, B.; Weiss, H.M.; Piasecki, S. Hot acidic Late Permian seas stifle life in record time. Earth Planet. Sci. Lett. 2011, 310, 389–400. [Google Scholar] [CrossRef]
  9. Shen, S.-Z.; Cao, C.-Q.; Zhang, H.; Bowring, S.A.; Henderson, C.M.; Payne, J.L.; Davydov, V.I.; Chen, B.; Yuan, D.-X.; Zhang, Y.-C.; et al. High-resolution δ13Ccarb chemostratigraphy from latest Guadalupian through earliest Triassic in South China and Iran. Earth Planet. Sci. Lett. 2013, 375, 156–165. [Google Scholar] [CrossRef]
  10. Burgess, S.D.; Muirhead, J.D.; Bowring, S.A. Initial pulse of Siberian Traps sills as the trigger of the end-Permian mass extinction. Nat. Commun. 2017, 8, 1–6. [Google Scholar] [CrossRef] [Green Version]
  11. Shukla, A.D.; Bhandari, N.; Shukla, P.N. Chemical signatures of the Permian-Triassic transitional environment in Spiti Valley, India. Geol. Soc. Am. Spec. Pap. 2002, 356, 445–454. [Google Scholar] [CrossRef]
  12. Ghosh, N.; Basu, A.R.; Bhargava, O.; Shukla, U.; Ghatak, A.; Garzione, C.N.; Ahluwalia, A.D. Catastrophic environmental transition at the Permian-Triassic Neo-Tethyan margin of Gondwanaland: Geochemical, isotopic and sedimentological evidence in the Spiti Valley, India. Gondwana Res. 2016, 34, 324–345. [Google Scholar] [CrossRef]
  13. Algeo, T.J.; Chen, Z.Q.; Fraiser, M.L.; Twitchett, R.J. Terrestrial-marine teleconnections in the collapse and rebuilding of Early Triassic marine ecosystems. Palaeogeogr. Palaeoclimatol. Palaeoecol. 2011, 308, 1–11. [Google Scholar] [CrossRef]
  14. Zhang, F.; Algeo, T.J.; Romaniello, S.J.; Cui, Y.; Zhao, L.; Chen, Z.-Q.; Anbar, A.D. Congruent Permian-Triassic δ238U records at Panthalassic and Tethyan sites: Confirmation of global-oceanic anoxia and validation of the U-isotope paleoredox proxy. Geology 2018, 46, 327–330. [Google Scholar] [CrossRef]
  15. Penn, J.L.; Deutsch, C.; Payne, J.L.; Sperling, E.A. Temperature-dependent hypoxia explains biogeography and severity of end-Permian marine mass extinction. Yearb. Paediatr. Endocrinol. 2019, 362, 11–30. [Google Scholar] [CrossRef]
  16. Song, H.; Huang, S.; Jia, E.; Dai, X.; Wignall, P.B.; Dunhill, A.M. Flat latitudinal diversity gradient caused by the Permian-Triassic mass extinction. Proc. Natl. Acad. Sci. USA 2020, 117, 17578–17583. [Google Scholar] [CrossRef]
  17. Garzanti, E.; Nicora, A.; Rettori, R. Permo-Triassic boundary and Lower to Middle Triassic in South Tibet. J. Asian Earth Sci. 1998, 16, 143–157. [Google Scholar] [CrossRef]
  18. Algeo, T.J.; Hannigan, R.; Rowe, H.; Brookfield, M.; Baud, A.; Krystyn, L.; Ellwood, B.B. Sequencing events across the Permian–Triassic boundary, Guryul Ravine (Kashmir, India). Palaeogeogr. Palaeoclim. Palaeoecol. 2007, 252, 328–346. [Google Scholar] [CrossRef]
  19. Bhargava, O.N.; Krystyn, L.; Balini, M.; Lein, R.; Nicora, A. Revised litho and sequence stratigraphy of the Spiti Triassic. Albertiana 2004, 30, 21–39. [Google Scholar]
  20. Tewari, R.; Pandita, S.K.; McLoughlin, S.; Agnihotri, D.; Pillai, S.S.; Singh, V.; Kumar, K.; Bhat, G.D. The Permian-Triassic paly-nological transition in the Guryul Ravine section, Kashmir, India: Implications for Tethyan-Gondwanan correlations. Earth Sci. Rev. 2015, 149, 53–66. [Google Scholar] [CrossRef] [Green Version]
  21. Brookfield, M.; Shellnutt, J.; Qi, L.; Hannigan, R.; Bhat, G.; Wignall, P. Platinum element group variations at the Permo-Triassic boundary in Kashmir and British Columbia and their significance. Chem. Geol. 2010, 272, 12–19. [Google Scholar] [CrossRef]
  22. Williams, J.C.; Basu, A.R.; Bhargava, O.N.; Ahluwalia, A.D.; Hannigan, R.E. Resolving original signatures from a sea of over-print—The geochemistry of the Gungri Shale (Upper Permian, Spiti Valley, India). Chem. Geol. 2012, 324, 59–72. [Google Scholar] [CrossRef]
  23. Stebbins, A.; Williams, J.; Brookfield, M.; Nye, S.W., Jr.; Hannigan, R. Frequent euxinia in southern Neo-Tethys Ocean prior to the end-Permian biocrisis: Evidence from the Spiti region, India. Palaeogeogr. Palaeoclim. 2019, 516, 1–10. [Google Scholar] [CrossRef]
  24. Krystyn, L.; Balini, M.; Nicora, A. Lower and Middle Triassic stage and substage boundaries in Spiti. Albertiana 2004, 30, 40–53. [Google Scholar]
  25. Bhargava, O.N. An updated introduction to the Spiti geology. J. Palaeontol. Soc. 2008, 53, 113–128. [Google Scholar]
  26. Ravizza, G.; Turekian, K.K. Application of the 187Re-187Os system to black shale geochronometry. Geochim. Cosmochim. Acta 1989, 53, 3257–3262. [Google Scholar] [CrossRef]
  27. Selby, D.; Creaser, R.A. Direct radiometric dating of the Devonian-Missippian time-scale boundary using the Re–Os black shale geochronometer. Geology 2005, 33, 545–548. [Google Scholar] [CrossRef]
  28. Kendall, B.; Creaser, R.A.; Gordon, G.W.; Anbar, A.D. Re-Os and Mo isotope systematics of black shales from the Middle Proterozoic Velkerri and Wollogorang Formations, McArthur Basin, northern Australia. Geochim. Cosmochim. Acta 2009, 73, 2534–2558. [Google Scholar] [CrossRef]
  29. Tripathy, G.R.; Hannah, J.L.; Stein, H.J. Refining the Jurassic-Cretaceous boundary: Re–Os geochronology and depositional envi-ronment of Upper Jurassic shales from the Norwegian Sea. Palaeogeogr. Palaeoclim. Palaeoecol. 2018, 503, 13–25. [Google Scholar] [CrossRef]
  30. Yang, G.; Hannah, J.; Zimmerman, A.; Stein, H.; Bekker, A. Re-Os depositional age for Archean carbonaceous slates from the southwestern Superior Province: Challenges and insights. Earth Planet. Sci. Lett. 2009, 280, 83–92. [Google Scholar] [CrossRef]
  31. Rooney, A.D.; Macdonald, F.A.; Strauss, J.V.; Dudas, F.O.; Hallmann, C.; Selby, D. Re–Os geochronology and coupled Os–Sr isotope constraints on the Sturtian snowball Earth. Proc. Natl. Acad. Sci. USA 2014, 111, 51–56. [Google Scholar] [CrossRef] [Green Version]
  32. Pašava, J.; Zaccarini, F.; Aiglsperger, T.; Vymazalová, A. Platinum-group elements (PGE) and their principal carriers in metal-rich black shales: An overview with a new data from Mo-Ni-PGE black shales (Zunyi region, Guizhou Province, south China). J. Geosci. 2013, 58, 209–216. [Google Scholar] [CrossRef]
  33. Georgiev, S.V.; Stein, H.J.; Yang, G.; Hannah, J.L.; Böttcher, M.E.; Grice, K.; Holman, A.I.; Turgeon, S.; Simonsen, S.; Cloquet, C. Late Permian-Early Triassic environmental changes recorded by multi-isotope (Re–Os–N–Hg) data and trace metal distribution from the Hovea-3 section, Western Australia. Gondwana Res. 2020, 88, 353–372. [Google Scholar] [CrossRef]
  34. Liu, Z.; Selby, D.; Zhang, H.; Zheng, Q.; Shen, S.; Sageman, B.B.; Grasby, S.E.; Beauchamp, B. Osmium-isotope evidence for vol-canism across the Wuchiapingian-Changhsingian boundary interval. Chem. Geol. 2019, 529, 119313. [Google Scholar] [CrossRef]
  35. Liu, Z.; Selby, D.; Zhang, H.; Shen, S. Evidence for volcanism and weathering during the Permian-Triassic mass extinction from Meishan (South China) osmium isotope record. Palaeogeogr. Palaeoclim. Palaeoecol. 2020, 553, 109790. [Google Scholar] [CrossRef]
  36. Veizer, J.; Ala, D.; Azmy, K.; Bruckschen, P.; Buhl, D.; Bruhn, F.; Carden, G.A.; Diener, A.; Ebneth, S.; Godderis, Y.; et al. 87Sr/86Sr, δ13C and δ18O evolution of Phanerozoic seawater. Chem. Geol. 1999, 161, 59–88. [Google Scholar] [CrossRef] [Green Version]
  37. Hu, X.-M.; Garzanti, E.; An, W. Provenance and drainage system of the Early Cretaceous volcanic detritus in the Himalaya as constrained by detrital zircon geochronology. J. Palaeogeogr. 2015, 4, 85–98. [Google Scholar] [CrossRef] [Green Version]
  38. Scotese, C.R.; Golonka, J. Paleomap Project, Paleogeographic Atlas; University of Texas at Arlington: Arlington, TX, USA, 1997; pp. 1–45. [Google Scholar]
  39. Kapoor, H.M. The Guryul ravine section, candidate of the global stratotype and point (GSSP) of the Permian-Triassic boundary (PTB). In The Paleozoic-Mesozoic Boundary: Candidates of the Global Stratotype Section and Point of the Permian-Triassic Boundary; Yin, H., Ed.; China University Geosciences Press: Wuhan, China, 1996; pp. 99–110. [Google Scholar]
  40. Brookfield, M.E.; Twitchett, R.J.; Goodings, C. Palaeoenvironments of the Permian-Triassic transition sections in Kashmir, India. Palaeogeogr. Palaeoclim. Palaeoecol. 2003, 198, 353–371. [Google Scholar] [CrossRef]
  41. Tripathy, G.R.; Singh, S.K.; Bhu, H. ReOs isotopes and major and trace element geochemistry of carbonaceous shales, Aravalli Supergroup, India: Impact of post-depositional processes. Chem. Geol. 2013, 354, 93–106. [Google Scholar] [CrossRef]
  42. Ackerman, L.; Pašava, J.; Šípková, A.; Martínková, E.; Haluzová, E.; Rodovská, Z.; Chrastný, V. Copper, zinc, chromium and osmium isotopic compositions of the Teplá-Barrandian unit black shales and implications for the composition and oxygenation of the Neoprotero-zoic-Cambrian ocean. Chem. Geol. 2019, 521, 59–75. [Google Scholar] [CrossRef]
  43. Selby, D.; Creaser, R.A. Re–Os geochronology of organic rich sediments: An evaluation of organic matter analysis methods. Chem. Geol. 2003, 200, 225–240. [Google Scholar] [CrossRef]
  44. Cohen, A.S.; Waters, F. Separation of osmium from geological materials by solvent extraction for analysis by thermal ionisation mass spectrometry. Anal. Chim. Acta 1996, 332, 269–275. [Google Scholar] [CrossRef]
  45. Birck, J.L.; Barman, M.R.; Capmas, F. Re–Os Isotopic Measurements at the Femtomole Level in Natural Samples. Geostand. Geoanal. Res. 1997, 21, 19–27. [Google Scholar] [CrossRef]
  46. Rahaman, W.; Singh, S.K.; Sinha, R.; Tandon, S. Sr, C and O isotopes in carbonate nodules from the Ganga Plain: Evidence for recent abrupt rise in dissolved 87Sr/86Sr ratios of the Ganga. Chem. Geol. 2011, 285, 184–193. [Google Scholar] [CrossRef]
  47. Weis, D.; Kieffer, B.; Maerschalk, C.; Barling, J.; De Jong, J.; Williams, G.A.; Hanano, D.; Pretorius, W.; Mattielli, N.; Scoates, J.S.; et al. High-precision isotopic characterization of USGS reference materials by TIMS and MC-ICP-MS. Geochem. Geophy. Geosy. 2006, 7, 8. [Google Scholar] [CrossRef]
  48. Danish, M.; Tripathy, G.R.; Panchang, R.; Gandhi, N.; Prakash, S. Dissolved boron in a brackish-water lagoon system (Chilika lagoon, India): Spatial distribution and coastal behavior. Mar. Chem. 2019, 214, 103663. [Google Scholar] [CrossRef]
  49. Peucker-Ehrenbrink, B.; Jahn, B.-M. Rhenium-osmium isotope systematics and platinum group element concentrations: Loess and the upper continental crust. Geochem. Geophys. Geosyst. 2001, 2. [Google Scholar] [CrossRef]
  50. Lu, X.; Kendall, B.; Stein, H.; Hannah, J. Temporal record of osmium concentrations and 187Os/188Os in organic-rich mudrocks: Implications for the osmium geochemical cycle and the use of osmium as a paleoceanographic tracer. Geochim. Cosmochim. Acta. 2017, 216, 221–241. [Google Scholar] [CrossRef]
  51. Sheen, A.I.; Kendall, B.; Reinhard, C.T.; Creaser, R.A.; Lyons, T.W.; Bekker, A.; Poulton, S.W.; Anbar, A.D. A model for the oceanic mass balance of rhenium and implications for the extent of Proterozoic ocean anoxia. Geochim. Cosmochim. Acta 2018, 227, 75–95. [Google Scholar] [CrossRef] [Green Version]
  52. Ludwig, K. Isoplot/Ex Version 3.75, A Geochronological Toolkit for Microsoft Excel; Berkeley Geochronology Center: Berkeley, CA, USA, 2012; Volume 5, p. 75. [Google Scholar]
  53. Rudnick, R.L.; Gao, S. Composition of the continental crust. In The Crust; Holland, H.D., Turekian, K.K., Eds.; University of Maryland: College Park, MD, USA, 2003; Volume 3, pp. 1–64. [Google Scholar]
  54. McArthur, J.M.; Algeo, T.J.; Van De Schootbrugge, B.; Li, Q.; Howarth, R.J. Basinal restriction, black shales, Re–Os dating and the Early Toarcian (Jurassic) oceanic anoxic event. Paleoceanography 2008, 23, 1–22. [Google Scholar] [CrossRef] [Green Version]
  55. Jaffe, L.A.; Peucker-Ehrenbrink, B.; Petsch, S.T. Mobility of rhenium, platinum group elements and organic carbon during black shale weathering. Earth Planet. Sci. Lett. 2002, 198, 339–353. [Google Scholar] [CrossRef]
  56. Tripathy, G.R.; Singh, S.K. Re–Os depositional age for black shales from the Kaimur Group, Upper Vindhyan, India. Chem. Geol. 2015, 413, 63–72. [Google Scholar] [CrossRef]
  57. McArthur, J.; Howarth, R.; Shields, G. Strontium Isotope Stratigraphy. Geol. Time Scale 2012, 1, 127–144. [Google Scholar] [CrossRef]
  58. Singh, S.K.; Trivedi, J.; Pande, K.; Ramesh, R.; Krishnaswami, S. Chemical and Strontium, Oxygen and Carbon Isotopic Compositions of Carbonates from the Lesser Himalaya: Implications to the Strontium Isotope Composition of the Source Waters of the Ganga, Ghaghara, and the Indus Rivers. Geochim. Cosmochim. Acta 1998, 62, 743–755. [Google Scholar] [CrossRef]
  59. Tucker, M.E. Sedimentary Petrology; Blackwell Science: Hoboken, NJ, USA, 1991. [Google Scholar]
  60. Garaguly, I.; Varga, A.; Raucsik, B.; Schubert, F.; Czuppon, G.; Frei, R. Pervasive early diagenetic dolomitization, subsequent hydrothermal alteration, and late stage hydrocarbon accumulation in a Middle Triassic carbonate sequence (Szeged Basin, SE Hungary). Mar. Pet. Geol. 2018, 98, 270–290. [Google Scholar] [CrossRef]
  61. Warren, J. Dolomite: Occurrence, evolution and economically important associations. Earth Sci. Rev. 2000, 52, 1–81. [Google Scholar] [CrossRef]
  62. Banner, J.L. Application of the trace element and isotope geochemistry of strontium to studies of carbonate diagenesis. Sedimentology 1995, 42, 805–824. [Google Scholar] [CrossRef]
  63. Veizer, J. Chemical diagenesis of carbonates: Theory and application. Stable Isot. Sediment. Geol. 1983, 10, 3–100. [Google Scholar]
  64. Derry, L.A.; Kaufman, A.J.; Jacobsen, S.B. Sedimentary cycling and environmental change in the Late Proterozoic: Evidence from stable and radiogenic isotopes. Geochim. Cosmochim. Acta 1992, 56, 1317–1329. [Google Scholar] [CrossRef]
  65. Tucker, M.E.; Hollingworth, N.T.J. The Upper Permian Reef Complex (EZ1) of North East England: Diagenesis in a Marine to Evaporitic Setting; Metzler, J.B., Ed.; Springer: Berlin/Heidelberg, Germany, 1986; pp. 270–290. [Google Scholar]
  66. Worden, R.H.; Burley, S.D. Sandstone Diagenesis: The Evolution of Sand to Stone. In Sandstone Diagenesis; John Wiley & Sons: Hoboken, NJ, USA, 2009; pp. 1–44. [Google Scholar]
  67. Bickle, M.J.; Harris, N.B.W.; Bunbury, J.M.; Chapman, H.J.; Fairchild, I.J.; Ahmad, T. Controls on the 87Sr/86Sr Ratio of Carbonates in the Garhwal Himalaya, Headwaters of the Ganges. J. Geol. 2001, 109, 737–753. [Google Scholar] [CrossRef] [Green Version]
  68. Ravizza, G.; Turekian, K.; Hay, B. The geochemistry of rhenium and osmium in recent sediments from the Black Sea. Geochim. Cosmochim. Acta 1991, 55, 3741–3752. [Google Scholar] [CrossRef]
  69. Peucker-Ehrenbrink, B.; Ravizza, G. The marine osmium isotope record. Terra Nova 2000, 12, 205–219. [Google Scholar] [CrossRef]
  70. Yang, G.; Chen, J.; Du, A.; Qu, W.; Yu, G. Re–Os dating of Mo-bearing black shale of the Laoyaling deposit, Tongling, Anhui Province, China. Chin. Sci. Bull. 2004, 49, 1396–1400. [Google Scholar] [CrossRef]
  71. Georgiev, S.V.; Stein, H.J.; Hannah, J.L.; Henderson, C.M.; Algeo, T.J. Enhanced recycling of organic matter and Os-isotopic evidence for multiple magmatic or meteoritic inputs to the Late Permian Panthalassic Ocean, Opal Creek, Canada. Geochim. Cosmochim. Acta 2015, 150, 192–210. [Google Scholar] [CrossRef]
  72. Black, B.A.; Neely, R.R.; Lamarque, J.-F.; Elkins-Tanton, L.T.; Kiehl, J.T.; Shields, C.A.; Mills, M.J.; Bardeen, C. Systemic swings in end-Permian climate from Siberian Traps carbon and sulfur outgassing. Nat. Geosci. 2018, 11, 949–954. [Google Scholar] [CrossRef]
  73. Racionero-Gómez, B.; Sproson, A.; Selby, D.; Gannoun, A.; Gröcke, D.; Greenwell, H.; Burton, K. Osmium uptake, distribution, and 187Os/188Os and 187Re/188Os compositions in Phaeophyceae macroalgae, Fucus vesiculosus: Implications for determining the 187Os/188Os composition of seawater. Geochim. Cosmochim. Acta 2017, 199, 48–57. [Google Scholar] [CrossRef] [Green Version]
  74. Racionero-Gómez, B.; Sproson, A.D.; Selby, D.; Gröcke, D.R.; Redden, H.; Greenwell, H.C. Rhenium uptake and distribution in phaeophyceae macroalgae, Fucus vesiculosus. R. Soc. Open Sci. 2016, 3, 160161. [Google Scholar] [CrossRef] [PubMed] [Green Version]
  75. Rooney, A.D.; Selby, D.; Lloyd, J.M.; Roberts, D.H.; Lückge, A.; Sageman, B.B.; Prouty, N.G. Tracking millennial-scale Holocene glacial advance and retreat using osmium isotopes: Insights from the Greenland ice sheet. Quat. Sci. Rev. 2016, 138, 49–61. [Google Scholar] [CrossRef] [Green Version]
Figure 1. (A) Geological map showing sample location from the Himalaya, India. Simplified stratigraphic detail of (B) Guryul Ravine and (C) Spiti valley sections are also included. Figure modified from [20,37]. The Paleo-geographic map is modified from [38].
Minerals 11 00417 g001
Figure 2. Covariation of Re with (A) total organic carbon (TOC) and (B) Os for the black shales from the Spiti valley and Guryul Ravine from the Himalaya. Shales from the Spiti valley are characterized with systematically higher TOC, Re and Os concentrations compared to those for the Guryul Ravine samples. For reference, the Re/Os ratio of seawater [51] and upper continental crust (UCC) [49] are also shown in the figure (B).
Minerals 11 00417 g002
Figure 3. 187Re–187Os isochron for the black shales from the Gungri Formation, Spiti Valley yields an age of 255 ± 22 Ma (2σ; n = 8; MSWD ~ 5.7).
Minerals 11 00417 g003
Figure 4. The Re–Os isochron plot of the siltstones from the Guryul Ravine showing the deviation from the “250-Ma” reference line.
Minerals 11 00417 g004
Figure 5. Measured Sr isotopic values of the Induan carbonate samples from the Spiti Valley, India. Data for seawater Sr isotopic trend are from [36].
Minerals 11 00417 g005
Figure 6. Positive correlations between (A) Sr and Mn concentrations, and (B) Sr/Ca and 87Sr/86Sr ratios of the carbonate samples (Mikin Formation) confirm post-depositional alteration of the samples.
Minerals 11 00417 g006
Figure 7. Global distribution of 187Re/188Os ratios for Late Permian sedimentary rocks from India (this study), Canada [71], Australia [33], South China [34], North China [70], East Greenland [8], Norway [8] and Poland [32]. The circles present the data point, whereas the box presents the data variance. Paleo-geographic position of these sites is shown in Figure 1; the sites in Figure 1 are referenced as per the number mentioned in the parentheses. The red box represents data from this study.
Minerals 11 00417 g007
Table 1. Geochemical and Re–Os isotopic data for the Late Permian rocks from two Himalayan sedimentary sections (Kashmir and Spiti valley, India).
Sample IDCaCO3 (wt%)TOC (wt%)Re (ng/g)Os (pg/g)192Os (pg/g)187Re/188Os187Os / 188OsRho *
Gungri Formation, Atargu, Spiti valley
ASL16/140.331.5710.08 ± 0.03151 ± 148416 ± 42.355 ± 0.0280.79
ASL16/14F0.141.457.70 ± 0.04104 ± 132473 ± 32.623 ± 0.0170.44
ASL16/180.501.366.07 ± 0.0295 ± 131393 ± 62.255 ± 0.0410.75
ASL16/16A0.081.354.27 ± 0.0390 ± 131278 ± 41.826 ± 0.0340.70
ASL16/16B0.171.324.60 ± 0.03103 ± 136257 ± 41.665 ± 0.0300.67
ASL16/20A1.001.395.38 ± 0.03106 ± 236300 ± 31.860 ± 0.0340.61
ASL16/20B0.671.395.47 ± 0.0396 ± 1 31347 ± 62.115 ± 0.0410.75
ASL16-20C0.751.425.70 ± 0.0397 ± 132358 ± 62.135 ± 0.0400.75
Khunamuh Formation, Guryul Ravine, Kashmir
GR15-E2/15A1b.d.1.061.71 ± 0.0272 ± 126133 ± 31.356 ± 0.0380.54
GR15-E2/15A2b.d.1.032.64 ± 0.0377 ± 128185 ± 41.103 ± 0.0280.47
GR15-E2/15B1b.d.1.071.35 ± 0.0266 ± 124109 ± 31.072 ± 0.0340.41
GR15-E2/15B2b.d.1.051.69 ± 0.0269 ± 125132 ± 31.052 ± 0.0380.48
GR15-E2/15C1b.d.1.052.70 ± 0.02105 ± 137146 ± 21.501 ± 0.0270.58
GR15-E2/15C2b.d.1.062.86 ± 0.0292 ± 133175 ± 31.459 ± 0.0290.6
GR15-E2/15D1b.d.0.530.82 ± 0.0277 ± 12858 ± 21.101 ± 0.0280.3
GR15-E2/15D2b.d.0.520.73 ± 0.0273 ± 12754 ± 21.093 ± 0.0310.28
* Rho stands for error correlation function; errors are in ±2σ; b.d.: below detection level. A, B, C and D in sample ID refers to separate powdering aliquots from the same strata.
Table 2. Elemental and Sr isotopic data for carbonate samples from the Mikin Formation, Spiti valley.
Sample IDCaCO3 (wt%)MnSr87Sr/86Sr in Carbonate Leaches *
µg/g10% Acetic Acid0.1 N HCl
ASL16/0252.1102066100.717698 ± 0.0000040.717159 ± 0.000004
ASL16/0387.188005430.715508 ± 0.0000030.715320 ± 0.000003
ASL16/0490.41104711820.718374 ± 0.0000040.718322 ± 0.000004
ASL16/0584.3101988850.718132 ± 0.0000030.717911 ± 0.000003
ASL16/05R----0.717903 ± 0.000003
ASL16/0686.346648150.716243 ± 0.0000040.716198 ± 0.000003
ASL16/06R---0.716266 ± 0.000004-
* Average 87Sr/86Sr for NBS-987 standard is 0.710246 ± 0.000013 (2σ; n = 12); R stand for replicate analyses. -: not analyzed.
Publisher’s Note: MDPI stays neutral with regard to jurisdictional claims in published maps and institutional affiliations.

