Article

Characterization of Waste Sludge Pigment from Production of ZnCl2

1
Department of Thermal Engineering, Faculty of Materials Science and Technology, VSB-Technical University of Ostrava, 17. Listopadu 2172/15, 708 00 Ostrava, Czech Republic
2
Nanotechnology Centre, CEET, VSB-Technical University of Ostrava, 17. Listopadu 2172/15, 708 00 Ostrava, Czech Republic
3
Institute of Environmental Technology, CEET, VSB-Technical University of Ostrava, 17. Listopadu 2172/15, 708 00 Ostrava, Czech Republic
4
Department of Non-Ferrous Metals, Refining and Recycling, Faculty of Materials Science and Technology, VSB-Technical University of Ostrava, 17. Listopadu 2172/15, 708 00 Ostrava, Czech Republic
*
Author to whom correspondence should be addressed.
Minerals 2021, 11(3), 313; https://doi.org/10.3390/min11030313
Submission received: 14 February 2021 / Revised: 10 March 2021 / Accepted: 15 March 2021 / Published: 17 March 2021
(This article belongs to the Special Issue Spectral Behavior of Mineral Pigments)

Abstract

:
This study is focused on the treatment of waste sludge from a zinc chloride production in order to prepare iron-rich pigments usable for a production of glazes. In galvanizing plants, yellow waste sludge containing significant amount of ZnO, Cl, and Fe2O3, is formed. This raw waste sludge cannot be used as a pigment in glaze. Therefore, three methods of treating this material were proposed: (a) washing with H2O, (b) calcination at 180 °C and washing by H2O, and (c) calcination at 900 °C and washing by H2O. These methods helped to reduce Zn and Cl content up to 97%. According to X-ray fluorescence analysis percentage of Fe2O3 increased from ~41% to ~98%. X-ray power diffraction analysis confirmed the formation of α-Fe2O3 (hematite) in the pigment prepared. Scanning electron microscopy with Energy dispersive X-ray analysis showed clusters of rounded particles, and also the change in size of particles after calcination was observed. Particle size, specific surface area, and density measurements together with thermogravimetric and differential thermal analyses were performed. Pigments prepared from the waste sludge were added to transparent glaze in amounts of 1, 5, 10, and 15 wt.%. Pigment-containing glazes were applied by spraying on fired ceramic tiles and then fired at 1060 °C. Color of glazes was determined by (Commission Internationale de l’Eclairage) CIE L*a*b* coordinates as colorless, light brown shades, brown-red, brown-yellow, and deep red-brown. Comparison with colors of glazes prepared using commercial pigments was also performed. Waste sludge can be used to prepare pigments and glazes containing pigments as an alternative to commercial products.

Graphical Abstract

1. Introduction

Preparation of glaze and pigment is an excellent alternative for recycling materials. The global pigment consumption in the industry is expected to be 282.7 thousand t in 2023/$8 bn, and, in Europe, it is expected to increase to approximately 85 thousand t. Pigments are widely applied in numerous industrial sectors, such as civil engineering, production of paper, paints, dyes, ceramic materials (18 thousand t in 2023), plastic materials, etc. This is the consumption for example: of mixed metal oxide pigments (60 thousand t), pearlescent pigments (71 thousand t), organic pigments (44 thousand t), metallic pigments (94 thousand t), and specialty pigments (14 thousand t) [1]. Pigments can be classified as inorganic, organic, and synthetic. They must fulfill three main requirements: thermal stability, chemical stability, and high colorings power [2].
Inorganic pigments exhibit covering properties, coloring properties, or other special features, and can be divided as follows: (a) white pigments, (b) black pigments, and (c) colored pigments. Their other special features are the anticorrosion properties (ferrite pigments) [3], but pigments can be also metallic, nacreous, luminescent [4], magnetic [5], or anti-rust [6]. The quality of pigment depends on the optical and physical properties. Inorganic pigments are powder substances coloring the environment (binder) in which where they are dispersed, or coloring the surface on which they are applied. Ceramic pigments are compounds of inorganic origin with various crystal structures. Ceramic pigments are formed by a thermally stable host lattice (MgAl2O4, TiZn2O4, ZrSiO4, TiO2, etc.), which is colorless in its pure form, and a chromophore determining the color of the resulting pigment and refractive indices of individual compounds. This property is very important because high refractive index of the pigment particles relative to the refractive index of the medium where it is dispersed indicates the quality of the pigment. By changing the amount of the individual compounds, or changing the stoichiometric representation of the elements in the structure, it is possible to prepare pigment shades for coloring ceramic glaze. Varying calcination conditions can also be used to achieve different color shades.
The most important property of the pigment is the color (the ability of pigmentation), and the ability to get dispersed in a matrix. The thermal stability of pigments in a ceramic material or engobe is determined to be between 1200 and 1300 °C. The pigment in the glaze and the pigment for decoration must be stable at temperatures of 1000–1200 °C and 625–775 °C, respectively [7,8,9].
Iron pigments, both natural and synthetic, have low cost of production and significant advantages for industrial purposes. The treatment of iron pigment can result in changes in color, such as black/magnetite, red/hematite, brown/maghemite, yellow/goethite, and orange/lepidocrocite [10,11]. The natural iron pigments comprise the following compounds: limonite (Fe2O3.xH2O) from yellow to red ocher, goethite (Fe3+O(OH))—red-brown, hematite (α-Fe2O3)—metallic grey ferrous mica. Naturally-hydrated Fe3+ oxides were used as pigments already in an Early Stone Age.
Many inorganic pigments are prepared with metallic oxides or salts. Interesting is the preparation of ferrous pigments by chemical means from waste raw materials, using precipitation reactions, in the form of ferrous precursors, e.g., magnetite (Fe3O4) [12,13], goethite α-FeO (OH), hematite (α-Fe2O3) [14,15,16], and maghemite γ-Fe2O3 [17,18]. α-Fe2O3, which can be further prepared, e.g., by the hydrothermal approach [19], sol-gel process, chemical precipitation, high-temperature thermal oxidation, etc. [20].
The path to the preparation of iron-rich pigments begins with the processing of ZnCl2. The ZnCl2 is a crystalline and hygroscopic powder exhibiting thermochromic properties. ZnCl2 is anhydrous with a density of 1400–1700 kg/m3, with pH value of 5. The color of the powder is white or slightly greyish. Heated to a temperature of 500–700 °C, molten anhydrous ZnCl2 dissolves metallic zinc. When this melt is rapidly cooled, yellow diamagnetic glass is formed. Raman spectroscopy analyses show that the yellow glass formed contains zinc ions. As the temperature increases, the color changes from white to yellow. This change in color is caused by lattice imperfections. Oxygen molecules are lost. The reaction of ZnO with acids proceeds as follows Equation (1) and in alkaline medium, and the following reaction occurs, as in Equation (2) [21]:
ZnO + 2HCl = H2O + ZnCl2,
ZnO + 2NaOH + H2O → Na2[Zn(OH)4]].
ZnCl2 is used in industry for metal surface treatment and electroplating, as an electrolyte or ion exchanger, in chemical syntheses, etc. [22,23,24,25]. Industrially, ZnCl2 is prepared from so-called overhaul acids, which are obtained in galvanizing plants by dissolving zinc coating on poorly galvanized objects (and aids and tools) in HCl. The Fe content in overhaul acids thus prepared is usually >1.5%. At the beginning of production, Fe is neutralized by the so-called zinc ash, which is also a waste product from galvanizing plants.
Subsequently, the iron ions are oxidized by H2O2. Because Fe2+ ions hydrolyze at higher pH than Zn2+ ions, it is necessary to achieve oxidation of all Fe to the oxidation state III. Hydrolytic precipitation is based on the different stability of the hydroxide precipitates depending on the pH of the solution. The hydrolytic precipitation of Fe can be described as follows in Equation (3):
Fe3+ + 3 H2O → Fe(OH)3 + 3H+.
The precipitate formed is filtered on a sludge filter press. Subsequently, metals nobler than Zn are removed from ZnCl2 solution by cementation process. Zn powder is used as a cementing agent. The efficiency and kinetics of the cementation process increase with increasing temperature, and the solution pH required lies in the range of 4 to 5. The reaction can be described by the following general mechanism in Equation (4):
Zn + Me2+ → Me + Zn2+.
This study is focused on the treatment of waste sludge from the ZnCl2 production in order to prepare iron pigments usable for a production of glazes. The waste sludge primarily contains ZnO, Cl, and Fe2O3. In its original form, it is yellow, due to the high percentage of Cl. To obtain pigment of good quality, the waste sludge calcination at 180 °C and 900 °C, and subsequent washing in water was proposed. The choice of temperatures is based on previous experiments performed by our research group. The materials studied in this work were characterized by a wide range of methods (X-ray powder diffraction (XRPD), thermogravimetric analysis (TG), differential thermal analysis (DTA), scanning electron microscopy (SEM), energy dispersive X-ray analysis (EDAX), X-ray fluorescence analysis (XRF), Brunauer-Emmett-Teller (BET) surface area analysis). Particle size distribution and density were also determined. Iron-rich pigments successfully prepared from the waste sludge were added to a transparent glaze and sprayed on ceramic tiles. The firing was performed at 1060 °C. The described procedure led to obtaining glazes with different color and intensity, with a compact appearance, gloss and without visible defects on the surface. Colorimetric analysis was used to compare colors of glazes prepared using our pigments with colors of glazes prepared using commercial pigments. This study shows how the waste sludge can be used to prepare products—pigments and pigment-containing glazes—alternative to commercial products.

2. Materials and Methods

2.1. Materials

All materials were obtained from the Czech Republic. Ceramic white slurry (labeled as CS) was obtained from Pávek Keramika, spol. s r.o. (Doubravice nad Svitavou, Czech Republic). Transparent glaze (labeled as TG) is a commercial white powder produced by Glazura s.r.o. company (Dobřín, Czech Republic). In the experiment, three types of commercial pigment (labeled as SP1, SP2, SP3) with visible different color SP1 (red), SP2 (light brown), and SP3 (dark brown) were used (Figure 1). Materials described above were used for recipe of glazes shown in Table 1, and chemical composition of these raw materials is presented in Table 2, part 3.1.
These pigments were applied in their original form. These are synthetic inert pigments, without any other additives (fillers), very finely ground, with very good colorability, opacity, and particles distribution, resistant to weathering and chemicals, non-toxic, and thermally stable up to 800 °C. Pigments are determined according to ČSN EN 12878—Pigments for the colouring of building materials based on cement and/or lime. (European Standard specifying requirements and testing methods for pigment intended to use in the coloring of building materials based on cement and cement lime combinations. List of relevant pigments for this application is available in European Standards EN 459 1 and EN 459 2). Pigments typically belong to one of the following classes: synthetic oxides, natural oxides, or iron hydroxides.
The material studied was a waste Fe sludge obtained as a secondary product during production of ZnCl2. Untreated form of the waste sludge (labeled as WFS) from the production of zinc oxide (see Figure 5, yellow color samples) is not suitable as a pigment. Therefore, three methods have been proposed to prepare a pigment applicable to glazes: (a) waste Fe sludge washed by H2O (labeled as WFS/0 and in an experiment called as the original form), (b) waste Fe sludge washed by H2O and calcined at 180 °C (labeled as WFS/180), and (c) waste Fe sludge washed by H2O and calcined at 900 °C (labeled as WFS/900).

2.2. Sample Preparation

Two recipes of prepared glazes (Table 1) were mixed. Recipe 1 contains 6 different mixtures of glazes. As a pigment, 1, 5, 10, or 15 wt.% of the waste Fe sludge was added into the transparent glaze (Table 2). Recipe 2 can be called “comparative” because of mixing transparent glaze with 10 wt.% of commercial (standard) pigments. Individually prepared mixtures (WFS/0; WFS/180; WFS/900 + TG) and (SP1; SP2; SP3; + TG) were homogenized in ball mill device with contain the content of 50% alumina balls by wet milling (5% H2O) for 30 min. The wet mixture was sieved through a 0.2 mm sieve. The obtained suspension was mixed with water to reach the composition expressed by weight of glaze. The range of litter weight was determined to be from 1442 to 1550 g.L−1. The liter gravity of glaze was determined in a 1 L graduated cylinder. First, the weight of the empty container was determined. Subsequently, the container with the glaze in it was weighed and the weight of the empty container was subtracted.
Ceramic tiles were prepared by casting into gypsum form having dimensions 10 × 10 cm2 (fireclay slurry with a water content of approximately 34%). The ceramic tiles were dried at 105 °C and fired in an electric resistance furnace (LAC M125/13HTCeramic, CZ) at a maximum temperature of 900 °C for 60 min. The glazes were applied by spraying method to ensure of compact layers on the surfaces of tiles.
In this experiment, the final firing was gradually specified. Firing I: This was originally designed for a temperature of 1060 °C, at a rate of 3 °C/min, and it was without a dwell at this temperature. The samples glazed in this way showed craters on the surface. Craters are usually formed due to gas leakage from the glaze. In this case, the reason might have been the presence of ZnO in the pigment. Firing II: The optimal firing curve for this type of pigment was with two dwells: 30 min/600 °C and 60 min/1060 °C.

2.3. Characterization Techniques

  • Chemical composition of raw materials was determined using energy dispersive fluorescence spectrometer SPECTRO XEPO (SPECTRO Analytical Instruments GmbH, Kleve, Germany), equipped with 50 Watt Pd X-ray tube.
  • The phase composition of samples was characterized using a Bruker D8 Advance X-ray powder diffractometer (Bruker AXS GmbH, Karlsruhe, Germany). The diffraction patterns in the range of 5° to 70° 2θ were recorded under CoKα (λ = 1.78897 Å, U = 35 kV, I = 25 mA) irradiation with scanning rate 2°/min using fast position-sensitive detector VÅNTEC1.
  • The morphology of the particles was characterized using the scanning electron microscope (SEM) QUANTA 450 FEG, (FEI, Hillsboro, OR, USA); the images were collected using a secondary electron detector.
  • The particle size distribution (PSD) was analyzed using Mastersizer (Malvern Panalytical Ltd., Malvern, UK). Measurements were performed in an aquatic environment, and ultrasound was used for homogenization of the suspension.
  • The characterization of the thermal behavior was performed on TG/DTAanalyzer STA504 (TA Instruments, New Castle, Delaware, USA). The sample of scale placed in alumina crucible was analyzed in a temperature range from 21 to 1100 °C in the dynamic atmosphere of N2 (5 L⋅h−1), and the heating rate was 10 K·min−1.
  • The reflectance spectra of the final glazes in the spectral range 400–700 nm were obtained using MiniScan EZ0828 spectrometer (HunterLab, Reston, VA, USA), model 45°/0°, small observation area. The color of the glazes was expressed using CIE L*a*b* coordinates calculated for 10° observer and D65 illuminant.
  • Specific surface area was determined by BET method-equipment (Quantachrome NovaWin Instrument-Acquisition and Reduction for NOVA instrument, analysis gas nitrogen, Graz, Austria).
  • Density of samples was determined by Pycnomatic and Pycnomatic ATC (Helium pycnometer) POROTEC GmbH, Coconut Creek, FL, USA.

3. Results and Discussion

3.1. Chemical Composition

Chemical composition of original materials (CS, WFS, FWS/0, WFS/180, and TG) used in experiments is provided in Table 2. The main oxides in the ceramic slurry (CS) are SiO2 and Al2O3 (over 83 wt.%), and ~4 wt.% of Fe2O3 and CaO was also found. Transparent glaze (TG) contains ~80 wt.% of SiO2, 9 wt.% of Al2O3 and 5 wt.% of Na2O. The waste Fe sludge (WFS) in original form (presented as yellow color in Figure 5) contains 41 wt.% of Fe2O3 and high content of chlorine (22 wt.%) and zinc oxide (up to 29 wt.%). After washing the waste sludge by H2O (WFS/0), the amount of chlorine and ZnO significantly decreased to 2.4 wt.% and 1.5 wt.%, respectively (Table 2). On the contrary, the amount of iron oxide reached 90 wt.% at sample WFS/0 and more than 97 wt.% at sample WFS/180 (Table 2). The differences in the composition of the WFS/180 and WFS/900 samples did not exceed 0.5 wt.%.
Commercial pigments are prepared by synthetic ways. Large amount of Fe2O3 expected in these pigments was confirmed by chemical analysis (Table 2). The red color pigment (SP1) contains over 97 wt.% of Fe2O3. The light brown pigment SP2 contains 95 wt.% of Fe2O3, and the last one, dark brown pigment SP3, contains 96 wt.% of Fe2O3.

3.2. Phase Composition of Commercial Pigments

X-ray diffraction analysis showed (Figure 2) showed the most intense reflections of hematite (α-Fe2O3) [26,27,28] in all three pigments. Moreover, magnetite was detected in samples SP2 (Figure 2b) and SP3 (Figure 2c). Only one phase was found in the pigment SP1 (Figure 2a), i.e., hematite with the most intense reflection at the position of 38° 2θ. In the case of light brown pigment SP2, the presence of three phases was found: α-hematite and magnetite at position 42° 2θ, and maghemite (γ-Fe2O3) at position 13° 2θ. The color of maghemite corresponds to the color of the SP2 pigment. In the case of the dark brown pigment SP3, dominant reflections of hematite and magnetite at the position 42–44 ° 2θ are present. In addition, reflections of wüstite (FeO) can be observed at the following positions: 42°, 50°, and 74° 2θ.

3.3. Granulometry of Commercial Pigments

The synthetic pigments SP1, SP2, and SP3 are very fine powders. All curves on (Figure 3) reveal very similar grain size. Red pigments SP1 have grained size Dv(10) = 0.95 µm, Dv(50) = 9.38 µm, and Dv(90) = 66.7 µm. The parameters of light brow pigment SP2 are Dv(10) = 0.47 µm, Dv(50) = 5.83 µm, and Dv(90) = 19.4 µm, while the parameters of the distribution curve of dark brown pigment SP3 are Dv(10) = 0.43 µm, Dv(50) = 7.02 µm, and Dv(90) = 28.4 µm. The optimum size of pigment particles for most applications is 0.1–10 µm. From the measured data, it can be concluded that the synthetic pigments SP1, SP2, SP3 have the properties declared by the manufacturer.

3.4. SEM Analysis of Commercial Pigments

Commercial pigments show exhibit a considerable heterogeneity of the particles, as shown by SEM analysis (Figure 4). The particles of these pigments have an irregular shape (see Figure 4B,C-1, with scale 20 µm). Image with scale 200 µm (Figure 4C-2) also do not show the presence of spherical grains. Based on SEM analysis, it can be stated that, in terms of particle shape (affecting pigment dispersibility), commercial pigments SP1 (Figure 4A) SP2 (Figure 4B), and SP3 (Figure 4C-1,C-2) are not ideal powder systems.

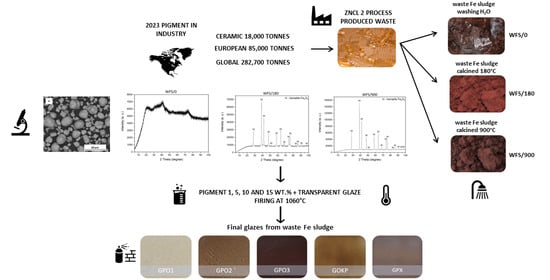
3.5. The Treatment of Waste Fe Sludge

The waste Fe sludge (Figure 5, labeled as WFS/0) was delivered in piece form containing over 23% of moisture. The aim was not only to achieve as much iron content in the mixture as possible but also to eliminate chlorine content. Three methods were designed for this process, with the resulting color effect of individual pigments (see Figure 5):
  • WFS/0—Waste Fe sludge washed by H2O by 1 L H2O/300 g of WFS,
  • WFS/180—Waste Fe sludge washed by H2O by 1 L H2O/300 g of WFS and calcined at 180 °C at the mode of 15 °C/min for 10 h/180 °C, and
  • WFS/900—Waste Fe sludge washed by H2O by 1 L H2O/300 g of WFS and calcined at 900 °C at the mode of 15 °C/min for 3 h/900 °C.
Figure 5 show untreated (labeled as WFS) and treated pigments (labeled as WFS/0, WFS/180, and WFS/900). Washing the waste with water removes soluble impurities. Washing and calcination lead to a partial reduction of the Zn and Cl amount contained in the sludge. After calcination, the amount of H2O decreased. WFS/180 and WFS/900 contained 2.2 wt.% and 0.2 wt.% of H2O, respectively. Density of WFS/0, WFS/180, and WFS/900 was 3.85 g/cm3, 4.95 g/cm3, and 4.46 g/cm3, respectively. During calcination of WFS/180, iron oxyhydroxides dehydrated to Fe2O3. This sludge must be well washed to remove most of the ZnCl2 contained in the sludge.
As mentioned before, the higher the calcination temperature, the more significant dehydration occurred. By calcination at 900 °C, the washed sludge was stabilized. The prepared pigments WFS/180 and WFS/900 are very fine powders. This is proven by their specific surface area (SSA) and better absorption of loose moisture compared to the WFS/0 sample, which was slightly coarser. Cl bound in the structure and α-FeOOH were released during heat treatments as HCl. At the same time, the amount of Zn is reduced by up to 97%. During calcination of the WFS/900 sample, the Cl in the mixture was significantly eliminated (by almost 99%). While the original waste Fe sludge WFS/0 contained ~41 wt.% of Fe2O3, usable waste sludge containing up to 90 wt.% of α-Fe2O3 was obtained by the calcination.

3.6. Granulometry of Waste Fe Sludge

Inorganic pigments are largely present in the powder form. The ideal powder material contains only particles of the same size; however, the actual system consists of particles of different sizes. Particle size distribution is a very important criterion of powder pigments, as the grain size has a fundamental effect on the optical properties of pigments. It is associated with the scattering of light on the particles, so it highly affects the resulting opacity and color. The sample was measured in an aqueous medium, and with regard to the presence of clumps in the investigated pigments, ultrasound was used for better dispersion.
The results are presented by distribution curves in Figure 6. Curves 2 and 3 have variable grain size. Pigment WFS/0 has grain sizes Dv(10) = 6.14 µm, Dv(50) = 13.8 µm, and Dv(90) = 30.3 µm. The parameters of WFS/180 are Dv(10) = 0.898 µm, Dv(50) = 2.61 µm, and Dv(90) = 7.7 µm, while the parameters of the distribution curve for pigment WFS/900 are Dv(10) = 1.98 µm, Dv(50) = 44.4 µm, and Dv(90) = 1950 µm. The particles can be divided into coarse—over 10 μm; large—10 to 3 μm; medium—3 to 1 μm; fine—1 to 0.3 μm; and very fine—below 0.3 μm.

3.7. SEM Analysis of Waste Fe Sludge

The particle size was changed by calcination. The most common morphology of hematite particles obtained by peptization method and calcined at 500 °C was truncated rhombohedrons, cubes, and octahedrons [29].
For inorganic pigments, it is suitable that particle sizes range from 0.1 to 10 μm [30], so the pigments have good covering and absorption qualities. Figure 7 shows WFS/0 sample morphology as determined by SEM by all samples and EDAX by (Figure 7A-1). SEM images show a not quite regular round particle system (Figure 7C-2). Moreover, particles larger than 1000 μm are also included in this sample, as determined by granulometry (Figure 6). Figure 7A-1 shows more clearly that there are round particles of different sizes, formed by clusters of smaller round particles of approximately 20 μm. Thus, if the particles are clustered into even smaller objects, the granulometric curves may be so variable on this basis.
The chlorine present in the WFS/0 (see Figure 7A-2) comes from the ZnCl2 purification process. The minimum amount of Al probably comes from a very different compound contained in the sludge precipitate (Figure 7A-2). The highest density, 4.95 g/cm3, was found for the WFS/180 sample, while the original untreated WFS/0 sample had the lowest density of all. Thermal calcination led to an increase in density by 28%. With an increase of the temperature, the SSA changes from 6.89 m2/g (for WFS/0) to 23.6 m2/g (WFS/180) and 14.86 m2/g (WFS/900). The SSA of commercial samples was determined to be 23.67 m2/g. The SSA value for all iron oxides prepared in this study is comparable to the commercial pigments used in this experiment.

3.8. Phase Analysis of Waste Fe Sludge

Results of the XRPD phase analysis are shown in Figure 8. The pattern of the sample WFS/0 (see Figure 8a) does not show any reflections. This sample contains Fe2O3 in amorphous form. Wider reflections of hematite phase were found in the case of sample WFS/180; dominant reflection is in the position 38° 2θ (PDF-2 card no. 00-033-064-64). From the point of view of the XRPD measurement, the sample WFS/180 (see Figure 8b) is comparable with the sample SP1. XRPD pattern of the sample WFS/900 (see Figure 8c) contains crystalline phase of the α-Fe2O3 (hematite) (PDF-2 card no.01-076-45-79) with the most intensive reflection in the position 39° 2θ. With increasing temperature of calcination, the reflections are narrower. In some cases, the goethite α-FeOOH transforms into crystalline phase of hematite, present as narrowly shaped peaks [31]. But the goethite phase was not found in tested pigments (Figure 8). When mixing the pigments with the transparent glaze, certain phase changes occurred. The α-Fe2O3 form is stable up to 800 °C, as declared by the manufacturer. When fired at 1060 °C, the magnetite form changes to hematite, which is stable up to 1000 °C [24].

3.9. TG and DTA of Waste Fe Sludge

TG a DTA curves for WFS/0 sample are shown in Figure 9. Significant endothermic reactions are present on the temperature at 110 °C, and 562 °C can be connected with moisture decomposition. Hematite form under atmospheric conditions and often the end of oxidative transformation of other iron oxides. Then, with temperature rising, goethite can transform to α-Fe2O3 or the peak is attributed to the oxidation of FeO to Fe3O4 and Fe2O3 [32,33,34]. The weight of the samples was stable at 600 °C. The significant decrease in mass (TG) is evidenced for temperatures 500–610 °C, and weight loss was approximately 30%. Above 620 °C, the DTA curve shows declining characteristics. The decrease in mass in the temperature range 20–90 °C is mainly associated with the release of physically absorbed water. However, it can be assumed that both α-Fe2O3 and γ-Fe2O3 phases are present in the sample at a temperature of 180 °C. As the temperature increases, the maghemite phase γ-Fe2O3 content in the sample gradually increases. This occurs up to a temperature of 350 °C, at which the content of the maghemite phase reaches a maximum [35]. However, a further increase in temperature in the range of 350–500 °C leads to a decrease in the amount of Fe2O3, and at a temperature of 500 °C the hematite α-phase Fe2O3 can predominate. The α-Fe2O3 is the most thermodynamically stable product in the calcination of other modifications at 500–700°C [36]. At higher temperatures (1200–1250 °C), partial reduction Fe3+ in hematite with a partial release of oxygen took place, as in Equation (5) [32]:
3Fe2O3 (s) ↔ 2Fe3O4 (s) + ½O2 (g).

3.10. Color of Glaze

If the material includes a group of color pigments, it must show a color shade, which is related to the ability of the pigment to absorb or distract incident light. Radiation in the entire visible wavelength range is absorbed by the black pigment (L* = 0). If incident radiation in this whole wavelength range is reflected, it is a white pigment (L* = 100). Finally, in the case of partial scattering and partial absorption of light, the pigment is colored. The real carrier of color is a system of electrons capable of polarization.
The degree of polarization is then reflected in the ability of material to show a certain color. Specifically, color carriers may be atoms, ions, or clusters, generally called chromospheres. The color of the pigment is affected by chemical composition and so determined by the structural arrangement of the substance, which means the presence of impurities, interstitial atoms or the presence of vacancies. Another important property of pigments is their reactivity, either with the environment, in which they are dispersed, or with the substrate, on which they are applied.
Quality of the resulting color effect is determined by opacity. This characteristic indicates the ability of the pigment dispersed in the binder to cover the substrate. The simplest method of evaluating color is by the human eye. The CIEL*, a*, b* scale was used for objective evaluation, leading to comparable results of color measurements.
The resulting glaze colors were characterized by visual assessment and using a measuring technique. Table 3 shows the measured values of CIEL*, a*, b* glazes, and Figure 10 shows the dependence of wavelength and reflectivity of prepared glazes. The CIEL*, a*, b* values describe the color space. The L* is used to express the lightness of the color; a* is used for the description of its position between magenta and green, and b* is used for the description of position between yellow and blue. Color of objects can be expressed using color-hex model, but also using the Munsell model in which the color is described by hue, lightness, and chroma [37,38].
Figure 10 shows the final glaze colors. Recipe 1 is based on glazes from waste Fe sludge treatment, while glazes in recipe 2 are made using commercial pigments. The final colors were determined using L*a*b* coordinates shown in Table 3.
For commercially used pigments, the manufacturer declares thermal stability up to 800 °C. Firing temperature of the final glazes in this experiment was higher, namely 1060 °C. The original commercial pigment at these temperatures causes shifts in the darkness in the final glazes. This applies especially for the bright red pigment SP1, which becomes darker in the final GPF1 glaze. The red color is caused by the α-Fe2O3 (hematite) phase; however, color changes occur at temperatures >1000 °C [24].
The resulting GPF1 glaze, originally with bright red pigment together with transparent glaze in red shades, has the coordinates L* = 23.44, a* = 25.41, b* = 18.88. GPF2 glaze with originally light brown pigment turns dark brown after firing at 1060 °C (L* = 20.23, a* = 21.27, b* = 15.72), and GPF3 glaze with the original dark brown pigment reaches the resulting values L* = 18.29, a* = 20.27, b* = 16.45. Visual evaluation of glazes with commercial pigments showed that the surfaces were without defects, and the opacity was high. Calcination of black magnetite Fe3O4 according to the Equation (6) leads to red colored hematite; according to Equation (7), the brown maghemite can be obtained [36,39].
2Fe3O4 + ½O2 → 3α-Fe2O3,
2Fe3O4 + ½O2 → 3γ-Fe2O3.
Glazes prepared using the waste Fe sludge are variable (Figure 10). The final GPO1 glazes (1 wt.% WFS/180 + 99 wt.% TG) are visually almost transparent with the highest light value being L* = 82.40.
GPO2 glazes (5 wt.% WFS/180 + 95 wt.% TG) already show a more pronounced coloration in light brown shades by reducing the value of L* = 31.48 towards darker tones. GPO3 glazes (10 wt.% WFS/180 + 90 wt.% TG) having parameters L* = 21.28, a* = 20.27, b* = 16.45, exhibit the lowest L* value and the highest a* value (i.e., dark brown-red color) of all GPO glazes. Furthermore, GPO4 glaze was prepared with 15 wt.% FWS/180 + 90 wt.% TG (picture not included). Both of these glaze shades, GPO3 and GPO4, are almost comparable, both visually and in terms of L*, a*, b* values. In the case of glazes from recipe 1, i.e., GPO1-4, a clear trend of change in color intensity depending on the amount of WFS added is demonstrated.
Two glazes, GOKP and GPX, were prepared using the recipe 1 (Table 1). The color of glaze GPX (10 wt.% WFS/900 + 90 wt.% TG) was a deep red-brown with coordinates L* = 16.98, a* = 17.69, b* = 10.93. Intensity and saturation of this glaze is comparable to the glaze GPF3 (10 wt.% WFS/180 + 90 wt.% TG), whose color has coordinates L* = 18.29, a* = 20.27, b* = 16.45. These two glazes exhibit the lowest L* values compared to other glazes.
GOKP glaze (10 wt.% WFS/0 + 90 wt.% TG) was found to have a completely different color compared to other glazes: the color turned brown-yellow with the following parameters: L* = 27.95, a* = 6.36, b* = 25.84. The b* value (+ yellow) is the highest of all glazes tested.
Thus, the washed uncalcined sludge itself showed a yellow-brown color after heat treatment at 1060 °C with visible undissolved pigment particles, which did not dissolve in the glaze.
The fact that the goethite was not observed by XRPD analysis can be explained either by its complete absence or by its very low amount. The presence of iron oxide (Fe3+) as a network with four-fold coordination creates a brownish color, which is, for example, in the GPO2 sample. If iron ions are in six-fold coordination, a faint yellow-pink hue may appear [24,40].
Figure 11 shows a completely different trend for the GPO1 glaze. The glazes GPO1 have a very gradually increasing lighter tonality between 490 and 700 nm. The reflectivity is 30% higher than that of other glazes. Glazes GPX, GPO3, GPF3, GPF2, and GPF1 have low reflectance with the continuous course in the whole range of wavelengths between 400 and 550 nm, and the tonality becomes lighter, between 600 and 700 nm. The GPO2 and GOKP glazes have an exponential course in the wavelength range of 400–600 nm.
These glazes are visibly different in color, so these curves from others. Different colors are formed in the glaze through different forms of iron [24]. The pigment, which was perfectly dispersed in the glaze, did not cause any surface defects. The particle size therefore directly affects the appearance of the ceramic glaze’s surface. Reducing the particle size of the glaze reduces the viscosity of the glaze with increased temperature. This causes better spreading, uniformity of the glass layer, and allows the production of the glaze without unevenness. The gloss of the glaze depends on the surface roughness, which depends on the viscosity of the glaze [41].

4. Conclusions

The possibility of using waste sludge from the production of ZnCl2 is obvious. Waste sludge is produced during the preparation process. Untreated sludge is a yellow precipitate containing large amount of ZnO, Cl, and Fe2O3, together with other impurities. Untreated yellow sludge was washed with 1L H2O/300 g; the waste sludge was then dried and calcined at either 180 °C or 900 °C. This method helped to reduce Zn and Cl content by up to 97%, and it also increased the percentage of Fe2O3 from 41 wt.% to 90 wt.%. A considerable amount of Fe2O3 pre-determines the use of this oxide as a pigment. Thermal treatment changed the color of the sludge from yellow to dark red. Depending on the calcination temperature, the pigment changed its color from bright red shades (180 °C) to brown (900 °C), which is typical for this type of pigment.
The TG/DTA curve indicates the initial removal of water from the samples. TG curve became stable at 600 °C. Furthermore, modification of FeO to the resulting α-Fe2O3 (hematite) takes place here, which was also confirmed by XRPD phase analysis. Particle morphology measurements showed clusters of round particles. Changes in particle size after calcination were also observed. The final glazes were affected by the amount of pigment added to the transparent glaze and by final firing temperature of 1060 °C. The resulting colors were: colorless (L* = 82.04, a* = 6.28, b* = 17.82), light brown (L* = 31.48, a* = 6.97, b* = 16.57), brown-red (L* = 21.28, a* = 12.23, b* = 9.71), brown-yellow (L* = 27.95, a* = 6.36, b* = 25.74), and deep red-brown (L* = 16.98, a* = 17.69, b* = 10.93). The prepared glazes have a compact appearance, gloss, and no visible defects on the surface. Based on the presented results, waste Fe sludge from galvanizing plants can be used to prepare pigments comparable to commercially available products.

Author Contributions

Conceptualization and methodology, H.O.; M.V., software, P.M. and T.Č.; validation, M.V.; formal analysis, P.M.; investigation, M.V.; resources, H.O. and J.T.; data curation, H.O.; writing—original draft preparation, H.O.; writing—review and editing, J.T. and H.O.; visualization, H.O.; supervision, J.V.; project administration, J.V.; funding acquisition, J.V. All authors have read and agreed to the published version of the manuscript.

Funding

This work was funded by the “Research on the management of waste, materials and other products of metallurgy and related sectors” project (No. CZ.02.1.01/0.0/0.0/17_049/0008426), the “Energy processes and materials in the industry” projects (No. SP2021/37) and the “Specific research in the metallurgical, materials and process engineering” projects (No. SP2021/41).

Data Availability Statement

The data presented in this study are available from the corresponding author upon request.

Acknowledgments

The authors thank Jan Juřica for the grain size analysis.

Conflicts of Interest

The authors declare no conflict of interest.

References

  1. The Future of High-Performance Pigments to 2023, Focus on Pigments. Available online: http://www.smithers.com (accessed on 10 February 2021).
  2. Monrós, G. Pigment, Ceramic. In Encyclopedia of Color Science and Technology; Luo, R., Ed.; Springer: New York, NY, USA, 2014; pp. 1–15. [Google Scholar]
  3. Benda, P.; Kalendová, A. Anticorrosion properties of pigments based on ferrite coated zinc particles. Phys. Procedia 2013, 44, 185–194. [Google Scholar] [CrossRef] [Green Version]
  4. Fernández-Osorio, A.; Rivera, C.E.; Vázquez-Olmos, A.; Chávez, J. Luminescent ceramic nano-pigments based on terbium-doped zinc aluminate: Synthesis, properties and performance. Dyes Pigment. 2015, 119, 22–29. [Google Scholar] [CrossRef]
  5. Phillips, R.W.; LaGallee, C.R.; Markantes, C.T.; Coombs, P.G. Multi-Layered Magnetic Pigments and Foils. Patents US-6099895-A, 8 August 2000. [Google Scholar]
  6. Zheng, S.; Li, J. Inorganic-organic sol-gel hybrid coatings for corrosion protection of metal. J. Sol-Gel Sci. Technol. 2010, 54, 174–187. [Google Scholar] [CrossRef]
  7. Pereira, O.C.; Bernadin, A.M. Ceramic colorant from untreated iron ore residue. J. Hazard. Mater. 2012, 233, 103–111. [Google Scholar] [CrossRef] [PubMed]
  8. Bondioli, F.; Andreola, F.; Barbieri, L.; Manfredini, T.; Ferrari, A.M. Effect of rice husk ash (RHA) in the synthesis of (Pr,Zr)SiO4 ceramic pigment. J. Eur. Ceram. Soc. 2007, 27, 3483–3488. [Google Scholar] [CrossRef]
  9. Eppler, R.A. Colorants for Ceramics. In Kirk-Othmer Encyclopedia of Chemical Technology; John Wiley & Sons, Inc.: New York, NY, USA, 2002. [Google Scholar] [CrossRef]
  10. Mufti, N.; Atma, T.; Fuad, A.; Datudji, E. Synthesis and characterization of black, red and yellow nanoparticles pigments from the iron sand. AIP Conf. Proc. 2014, 1617, 165. [Google Scholar] [CrossRef]
  11. Legodi, M.A.; de Waal, D. The preparation of magnetite, goethite, hematite and maghemite of pigment quality from mill scale iron waste. Dyes Pigment. 2007, 74, 161–168. [Google Scholar] [CrossRef]
  12. Sugimoto, T.; Muramatsu, A.; Sakata, K.; Shindo, D.J. Characterization of hematite particles of different shapes. Colloid Interface Sci. 1993, 158, 420–428. [Google Scholar] [CrossRef]
  13. Ueda, M.; Shimada, S.; Inaga, M. Synthesis of crystalline ferrites below 60 °C. J. Eur. Ceram. Soc. 1996, 16, 685–686. [Google Scholar] [CrossRef]
  14. Prim, S.R.; Folgueras, M.V.; De Lima, M.A.; Hotza, D. Synthesis and characterization of hematite pigment obtained from a steel waste industry. J. Hazard. Mater. 2011, 193, 1307–1313. [Google Scholar] [CrossRef]
  15. Ismail, H.M.; Gadenhead, D.A.; Zaki, M.I. Thermal genesis course of iron oxide pigmentary powders from steel-pickling chemical waste. J. Colloid Interface Sci. 1996, 183, 320–328. [Google Scholar] [CrossRef]
  16. Khoiroh, L.M.; Nuraini, E.D.; Aini, N. Synthesis of goethite (α-FeOOH) pigment by precipitation method from iron lathe waste. Mater. Sci. 2018, 6, 65–69. [Google Scholar] [CrossRef] [Green Version]
  17. Müller, M.; Villalba, J.C.; Mariani, F.Q.; Dalpasquale, M.; Lemos, M.Z.; Huila, M.F.G.; Anaissi, F.J. Synthesis and characterization of iron oxide pigments through the method of the forced hydrolysis of inorganic salts. Dyes Pigment. 2015, 120, 271–278. [Google Scholar] [CrossRef]
  18. Nunez, N.O.; Morales, M.P.; Tatraj, P.; Serna, C.J. Preparation of high acicular and uniform goethite particles by a modified-carbonate route. J. Mater. Chem. 2000, 10, 2561–2565. [Google Scholar] [CrossRef]
  19. Lu, Y.; Dong, W.; Wang, W.; Ding, J.; Wang, Q.; Hui, A.; Wang, A. Optimal Synthesis of Environment-Friendly Iron Red Pigment from Natural Nanostructured Clay Minerals. Nanomaterials 2018, 11, 925. [Google Scholar] [CrossRef] [Green Version]
  20. Yang, T.; Huang, Z.; Liu, Y.; Fang, M.; Ouyang, X.; Hu, M. Controlled synthesis of porous FeCO3 microspheres and the conversion to α-Fe2O3 with unconventional morphology. Ceram. Int. 2014, 14, 11975–11983. [Google Scholar] [CrossRef]
  21. Djurišić, A.B.; Chen, X.; Leung, Y.H.; Ching, A.M. ZnO nanostructures: Growth, properties and applications. J. Mater. Chem. 2021, 22, 6526–6536. [Google Scholar] [CrossRef]
  22. Cao, N.J.; Xu, Q.; Chen, L.F. Acid hydrolysis of cellulose in zinc chloride solution. Appl. Biochem. Biotechnol. 1995, 1, 21–28. [Google Scholar] [CrossRef]
  23. Zhang, Z.J.; Dong, C.; Ding, X.Y.; Xia, Y.K.A. Generalized ZnCl2 activation method to produce nitrogen-containing nanoporous carbon materials for supercapacitor applications. J. Alloys Compd. 2017, 5, 12653–12672. [Google Scholar] [CrossRef]
  24. Eppler, R.A.; Eppler, D.A. Glaze and Glass Coating; The American Ceramic Society: Westerville, OH, USA, 2000. [Google Scholar]
  25. Jandová, J.; Lisá, K.; Salátová, Z. Continuous Precipitation of Metals and Its Application in Hydrometallurgical Processes. In Proceedings of the 7th Conference on Environment and Mineral Processing, Ostrava, Czech Republic, 5–6 March 2003. [Google Scholar]
  26. Widodo, R.D.; Priyono; Rusiyanto; Anis, S.; Ichwani, A.A.; Setiawan, B.; Fitriyana, D.F.; Rochman, L. Synthesis and characterization of iron (III) oxide form natural iron sand of the south coastal area, Purworejo Central Java. J. Phys. Conf. Ser. 2020, 1444, 012043. [Google Scholar] [CrossRef]
  27. Bedoya, P.A.C.; Botta, P.M.; Bercoff, P.G.; Fanovich, M.A. Magnetic iron oxides nanoparticles obtained by mechanochemical reactions from different solid precursors. J. Alloys Compd. 2021, 860, 157892. [Google Scholar] [CrossRef]
  28. Yadav, B.S.; Singh, R.; Vishwakarma, A.K.; Kumar, N. Facile synthesis of substantially magnetic hollow nanospheres of maghemite (gamma-Fe2O3) originated from magnetite (Fe3O4) via solvothermal method. J. Supercond. Nov. Magn. 2020, 33, 2199–2208. [Google Scholar] [CrossRef]
  29. Sankova, N.; Parkhomchuk, E. Pseudomorphism and size stabilization of hematite particles in the organic phase synthesis. J. Solid State Chem. 2020, 282, 121130. [Google Scholar] [CrossRef]
  30. Novotny, M.; Solc, Z.; Trojan, M. Pigments, Inorganic. In Kirk-Othmer Encyklopedia of Chemical Technology, 5th ed.; John Wiley & Sons, Inc.: New York, NY, USA, 2005. [Google Scholar]
  31. Meng, F.; Morin, S.A.; Jin, S. Rational solution growth of α-FeOOH nanowires driven by screw dislocations and their conversion to α-Fe2O3 nanowires. J. Am. Chem. Soc. 2011, 133, 8408–8411. [Google Scholar] [CrossRef]
  32. Bondioli, F.; Ferrari, A.M.; Leonelli, C.; Manfredini, T. Syntheses of Fe2O3/Silica Red Inorganic Inclusion Pigments for Ceramic Application. Mater. Res. Bull. 1998, 33, 723–729. [Google Scholar] [CrossRef]
  33. Ullrich, A.; Rölle, N.; Horn, S. From wustite to hematite: Thermal transformation of differently sized iron oxide nanoparticles in air. J. Nanopart. Res. 2019, 21, 168. [Google Scholar] [CrossRef]
  34. Koizumi, H.; Uddin, M.d.A.; Kato, Y. Effect of ultrasonic irradiation on γ-Fe2O3 formation by co-precipitation method with Fe3+ salt and alkaline solution. Inorg. Chem. Commun. 2021, 124, 108400. [Google Scholar] [CrossRef]
  35. Gregor, C.; Hermanek, M.; Jancík, D.; Pechousek, J.; Filip, J.; Hrbač, J.; Zbořil, R. The Effect of Surface Area and Crystal Structure on the Catalytic Efficiency of Iron(III) Oxide Nanoparticles in Hydrogen Peroxide Decomposition. Eur. J. Inorg. Chem. 2010, 16, 2343–2351. [Google Scholar] [CrossRef]
  36. Buchner, W.; Schliebs, R.; Winter, G.; Buchel, K.H. Industrial Inorganic Chemistry; Wiley-VCH Verlag GmbH: Los Angeles, CA, USA, 1989. [Google Scholar]
  37. Schanda, J. Colorimetry: Understanding the CIE System; John Wiley: Hoboken, NJ, USA, 2007. [Google Scholar]
  38. Gulrajani, M.L. Colour Measurement: Principles, Advances and Industrial Applications; Woodhead Publishing: Philadelphia, PA, USA, 2010. [Google Scholar]
  39. Buxbuam, G. Industrial Inorganic Pigments; WILET-VCH: Weinheim, Germany, 1998. [Google Scholar]
  40. Pekkan, K.; Karasu, B. Evaluation of borax solid wastes in production of frits suitable for fast single-fired wall tile opaque glass-ceramic glazes. Bull. Mater. Sci. 2010, 33, 135–144. [Google Scholar] [CrossRef]
  41. Bernardin, A.M. The influence of particle size distribution on the surface appearance of glazed tile. Dyes Pigment. 2009, 80, 121–124. [Google Scholar] [CrossRef]
Figure 1. Commercial pigments in powder form used for preparation of glazes.
Minerals 11 00313 g001
Figure 2. XRD patterns of (a) SP1 pigment (red color); (b) SP2 pigment (light brown color); and (c) SP3 pigment (dark brown color).
Minerals 11 00313 g002
Figure 3. Grain size distribution of pigment: (1) SP1 (red); (2) SP2 (light brown); (3) SP3 (dark brown).
Minerals 11 00313 g003
Figure 4. SEM images of commercial pigments (A) red pigment SP1 with scale 20 µm; (B) light brown pigment SP2 with scale 20µm; (C-1) dark brow pigment SP3 with scale 20 µm and (C-2) dark brown pigment SP3 with scale 200 µm.
Minerals 11 00313 g004
Figure 5. Form and color of the untreated waste Fe sludge (WFS), waste Fe sludge washed in water (WFS/0), waste Fe sludge calcined at 180 °C (WFS/180), and waste Fe sludge calcined at 900 °C (WFS/900).
Minerals 11 00313 g005
Figure 6. Grain size distribution of pigment waste Fe sludge: (1) original (WFS/0); (2) calcined at 180 °C (WFS/180); (3) calcined at 900 °C (WFS/900).
Minerals 11 00313 g006
Figure 7. SEM/EDAX images of (A-1) original (WFS/0) with scale 20 µm; (A-2) original (WFS/0) with EDAX analysis; (B-1) calcined at 180 °C (WFS/180) with scale 20 µm; (B-2) calcined at 180°C (WFS/180) with scale 200 µm; (C-1) calcined at 900 °C (WFS/900) with scale 20 µm; (C-2) calcined at 900 °C (WFS/900) with scale 200 µm.
Minerals 11 00313 g007
Figure 8. XRD pattern of (a) WFS/0 samples (non-calcined Fe waste sludge); (b) WFS/180 (waste Fe sludge calcined at 180 °C); and (c) WFS/900 (waste Fe sludge calcined at 900 °C).
Minerals 11 00313 g008
Figure 9. Thermogravimetric (TG) and differential thermal analysis (DTA) curves of the sample WFS/0 (original waste Fe sludge).
Minerals 11 00313 g009
Figure 10. Images of final colored glazes prepared with the following recipe type: Recipe 2 = GPF1, 2, 3 (10 wt.% SP1, 2, 3 + 90 wt.% TG); Recipe 1 = GPO1 (1 wt.% WFS/180 + 99 wt.% TG); GPO2 (5 wt.% WFS/180 + 95 wt.% TG); GPO3 (10 wt.% WFS/180 + 90 wt.% TG); GOKP (10 wt.% WFS/0 + 90 wt.% TG); and GPX (10 wt.% WFS/900 + 90 wt.% TG).
Minerals 11 00313 g010
Figure 11. Dependence of the reflectance (%) on the wavelength (nm) for all prepared glazes fired at 1060 °C.
Minerals 11 00313 g011
Table 1. Recipe of glazes prepared from waste Fe sludge (WFS) and commercial pigment (SP, standard pigment).
RecipeSamplesAmount of the Materials (wt.%)
Transparent Glaze (TG)Waste Fe Sludge (WFS)Standard Pigments (SP)
WFS/0WFS/180WFS/900SP1SP2SP3
R1GP0199 1
GP0295 5
GP0390 10
GP0485 15
GPX90 10
GOKP9010
R2GPF190 10
GPF290 10
GPF390 10
Table 2. Chemical composition of materials.
Amount of Oxides in Raw Materials (wt.%)
OxidesCeramic Slurry (CS)Waste Fe Sludge(WFS)Waste Fe Sludge (WFS/0)Waste Fe Sludge (WFS/180)Transparent Glaze (TG)SP3 (Dark Brown)SP2 (Light Brown)SP1 (Red)
Na2O1.225.614.61 5.50
MgO2.831.120.18 <0.30.580.44<0.001
Al2O312.420.200.740.499.10<0.0010.44<0.001
SiO269.57 80.100.160.80<0.001
P2O5<0.0012 0.060.16<0.010.0220.073<0.001
SO30.190.150.190.710.120.270.330.20
K2O2.08 0.88<0.001<0.001<0.001
CaO4.52 0.02<0.0010.300.050.310.01
TiO20.56 <0.0010.130.670.591.311
MnO0.07 <0.0010.0061.060.750.13
Fe2O34.0940.9290.0997.560.2296.9795.2297.807
BaO0.05 0.05
Cl 22.082.470.49 0.0060.017<0.001
ZnO 29.871.520.24 0.150.130.03
PbO 0.050.12<0.001
V2O5 <0.0010.03<0.001
Cr2O3 0.14 <0.0010.12<0.001
NiO 0.0280.10<0.001
CuO <0.0010.047<0.001
Table 3. CIE L*a*b* coordinates of glazes.
SamplesCIE Values
L*a*b*
GPO182.046.2817.85
GPO231.486.9716.57
GPO321.2812.239.71
GPX16.9817.6910.93
GOKP27.956.3625.84
GPF123.4425.4118.88
GPF220.2321.2715.72
GPF318.2920.2716.45
Notes: L* indicates lightness +/− darkness, a* is the red +/− green coordinate, and b* is the yellow +/− blue coordinate.
Publisher’s Note: MDPI stays neutral with regard to jurisdictional claims in published maps and institutional affiliations.

