Article

The Effect of Chemical Composition of Ultramafic and Mafic Aggregates on Their Physicomechanical Properties as well as on the Produced Concrete Strength

by
Paraskevi Lampropoulou
1,*,
Petros Petrounias
1,
Panagiota P. Giannakopoulou
1,
Aikaterini Rogkala
1,
Nikolaos Koukouzas
2,
Basilios Tsikouras
3 and
Konstantin Hatzipanagiotou
1
1
Section of Earth Materials, Department of Geology, University of Patras, 265 04 Patras, Greece
2
Chemical Process & Energy Resources Institute, Centre for Research & Technology Hellas (CERTH), Maroussi, 15125 Athens, Greece
3
Physical and Geological Sciences, Faculty of Science, Universiti Brunei Darussalam, Jalan Tungku Link, Gadong BE1410, Bandar Seri Begawan, Brunei Darussalam
*
Author to whom correspondence should be addressed.
Minerals 2020, 10(5), 406; https://doi.org/10.3390/min10050406
Submission received: 23 March 2020 / Revised: 25 April 2020 / Accepted: 29 April 2020 / Published: 30 April 2020
(This article belongs to the Special Issue Applied Petrography of Construction Materials)

Abstract

:
This study examines how the chemical composition of ultramafic and mafic rocks effects their physicomechanical properties and therefore how influences the concrete strength of the produced concrete specimens. For this scope, ultramafic (Group I) and mafic rocks (Group II) derived from the Veria–Naousa and Edessa ophiolite complexes (Greece) were selected in order to identify their chemical composition and their engineering properties according to international standards. Additionally, representative rocks were used as concrete aggregates in order to produce concrete specimens, whereas their mechanical strength was calculated. A geochemical index (Ga) was proposed and correlated with the engineering properties of the examined rocks as well as with the widely used alteration degree LOI (loss on ignition). Correlation diagrams between engineering properties and the proposed geochemical index (Ga) have showed that these properties were strongly influenced by the alteration processes expressed via Ga index. More particularly, mainly serpentine in ultramafic and chlorite in mafic rocks, minerals indicators for the alteration of ultramafic and mafic rocks, respectively, seem to determine their engineering properties. Concerning the mechanical strength of the produced concrete specimens, the results have showed that the increasing values of Ga index negatively effect concrete strength.

1. Introduction

Engineering projects, in which natural aggregate rocks are used as raw materials, strongly influenced by their physicomechanical properties which are directly correlated with the particular characteristics of rocks. Several researchers have studied the effect of mineralogical composition, textural characteristics and chemical composition of various types of aggregate rocks in order to predict their mechanical behavior when used in various construction applications [1,2,3,4,5,6,7,8,9,10,11,12,13,14,15,16,17,18]. During the last decades, particular emphasis, using variety of analytical methods, has been placed on the evaluation/quantification of alteration degree and on the influence of alteration of aggregate rocks in their engineering properties [4,5,18,19] and consequently in their construction applications [4,18].
Ultramafic rocks exhibit serpentine, a laminate soft mineral which belongs to the phyllosilicate subclass and forms smooth surfaces, as their main alteration product [20,21]. The serpentine group includes three closely related minerals: antigorite, lizardite and chrysotile. First-order changes to the major element composition of peridotites induced by serpentinization are the addition of 10–12 wt% water and loss of CaO [22,23,24]. Chlorite is the most common and abundant secondary mineral of heated seawater-mafic rocks as a result of substantive changes in the Ca/Mg ratio of the reacting fluid. [25], whereas its structure consists of silicate layers sandwiching a brucite layer in a silicate–brucite–silicate stacking sequence. The soft and platy nature both of serpentine and chlorite, the mesh texture of serpentine constitute critical factors for the development of porous areas in mafic and ultramafic rocks where they are contained and hence resulted in less mechanically durable aggregates and in aggregates with worse physical properties [4,5,18,19]. These minerals are also responsible for the formation of surfaces of weakness and for extended detachments between the cement paste and mafic and ultramafic aggregates in the, respectively produced concrete specimens [5,18]. Furthermore, numerous of petrographic [8,17,26,27,28,29,30,31] and chemical indices [7,32,33,34,35,36,37] have been proposed and have been used for each lithological group of rocks individually. Scientists have made efforts to correlate the alteration degree of rocks, expressed by chemical indices, with their main engineering properties (physical and mechanical) [7,32,33,34,35,36,37,38,39,40]. Nevertheless, most of them mainly concerns either sedimentary or acidic igneous rocks [11,12,15,16], while less metamorphic [16,32,41] and even lesser mafic or ultramafic igneous rocks derived from ophiolite complexes [38,42] and despite the fact that the latter are frequently used on several engineering works all over the world [43,44]. For example, weathering and alteration indices, based on major element analyses, investigated by Koca [38] and by Tugrul [42] in andesitic and basaltic rocks, respectively have been influenced their physical and mechanical properties. In mafic and ultramafic rocks, these indices express the geochemical changes of rocks derived from alteration processes which have been mineralogically expressed by the presence of secondary phyllosilicate minerals such as serpentine and chlorite.
Aggregates present the dominant constituents of concrete, typically occupying between 70% and 80% of its volume and therefore they have significant influence on the concrete performance [45,46,47,48]. The basic concrete component is the material which binds the aggregate particles together, commonly comprising a mixture of cement and water [45,49]. The mineralogical composition of the used aggregates and more specifically their alteration degree plays significant role on their mechanical behavior [17,18,50,51,52] and consequently on the mechanical performance of the produced concrete specimens [4,18]. Several researchers have studied the geochemical composition of different type of rocks used as concrete aggregates in order to evaluate their possibility in creating alkali silica reaction zones between the cement paste and the aggregate particles in concretes [53], while the geochemical composition of aggregate rocks hasn’t been correlated till today with the mechanical strength of the produced concrete specimens.
This study first focuses on the influence of chemical composition of ultramafic and mafic rocks on their physicomechanical performance and secondarily on how their chemistry affects the final strength of produced concrete specimens.

2. Geological Setting

Ultramafic and mafic rock samples of this study were collected from two ophiolite complexes, Veria–Naousa and Edessa both located on North Greece.
The Veria–Naousa ophiolite complex belongs to Almopias subzone of the Axios geotectonic zone (Figure 1). Tectonized serpentinized lherzolite and harzburgite, interfered by few pyroxenitic and rodingite dykes [54], as well as gabbro, diabase and pillow basalt compose this complex. It constituted a part of oceanic lithosphere, which was obducted onto carbonates of the Pelagonian Zone during Upper Jurassic to Lower Cretaceous. Neogene to Quaternary conglomeratic, breccia limestone and flysch lie unconformity on this dismembered ophiolite mass. Edessa ophiolite complex (Figure 2) consists of serpentinized harzburgite, lherzolite, diorite, gabbro, diabase and basalt with strong tectonic characteristics and variable alteration degree [55,56]. It represents remnant of oceanic lithosphere, thrusted out of ocean basins during Upper Jurassic to Lower Cretaceous time [57,58]. Serpentinized harzburgite is the main lithotype of this complex while lenses or beds of chromitite are also included [59]. Middle-Upper Cretaceous to Paleocene transgressive sediments lying conformably on ophiolitic rocks while volcanic rocks of Almopias subzone are bordered on these.

3. Materials and Methods

In this study, crushed ultramafic and mafic aggregates rocks derived from the referred ophiolite complexes were collected, during the research in the field area, in order to be analyzed according to their petrographic features, geochemistry, physicomechanical properties in the laboratory as well as concrete specimens were produced by these aggregates which were mechanically tested in a next stage.

3.1. Aggregate Tests

The collected rocks were first examined petrographically using a polarizing optical microscope (Leitz Ortholux II POL-BK Ltd., Midland, ON, Canada) following the EN 932–3 [62] standard. Whole-rock chemical analyses for major and trace elements were performed at Bureau Veritas Mineral Laboratories at Vancouver (BC, Canada). The mineralogical composition of the investigated serpentinites was also identified using powder X-ray diffraction (XRD) analysis, with a Bruker D8 Advance Diffractometer (Bruker, Billerica, MA, USA), with Ni-filtered CuKα radiation. The scanning area for bulk mineralogy of the samples covered the 2θ interval 2–70°, with a scanning angle step size of 0.015° and a time step of 0.1 s. The mineral phases were determined using the DIFFRACplus EVA 12® software (version 9.0, Bruker-AXS, Billerica, MA, USA) based on the ICDD Powder Diffraction File of PDF-2 2006. Polished thin sections of the examined rock samples were analyzed in scanning electron microscopes (SEM) in order to identify their mineralogical characteristics. Mineral microanalyses were performed using a JEOL JSM-6300 SEM equipped with energy dispersive and wavelength spectrometers (EDS and WDS) and INCA software. The scanning electron microscope used is located in the Laboratory of Electron Microscopy and Microanalysis, University of Patras, Rio Achaia, Greece. Operating conditions were accelerating voltage 25 kV and beam current 3.3 nA, with a 4-μm beam diameter. The total counting time was 60 s and dead-time 40%. Synthetic oxides and natural minerals were used as standards for the analyses, where the detection limits are ~0.1% and accuracy better than 5% was obtained. Major element analyses were carried out using an XRF (X-ray Fluorescence) spectrometer and a sequential spectrometer (ICP-ES).
The physical properties which were performed in the examined samples were the total porosity (nt) and the moisture content (w). The cohesion of a rock could be affected by the presence of moisture in it. In the studied samples the moisture content (w) was examined according to the procedure described in AASHTO T-255 [63]. The total porosity (nt) was calculated using specimens of rocks according to the ISRM 1981 standard [64]. The examined mechanical properties of the samples were the Los Angeles abrasion value (LA) and the uniaxial compressive strength (UCS). The Los Angeles abrasion (LA) is one test to determine coarse aggregate strength. It is the test expresses resistance of rocks in abrasion and attrition and was performed according to ASTM C-131 [65]. The uniaxial compressive strength (UCS) was examined on core cylindrical samples according to the ASTM D 2938–95 (2002) [66] standard. Average value was calculated for six specimens of each sample. The point load index (Is(50)) is used in order to obtain an indirect measure of the uniaxial compressive strength, according to the ISRM [67] standard.

3.2. Concrete Tests

Thirty-six normal concrete cube specimens (150 × 150 mm) were made from the aggregate types (Table 1), according to ACI-211.1-91 [68]. In a cylindrical electrical cement mixer, the dry stirring of the aggregates (of all fractions) was carried out first and then the cement and water were gradually added. The mixing time is measured after entering all the materials in the mixer where in the present study the mixing lasted for 7 min in each sample. The aggregate were crushed through standard sieves separated into the size classes of 2.00–4.75 (23 w/v%), 4.45–9.5 (23 w/v%) and 9.5–19.1 (20 w/v%) mm, while in the size of sand the same carbonate sand (34 w/v%) was used in each concrete specimen. All of the parameters remained constant in all the concrete specimens. For optimal slump, the condensation was completed using a rod with a diameter Φ16 and a length of 60 cm with rounded edges. Each cast was filled using a scoop in two layers (half and half each time) and each layer was concentrated individually. To thicken each layer, 25 strokes were made with the relevant rod. After the condensation was completed, the final surface was leveled, the surfaces of the casts were cleaned, and the specimens were numbered. After 24 h, the samples were removed from the mold and were cured in water for 28 days. Curing temperature was 20 ± 3 °C. These specimens were tested in a compression testing machine at an increasing rate of load of 140 kg/cm2 per minute. The compressive strength of concrete is calculated by the division of the value of the load at the moment of failure over the area of specimen. The compression test was elaborated according to BS EN 12390-3:2009 [69].

4. Results

4.1. Aggregate Test Results

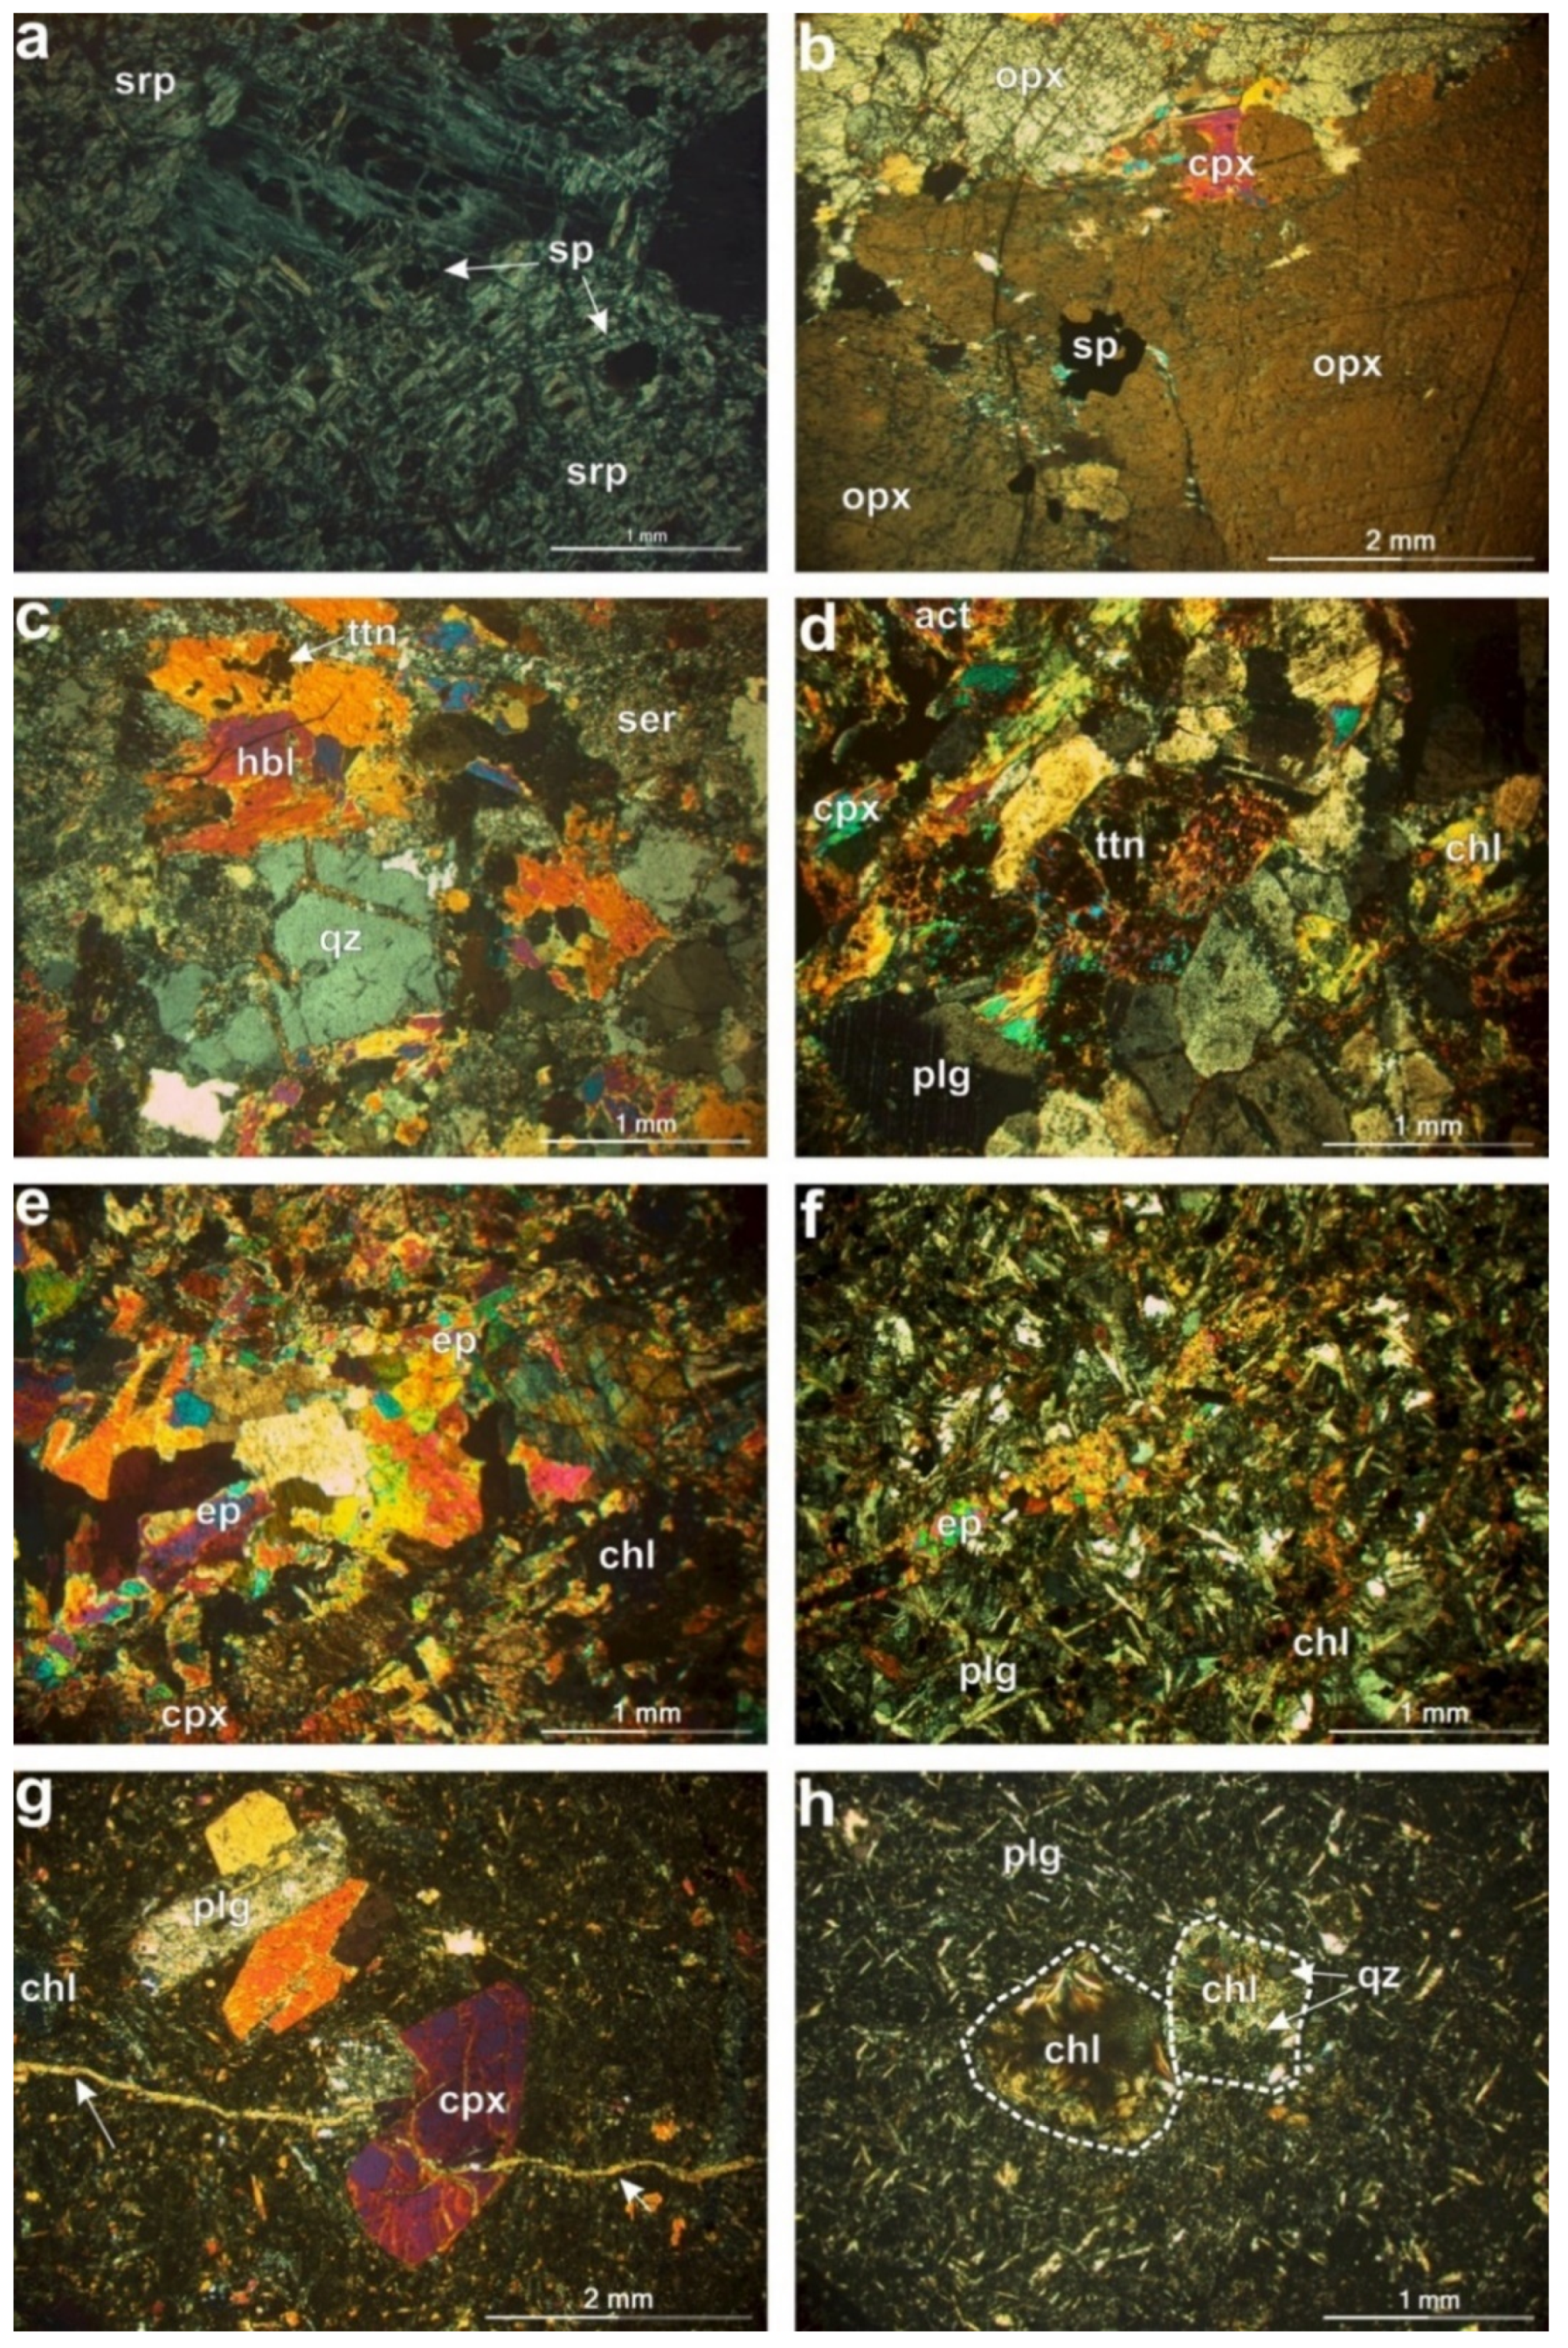
4.1.1. Petrographic Characteristics of the Examined Aggregate Rocks

The aggregate rocks which were examined in this study were classified into two groups. Group I consists of ultramafic and Group II of mafic rocks. Based on their macroscopic and microscopic observations, the examined ultramafic rocks are characterized by variety in their alteration (from low to highly altered). In most of the cases ultramafic rocks presented as highly serpentinized with mesh or scarcely ribbon texture (Figure 3a). Intragranular or transgranular microcracks were also observed as result of the tectonic deformation. The altered product of serpentine constitutes their dominant secondary mineral (65.0–90.0% of serpentine). Low amounts of chlorite, talc, tremolite, calcite, few relics of pyroxene and spinel crystals completed the modal composition of these rocks. Among the studied ultramafic lithotypes, only pyroxenites are presented as less altered and displayed mainly granular or locally porphyroclastic texture with intersected microcracks (Figure 3b). Orthopyroxene, clinopyroxene, olivine and chromite compose their primary mineralogy, while low amount of serpentine is observed too (<3.0%).
Similar to the ultramafic rock samples, mafic rocks also display a wide range of alteration degree (from highly to low altered) which expressed through the presence of secondary minerals. Diorites were mainly observed as fine to medium grained, with granular or subophitic texture. Their modal mineralogy is composed of plagioclase, hornblende, alkali–feldspar and clinopyroxene, less quartz, biotite and accessory phases of titanite, apatite and opaque minerals (Figure 3c). Chlorite, epidote, actinolite and sericite are the main secondary minerals which amount ranges from 3.0% to 7.0%. Gabbros present granular, subhedral to euhedral and scarcely subophitic texture (Figure 3d). They principally consist of plagioclase and clinopyroxene and they display a wide range of alteration degree. The secondary minerals are mainly chlorite, epidote, actinolite, sericite and saussurite, which amounts vary from 8.0% to 36.0% (Figure 3e). Accessory phases of opaque minerals and titanite are also complete their modal mineralogical composition. The diabase samples are fine grained rocks with mainly ophitic-subophitic and minor porphyritic texture (Figure 3f). Their mineral composition was not significantly different from those of gabbroic rocks while they present variations regarding to their alteration degree. Basalts were characterized by a microcrystalline to glassy matrix, locally porphyritic with major pyroxene and plagioclase phenocrysts (Figure 3g). The fine-grained ground mass contains primary minerals and low amounts of secondary phases such as chlorite, actinolite opaque minerals, clay minerals and quartz. The dominant texture is the porphyritic. Transgranular microcracks due to tectonic strain were secondarily saturated by oxides, epidote, calcite and quartz, while different size amygdules were also filled in with secondary minerals (Figure 3h).

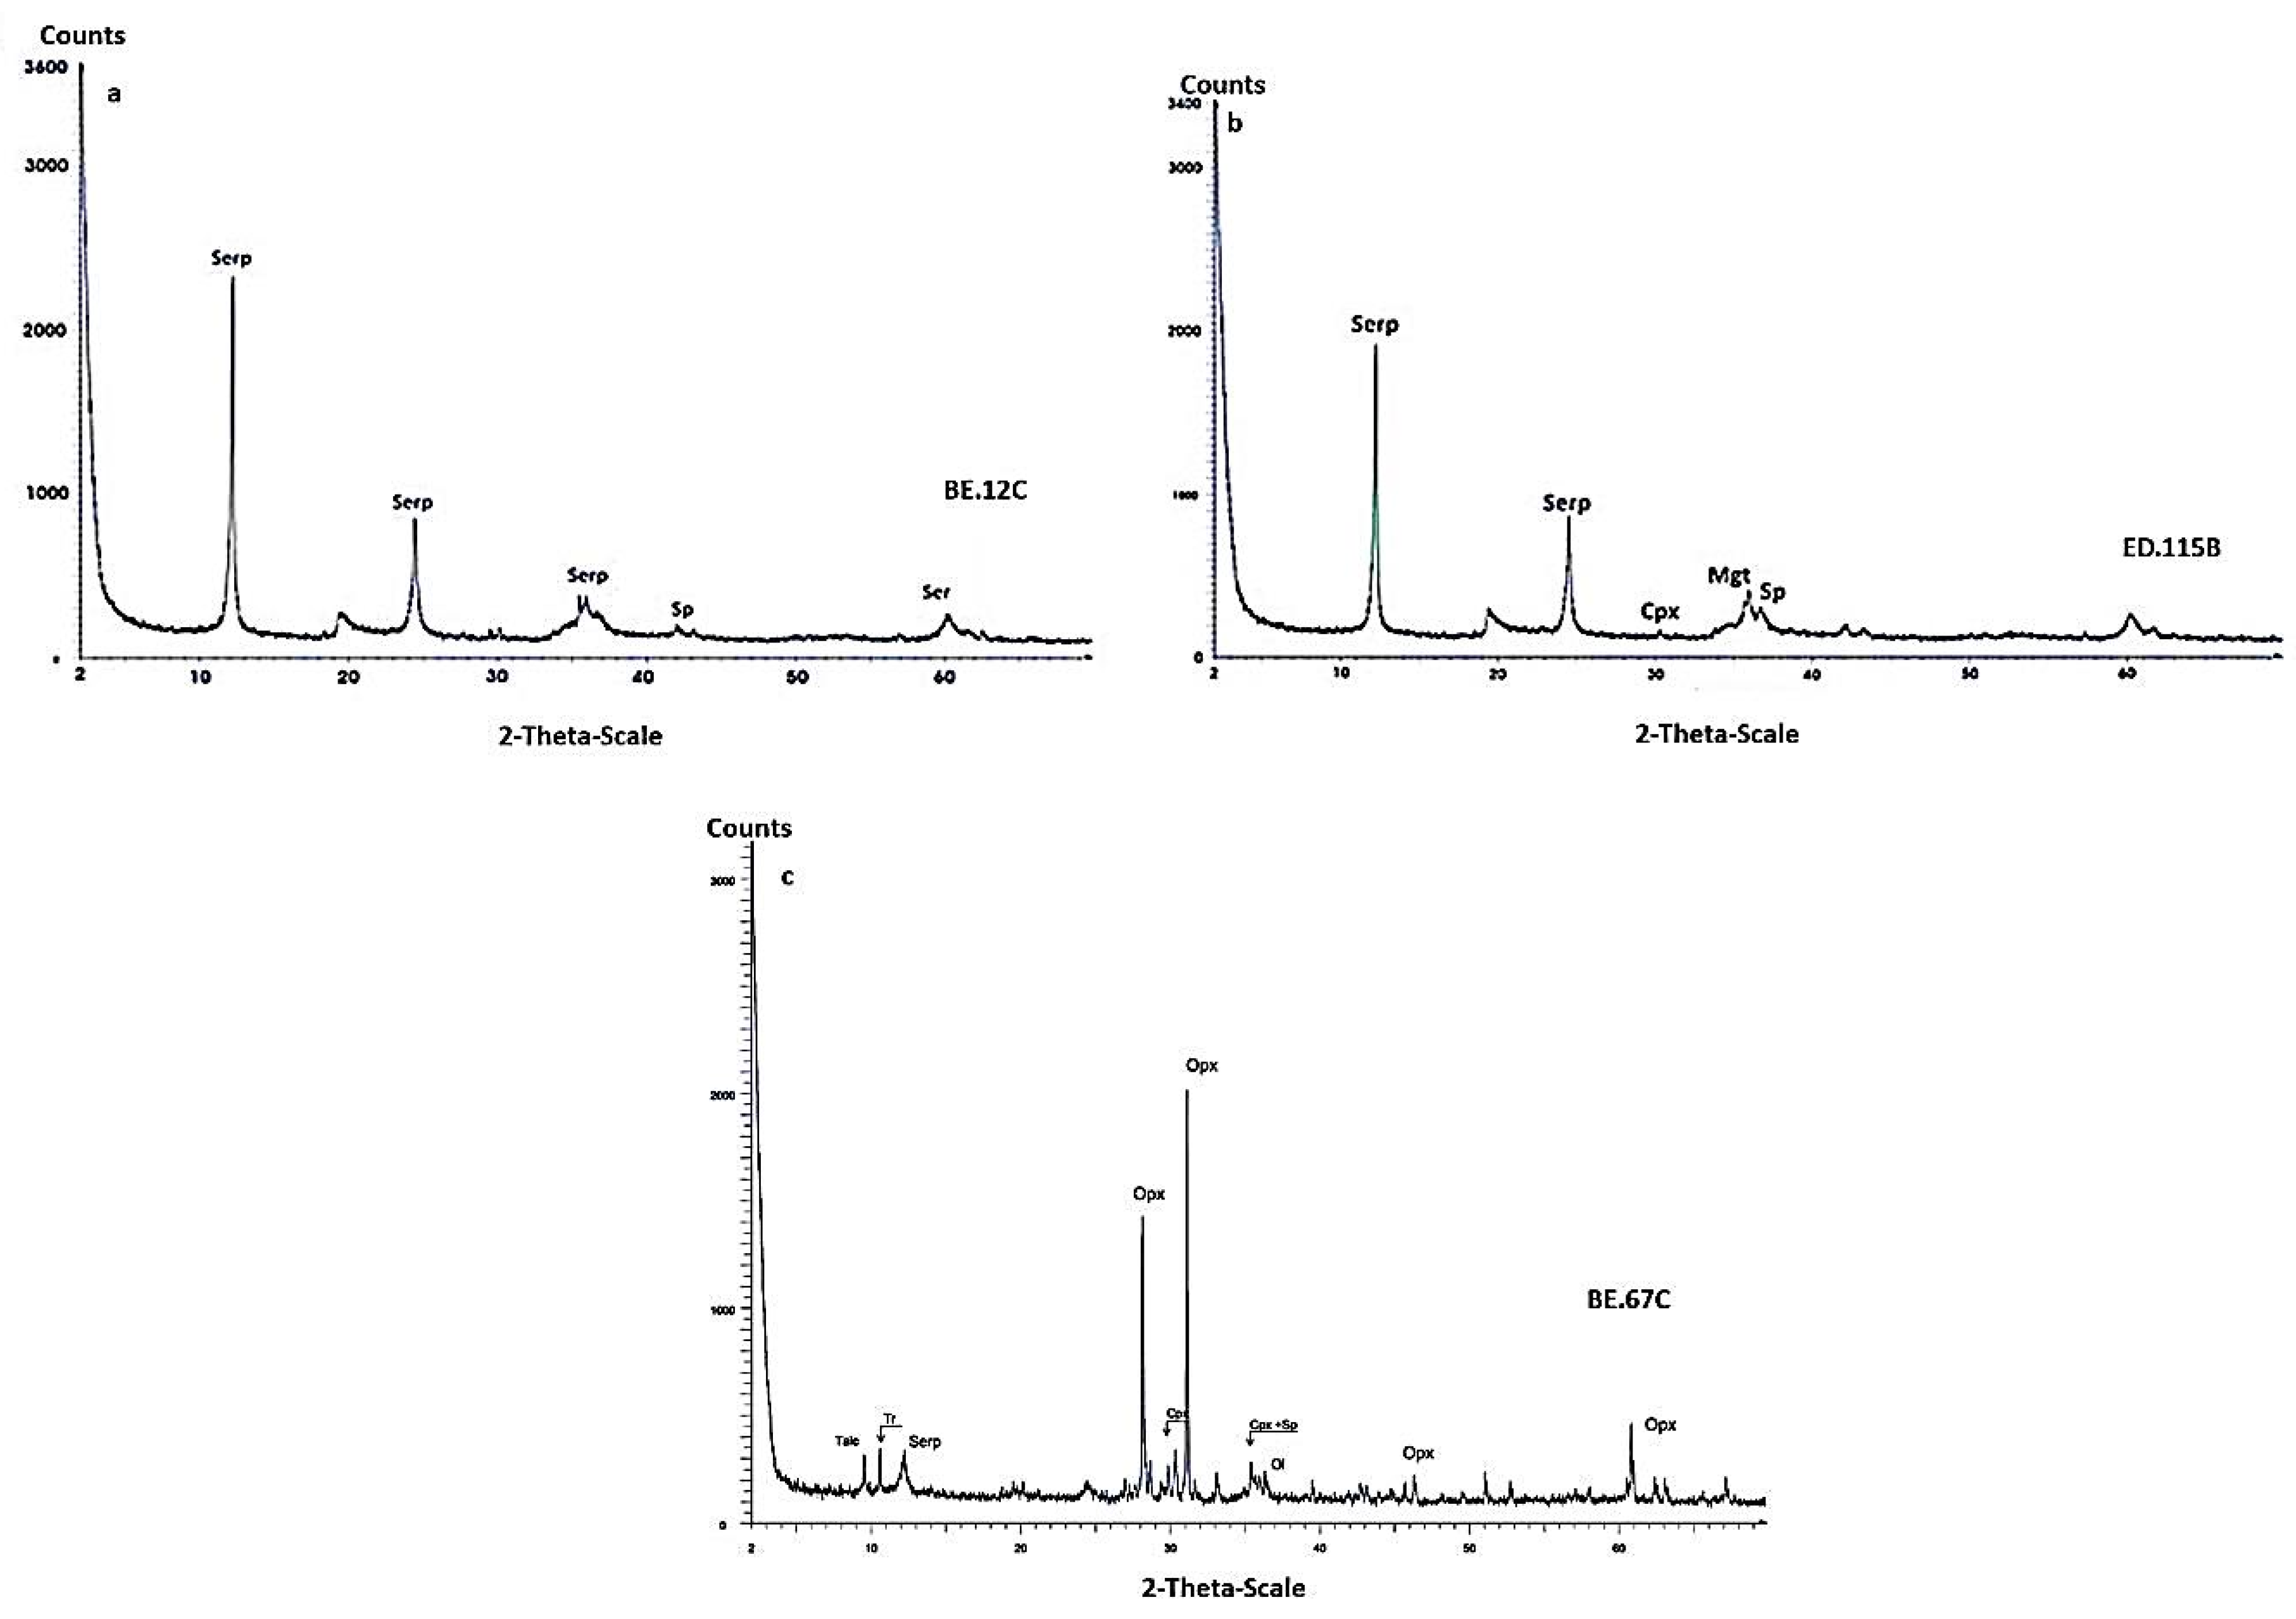
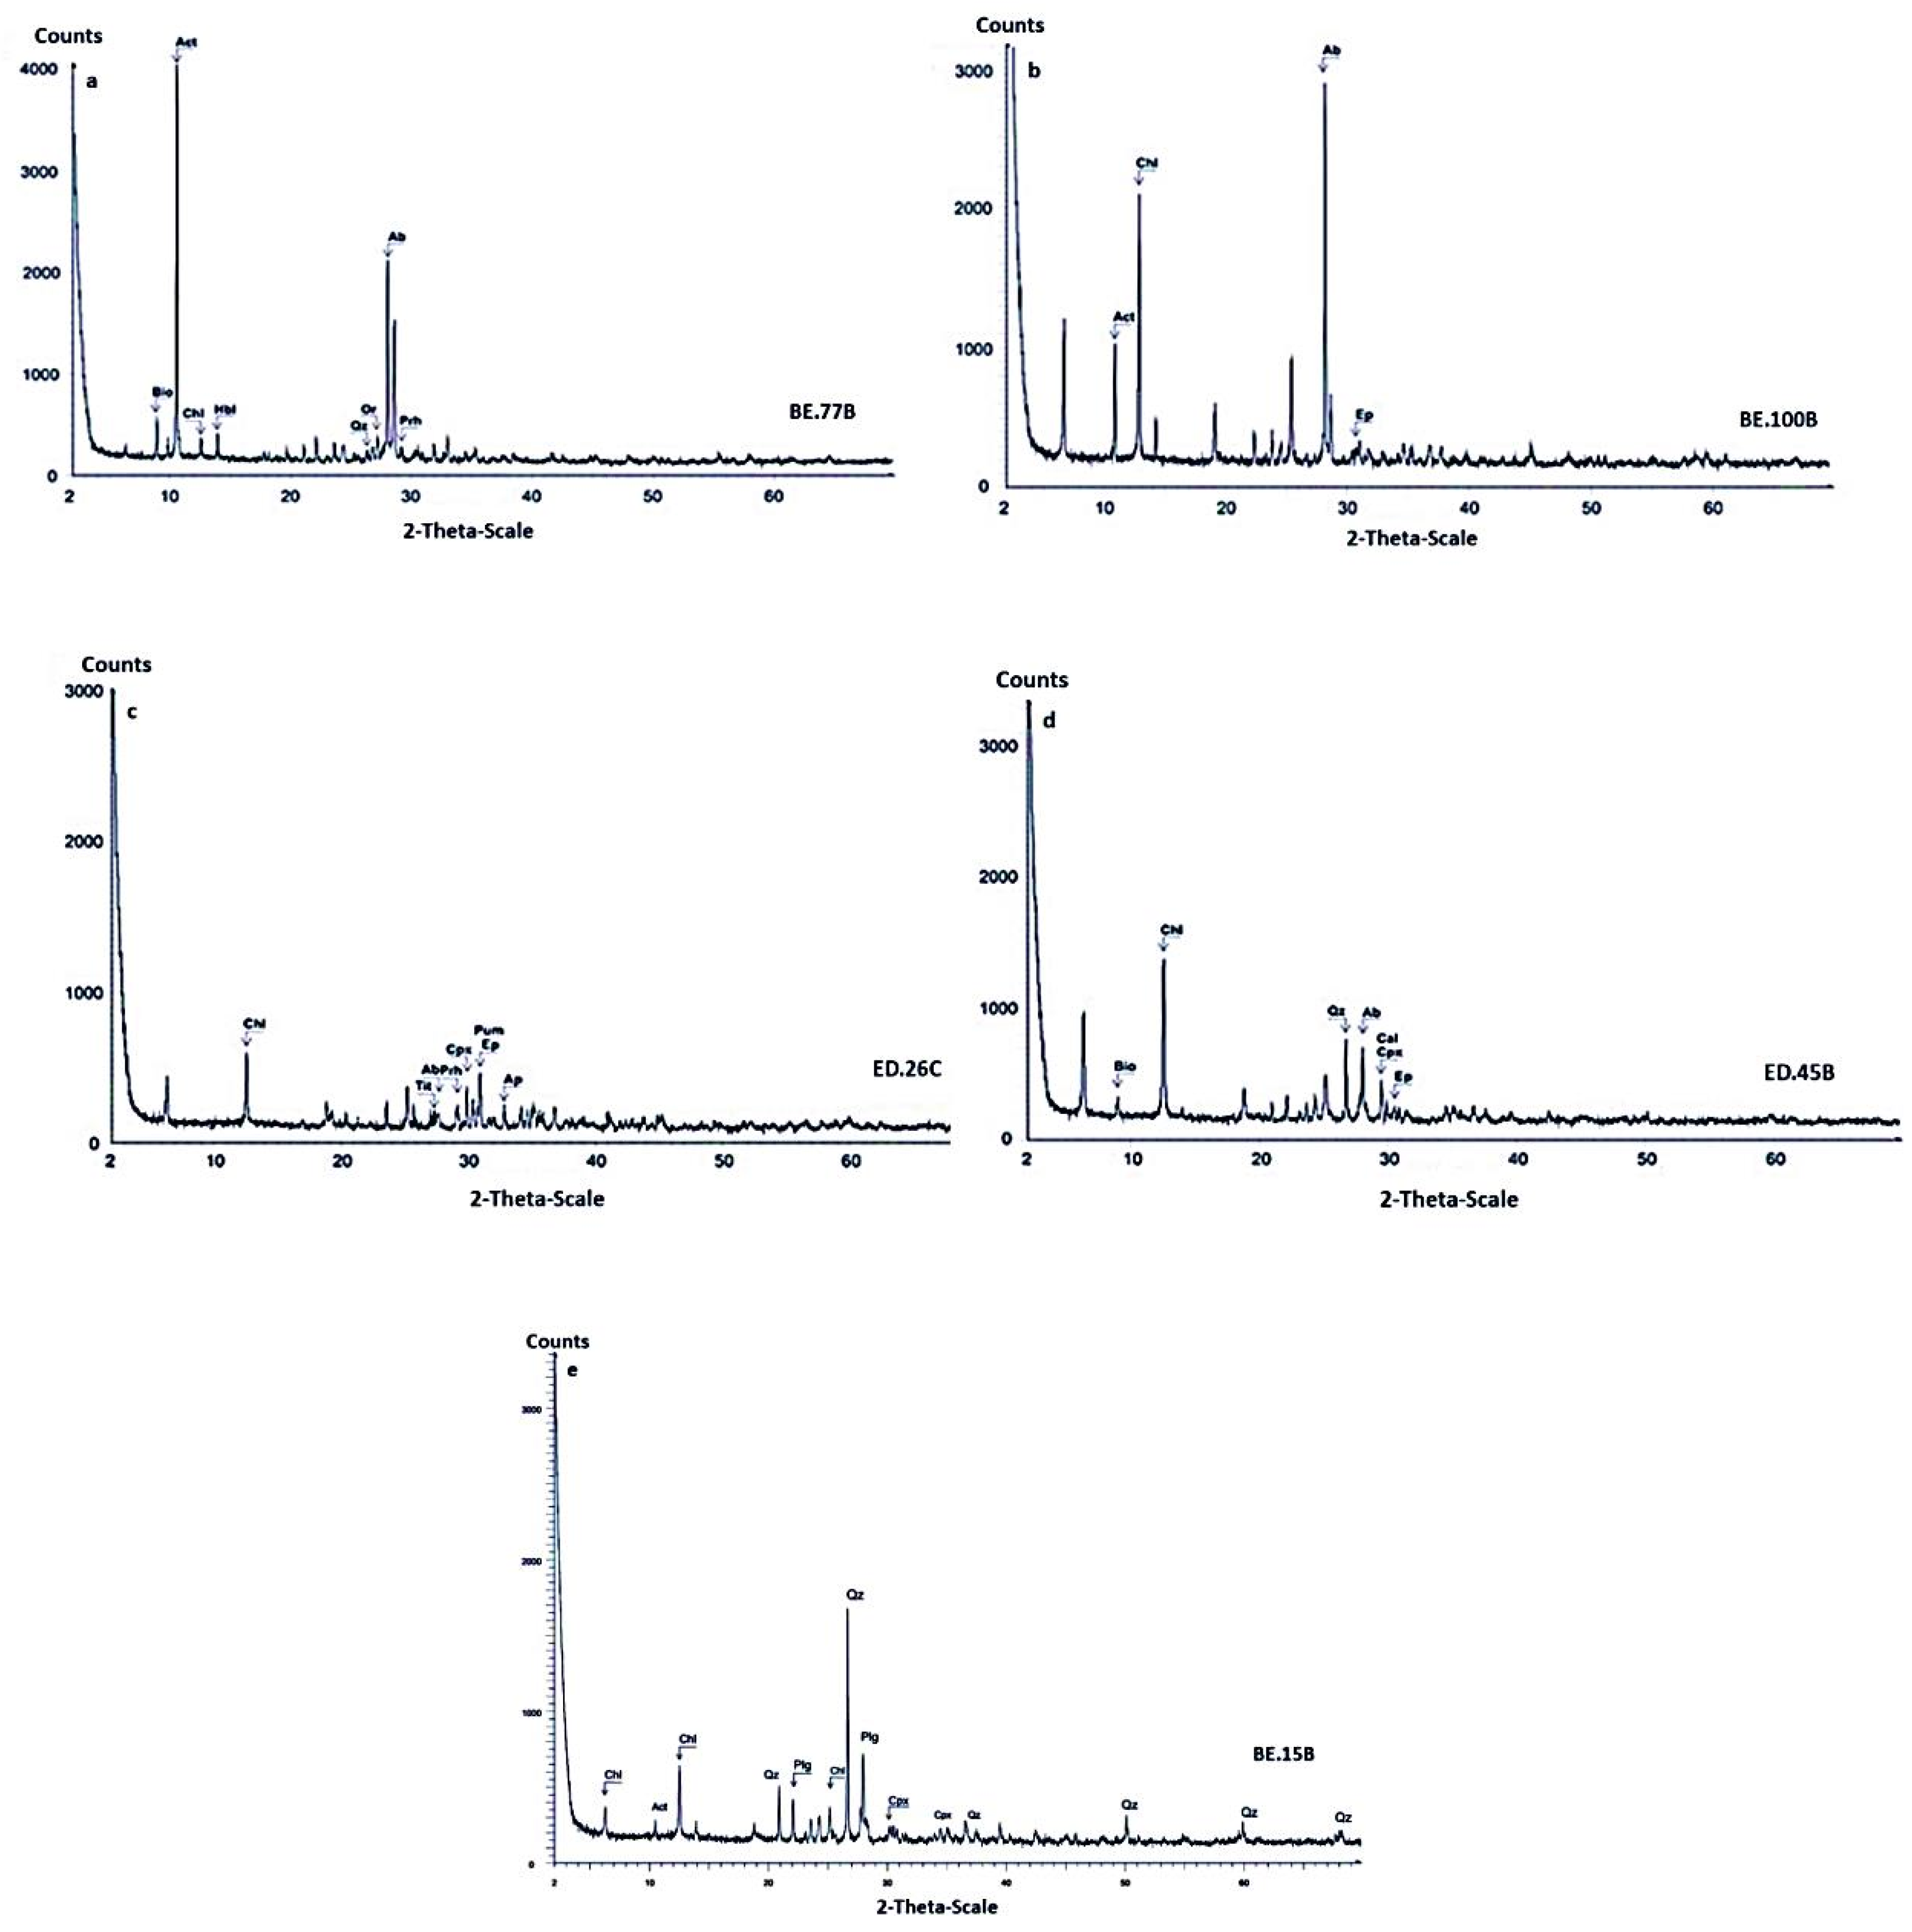
4.1.2. X-Ray Diffractometry of the Examined Aggregate Rocks

Representative X-ray diffraction patterns of all the studied lithologies (Group I and Group II) are presented in Figure 4 and Figure 5. The dominant alteration product of samples of Group I is the serpentine, while talc and tremolite occurred in minor amounts. Concerning the bulk mineralogy of Group II (mafic rocks), chlorite is the dominant secondary mineral, whereas epidote, actinolite as well as prehnite and pumpellyite occur in minor concentrations.

4.1.3. Mineral Chemistry

Serpentine Group Minerals

Representative microanalyses of serpentine group minerals are reported in Table 1 and plotted in Figure 6. Serpentine group minerals are composed of SiO2 (42.60–46.01 wt%), MgO (35.96–40.53 wt%), Fe2O3 (1.79–5.40 wt%), as well as low contents of Al2O3, Cr2O3, NiO, CaO, Na2O and K2O. Serpentine group minerals from serpentinized harzburgite display higher SiO2, MgO, Fe2O3, Cr2O3 and lower Al2O3 contents than those of the others two lithotypes. On the other hand, serpentinized lherzolite display serpentines with higher amounts of Al2O3 and slightly higher contents of Na2O3 and K2O relative to those of pyroxenite and serpentinized harzburgite. On the SiO2 vs. MgO binary plot (Figure 6a), the analyzed serpentine group minerals from serpentinized harzburgite and pyroxenite are plotted in the overlap field between the three serpentine polymorphs, while those of serpentinized lherzolite are mainly plotted in the field of lizardite. On the MgO vs. FeO binary plot (Figure 6b) the analyzed serpentines from serpentinized harzburgite and pyroxenite are mainly plotted in the field of antigorite due to the higher FeO contents compared with those of lherzolite. FeO was calculated by the Fe2O3 in order to be shown in the diagram in Figure 6b.

Chlorite

Chlorite appears xenomorphic crystals with the shape of scaly, sheet or bunchy. Usually, chlorite is closely to plagioclase, epidote, and actinolite or partially replaced the clinopyroxene in the examined mafic rocks. The examined ultramafic rocks display lesser amounts of chlorite, which mainly replaced clinopyroxene. Representative microanalyses of chlorite from the examined rocks are given in Table 2 and plotted in Figure 7. The serpentinized harzburgite contains chlorites with lesser Fet/(Fet + Mg) ratio (0.03–0.06) and FeO contents (1.84–3.71 wt%), as well as higher contents of SiO2, MgO and Cr2O3 (33.30–34.50 wt%, 33.42–33.64 wt% and 0.72–2.33 wt%, respectively) than those of mafic rocks. The examined mafic rocks display chlorites with higher Al2O3 (15.27–20.53 wt%) and FeO (15.66–30.58 wt%) contents, as well as slightly higher amounts of MnO, CaO and K2O than those of ultramafic rock. Basalts present chlorites with the higher Fet/(Fet + Mg) ratio (0.29–0.45) than the other examined lithotypes.
Chlorites’ compositions of the examined rocks are presented on the Si vs. Fet binary plot (Figure 7). The serpentinized harzburgite contains penninite and clinochlore (Figure 7). The examined mafic rocks (diorite, gabbro, diabase) contain diabantine and pycnochlorite, while the basalt mainly contains diabantine and brunsvigite with few analyses plotted in the pycnochlorite field (Figure 7).

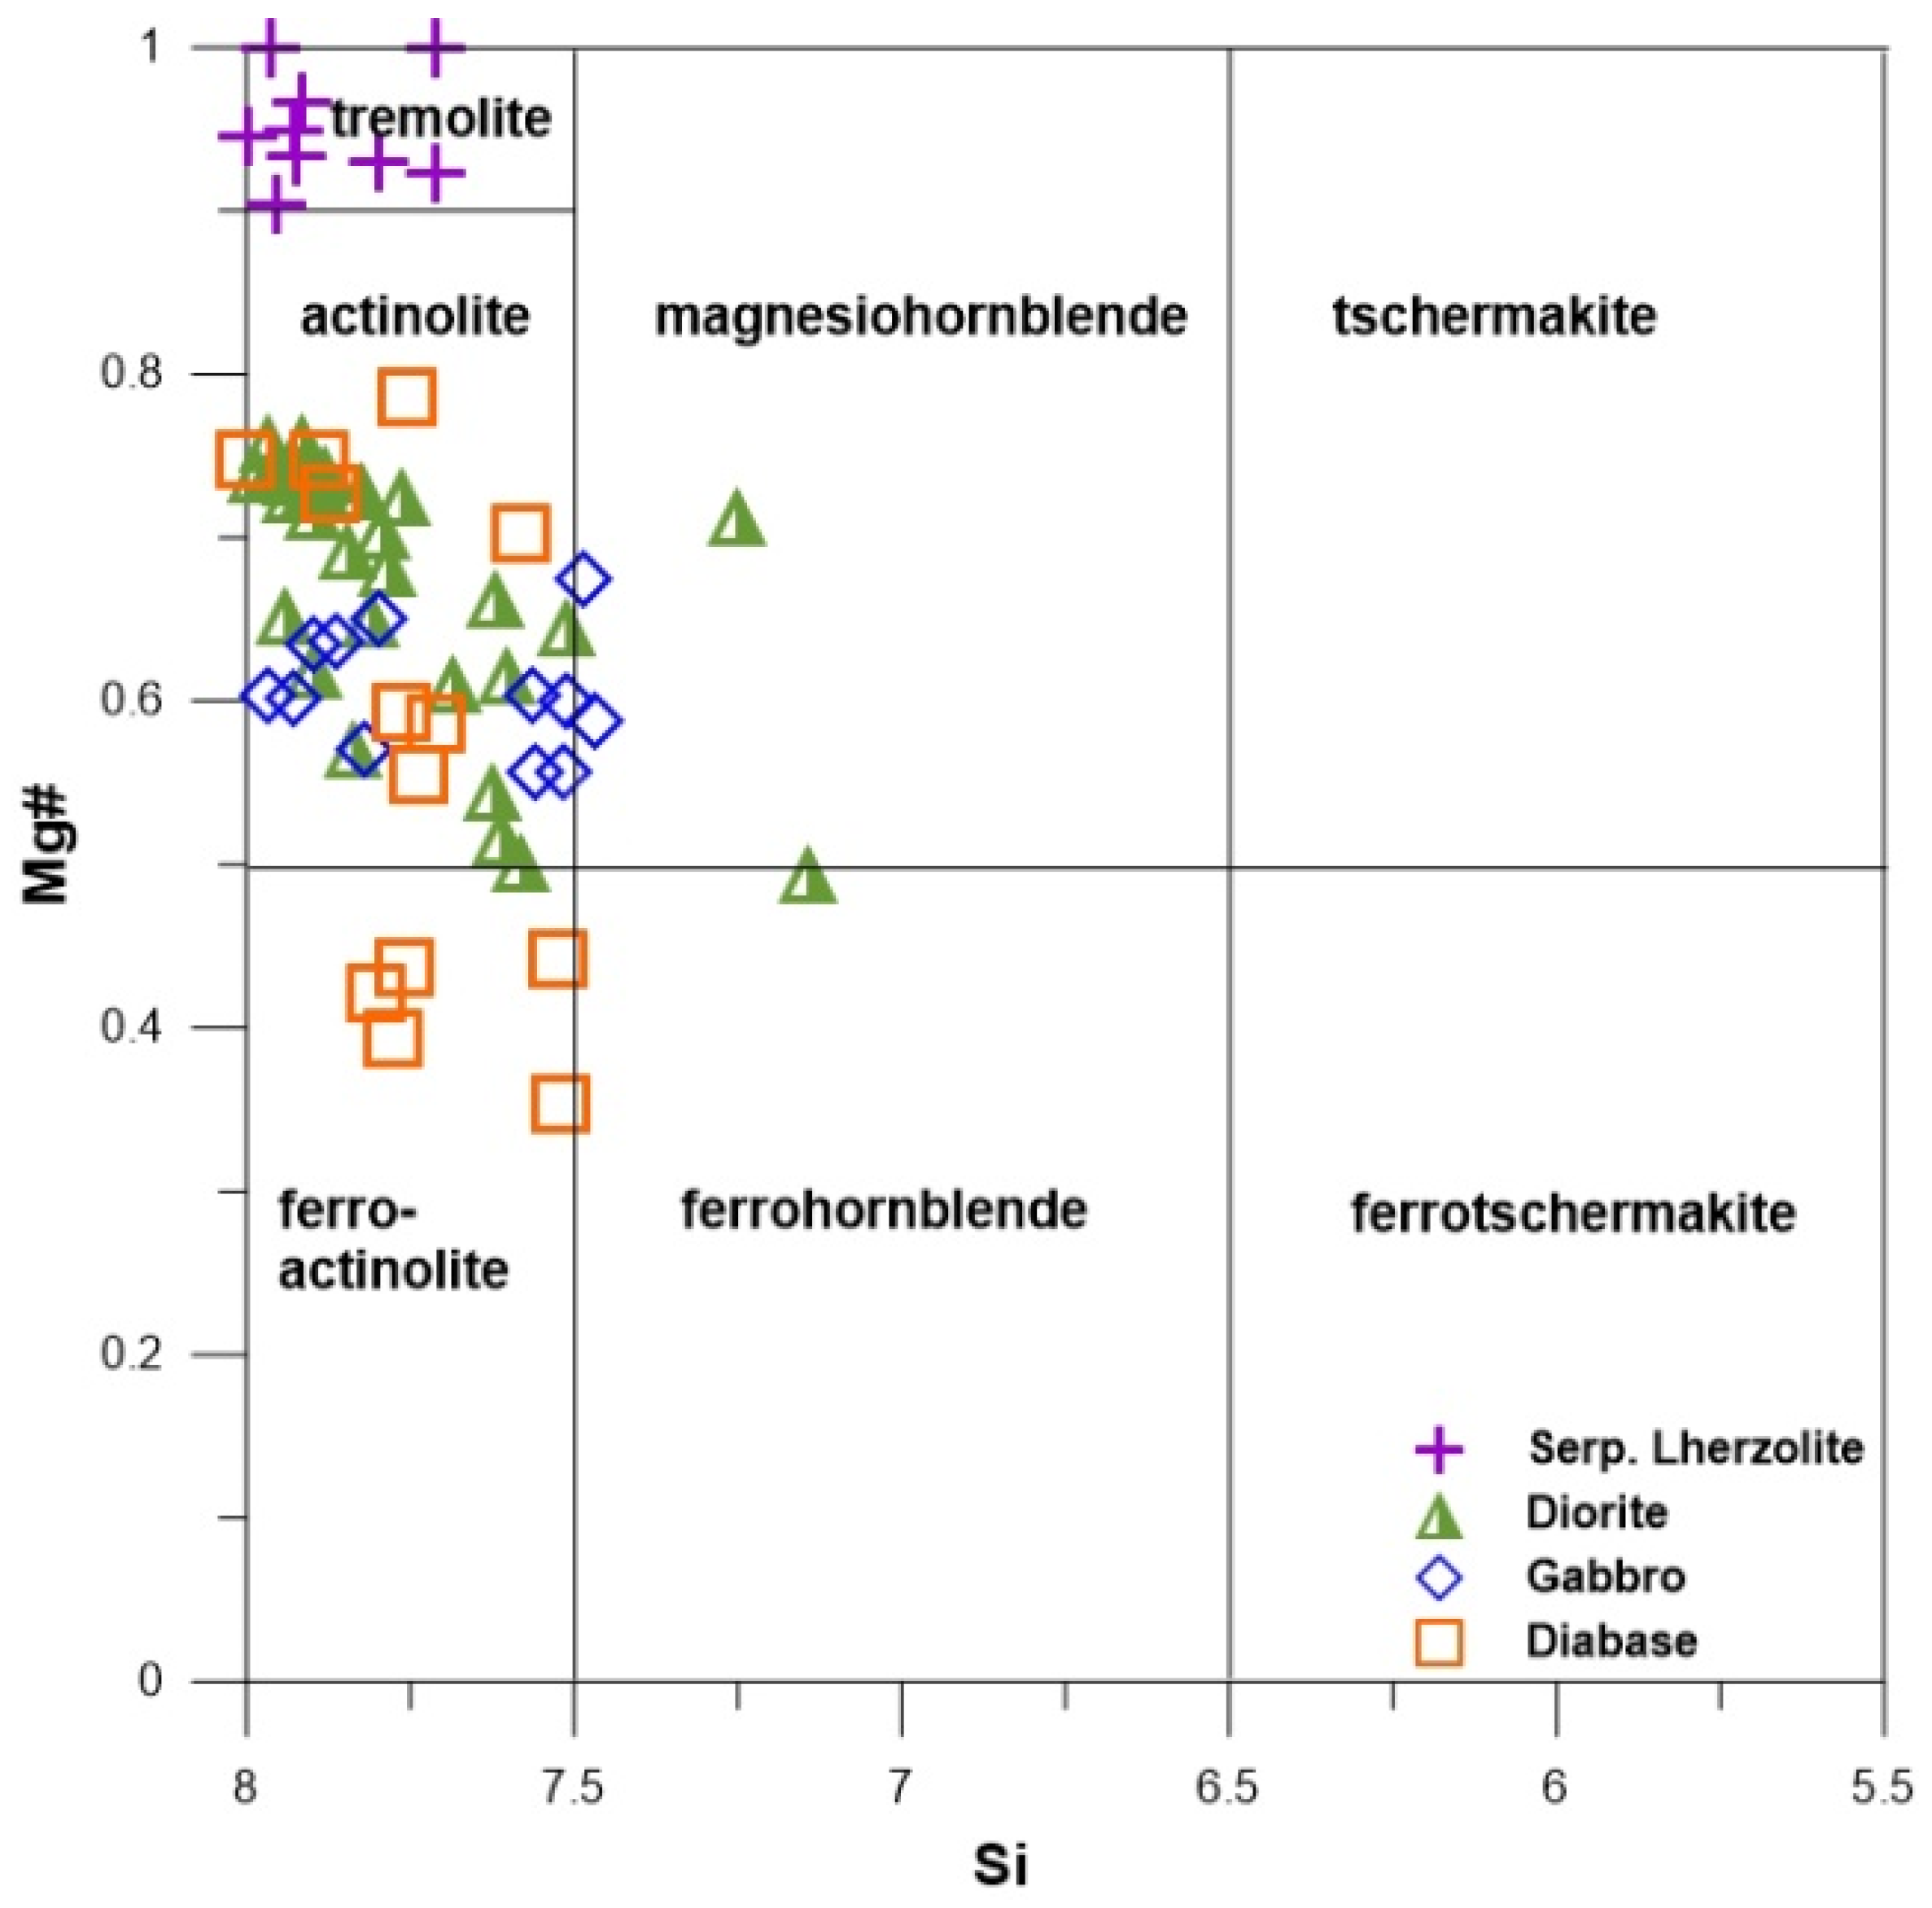
Amphibole Group Minerals

Representative amphibole analyses from the examined ultramafic and mafic rocks are presented in Table 3. The amphiboles are primary in diorite and secondary in the other lithotypes, which derived from alteration of pyroxenes. The primary amphiboles from the diorite are represented by magnesiohornblende to ferrohornblende in the classification diagram of Leak et al. [72] (Figure 8). Secondary amphiboles are represented by actinolite in ferro-actinolite in mafic rocks, as well as by tremolite in serpentinized lherzolite (Figure 8). Mg# [(Mg/(Mg + Fe2+)] of amphiboles range from 0.924 to 0.942 in serpentinized lherzolite and from 0.449 to 0.734 in mafic rocks (Table 3). Actinolite from the diabase shows similar characteristics including high FeO and relatively low MgO contents in contrast to this from the diorite which displays higher MgO and lower FeO contents. On the basis of Al2O3, TiO2 and MnO contents, the amphiboles of the examined mafic rocks display relative compositions. Tremolites present the higher SiO2, MgO and CaO contents, as well as the lower Al2O3 and FeO contents than the other amphibole analyses.

4.1.4. Geochemical Characteristics of the Examined Aggregate rocks

Major elements data from the examined aggregate rocks are presented in Table 4. In the serpentinized ultramafic rocks MgO content ranges from 26.00 wt% to 36.71 wt% with the lower content in the less serpentinized pyroxenites (BE.67C, BE.67D). Moreover, pyroxenites are richer in CaO (1.90–2.14 wt%) compared to the highly serpentinized samples (0.02–1.29 wt%). The latter samples indicated increased loss on ignition (LOI) content (13.4–15.3%) since LOI index is related to the degree of alteration of igneous rocks [5,32]. Only traces of TiO2 presented in the studied ultramafic rocks. Diorites present SiO2 content which varies from 52.4 wt% to 53.55 wt%, while gabbros content ranges between 39.9 wt% and 43.82 wt%. LOI of diorites ranges from 2.0% to 3.1%. Gabbros are chemically differentiated between the two ophiolitic sources, especially in the case of CaO content which ranges from 6.35 wt% to 27.52 wt%. Regarding the LOI content, they presented similar values (5.1–5.8%). Diabases are characterized by SiO2 content ranging from 38.35 wt% to 57.17 wt%, with higher amounts in samples derived from Veria–Naousa ophiolite complex. Moreover, diabases present amounts of Fe2O3 and MgO which range from 7.14 wt% to 11.03 wt% and 4.16 wt% to 10.67 wt%, respectively. They are significantly differentiated in Al2O3 content (3.78–17.31 wt%) as well as in LOI (2.0–6.0%). Βasalt from Veria–Naousa ophiolite complex differs from that derived from Edessa complex mainly in the content of SiO2 (BE.15B = 59.34 wt%; ED.66C = 48.40 wt%) and minor in the content of TiO2 (BE.15B = 0.56 wt%; ED.66C = 2.39 wt%), while the LOI content of these samples don’t exceed the 3.0%.

4.1.5. Physicomechanical Properties of the Examined Aggregate Rocks

The results of the physicomechanical tests of the studied samples are presented in Table 5. The serpentinized ultramafic rocks revealed high values of total porosity (nt: 2.80–6.30%), the moisture content (w) range from 1.25% to 2.18%. Regarding their mechanical results, their resistance in abrasion (LA) range from 25.50% to 40.40%, their uniaxial compressive strength (UCS) varies from 20.0 to 55.0 MPa and their point load index (Is(50)) presents values from 1.2 to 3.8 MPa. The less ultramafic serpentinized rock samples constitute an exception of Group I, indicating better physical and mechanical properties compared to those containing higher alteration degree. In comparison to the serpentinized ultramafic rocks, the mafic samples present reduced values of their physical properties (nt: 0.13–1.74%; w: 0.2–0.6%) and increased values of their mechanical properties (UCS: 80.0–165.9 MPa; LA: 7.30–18.00%; Is(50): 4.1–12.0 MPa). In the Gerania, Guevgueli, Koziakas, Pindos, Vourinos and Orthrys ophiolite complexes, the values of the physical and mechanical properties [5,6,73] of both mafic and ultramafic rocks are similar to those shown in Table 5.

4.2. Concrete Strength Results

Concrete strength values vary from 25 to 32 Mpa in the examined specimens and in those specimens made by mafic aggregate rocks (Group II) display better mechanical strength than those made by ultramafic aggregates (Group I). More specifically, the uniaxial compressive strength of concrete specimens produced by ultramafic aggregate rocks presents value from 25.0 to 27.0 MPa, with the more serpentinized presenting the lowest concrete strength. Regarding the concrete strength values of specimens made by mafic aggregate rocks, their values vary from 29.0 to 32.0 MPa as is shown in Table 6. Sample BE.113B (diabase) exhibits the higher concrete strength (Table 6).

5. Discussion

5.1. The Effect of Chemical Composition of Mafic and Ultramafic Aggregates on Their Physicomechanical Properties

Chemical indices constitute a useful tool to estimate the physicomechanical performance of various types of rocks as they may present a quantitative measure of alteration extent of them. As a result, chemical indices considered to have high significance for the evaluation of the engineering properties of aggregate rocks (e.g., [1,12,73]). Numerous efforts were made over the past years trying to correlate alteration of rocks with their physicomechanical properties by using chemical indices, whereas most of them have been proposed for igneous rocks, mainly for acidic or intermediate rock types (e.g., [33,37]), while less of them for mafic and/or ultramafic rocks [74]. Some of the indices are quite simple (e.g, [39,75]) expressed just by ratios of oxides and other more complicated (e.g, [32,40,76,77]). The principal assumption in formulating these indices is that the behavior of chemical elements is exclusively controlled by the alteration degree expressed by the relationship between mobile and immobile oxides such as SiO2, Na2O, CaO, MgO, K2O and Al2O3, Fe2O3, TiO2, respectively.
In this study, in order to identify the effect of chemical composition of ultramafic and mafic rocks on their physicomechanical properties and hence on the mechanical strength of the produced concrete specimens, a new geochemical alteration index named Ga (alteration) is proposed. The proposed index takes into account a larger number of mobile and immobile elements so that through this index the geochemical depiction of rocks is more fully reflected. In general, Ga expresses the degree of the alteration process which takes place through the mobility of major elements and is attributed by the following mobile to immobile ratio:
Ga = (CaO + MgO + K2O)/(Al2O3 + Fe2O3 + TiO2)
Ga values of the examined samples are listed in Table 7.
The values of Ga index, in ultramafic rocks, range from 3.09 to 4.61, with the most serpentinized rocks having the highest values. This wide range of Ga values is due to their different MgO content. High concentration of MgO in ultramafic rocks can be explained by the presence of minerals such as olivine, pyroxene and mainly serpentine [78], as has been observed during the analysis of the chemistry of the main secondary minerals of the examined rocks. Generally, during serpentinization, the mobile CaO is leached, while minerals rich in magnesium and water (serpentine) dominate in their mineralogy as has been presented in the X-ray diffraction patterns of the investigated ultramafic rocks (Figure 4). On the other hand, mafic rocks present obviously lower values of Ga values, ranging from 0.33 to 1.50. The most altered mafic rocks contain higher amount of CaO (until 27.52%) compared to the less altered. The wide range of CaO content in mafic rocks indicates that Ca is an intense mobile element during the hydrothermal alteration process [79]. The altered mafic rocks contain higher amount of minerals rich in Ca such as epidote and chlorite as was presented when used combined petrographic methods such as analysis via polarizing microscope, X-ray Diffractometry and minerals chemistry (Figure 3, Figure 5, Figure 7, Figure 8).
To evaluate the influence of Ga index on the physicomechanical properties of the examined ultramafic and mafic rocks correlation diagrams among the engineering properties were carried out (Figure 9). Correlations observed between these engineering properties and the proposed geochemical index (Ga) showed that these properties were strongly influenced by the alteration processes. The physical properties both from Group I and II are strongly and positively correlated to Ga (Figure 9), while when this index (Ga) is plotted against to the uniaxial compressive strength (UCS) and point load index (Is(50)) a strong but negative relation is occurred. On the other hand, as the Los Angeles values (LA) increase the index (Ga) values increase, respectively (Figure 9). More specifically, among the studied ultramafic rock samples, the highly serpentinized ones, display Ga > 3.47, showing the highest total porosity (nt: 2.80–6.29%), moisture content (w: 1.25–2.18%) and LA values (25.50–40.40%) as well as the lower UCS (20.0–55.0 MPa) and Is(50) values (1.2–3.8 MPa). These results attributed to the presence of the hydrous phyllosilicate mineral serpentine which has extensively replaced the primary minerals [17,80]. Petrounias et al. [19] have studied the influence of secondary phyllosilicate minerals of the same ultramafic rocks with this study on their physical and mechanical performance by introducing a new petrographic index Uph (sum of secondary phyllosilicate minerals) highlighting the significant effect of serpentine. Additionally, Giannakopoulou et al. [5] by proposing the petrographic index SEC/PR in ultramafic rocks derived from Veria–Naousa and Gerania ophiolite complexes enhanced the negative influence of serpentine on the engineering properties when assuming that serpentine characterized by loose structure, fibrous or platy crystals, eminent cleavage, mesh texture and low microtopography negatively resulted in the engineering properties of ultramafic aggregates.
Mafic rocks (Group II) exhibit a more complex behavior in contrast to the ultramafic rocks (Group I). The less altered basalt (BE.15B) exhibits the lowest total porosity and Ga values (Table 5 and Table 8), relative low moisture content and the highest UCS value. It is also yielded high value of Is(50) and low moisture content and moderate LA value (Table 5). On the other hand, BE.167, one of the most altered gabbroic samples presents the lower compressive strength, one of the higher LA values as well as of the worst physical properties (Table 5). The above described correlations can mainly be attributed to the amount of secondary minerals (chlorite, actinolite, clay minerals) participating in the modal composition of these rocks. Low amount of soft phyllosilicate secondary minerals (chlorite) resulted in the increase of the mechanical strength. Moreover, the preservation of the initial textural characteristics, due to the low alteration degree and consequently to the low total porosity and moisture content values may also positively affects to their mechanical behavior [3,16]. Similar mismatches were also observed among several/some diabasic and dioritic samples and therefore Ga index should be used carefully as a prediction index in mafic rocks as it is quite possible that several mechanical properties of such rocks strongly depend more on other parameters such as primary mineralogy. The above-mentioned relationships among the proposed geochemical index and the engineering properties of ultramafic and mafic aggregate rocks result in the indirect predict of these properties through this index. A prediction index such as Ga may also act in the reduction of energy consumed during the unreasonable extraction of aggregates.
In order to test the viability of this index (Ga), their values were correlated with the loss on ignition (LOI) of the examined rocks since the latter constitute a widely accepted and extensively used approximate alteration index (Figure 9f). Most the examined ultramafic rocks are highly serpentinized, except pyroxenite which shows minor alteration degree (Figure 4c) and therefore extremely low Ga values (Table 7). This fact led us to exclude these two samples from the correlation coefficient as well form the trend line. A strong and positive relationship was obtained between LOI and Ga, hence proving the validity of the proposed Ga as a new alteration index for ultramafic and mafic rocks. LOI is widely believed to be an alteration index of rocks, while it is closely related to the serpentinization degree particularly for ultramafic rocks and mainly expresses the amount of hydrated secondary minerals (e.g., chlorite) contained in mafic rocks.

5.2. The Effect of Chemical Composition of Mafic and Ultramafic Aggregates on Their Produced Concrete Mechanical Behavior

Up to now, researchers have used the geochemical composition of aggregate rocks for testing the possibility of the existence of the alkali silica reaction zones between the cement paste and the aggregate particles in concretes [53]. Furthermore, researchers have tried to identify the results of the chemical reactions between cement paste and aggregate particles in concrete [4,18] while others have examined the alkali–silica reaction in concrete [81,82]. Moreover, the influence of petrographic and mineralogical characteristics of aggregate rocks on their engineering properties as well as on the mechanical strength on the produced concrete specimens has also been studied [4,18]. More specifically, the effect of the alteration degree of mafic and ultramafic rock aggregates on the concrete strength has recently studied by Petrounias et al. [4,18]. However, a research gap has been observed related to the existence of a geochemical alteration index of rocks as well as to the relationship between the index with the mechanical strength of the produced concretes. In this study, the geochemical composition of ultramafic and mafic aggregate rocks was correlated with the concrete strength. In the diagram of Figure 10, strong negative relation between the proposed Ga index and the concrete strength was observed.
The above relationship (Figure 10) indicates that the Ga index and consequently the alteration degree of ultramafic and mafic rocks are directly related with the concrete strength. The following diagram shows an expected trend between the samples relative to the degree of rock depletion as shown in Table 7. This fact is in accordance with the conclusions of Petrounias et al. [4,18] research, who have reported that as the serpentinization in ultramafic rocks increases the concrete strength decreases, respectively due to the platy morphology of serpentine minerals and due to the extended form of failures and detachments which results in intense debonding in concrete specimens. The above trend also supports that as the alteration degree of mafic rocks increases the concrete strength decreases too. In such a conclusion, Petrounias et al. [4] have also been conducted when they studied the mechanical strength of concrete specimens produced by mafic aggregate rocks. They noticed that the amount of chlorite contained in mafic aggregates constitutes the determinant factor for reducing the final concrete strength as chlorite also presents platy surfaces which act similarly to serpentine and hence displaying detachments between the cement paste and the aggregate particle. It is obvious that the mechanical strength of a construction product such as concrete is controlled by various factors directly dependent on each other, which are links in the same chain, such as the mineralogical composition of rocks which affects their chemical composition and on their engineering properties. Furthermore, the whole chemical composition of the aggregates used in concrete combined with the chemical composition of cement constitute a chemically complex system which affects the hydraulic properties of cement and consequently determines the final concrete strength.
In this study, other widely used chemical indices were calculated for the examined mafic and ultramafic rocks (Table 8 and Table 9) and were correlated with the engineering properties of the tested aggregates, with the LOI index and with the mechanical strength of the produced concrete specimens (Table 10) in order to identify their effectiveness compared with the proposed Ga index.
As you can see in the correlations which are listed in Table 10, PI and CIA index, which have been proposed by Rieche [76] and Nesbitt & Young [40], respectively, did not seem to present any relationship neither with the engineering properties of the examined rocks, nor with the mechanical strength of the produced concretes (r2 = 0.16 and 0.06, respectively). However, ba2 [75] and mainly VR [83,84] index are well correlated with the above mentioned parameters indicating the influence of the chemical composition of rocks on their properties as well as on the final quality of the construction applications in which they participate. On the other hand, we should notice at this point that Ga displays higher r2 with the aforementioned parameters in contrast to the last two indices (ba2 and VR), a fact which strongly indicates the effect of geochemistry on the engineering behavior of aggregate rocks. More specifically, concerning the VR index, which is a ratio of immobile to mobile elements of rocks: Ga seems to be a more complete index as it takes into account more mobile and immobile major elements of each examined lithotype.
The proposed geochemical index (Ga) of aggregates directly supports the concept of the influence of chemical composition of rocks on the produced concretes which are directly depended on the alteration of rocks and consequently on their mineralogical composition. Additionally, the proposed index (Ga) may also be used as a prediction index of the performance and of the mechanical strength of concrete specimens so as to avoid the study and use of altered rocks for concrete aggregates by investigating their chemical composition. A chemical index, such as the proposed Ga, may work properly as a prediction index, however, it is not possible to work as it is in any construction application such as concrete is a multifactorial system of dependent parameters, which determine the final strength of each construction application.

6. Conclusions

In this study, the influence of chemical composition of mafic and ultramafic rocks on their engineering properties was examined, and consequently, how their chemical composition may control the mechanical strength of the produced concrete specimens. This study led to the following remarkable conclusions:
  • Chemical composition of ultramafic and mafic rocks is directly correlated with their physicomechanical behavior when used as aggregates.
  • A geochemical alteration index (Ga) was proposed for ultramafic and mafic aggregate rocks as an indirectly indicator of engineering performance of aggregates. The variation of Ga values between ultramafic (Group I) and mafic (Group II) rocks is relative to the different type of alteration among these lithologies.
  • Chemical composition of ultramafic and mafic rocks, expressed by the proposed index (Ga) presented as a useful tool for predicting mechanical behavior of construction applications such as concrete and contributes for saving money, time and conserving energy in the construction field.
The combination of petrographic and chemical analytical methods with engineering properties constitutes a useful tool for the evaluation of rocks as aggregates.

Author Contributions

P.L. carried out the interpretation of the geochemical data, participated in the interpretation of the results and contributed to the manuscript writing; P.P. participated in the fieldwork, the elaboration of laboratory tests, the interpretation of the results, coordinated the research and the writing of the manuscript; P.P.G. participated in the elaboration of laboratory tests, the interpretation of the results and contributed to the manuscript writing; A.R. participated in the fieldwork, the interpretation of the results and contributed to the manuscript writing; N.K. contributed to the interpretation of the results; B.T. participated in the fieldwork and in the interpretation of the results; K.H. participated in the interpretation of the results. All authors have read and agreed to the published version of the manuscript.

Funding

This research received no external funding.

Acknowledgments

We would like to thank M. Kalpogiannaki for her assistance in the construction of the geological maps.

Conflicts of Interest

The authors declare no conflict of interest.

References

  1. Kilic, R. The Unified Alteration Index (UAI) for mafic rocks. Environ. Eng. Geosci. 1999, 4, 475–483. [Google Scholar] [CrossRef]
  2. Xia, K.; Nasseri, M.H.B.; Mohanty, B.; Lu, F.; Chen, R.; Luo, S.N. Effects of microstructures on dynamic compression of Barre granite. Int. J. Rock Mech. Min. Sci. 2008, 45, 879–887. [Google Scholar] [CrossRef]
  3. Liu, H.; Lindqvist, P.A.; Åkesson, U.; Kou, S.; Lindqvist, J.E. Characterisation of rock aggregate breakage properties using realistic texture-based modelling. Int. J. Numer. Anal. Methods Geomech. 2012, 36, 1280–1302. [Google Scholar] [CrossRef] [Green Version]
  4. Petrounias, P.; Giannakopoulou, P.P.; Rogkala, A.; Stamatis, P.M.; Lampropoulou, P.; Tsikouras, B.; Hatzipanagiotou, K. The Effect of Petrographic Characteristics and Physico-Mechanical Properties of Aggregates on the Quality of Concrete. Minerals 2018, 8, 577. [Google Scholar] [CrossRef] [Green Version]
  5. Giannakopoulou, P.P.; Petrounias, P.; Rogkala, A.; Tsikouras, B.; Stamatis, P.M.; Pomonis, P.; Hatzipanagiotou, K. The influence of the mineralogical composition of ultramafic rocks on their engineering performance: A case study from the Veria-Naousa and Gerania ophiolite complexes (Greece). Geosciences 2018, 8, 251. [Google Scholar] [CrossRef] [Green Version]
  6. Giannakopoulou, P.P.; Petrounias, P.; Tsikouras, B.; Kalaitzidis, S.; Rogkala, A.; Hatzipanagiotou, K.; Tombros, S.F. Using Factor Analysis to Determine the Interrelationships between the Engineering Properties of Aggregates from Igneous Rocks in Greece. Minerals 2018, 8, 580. [Google Scholar] [CrossRef] [Green Version]
  7. Jayawardena, U.S.; Izawa, E. A new chemical index of weathering for metamorphic silicate rocks in tropical regions: A study from Sri Lanka. Eng. Geol. 1994, 36, 303–310. [Google Scholar] [CrossRef]
  8. Ceryan, S. New weathering indices for evaluating durability and weathering characterization of crystalline rock material: A case study from NE Turkey. J. Afr. Earth Sci. 2015, 103, 54–64. [Google Scholar] [CrossRef]
  9. Turgul, A.; Zarif, I.H. Correlation of mineralogical and textural characteristics with engineering properties of selected granitic rocks from Turkey. Eng. Geol. 1999, 51, 303–317. [Google Scholar]
  10. Sousa, L.M.O. The influence of the characteristics of quartz and mineral dete-rioration on the strength of granitic dimensional stones. Environ. Earth Sci. 2013, 69, 1333–1346. [Google Scholar] [CrossRef]
  11. Vesiloglou-Gultekin, N.; Sezer, E.A.; Gokceoglou, C.; Bayahan, H. An application of adaptive neuro fuzzy inference system for estimating the uniaxial compressive strength of certain granitic rocks from their mineral contents. Expert Syst. Appl. 2013, 40, 921–928. [Google Scholar] [CrossRef]
  12. Undul, O. Assessment of mineralogical and petrographic factors affecting petro-physical properties, strength and cracking processes of volcanic rocks. Eng. Geol. 2016, 210, 10–22. [Google Scholar] [CrossRef]
  13. Pricryl, R. Some microstructural aspects of strength variation in rocks. Int. J. Rock Mech. Min. 2001, 38, 671–682. [Google Scholar] [CrossRef]
  14. Peng, J.; Wong, L.N.Y.; Teh, C.I. Influence of grain size heterogeneity on strength and microcracking behavior of crystalline rocks. J. Geophys. Res. Solid Earth. 2017, 122, 1054–1073. [Google Scholar] [CrossRef] [Green Version]
  15. Bandini, A.; Berry, P. Influence of Marble’s Texture on its Mechanical Behavior. Rock Mech. Rock Eng. 2013, 46, 785–799. [Google Scholar] [CrossRef]
  16. Hemmati, A.; Ghafoori, M.; Moomivand, H.; Lashkaripour, G.R. The effect of mineralogy and textural characteristics on the strength of crystalline igneous rocks using image-based textural quantification. Eng. Geol. 2020, 266, 105467. [Google Scholar] [CrossRef]
  17. Rigopoulos, I.; Tsikouras, B.; Pomonis, P.; Hatzipanagiotou, K. The influence of alteration on the engineering properties of dolerites: The example from the Pindos and Vourinos ophiolites (northern Greece). Int. J. Rock Mech. Min. Sci. 2010, 47, 69–80. [Google Scholar] [CrossRef]
  18. Petrounias, P.; Giannakopoulou, P.P.; Rogkala, A.; Stamatis, P.M.; Tsikouras, B.; Papoulis, D.; Lampropoulou, P.; Hatzipanagiotou, K. The Influence of Alteration of Aggregates on the Quality of the Concrete: A Case Study from Serpentinites and Andesites from Central Macedonia (North Greece). Geosciences 2018, 8, 115. [Google Scholar] [CrossRef] [Green Version]
  19. Petrounias, P.; Giannakopoulou, P.P.; Rogkala, A.; Lampropoulou, P.; Koutsopoulou, E.; Papoulis, D.; Tsikouras, B.; Hatzipanagiotou, K. The Impact of Secondary Phyllosilicate Minerals on the Engineering Properties of Various Igneous Aggregates from Greece. Minerals 2018, 8, 329. [Google Scholar] [CrossRef] [Green Version]
  20. Escartin, J.; Hirth, G.; Evans, B. Strength of slightly serpentinized peridotites: Implications for the tectonics of oceanic lithosphere. Geology 2001, 29, 1023–1026. [Google Scholar] [CrossRef]
  21. Frost, B.R.; Beard, J.S. On silica activity and serpentinization. J. Petrol. 2007, 48, 1351–1368. [Google Scholar] [CrossRef] [Green Version]
  22. Shevais, J.W.; Kolesar, P.; Andreasen, K. A field and chemical study of serpentinization—Stonyford, California: Chemical flux and mass balance. Int. Geol. Rev. 2005, 47, 1–23. [Google Scholar] [CrossRef]
  23. Deschamps, F.; Godard, M.; Guillot, S.; Hattori, K. Geochemistry of subduction zone serpentinites: A review. Lithos 2013, 178, 96–127. [Google Scholar] [CrossRef]
  24. Malvoisin, B. Mass transfer in the oceanic lithosphere: Serpentinization is not isochemical. Earth Planet. Sci. Lett. 2015, 430, 75–85. [Google Scholar] [CrossRef]
  25. Bettison, L.A.; Schiffman, P. Compositional and Structural variations of phyllosillicates from the Point Soil ophiolite, California. Am. Mineral. 1988, 79, 671–695. [Google Scholar]
  26. Weinert, H.H. Basic Igneous Rocks in Road Foundations; The National Academies of Sciences, Engineering, and Medicine: Washington, DC, USA, 1964; p. 47. [Google Scholar]
  27. Lumb, P. The Properties of Decomposed Granite. Géotechnique 1962, 12, 226–243. [Google Scholar] [CrossRef]
  28. Irfan, T.Y.; Dearman, W.R. The engineering petrography of weathered granite in Cornwall, England. Q. J. Eng. Geol. Hydrogeol. 1978, 11, 233–244. [Google Scholar] [CrossRef]
  29. Cole, W.F.; Sandy, M.J. A proposed secondary mineral rating for basalt road aggregate durability. Proc. Aust. Road Res. Board. 1980, 10, 27–37. [Google Scholar]
  30. Okewale, I.A.; Coop, M.R. Suitability of Different Approaches for Analyzing and Predicting the Behavior of Decomposed Volcanic Rocks. J. Geotech. Geoenviron. 2018, 144, 0401806. [Google Scholar] [CrossRef]
  31. Tugrul, A.; Zarif, I.H. Engineering aspects of limestone weathering in Istanbul, Turkey. Bull. Eng. Geol. Environ. 2013, 58, 191–206. [Google Scholar] [CrossRef]
  32. Duzgoren-Aydin, N.; Aydin, A.; Malpas, J. Re-assessment of chemical weathering indices: Case study on pyroclastic rocks of Hong Kong. Eng. Geol. 2002, 63, 99–119. [Google Scholar] [CrossRef]
  33. Irfan, T.Y. Mineralogy, fabric properties and classification of weathered granites in Hong Kong. Q. J. Eng. Geol. Hydrogeol. 1996, 29, 5–35. [Google Scholar] [CrossRef]
  34. Ceryan, S. New Chemical Weathering Indices for Estimating the Mechanical Properties of Rocks: A Case Study from the Kürtün Granodiorite, NE Turkey. Turkish J. Earth Sci. 2008, 17, 187–207. [Google Scholar]
  35. Guan, P.; Ng, C.W.W.; Sun, M.; Tang, W. Weathering indices for rhyolitic tuff and granite in Hong Kong. Eng. Geol. 2001, 59, 147–159. [Google Scholar] [CrossRef]
  36. Hill, I.G.; Worden, R.H.; Meighan, I.G. Yttrium: The immobility-mobility transition during basaltic weathering. Geology 2000, 28, 923–926. [Google Scholar] [CrossRef]
  37. Nordt, L.C.; Driese, S.D. New weathering index improves paleorainfall estimates from Vertisols. Geology 2010, 38, 407–410. [Google Scholar] [CrossRef]
  38. Koca, Y.; Kıncal, C. The relationships between the rock material properties and weathering grades of andesitic rocks around Izmir, Turkey. Bull. Eng. Geol. Environ. 2016, 75, 709–734. [Google Scholar] [CrossRef]
  39. Gupta, A.S.; Rao, K.S. Weathering indices and their applicability for crystalline rocks. Bull. Eng. Geol. Environ. 2001, 60, 201–221. [Google Scholar] [CrossRef]
  40. Nesbitt, H.; Young, G. Early Proterozoic climates and plate motions inferred from major element chemistry of lutites. Nature 1982, 299, 715–717. [Google Scholar] [CrossRef]
  41. Udagedara, D.T.; OguchiC, T.; Gunatilake, A.A.J.K. Combination of chemical indices and physical properties in the assessment of weathering grades of sillimanite-garnet gneiss in tropical environment. Bull. Eng. Geol. Environ. 2017, 76, 145–157. [Google Scholar] [CrossRef]
  42. Tugrul, A.; Gurpinar, O. The effect of chemical weathering on the engineering properties of Eocene basalts in northeastern Turkey. Environ. Eng. Geosci. 1997, 3, 225–234. [Google Scholar] [CrossRef]
  43. Ramana, Y.V.; Gogte, B.S.; Sarma, K.V.L.N.S. Physical properties of Indus ophiolites from Kashmir Himalaya. Phys. Earth Planet Int. 1986, 43, 104–122. [Google Scholar] [CrossRef]
  44. Marinos, P.; Hoek, E.; Marinos, V. Variability of the engineering properties of rock masses quantified by the geological strength index: The case of ophiolites with special emphasis on tunneling. Bull. Eng. Geol. Environ. 2006, 65, 129–142. [Google Scholar] [CrossRef]
  45. Jackson, N. Civil Engineering Materials; Macmillan Press Ltd.: London, UK, 1983; pp. 377–378. [Google Scholar]
  46. LaLonde, W.S.; Janes, M.F. Concrete Engineering Handbook; Library of Congress: New York, NY, USA, 1961.
  47. Neville, A.M. Properties of Concrete, 5th ed.; Pearson Education Publishing Ltd.: London, UK, 2005. [Google Scholar]
  48. Thomas, M.D.A.; Folliard, K.J. Concrete aggregates and the durability of concrete. Durab. Concr. Cem. Compos. 2007, 247–281. [Google Scholar] [CrossRef]
  49. Taylor, G.D. Materials in Construction, 2nd ed.; Longman Group Ltd., Longman House, Burnt Mill: Harlow, UK, 1994. [Google Scholar]
  50. Petrounias, P.; Rogkala, A.; Kalpogiannaki, M.; Tsikouras, B.; Hatzipanagiotou, K. Comparative study of physico-mechanical properties of ultrabasic rocks (Veria-Naousa ophiolite) and andesites from central Macedonia (Greece). Bull. Geol. Soc. Greece 2016, 50, 1989–1998. [Google Scholar] [CrossRef]
  51. Giannakopoulou, P.P.; Tsikouras, B.; Hatzipanagiotou, K. The interdependence of mechanical properties of ultramafic rocks from Gerania ophiolitic complex. Bull. Geol. Soc. Greece 2016, 50, 1829–1837. [Google Scholar] [CrossRef] [Green Version]
  52. Al-Oraimi, S.K.; Taha, R.; Hassan, H.F. The effect of the mineralogy of coarse aggregate on the mechanical properties of high-strength concrete. Constr. Build. Mater. 2006, 20, 499–503. [Google Scholar] [CrossRef]
  53. Korkanc, M.; Tugrul, A. Evaluation of selected basalts from Nigde, Turkey, as source of concrete aggregate. Eng. Geol. 2004, 75, 291–307. [Google Scholar] [CrossRef]
  54. Rogkala, A.; Petrounias, P.; Tsikouras, B.; Hatzipanagiotou, K. New occurrence of pyroxenites in the Veria-Naousa ophiolite (north Greece): Implications on their origin and petrogenetic evolution. Geosciences 2017, 7, 92. [Google Scholar] [CrossRef] [Green Version]
  55. Pe-Piper, G.; Piper, D.J.W. The Igneous Rocks of GREECE; The Anatomy of an Orogen; Beitrge zur Regionalen Geologie der Erde (Series); Gebrder Borntaeger: Stuttgart, Germany, 2002; p. 573. [Google Scholar] [CrossRef]
  56. Saccani, E.; Bortolotti, V.; Marroni, M.; Pandolfi, L.; Photiades, A.; Principi, G. The Jurassic association of backarc basin ophiolites and calc-alkaline volcanics in the Guevgueli complex (Northern Greece): Implication for the evolution of the Vardar zone. Ofioliti 2008, 33, 209–227. [Google Scholar]
  57. Decourt, J.; Aubouin, J.; Savoyat, E. Le sillonmesohellenique et la zone pelagonienne. Bull. Soc. Geol. Fr. 1977, 1, 32–70. [Google Scholar]
  58. Michailidis, K.M. Zoned chromites with high MN-contents in the Fe–Ni–Cr-laterite ore deposits from the Edessa area in Northern Greece. Miner. Depos. 1990, 25, 190–197. [Google Scholar] [CrossRef]
  59. Rogkala, A.; Petrounias, P.; Tsikouras, B.; Giannakopoulou, P.P.; Hatzipanagiotou, K. Mineralogical Evidence for Partial Melting and Melt-Rock Interaction Processes in the Mantle Peridotites of Edessa Ophiolite (North Greece). Minerals 2019, 9, 120. [Google Scholar] [CrossRef] [Green Version]
  60. Brunn, J.H. Geological Map of Greece, Veroia Sheet, 1:50.000; IGME: Athens, Greece, 1982. [Google Scholar]
  61. Mercier, J.L.; Vergely, P. Geological Map of Greece, Edhessa Sheet, 1:50.000; IGME: Athens, Greece, 1984. [Google Scholar]
  62. EN 932. Part 3: Procedure and Terminology for Simplified Petrographic Description; European Standard: Warsaw, Poland, 1996. [Google Scholar]
  63. AASHTO T255. Standard Method of Test for Total Evaporable Moisture Content of Aggregate by Drying; AASHTO: Washington, DC, USA, 2000. [Google Scholar]
  64. ISRM Suggested Methods. Rock Characterization Testing and Monitoring; Brown, E., Ed.; Pergamon Press: Oxford, UK, 1981; p. 211. [Google Scholar]
  65. ASTM C-131. Resistance to Abrasion of Small-Size Coarse Aggregate by Use of the Los Angeles Machine; American Society for Testing and Materials: Philadelphia, PA, USA, 1989. [Google Scholar]
  66. ASTM D-2938. Standard Test Method of Unconfined Compressive Strength of Intact Rock Core Specimens; Annual Book of Standards, 4.08; American Society for Testing and Materials: Philadelphia, PA, USA, 1986. [Google Scholar]
  67. ISRM. Suggested method for determining point load strength. Int. J. Rock Mech Min. Sci. Geomech. Abstr. 1985, 22, 51–62. [Google Scholar] [CrossRef]
  68. ACI-211. 1-91. Standard for Selecting Proportions for Normal, Heavyweight and Mass Concrete; American Concrete Institute: Farmington Hills, MI, USA, 2002. [Google Scholar]
  69. BS EN 12390. Part 3: Testing Hardened Concrete. Compressive Strength of Test Specimens; British Standard Institution: London, UK, 2009. [Google Scholar]
  70. Singh, A.K.; Singh, R.B. Genetic implications of Zn- and Mn-rich Cr-spinels in serpentinites of the Tidding Suture Zone, eastern Himalaya, NE India. Geol. J. 2013, 48, 22–38. [Google Scholar] [CrossRef]
  71. Bailey, S.W. Summary of recommendations of AIPEA nomenclature committee on clay minerals. Am. Mineral. 1980, 65, 1–7. [Google Scholar]
  72. Leake, E.B.; Wooley, A.R.; Birch, W.D.; Burke, E.A.J.; Ferraris, G.; Grice, J.D.; Hawthorne, F.C.; Kisch, H.J.; Krivovichev, V.G.; Schumacher, J.C.; et al. Nomenclature of amphiboles: Additions and revisions to the International Mineralogical Association’s amphibole nomenclature. Eur. J. Mineral. 2004, 89, 191–196. [Google Scholar]
  73. Rigopoulos, I.; Tsikouras, B.; Pomonis, P.; Hatzipanagiotou, K. Assessment of the engineering behavior of ultramafic and mafic rocks using chemical indices. Eng. Geol. 2015, 196, 222–237. [Google Scholar] [CrossRef]
  74. Babechuk, M.G.; Widdowson, M.; Kamber, B.S. Quantifying chemical weathering intensity and trace element release from two contrasting basalt profiles, Deccan Traps, India. Chem. Geol. 2014, 363, 56–75. [Google Scholar] [CrossRef]
  75. Harrassowitz, H. Laterit. Forsch. Geol. Paleont. 1926, 4, 253–565. [Google Scholar]
  76. Reiche, P. Graphic representation of chemical weathering. J. Sediment. Petrol. 1943, 13, 58–68. [Google Scholar]
  77. Harnois, L. The CIW index: A new chemical index of weathering. Sediment. Geol. 1988, 55, 319–322. [Google Scholar] [CrossRef]
  78. Venturelli, G.; Contini, S.; Bonazzi, A. Weathering rocks and element mobility at Mt. Prinzera, Northern Apennines, Italy. Mineral. Mag. 1997, 61, 765–778. [Google Scholar] [CrossRef]
  79. Polat, A.; Hofmann, A.W.; Rosing, M.T. Boninite-like volcanic rocks in the 3.7–3.8 Ga Isua greenstone belt, West Greenland: Geochemical evidence for intraoceanic subduction zone processes in the Early Earth. Chem. Geol. 2002, 184, 231–254. [Google Scholar] [CrossRef]
  80. Diamantis, K.; Gartzos, E.; Migiros, G. Study on uniaxial compressive strength, point load strength index, dynamic and physical properties of serpentinites from Central Greece. Q. J. Eng. Geol. Hydrogeol. 2012, 45, 423–433. [Google Scholar]
  81. Sibbick, R.G.; Page, C.L. Susceptibility of various UK aggregates to alkali–aggregate reaction. In Proceedings of the Ninth International Conference on Alkali-Aggregate Reaction in Concrete, London, UK, 27–31 July 1992; pp. 980–987. [Google Scholar]
  82. Ponce, J.M.; Batic, O.R. Different manifestations of the alkali-silica reaction in concrete according to the reaction kinetics of the reactive aggregate. Cem. Concr. Res. 2006, 36, 1148–1156. [Google Scholar] [CrossRef]
  83. Vogt, T. Swlitjelmefeltets geologiog petrografi. Nor. Geol. Tidsskr. 1927, 121, 1–560. [Google Scholar]
  84. Roaldset, E. Mineralogy and geochemistry of Quaternary clays in the numedal area, southern Norway. Nor. Geol. Tidsskr. 1972, 52, 335–369. [Google Scholar]
Figure 1. Geological map of the Veria–Naousa region [4,60]; modified after fieldwork and mapping by using ArcMap (version 10.1, Esri, Redlands, CA, USA); the rectangle in the inset shows the study area.
Minerals 10 00406 g001
Figure 2. Geological map of the Edessa region [4,61]; modified after fieldwork and mapping by using ArcMap (version 10.1, Esri, Redlands, CA, USA); the rectangle in the inset shows the study area.
Minerals 10 00406 g002
Figure 3. Photomicrographs of representative examined rocks (Crossed Polarized Nicols-XPL) showing: (a) mesh texture and subhedral spinel in serpentinized harzburgite (sample BE.12C); (b) porphyroclastic orthopyroxene with lesser clinopyroxene and subhedral grains of spinel in pyroxenite (sample BE.67C); (c) hornblende with irregular shape surrounded by sericitized plagioclase and quartz as well as enclosed titanite in diorite (sample BE.93); (d) gabbro exhibiting ophitic texture with plagioclase and clinopyroxene accompanied by subhedral grains of titanite and actinolite (sample BE.100B); (e) gabbro with high degree of alteration where clinopyroxene was altered to epidote and chlorite (sample ED.26C); (f) diabase exhibiting subophitic texture (sample BE.43B); (g) porphyritic texture in basalt showing clinopyroxene, plagioclase, chlorite, epidote and calcite veinlet (sample ED.66C); (h) porphyritic and microlitic textures in basalt with amygdules containing chlorite and quartz (sample BE.15B); srp: serpentine, sp: spinel, opx: orthopyroxene, cpx: clinopyroxene, hbl: hornblende, qz: quartz, ttn: titanite, ser: sericite, act: actinolite, plg: plagioclase, chl: chlorite, ep: epidote.
Minerals 10 00406 g003
Figure 4. Representative X-ray diffraction patterns of the investigated ultramafic samples of Group I: (a) serpentinized harzburgite; (b) serpentinized lherzolite; (c) pyroxenite; (serp: serpentine, sp: spinel, cpx: clinopyroxene, mgt: magnetite, talc: talc, tr: tremolite, opx: orthopyroxene, ol: olivine).
Minerals 10 00406 g004
Figure 5. Representative X-ray diffraction patterns of the investigated mafic samples of Group II: (a) diorite; (b) gabbro; (c) gabbro; (d) diabase; (e) basalt; (bio: biotite, act: actinolite, chl: chlorite, hbl: hornblende, qz: quartz, or: orthoclase, ab: albite, prh: prehnite, ep: epidote, plg: plagioclase, pum: pumpellyite, ap: apatite, tit: titanite).
Minerals 10 00406 g005
Figure 6. (a) MgO vs. SiO2 plot and (b) FeO vs. MgO plot for examined ultramafic and mafic rocks. Fields of antigorite, lizardite and chrysotile are from Singh & Singh [70].
Minerals 10 00406 g006
Figure 7. Plot of analyzed chlorites on their classification diagram of the examined ultramafic and mafic rocks according to Bailey [71].
Minerals 10 00406 g007
Figure 8. Plot of the analyzed amphibole group minerals from examined ultramafic and mafic rocks on their classification diagram [72].
Minerals 10 00406 g008
Figure 9. (a) total porosity of the studied rocks plotted against their Ga index; (b) moisture content of the studied rocks plotted against their Ga index; (c) Los Angeles of the studied rocks plotted against their Ga index; (d) uniaxial compressive strength of the studied rocks plotted against their Ga index; (e) point load index of the studied rocks plotted against their Ga index; (f) Ga index of the studied rocks plotted against the loss on ignition values.
Minerals 10 00406 g009
Figure 10. Uniaxial compressive strength of the produced concrete specimens (UCScon) (MPa) plotted against the geochemical index-Ga of the examined ultramafic and mafic aggregates.
Minerals 10 00406 g010
Table 1. Representative electron microanalyses of serpentine group minerals from examined ultramafic rocks (-: below detection limit).
SampleSerpentinized LherzoliteSerpentinized HarzburgitePyroxenite
BE.103BBE.133BBE.12CED.59BBE.67C
Analytical Number23649613467257810
wt%
SiO244.1345.3045.2844.4242.7043.6546.0144.8644.4844.5142.6044.6845.0645.1745.96
TiO2---------------
Al2O3-1.301.601.00----0.39-0.12-1.450.860.94
Fe2O34.802.302.412.023.314.565.285.402.734.313.831.794.794.074.02
MnO---------------
MgO38.6336.6037.3836.4336.9337.9840.0240.5335.9636.1336.0439.1736.7536.3737.46
CaO0.170.010.030.08--------0.760.570.69
Na2O0.220.230.180.29-----------
K2O0.010.080.010.01-----------
NiO-----------0.65---
Cr2O3-----1.21--0.36----0.72-
Sum87.9685.8286.8984.2582.9487.4091.3190.7983.9284.9582.5986.2988.8187.7689.07
Formula units based on 7 atoms of oxygen
Si2.0372.1092.0852.1072.0732.0302.0422.0102.1212.1092.0792.0812.0522.0782.080
Ti---------------
Al-0.0710.0870.056----0.022-0.007-0.0780.0470.050
Fe3+0.1670.0810.0830.0720.1210.1600.1790.1820.0980.1540.1410.0630.1640.1410.137
Mn---------------
Mg2.6582.5402.5652.5762.6732.6332.6482.7072.5572.5522.6222.7202.4952.4952.527
Ca0.008-0.0010.004--------0.0370.0280.033
Na0.0200.0210.0160.027-----------
K0.0010.0050.0010.001-----------
Ni-----------0.024---
Cr-----0.044--0.014----0.026-
Total4.8904.8284.8394.8434.8674.8684.8694.8994.8124.8144.8484.8884.8274.8154.827
Table 2. Representative electron microanalyses of chlorite from examined ultramafic and mafic rocks (-: below detection limit, t: total, iv: 4+, vi: 6+).
SampleSerpentinized HarzburgiteDioriteGabbroDiabaseBasalt
BE.12CBE.103BBE.77BED.93BED.26CBE.100BBE.165BE.43BED.110BΒΕ.15ΒED.66C
Analytical Number242821071013891141111
wt%
SiO233.3036.1534.5030.5632.7333.7632.6831.6728.5235.4533.5530.7530.9330.0329.9732.9930.88
TiO2-----------------
Al2O318.7913.0911.4720.5317.7317.2820.2215.2717.6818.9918.4418.5217.6417.8218.1315.7619.07
Cr2O30.980.722.33-0.14-0.12----0.59-----
FeO1.841.943.7119.1717.0117.8417.5524.1725.2720.8523.0915.6624.3830.4130.5825.6825.71
MgO33.6434.3333.4219.4219.7218.9820.1916.8014.8318.6717.4221.0016.6011.2811.9614.3513.64
NiO-----------------
MnO----0.24---0.360.51--0.460.610.510.320.51
CaO----0.35-0.27--0.40-1.27-0.15---
Na2O-----------------
K2O-----0.48--------0.300.280.42
Sum88.5586.2385.4390.1087.9288.3491.0387.9186.6694.8792.5087.7990.0190.3091.4589.3890.23
Formula units based on 28 atoms of oxygens
Si6.1076.7896.6645.9946.4926.6766.2576.5406.0576.5916.4806.1196.2506.2526.1696.7356.265
Aliv1.8931.2111.3362.0061.5081.3241.7431.4601.9431.4091.5201.8811.7501.7481.8311.2651.735
8.0008.0008.0008.0008.0008.0008.0008.0008.0008.0008.0008.0008.0008.0008.0008.0008.000
Alvi2.1691.6861.2752.7402.6362.7042.8192.2562.4822.7522.6772.4632.4512.6252.5682.5262.825
Ti-----------------
Fe2+0.2820.3050.5993.1452.8212.9502.8104.1744.4883.2423.7292.6064.1205.2955.2644.3844.362
Cr0.1420.1070.356-0.022-0.018----0.093-----
Mn---0.0700.040-0.044-0.0650.080--0.0790.1080.0890.0550.088
Mg9.1989.6119.6235.6785.8315.5955.7625.1724.6955.1755.0156.2305.0003.5013.6704.3674.126
Ca----0.074----0.080-0.271-0.033---
Na-----------------
K--------------0.0790.0730.109
Ni-----0.121-----------
11.79111.84311.85311.63311.42511.37111.45311.60211.73011.32911.42211.66311.65011.56211.67111.40611.509
Total19.79119.84319.85319.63319.42519.37119.45319.60219.73019.32919.42219.66319.65019.56219.67119.40619.509
Fet/(Fet + Mg)0.030.030.060.360.330.350.330.450.490.390.430.290.450.600.590.500.51
Table 3. Representative electron microanalyses of amphibole group minerals from examined ultramafic and mafic rocks [-: below detection limit, iv: 4+, vi: 6+, Mg#: (Mg/(Mg + Fe2+)]
SampleSerpentinized LherzoliteDioriteGabbroDiabase
BE.133BΒΕ.77BBE.100BED.110B
Analytical Number36591735101716
wt%
SiO258.3254.8254.8146.7050.7751.2351.1451.2552.0351.4050.59
TiO2-----0.821.020.830.500.340.67
Al2O30.660.873.056.824.904.404.074.982.944.963.77
FeO2.603.0510.7521.3618.5918.2016.2416.4116.6313.9320.67
MnO--0.310.250.47-- -0.360.32
MgO23.8420.8816.679.7612.7212.7813.8212.9313.5713.7611.82
CaO12.6013.8011.2810.0111.0610.5810.4911.3810.8311.148.51
Na2O--0.56------0.780.65
K2O---0.14--0.30--0.270.28
Cr2O3-----------
NiO-0.22---------
Sum98.0293.6497.4395.0498.5198.0197.0897.7896.5096.9497.28
Formula units based on 23 atoms of oxygens
Si7.9367.8897.7947.2147.4407.5017.5107.4687.6837.5107.558
Aliv0.0640.1110.2060.7860.5600.4990.4900.5320.3170.4900.442
Fe3+-----------
Ti-----------
T8.0008.0008.0008.0008.0008.0008.0008.0008.0008.0008.000
Alvi0.0420.0370.3050.4550.2860.2610.2140.3280.1950.3640.222
Ti-----0.0900.1130.0910.0560.0370.075
Fe3+-----------
Cr-----------
Mg4.8364.4803.5342.2482.7792.7903.0252.8102.9872.9972.632
Fe2+0.1220.3671.1612.2971.9361.8601.6481.7701.7621.6012.071
Mn-----------
C5.0005.0005.0005.0005.0005.0005.0005.0005.0005.0005.000
Mg-----------
Fe2+0.174-0.1170.4620.3430.3690.3470.2310.2920.1010.512
Mn--0.0370.0330.058----0.0450.040
Ca1.8262.0001.7191.5051.5991.6311.6501.7691.7081.7441.362
Na--0.127------0.1100.086
B2.0002.0002.0002.0002.0002.0001.9972.0002.0002.0002.000
Ca0.0110.128-0.1520.1370.029-0.0090.005--
Na--0.028------0.1110.103
K---0.028--0.056--0.0500.053
A0.0110.1280.0280.1790.1370.0290.0560.0090.0050.1610.156
Mg#0.9420.9240.7340.4490.5490.5560.6030.5840.5930.6380.505
Table 4. Representative geochemical analyses of examined aggregates from Veria–Naousa and Edessa ophiolite (- below detection limit).
GroupSampleLithotypeSiO2TiO2Al2O3Fe2O3MgOCaONa2OK2OLOI
Group I
Ultramafic rocks
BE.01CSerpentinized harzburgite39.82-1.018.8634.170.10--14.6
BE.12CSerpentinized harzburgite40.95-1.118.0634.810.21--13.5
ED.59BSerpentinized harzburgite39.95-0.398.0636.710.02--14.1
BE.122BSerpentinized harzburgite38.78-0.987.6836.000.28--15.3
BE.103BSerpentinized lherzolite39,80-0.727.5635.561.29--14.2
BE.133BSerpentinized lherzolite39.590.021.397.9835.581.19--13.4
ED.115BSerpentinized harzburgite40.82-0.337.5136.130.03--14.4
BE.67CPyroxenite57.650.021.037.7829.012.140.02-1.2
BE.67DPyroxenite54.790.021.008.0026.001.90 -1.1
Group II
Mafic rocks
BE.77BDiorite52.400.5214.9410.846.477.253.361.802.0
ED.93BDiorite53.550.1612.259.5410.495.683.940.783.1
BE.100BGabbro43.820.6917.7914.527.686.353.550.055.1
ED.26CGabbro39.901.3017.707.328.5519.090.070.015.8
BE.165Gabbro38.921.4414.718.246.3727.520.07-5.6
BE.166Gabbro35.190.2217.296.2111.0324.66--5.4
BE.167Gabbro38.491.7111.719.727.5327.34--5.3
BE.43BDiabase57.170.2211.687.1410.565.884.890.261.7
ED.24BDiabase38.351.2318.308.769.3517.310.180.015.4
ED.45BDiabase48.240.6615.5011.036.776.893.011.426.0
BE.113BDiabase52.990.3412.858.4610.675.944.830.153.2
ED.110BDiabase48.730.4817.0610.294.1614.262.670.022.0
BE.15BBasalt59.340.5614.3610.024.203.783.890.473.0
ED.66CBasalt48.402.3913.6314.286.646.564.800.052.6
BE.3ABasalt0.960.9615.589.236.0221.080.020.024.1
Table 5. Physicomechanical properties of the examined ultramafic and mafic aggregate rocks.
GroupSampleLithotypeTotal Porosity (%)Moisture Content (%)Los Angeles (%)Uniaxial Compressive Strength (MPa)Point Load Index (MPa)
Group I
Ultramafic rocks
BE.01CSerpentinized harzburgite4.001.5027.0055.03.8
BE.12CSerpentinized harzburgite5.002.1834.0045.01.9
ED.59BSerpentinized harzburgite6.291.5240.4020.01.4
BE.122BSerpentinized harzburgite3.211.2525.5025.453.0
BE.103BSerpentinized lherzolite5.001.9528.9832.01.2
BE.133BSerpentinized lherzolite2.801.4026.0035.01.6
ED.115BSerpentinized harzburgite4.531.6035.0028.01.9
BE.67CPyroxenite1.401.1817.2075.04.9
BE.67DPyroxenite1.200.9017.8078.04.4
Group II Mafic rocksBE.77BDiorite0.800.3812.4095.010.0
ED.93BDiorite1.270.5011.80100.08.0
BE.100BGabbro0.880.4713.9085.09.0
ED.26CGabbro1.740.6016.0080.07.0
BE.165Gabbro1.720.8018.0079.08.0
BE.166Gabbro2.001.1019.5079.07.0
BE.167Gabbro1.901.0118.3079.07.5
BE.43BDiabase0.530.258.70120.012.8
ED.24BDiabase0.840.5214.1091.339.7
ED.45BDiabase0.240.4110.00110.08.4
BE.113BDiabase0.450.427.4097.159.7
ED.110BDiabase0.860.207.30148.012.0
BE.15BBasalt0.130.2910.50165.912.6
ED.66CBasalt0.380.467.60140.011.0
BE.3ABasalt0.950.6812.50110.011.2
Table 6. Uniaxial compressive strength of concrete specimens produced by the examined ultramafic and mafic aggregates.
GroupSampleLithotypeConcrete Uniaxial Compressive Strength (MPa)
Group I
Ultramafic rocks
BE.12CSerpentinized harzburgite26.0
ED.59BSerpentinized harzburgite25.0
BE.122BSerpentinized harzburgite26.0
BE.103BSerpentinized lherzolite26.0
BE.67CPyroxenite27.0
BE.67DPyroxenite27.0
BE.77BDiorite29.0
BE.100BGabbro30.0
ED.26CGabbro29.0
Group II Mafic rocksBE.165Altered Gabbro28.0
BE.166Altered Gabbro28.0
BE.167Altered Gabbro28.0
ED.24BDiabase31.0
ED.45BDiabase29.0
BE.113BDiabase32.0
ED.110BDiabase31.0
ED.66CBasalt31.0
BE.3ABasalt29.0
Table 7. Geochemical index Ga of the examined ultramafic and mafic aggregates.
GroupSampleLithotypeQualitatively Measured Degree of AlterationGeochemical Index-Ga
Group I
Ultramafic rocks
BE.01CSerpentinized harzburgiteMedium to high3.47
BE.12CSerpentinized harzburgiteMedium to high3.82
ED.59BSerpentinized harzburgiteHigh4.34
BE.122BSerpentinized harzburgiteMedium to high4.20
BE.103BSerpentinized lherzoliteMedium to high4.45
BE.133BSerpentinized lherzoliteHigh3.91
ED.115BSerpentinized harzburgiteHigh4.61
BE.67CPyroxeniteLow3.57
BE.67DPyroxeniteLow3.09
Group II Mafic rocksBE.77BDioriteMedium0.59
ED.93BDioriteMedium0.77
BE.100BGabbroLow0.42
ED.26CGabbroMedium0.94
BE.165GabbroHigh1.39
BE.166GabbroHigh1.50
BE.167GabbroHigh1.50
BE.43BDiabaseMedium0.87
ED.24BDiabaseMedium1.05
ED.45BDiabaseLow0.55
BE.113BDiabaseMedium0.77
ED.110BDiabaseLow0.66
BE.15BBasaltLow0.33
ED.66CBasaltLow0.43
BE.3ABasaltMedium1.05
Table 8. Summary of the used chemical indices.
Chemical IndexFormulaReference
PI100 × SiO2/(SiO2 + TiO2 + Fe2O3 + FeO + Al2O3)Rieche [76]
CIA100 × [Al2O3/(Al2O3 + CaO + Na2O + K2O)]Nesbitt [40]
ba2(CaO + MgO)/Al2O3Harrassowitz [75]
VR(Al2O3 + K2O)/(MgO + CaO + Na2O)Vogt [83] & Roaldset [84]
Table 9. Geochemical Indices (PI, CIA, ba2, VR) of the examined ultramafic and mafic aggregates.
GroupSampleLithotypePICIAba2VR
Group I
Ultramafic rocks
BE.01CSerpentinized harzburgite69.0690.9933.930.03
BE.12CSerpentinized harzburgite71.3884.0931.550.03
ED.59BSerpentinized harzburgite71.7895.1294.180.01
BE.122BSerpentinized harzburgite71.3577.7837.020.03
BE.103BSerpentinized lherzolite72.5235.8251.180.02
BE.133BSerpentinized lherzolite70.4953.8826.450.04
ED.115BSerpentinized harzburgite73.6691.67109.580.01
BE.67CPyroxenite78.4632.2930.240.03
BE.67DPyroxenite75.6935.1425.670.04
Group II Mafic rocksBE.77BDiorite59.2454.630.920.98
ED.93BDiorite63.6954.081.320.65
BE.100BGabbro48.7564.130.791.01
ED.26CGabbro54.8048.011.560.64
BE.165Gabbro54.5634.782.300.43
BE.166Gabbro54.2641.222.060.48
BE.167Gabbro54.2229.992.980.34
BE.43BDiabase69.1851.431.410.56
ED.24BDiabase51.4651.121.460.68
ED.45BDiabase56.5257.790.881.01
BE.113BDiabase64.4254.061.290.61
ED.110BDiabase56.7850.161.080.81
BE.15BBasalt63.6063.820.561.25
ED.66CBasalt52.8754.430.970.76
BE.3ABasalt2.8093.612.340.43
Table 10. Correlations between the chemical indices of Table 8 and tested parameters of this study (con: concrete).
CorrelationsCorrelation Coefficient (r2)CorrelationsCorrelation Coefficient (r2)
PI-nt0.16ba2-nt0.69
PI-w0.10ba2-w0.78
PI-LA0.17ba2-LA0.73
PI-UCS0.17ba2-UCS0.72
PI-Is(50)0.29ba2-Is(50)0.48
PI-UCScon0.16ba2-UCScon0.57
PI-LOI0.11ba2-LOI0.56
CIA-nt0.28VR-nt0.72
CIA-w0.05VR-w0.72
CIA-LA0.20VR-LA0.75
CIA-UCS0.07VR-UCS0.77
CIA-Is(50)0.08VR-Is(50)0.70
CIA-UCScon0.06VR-UCScon0.82
CIA-LOI0.34VR-LOI0.77

