Agate Genesis: A Continuing Enigma


1
55 Common lane, Auckley, Doncaster DN9 3HX, UK
2
Sobolev Institute of Geology and Mineralogy, Siberian Branch of Russian Academy of Sciences, 630090 Novosibirsk, Russia
3
Department of Geology and Geophysics, Novosibirsk State University, Pirogova str., 2, 630090 Novosibirsk, Russia
*
Author to whom correspondence should be addressed.
Minerals 2020, 10(11), 953; https://doi.org/10.3390/min10110953
Submission received: 21 September 2020
/
Revised: 11 October 2020
/
Accepted: 21 October 2020
/
Published: 26 October 2020
(This article belongs to the Special Issue Agates: Types, Mineralogy, Deposits, Host Rocks, Ages and Genesis)
Abstract
:This review covers the last 250 years of major scientific contributions on the genesis of agates found in basic igneous host rocks. From 1770 to 1955, the genesis question was frequently limited to discussions based on observations on host rock and agate thick sections. Over the next 25 years, experimental investigations examined phase transformations when silica glass and various forms of amorphous silica were heated to high temperatures. This work demonstrated that the change from the amorphous state into chalcedony was likely to be a multi-stage process. The last 40 years has seen modern scientific instrumentation play a key role in identifying the physical and chemical properties of agate. The outcome of this work has allowed limited evidence-based comment on the conditions of agate formation. There is a general consensus that agates in these basic igneous hosts form at <100 °C. However, the silica source and the nature of the initial deposit remain to be proven.
1. Introduction
Agate and chalcedony are the compact varieties of silica that are primarily composed of minute crystals of α-quartz. Chalcedony has a fairly uniform colour but is band free while agate is banded chalcedony. Sectioned agates from igneous host rocks generally show the banding as one of two major types with wall lining (sometimes called fortification) banding being the most common type. These agates show initial bands appearing to replicate the supporting cavity wall. Subsequent bands follow with an approximate repetition that frequently continues towards the agate centre. A second type demonstrates horizontal bands that are apparently gravity controlled. Both types can be found in the same agate.
Basalt and andesite are the most widespread agate host rocks but agates can also be found in some fossil wood and sedimentary host rocks, particularly limestone. However, there is no reason why agates in different environments should follow identical genesis routes. Discussion in the present paper is mainly limited to scientific contributions that have been made over the last 250 years on the complex question of agate genesis in basaltic and andesitic host rocks.
The present review is in three parts. From 1770 to 1955, scientific contributions to the genesis question were generally based on host rock observations and agate thick sections. Experimental investigations played a relatively small part and contributions during this period are considered chronologically. During the next 25 years phase transformations in silica glass and amorphous silica were investigated. Many of these studies were not directly concerned with agate but the work has implications for the agate genesis question. Modern scientific instrumentation has played a key role in identifying the physical and chemical properties of agate. In order to avoid information repetition, some relevant pre-1980 work is considered with 1980–2020 in the final discussion. The review includes some contributions by research workers from Russia and Germany, who only published in Russian and German.
2. Scientific Contributions over the Years 1770–1980
2.1. 1770–1900
Agates have been collected and fashioned since the earliest civilisations and many must have wondered about the formation of these beautiful minerals. Collini [1] states, “Not only is the red colour in agate due to iron but it is also the cause of the green, red and brown in moss agate”. According to Liesegang [2], Collini [1] was the first to suggest that these colours had their origins from iron compounds that had been transported in circulating waters from the neighbouring host rocks. The iron rich solutions were then able to penetrate the still soft agate. Hardening of the agate prevented further iron solution penetration. Liesegang [2] also cites Lasius as an early worker who suggested silica enters the gas vesicles in solution. In 1931, Liesegang [3] added more experimentation and comment to his earlier observations.
Germany hosts some of the world’s finest agates and the agate industry based around Idar Oberstein has produced high quality agate products since the 14th century [4]. This large commercial background accounts for the fact that agate and its genesis was very much the preserve of the German scientists. In 1849, Noeggerath [5] and Haidinger [6] published a series of open letters in which they stated their opposing views on the method of silica solution entry into the gas vesicle. The conference records of the 20th July in the Freunde der Naturwissenschaften, Vienna stated the areas of agreement and their differences. Both agreed that gaseous bubbles are formed in the erupted lavas and the subsequent parallel vesicular flows were due to the movement of the lava. Misshapen amygdales are the result of vapour bubbles meeting within the high viscosity lava; this leads to twin and triplet bubbles. Noeggerath [5] emphasised the agate variations were a feature of the different local environments. He pointed to amygdales in Westphalen where the calcite had been dissolved in the upper reaches but not at the lower levels and claimed the firm rock protected the calcite from dissolution.
Noeggerath [5] asserted that the silicic acid, necessary for the agates, comes from hot springs and appears after the decomposition of the host rock. He noted that agates had been found in compact bedrock while entirely friable rocks can be free from agates. However, it is the method of silica entry into the vesicle that produces major differences of opinion.
Haidinger [6] took a contrary view arguing that the “mountain sweat” carries the separate silica into the gas vesicle. Noeggerath [5] acknowledged that water could pass through the host rock but would not be able to penetrate the impermeable agate layers. As an alternative he pointed to the infiltration canals as means of silica entry and this would allow the continual development of successive layers. These canals are found in some agates and appear to breach the outer layer.
At the end of his open letter of May 1849, Noeggerath [5] writes, “I beg you to compare the permeable and impermeable layers, which allow the art of colouring banded quartz. How is it possible for the silica entry to happen and form successive precipitations from outside when the earliest formed impermeable layers presents a barrier to all further additions?”. Haidinger [6] did not answer the question and the infiltration canal was accepted until challenged by Liesegang in 1915 [2]. This interesting infiltration feature is still proposed by some authors as a point of solution input or water exit. The canals feature regularly in agate genesis and are discussed later in the paper.
2.2. 1900–1945
In 1901 Heddle [7] published an important work: “The Mineralogy of Scotland”. He had spent many years collecting Scottish agates and the book included a chapter on the question of agate genesis. He suggested that silica could enter the gas vesicle as a result of osmosis with the early deposits acting as a membrane. As a semipermeable membrane and solute concentrations are not mentioned he is really describing diffusion. The desilicified solution then leaves the agate via tubular openings: Noeggerath’s [5] infiltration canals.
The first detailed thin section study of agates that we identified was carried out by Timofeev in 1912 [8]. Three of his micrographs are shown in Figure 1. Using a polarizing microscope he was able to reveal the typical chalcedonic pattern with white bands temporarily halting the growth. His work was based upon the agate amygdales found in the Suisari Island basalts in Lake Onega, Karelia, Russia. He proposed a crystallization sequence of chalcedony → quartzine → quartz. Some of the agates had developed a stalactite type growth. Cross sections of the stalactite are described as alternating zones of chalcedony and quartzine separated by a pigment. Some stalactites had the occasional calcite deposit within the agate.
Liesegang [2] had made several publications on rhythmic banding in silica gels and by 1915 he was able to publish his major work Die Achate. Apart from infiltration canals, Liesegang was able to synthesize various agate-like patterns by allowing metal ions to diffuse in silica gels containing suitable anions. The common wall lining agate can be simulated if a single curved line of Fe3+(aq) is drawn across a flat surface of solidified silica gel containing an alkali. A simulated wall lining agate pattern develops due to the ions diffusing across the gel (Figure 2a). Liesegang banding can also be shown when separate partially miscible liquids are poured from a container (Figure 2b). Horizontal bands are readily formed by OH- (aq) on top of solidified gelatine in a large boiling tube containing Mg2+(aq) or transition metal ions. Liesegang’s [2] Die Achate has had a major impact on the discussion of agate genesis and 80 years later it was still being linked with agate genesis.
Reis [9] published the largest single work on agate and later he produced a further long treatise in which he gave his conclusions on agate genesis: Reis [10]. He was not the first worker to recognise that the wall contact layer was different from the rest of the agate but he was the first to suggest that it was of a different generation. Reis [9,10] opposed the silica entry osmosis mechanism as it depended upon a semipermeable membrane being complete. He believed that the temperature gradient within the lava flow created a sucking effect that drew the silica solutions into the cavity. Iron oxides played a dual role by precipitating the silica and adding colour to the agate. The work of Reiss was largely ignored until Fischer in 1954 [11] added key support for the Reiss hypotheses.
Jessop in 1930 [12] questioned the view that chalcedony was a mixture of quartz and opal. This was based on the fact that the refractive index would not be the approximately constant value found in samples of all geological ages. Jessop [12] proposed that the silica was deposited as a gel containing gas and solid impurities in a solution. As crystallisation advanced from the outside edge, the dissolved substances move with the crystallisation front until a point of saturation is reached. The gaseous or solid impurities are entombed in the crystalline silica and the thickness of the band depends upon the concentration of impurity and the rate of crystallisation. As the solid and gaseous solutes do not necessarily reach saturation at the same point, they allow bands to be partially or totally distinct.
The white bands cannot be stained and this was demonstrated using thin sections. These bands reveal an acicular structure and were parallel to the fibres. The bands that can be dyed are uniform. He proposed that the white bands contain the solid inclusions and the clear bands contain the gaseous bubbles. Such a hypothesis allows dyeing to be a question of relative retentivity and permeability.
In 1931, Liesegang [3] admitted that a pre-existing gel is not always necessary but objected to the length of time taken to form agate via any rhythmic deposition. In this paper, he proposed an alternative mechanism for the formation of the horizontal layering in agate. Layers of varying concentrations of hot sugar solutions can reflect light differently. The salt lakes in Siebenbürgen where the bottom of the lake is 50 °F hotter than the more dilute upper layers show a similar effect. Such variations can also be produced in water glass and he proposed that the horizontal layers are caused by a similar salt-like effect that was eventually “frozen”.
Pilipenko in 1934 [13] supported the Noeggerath hypothesis and opposed the Liesegang propositions. Pilipenko [13] was one of a few to base his argument on the results of a detailed study of thin sections, polished sections, and the outer surface of agates. He put forward a hypothesis for the deposition of chalcedony from “aqueous silica solutions” that penetrated the empty chambers in effusive rocks through pores, hair cracks, and supply channels in the walls of voids. He proposed that chalcedony deposition was in a liquid and gaseous medium. He discounted the Liesegang hypothesis on a number of points:
- (1)
- Some samples of agates are found with a hollow space. This demonstrates that the vesicle is not always filled with a gel;
- (2)
- The vesicular infill occurs by the layering of the first generation and can be accompanied by metasomatic substitution of crystals, which have been previously precipitated;
- (3)
- The hypothesis does not explain why, in the same sample, colourless banded chalcedony varies with the pigmented chalcedony;
- (4)
- The role of pigmentation is not clear with (a) well-formed amethyst crystal centres and (b) brown pigments found in various zones with the disappearance of strong pigment zones;
- (5)
- In artificial preparations, the deposits are torn and split while in nature this phenomenon is rare.
As an alternative Pilipenko [13] proposed that, “a study of the outer surface of agate reveals a number of pores or openings in the walls of sections which surround the agate”. It is presumably these openings that allow the silica to enter the vesicle.
A study of the outer surface of agates in contact with effusive rocks showed the various types of silica deposition in the chambers is grouped into seven types. The first six types of agates are formed in chambers that are not completely filled by silica solutions. In this case, silica deposition occurs horizontally starting at the bottom of the chambers and builds layer upon layer. Silica stalactites and various sagging formations descend from free walls. The seventh type occurs when the chamber is completely filled with a silica solution. Here, deposition of chalcedony goes along the walls of the chamber layer by layer. The number of incoming solutions into the chamber travel through conducting canals and pores of various sizes. Solution inflow equals outflow.
Pilipenko [13] investigated the structure of the infiltration channels and gave great importance to their formation. Infiltration canals develop only within the agate body. In longitudinal sections through the canal, it is clearly shown that traces of agate in the form of a sleeve are pulled out. The sleeves themselves are folded from chalcedony tubes, concentrically embedded into each other.
2.3. 1945–1955
Kuzmin in 1947 [14] included a chapter on agate in a PhD thesis that was based on “Periodic-rhythmical phenomena in Mineralogy and Geology”. In 2019, the thesis was published in his memory. He investigated the banded structures of agates and rejected Liesegang’s hypothesis of agate formation. As agate banding could form as the wall lining or horizontal type, he proposed that the vesicle silica solutions would be colloidal or molecular leading to the respective wall lining and horizontal banding. He credited molecular or highly diluted solutions for the development of sharply defined horizontal layers in the chamber. However, the so-called infiltration canals in agates were interpreted as a point of “output”. He proposed that these exit points occur when the chamber is full of a silica solution and osmotic pressure forces the excess solution to exit via the channels. Once diffusion has started, the channels lower the pressure and allow fresh solutions to diffuse into the cavity. The outward pointing structure shows that they exist as a departure point. The structure of these output channels convincingly shows that the agate structure follows a sequential deposition of rhythmic layers.
In a paper that is more tentative in its suggestions than many of its predecessors, Nacken in 1948 [15] suggests that the silica precursor for agate is the existence of an immiscible liquid state within the magma. Perhaps in an attempt to pre-empt the inevitable criticism, Nacken comments on the problem presented by the melting point of silica at 1600 °C existing within a basaltic magma of 1100 °C. He quotes the work of the Geophysical Laboratory at the Carnegie Institute, Washington, where experiments have been performed on “peculiar acid magma systems” containing excess silica in the molten state. Such systems divide into silica rich and silica poor immiscible mixtures”. The silica rich component would lead to drops with a density of 2.3 g/cm3 within a magma density of 2.6 g/cm3. This density difference would allow the silica drops to rise and eventually form agates. With silica drops suitably in place Nacken [15] returns to his original synthesis of chalcedony from glass that had been subject to a hydrothermal conversion at 400 °C. The conversion was sensitive to pH, impurities, and the temperature gradient within the glass. When the glass had been converted to chalcedony, there is a volume decrease, which allows further solution attacks along capillary cracks. Any impurities are pushed along with the crystallisation front and precipitate in layers.
Fischer in 1954 [11] reviewed the 20th century German literature on agate genesis and commented on the theories of Liesegang [3], Nacken [15], and Reis [9,10] in some detail. He supported the Reis [9,10] contribution and rejected the Nacken [15] hypothesis on the grounds that a magmatic temperature of 1100 °C would not support a silica melt of 1600 °C. Calcite is often found in agate and at these temperatures calcite would be converted into wollastonite. Liesegang’s hypothesis [3] required the existence of a pre-existing gel but his explanation failed to correlate with laboratory findings. Fischer [11] accepted the low solubility of silica in water was a problem but the enormous volumes of water generated and the length of time for the demise of thermal springs are sufficient to support the theories of Reis [9,10].
2.4. 1955–1982
Studies during 1955–1982 allowed modern day instrumentation to play a greater part in the investigation of agate. Potential precursors, such as amorphous silica and silica glass, were examined at high temperature and pressure. Operating in the temperature range of 330–450 °C and pressures of 10–40 kPa, Carr and Fyfe [16] established the conversion of near amorphous silica into quartz. Intermediate silica phases were identified by powder X-ray diffraction (XRD). They established the transition as: near amorphous silica → cristobalite → silica–K → quartz. Silica-K or keatite was first synthesised by Keat [17]. It is very rare in the natural state and has never been identified in agate.
White and Corwin [18] investigated the formation of synthetic chalcedony by heating glass in hydrothermal solutions at 400 °C and 34 MPa. Chalcedony was made by the direct transformation of silica glass or cristobalite. They found that no conversion took place in weakly acid solutions but a complete and rapid conversion occurred under slightly alkaline conditions. The transformation proceeded via cristobalite or keatite.
Experimental investigations on the formation of quartz from amorphous silica were carried out in alkaline hydrothermal conditions with the addition of alkali metal hydroxides or carbonates [19]. Experiments were carried out over a temperature range of 100 and 250 °C with transformations occurring in a matter of days. The results show the change of amorphous silica to quartz went through two intermediate phases of silica-X (a new polymorph of silica) and then cristobalite. The transformation rate was increased by a high temperature and pH.
Ernst and Calvert [20] investigated the changes in porcelanite when heated hydrothermally at temperatures of 300, 400, and 500 °C, 200 MPa pressure. Natural porcelanite from the Monterey Formation, CA, USA, was used in the experiments. The porcelanite was 98% cryptocrystalline with finely crystalline cristobalite together with very minor quartz. Their prime aim was to establish the conversion rates with regard to the eventual formation of chert. The change of cristobalite to quartz is relevant to the question of agate genesis and was found to be zero order.
Colloidal silica has been frequently suggested as the starting material for agate. However, Oehler [21] was the first to carry prolonged heating experiments on colloidal silica solutions. He added HCl to neutralise the alkaline silica colloid bringing the pH from 10 to pH 7 in order to produce a solid gel. The gel was sealed in silver capsules and heated between 100 and 300 °C at 300 MPa pressure for 25–5200 h. The solidified gel crystallised as quartz that was predominantly in the form of chalcedonic spherulites. The spherulites were either length slow or length fast or both. The formation of each type depended upon the conditions. It should be noted that the fibrosity was just in quartz microspheres and was not a synthetic version of an agate amygdale.
Previously, detailed chemical analysis in agate literature was rare but in 1982, Flörke and co-workers [22] investigated several Brazilian agates for their trace metal ion content. Additional work examined the two types of water that are found in agate: free molecular water was low while the silanol water (SiOH) was high. They were able to demonstrate that the wall banding and the horizontal banding in the same agate were clearly of different generations.
3. Scientific Contributions over the Years 1980–2020
3.1. Genesis Contributions in the Early Years
The origins of the silica source, means of transportation, and its physical state on deposition have been discussed over the last 250 years. Unfortunately with the unknowns, every suggestion is met with valid queries or objections. The various problems have been reviewed in detail with Godovikov et al. [23], Goncharov et al. [24], Landmesser [25,26], Moxon [27], and Götze [28].
From 1770 to 1930, the agate genesis hypotheses were largely based on the agate appearance and found in basic igneous host rocks. Our comments are made with hindsight but some suitable techniques were available and rarely applied to the agate genesis question. In particular, there was a general failure to examine agate in the thin section. Sorby [29] was the first person to use a polarizing microscope for the examination of rock thin sections. This initial publication was used to differentiate agate from calcite in the calcareous grit in Yorkshire, UK. The collection held in the Technische Universität Bergakademie, Freiberg, Germany shows that rock thin sections were being studied at various times during the late 19th century [30]. Yet agate thin sections rarely featured in these early years of the agate genesis discussion. The chalcedonic fibrosity and its apparent fibrous growth are shown by a thin section examination (Figure 3).
By 1920, a number of inorganic crystal structures had been investigated using XRD. However as far as we are aware, the first agate investigation using XRD was by Heinz (1930) [31]. Undoubtedly, it was the work of Liesegang [2,3] with his experiments on silica gels that had the greatest influence. His ideas dominated the agate genesis question for much of the 20th century. The simulation of the rhythmic agate patterns in silica gels and in natural settings has ensured that the term “Liesegang bands or rings” will be preserved in perpetuity (Figure 4).
The need to have a pre-existing gel and its reliance of a later diffusion by a suitable cation resulted in some objecting to the Liesegang [2] hypothesis. Ion diffusion across silica gel in a Petri dish and vertical diffusion in a boiling tube produces a clear impression of wall lining and horizontal banding respectively. This initial gelatinous deposit is still favoured by some recent authors. Pabian and Zarins in 1994 [32] invoked genesis from a silica gel deposit with banding caused by the Belousov-Zhabotinsky (B-Z) reaction. The B-Z reaction creates banding oscillations between two chemicals and can produce rhythmic banding in gels [33,34]). The Pabian and Zarins [32] hypothesis is based upon an initial vesicular infill of silica gel and contact is made with alkaline ground water. Based on the B-Z reaction, they propose that this creates a continual electrochemical wave front banding.
Suggestions of an initial gel deposit as a starting material for agate genesis are flawed from the start. A comment was never made about the temporary nature of the generated patterns. After several weeks, the gels become cracked and dehydrated leaving only a coloured silica powder. A further comment is made in the discussion.
3.2. Chalcedony from Silica Glass
During the late 1950s, the electronics industry experienced an increased demand for high quality quartz. There were many attempts to synthesise quartz from various forms of silica glass. As chalcedony was often a byproduct, some data might have potential links to agate genesis. Following on from a previous study, White and Corwin [18] produced synthetic chalcedony from a silica glass that had been subjected to a hydrothermal solution at 400 °C and 34 MPa pressure. Conversion only occurred in weakly alkaline conditions with the transformation proceeding from silica glass → cristobalite → keatite → chalcedony → quartz. During long runs, the glass was completely converted to quartz. Synthetic chalcedony had the same anomalous properties as those of natural quartz: a brown colour in transmitted light and a refractive index lower than quartz. The transformation process is repeated in many changes of amorphous silica to quartz. Unfortunately, the silica glass starting material discounts any direct link with agate genesis.
3.3. Agate Formation Temperature
Götze in 2011 [28] carried out an extensive review of the methods used to study this temperature question. Here, we will deal with just three of the techniques. Oxygen and hydrogen isotope analysis was first used on Scottish Devonian and Tertiary agates by Fallick et al. [35]. Their work demonstrated agate formation was 50 °C. Later, Harris [36] examined Namibian agates and assigned a formation temperature of 120 °C. The Harris data were re-examined by Saunders [37] who placed the agate formation temperature between 39 and 85 °C. A second method is based on the concentration of Al3+ ion in macrocrystalline quartz that is sometimes found at the centre of the agate [38]. Here, agate formation temperature was estimated at between 50 and 200 °C. A mineralothermometric study of gas-liquid inclusions in quartz of agates located in andesite-basalts from many deposits in the north-east of Russia showed that the homogenization temperatures were <120–170 °C: Lebedinoe (140–170 °C), Kedon (100–135 °C), Yana (130–135 °C), Yakanvaam (100–120 °C), Takhtayama and Ryrkalaut (110–120 °C) [24].
Most recent investigators into the question of agate genesis accept that agate formation occurs at <100 °C. Any question of agate genesis occurring at temperatures higher than 200 °C has to be totally discounted. Agates when heated at higher temperatures produce irreversible property changes.
A thermogravimetric sketch plot of heated agate powder is drawn in Figure 5a. This typical curve shows three basic changes that have all been investigated using infrared (IR) by Yamagishi et al. [39] and they demonstrated:
- (1)
- Loosely bound water molecules are lost at <200 °C.
- (2)
- Tightly bound water and various forms of silanol water are lost up to 800 °C.
- (3)
- The maximum mass loss is reached at 850 °C.
The variations in the total water in agate with respect to host age are shown in Figure 5b. The determined total water took into account the water loss in preparing <50 μm powder, which was then heated to 1200 °C. The plot shows a linear decrease in total water loss in agates over the first 60 Ma years with an approximate constant total water loss in agates from host rocks aged between 180 and 1100 Ma [40].
3.4. The Discovery of Moganite
The application of oxygen and hydrogen isotope analysis of agate formation temperatures by Fallick et al. [35] was a key contribution to the agate genesis enigma. Of equal importance was the discovery of moganite in the cracks and flows of the Mogan formation, Gran Canaria by Flörke et al. [41].
Since 1976, there have been many investigations into the properties of moganite but it was not until 1999 that it was officially recognised as a separate mineral by the International Commission on New Minerals and Mineral Names. Totally pure moganite has never been synthesised nor found pure in the natural state. The samples from Gran Canaria still provide the highest concentrations of moganite. It was the work of Heaney and Post [42] that effectively opened up the moganite story in agate by examining more than 150 samples of agate, chalcedony, chert, and flint. One of the data plots demonstrated chalcedony and agate differences in moganite ranged from 23 to 2 wt%. In a separate study, XRD was used to analyse 10 samples of Mogan moganite; the only mineral phases present were quartz and moganite with the moganite content greater than 80 wt% in half the samples. However, moganite was as low as 52 wt% in the remainder [43].
Raman spectroscopy is also a common technique for determining the moganite content. Götze et al. [44] used the two techniques to examine agate and showed that Raman can give higher values than was determined by XRD. These differences were attributed to the limited contribution to the Bragg reflection due to the small size and distribution of moganite. There have been a number of trace cation and moganite analyses of chalcedony. One was carried out by Petrovic et al. [45] with quartz and moganite (22 wt%) once again the only mineral phases. Al3+ at 0.52 wt% produced the largest concentration of the trace metal ions. Moganite is more soluble than quartz and the release of water during the geological time scale results in moganite slowly dissolving and reforming as microcrystalline quartz. The importance of this change is examined in the discussion.
3.5. Cation and Silica Loss from Basalt Host and Their Potential Role in Agate Formation
Suggested mechanisms have frequently been based upon an initial silica solution entering the gas vesicle with the subsequent water loss leaving a deposit of amorphous silica. Process repetition fills the vesicle with silica and eventually agate forms. Noeggerath [5] and Haidinger [6] first introduced aspects of this in 1849. However, the nature of silica in solution and its solubility were unknown until the 1950s. Previously, it had been assumed that aqueous silica existed in the colloidal state together with higher forms of silicic acid. Krauskopf [46] summarised earlier work that had established silicon exists primarily as monomeric silicic acid (H4SiO4). He used the yellow colour formation between silica solutions and ammonium molybdate to a great effect. Colorimetric methods could now be used to identify the concentration of H4SiO4(aq).
Krauskopf [46] was interested in the conditions for silica solubility and the precipitation of amorphous silica. He added to, and summarised, the solubility changes with temperature. Silica solubility was found to be 100–140 ppm at 25 °C; 300–380 ppm at 90 °C. He also demonstrated that the solubility has shown little change between pH values of 1 and 9. Krauskopf [46] was dealing with silica in all sedimentary environments. However, the data clearly has implications for silica transport and deposition into gas vesicles.
The alteration of the host rock has frequently been cited as a possible source of silica. Patterson and Roberson [47] carried out an analysis on the depth of boreholes from the eastern part of Kauai Island, Hawaii. Seven boreholes of varying depth together with fresh rock were analysed for their chemical composition. Water from the host rock was also included in the analysis. Just four metal ions with the highest listed concentrations have been selected for comment (Table 1). The depth of basalt bore holes ranged from 0.6 to 11 m (hole numbers 1 and 7) and the data were compared to fresh basalt (number 8).
Kauai Island basalt has been dated at 5.1 Ma [48]. Table 1 shows the changes with borehole depth from a relatively young host. The analysis of water from the rock shows the total loss of Fe3+ and demonstrates that this ion has been transported out of the host rock system at an early stage. Such a young island gives an indication of a possible cation and silica mobility from a basalt rock and to a gas vesicle. We are not aware of any agate or chalcedony forming on Kauai but the Patterson and Roberson [47] data has relevance regarding mineral loss in an agate basalt host. Equally important is a chemical analysis of trace metal ions that have been identified in agate and the agate host.
Götze et al. [49] quantified 27 trace metal ions in 18 worldwide agates and host rocks. We selected host and agate data from two Scottish sites and one each from Mexico and Brazil. Agate host rocks for this selection of sites ranged in age from 38 to 412 Ma. Both the Götze et al. [49] and Patterson and Roberson [47] studies identified a larger number of ions, but we limited our speculative comments to those cations that were likely to have the greatest effect on H4SiO4. Iron (III) oxide offers colour to many types of agate and the trivalent ions of Fe3+ and Al3+ would be expected to have the greatest effect on any silica solutions or sols. Magnesium ions are generally the largest concentration of the divalent ions and Na+ has by far the largest concentration of the monovalent ions.
Montrose and Ardownie Quarry share the same glassy andesite that formed 412 Ma years ago in the Eastern Midland Valley, Scotland. The distance between the two areas is 38 km. Chihuahua is world famous for the high quality agates and, like Brazil, is one of the few countries that mine and export agates. Brazil is by far the world leader in bulk agate export but the agates tend to be very large but dull and unusually, they can be dyed. Trace element analysis in agate and host rock from Mexico, Brazil, and Scotland are shown in Table 2.
The two neighbouring Scottish agate sites had similar concentrations of Mg2+ and Na+ and the concentrations of Fe3+ in agate are much lower than in the younger host rocks. This is in spite of the older host rocks presently having Fe3+ at a greater concentration. The agates from these two areas are attractive but not typically highly coloured with oxides of iron. The concentration of Na+ in all four host rocks is high and interestingly only relatively small concentrations survive in the agate. Presumably, much remains in solution and is lost with the departing vesicular water.
Two studies have used the silico-molybdate method to investigate the effect of iron ions/compounds on silica solutions and soils. A pressure membrane extractor was used to obtain H4SiO4 solutions from various soils [51]. In addition to the effect of iron (III) oxide, they separately added aluminium oxide to the silica solution at pH values 1–12. The addition of iron (III) oxide on the concentration of monosilicic acid resulted in a silica fall from 120 to 80 ppm at pH 4 and 70 ppm at pH 9. Aluminium oxide was more effective in reducing concentrations over the same two pH values producing a respective fall of 35 and 25 ppm.
Moxon [52] examined the separate effects of Fe3+ and Mg2+ in removing H4SiO4 and colloidal SiO2 from solutions and sols after a short run of 45 min. The various runs were within the normal groundwater pH range of 4–9. A relatively high Fe3+:H4SiO4 ratio of 1:3 could only remove 18% while a 1:96 ratio of Fe3+: colloidal SiO2 removed 90% of the silica. Over a 16 month period, 10, 20, and 40 ppm of Fe3+(aq) and Mg2+(aq) were separate additions to silica sols containing 1600, 3300, and 6800 ppm of silica respectively. These runs included fresh silica controls. In each case the solution pH was adjusted to 8.2. After 16 months, the added cations had been no more effective in precipitating silica than the control.
The solutions were stored in a cupboard at room temperature and reinvestigated after 14 years. All the H4SiO4 solutions had reached an equilibrium concentration of 122 ppm. There were a number of gelatinous flocs in suspension, on the side and floor of the containing flask. Apart from one of the 9 solutions tested, the pH fell from 8.2 to 6.1. Samples of the gels were dehydrated by oven heating and examined using XRD that included a new fresh gel control for comparison. In all cases XRD produced one single broad reflection. A full width at half maximum profile intensity (FWHM) was measured. With standard deviation included, all the 14 years old gels showed FWHM values were greater than the new fresh gel control. Unfortunately, FWHM could not differentiate between the Mg2+, Fe3+ samples and the original gel control. Nevertheless, over the 14 years some silica reorganisation had taken place in all samples. The new fresh silica gel control showed only very minor unidentifiable peaks in the diffractogram scan from 15 to 36° 2θ. However, a number of the scans did show minor crystalline development peaks 21.5 and 22° 2θ. The XRD signals from the 14-year-old gels (Figure 6b) were compared to those of an agate from New Zealand. The host age was 89 Ma but its agate properties show agate formation was 40 Ma (Figure 6a).
The International Centre for Diffraction Data [53] gives the 100% signal intensity for synthetic tridymite and cristobalite as 21.58 and 21.98° 2θ respectively. There is the possibility of tridymite amongst the signal noise to the left of the cristobalite (Figure 6a) but XRD identification of cristobalite and tridymite together is not straightforward. Additionally, both silica polymorphs show some data variability with samples obtained from natural sources. Agates less than 60 Ma produce a similar collection of peaks and are discussed later. XRD details for Figure 6a: data was obtained from a Bruker D8 diffractometer in the reflection mode; the <10 μm powder was scanned over 17° < 2θ < 25° with a step size of 0.02° 2θ and a scan speed of 20 s/step (after Moxon and Carpenter [50]). Further examples and discussion about this cristobalite signal is described using the samples shown in Figure 13. The data for Figure 6b was obtained from a Philips vertical goniometer with runs over 15° < 2θ < 38°. Full details were given in Moxon [52].
3.6. Age of Agate and Host
Unfortunately, there has only been one attempt to date both the age of the agate and volcanic host rock. Yucca Mt., NV, USA was proposed as a nuclear waste storage site and safety concerns have ensured three decades of continual and varied research. Here, chalcedony started development 4 Ma after the formation of the 13 Ma host [54]. Water movement within the mountain was an important part of the investigation. However, the low level of uranium in agates is partially the reason for the lack of any further U-Pb dating.
The availability of a variety of agates from around the world allowed changes of the quartz crystallite size and moganite content to be investigated with respect to host rock age [50]. Agates from 26 host rocks aged between 13 and 3480 Ma were examined using powder XRD to determine the crystallite size and moganite content. A total of 180 and 144 agates were investigated for the respective crystallite size and moganite content determinations. Two of the three agate regions had been involved in later metamorphic events and this had affected their properties [55,56]. The crystallite size (nm) of the remaining 23 regions shows four distinct changes of development (Figure 7a). At (A) the first 60 Ma followed a linear trend; (B) cessation of growth for the next 240 Ma; (C) a small growth spurt over the next 100 Ma; and (D) cessation of growth that continued for the next 700 Ma. The change in moganite content with respect to host rock age is shown in Figure 7b. Here, there was a linear trend over the first 60 Ma with an approximate constancy with agates from older hosts.
Three of the 23 regions were obviously off trend: agates from Brazil, New Zealand and the older agates from Northumbria, England. Brazil and New Zealand agates appeared to have an age of 26 and 30 Ma respectively. Similar comments can be made about the moganite content of the Brazilian and New Zealand agates shown in Figure 7b. The same agates show further evidence of this agate immaturity in the measured various types of water. All show the Brazilian and New Zealand agate regions are not outliers but have clear agate property trends supporting a later agate deposition [40]. Nevertheless for the majority of investigated agates, formation was generally penecontemporaneous with the host rock (Figure 7).
The changes in moganite content and quartz crystallite size with respect to host age is due to the release of structural silanol water:
Si-OH + HO-Si → Si-O-Si + H2O
This age-related change shown in Equation (1) has been established using cathodoluminescence. Released water is then able to dissolve the more soluble moganite and increase the size of recrystallizing quartz crystallites. Collectively, this produces a decrease in the moganite and silanol content with an increase in the age-related quartz crystallite size [57].
3.7. The Role of the Infiltration Canal
This peculiar feature has been noted since the 19th century and has been discussed as a means either of silica solution entry or as a water conduit for eventual water loss. It is not difficult to find these canals in some agates (Figure 8). Equally, it is not difficult to slice an agate into many sections and fail to find any canals. Walger et al. [58] examined the structures of these canals and commented that agates can be found with and without the canal. The Ayr to Girvan railway in Scotland was constructed at the beginning of the 20th century and allowed Smith in 1910 [59] to collect many hundreds of agates. He comments on the rarity of the canals in these Scottish agates. It is clear that the canals are a peculiar and interesting feature but cannot play a universal role in agate genesis.
3.8. The Wall-Contact Layer
Agates from basic igneous host rocks always have an initial wall-contact layer that is different from the rest of the agate. This layer varies in thickness, generally 1–3 mm, but may appear to be absent. However, a thin section examination with polars crossed will always demonstrate an initial wall contact layer that is different from the bulk of the agate. These agate contact layers evenly coated the vesicle and did not appear to be influenced by gravity. The Botswana agate in Figure 9a was unusual with an apparent 5 mm contact layer. However, a thin section shows that the wall contact lining was the usual 1–2 mm (x in Figure 9b). The brown layer (y) shows a contrasting micro texture with the central region (z) demonstrating that these two areas were different generations.
Reis [10,11] proposed this wall-lining was a different generation. Comment has been made about Brazilian agates [60]; bituminous agates [61]; and sedimentary agates [62]. An agate wall lining is also found in the Brazilian amethyst geodes. This led to the proposition that aqueous silica in the forming solutions diffuse through agate fractures [63]. Fractures or even hairline cracks are rare in agate and when observed they are sufficiently significant to be assigned to host rock movement. The genesis implications of this agate contact layer are of prime importance. A first deposit of wall lining would always present a potential barrier for bulk entry of silica into the vesicle.
This wall lining deposit is sometimes apparent in a thick section: as shown by the Brazilian agates in Figure 8b. Notice the near uniformity of the wall lining layers in these agates. It would be remarkable if the first silica solution could fill the gas vesicle and evenly coat the vesicle wall, crystallize, and then allow subsequent silica solutions to enter.
One study characterised nine Brazilian agates that had a lower horizontally banded section and an upper chamber with the normal wall lining pattern [64]. The volume division between the wall lining and horizontal banding varied with different agates. The horizontal banding in these agates is between 30 and 70% of the total. Thin sections of four of these Brazilian agates are shown in Figure 10a–d.
The wall contact layer in Figure 10IIa,b,d was present in the upper and lower chambers but absent in the lower chamber of IIc. There are two wall contact layers shown in agate IIa (labelled x and y). These two layers gradually faded into one at the bottom of the horizontal region. In IIc the wall contact layer was absent in the horizontally banded region. Additionally, these layers got thinner in the horizontal banded region in IId.
The observations on these combined horizontal and wall lining agates suggest the following development. Initially, enough silica is deposited on the empty vesicle floor to form a single horizontal band. At some point, there was a cessation of silica. During a later period fresh silica was deposited and followed by another pause of silica deposition. The process is repeated producing several layers. The evidence for these separate depositions is shown by the differing layer textures that range from chalcedony to prismatic quartz. Clearly this is a stop/start activity. Eventually the upper chamber now had a horizontal base but the silica input continued until sufficient silica had filled the remaining space. These agates were examined using XRD and some areas demonstrated trace cristobalite. The presence of cristobalite in agate supports the development mechanism proposed by Landmesser [25,26] and will be discussed later:
amorphous silica → cristobalite/tridymite → cristobalite → chalcedony/moganite
→ granular quartz
→ granular quartz
Each of the silica transformations shown in Scheme (2) has a greater density than its predecessor. When the transformation of layers and upper chamber is complete then shrinkage will occur but the larger bulk in the upper chamber will produce the greatest shrinkage. Here, the gap will be wider between the agate and the vesicle wall. Finally, silica deposition fills this wall lining gap. Agate IIb shows a much wider fibrous growth in the upper chamber and with a continuous but thinner fibrosity at the bottom of this chamber where thin horizontal bands have formed. The wall lining falls to around a fifth of the thickness when it fills the contact wall in the lower horizontal bands. Hence, the wall lining layer is the last generation.
3.9. Agate under the Scanning Electron Microscope
Lange et al. [65] and Holzhey [66] used the scanning electron microscope (SEM) to find evidence of the petrographic fibrosity observed in agate thin sections. The fibrosity was not found and instead, a surface composed of globulites was observed. The globulites varied in size between 0.1 and 3 μm [66] or subparticles with sizes ranging from 0.07 to 0.7 μm [66]. Additionally, there have been a number of publications citing the use of the SEM in a support role when investigating agate and chalcedony. Examples include, the effects of heating chalcedony at 500 °C [67]; agates from Permian rocks [68].
Early work had shown age-related trends in the development of quartz crystallite size and the SEM was used to observe differences between agates from young and old host rocks [69]. There are clear trends of increasing globulite size with age (Figure 11). However apart from agates from the youngest and oldest host rocks, there were too many size variables in each micrograph for worthwhile size comparison data. The same study showed host-age related differences between the white bands in agate. Agates from young host rocks will frequently show hints of faint white banding that becomes more intense in agates from host rocks greater 50 Ma. The white bands develop a structural form that is reminiscent of the edges of a stack of plates (Figure 12). Heinz [31] boiled the white and coloured bands in KOH(aq) and found that white bands offered a greater resistance to the KOH(aq): this was credited to an increased opal content. Opal is absent in agate and the SEM shows the observed differences are structural: the “plate” edges offering more resistance to the alkali attack.
3.10. Hydrocarbon Inclusions in Agate
In recent years, various hydrocarbon deposits have been reported in agates. Barsanov and Yakovleva [70] found oil and water in both horizontal layered bands from North Timan in the Russian Urals and in wall lining banded agate from the Kyzal-Tugan deposit, Taldy-Kurgan, Kazakhstan. The identification of hydrocarbons between horizontal agate layers is particularly interesting as the different formations in these horizontal layers is indicative of their long time-related formations.
Silaev et al. [71] studied the composition of gases in agates from the epithermal deposits from the Russian Polar Urals. Most of the secretion bodies have a lens shape with intermittent and wedge-shaped protrusions. Using pyrography, they identified the main composition of the inclusions. In order of decreasing concentration these were H2O, CO2, CO, CH4, and N2. The total content of the gases was in the range of 100–600 μg/g. Hydrocarbons in the fluid inclusions varied from 0.25 to 7 μg/g. The presence of hydrocarbons in agate was confirmed by radioscopic data. As a result of the determinations of the gas–liquid inclusions, they proposed a formation temperature in the range of 100–200 °C.
A third study of hydrocarbons in agates was made using samples from Nowy Kościol Lower Silesia, Poland by Dumeńska-Slowik et al. [61]. They describe the composition of the bitumen as mainly asphaltenes (56%). The remaining fractions in order of composition are saturated hydrocarbons (18%), resins (16%), and aromatic hydrocarbons (10%). Carbon isotope analysis revealed an algal-humic or algal origin.
4. Discussion
Agates are mainly found in basic igneous host rocks and this discussion is limited to the origins of agates from these host rocks. Any solution to the genesis problem requires answers to the following questions.
- (a)
- What is the formation temperature?
- (b)
- What is the source of the silica?
- (c)
- What is the nature of the silica deposit?
(a) Formation temperature: this is the only question that has been answered and the majority of interested workers accept the oxygen and hydrogen isotope analysis of Fallick et al. [35] and Saunders [37]. The collective present evidence shows that the agate formation temperature in these basaltic host rocks was <200 °C and most likely <100 °C. Any proposal of a higher formation temperature has to explain the conflict of evidence found by the various irreversible silanol water losses that are observed between 200 and 850 °C that were described by Yamagishi et al. [37]. All the observed changes would not be observed if agate had formed at a temperature >250 °C. Furthermore, when agate is heated at higher temperatures there are clear visible and further irreversible physical changes, as the agate turns white and porous. Depending upon the temperature, agate is also likely to become fractured.
(b) Silica source: Host rock leaching would be the most popular choice suggested by interested workers. One of us (T.M.) has examined many of the 412 Ma agate-bearing host rocks of the Midland Valley, Scotland. There is ample evidence of weathering/alteration in these old host rocks. Although fresh feldspars were observed, most did show signs of change. The ferromagnesian content was highly altered with thin sections showing indistinct remnants as a common feature. These rocks had the potential to release the silica for agate formation and Fe3+ for oxide colouring. However, the most telling feature for some of the Eastern Midland Valley agates is their clear lack of red/brown iron oxide colouring. Conversely, the Burn Anne agates from the Western Midland Valley provide Scotland’s most colourful red and yellow agates. Extensive research on the Yucca Mt., NV, USA shows the downward percolation of water is depositing amorphous silica in these 13 Ma Miocene Tuffs. Chalcedony forms in fissures and as a host coating [72]. However, these tuffs are not the typical agate host rocks.
The link between host age and agate crystallinity demonstrates agate formation is mostly a penecontemporaneous deposit of host and agate [50]. This timing would offer support for late hydrothermal solutions or hot springs carrying higher concentrations of H4SiO4. Scientists investigating hot spring silica differentiate between two types of silica sinter: a direct deposition from hot solutions and silica released by steam attacking the host rock. Either directly or indirectly these actions are a potential supply of silica for agate formation.
(c) The nature of the silica deposit: There are two potential alternatives for the initial deposit: silica gel or powder. This would be followed by a later transformation into chalcedony. Harder and Flehmig [73] showed that iron, magnesium, and aluminium hydroxides could absorb silica from low concentration of silica solution (0.5 ppm). The silica enriched precipitates formed quartz crystals within days. Elsewhere, quartz crystals have been grown in the laboratory from a solution containing 4.4 ppm of silicic acid at 20 °C [74]. Both these studies require quartz formation to be from solutions that are saturated with respect to quartz but under saturated with respect to amorphous silica. These conditions are limiting and the developing crystals are prismatic quartz and not agate.
Godovikov et al. [23] presented the results of experiments investigating the diffusion processes in silica gel. They used the silicate (office) glue, which is mainly an aqueous solution of Na2SiO3 and iron, nickel, or copper sulphate in the experiments. A sparingly soluble salt in solution was poured onto a silica gel containing the same salt. Maximum supersaturation occurs at the interface between solution and gel. At this interface, they observed the appearance of complex branched dendrites. When the degree of supersaturation was minimal, there was a growth of individual full-faceted crystals. They proposed that spherulites arise under conditions of supersaturation. Additionally the authors proposed that the colour of agates has various causes. Essentially, a) uneven distribution of pores and their different shapes in separate layers of agate; b) a different mineral composition in individual zones; and c) finely dispersed inclusions of brightly coloured minerals.
Heaney [75] developed a theoretical model to explain the formation of chalcedony and prismatic quartz in the same sample. This was based on the differences of structure and solubility between chalcedony and prismatic quartz. A final single deposit of macrocrystalline quartz is shown in Figure 3. When this occurs prismatic quartz is usually found around the centre of a sample with a clean break from the surrounding chalcedony. An immediate impression is distinct separate entries and depositions. This is not possible and the Heaney [75] mechanism is based on a weakly polymerised silica solution allowing the formation of chalcedony and leaving a more dilute solution of monomeric silicic acid. Eventually, the very dilute silicic acid solution is now under saturated with respect to amorphous silica but saturated with respect to prismatic quartz: ideal conditions for a final deposit of prismatic quartz.
Over the last century and prompted by the work of Liesegang [2], there has been support for the direct precipitation of silica gel as an agate precursor. Reported direct formations of silica gel are very rare but Naboko and Silnichenko [76] commented on a silica gel (52% silica) that was forming on the solfataras of the Golovnin volcano in Russia. However, gel cannot diffuse through the host rock. Any gel precursor must form within the gas vesicle. To overcome this objection, a hypothesis was proposed by Harder and Flehmig [73] who suggested that a reaction between solutions containing silica sols and Fe3+(aq) or Al3+(aq) enter the vesicle separately. This mixture produces a gel-like state that could eventual form agate. Present day solutions circulating in host rocks do not contain the high concentrations of these two ions or silica; these would be necessary to generate a silica gel. Dry gels quickly dehydrate and produce a powder of amorphous silica. As a hypothesis, there seems little point in adding one more step to this amorphous silica beginning.
Agate, chalcedony, and chert are all forms of microcrystalline quartz. Although chert commonly shows a granular texture when examined petrographically, patches of chalcedony in chert are not rare. Chalcedony has been identified occurring with amorphous silica in the Yucca Mt, Nevada. Additionally it is amorphous silica (opal-A) that is commonly found around hot springs in New Zealand and Yellowstone Park, USA. Unfortunately, investigators of silica sinter do not tend to differentiate between the various forms of microcrystalline quartz: chalcedony is not often reported. Nevertheless, chalcedony is presently being formed in the Tengchong geothermal area China [77]. Additionally, Marcoux et al. [78] identified black, grey-brown and white chalcedony that formed in the siliceous sinter of the 295 Ma French Massif Central.
Studies on the genesis of chert and sinter have produced a much greater volume of work than agate but similarities and differences between all three provide potential development links for agate investigation. Stages of development for chert [79] and sinter [80] have been shown to follow sequence:
amorphous silica → cristobalite/tridymite → cristobalite →
chalcedony/moganite → granular quartz
chalcedony/moganite → granular quartz
Landmesser [25,26] argued the same transformations for agate (2). A comparison of the rate of phase transformations for agate, chert, and sinter demonstrates the major origin differences between these three forms of microcrystalline quartz. Silica sinter discharges from weakly alkaline chloride waters at ≤100 °C. The time scale for completion of the sinter diagenesis is typically 50 ka [81]. However, a faster rate of conversion of sinter into quartz has been achieved when a partial conversion into quartz occurred within weeks [82]. As expected, the completion of each silica sinter transformation step is generally not rapid. For example, a single XRD diffractogram can show evidence of amorphous silica, cristobalite and tridymite.
Moganite is found in sinter, chert, and agate but the survival rates differ greatly. In sinters with ages 20–220 ka the moganite content is at a maximum of 13 wt% whereas Tertiary sinters are generally free of moganite [83]. Chert hosts of the Cretaceous age have been identified with a moganite content of >20 wt% [84]. This contrasts with 56 wt% moganite identified in the Yucca Mt chalcedony and it has been identified in agate from the 1100 Ma Lake Superior host [50]. However, detecting moganite from agate in host rocks >400 Ma using XRD is not always possible.
Chert diagenesis is much more prolonged where surface amorphous silica can survive for 85 Ma. Transformation to cristobalite/tridymite can be 5–10 Ma and is still found in rocks aged 120 Ma but is not observed in rocks >140 Ma. Quartz requires a minimum of 40 Ma at depths of 500 m [85]. The phase transformation changes and moganite differences in sinter, agate, and chert have a link to the particular formation temperatures: silica sinter shows a variable but the most rapid changes with the silica deposits held at 100 °C.
Agate development bears a close link to the age of the host and polymorph precursors have occasionally been identified: cristobalite/tridymite layering in Brazilian agate [22]. Moxon and Carpenter [50] identified cristobalite in agates from Mexico, Iran, Rum, and Scotland: these are all hosts younger than 60 Ma. Cristobalite was also found in the hosts of New Zealand agate (89 Ma) and Brazil (135 Ma): providing further evidence for a formation age much later than their hosts. The basic XRD data identifying the weak cristobalite XRD signals in agates from Brazilian, and Iranian hosts are shown in Figure 13. Cristobalite identification in agate has not been reported in agate from hosts older than 60 Ma elsewhere. As discussed earlier, the properties of Brazilian agate demonstrate a formation at 26–30 Ma.
The prime aim of the Moxon and Carpenter (2009) [50] study was to investigate the moganite to quartz transformation. The quantification of the moganite content was carried out using a Bruker diffractometer with a step size of 0.02° 2θ and a scan rate of 20 s/step. A total of 32 agates were examined from hosts ≤60 Ma (that also included Brazilian and New Zealand agates). Exactly half were free of cristobalite but the remainder gave the cristobalite XRD signal. Three agates from the cristobalite batch were selected for a more intense scan and at least two of the next cristobalite most intense signals were identified at 28.4, 31.5, and 36.1°2θ. The detected cristobalite was noted in the paper but not examined any further.
The same data has been examined in more detail and two of the diffractograms are shown in Figure 13. The Brazilian agate shows the presence of cristobalite and the plot was similar to that produced by the New Zealand agate in Figure 6a. All the agates, apart from those from Brazil and New Zealand, were from hosts younger than 60 Ma.
There was a contrast between the cristobalite peaks shown by the two agates in Figure 13. There were two peaks in the Brazilian agate against the single peak in the Iranian agate. We speculated that the second outer peak could be tridymite and the change from younger to older agate was demonstrating an opal CT → opal C change. The outer peaks of the agates showing this peaked feature were measured and produced a mean value of 21.89(6)° 2θ and a cristobalite mean value of 21.99(4)° 2θ. Data shown in parentheses are ± one standard deviation. The JCPDDS [53] data for synthetic tridymite and synthetic cristobalite were 21.58 and 21.98° 2θ respectively. The identification of tridymite and cristobalite with XRD when found together in the natural state is not straightforward. The regular appearance and consistency of the outer signal in these samples would rule out instrument noise.
Of the 16 agates that showed these two signals, 5 were from Mt Somers New Zealand and 4 in each of the batches from Chihuahua, Mexico, and Khur, Iran. Cristobalite identification in agate has not been found elsewhere in agates older than 60 Ma. Hence, the identification of cristobalite in Brazilian and New Zealand agates further supports their late agate formation. Dates of the late entry of some secondary minerals into the gas vesicles of the Brazilian Paraná Continental Flood basalts have been summarised by Gilg et al. [86]. Various secondary infills occurred up to 60 Ma after the basalt formation. However, the properties of Brazilian agates (water and moganite content and crystallite size) show a formation age around 100 Ma after host formation.
5. Summary
The most prolific source of agate is from basalt and andesite and we concentrated our deliberations on agates from these hosts. Such agates provide by far the greatest scientific interest and involvement. Agates found in acidic igneous and sedimentary rocks are more rare and this is reflected by the smaller number of literature publications.
Until the mid 20th century there were few scientific publications on agate and these were mainly limited to speculative comments based on agate banding and their hosts. Viewed from 2020, clear exceptions would be the early observations and micrographs produced by Timofeev [8]; the detailed thin section examinations of Pilipenko [13] and the gel studies of Liesegang [2,3]. Liesegang’s works on gels were still producing links to agate genesis until the end of the last century. However, there is now little support for an explanation of agate formation based upon the concept of metal ion diffusion into a silica gel.
From 1960, industrial requirements for high quality quartz were the driving force for a number of high temperature and pressure investigations on various forms of silica. Unfortunately, none of these experiments had a direct application to agate genesis. Additionally, studies using high temperature/pressure conditions and those under normal earth conditions can proceed by different mechanisms giving conflicting results. Nevertheless, advances in scientific equipment over the last 60 years have allowed a more detailed understanding of the properties and composition of agate.
In these basic igneous host rocks, enough evidence has now been obtained for an agate formation temperature at mostly < 100 °C. The agate silica content was initially assumed to be just fine-grained α-quartz. However, the more recent discoveries of moganite and cristobalite have allowed evidence-based speculation to propose that agate starts as amorphous silica. Over geological time, it progresses to cristobalite before transforming into agate.
It is probable that tridymite forms before cristobalite but the evidence has still to be conclusively found. On initial formation, agate is on a lengthy journey of development. Agates are unusual in ageing over the geological time scale. The changes are due to the release of water and the very slow transformation of moganite into quartz. The result is an increase in quartz crystallite size. SEM examinations demonstrate globular development in the clear bands and further maturity in the white bands. This development in the white bands is often apparent in agate thin sections. White bands in agates older than 180 Ma generally show a more intense white than is found in younger agates (compare the Brazilian and Botswana samples in the respective Figure 8 and Figure 9). A thin section of a 3480 Ma agate from Australia shows that the end of agate development is only reached when fibrous quartz is transformed into microcrystalline granular quartz [55].
Presently, agate genesis research does lack any commercial driving force. The genesis problem has been in the literature since the 18th century and will not be to be solved with a 3-year funding grant. One important incentive for chert and silica sinter research has been the early forms of life that have been trapped in the material. This might change for agate as the Mars Rover units have been investigating silica links to water and microbiological activity and this does include chalcedony.
For the future, agate properties that change w.r.t host age might be a simpler and a cheaper direction of study. In order to make valid comparisons, any such investigation will require sufficient agates from host rocks of various ages. As always, there is the proviso regarding outliers that have formed later than the host. As described in this paper, three of the 26 agate regions demonstrated an earlier but consistent age of formation that was much later than the host.
The most likely area of profitable investigation would involve agate from very young host rocks. We described data from a single sample of Yucca Mt (13 Ma) chalcedony providing a crystallite size and moganite content. While this agate had a crystallite size of 40 nm that is in line with expectations, the 56 wt% moganite did appear to be very high when compared to the 19% moganite in agate from the 23 Ma Mt Warning Australia host. At face value, this would suggest that agates in their very early years of development are exceptionally high in moganite. In which case, extrapolation back to zero time would not be possible. Alternatively, this sample is a freak result and further analyses would produce other data that is more in line with expectations. Where possible a minimum of five samples from the same area should be examined. It would appear that agates from the young host rocks have the most to offer future investigations into agate genesis. In this category, the islands of Hawaii would be a prime source for agate study. These islands have formed as a result of movement across a hot spot in the Earth’s mantle. Several islands offer formation dates ranging from 0.43 to 5.1 Ma [48]. It helps that the geology of these islands has been thoroughly investigated by the US Geological Survey and many others.
Author Contributions
Conceptualization, T.M.; methodology, T.M.; writing and editing, T.M. and G.P.; visualization, T.M. and G.P.; supervision, T.M.; translation of works in Russian into English, G.P. All authors have read and agreed to the published version of the manuscript.
Funding
This research was funded by the Ministry of Science and Higher Education of the Russian Federation within the framework of the state assignment of the Sobolev Institute of Geology and Mineralogy of Siberian Branch of Russian Academy of Sciences (topic no. 0330-2016-0001).
Acknowledgments
The agates used in the studies by T.M. have been donated by Glenn Archer (Outback Mining, Australia), Rob Burns, Jeannette Carrillo (Gem Center USA, Inc.), Roger Clark, Nick Crawford, Brad Cross, Robin Field, Gerhard Holzhey, Brian Isfield, Herbert Knuettel (Agate Botswana), Reg Lacon, Brian Leith, Maziar Nazari, Dave Nelson, Leonid Neymark, John Raeburn, John Richmond, Vanessa Tappenden, Bill Wilson, and Johann Zenz. Links between agate properties and host age could not have been investigated without these donations. T.M. is indebted to the Dept. of Earth Sciences, Cambridge University, UK for access to the laboratories. The contributions of co-workers and support staff were essential for the progress made. Thanks are due to Tony Abraham, Michael Carpenter, Ian Marshall, Chris Parish, Chiara Petrone, Stephen Reed, Susana Rios, Paul Taylor, Martin Walker, and Ming Zhang. Gerd Schmid translated the early German papers into English. We thank Evgeniya Svetova for help in finding rare pre-1934 Russian agate articles. We thank three reviewers for their comments after a first submission of the manuscript.
Conflicts of Interest
The authors declare no conflict of interest.
References
- Collini, C. Tagebuch Einer Reise, Welches Verschiedene Mineralogische Beobachtungen, Besonders über Die Achate und den Basalt Enthält; C.F. Schwan: Mannheim, Germany, 1776; p. 582. [Google Scholar]
- Liesegang, R.E. Die Achate; T. Verlag von Theodor Steinkopff: Dresden/Leipzig, Germany, 1915; p. 122. [Google Scholar]
- Liesegang, R.E. Achat Theorien. Chem Erde 1931, 4, 143–152. [Google Scholar]
- Zenz, J. Fascinating Idar Oberstein in Agates; Bode: Lauenstein, Germany, 2009; pp. 164–185. [Google Scholar]
- Noeggerath, J. Sendschreiben an den K. K. wirklichen Bergrath und Professor Haidinger in Wien, über die Achat-Mandeln in den Melaphyren. Verh. Nat. Ver. Preuss. Rheinl. Westphalens 1849, 6, 243–260. (In German) [Google Scholar]
- Haidinger, W. Versammlungsberichte. In Berichte über die Mittheilungen von Freunden der Naturwissenschaften in Wien; Braumüller u. Seidel: Wien, Germany, 1849; pp. 61–69. (In German) [Google Scholar]
- Heddle, M.F. The Mineralogy of Scotland; David Douglas: Edinburgh, Scotland, 1901; Volume 1, p. 148. [Google Scholar]
- Timofeev, V.M. Chalcedony of Sujsar Island. Proc. Soc. St. Petersburg Nat. 1912, 35, 157–174. (In Russian) [Google Scholar]
- Reis, O.M. Einzelheiten über Bau und Entstehung von Enhydros, Kalzitachat und Achat I. Geognost. Jahresh. 1917, 29, 81–298. (In German) [Google Scholar]
- Reis, O.M. Einzelheiten über Bau und Entstehung von Enhydros, Kalzitachat und Achat II. Geognost. Jahresh. 1918, 31, 1–92. (In German) [Google Scholar]
- Fischer, W. Zum Problem der Achatgenese. N. J. Miner. Abh. 1954, 86, 367–392. (In German) [Google Scholar]
- Jessop, R. Agates and cherts of Derbyshire. Geol. Assoc. 1930, 42, 29–43. [Google Scholar] [CrossRef]
- Pilipenko, P.P. Zur Frage der Achat genese. Bul. Soc. Nat. Mosc. 1934, 12, 279–299, (In German and Russian). [Google Scholar]
- Kuzmin, A.M. Periodic-Rhythmical Phenomena in Mineralogy and Geology; Scientific & Technical Translations: Tomsk, Russia, 2019; p. 336. (In Russian) [Google Scholar]
- Nacken, R. Über die Nachbildung von Chalcedon–Mandeln. Natur Folk 1948, 78, 2–8. [Google Scholar]
- Carr, R.M.; Fyfe, W.S. Some observations on the crystallization of amorphous silica. Am. Mineral. 1958, 43, 908–916. [Google Scholar]
- Keat, P.P. A New Crystalline Silica. Science 1954, 120, 328–330. [Google Scholar] [CrossRef] [PubMed]
- White, J.F.; Corwin, J.F. Synthesis and origin of chalcedony. Am. Mineral. 1961, 46, 112–119. [Google Scholar]
- Heydemann, A. Untersuchungen über die Bildungsbedingungen von Quarz in Temperaturbereich zwischen 100 °C und 250 °C. Beiträge zur Mineralogie und Petrographie 1964, 10, 242–259. (In German) [Google Scholar] [CrossRef]
- Ernst, W.G.; Calvert, S.E. An experimental study of the recrystallization of porcelanite and its bearing on the origin of some bedded cherts. Am. J. Sci. 1969, 267, 114–133. [Google Scholar]
- Oehler, J.H. Hydrothermal crystallization of silica gel. Geol. Soc. Am. Bul. 1976, 87, 1143–1152. [Google Scholar] [CrossRef]
- Flörke, O.W.; Köhler-Herbetz, B.; Langer, K.; Tönges, I. Water in microcrystalline quartz of volcanic origin: Agates. Contrib. Mineral. Petrol. 1982, 80, 324–333. [Google Scholar] [CrossRef]
- Godovikov, A.A.; Ripinen, O.I.; Motorin, S.G. Agates; Nedra: Moscow, Russia, 1987; p. 368. (In Russian) [Google Scholar]
- Goncharov, V.I.; Gorodinsky, M.E.; Pavlov, G.F.; Savva, N.E.; Fadeev, A.P.; Vartanov, V.V.; Gunchenko, E.V. Chalcedony of North-East. of the USSR; Science: Moscow, Russia, 1987; p. 192. (In Russian) [Google Scholar]
- Landmesser, M. Mobility by metastability: Silica transport and accumulation at low temperatures. Chem. Erde 1995, 55, 149–176. [Google Scholar]
- Landmesser, M. Mobility by metastability in sedimentary and agate petrology: Applications. Chem. Erde 1998, 58, 1–22. [Google Scholar]
- Moxon, T. Agate Microstructure and Possible Origin; Terra Publications: Doncaster, UK, 1996; p. 106. [Google Scholar]
- Götze, J. Agate-fascination between legend and science. In Agates III; Zenz, J., Ed.; Bode-Verlag: Salzhemmendorf, German, 2011; pp. 19–133. [Google Scholar]
- Sorby, H.C. On the microscopical structure of Calcareous Grit of the Yorkshire coast. Quart. J. Geol. Soc. Lond. 1851, 7, 1–6. [Google Scholar] [CrossRef]
- Eberspächer, S.; Lange, J.-M.; Zaun, J.; Kehrer, C.; Heide, G. The Historical Collection of Rock Thin Sections at the Technische Universität Bergakademie Freiberg and Evaluation of Digitization Methods. 2015. Available online: https://www.researchgate.net/publication/273118591e (accessed on 1 September 2020).
- Heinz, H. Die Entstehung Die Entstehung der Achate, ihre Verwitterung und ihre künstliche Färbung. Chem. Erde 1930, 4, 501–525. (In German) [Google Scholar]
- Pabian, R.K.; Zarins, A. Banded Agates—Origins and Inclusions. Educational Circular. No. 12; University of Bebraska: Lincoln, NE, USA, 1994; p. 32. [Google Scholar]
- Belousov, B.P. A periodic reaction and its mechanism. In Sbornik Referatov po Radiatsioanoi Medicine for 1958 Year; Medgiz: Moscow, Russia, 1959; p. 145. (In Russian) [Google Scholar]
- Zhabotinsky, A.M. Periodic liquid phase reactions. Proc. Acad. Sci. USSR 1964, 157, 392–395. (In Russian) [Google Scholar]
- Fallick, A.E.; Jocelyn, J.; Donelly, T.; Guy, M.; Behan, C. Origin of agates in the volcanic rocks of Scotland. Nature 1985, 313, 672–674. [Google Scholar] [CrossRef]
- Harris, C. Oxygen-isotope zonation of agates from Karoo volcanic of the Skeleton Coast, Namibia. Am. Mineral. 1989, 74, 476–481. [Google Scholar]
- Saunders, J.A. Oxygen-isotope zonation of agates from Karoo volcanic of the Skeleton Coast, Namibia: Discussion. Am. Mineral. 1990, 75, 1205–1206. [Google Scholar]
- Götze, J.; Plötze, M.; Tichomirova, M.; Fuchs, H. Aluminium in quartz as an indicator of the temperature of formation of agate. Miner. Mag. 2001, 65, 407–413. [Google Scholar] [CrossRef]
- Yamagishi, H.; Nakashima, S.; Ito, Y. High temperature infrared of hydrous spectra microcrystalline quartz. Phys. Chem. Miner. 1997, 24, 66–74. [Google Scholar] [CrossRef]
- Moxon, T. A re-examination of water in agate and its bearing on the agate genesis enigma. Miner. Mag. 2017, 81, 1223–1244. [Google Scholar] [CrossRef]
- Flörke, O.W.; Jones, J.B.; Schmincke, H.U. A new microcrystalline silica from Gran Canaria. Zeitschrift für Kristallographie-Crystalline Materials 1976, 143, 156–165. [Google Scholar] [CrossRef]
- Heaney, P.J.; Post, J.E. The Widespread Distribution of a Noel Silica Polymorph in Microcrystalline Quartz Varieties. Science 1992, 255, 441–443. [Google Scholar] [CrossRef]
- Zhang, M.; Moxon, T. Infrared absorption spectroscopy of SiO2-moganite. Am. Mineral. 2014, 99, 671–680. [Google Scholar] [CrossRef]
- Götze, J.; Nasdala, L.; Kleeberg, R.; Wenzel, M. Occurrence and distribution of “moganite” in agate/chalcedony: A combined micro-Raman, Rietveld, and cathodoluminescence study. Contrib. Mineral. Petrol. 1998, 133, 96–105. [Google Scholar] [CrossRef]
- Petrovic, I.; Heaney, P.J.; Navrotsky, A. Thermochemistry of the new silica polymorph moganite. Phys. Chem. Miner. 1996, 23, 119–126. [Google Scholar] [CrossRef]
- Krauskopf, K. Dissolution and precipitation of silica at low temperatures. Geochim. Cosmochim. Acta 1956, 10, 1–26. [Google Scholar] [CrossRef]
- Patterson, S.H.; Roberson, C.E. Weathered basalt in the Eastern part of Kauai, Hawaii. Prof. Paper 424 C 219 US Geol. Surv. 1961, 424, 195–198. [Google Scholar]
- Fleischer, R.C.; McIntosh, C.E.; Tarr, C.L. Evolution on a volcanic conveyor belt: Using phylogeographic reconstruction and K-Ar based ages of the Hawaiian Islands to estimate molecular evolutionary rates. Mol. Ecol. 1998, 7, 533–545. [Google Scholar] [CrossRef] [Green Version]
- Götze, J.; Tichomirow, M.; Fuchs, H.; Pilot, J.; Sharp, Z.D. Chemistry of agates: A trace element and stable isotope study. Chem. Geol. 2001, 175, 523–541. [Google Scholar] [CrossRef]
- Moxon, T.; Carpenter, M.A. Crystallite growth kinetics in nanocrystalline quartz (agate and chalcedony). Miner. Mag. 2009, 73, 551–568. [Google Scholar] [CrossRef]
- Jones, H.P.; Handreck, K.A. Effects of iron and aluminium oxides on silica in solution in soils. Nature 1963, 198, 852–853. [Google Scholar] [CrossRef]
- Moxon, T. The co-precipitation of Fe3+ and SiO2 and its role in agate genesis. Neues Jahrb. Fur Mineral. Mon. 1996, 1, 21–36. [Google Scholar]
- File, P.D. JCPDS International Centre for Diffraction Data; ICDD: Newtown Square, PA, USA, 1998. [Google Scholar]
- Neymark, L.A.; Amelin, Y.; Paces, J.B.; Peterman, Z.E. U-Pb ages of secondary silica at Yucca Mountain, Nevada: Implications for the paleohydrology of the unsaturated zone. Appl. Geochem. 2002, 17, 709–734. [Google Scholar] [CrossRef] [Green Version]
- Moxon, T.; Nelson, D.R.; Zhang, M. Agate recrystallisation: Evidence found in the Archaen and Proterozoic host rocks, Western Australia. Aust. J. Earth Sci. 2006, 53, 235–248. [Google Scholar] [CrossRef]
- Moxon, T.; Reed, S.J.B.; Zhang, M. Metamorphic effects on agate found near the Shap granite, Cumbria: As demonstrated by petrography, X-ray diffraction spectroscopic methods. Miner. Mag. 2007, 71, 461–476. [Google Scholar] [CrossRef]
- Moxon, T.; Reed, S.J.B. Agate and chalcedony from igneous and sedimentary hosts aged from 13 to 3480 Ma: A cathodoluminescence study. Miner. Mag. 2006, 70, 485–498. [Google Scholar] [CrossRef]
- Walger, E.; Matthess, G.; von Seckendorf, V.; Liebau, F. The formation of agate structure for silica transport, agate layer accretion, and flow atterns and models flow regimes in infiltration canals. N. Jb. für Geologie und Palāontologie Abh. 2009, 186, 113–152. [Google Scholar]
- Smith, J. Semi-Precious Stones of Carrick; Kilwining: Spean Bridge, UK, 1910; p. 84. [Google Scholar]
- Wang, Y.; Merino, E. Self-organisational origin of agates: Banding fiber twisting, composition and dynamic crystallization model. Geochim. Cosmochim. Acta 1990, 54, 1627–1638. [Google Scholar] [CrossRef]
- Dumeńska-Slowik, M.; Natkaniec-Nowak, L.; Kotarba, M.J.; Sikorska, M.; Rzymełka, J.A.; Łoboda, A.; Gaweł, A. Mineralogical and geochemical characterization of the “bituminous” agates from Nowy Kościol Lower Silesia. J. Mineral. Geochem. 2008, 184, 255–268. [Google Scholar]
- Götze, J.; Möckel, R.; Kempe, U.; Kapitonov, I.; Vennemann, T. Characteristics and origin of agates in sedimentary rocks from the Dryhead area, Montana, USA. Miner. Mag. 2009, 73, 673–690. [Google Scholar] [CrossRef]
- Commin-Fischer, A.; Berger, G.; Polve, M.; Dubois, M.; Sardini, P.; Beaufort, D.; Formoso, M. Petrography and chemistry of SiO2 filling phases in amethyst geodes from Sierra Geral Formation deposit, Rio Grande do Sul, Brazil. J. Am. Earth Sci. 2010, 29, 751–760. [Google Scholar] [CrossRef]
- Moxon, T.; Petrone, C.M.; Reed, S.J.B. Characterisation and genesis of horizontal banding in Brazilian agate: An X-ray diffraction, thermogravimetric and microprobe study. Miner. Mag. 2013, 77, 227–248. [Google Scholar] [CrossRef] [Green Version]
- Lange, P.; Blankenburg, H.-J.; Schron, W. Rasterelectronmikroscopische Untersuchgen an Vulkanachaten. Z. Geol. Wiss. 1984, 12, 669–683. (In German) [Google Scholar]
- Holzhey, G. Mikrokristalline SiO2 Minerallisation in rhyolithischen. Rotliegendvulkaniten des Thüringer Waldes (Deutschland) und ihre Genese. Chem. Erde 1999, 59, 183–205. (In German) [Google Scholar]
- Fukuda, J.; Yokoyama, T.; Kirino, Y. Characterization of the states and diffusivity of intergranular water in a chalcedonic quartz by high temperature situ infrared spectroscopy. Miner. Mag. 2009, 73, 825–835. [Google Scholar] [CrossRef]
- Götze, J.; Möckel, R.; Vennemann, T.; Muller, A. Origin and geochemistry of agates in Permian volcanic rocks of the Sub-Erzgebirge basin, Saxony (Germany). Chem. Geol. 2016, 428, 77–91. [Google Scholar] [CrossRef]
- Moxon, T. Agate: A study of ageing. Eur. J. Mineral. 2002, 14, 1109–1118. [Google Scholar] [CrossRef]
- Barsanov, G.P.; Yakovleva, M.E. Mineralogy, macro- and micromorphological features of agates. New Data Miner. 1982, 30, 3–26. (In Russian) [Google Scholar]
- Silaev, V.I.; Shanina, S.N.; Ivanovskii, V.S. Inclusions of oil gases in agate-type secretions: Implications for forecast of the oil- and gas-bearing potential of the Polar Urals. Dokl. Earth Sci. 2002, 383, 246–252. (In Russian) [Google Scholar]
- Whelan, J.B.; Paces, J.B.; Peterman, Z.E. Physical and stable-isotope evidence for the formation of secondary calcite in the unsaturated zone, Yucca Mountain, Nevada. Appl. Geochem. 2002, 17, 735–750. [Google Scholar] [CrossRef]
- Harder, H.; Flehmig, W. Quarzsynthese bei tiefen temperature. Geochim. Cosmochim. Acta 1970, 34, 295–305. [Google Scholar] [CrossRef]
- Mackenzie, F.T.; Gees, R. Quartz synthesis at earth surface conditions. Science 1971, 173, 533–535. [Google Scholar] [CrossRef]
- Heaney, P.J. A proposed mechanism for the growth of chalcedony. Contrib. Mineral. Petrol. 1993, 115, 66–74. [Google Scholar] [CrossRef]
- Naboko, S.L.; Silnichenko. The formation of silica gel on the solfataras of the Golovin volcano on Kunashir Island. Geochemistry 1957, 3, 253–256. (In Russian) [Google Scholar]
- Meixiang, Z.; Wei, T. Surface hydrothermal minerals and their distribution in the Tengchon geothermal area, China. Geothermics 1987, 16, 181–195. [Google Scholar] [CrossRef]
- Marcoux, E.; Le Berre, P.; Cocherie, A. The Meillers Autunian hydrothermal chalcedony: First evidence of a 295 Ma auriferous epithermal sinter in the French Massif Central. Ore Geol. Rev. 2004, 25, 69–87. [Google Scholar] [CrossRef] [Green Version]
- Knauth, L.P. Petrogenesis of chert. Rev. Mineral. 1994, 29, 233–258. [Google Scholar]
- Rodgers, K.A.; Browne, P.R.L.; Buddle, T.F.; Cook, K.L.; Greatrez, R.A.; Hampton, W.A.; Herdianita, N.R.; Holland, G.R.; Lynne, B.Y.; Martin, R.; et al. Silica phases in sinters and residues from geothermal fields of New Zealand. Earth Sci. Rev. 2004, 66, 1–61. [Google Scholar] [CrossRef]
- Herdianita, N.R.; Browne, P.R.L.; Rodgers, K.A.; Campbell, K.A. Mineralogical and textural changes accompanying ageing of silica sinter. Miner. Depos. 2000, 35, 48–62. [Google Scholar] [CrossRef]
- Lynne, B.Y.; Campbell, K.A.; Perry, R.S.; Browne, P.R.L.; Moore, J.N. Acceleration of sinter diagenesis in an active fumarole, Taupo volcanic zone, New Zealand. Geology 2006, 34, 749–752. [Google Scholar] [CrossRef]
- Rodgers, K.A.; Cressey, G. The occurrence, detection and significance of moganite (SiO2) among some silica sinters. Miner. Mag. 2001, 65, 157–167. [Google Scholar] [CrossRef]
- Heaney, P.J. Moganite as an indicator for vanished evaporites: A testament. J. Sediment. Res. 1995, 65, 633–638. [Google Scholar]
- Hesse, R. Origin of chert: Diagenesis of biogenic siliceous sediments. Geosci. Can. 1988, 15, 171–192. [Google Scholar]
- Gilg, H.A.; Morteani, G.; Kostitsyn, Y.; Preinfalk, C.; Gatter, I.; Streider, A.J. Genesis of amethyst geodes in basaltic rocks of the Serra Geral formation (Ametista do Sul, Rio Grande do Sul, Brazil): A fluid inclusion, REE, oxygen, carbon and Sr isotope study on basalt, quartz and calcite. Miner. Depos. 2003, 38, 1009–1025. [Google Scholar] [CrossRef]
Figure 1.
Timofeev micrographs [8]. The original captions describe the (a) alternation of zones of quartz (light) and chalcedony (dark); (b) the formation of quartzine filaments on the faces of the quartz rhombohedra; and (c) zones showing a changing orientation from chalcedony to quartz.
Figure 1.
Timofeev micrographs [8]. The original captions describe the (a) alternation of zones of quartz (light) and chalcedony (dark); (b) the formation of quartzine filaments on the faces of the quartz rhombohedra; and (c) zones showing a changing orientation from chalcedony to quartz.

Figure 2.
(a) Liesegang rings of silver chromate. They are formed when aqueous silver ions slowly diffuse through a gel containing chromate ions producing a precipitate of silver chromate (from Liesegang [3]). (b) Liesegang banding that has been produced when samples of blue, orange, and white dyed polyester resin are simultaneously poured round a solid circular disc. The pouring point was at (x) with an apparent exit canal at (y). Disc hole diameter = 2 cm.

Figure 3.
(a) A Brazilian agate that has been dyed to a depth of around 2 mm. (b) The thin section that was made from a slab just below the dyed surface. Note the wall contact layer shows a different texture to the main microstructure. The arrows indicate the direction of growth leading to a final development of macrocrystalline quartz crystals. Polars crossed. Scale bar = 2 cm.

Figure 4.
Two natural settings that have developed Liesegang rings. (a) An elliptical development in the sandstone cliffs at Hunstanton, Norfolk, England. (b) Rust rings that have formed on the support plate of a battery driven clock.
Figure 4.
Two natural settings that have developed Liesegang rings. (a) An elliptical development in the sandstone cliffs at Hunstanton, Norfolk, England. (b) Rust rings that have formed on the support plate of a battery driven clock.

Figure 5.
(a) A sketch plot of typical TGA (thermo gravimetric analysis) changes when powdered agate is heated to 1000 °C (after Yamagishi et al. [39]). (b) Total water loss from agate with respect to age of the host rock. Agate powders (<50 μm) were heated at 1200 °C (after Moxon [40]).
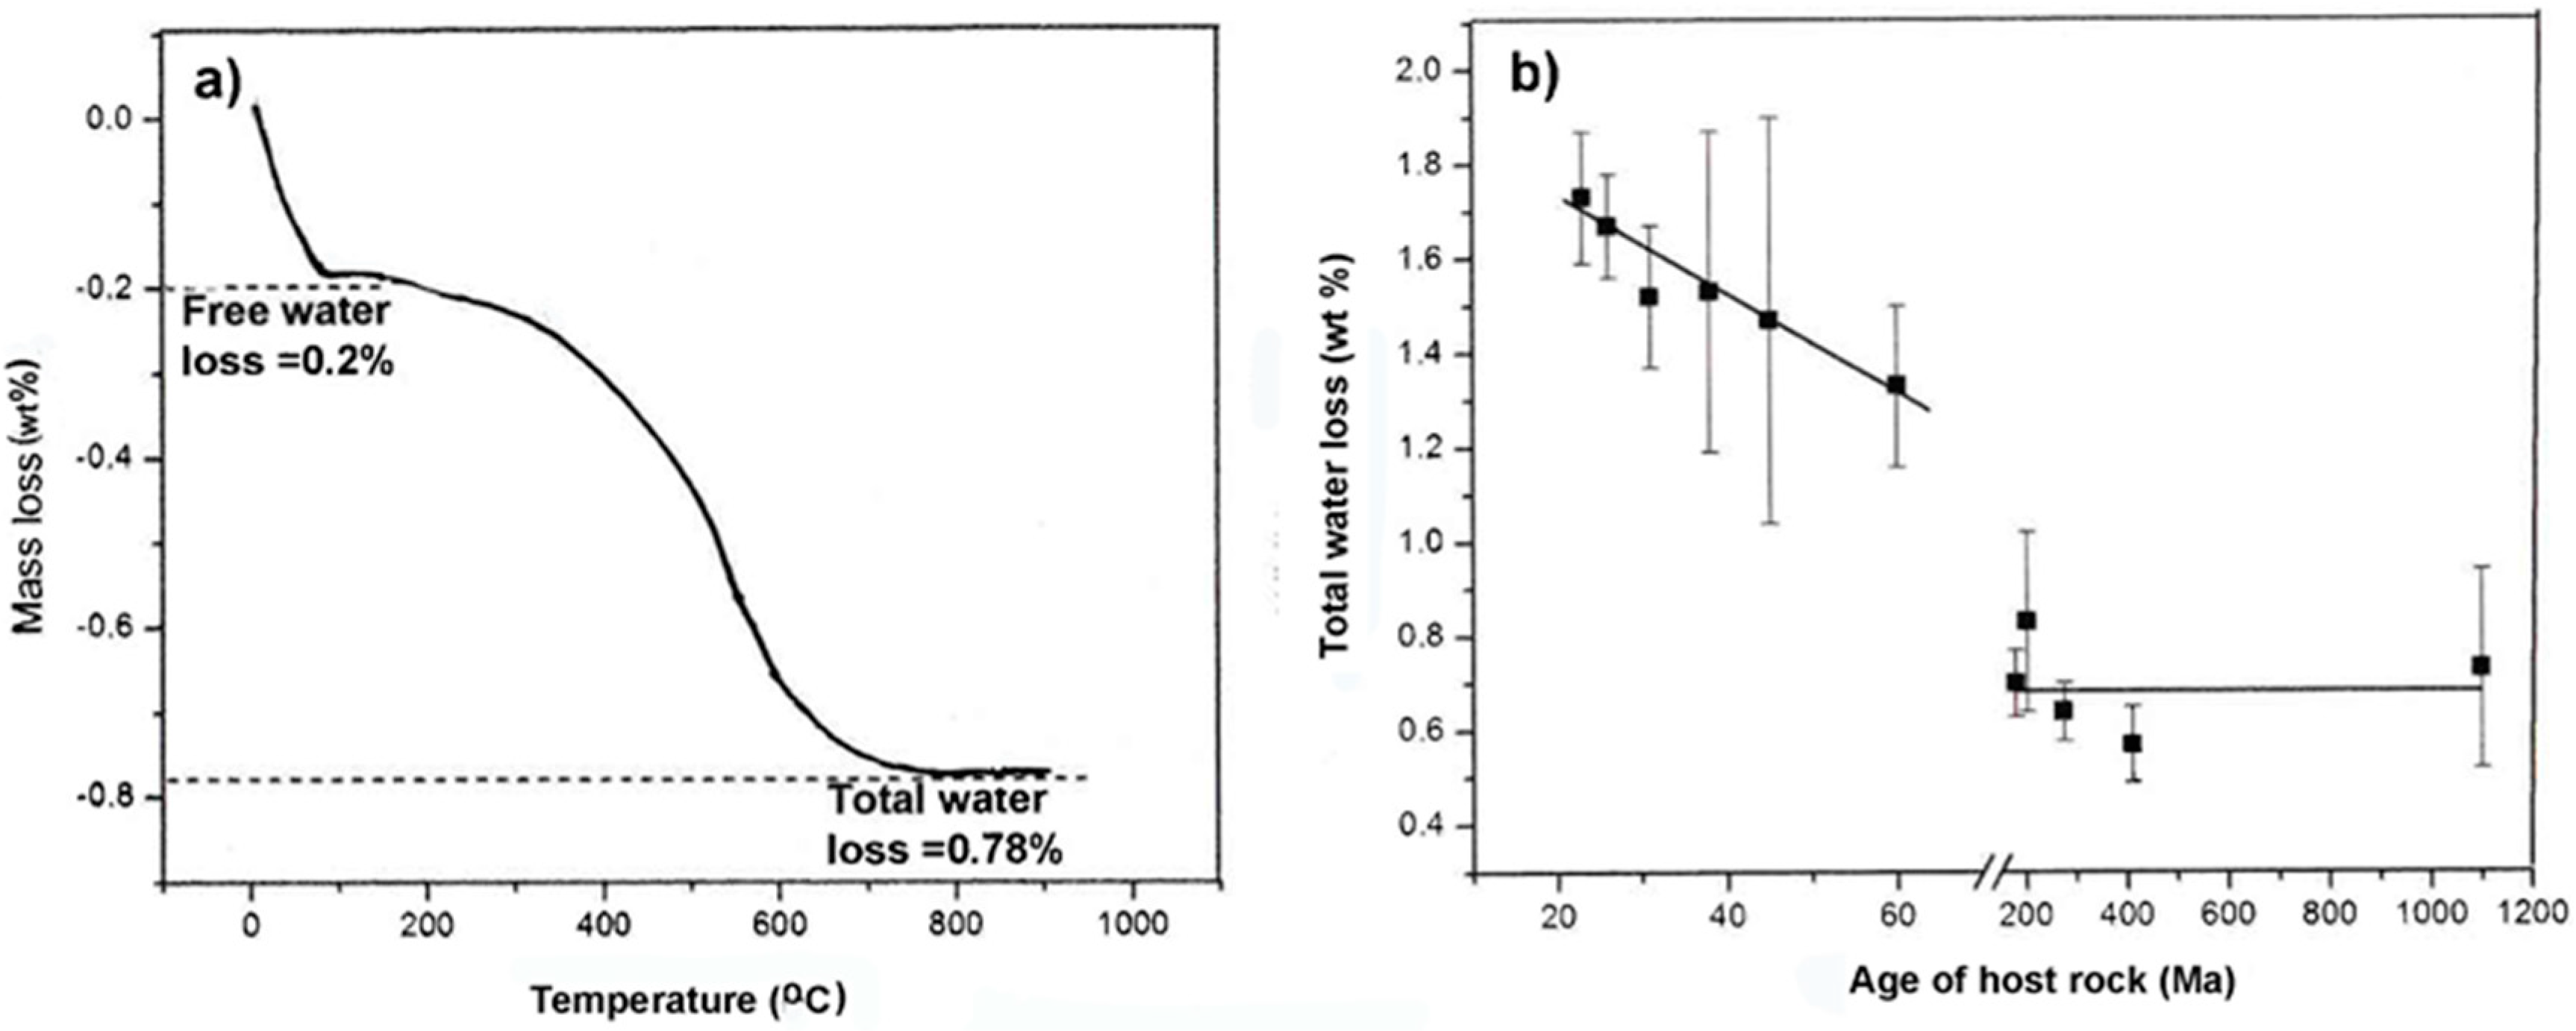
Figure 6.
(a) An expanded examination of the cristobalite (Cr) and a possible tridymite signal. (b) XRD diffractogram of a 14-year-old silica gel and a fresh gel control. The aged gel shows small development peaks that were attributed to tridymite and cristobalite and an unidentified intermediate signal (In) (after Moxon [52]).

Figure 7.
(a) Mean crystallite size as a function of age. The plot divides into four age regions: (A) an initial linear growth found in agates from host rocks aged up to 60 Ma: (B) over the next 210 Ma there is minimal growth: (C) growth restarts for 30 Ma: (D) after 300 Ma there is a final cessation of growth up to 1100 Ma. (b) Mean moganite content as a function of age. Agates formed from host rocks <60 Ma show a linear decline in the moganite content and little change in the older hosts. The apparent outliers (shown in red) suggest agate formation long after the host age. Agate regions: (1) Yucca Mt., USA; (2) Mt. Warning, Australia; (3) Chihuahua, Mexico; (4) Cottonwood Springs, USA; (5) Washington, USA; (6) Las Choyas, Mexico; (7) Khur, Iran; (8) BTVP, Scotland; (9) Mt Somers, New Zealand; (10) Rio Grande do Sul, Brazil; (11) Semolale, Botswana; (12) Nova Scotia, Canada; (13) Agate Creek, Australia; (14) Thuringia, Germany; (15) Derbyshire, England; (16) East Midland Valley, Scotland; and (17) West Midland Valley, Scotland. A further 8 regions from host rocks aged between 430 and 3750 Ma are not shown as minimal change occurs after 400 Ma. Error bars show one standard deviation. XRD details: Grain size < 10 μm using a Brucker D8 diffractometer in the reflection mode, crystallite size was based on the main (101) quartz reflection recorded on scans 17° < 2θ < 30° with step size of 0.01° 2θ and a scan speed of 10 s/step. The changed details for the moganite determination were 17° < 2θ < 25°, step size of 0.02° 2θ and a scan speed of 20 s/step. The moganite and quartz peak areas were determined by fitting unconstrained Lorentzian functions using the Advanced Fitting Tool in “Origin” Moganite content has been taken as the proportion (in %) of moganite peak area/total area with an estimated resolution of ±2%. Full data is given in Moxon and Carpenter [50].
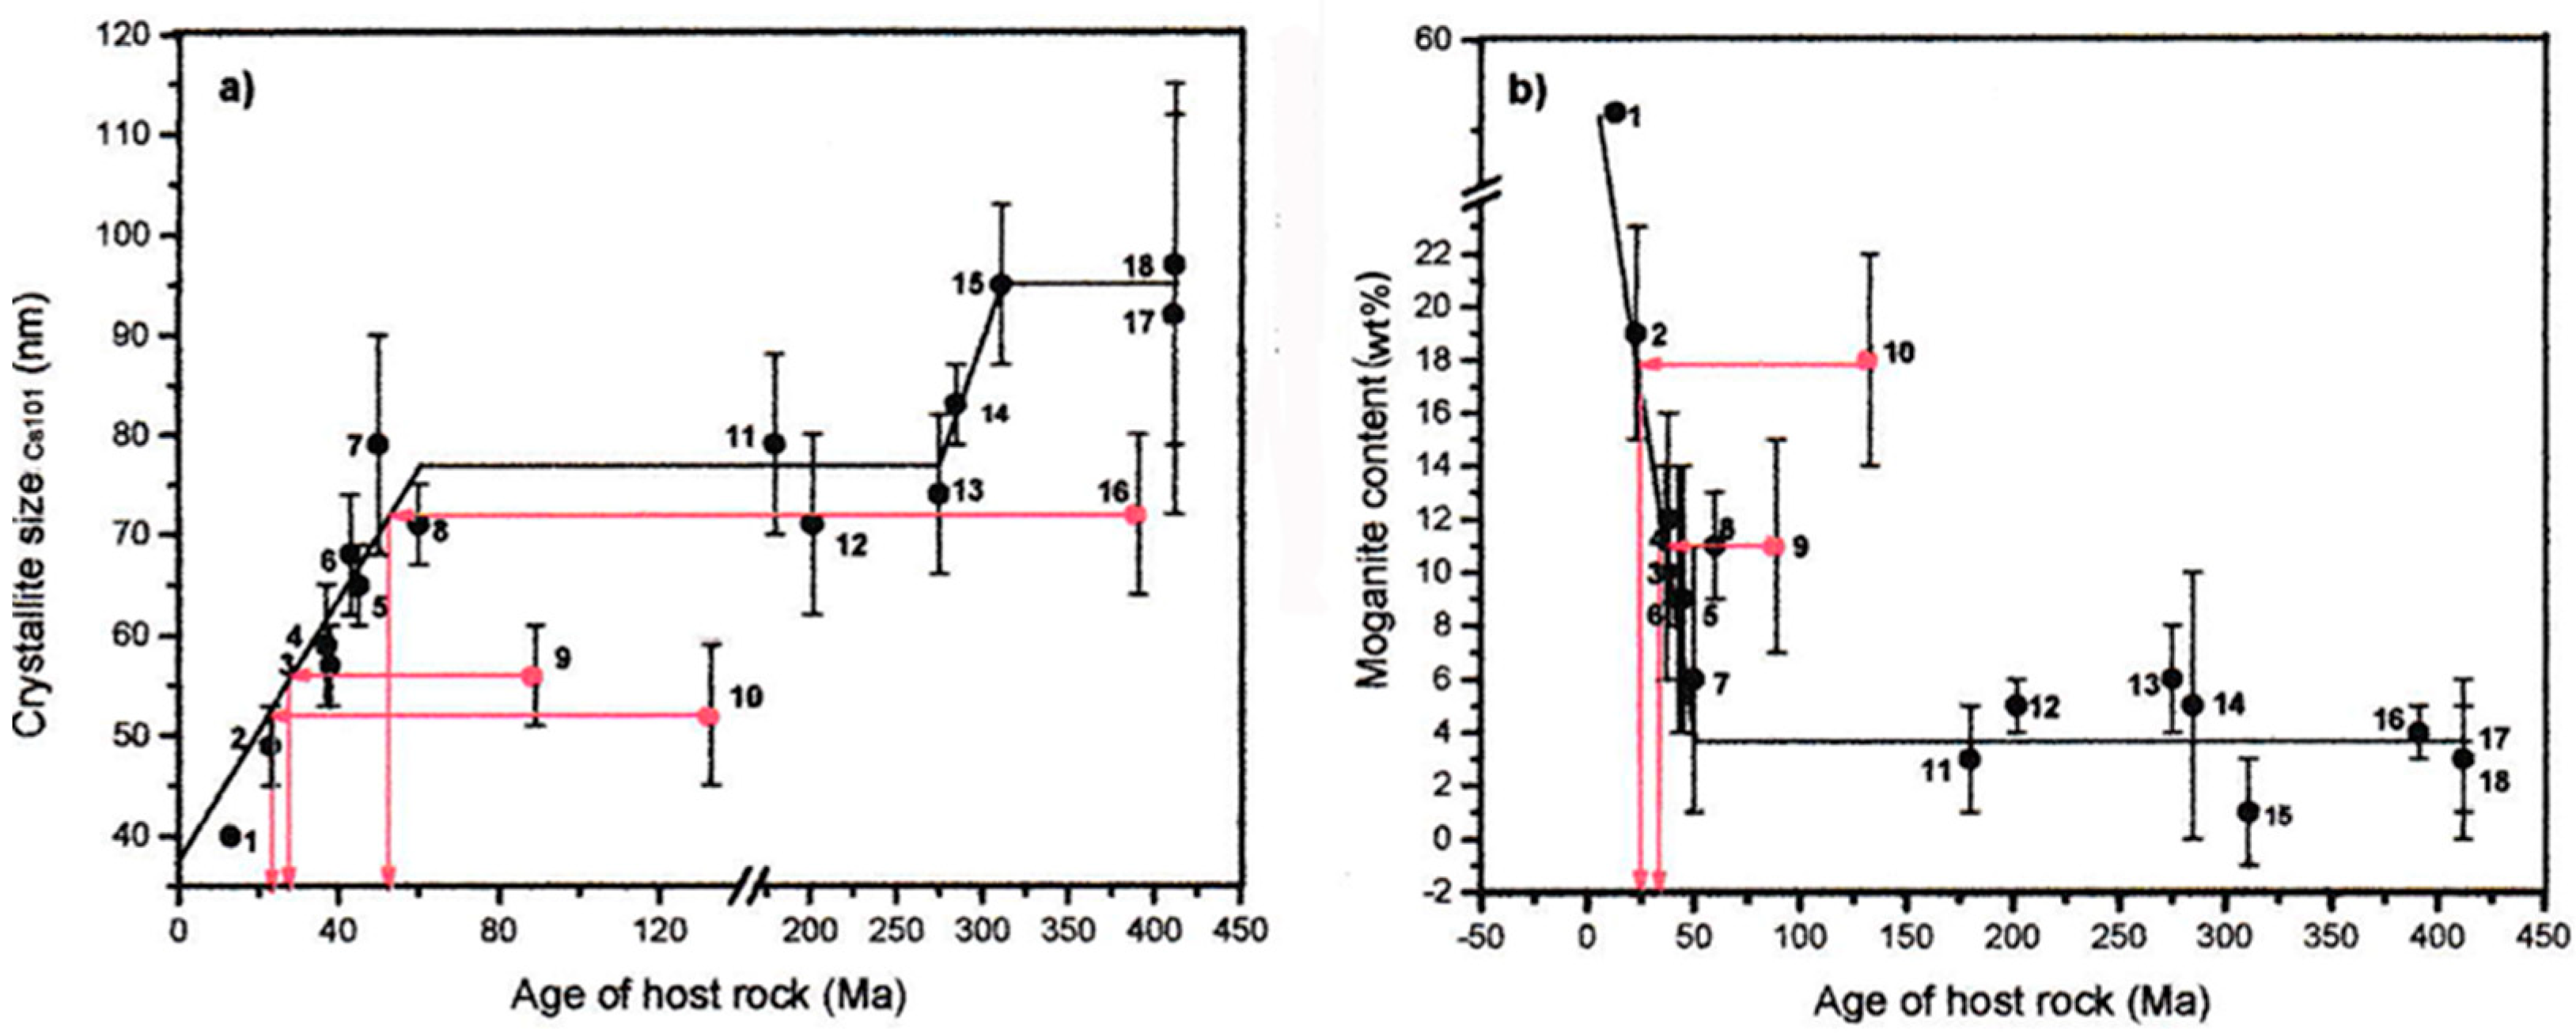
Figure 8.
(a,b) Two Brazilian agates showing similar horizontal banding in the infiltration canals. Scale bar = 1 cm.
Figure 8.
(a,b) Two Brazilian agates showing similar horizontal banding in the infiltration canals. Scale bar = 1 cm.

Figure 9.
(a,b) Botswana agate showing an apparent large wall lining layer. However, a thin section (b) shows that there are 3 distinct growth formations with (x) a thin actual wall contact layer that is 0.2 mm; (y) the rest of the brown layer and (z) the black and white agate bulk.
Figure 9.
(a,b) Botswana agate showing an apparent large wall lining layer. However, a thin section (b) shows that there are 3 distinct growth formations with (x) a thin actual wall contact layer that is 0.2 mm; (y) the rest of the brown layer and (z) the black and white agate bulk.

Figure 10.
(a–d) The four monochrome micrographs are thin sections of four Brazilian agates with wall lining and horizontal banding, these are labelled as II (a–d). There are two thick sections with the original banding (Ic, Id). The discrete layers of horizontal bands are separated from the wall lining sections by the white dividing space. In Brazil slab II (a), there are two initial wall lining deposits, labelled x and y: these are reduced in the horizontally banded section. The thickness of the initial wall lining layer in Brazil slab II (b) shows tapering in the base of the horizontally banded section. The continuous sheaf-like growth (x) from the wall lining also coats the gap at the edge of the horizontally banded layers. Brazil slab (c) shows the initial wall lining deposit is absent in the horizontally banded layers. Brazil slab (d) demonstrates four separate wall lining deposits line the cavity wall. Scale of thin sections = 2 cm at the maximum width.

Figure 11.
SEM micrographs showing the development in clear bands: (a) Rio Grande do Sul, Brazil 135 Ma, (52 nm) 135 Ma; (b) Isle of Mull, Scotland, 60 Ma (72 nm); (c) Agate Creek, Queensland, Australia 275 Ma (74 nm); and (d) Ethiebeaton Quarry, Scotland 412 Ma (96 nm). The stated age is the host age and crystallite size is the mean crystallite size for that particular region. The properties of the Brazilian agate, including crystallite size, indicate a formation age of ~26 Ma. SEM details: small agate slices were coated with gold and examined in a JEOL 820 SEM. The experimental conditions used a 20 kV accelerating voltage with a current of 1 nA.

Figure 12.
(a–d) are the white banded regions from the same agates shown in Figure 11: (a) Rio Grande do Sul, Brazil 135 Ma, (52 nm) 135 Ma. The black lines mark a faint white band; (b) Isle of Mull, Scotland, 60 Ma (72 nm); (c) Agate Creek, Queensland, Australia 275 Ma (74 nm); (d) Ethiebeaton Quarry, Scotland 412 Ma (96 nm). The stated age is the host age and crystallite size is the mean crystallite size for that particular region. The properties of the Brazilian agate, including crystallite size, indicate a formation age of ~26 Ma. SEM details as given in Figure 11.

Figure 13.
Cristobalite (Cr) identified in agates from Brazil (a) and Iran (b). The stated ages are the host ages but the properties of Brazilian agate suggest an agate age of 25–30 Ma.
Figure 13.
Cristobalite (Cr) identified in agates from Brazil (a) and Iran (b). The stated ages are the host ages but the properties of Brazilian agate suggest an agate age of 25–30 Ma.


Table 1.
Trace Analysis of Kauai Basalt Taken from Boreholes at Various Depths.
| Analysis of Rock Samples | Water Analysis from the Rock | ||||||||||||
|---|---|---|---|---|---|---|---|---|---|---|---|---|---|
| Hole | Depth | SiO2 | Fe2O3 | Al2O3 | MgO | Na2O | H2O | SiO2 | Fe3+ | Al3+ | Mg2+ | Na+ | pH |
| No | m | (wt%) | (ppm) | ||||||||||
| 1 | 0.6 | 5.7 | 40.2 | 25.6 | 0.65 | 0.04 | 18.6 | 2.9 | 0.00 | 0.11 | 1.9 | 11 | 4.6 |
| 6 | 9.5 | 21.5 | 30.7 | 25.1 | 1.0 | 0.06 | 14.6 | 2.5 | 0.00 | 0.12 | 1.5 | 8.5 | 4.7 |
| 8 | ⁻ | 45.0 | 4.3 | 11.8 | 12.0 | 3.1 | 3.1 | 42 | 0.00 | 0.06 | 11 | 21 | 7.6 |
Table 2.
Cation Concentrations in Agate and Host in Samples from Mexico, Brazil, and Scotland.
| Agate Source | Country | Host Rock Type | Age of Host * (Ma) | Fe3+ | Al3+ (ppm) | Mg2+ | Na+ |
|---|---|---|---|---|---|---|---|
| Chihuahua | Mexico | Andesite Agate | 38 - | 6695 215 ** | nd 925 ** | 5460 151 ** | 25,000 320 ** |
| Rio Grande do Sol | Brazil | Basalt Agate | 135 - | 14,700 137 | nd 54 | nd 10 | 19,000 140 |
| Montrose | Scotland | Andesite Agate | 412 - | 33,400 70 | nd 456 | nd 15 | 23,000 230 |
| Ardownie Quarry | Scotland | Andesite Agate | 412 - | 37,300 36 | nd 232 | nd 18 | 27,000 210 |
Publisher’s Note: MDPI stays neutral with regard to jurisdictional claims in published maps and institutional affiliations. |
© 2020 by the authors. Licensee MDPI, Basel, Switzerland. This article is an open access article distributed under the terms and conditions of the Creative Commons Attribution (CC BY) license (http://creativecommons.org/licenses/by/4.0/).
Share and Cite
MDPI and ACS Style
Moxon, T.; Palyanova, G. Agate Genesis: A Continuing Enigma. Minerals 2020, 10, 953. https://doi.org/10.3390/min10110953
AMA Style
Moxon T, Palyanova G. Agate Genesis: A Continuing Enigma. Minerals. 2020; 10(11):953. https://doi.org/10.3390/min10110953
Chicago/Turabian StyleMoxon, Terry, and Galina Palyanova. 2020. "Agate Genesis: A Continuing Enigma" Minerals 10, no. 11: 953. https://doi.org/10.3390/min10110953
Note that from the first issue of 2016, this journal uses article numbers instead of page numbers. See further details here.