Article

Lithium-Rich Claystone in the McDermitt Caldera, Nevada, USA: Geologic, Mineralogical, and Geochemical Characteristics and Possible Origin

by
Stephen B. Castor
and
Christopher D. Henry
*
Nevada Bureau of Mines and Geology, University of Nevada, Reno, NV 89557, USA
*
Author to whom correspondence should be addressed.
Minerals 2020, 10(1), 68; https://doi.org/10.3390/min10010068
Submission received: 23 November 2019 / Revised: 23 December 2019 / Accepted: 9 January 2020 / Published: 15 January 2020
(This article belongs to the Special Issue Evolution of Li-rich Brines)

Abstract

:
Lithium deposits in tuffaceous sediments of the McDermitt caldera constitute possibly the world’s largest Li clay resource, yet their characteristics and origin are not established. The 40 × 25 km McDermitt caldera collapsed during the eruption of ~1000 km3 of a 16.4 Ma, zoned peralkaline to metaluminous tuff; minor caldera magmatism ceased by 16.1 Ma. About 200 m of sediments mostly composed of glass from regional pyroclastic eruptions accumulated in the caldera until about 15.7 Ma. Closed hydrologic system diagenesis (CHSD) altered the tuffaceous sediments to a consistent vertical mineral zonation of clay, analcime, K-feldspar, and albite. Entire sedimentary sections in the southern and western parts of the caldera basin have ≥1500 ppm Li. Lithium-rich intervals are dominantly claystone. The most thoroughly studied deposit is a laterally continuous, ~3000 ppm Li zone in the lower sedimentary section that also has high K, Rb, Mo, As, and Sb (and partly Mg and F). Lithium occurs as an illitic clay (tainiolite?). The overlying, upper sedimentary section averages <2000 ppm Li which resides in smectite (hectorite). A transitional zone has variably mixed smectite–illite clay and averages ~2000 ppm Li. An 40Ar/39Ar age of ~14.9 Ma on authigenic K-feldspar in the illite zone is ~1.2 Ma younger than the 16.1 Ma end of magmatism in the caldera, which mitigates against a simple hydrothermal origin. Closed hydrologic system diagenesis was essential to Li mineralization, but Li budget calculations suggest a source of Li in addition to the tuffaceous sediments is required. This additional source could be Li originally in highly enriched magma that entered the diagenetic system through either (1) Li in magma exsolved into a hydrous volatile phase during eruption. The Li-rich volatile phase coated glass shards or was trapped in pumice and was quickly leached by surface or groundwater upon deposition in the caldera. (2) Residual magma immediately following ash-flow eruption and caldera collapse generated Li-rich hydrothermal fluids that mixed with meteoric water in the closed caldera basin, generating a hybrid diagenetic fluid. The hydrothermal fluid and hybrid diagenetic fluids would have existed only during initial basin sedimentation between about 16.4 and 16.1 Ma.

1. Introduction

Lithium, essential to Li-ion batteries and electric vehicles, is mostly produced from brines, which are also the largest identified resource [1,2,3,4]. Lithium-bearing pegmatites are also a significant source, were the primary source until a few decades ago, and are generally considered the second largest resource [2,4]. In contrast, Li clay deposits, such as though occurring in the McDermitt caldera, are called “sediment-hosted deposits” [4] or “unusual lithium deposits” [2] and interpreted to represent “less than 3% of global lithium resources” [4]. These deposits are also characterized as “hectorite deposits” [2,3,4] because published work only identified the Li-smecite hectorite (Na0.3(Mg,Li)3Si4O10(OH)2) [5,6]. This depiction is unfortunate because we show here that Li-illite that is chemically similar to the Li-mica tainiolite (KLiMg2Si4O10F2) is the primary Li mineral in the most Li-rich deposits at McDermitt. A Li-smectite is present in rock with lower Li. Our new work and recent resource estimates [7] show that published grade and resource estimates are significantly low. Nevertheless, the McDermitt deposits are ranked the world’s fifth largest in situ Li resource at 2.0 Mt Li [1].
Lithium clay deposits of the McDermitt caldera are indeed a huge potential resource. The single, most explored Thacker Pass deposit has a measured, indicated, and inferred resource of 533 Mt at 0.29% Li, or more than 1.5 Mt Li [7]. The Thacker Pass deposit covers <1% of the surface area of tuffaceous sediments in the McDermitt caldera, and these sediments are interpreted to have equal “high potential” for Li mineralization [8]. Although this assessment undoubtedly overstates the potential for Li mineralization, it nevertheless suggests the possible magnitude, and work on the deposits is progressing towards mining [7]. Although the McDermitt Li mineralization was first recognized in the 1970s, its origin is not established. Recent publications simply offer speculation “probably similar to that of the original hectorite discovery at the Hector Mine near Barstow, California” [2].
In pioneering work [5,6], mineralization was proposed to have resulted from diagenesis: leaching of Li from rhyolitic volcanic glass in intra-caldera sedimentary deposits and concentration in K-feldspar-rich alteration zones. Although [5,6] did not use the term, the process they discuss is essentially “closed hydrologic system diagenesis” (CHSD) [9,10,11,12]. Proposed mechanisms of low-temperature formation of Li-rich brines in closed basins are similar [13].
More recently, Benson et al. [14] speculated about more complex and partly hydrothermal origins in the McDermitt caldera. (1) Li was leached from solid rhyolite by meteoric water and deposited in the closed caldera basin. (2) Li from degassing magmatic fluids (generated from the more than 3500 Mt Li thought to be originally present in the McDermitt Tuff magma [14]) generated a hydrothermal fluid that interacted with meteoric water. (3) This composite magmatic–meteoric water formed a “near-neutral, low-T hydrothermal system characterized by clinoptilolite-K feldspar alteration.” The Li-smectite and illite formed in this alteration zone, which was (4) “focused above caldera ring fractures where magmatic fluid influx was maximized.” Part 1 of the Benson et al. [14] process is similar to that proposed by Glanzman and Rytuba [5], but parts 2, 3, and 4 are distinctly different.
Our geologic, mineralogical, and geochemical work demonstrates that the intracaldera tuffaceous sediments did indeed undergo CHSD, which played a significant role in generating Li mineralization. However, Li budget calculations also suggest that the sediments may not have contained sufficient Li to provide all that exists in deposits in the caldera and that another source, possibly including a hydrothermal input, is required.

History of Exploration and Development

The Thacker Pass Project (formerly Kings Valley Lithium Project) is in the McDermitt caldera in north-central Nevada and southern Oregon (Figure 1). Lithium-rich sediments were identified in the western part of the caldera by Chevron Minerals Inc. during condemnation drilling for U in 1977 and evaluated in the early 1980s. Research by the US Geological Survey expanded on the exploration work and extended mineralization into the northern part of the caldera [6]. Western Lithium Corp. (now Lithium Nevada Corp. which is a wholly owned subsidiary of Lithium Americas Corp.) evaluated the Chevron deposits beginning in 2007 and by 2011 had drilled more than 200 core holes in the most accessible Thacker Pass deposit (formerly stage 1 deposit); they also drilled 38 holes in the South lens (formerly stage 2 deposit) to the north [7,15,16]. Lithium Nevada has three other areas in the western part of the caldera, and Jindalee Resources [17,18] has encountered significant Li in the northwestern part of the caldera. Only the eastern part of the caldera has not been explored, although sparse surface anomalies suggest Li mineralization is also present there.

2. Methods

This paper presents results from geologic studies done over many years and laboratory work done in 2010–2011 as part of consulting to determine mineral assemblages in core samples from the Thacker Pass Li deposit in the McDermitt caldera. The mineralogical work, performed for Western Lithium Corporation (now Lithium Nevada), included correlation with unpublished company chemical data.
On the basis of core examination and Lithium Nevada Corp. drill hole logs, 104 drill hole samples were selected for powder X-ray diffraction (XRD) analysis and 32 samples for petrographic examination. The samples came from six drill holes arrayed across the Thacker Pass deposit (WLC holes 43, 62, 65, 67, 69, and 79) representing an area about 1200 m in diameter. The samples included both hand samples of core and bulk samples from intervals 0.3 to 2.6 m thick that were previously chemically analyzed for Lithium Nevada during deposit evaluation. The XRD analysis was also performed on a single hand sample collected from a surface pit. Overall, the samples were selected to determine the mineral assemblages and their distribution in and around the deposit.
All samples were scanned on Philips automated XRD equipment at the University of Nevada, Reno, NV, USA. Data were acquired on a PC using MDI Datascan software and processed using Jade software with ICDD PDF minerals database. Most clay-rich hand samples were dried at 80 °C prior to analysis to enable pulp preparation. Selected clay-rich samples were put in a bell jar at constant 52% humidity overnight and partially rescanned and then fumed with ethylene glycol in a bell jar for at least 10 h and again rescanned to determine expansive properties to aid clay mineral identification. The XRD scans were initially run at 2θ = 4–50°, scans of glycolated clay covered 2θ 4–28°, and some clay-rich samples were rescanned at higher 2θ (50–70°) to further define the clay mineral structure.
Thin sections were examined using standard petrographic practices under transmitted and reflected light with a Nikon Optiphot polarizing microscope at the Nevada Bureau of Mines and Geology, University of Nevada, Reno, NV, USA. All samples were impregnated with epoxy prior to thin section preparation.

2.1. Chemical Analyses

Chemical information reported below was obtained from Lithium Nevada drill-hole sample analyses for which contents of Li and other elements were obtained using four-acid “near total” digestion followed by ICP-MS and ICP-AES analyses by ALS Chemex. Almost all of the chemical data were from the Thacker Pass area, but some Li data came from an earlier report by the US Geological Survey [5] and from Chevron Minerals. As of June 2011, Lithium Nevada had drilled and assayed 202 core holes in the Thacker Pass area with a total depth of 19,259 m, producing a total of 11,157 samples [16].
In addition to assays from Lithium Nevada, chemical analyses were obtained of 28 samples of variably fresh to altered tuffaceous sediments in the McDermitt caldera (Table S1). Analyses were done by XRF (major oxides) and ICP-MS (trace elements by four acid leach) at ALS Chemex (methods ME-XRF06 and ME-MS61).

2.2. 40Ar/39Ar Dating

Sanidine, anorthoclase, or plagioclase from tephra were concentrated from crushed, sieved samples by standard magnetic and density techniques, then leached with dilute HF to remove adhering matrix, alteration products, or other non-feldspar material. All samples were hand-picked under a binocular microscope (Carl Zeiss, Jena, Germany). Samples and neutron flux monitor Fish Canyon Tuff sanidine were irradiated in Al disks at the USGS TRIGA reactor in Denver, CO, USA. Individual feldspar crystals were fused with a CO2 laser at 3–5 W. Extracted gases were analyzed on an ARGUS VI multi-collector mass spectrometer (Thermo Scientific, Manchester, UK). All ages were calculated relative to an age of 28.201 Ma [33,34] on Fish Canyon Tuff sanidine. 40Ar/39Ar dating also provided the K/Ca ratio of the analyzed material because irradiation converts some 37Ca to 37Ar. The K/Ca ratio of feldspars was generally consistent for related tuffs or rhyolites and was a highly useful secondary correlation tool. Table S2 contains full analytical data.

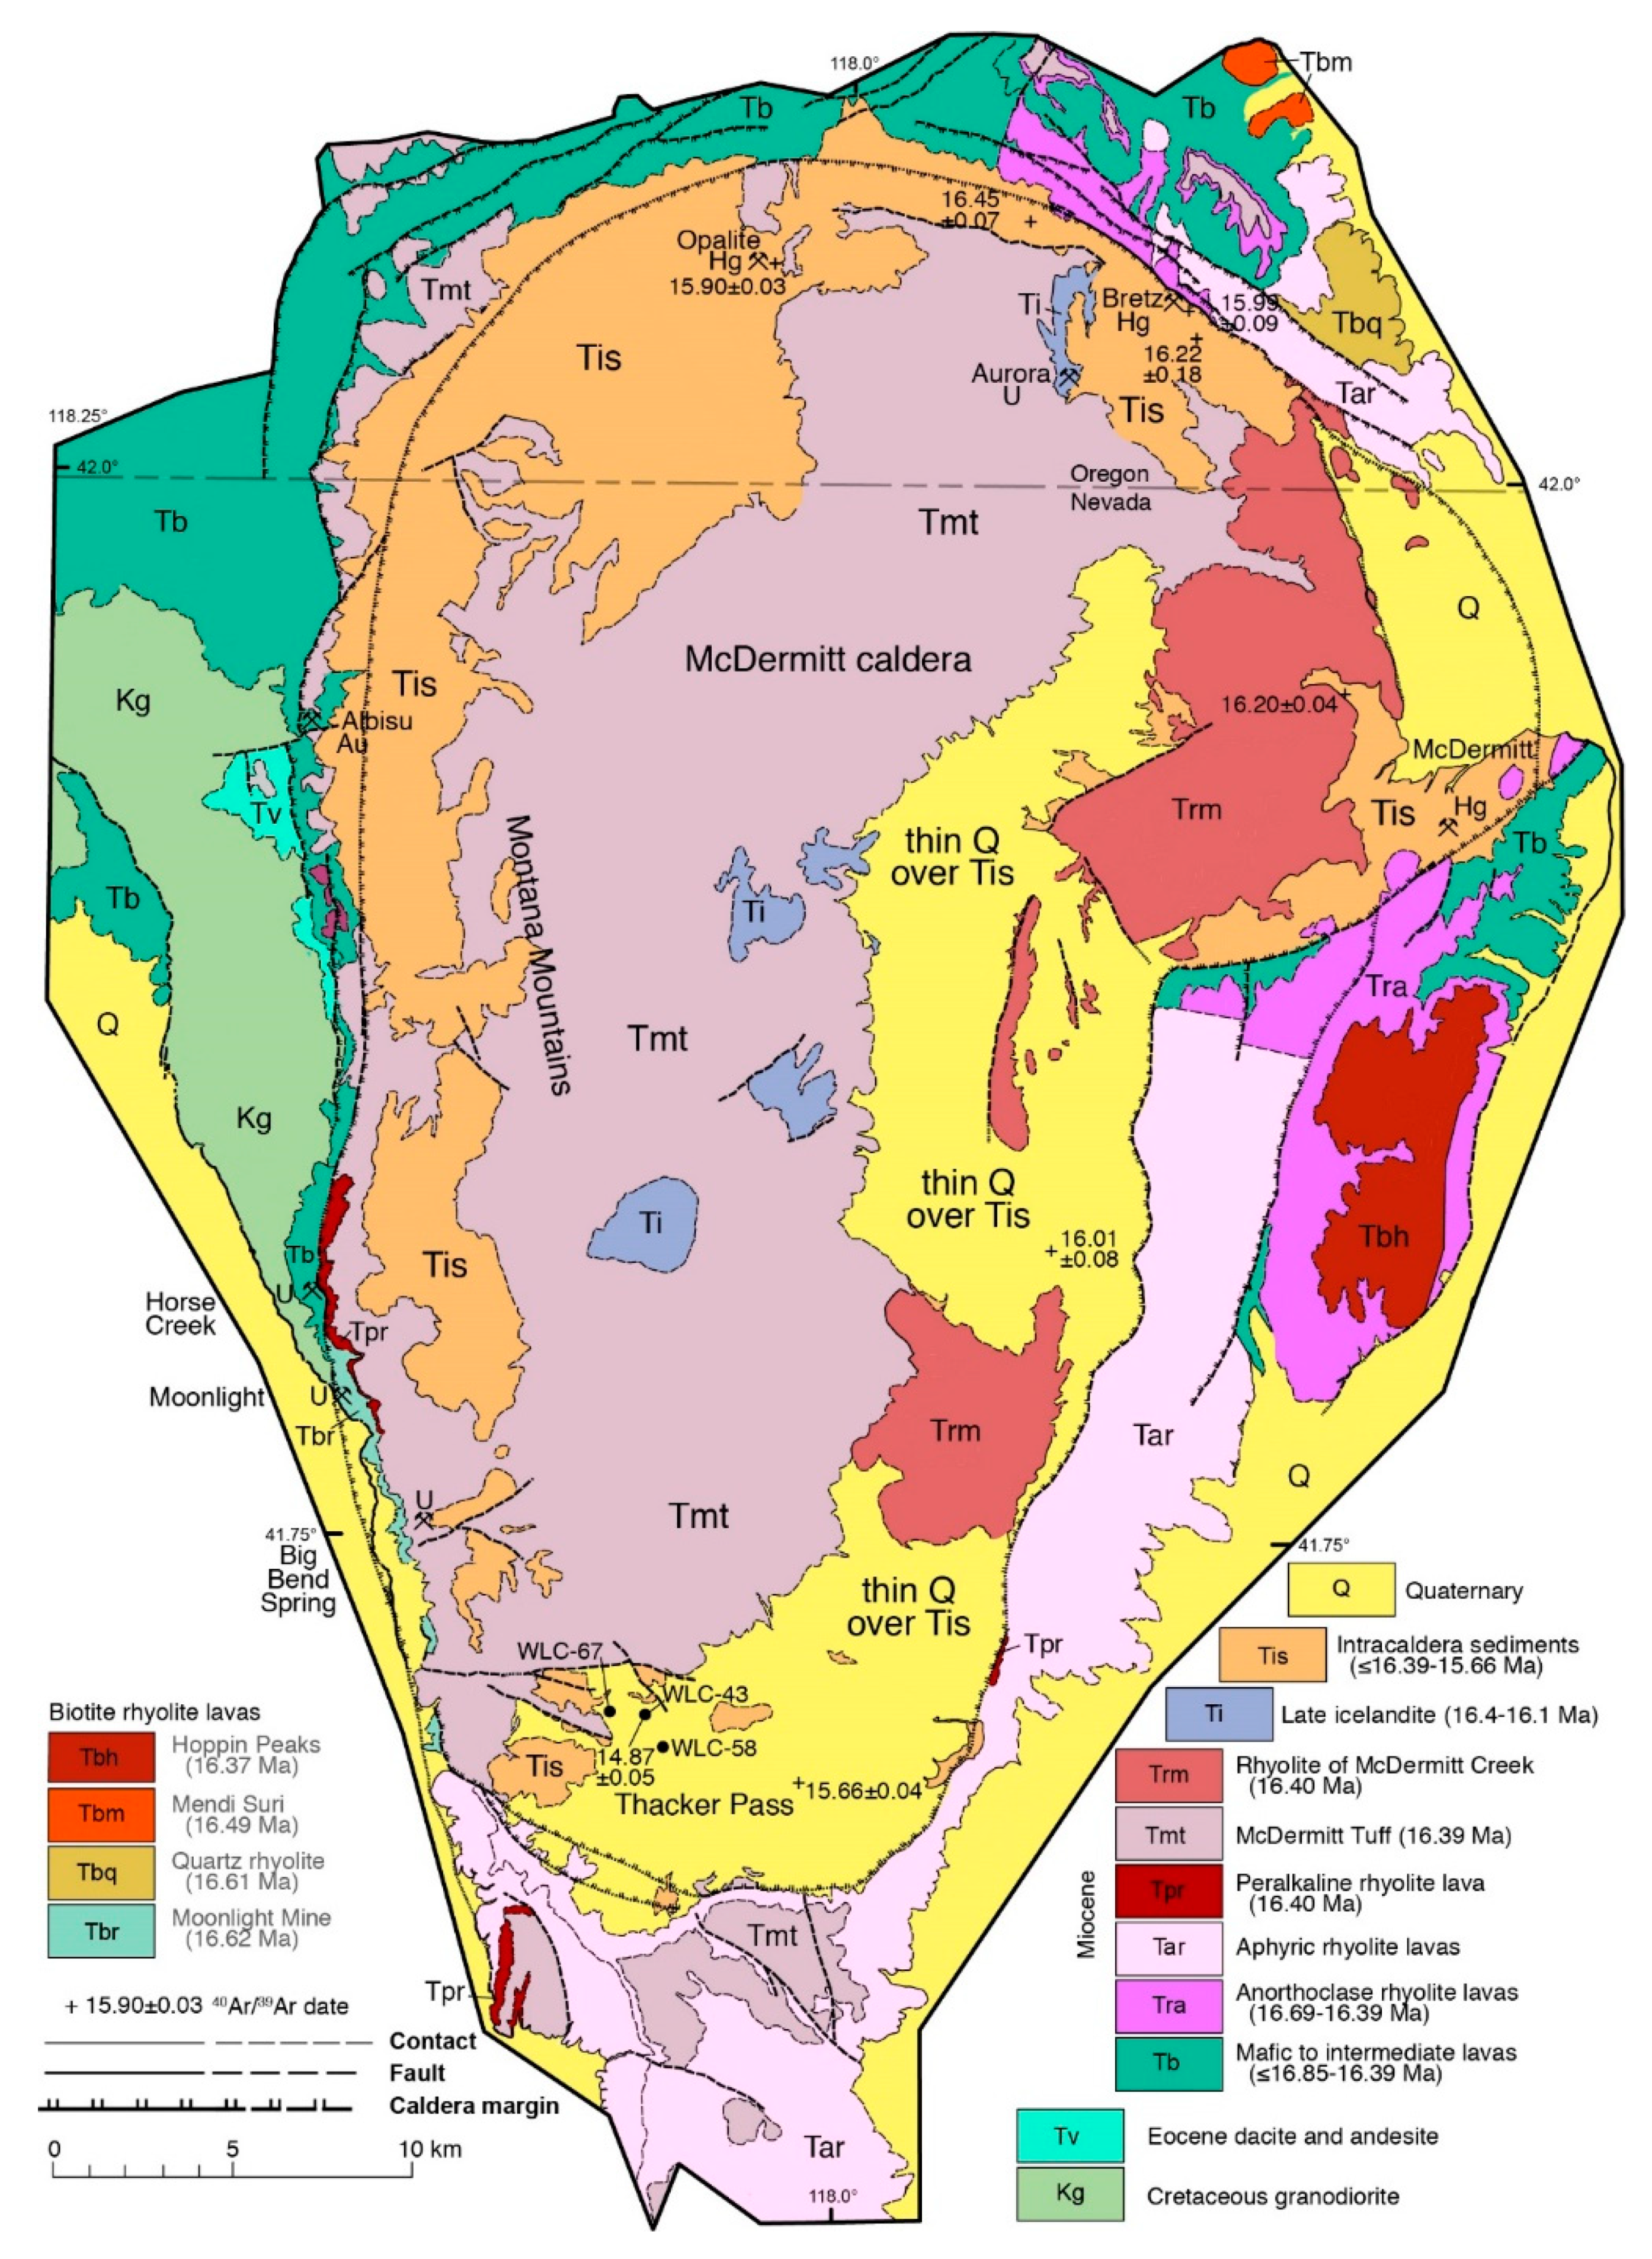
3. Geologic Setting and Evolution of the McDermitt Caldera

3.1. Magmatic and Structural Evolution

The McDermitt caldera formed during eruption ca. 1000 km3 of the 16.39 ± 0.02 Ma (n = 3) McDermitt Tuff which is strongly zoned from peralkaline, aphyric, high-SiO2 rhyolite (comendite) to metaluminous, abundantly anorthoclase-phyric, trachydacite or Fe-rich andesite (icelandite) (Table 1) [19]. The caldera is one of several that formed during the initial development of the Yellowstone hotspot and Columbia River basalt volcanism in northern Nevada and southeastern Oregon (Figure 1) [19,20,21,22].
The caldera formed in an area that had undergone two small-volume episodes of Eocene intermediate volcanism at 47 and 39 Ma and major middle Miocene volcanism that led continuously to caldera formation (Figure 2; Table 1) [19]. Eruption of Steens Basalt, the oldest Miocene activity, began before 16.69 Ma, probably at about 16.85 or 16.75 Ma [20,35]. Exclusively mafic magmas erupted initially, becoming more silicic with time. Rhyolite lavas erupted as early as 16.69 ± 0.02 Ma, contemporaneous with upper parts of Steens Basalt, and the proportion of rhyolite increased steadily up to eruption of the McDermitt Tuff. Pre-caldera silicic activity was almost entirely effusive and compositionally diverse, including metaluminous to variably peralkaline rhyolite lavas. The oldest rhyolites were mildly peralkaline, sparsely anorthoclase-pyric rhyolite and peralkaline, aphyric rhyolite. Metaluminous to peraluminous, biotite rhyolite lavas, and domes were emplaced around what is now the caldera wall in three episodes at 16.62–16.61, 16.49, and 16.38 to 16.36 Ma. A voluminous lava or several indistinguishable lavas of quartz–sanidine–sodic amphibole porphyritic rhyolite erupted around what is now the southern wall of the caldera at 16.40 Ma. Variably peralkaline ash-flow tuffs from nearby calderas are interbedded with the pre-McDermitt caldera rocks. The McDermitt caldera formed in accreted island arc terrane or transitional crust rifted from the North American craton (Figure 1).
Caldera collapse generated an irregularly keyhole-shaped, 40 × 30 to 22 km, caldera basin (Figure 2). Approximately 50% to 85% of erupted McDermitt Tuff ponded within the caldera. The base of intracaldera tuff is exposed only along the western side where it is 610 m thick, and total thicknesses over the rest of the caldera may locally be greater. Total caldera collapse was no more than about 1 km.
The caldera underwent post-collapse resurgence between about 16.4 and 16.1 Ma that uplifted intracaldera McDermitt Tuff into an irregular, north-elongate dome where the tuff is exposed (Figure 2). Resurgence was driven by intrusion of icelandite magma, which also erupted from two major vents and as widespread lavas. Youngest caldera magmatism is about 16.1 Ma, the age of an icelandite lava that overlies intracaldera McDermitt Tuff. Magmatism ceased at that time except for some stratigraphically late but poorly dated basaltic lavas that overlie tuffaceous sediments in the southern part of the caldera.

3.2. Intra-Caldera Tuffaceous Sediments

Tuffaceous sediments, the host rock for Li mineralization (Figure 3A), accumulated in the caldera basin starting immediately after initial collapse and lasting at least until 15.66 ± 0.04 Ma based on our new 40Ar/39Ar dates (Table 2). Sedimentation undoubtedly began before resurgence and certainly continued after it. The sediments occupy an irregular, donut-shaped area surrounding the dome. Because some sedimentation postdated resurgence, the deposits are commonly referred to as “moat sediments” [5,6,36].
The sedimentary section progresses upward from coarse, commonly silicified conglomerate and breccia up to about 15 m thick at the base of the unit near the western margin of the caldera to well-bedded, planar- to cross-laminated, tuffaceous sandstone, claystone, mudstone, pyroclastic-fall deposits (tephra), and minor conglomerate and fossiliferous limestone totaling as much as 200 m thick and distributed throughout the caldera.
The lower conglomerate and breccia, which are resistant and well exposed, are poorly sorted with angular to sub-angular clasts up to 1 m diameter of McDermitt Tuff, pre-caldera volcanic rocks particularly biotite rhyolite, and lesser granite. The conglomerate and breccia probably resulted from erosion of the nearby caldera wall soon after collapse.
The thick, overlying tuffaceous sediments generally are weakly indurated and easily weathered and eroded. They are sparsely exposed in a few canyons and in mine and exploration workings in the northern part of the caldera, where they are locally silicified by hydrothermal alteration, but poorly exposed to commonly covered by Quaternary fan deposits elsewhere, especially around Thacker Pass in the south and along the eastern part of the caldera (Figure 2). Where exposed, the sediments occur mostly as float and commonly form light and dark bands on aerial photographs that correspond with varying densities of sagebrush and other vegetation.
Before diagenesis, the deposits consisted of glass shards, fine pumice, and mineral and rock fragments (Figure 3B). Although glass is commonly preserved in tephra, the sediments mostly are altered to clay minerals, zeolites, and feldspar ([5]; this study) and are locally silicified to opal or chalcedony (Figure 3C) [39,40,41,42]. Petrified wood, diatoms, fish, and leaves occur in tuffaceous sediments and unidentified shells in limestone [5,39,43,44].
That the clay-rich sediments are altered pyroclastic deposits is additionally demonstrated by the common presence of quartz of pyroclastic origin. Thin sections of mudstone samples show fine, disseminated, mostly angular to subrounded dipyramids or dipyramidal prisms aligned parallel to bedding. The quartz dipyramids are commonly shattered (Figure 3D), consistent with rhyolitic pyroclastic origin [45].
The sediments are thickest in the northern caldera where drilling encountered as much as 210 m at the Aurora U deposit [40] and in the southern caldera at Thacker Pass where drilling by Western Lithium Corporation encountered as much as 190 m in WLC58 [7] (Figure 2 and Figure 4). No more than ca. 120 m are preserved in the western rim, where the upper sedimentary section was completely removed.
The 40Ar/39Ar dates of seven pyroclastic-fall or reworked fall deposits distributed around most of the caldera range from 16.45±0.07 Ma, indistinguishable from the age of McDermitt Tuff, to 15.66 ± 0.04 Ma (Table 2). Correlating the poorly exposed sediments around the caldera is impossible, although drilling allows correlation of depositional packages over a few kilometers [17,18]. Nevertheless, the youngest date is from tephra in a roadcut approximately 3 km east of WLC58, which penetrated 188 m of tuffaceous sediments, one of the thickest sections in the caldera. This location of the youngest tephra indicates it is near the top of the tuffaceous sedimentary section in the caldera, and its age suggests sedimentation probably ended about that time.
The proportion of sediments deposited pre- and post-resurgence is uncertain because of the poor exposure and difficulty in evaluating what has or has not been resurgently domed. Most previous interpretations are that the sediments were deposited post-resurgence in a moat between the caldera wall and the resurgent uplift [5,6,44]. However, the inward dip of sediments near the caldera wall and gentle dips off the uplift suggest some sediments were deposited before resurgence.
The total mass of tuffaceous sediments is important, because they are the host of, and were a likely source of Li to, the deposits. We calculated mass under different assumptions of total volume (thickness of deposits and whether they covered the entire caldera or just the “moat” around the resurgent dome) and density of tuffaceous sediments (Table 3A). A reasonable mass estimate of approximately 2.2 × 10¹¹ t is based on deposition of sediments to an average thickness of approximately 160 m over the non-resurgent part of the caldera and a density of 2. The maximum mass is 4 × 10¹¹ t based on 1000 km2 caldera area, deposition of sediment over the entire area (i.e., all sediments pre-resurgence, which is unlikely), maximum thickness of 200 m, and density of 2. A minimum mass is 1.3 × 10¹¹ t based on deposition over the non-resurgent part of the caldera (700 km2), an average thickness of 100 m, and a density of 1.79 [7]. Extracting 10 ppm Li from these respective masses would yield 2.2 Mt, 4 Mt, and 1.3 Mt Li.

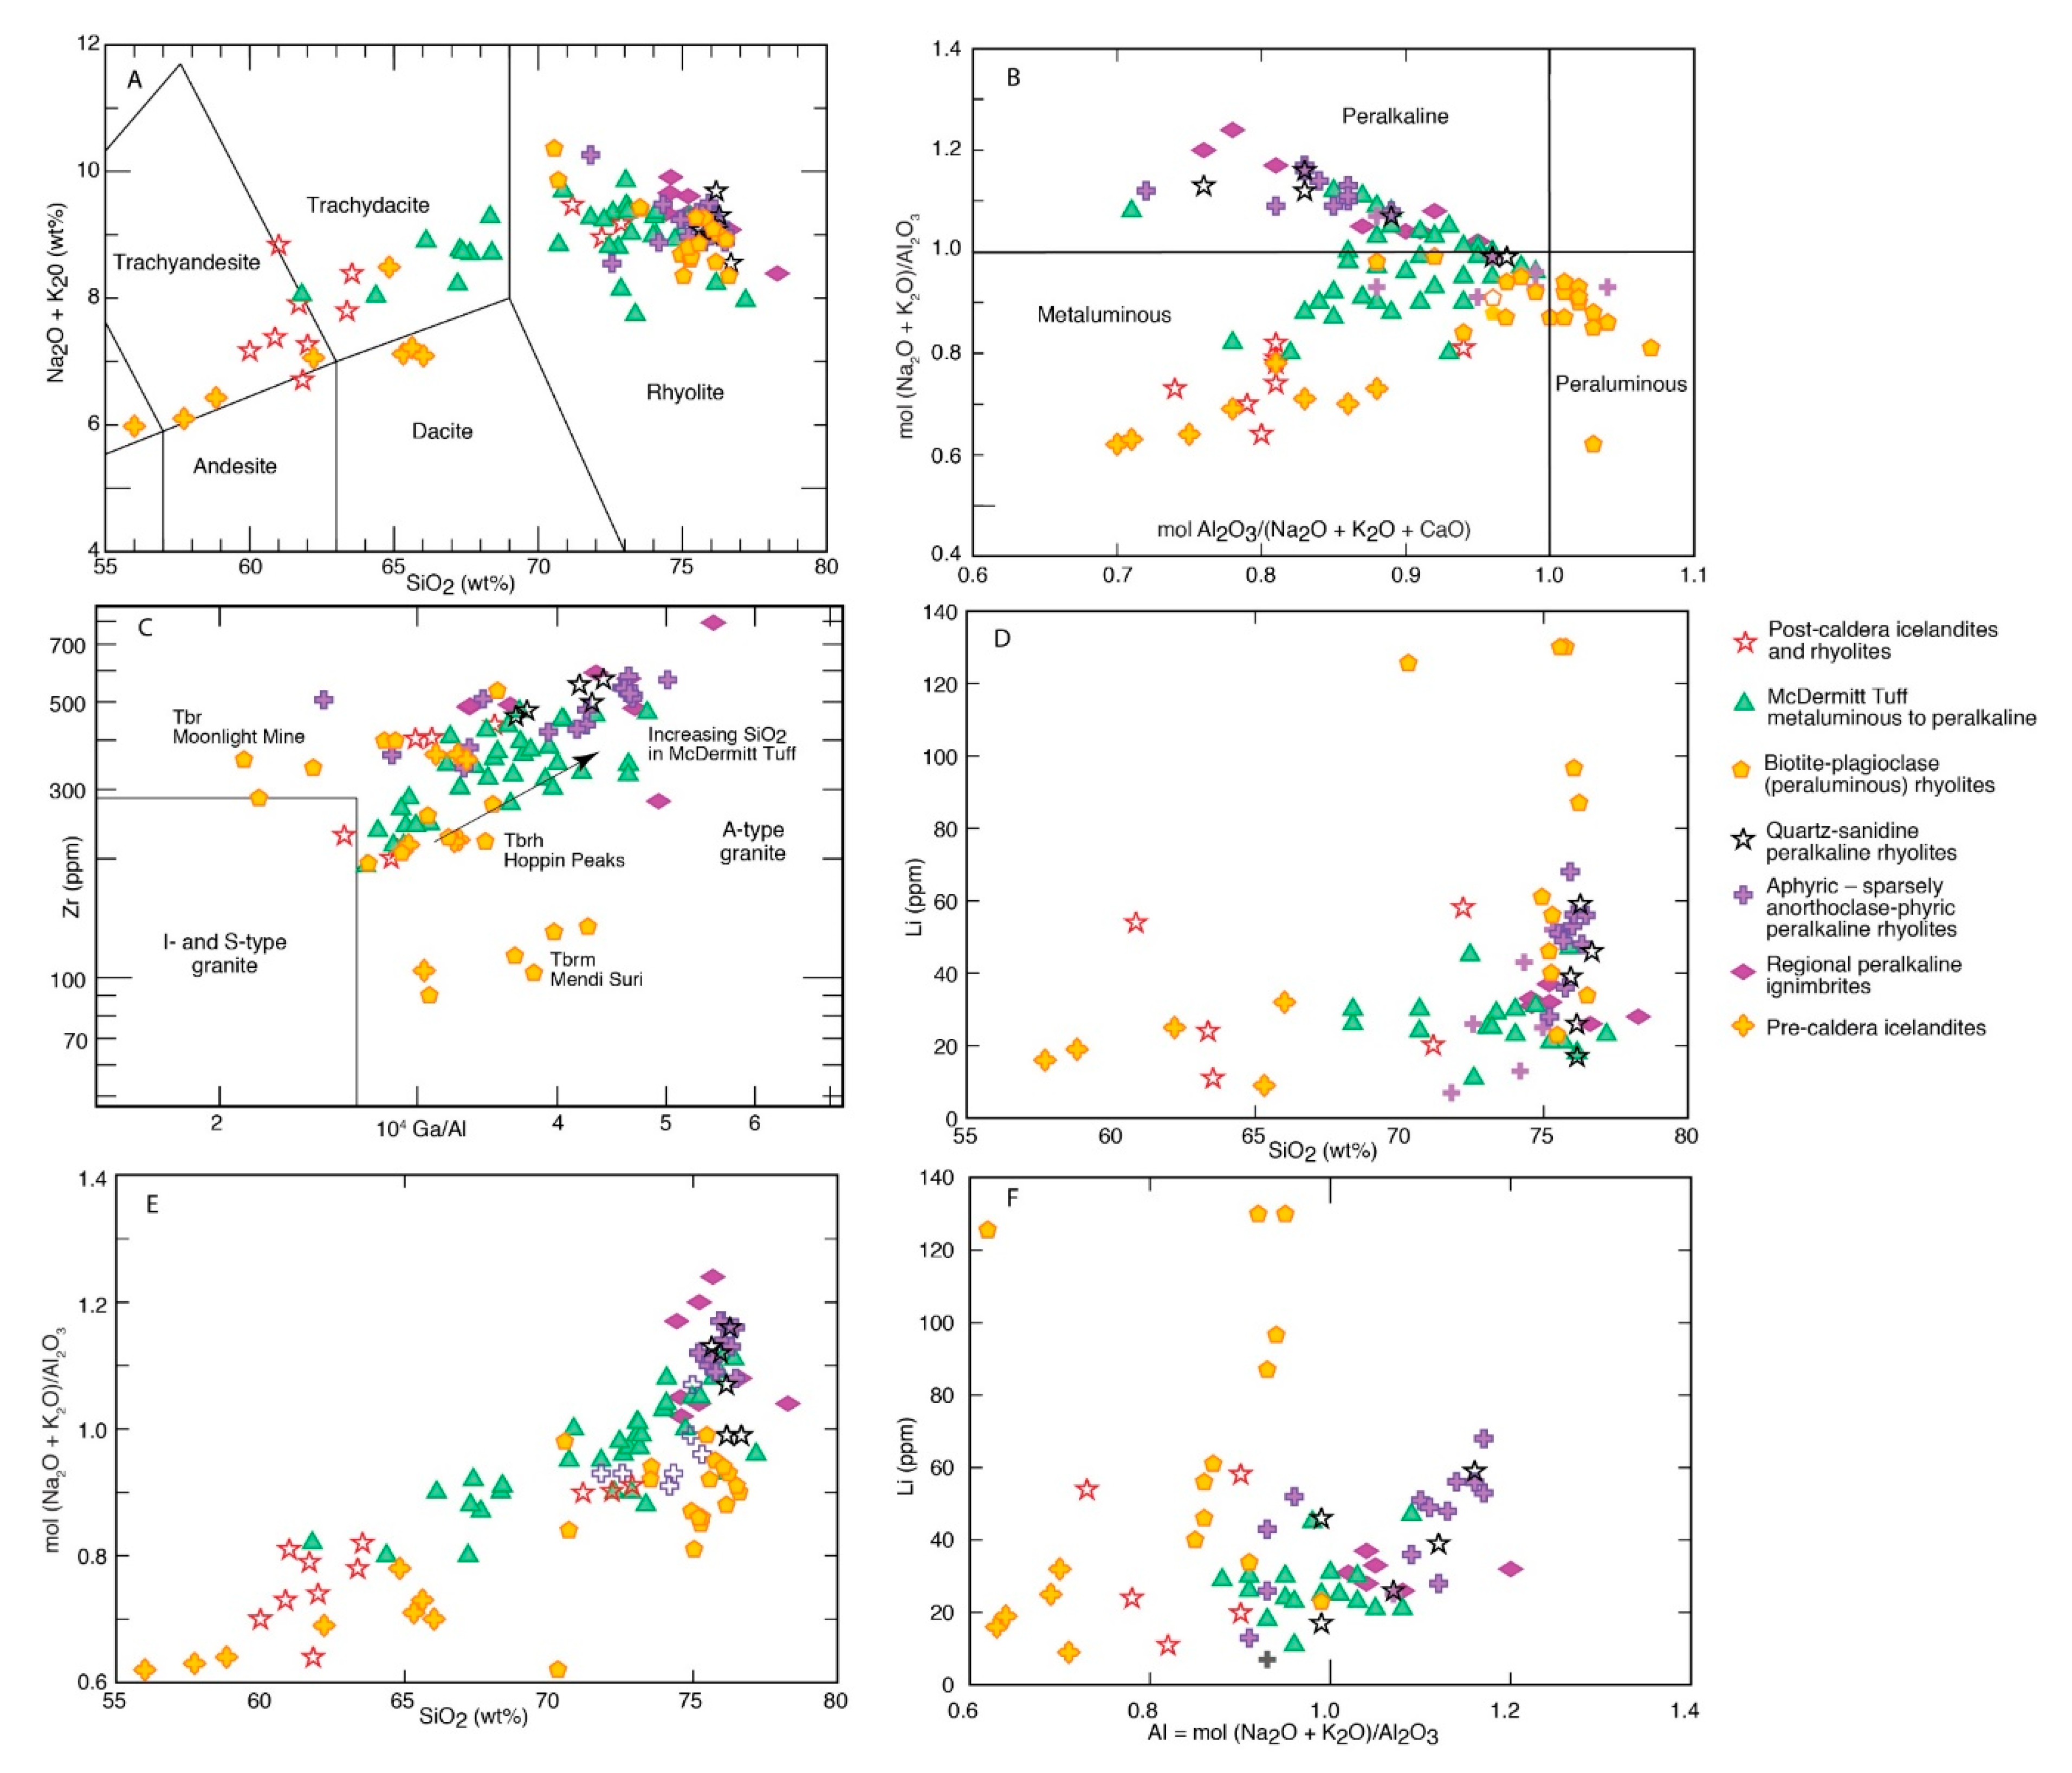
3.3. Geochemistry of Caldera-Related Rocks and Tuffaceous Sediments

The McDermitt caldera has long been recognized as a peralkaline system, but related silicic rocks range from biotite-bearing metaluminous to strongly peralkaline (Figure 4).
The different silicic suites probably formed from combined differentiation of Steens- (or Columbia River Basalt) related mantle melts and assimilation of different crust [48]. The metaluminous–peralkaline series probably interacted with accreted mafic crust, whereas the metaluminous–peraluminous, biotite-bearing suites probably incorporated more continental crust, possibly including Mesozoic granitoids. Notably, both biotite-bearing and peralkaline suites plot in A-type granite or within plate fields on discrimination diagrams (Figure 4), which distinguishes all from typical middle Cenozoic calc-alkaline ignimbrites of the Great Basin [49].
Lithium contents of whole rocks increase with increasing SiO2 contents in both biotite-bearing and peralkaline suites. However, the biotite-bearing rocks contain the highest concentrations of Li (71 ± 37 ppm, range 21–130 ppm, n = 12), whereas concentrations are significantly lower in pre-caldera peralkaline (33 ± 16 ppm, range 7–68 ppm, n = 37) or the metaluminous–peralkaline McDermitt Tuff (27 ± 9 ppm, range 11–47, n = 17). The significance of these concentrations and differences is uncertain. On one hand, they are consistent with observations that Li is more enriched in rhyolites that have a substantial continental felsic crustal component [50]. However, Hofstra et al. [50] and Benson et al. [14] found that lithium concentrations in melt inclusions in quartz phenocrysts of both peralkaline and biotite-bearing suites in the United States are significantly higher than whole-rock concentrations. Hofstra et al. [50] interpreted that 45% to 98% of magmatic Li was lost to an exsolved, aqueous phase during shallow intrusion and eruption. They further interpreted that this aqueous phase condensed onto glass shards, where Li could be leached into meteoric water when the erupted ash was deposited.
Based on analysis of melt inclusions, Benson et al. [14] concluded that several peralkaline magmas that erupted as tuffs in the McDermitt area initially contained 1100 to 1500 ppm Li, most of which was lost during degassing accompanying eruption. Benson et al. [14] interpreted that the magma that erupted as the tuff of Long Ridge [36], which they correlate with the McDermitt Tuff, contained 1500 ppm Li before degassing. They further interpreted that the tuff magma initially contained ca. 3500 Mt Li that could be available for mineralization. Given the very low 27 ± 9 ppm average Li content of McDermitt Tuff, the fate of all the Li that is not in the solid rock is an important question for the origin of mineralization. However, the significance of the very high magmatic Li contents is uncertain because (1) the peralkaline magmas presumably incorporated very little felsic crust, (2) the McDermitt Tuff lacks quartz phenocrysts and the location and relationship of the analyzed sample to the tuff of Long Ridge are uncertain, and (3) no data are available for Li contents in melt inclusions of the biotite rhyolites.
Tuffaceous sediments and tephra in the sediments are commonly diagenetically altered, so their chemical compositions are imperfect indicators of geochemical suite. Nevertheless, the 16.4–15.7 Ma age range, coarseness of some tephra, phenocryst mineralogy (anorthoclase, sanidine, and/or plagioclase; presence or absence of quartz), K/Ca of dated feldspar, and immobile element composition of tephra indicate that they were derived from nearby volcanic centers (Figure 1; Table 2). Samples of still glassy tephra, which are least likely to have been affected by diagenesis, with anorthoclase, no quartz, and high Zr, Y, and Nb, are similar to anorthoclase–phyric rhyolites erupted around the McDermitt caldera and from the High Rock and Santa Rosa–Calico volcanic centers [23,24,25]. Samples that have biotite or plagioclase and sanidine and low Zr, Y, and Nb are similar to the biotite-bearing suites at McDermitt, Hawks Valley [26], and High Rock [25]. Sample H16-592 with sanidine, quartz, and high Zr and Y is similar to Jarbidge Rhyolite [51]. The Li contents of the glassy tephra range from 14.1 to 143 ppm (Table S1), similar to the range in igneous rocks, with an overall mean of 69 ± 48 ppm. However, the contents do not show the differences shown by igneous rocks. Definite or probable biotite rhyolites have Li concentrations ranging from 18 to 142 ppm and a mean of 67 ± 53 ppm (n = 4), with one inexplicable (not obviously mineralized, and possibly contaminated) sample that contains 5757 ppm (H16-606). Contents of probable anorthoclase rhyolite tephra range from 17 to 143 ppm with a mean of 75 ± 50 ppm (n = 8). Similarity in Li contents of the interpreted biotite-bearing and anorthoclase-bearing tuffaceous sediments suggests that either or both of our interpretations of the affinities of the tephra and our assumption that their Li contents have not been affected by diagenesis probably are not completely correct.

3.4. Hydrothermal Systems of the Caldera

Because the Li deposits may have formed through diagenesis or hydrothermal alteration, the characteristics of known hydrothermal systems are important. The McDermitt caldera underwent significant hydrothermal alteration largely contemporaneous with magmatism [19,27,52,53,54]. All hydrothermal activity was focused along or near the caldera ring-fracture system (Figure 2) (see also [53]). Uranium mineralization that is highly enriched in Zr and with most U in hydrothermal zircon occurs extensively in pre-caldera rocks and McDermitt Tuff along and just inside the western margin (Figure 2) [27]. Adularia at the U–Zr Moonlight Mine along the western ring fracture yielded a 40Ar/39Ar date of 16.32 ± 0.10 Ma [19]. Geochemical similarities among the distinctive U–Zr occurrences suggest all probably formed at the same time.
Uranium mineralization in the northern part of the caldera is not enriched in Zr, which, along with its wide separation from the western U–Zr deposits (Figure 2), suggests it is unrelated. Northern U mineralization is undated but younger than the 16.41 ± 0.02 Ma icelandite lava that is the major host.
Numerous Hg deposits, which were the largest Hg producers in the U.S. between 1933 and 1989, occur in intracaldera tuffaceous sediments in an arc along the northeastern to northern part of the caldera (Figure 2) [6,19,41,42]. Adularia from the largest, the McDermitt Mine, yielded an imprecise 40Ar/39Ar date of about 16.3 Ma [19]. The adularia is very fine grained (≤50 µm) and intimately intergrown with opal, which contributed considerable excess 40Ar. An adularia K–Ar date of 15.7 ± 0.4 Ma from the McDermitt Mine [53] is consistent with mineralization contemporaneous with magmatism. Whether all Hg mineralization occurred around 16 Ma is unknown.
Temperature estimates from fluid inclusions are about 340 °C for the Moonlight U mineralization and 200 °C for Hg mineralization at McDermitt, Bretz, and Opalite [6,52].

4. Lithium Mineralization

Stratiform deposits of Li clay are extensively developed in the intra-caldera tuffaceous sediments (Figure 5). Deposits have been most intensely examined along the southern and western side of the caldera and in Lithium Nevada Corporation’s Thacker Pass Project [7]. The deposits have been variably referred to as “lenses” or “zones” [7,15,16]. To avoid confusion, we refer to the Thacker Pass deposit, which has been the focus of our mineralogical and chemical work. It is the most thoroughly evaluated deposit and is the closest to mining. Other areas of mineralization are referred to as “lenses”, following Lithium Nevada usage [7]. Jindalee Resources Incorporated is currently drilling their claims in the northwestern part of the caldera [17,18]. Published data indicate Li mineralization continues around the northern side of the caldera [5]. Little drilling and no publicly available data are available around the eastern side, where tuffaceous sediments are definitely present although largely covered by Quaternary deposits (Figure 2).

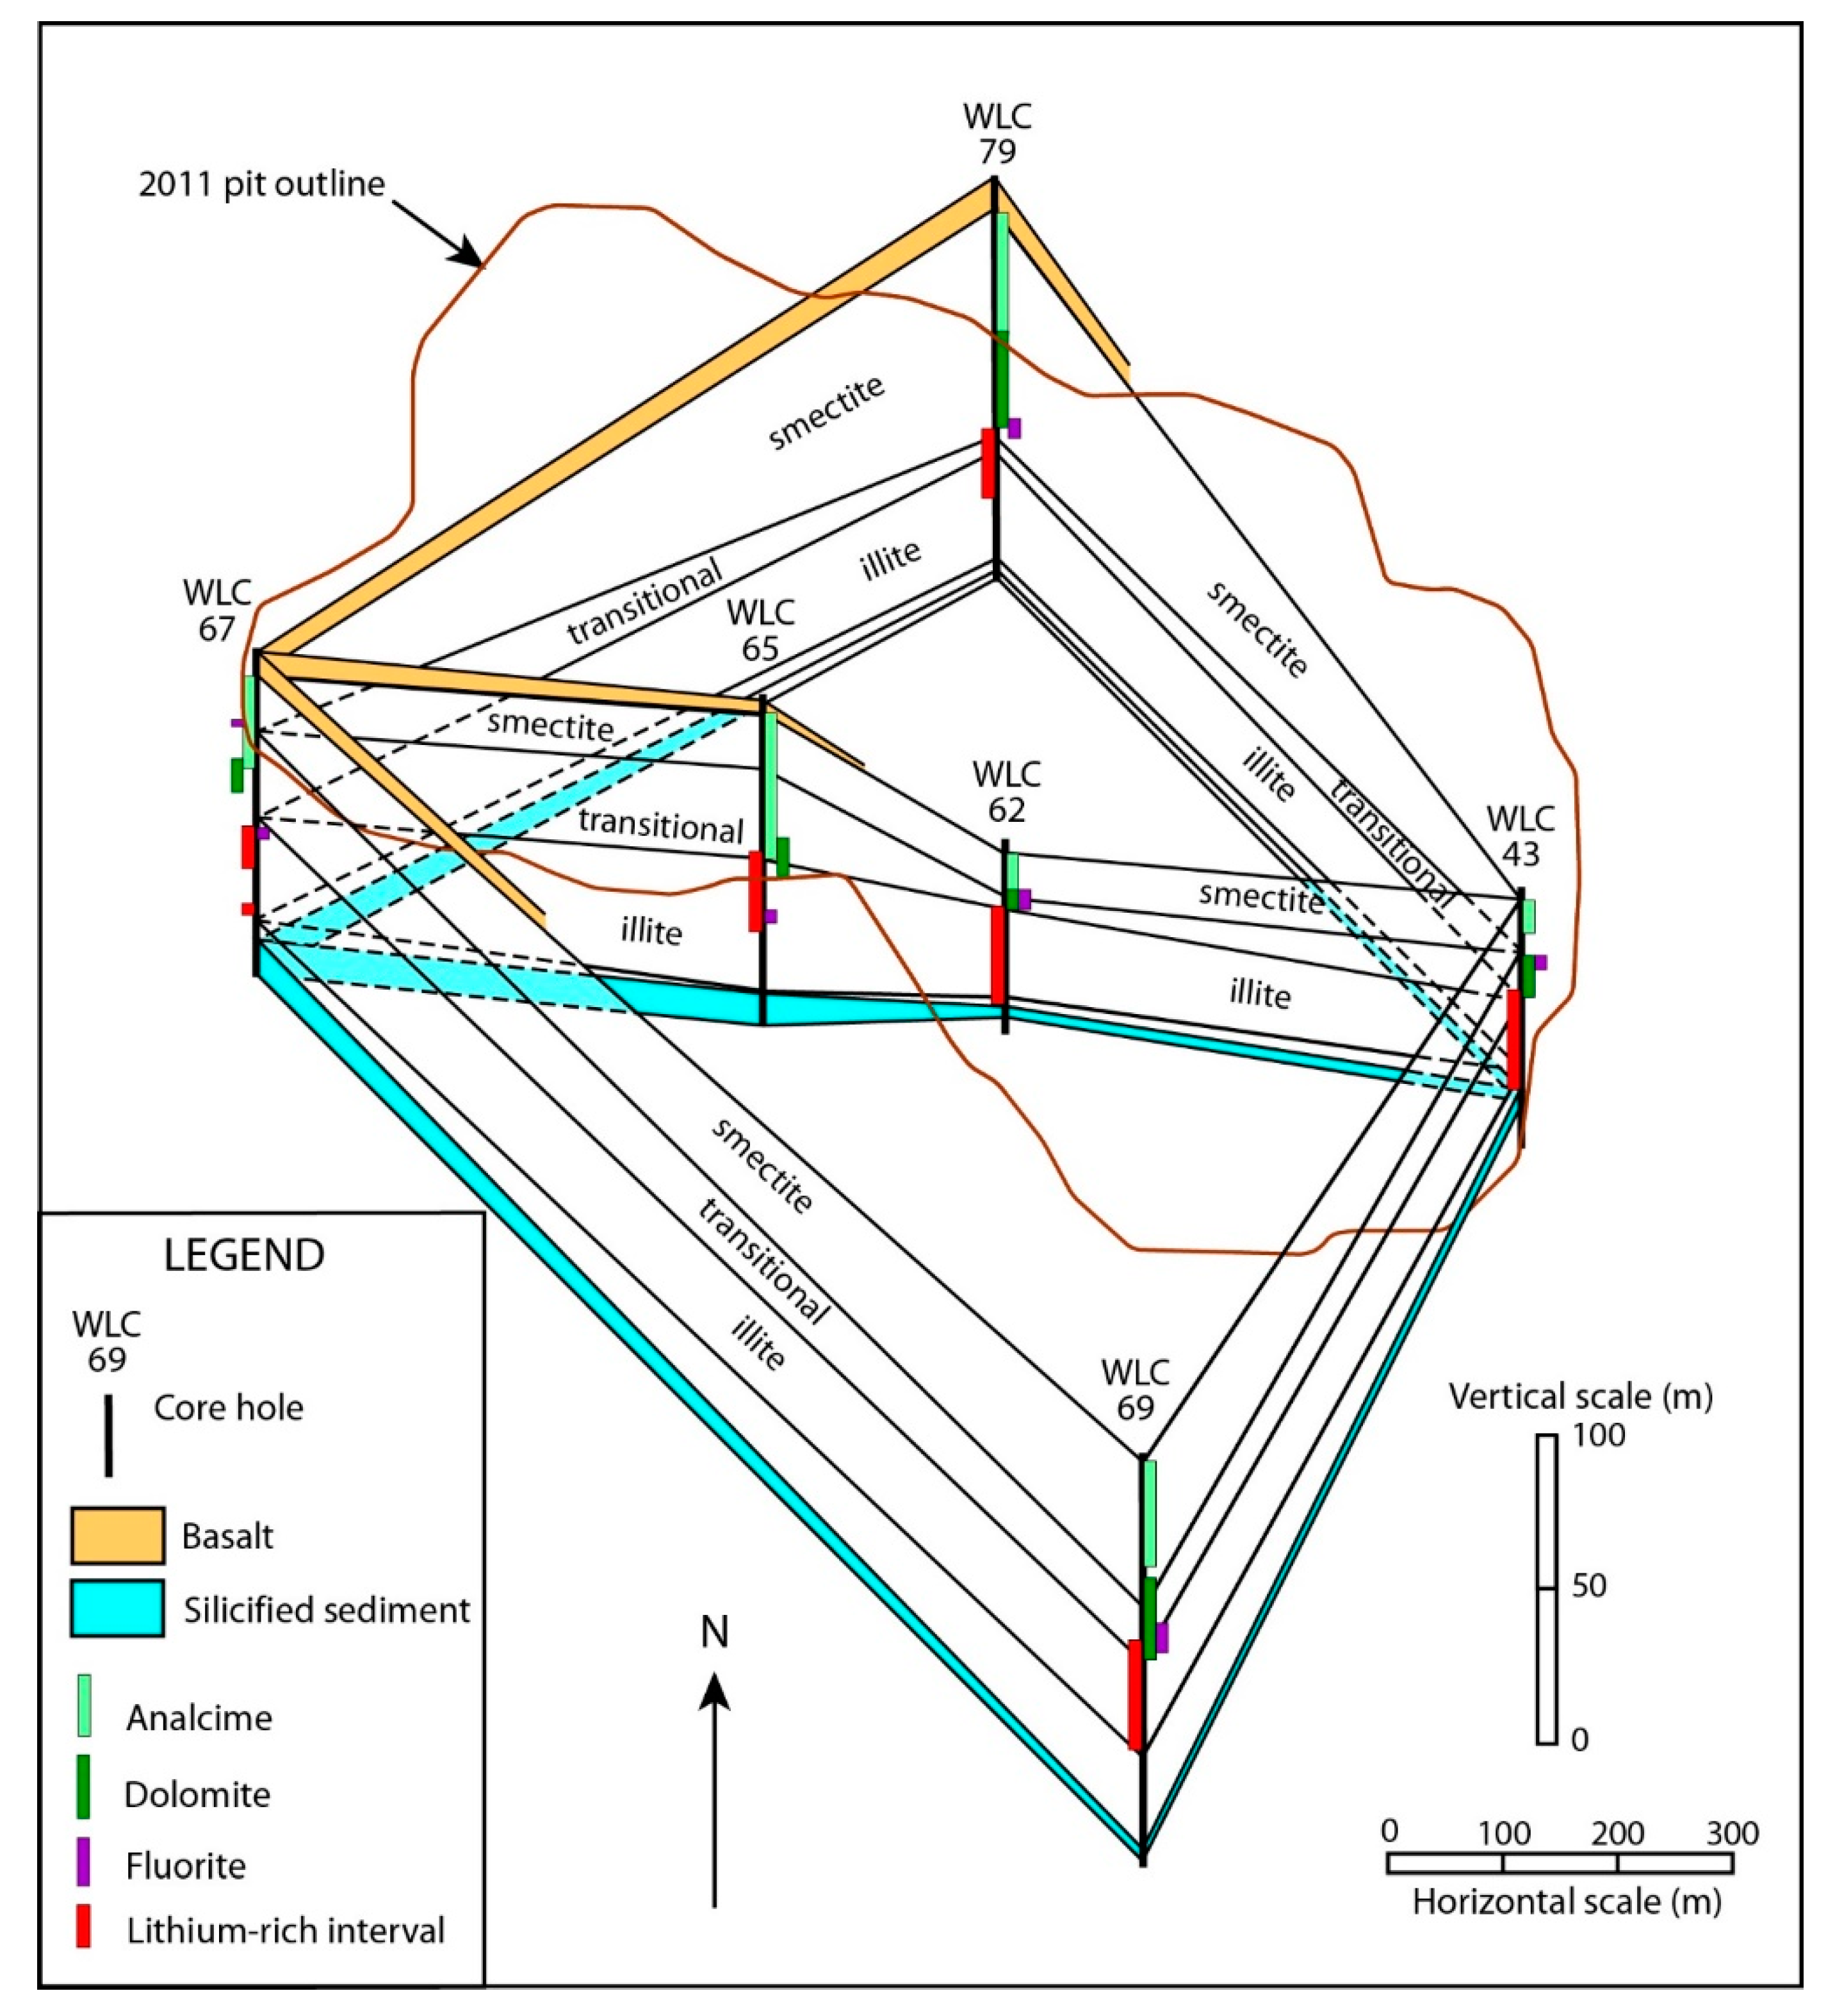
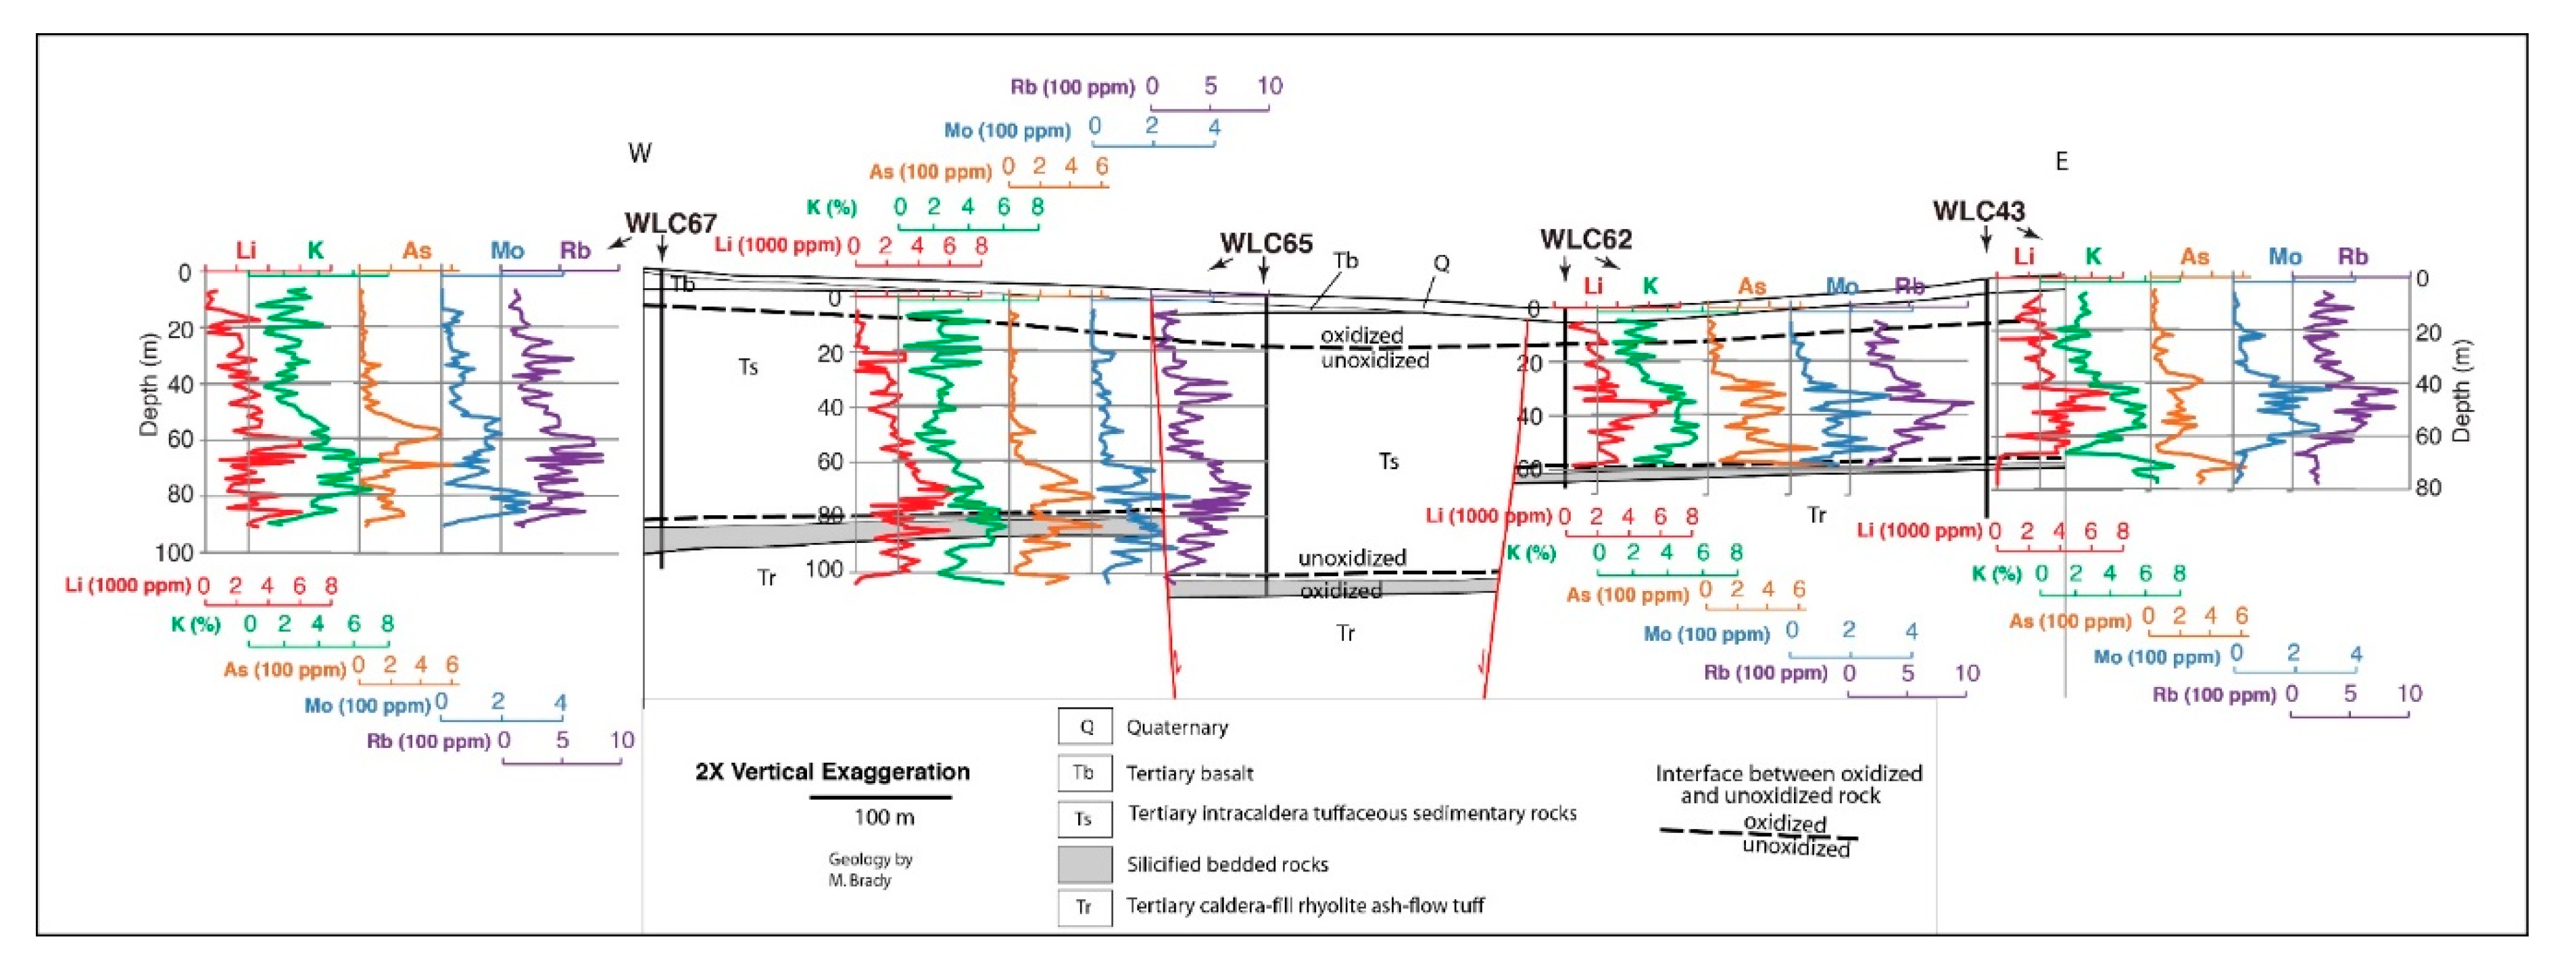
4.1. Geology of the Thacker Pass Deposit

The tuffaceous sediments in and around the Thacker Pass deposit are mostly covered by thin alluvium. Natural outcrops occur along a few drainages, and roadcuts and a small open-pit clay mine provide minor additional exposure (Figure 3A). Therefore, stratigraphic and mineral data are primarily based on drill core.
The most Li-rich zone in the Thacker Pass area is the lowermost 70–90 m of the sedimentary section, directly above McDermitt Tuff (Figure 6 and Figure 7). The deposit is structurally high and near surface relative to areas to the south and southeast, and the top of the Li-rich zone is at or within 10 m of the surface. The Li-rich zone is much deeper to the southeast, for example, in drill hole WLC58, which has the thickest section of tuffaceous sediments in the area (188 m) (Figure 2 and Figure 5). WLC58 also penetrated 544 m of McDermitt Tuff beneath the sedimentary section.
The Thacker Pass deposit mostly consists of interlayered fine-grained sediment and volcanic ash (Figure 3B) with a few mafic or intermediate lavas logged in some drill holes. Laminar strata and finely graded bedding support lacustrine deposition. Claystone comprises 40% to 90% of the section and dominates Li-rich intervals. Clay-rich units can be correlated from hole to hole over lateral distances of more than 150 m although unit thickness can vary by as much as 20% [16].
Most of the sedimentary section is unoxidized (Figure 7). The rock at the base of the sedimentary section, in the silicified zone, and at the top of the underlying McDermitt Tuff is variably oxidized over 3 to 12 m intervals, but logging by Western Lithium geologists did not record oxidation there in holes WLC58 and WLC69. The uppermost 15 to 30 m of sediments in Figure 7 are oxidized. Claystone in the lower part of the section, which is the primary zone of mineralization, is commonly dark gray, possibly due to relatively abundant organic material (Figure 3B). Unoxidized claystones are variably brown, tan, gray, greenish- to bluish-gray, and black, whereas the ash is generally white or very light gray. Oxidized claystone is brown to greenish-tan and contains iron oxide, whereas the ash is white with some orange-brown iron oxide. Pyrite is common in the unoxidized zone, which also contains bitumen. The upper oxidized zone probably reflects modern weathering. However, the lower oxidized zone appears to be displaced by faults, so must be relatively old.
Calcite beds and beds of calcified tuff are present throughout the sedimentary section. Irregular to well-crystalized white masses of calcite as much as 4 cm across are common in the dark claystone in the lower part of the section (Figure 3E). Dolomite and fluorite occur locally as small crystalline masses and as thin beds, mostly in the middle part of the section (Figure 3F,G).
A silicified zone occurs at the base of the sedimentary section in every drill hole that we examined in the deposit (Figure 7). Both laminated sediments and interlayered tuffs are partly to completely replaced by microcrystalline quartz (Figure 3C). Fine sedimentary laminae as well as comparatively coarse tuff beds are also preserved in a silicified zone at the base of the sedimentary section in outcrop west of the South lens. Microcrystalline quartz also occurs locally in the sedimentary section as irregular veins, generally in or associated with tuff beds.

4.2. Mineral Assemblages and Zoning

Four core holes through the Thacker Pass deposit and two holes immediately south and north of the deposit (WLC69 and WLC79) show consistent mineral zoning based on thin section, SEM, and XRD data (Figure 6 and Figure 7). These zones also show distinctive Li and other element concentrations (Figure 6; discussed more comprehensively in Section 4.3. Geochemistry). An upper zone has smectite clay and analcime and generally lower Li concentrations (Figure 7). A lower zone has illitic clay, first identified by Hudson (2008) [55], and the highest average Li contents. A transitional clay zone lies between the illitic and smectitic zones and has intermediate Li. At the base of the sedimentary section beneath the illite zone and directly above the strongly silicified zone is a lower zone of mixed illitic and smectitic clays, which also averages low to moderate Li.
Calcite, albite, K-feldspar, and quartz occur in all zones except the silicified zone, which is dominantly microcrystalline quartz but locally contains weakly silicified tuff layers with minor K-feldspar and clay (Figure 6). Dolomite and fluorite are present, partly together, in or near the transitional zone, just above or in the upper part of the Li-rich zone. However, in hole WLC65, fluorite was only found in the middle of the illite zone.

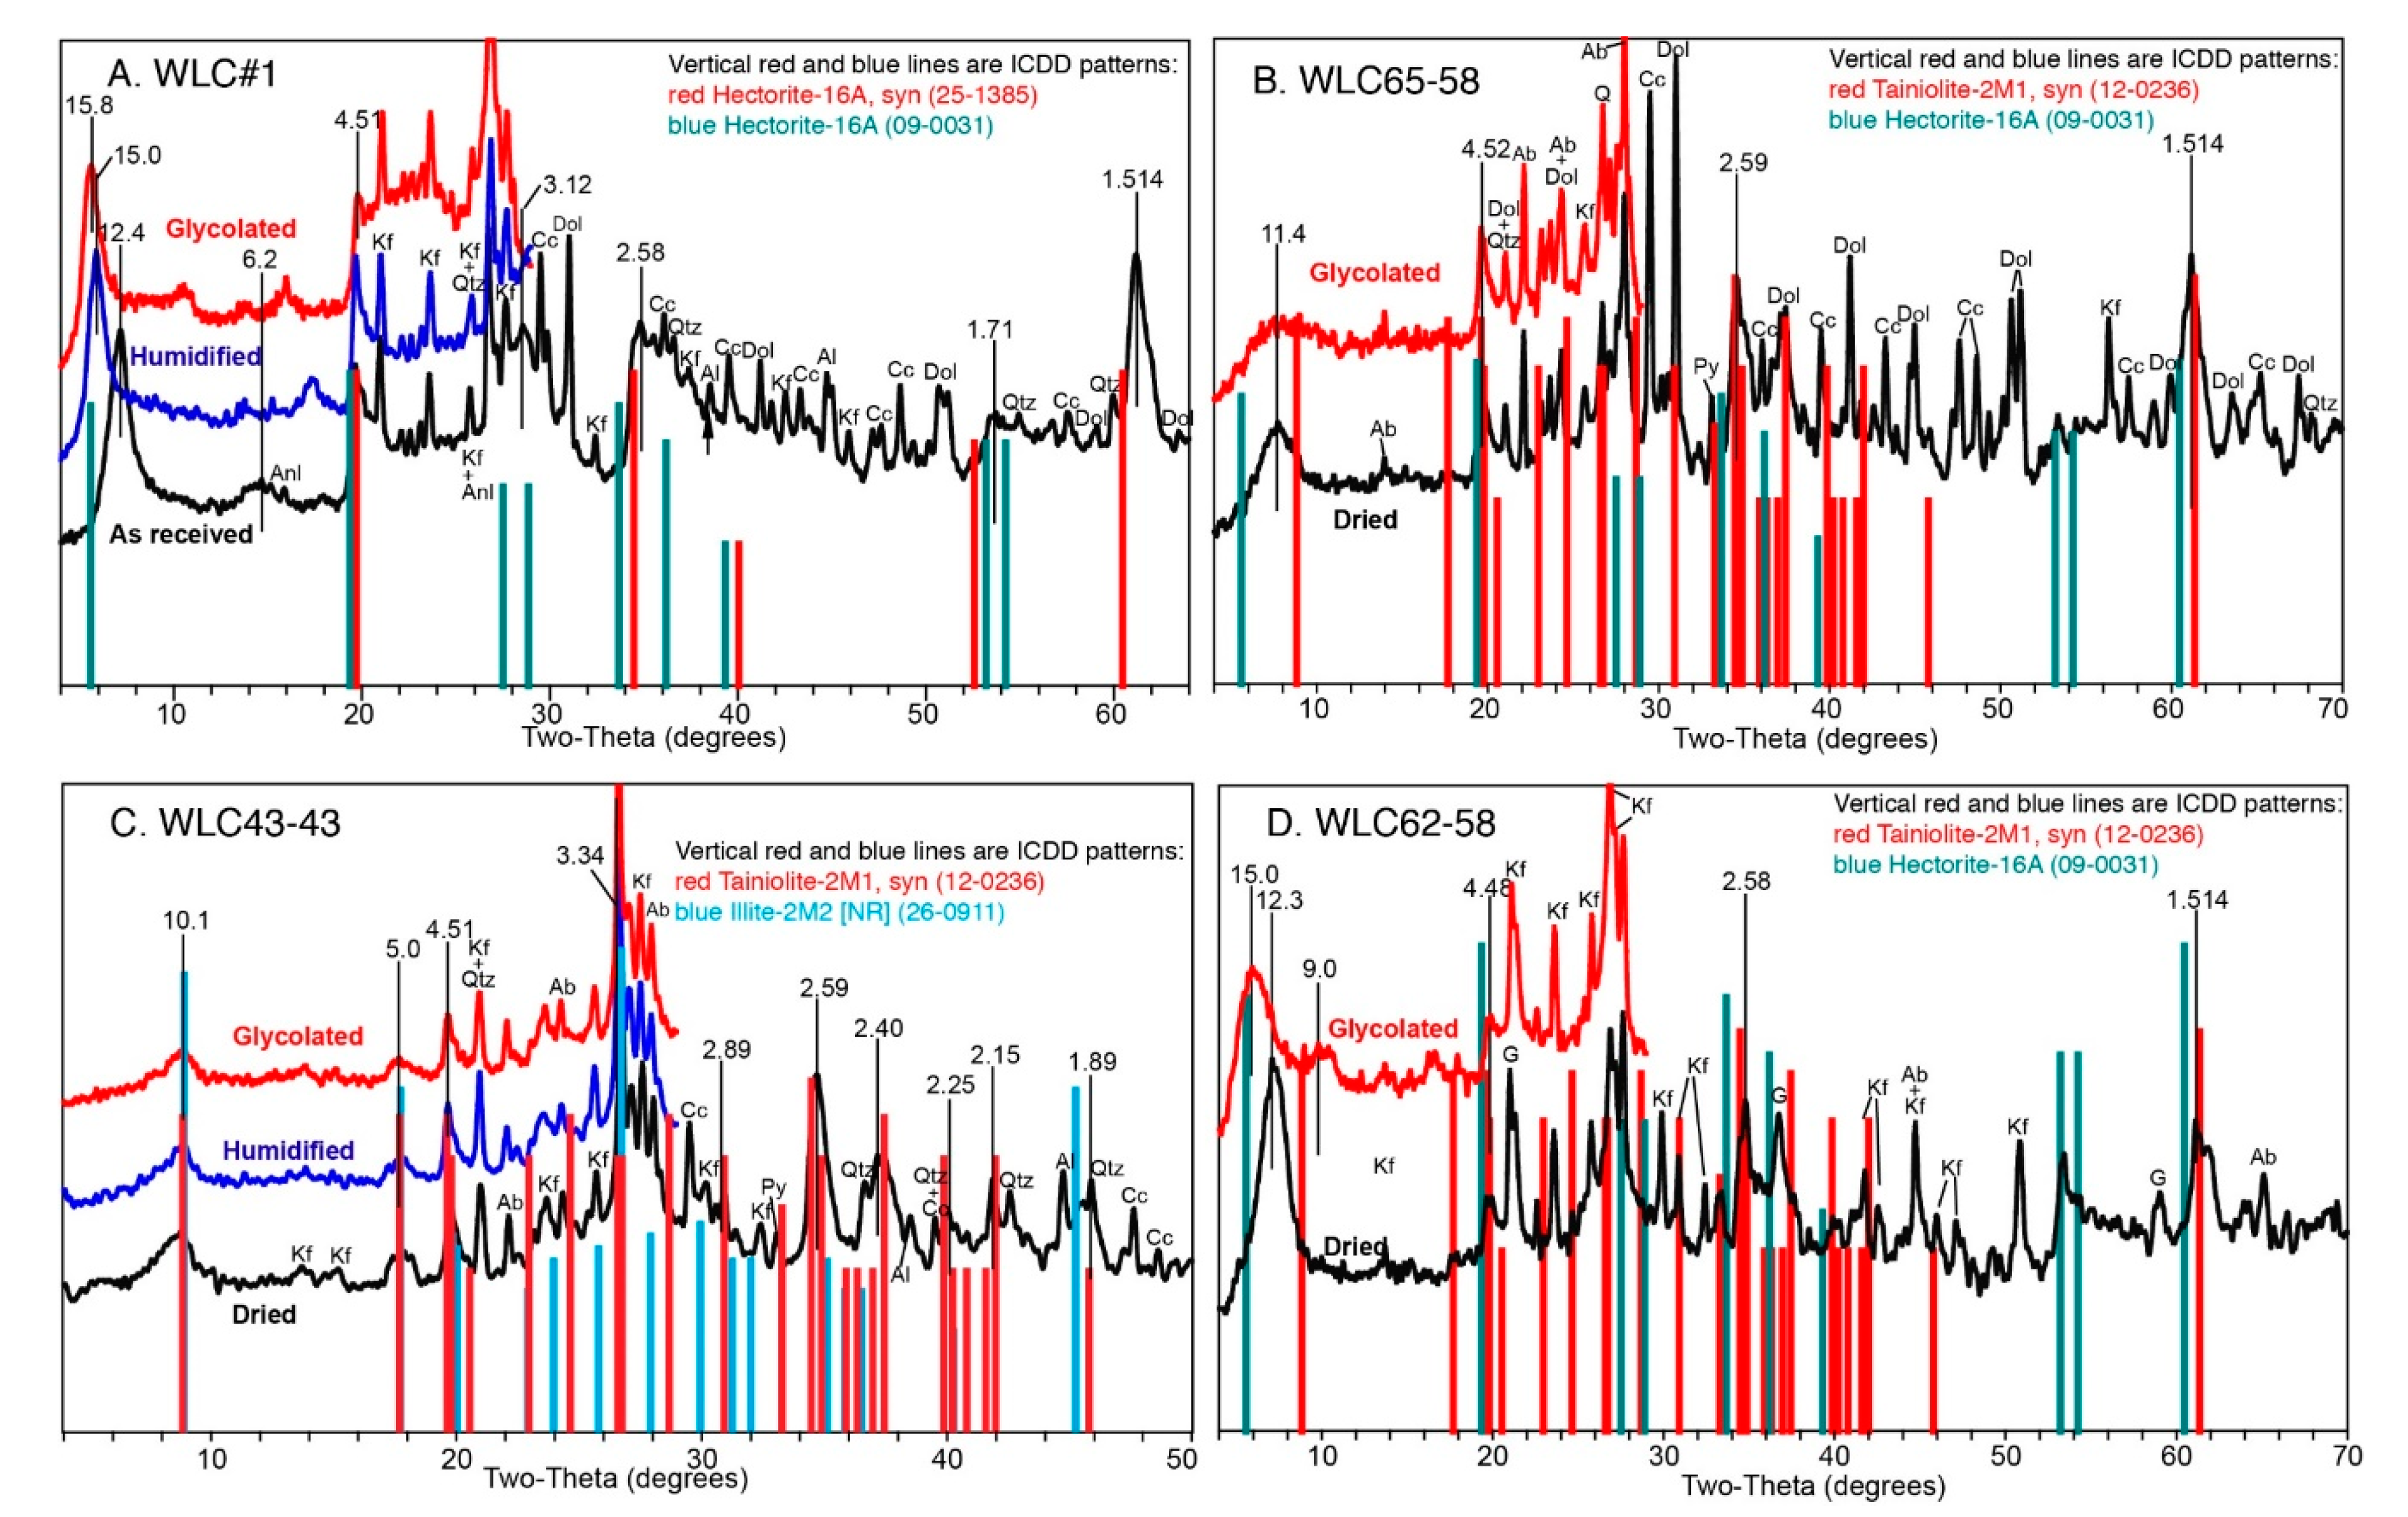
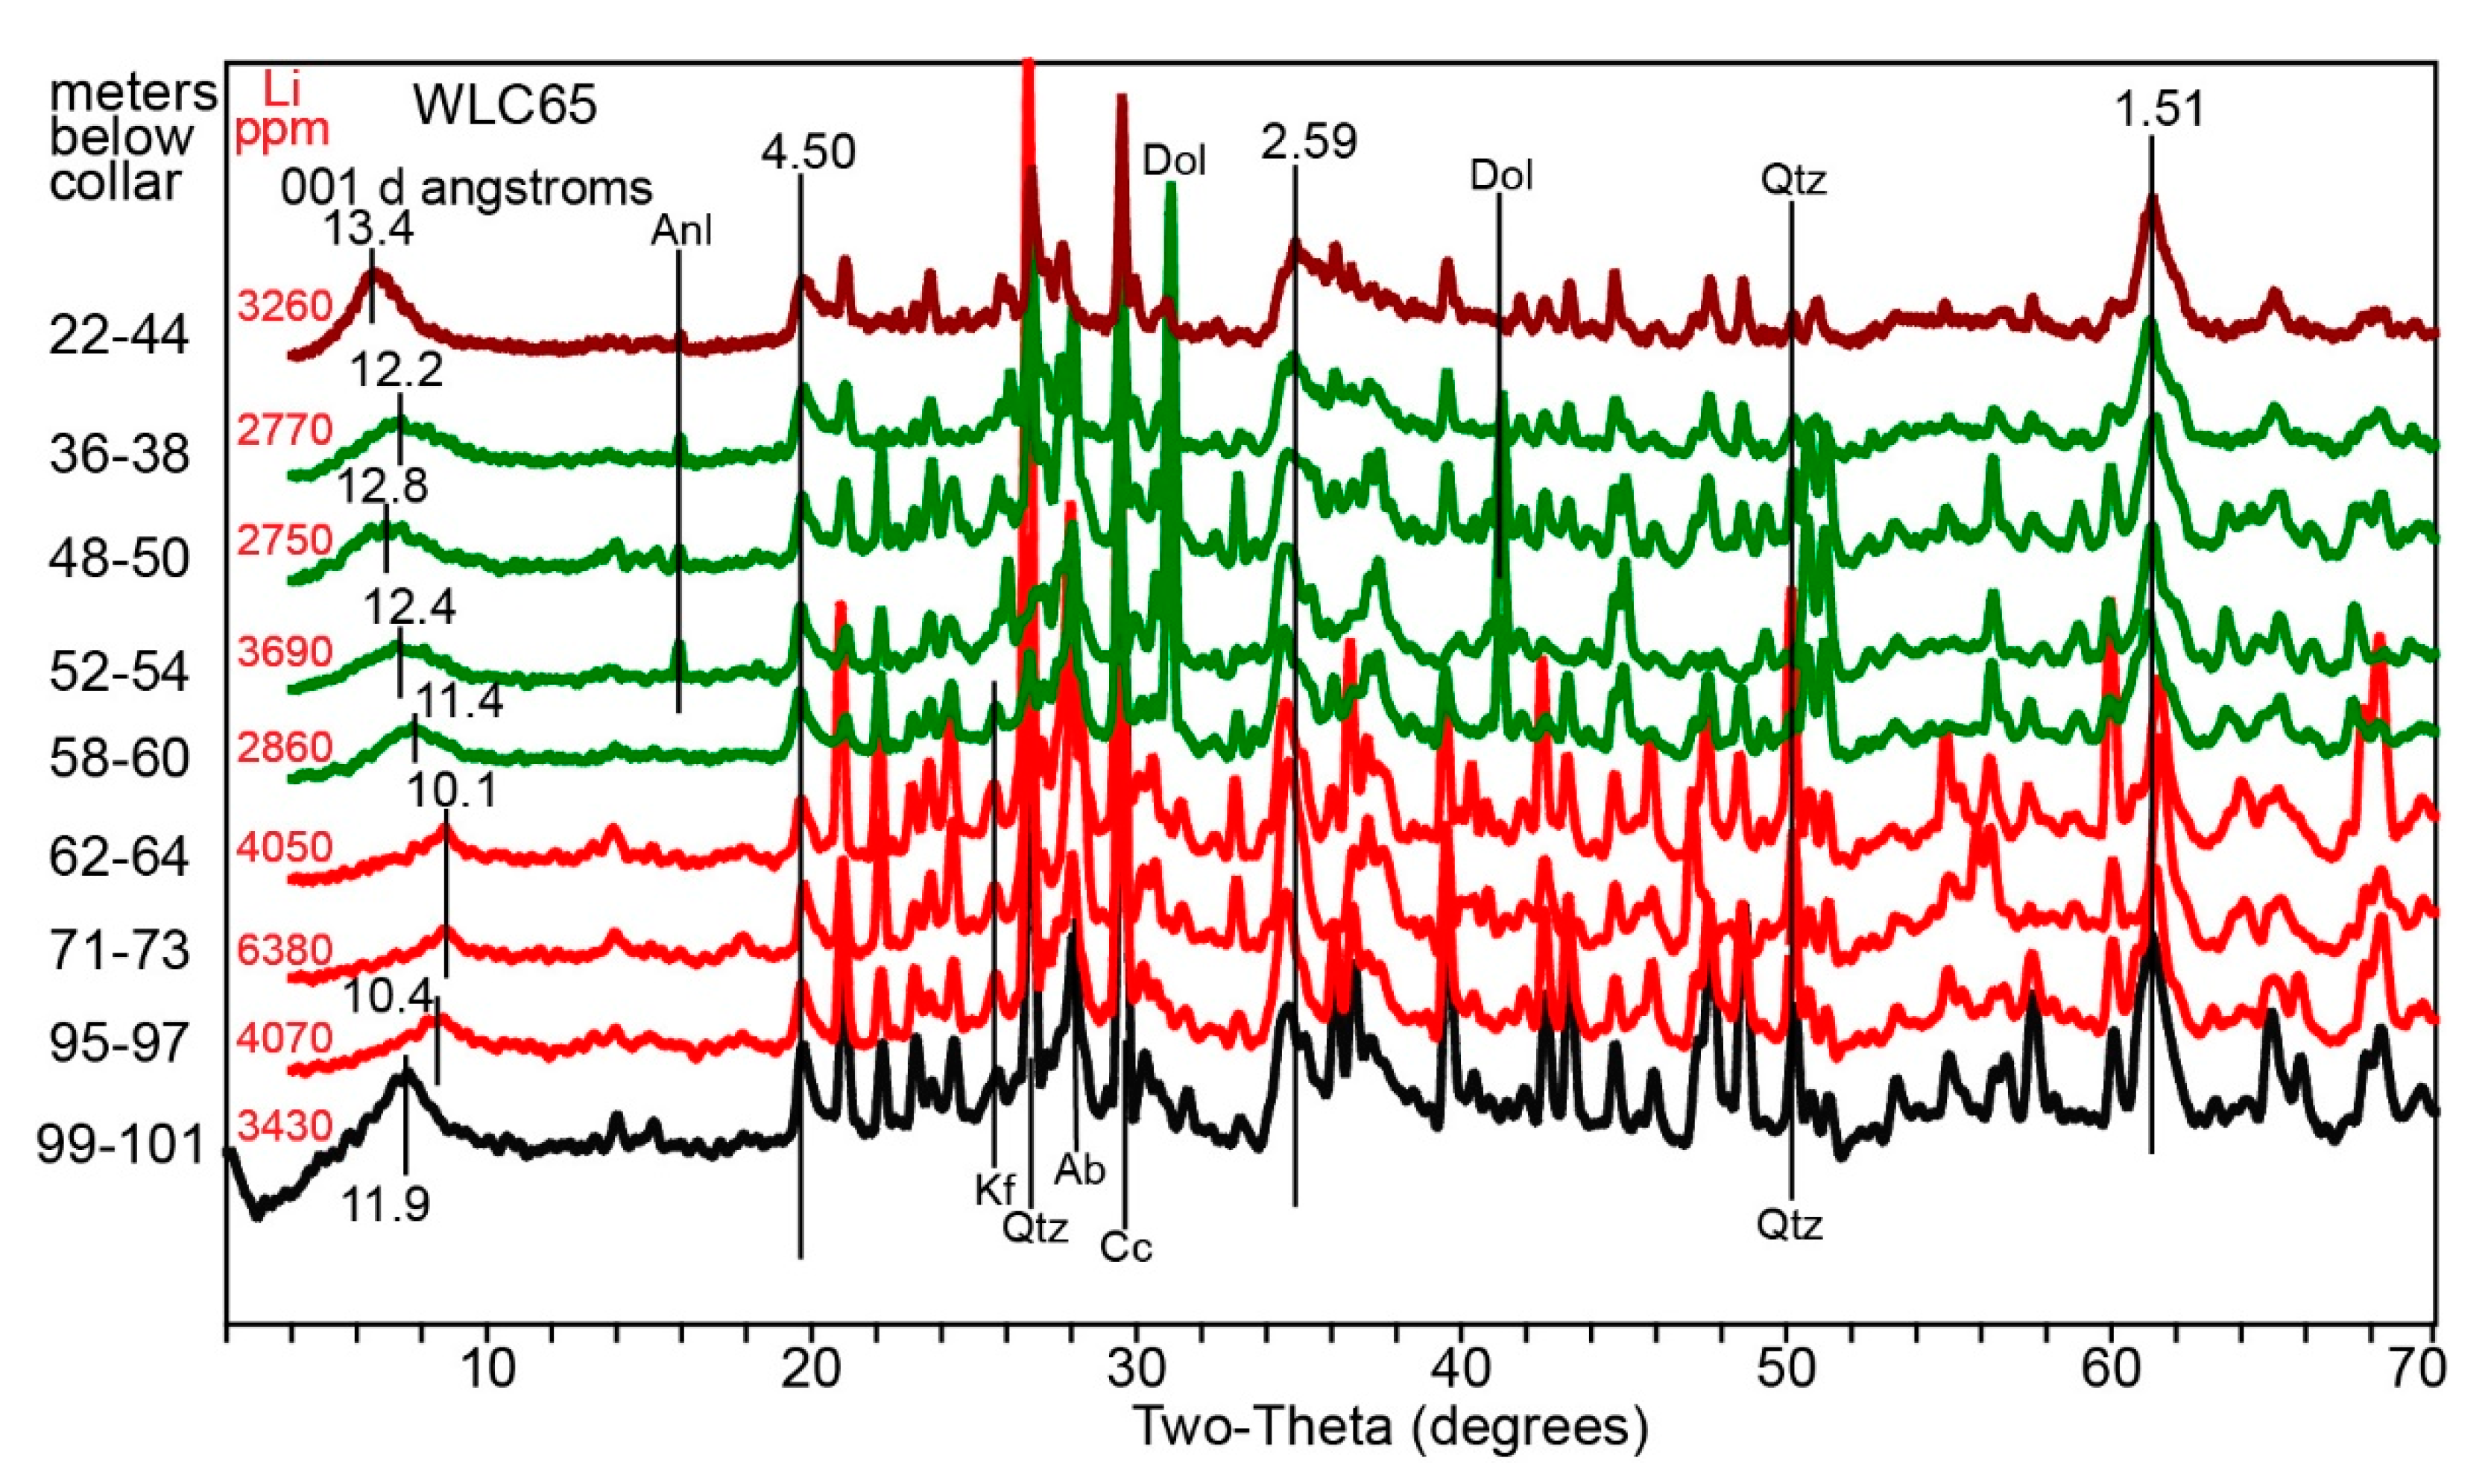
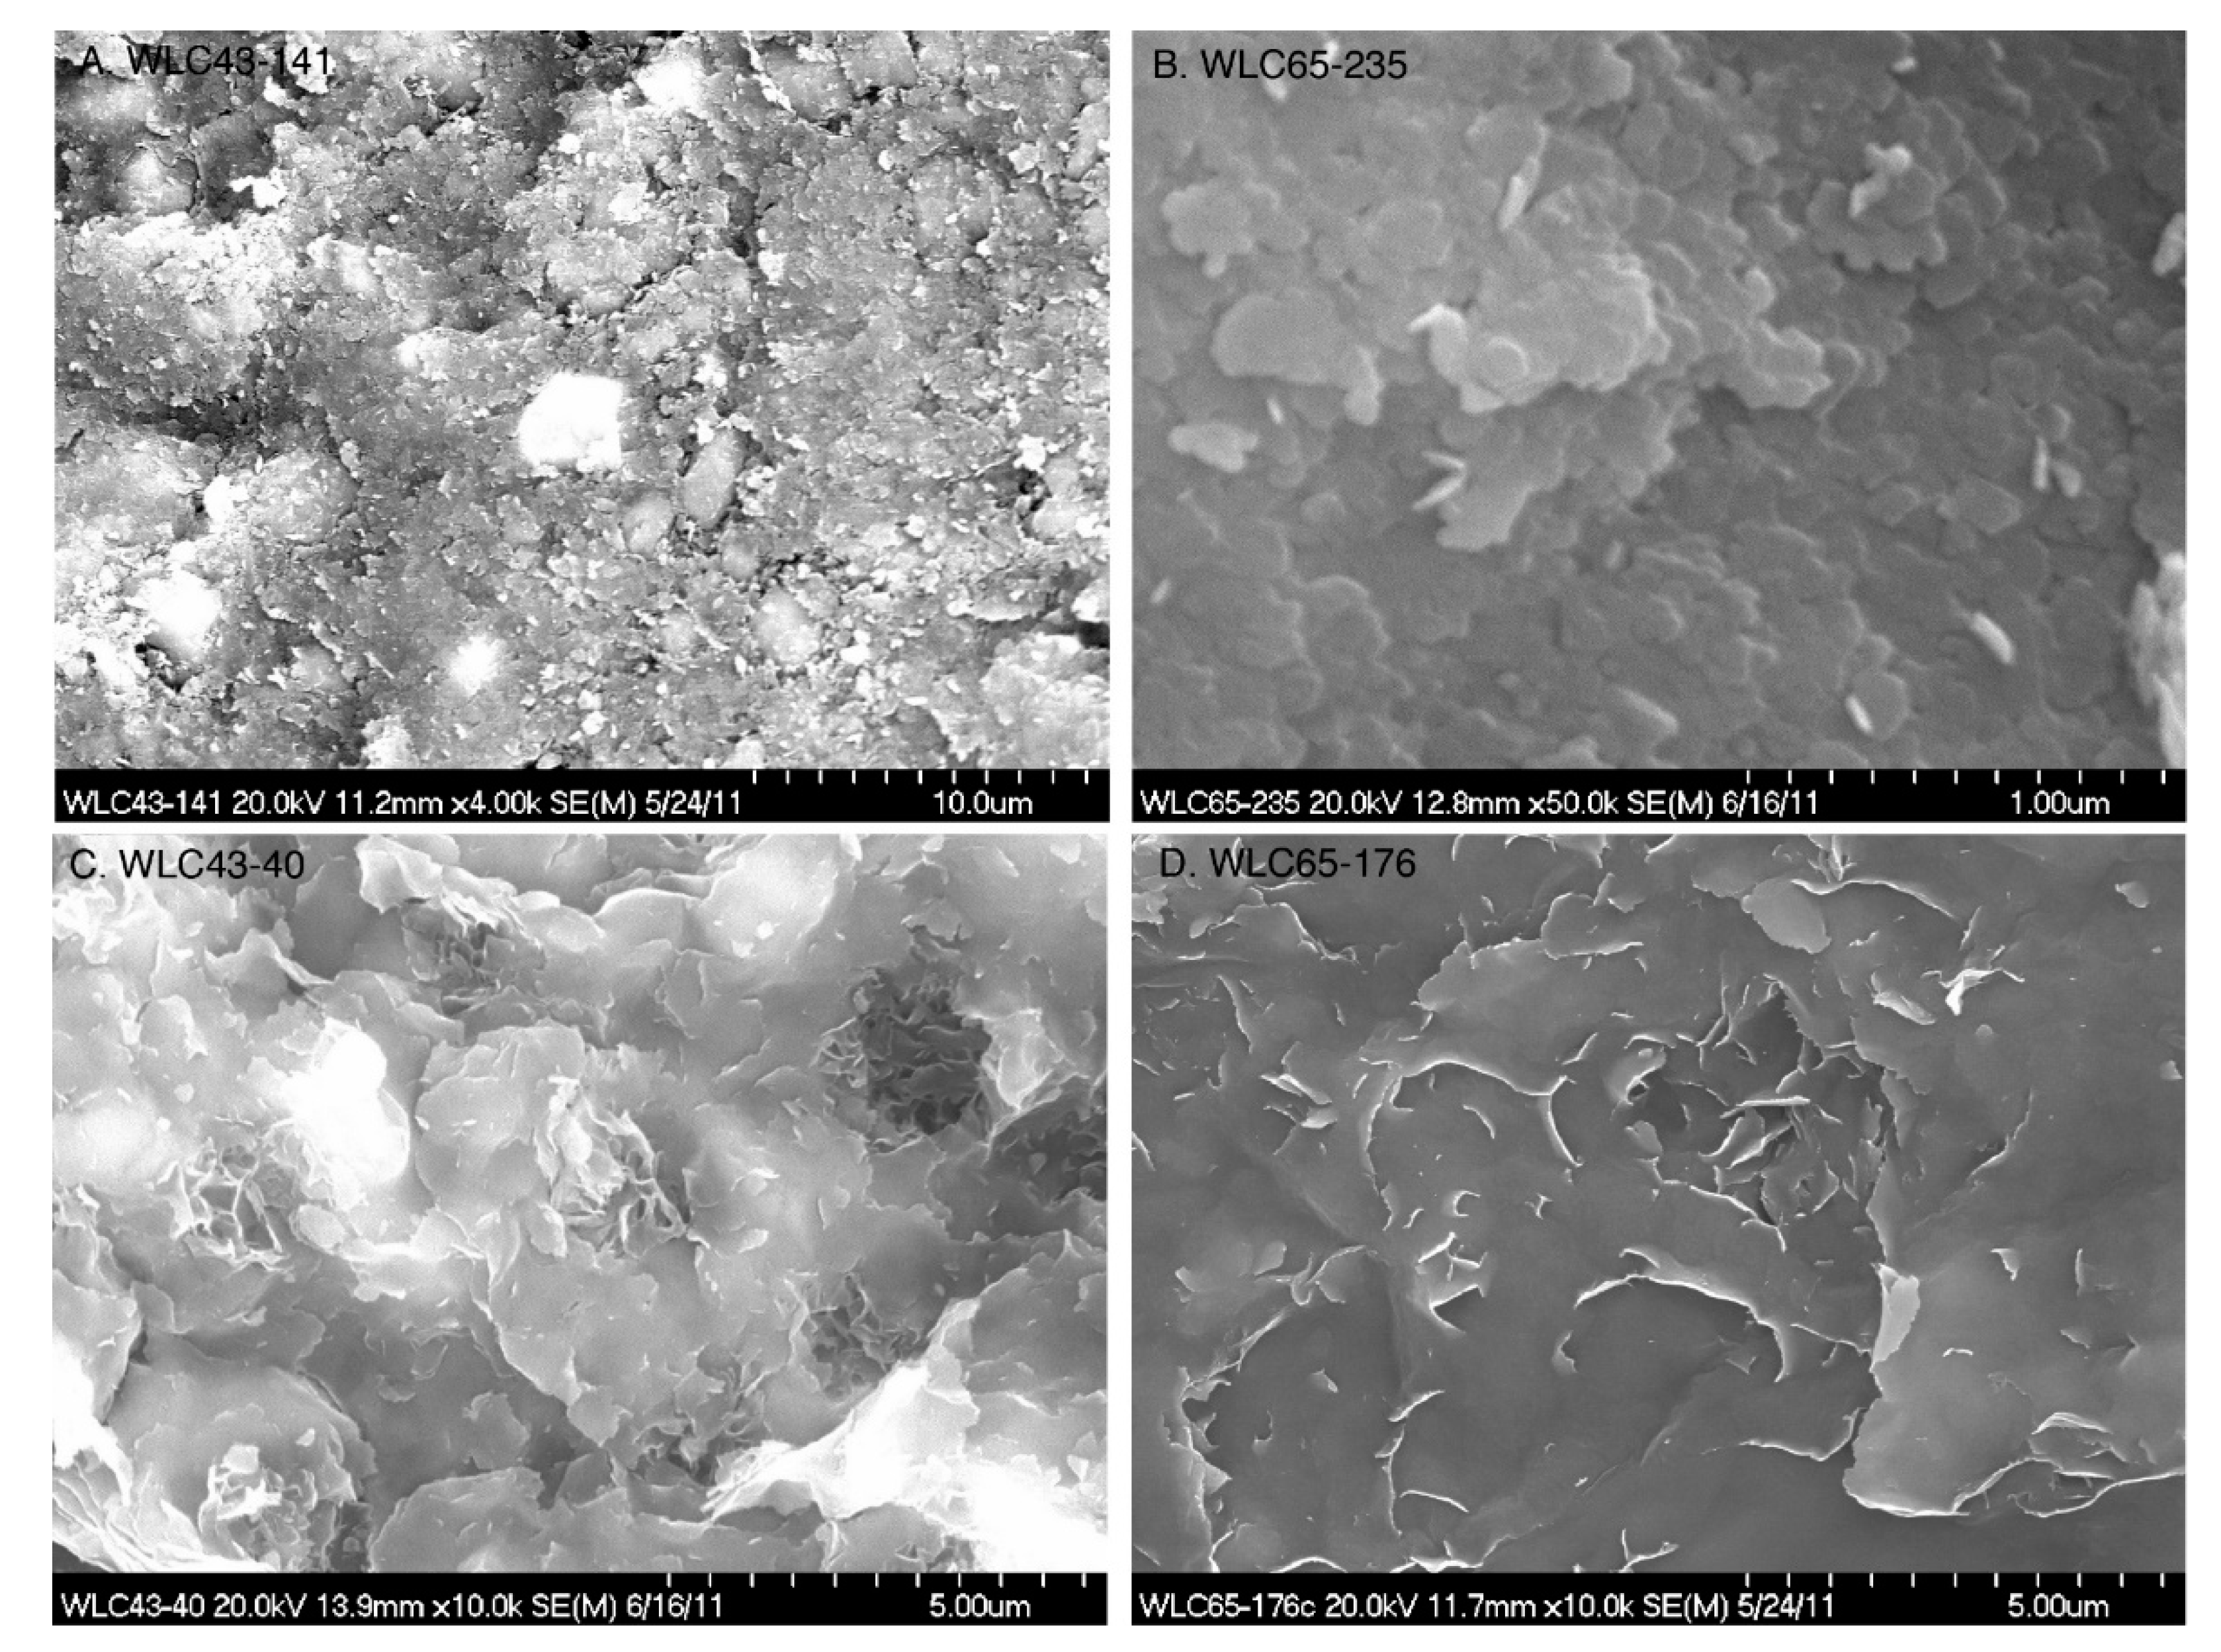
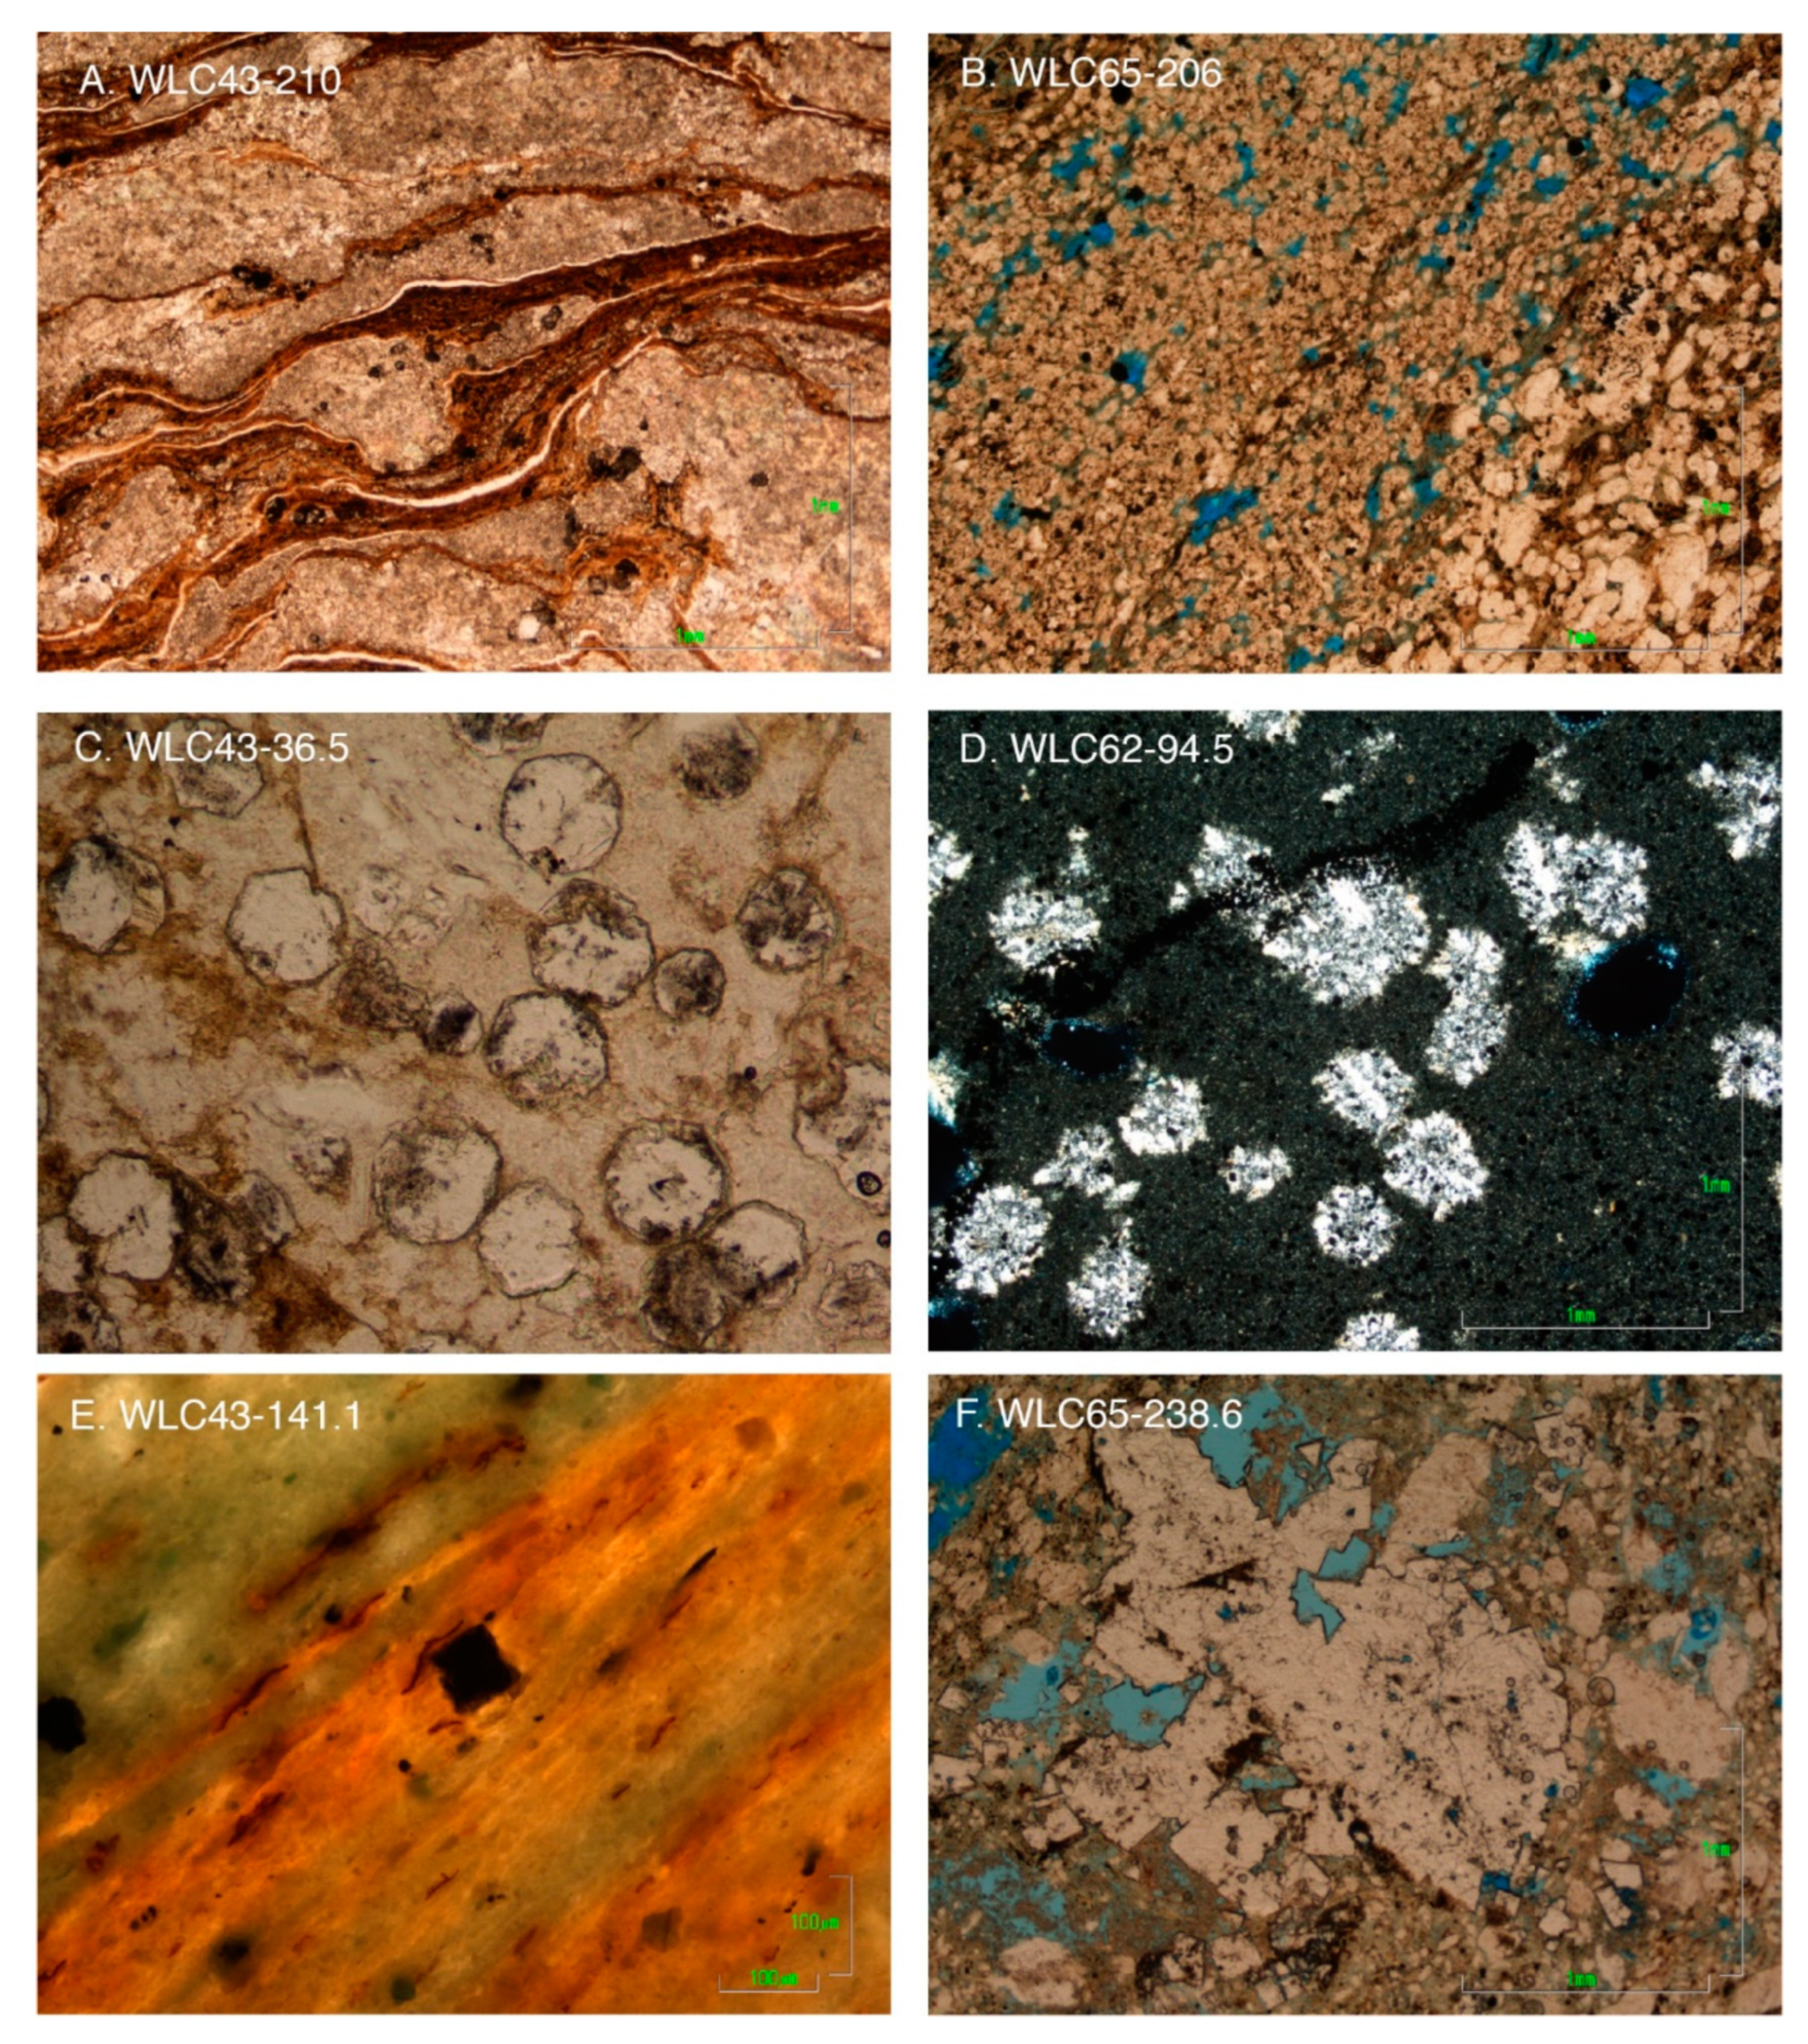
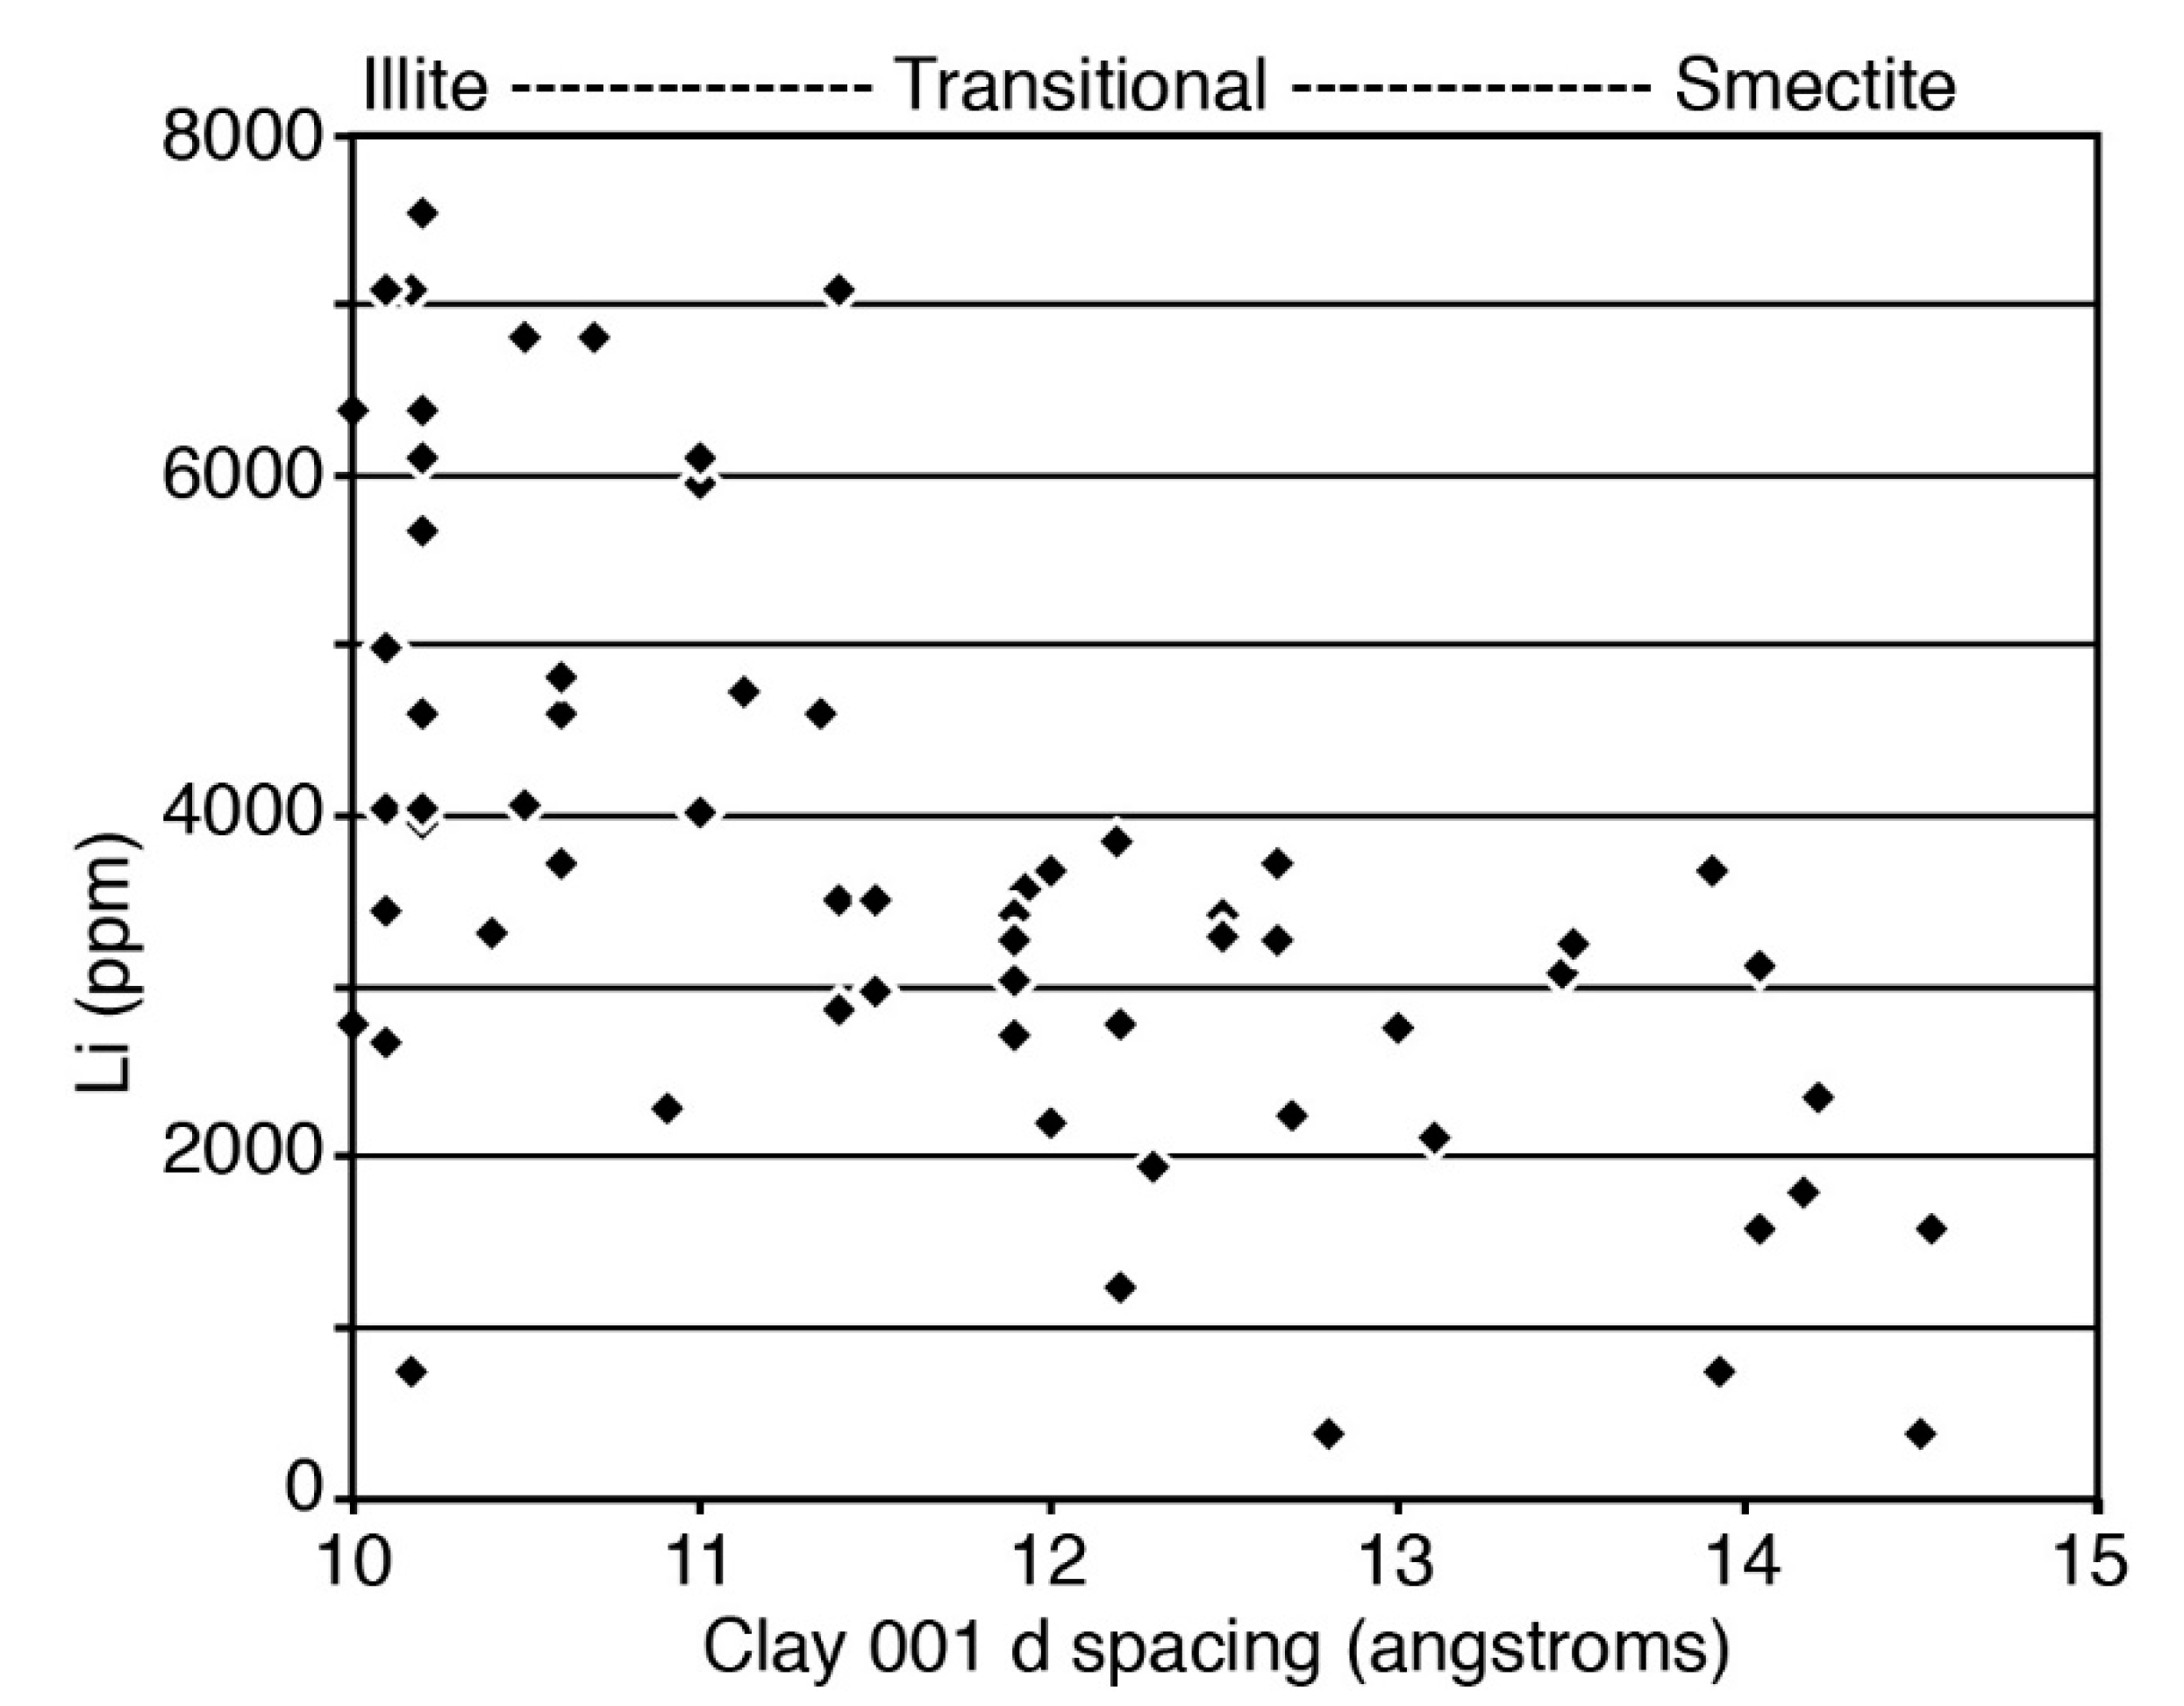
4.2.1. Clay Minerals: XRD Data

Clay that gives smectite XRD patterns mainly occurs in the upper part of the sedimentary sequence in Thacker Pass drill holes (Figure 6). Smectite in the McDermitt caldera has been identified as hectorite on the basis of XRD patterns and high Li and F contents of bulk samples [6,56,57], but this identification is equivocal. The 001 d spacing for Thacker Pass smectite is 12.4 to 14.5 angstroms for oven-dried samples; however, expansion in 52% humidity and by glycolation brings this spacing into line with ICDD hectorite patterns (Figure 8A). The ICDD hectorite pattern for the type locality at Hector, California, has 001 d of 15.8 angstroms for clay at 50% humidity, but a glycolated pattern is not available. Curiously, an ICDD pattern available for synthetic 16-angstrom hectorite gives no 001 d peak location. One of the tests for trioctahedral smectite, including hectorite, is a strong peak at d = 1. 53 to 1.54 angstroms [58]. Instead, the Thacker Pass Li-smectite shows a strong peak at 1.51 to 1.52 angstroms consistent with dioctahedral clay (Figure 8A).
The clay that dominates the lower, Li-rich part of the sedimentary sequence (Figure 6) is in the illite group on the basis of typically diffuse clay peaks with 001 d spacing of about 10 to 11 angstroms (Figure 8C). Glycolation has little or no effect on 001 d spacing of this clay, consistent with illite, in contrast to the large effect on smectite from the upper part of the sedimentary section (Figure 8A). Illite is technically not considered a mineral species, but instead a clay mineral group whose members are structurally analogous to the mica mineral muscovite. The illite group contains both dioctahedral and trioctahedral clays [59]. The Thacker Pass clay is clearly not a typical illite group mineral on the basis of its chemistry: it has high K like illite, but also high Mg, Li, and F (Table 4). On the basis of its chemistry and XRD peak locations (Figure 8C), the closest mica analog to the Thacker Pass illite is tainiolite, a trioctahedral Li mica found in pegmatites associated with peralkaline granites. The Thacker Pass Li-rich clay may be an as-yet unnamed Li clay mineral that is part of the illite group.
The illitic clay zone is overlain and underlain by clay that gives XRD patterns that are intermediate between smectite and illite, giving 001 clay peaks in dried samples at d = 11 to 12.5 angstroms (Figure 8B). Glycolation spreads the 001 peak for these clays to diffuse positions consistent with mixed clay, possibly randomly interstratified smectite-illite and/or mixed separate clay species. In drill holes WLC65 and WLC67, transitional clay occurs above the Li-rich zone, whereas it occurs mostly within the Li-rich zone in holes WLC43 and WLC62 (Figure 6).
Mixed clay that gives smectite or mixed clay XRD patterns (Figure 8D) occurs in samples taken from the base of the sedimentary section in all drill holes examined. Such samples are commonly oxidized. A dried sample containing smectite with 001 d of about 15 angstroms and low Li (~60 ppm) occurs in altered and oxidized McDermitt Tuff directly beneath the sedimentary section in hole WLC43.
A series of stacked XRD patterns for dried samples depicts the variation in 001 d-spacing at depths of 22 m to 101 m in hole WLC65 (Figure 9). The upper smectite zone is represented by a pattern with 001 d at 13.4 angstroms. Transitional clays between 36 and 60 m have 001 d of 11.4–12.8 angstroms, and illitic clay between 62 and 97 m gives 10.1–10.4 angstroms. A sample from just above the basal silicified zone (99–101 m) has 001 d = 11.9 angstroms, a transitional clay value. In contrast, other strong clay peaks (d = 4.52, 2.59, and 1.51 angstroms) are unchanged, or nearly so, from zone to zone.

4.2.2. Petrography

Thin section examination of the clays in Thacker Pass samples was not useful in clay species identification. Most of the clay, whether it gave smectite, illite, or transitional XRD patterns had similar maximum birefringence, first-order yellow or orange (0.010 to 0.015). Most illitic clay has slightly higher birefringence to second-order blue (0.020). However, a smectitic sample was found to contain some clay with local second-order yellowish-green birefringence (0.028). Individual clay grains were not distinguishable in thin section. Secondary SEM imaging shows that clay in the illite zone appears granular (Figure 10A) and at very high magnification as flat hexagonal plates about 0.1 µm across (Figure 10B). In contrast, smectite clay is present as smooth, convoluted, sheet-like masses with no discernable cystallinity (Figure 10C), and transitional clay exhibits similar morphology to that of smectite (Figure 10D).
Some sediment layers are wholly to partly composed of carbonate, mostly calcite on the basis of XRD scans. Li-rich claystone commonly contains calcite masses to 1 cm or more comprised of rhombs or anhedral grains < 1 mm across (Figure 3E). Locally these grains form sprays of thin blades (Figure 3E and Figure 11A) and in some cases crude radial rosettes that cross sedimentary lamina without disruption suggesting post-lithification recrystallization of existing crystals (possibly gypsum). On the basis of XRD analysis, dolomite occurs in claystone above the Li-rich zone in holes WLC62, WLC65, and WLC67, whereas it occurs in the upper part of the Li-rich zone in hole WLC43 (Figure 6). A slab of dolomite-rich mudstone (Figure 3F) shows dolomite occurring both as disseminated 50–200 µm rhombs that cross laminae and as nearly monomineralic layers to 300 µm thick.
In addition to detrital quartz (Figure 11B), quartz also occurs as authigenic masses or layers with radial or granular internal structure, in some cases with rectilinear alignment of elongate grains. Microcrystalline quartz is present as veins within and cutting across tuff layers in the high-Li zone in one drill hole (Figure 3H) and in a tuff layer in the smectite zone.
Analcime, the only zeolite found by XRD or thin section analysis in the Thacker Pass deposit, occurs in the smectite and transitional zones (Figure 6). It was identified in thin section of tuff as well-formed octahedral crystals ~100 µm across (Figure 11C) and in other samples as finely crystalline masses. Analcime is not present in the illite zone, but small equant masses of albite that are likely pseudomorphs after analcime are present in tuff (Figure 11D). The occurrence of analcime and albite in Thacker Pass rocks is similar to their occurrence in diagenetically altered Jurassic Morrison Formation (54).
The XRD scans indicate that mudstone samples commonly contain minor to moderately abundant authigenic K-feldspar and (or) albite. Feldspar appears as weakly birefringent, fine (<10 µm) grains in thin tuff layers, in irregular masses to 1 mm, and in lamina with clay or with fluorite + calcite. A sample collected from a thin tuff bed in the Li-rich zone and, subsequently, dated (sample WLC43-180; Table 2) consists almost entirely of K-feldspar replacing glass shards with ~5% pyrite and lesser calcite. This sample has ghosts of shards to 100 µm and lathy grains to 50 µm (zeolite?), now totally replaced by K-feldspar.
Pyrite occurs in almost all mudstone samples from depths greater than 12 to 20 m, above which it is mostly oxidized to goethite. The pyrite generally occurs as equant grains, commonly cubes, that are less than 100 µm across but locally as 1–2 mm cubes and irregular grains (Figure 11E). In a few samples the pyrite pseudomorphs thin blades of an unknown mineral (possibly marcasite). Bitumen with weak, brass-colored reflectance occurs as thin flakes, lenses, and shards, generally less than 5 µm across and commonly aligned parallel to mudstone lamina, in unoxidized mudstone, generally in amounts of 1% or less by volume (Figure 11E). Bitumen also occurs as sparse larger blobs, plates, or skeletal masses that may be fusinite (bitumen derived from wood fragments).
Fluorite, determined to be present by XRD analysis in specimens from all six holes shown in Figure 6 and elsewhere [55], was only identified in thin sections from two holes. Sandy mudstone from a 1 m interval in hole WLC65 contains crystalline masses and rosettes, similar to calcite in occurrence, that consist of fluorite cubes to 0.5 mm in clusters as much as 2.5 mm across (Figure 11F). The fluorite has sharp crystal boundaries against, and locally occurs within, quartz, suggesting that fluorite crystallization preceded some quartz crystallization. Similar fluorite was found in WLC67 with clay, feldspar, and calcite in a thin claystone layer in which bedding laminae are molded around fluorite crystals indicating that the sediment was still soft when the fluorite crystallized (Figure 3G).

4.3. Geochemistry

Almost the entire tuffaceous sedimentary section in the Thacker Pass area and wherever measured in the caldera has high Li contents, which correlate with clay mineralogy and abundance (Figure 5 and Figure 12; Table 3B). Analyses of 9880, generally 1.5 m (5 feet) core intervals from 206 drill holes from 2007–2011 in and around the Thacker Pass deposit gave mean and median Li values of 2506 and 2500 ppm, respectively. The highest Li content is 8850 ppm from a Thacker Pass drill hole [16].
The lower, illitic, most Li-rich zone in the deposit contains intervals with 3000–7000 ppm Li and a few <3000 ppm samples (Figure 12). Most intervals in the upper, smectitic zone have 1000–3000 ppm Li. The average Li content for all of hole WLC67, which intersected one of the thickest sedimentary sections (including a thick section of the relatively Li-poor upper part of the section) is 2518 ppm Li, whereas hole WLC62 which contains relatively more of the high-Li zone (likely due to the erosion of the relatively low-Li upper part of the section) averages 3461 ppm Li (Table 3B). In WLC58, the entire sedimentary section has an average Li content of 1659 ppm and a 24 m thick zone centered at about 140 m depth that averaged 3478 ppm Li (Figure 5; Table 3B).
In the drill holes that we analyzed, Li is highest in dark gray, carbon-rich claystone intervals that are common in the lower, illitic, parts of the section. The Li is consistently lower in light-colored ash intervals or intervals containing large amounts of ash. Where analyzed, the basal silicified zone gives Li values between 50 and 1510 ppm Li, with higher Li values in less silicified intervals. In most holes, intervals in the silicified zone were not analyzed, presumably because Western Lithium geologists found it to have low Li during early work.
Several major and trace elements are also enriched and generally correlate with Li in the Thacker Pass deposit (Figure 7). These include K (up to 7.5%), Rb (to 1030 ppm), Mo (to 323 ppm), and As (to 660 ppm), as well as Mg (to 8%) and Sb (to 37 ppm) (Mg and Sb not shown on Figure 7). Neither U nor Zr, elements enriched in the McDermitt U–Zr hydrothermal systems (or, for U, in roll-front deposits), correlate with Li. The tuffaceous sediments have mostly low concentrations of each, ≤19 ppm U (and mostly ≤10 ppm) and ≤130 ppm Zr. The highest values of each, 19–36 ppm U and >500 ppm Zr, are in underlying McDermitt Tuff, which also has 55–111 ppm Li.
Plots of Li versus Mo, Mg, and F content in hole WLC43 (the only hole of the four we examined with F analyses) illustrate variable correlation (Figure 13). Mg and F show partly linear correlations but with zones of high, non-correlative values. These data suggest Mg and F partly reside in the same mineral as Li (Li-rich clay, both smectite and illite) but also are present in separate non-Li phases, probably dolomite and fluorite. Mo loosely correlates with Li; its mineral site is unknown (Figure 13).
Similar Li-rich intervals are present in the four deposits in the western part of the caldera (Figure 5), where the upper part of the sedimentary section is eroded and neither detailed mineralogy nor chemical analyses other than Li are available. The most Li-rich intervals are generally 40–50 m above the base of the sedimentary section, slightly higher than in the section at Thacker Pass. Analyses of 2013 1.5 m interval samples from 38 core holes for the South lens show a mean and median of 2271 and 2200 ppm, respectively [16]. Hole MC82-009 (Figure 5; Table 3B) is an example. Fewer data are published for the other lenses. However, a core hole through the North lens intersected 110 m of tuffaceous sediments containing an average of 2158 ppm Li (MC83-059, Figure 5; Table 3B) [15].

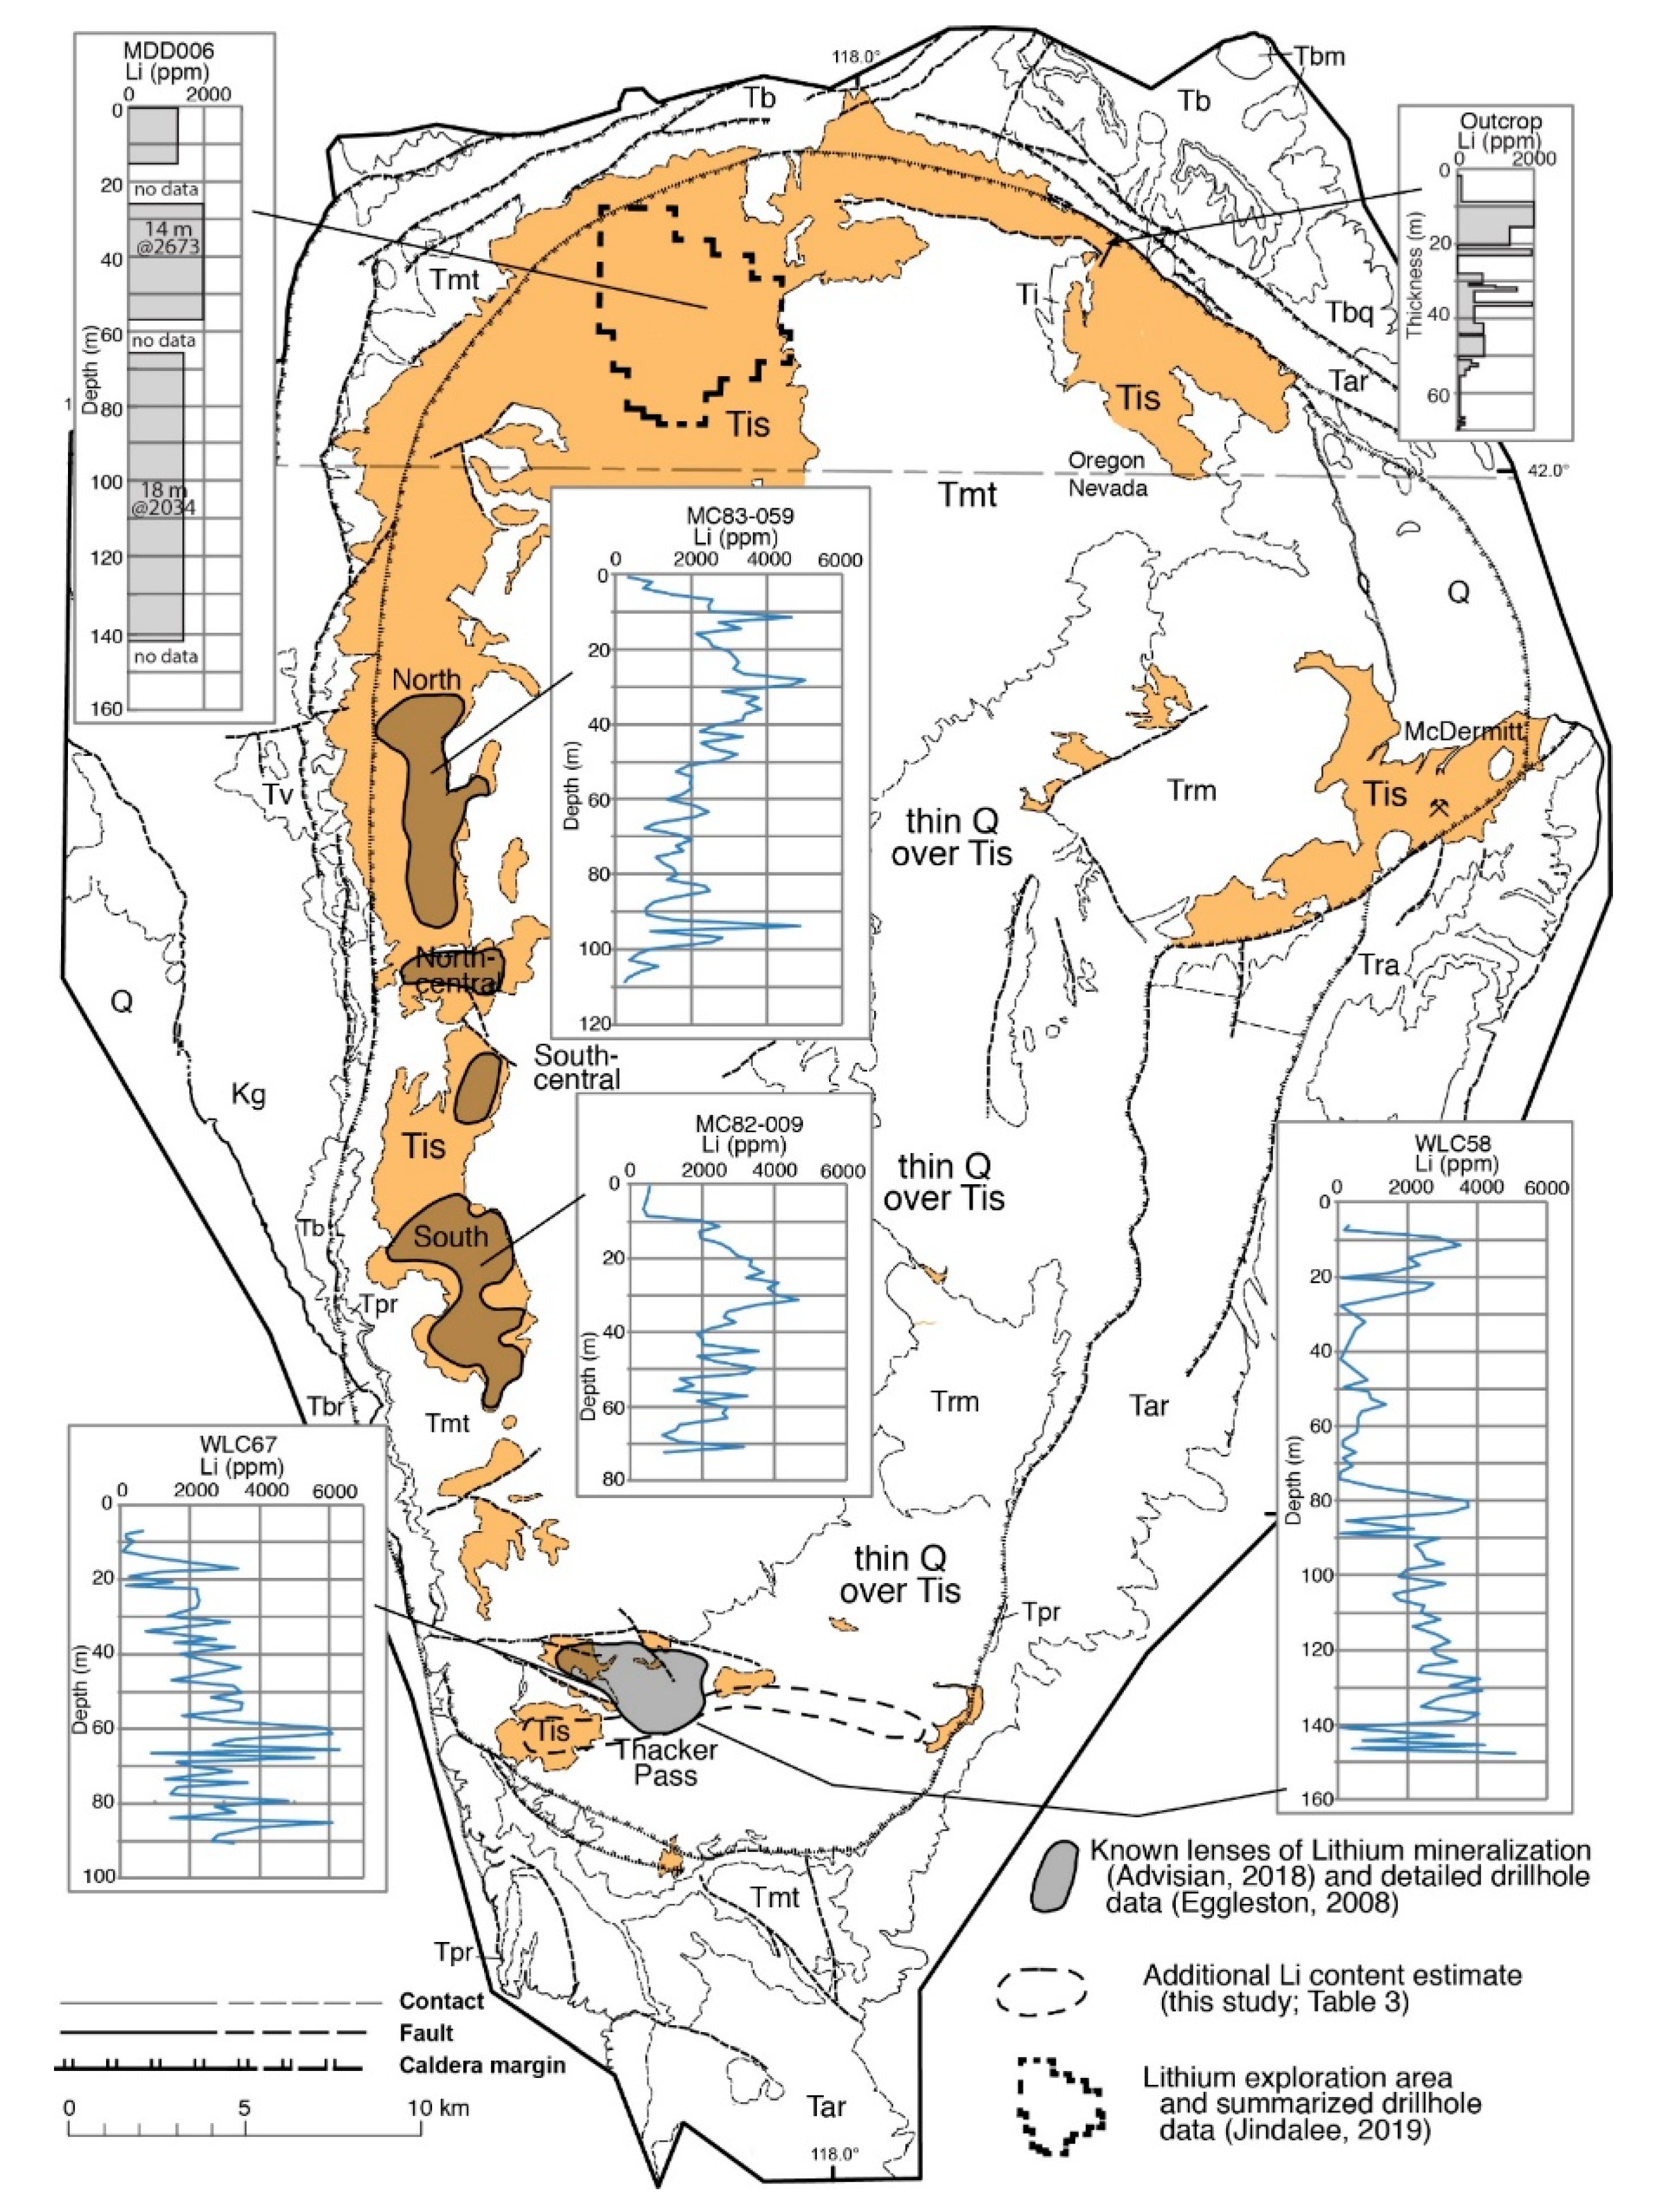
4.4. Distribution: Is Lithium Mineralization Continuous Around the Entire Caldera?

Lithium mineralization is widespread through the intracaldera tuffaceous sediments, possibly throughout the caldera (Figure 5) [5,6,7,15,16,17,18]. The mineralized lenses were initially defined by Chevron as potentially minable and further delineated by Western Lithium/Lithium Nevada. However, the lenses are simply potentially mineable deposits with the highest grades and greatest thicknesses (Table 3C), and Li mineralization is far more widespread between and beyond the lenses. Jindalee Resources is evaluating Li mineralization in a 27 km2, northwestern area of tuffaceous sediment outcrop (Figure 5) and announced an independently estimated, mid-point Exploration Target of 4.3 Mt contained Li based on a 1000 ppm Li cutoff, 3100 Mt rock, and 1400 ppm average Li grade for their project area (Table 3C) [18]. The Exploration Target is based on interpolation between 13 drill holes and outcrop of Li-bearing sediments using the requirements of JORC (2012) [47]. Lithium enrichment in the sedimentary section west of the Bretz Mine in the northeastern part of the caldera [5], at the McDermitt Hg mine [65], and drilling by Lithium Nevada Corp. between the Thacker Pass deposit and the southeastern caldera structural margin extend mineralization around 3/4 of the caldera (Figure 5). Little drilling has been done in the eastern part of the caldera, which is mostly covered by a thin veneer of Quaternary alluvium, and no information is publicly available. A U.S. government mineral resource assessment [8] assigned equal potential for Li mineralization to the intracaldera tuffaceous sediments throughout the caldera.

4.5. Timing of Lithium Mineralization

The presence of Li mineralization throughout the tuffaceous sedimentary sequence indicates mineralization postdates the youngest tephra date of 15.66 ± 0.04 Ma (Table 2). Our precise 40Ar/39Ar date of 14.87 ± 0.05 Ma of authigenic K-feldspar (WLC43-180; Table 2) [19] provides a direct date that postdates caldera-related magmatism by 1.2 Ma. The K-feldspar replaces glass shards in a 4 cm thick layer that includes minor calcite and pyrite. The containing 1.5 m assayed interval has 4840 ppm Li and is in the illitic clay zone (Figure 6). The K-feldspar certainly dates at least part of diagenesis, which may have proceeded over a significant time span (see Section 5.1.4. Timing).

5. Discussion

Sections of Li-enriched claystone are found in intra-caldera sedimentary deposits (Tis) throughout the caldera (Figure 5) [5,7,18,19,56]. Stratiform Li-rich deposits along the west side of the caldera appear to have occupied a continuous zone and may have originally extended throughout the intra-caldera lacustrine environment. The origin of these deposits, especially the relative contributions of low-temperature diagenesis versus higher temperature hydrothermal activity in providing and concentrating Li, is uncertain. A diagenetic mechanism would involve (1) dissolution of volcanic glass in the intra-caldera tuffaceous sedimentary sequence as the primary source of Li, (2) transport and concentration of Li and other constituents in groundwater that became alkaline and saline through reaction with glass and evaporation in the hydrologically closed basin, and (3) concentration, possibly partly through precipitation of diagenetic minerals (Li smecite and illite) and partly by reduction of the initially oxidized groundwater. This is similar to the interpretation of Glanzman and Rytuba [5] and Rytuba and Glanzman [6], although they also interpreted that Li was concentrated during analcime-related diagenesis, but that hydrothermal alteration converted analcime to K-feldspar.
A simple hydrothermal model analogous to the known epithermal deposits of the caldera is unrealistic given the distribution of Li mineralization throughout the caldera. However, the large Li budget discussed below suggests the need for an additional source of Li beyond only diagenesis of the tuffaceous sedimentary deposits, for example, the Benson et al. [14] model summarized in Section 1. In that model, meteoric water leached Li from solid rhyolite (probably through diagenesis but not specified), then interacted with hydrothermal water from degassing magmatic fluids to generate a composite hydrothermal-meteoric water that deposited Li along with the diagenetic minerals.

5.1. Origin of Lithium Mineralization: Key Characteristics

Our documented characteristics of Li mineralization in the McDermitt caldera provide considerable insight into the possible origin of the deposits. Key points to compare with possible mechanisms are (1) distribution of Li-mineralization throughout the intra-caldera tuffaceous sedimentary sequence, (2) alteration and Li mineralogy, (3) enrichment in Mo, As, Sb, K, Rb, Mg, F, and (4) timing of mineralization.

5.1.1. Distribution

Lithium-rich zones are present in the tuffaceous sedimentary sequence throughout most, possibly all, of the caldera over approximately a 43 km north–south and 28 km east–west area (Figure 5). The Li content drops to background levels in underlying McDermitt Tuff. The extent to which mineralization is present in the eastern part of the caldera is the only uncertainty. This wide distribution and restriction to the sedimentary section require a large-scale process active over the entire area. Diagenesis of the tuffaceous sediments would have affected the entire closed caldera basin. In contrast, known U–Zr and Hg hydrothermal mineralization in the caldera consists of several, isolated areas, each a few kilometers wide, on or near the caldera ring-fracture system (Figure 2). Lithium mineralization is definitely not focused along the ring-fracture system.

5.1.2. Mineralogy

Detailed mineralogical study of the Thacker Pass deposit reveals an assemblage containing smectitic and illitic clay, analcime, K-feldspar, and albite (Figure 6). Glanzman and Rytuba [5] and Rytuba and Glanzman [6] found similar mineralogy more broadly through the intra-caldera tuffaceous sedimentary sequence, additionally with the zeolites clinoptilolite, mordenite, and erionite. These minerals are those that form from closed hydrologic system diagenesis (CHSD) of volcanic glass. In CHSD, groundwater and connected surface water evolve through rock-water interaction, especially with highly soluble volcanic glass initially present as shards and pumice, and evaporation in a closed basin to become highly alkaline and saline [11,12]. The McDermitt caldera basin in which the tuffaceous sediments accumulated is an ideal example of such a closed basin. The typical mineralogical progression in CHSD as glass dissolves and water composition evolves is various forms of opaline silica, smectite, various zeolites (to analcime), and K-feldspar in the most alkaline and highly evolved systems.
The presence of the CHSD mineral assemblage, which at McDermitt includes Li smectite and illite, provides some of the strongest evidence for a diagenetic origin of Li mineralization. However, an obvious point is that most such diagenetic systems do not have Li-bearing smectite and illite, which implies McDermitt had some unusually rich Li source (see Section 5.2.).
Most CHSD occurs at near surface temperature, ≤50 °C [12], although diagenesis in a volcanically active area could be at higher temperature. Also, modern, alkaline lakes have recorded temperatures as high as 60 °C because they act as solar ponds (B.F. Jones, written communication in [66]). Glanzman and Rytuba [5] did not report a temperature of diagenesis but did interpret that hydrothermal alteration overprinted the diagenetic sequence at five locations in the caldera: at the McDermitt, Bretz, and Opalite mercury mines, a location 2 km south of the Bretz Mine, and a general area along the western part of the caldera that encompasses the Moonlight and Horse Creek uranium deposits (Figure 2). These areas did undergo hydrothermal alteration, but our dating indicates that hydrothermal activity at the McDermitt and Moonlight Mines accompanied ≥16 Ma caldera magmatism, whereas diagenesis was active at least at 14.9 Ma. Diagenesis overprinting hydrothermal alteration is more likely.
The presence of illite and albite could indicate higher temperatures. Based on studies of diagenesis of Tertiary deposits of the Gulf Coast, the presence of illite could indicate temperatures as high as 90–120 °C [67,68]. For example, the complete loss of expandable layers in the smectite-illite conversion, which is accompanied by increase of K from about 2% to 4%, occurs at depths of 2500–3000 m at about 100 °C [69]. Authigenic albite is thought to require approximately 100 °C based on studies of albitization of plagioclase [70,71,72]. A study of open hydrologic system diagenesis at Yucca Mountain, Nevada proposed even higher temperatures—175–200 °C for the transformation of analcime to albite and about 200 °C for the conversion of smectite to illite—in tuff at depths of about 1200 m in drill hole samples [73]. The same study speculated that this alteration was caused by hydrothermal input from a nearby caldera.
However, diagenetic illite and albite have been identified in tuffaceous sediments of the Jurassic Morrison Formation where it accumulated in a large (600 × 300 km), alkaline, saline lake in northwestern New Mexico and southwestern Colorado [66,74,75,76]. Turner and Fishman [66] and Turner-Peterson et al. [76] interpreted that pore-water chemistry can be more important than temperature in illite and albite formation, and that these minerals can form at near-surface temperatures in saline, alkaline lakes similar to the McDermitt caldera setting. For example, vitrinite reflectance values demonstrate that the Morrison Formation was subject to temperatures no greater than 75 °C. Further, albite is present in lacustrine beds of the Green River Formation (Piceance basin, Colorado and Utah) [77] and in Miocene borax-bearing lacustrine tuffs near Boron, California [78]. Both of these settings indicate the low temperature of albite formation. The Green River Formation has low vitrinite reflectance values (mean of 0.32% ± 0.1%) [79] that indicate maximum temperatures of approximately 50 °C, and primary borax in the Miocene beds is unstable above 58 °C [80].
The presence of anhedral-granular microcrystalline quartz in the basal silicified zone beneath the Thacker Pass deposit and locally in veins in the sedimentary sequence in the Thacker Pass deposit also allow hydrothermal activity. Amorphous silica can rapidly be replaced by chalcedony at temperatures up to 180 °C, and anhedral aggregates of quartz generally form above 180 °C in hydrothermal veins [81]. However, the conditions of formation of chalcedony or microcrystalline quartz are highly debated [82].
A preliminary conclusion from these disparate studies is that illite and albite can form over a wide temperature range, including at low to moderate temperatures, and their presence in McDermitt tuffaceous sediments does not require even moderate temperatures. A further complication is that no information exists for the temperature or other conditions of formation of Li illite (with tainiolite composition; Table 4) present in McDermitt tuffaceous sediments. Diagenesis in the McDermitt caldera could have occurred at temperatures as low as 25 °C and possibly as high as 70 °C, but temperatures greater than 100 °C could have existed only in special circumstances discussed below.

5.1.3. Geochemistry

Lithium mineralization in the Thacker Pass deposit is enriched in several major and trace elements: Mo, As, Sb, K, Rb, Mg, and F (Figure 7 and Figure 13). The significance of enrichment in these elements is uncertain because all except possibly Mg are enriched in both hydrothermal and low-temperature diagenetic systems. Miocene epithermal systems in the Great Basin [83] and hot-spring related Au–Ag systems [84] are enriched in these elements. More locally, the Moonlight U–Zr deposit in the ring-fracture of the McDermitt caldera is enriched in As, Mo, and Sb and has hydrothermal adularia and fluorite that indicate K and F enrichment [27].
A diagenetic origin of the elements would involve the same processes as a possible origin of Li: dissolution of volcanic glass to release them, transport by oxidizing groundwater, and precipitation by several possible mechanisms. Baseline concentrations of K (4–5% K2O), Rb (hundreds ppm), U (5–15 ppm), Mo (few ppm), and F (thousands ppm) are high in silicic rocks and glass, both at McDermitt and worldwide (Table S1) [85]. That U, Mo, As, Se, V, and other elements are soluble in oxidized groundwater and insoluble–precipitate–in reduced water has long been recognized [86,87,88]. Uranium roll-front deposits form from reduction of oxidized water with moderately low U concentrations and are variably enriched in these elements. For example, the uranyl (+6) ion is readily complexed and soluble in oxidized ground water, but reduction causes precipitation as insoluble U+4 minerals [86,89]. Mo, As, and Sb are enriched in the reduced part of the Li deposits, which could have been a trap for them. Moreover, source concentrations of these elements need not be high if the trapping mechanism is efficient. Uranium roll-front deposits are highly enriched even though the source volcanic glass (or granite) may have contained 5–15 ppm U. In a closed hydrologic system such as the McDermitt caldera, dissolved elements cannot escape.
If solution of glass, transport by oxidized groundwater, and trapping by reduction are important for enrichment of these elements with Li, the absence of U is curious. A possible explanation is that solution of glass released uranium, but the uranium did not undergo long-distance transport because it was locally trapped by precipitation or adsorption, for example by Fe–Ti–Mn oxyhydroxides [86,90,91]. Moreover, the absence of uranium is possibly more of a challenge for a hydrothermal origin, given the presence of abundant uranium and uranium-zirconium mineralization in the caldera.
Several elements (K, Rb, and F) are moderately abundant in the tuffaceous material that originally comprised the sedimentary section and may be only slightly redistributed within it.

5.1.4. Timing

The timing of Li mineralization is constrained by geologic relationships and a single 40Ar/39Ar date. Distribution of Li enrichment throughout the tuffaceous sedimentary sequence indicates some mineralization postdates the youngest tephra date of 15.66 ± 0.04 Ma (Table 2) which is confirmed by our 40Ar/39Ar date of 14.87 ± 0.05 Ma of authigenic K-feldspar (this study; [19]). This age postdates caldera-related magmatism by 1.2 Ma, which ended ca. 16.1 Ma with eruption of late icelandites, and the dated Moonlight and McDermitt hydrothermal systems by ca. 1.4 Ma. The date does not preclude involvement of hydrothermal activity, but what would drive a hydrothermal episode at 14.9 Ma is unknown. The reported lavas, possibly correlative with the 16.1 Ma icelandites, in the sedimentary section suggest magmatic activity could have been a source of heat and fluids during early sedimentary deposition, but not at 14.9 Ma.
The 14.9 Ma date only indicates the formation time of some K-feldspar, not necessarily the inception or duration of diagenesis. Epithermal hydrothermal deposits commonly form geologically rapidly, for example ≤50 ka for the giant Round Mountain Au–Ag deposit in a caldera in central Nevada [92]. In contrast, CHSD could be relatively protracted. Volcanic glass can dissolve, and zeolites and other minerals precipitate, rapidly in alkaline water [9,10,93,94]. Therefore, CHSD could have begun as soon as a lake formed and tuffaceous sediments began to accumulate in the McDermitt caldera, ca. 16.4 Ma. Diagenesis is a progressive chemical and mineralogical process that does not cease with solution of glass. Initial diagenetic minerals commonly alter to form new minerals either because the initial minerals are metastable or because the course of diagenesis gives rise to new conditions. Tuffaceous deposits continued to accumulate in the caldera at least until 15.66 ± 0.04 Ma (Table 2), so diagenesis probably would have continued at least until all soluble material was consumed or the closed basin was breached, ending alkaline conditions. Additionally, K-feldspar and analcime are interpreted to form by replacement of early formed zeolite [9]. Whether this is the case for the Thacker Pass K-feldspar is unknown, but it does allow the date to be for a late part of diagenesis. Hay [10] and Turner and Fishman [66] suggested that diagenesis could take as long as 500 ka. Geologic relationships and the 14.87 Ma date on K-feldspar (Table 2) suggest diagenesis could last much longer, at least as long as 1.2 Ma at Thacker Pass.

5.2. Can Diagenesis of Intra-Caldera Tuffaceous Sediments Provide All the Lithium?

That CHSD has occurred is certain. Formation of smectite in CHSD is normal, and illite and albite can be explained as the result of diagenesis in an alkaline, saline ground and surface water system. What is unusual is that these are Li-smectite and illite in the McDermitt system. Moreover, available data suggest that the whole sedimentary section throughout the caldera is enriched in Li. In Table 3, we present a rough (“back of the envelope”) calculation of how much Li may have been available from solution of glass in the tuffaceous sediments when deposited and how much Li may now be present as mineralization in the tuffaceous sediments. This calculation does not consider economic potential, just how much total Li is present. We concede in advance that our assumptions and calculations are very approximate but insist they are necessary for a preliminary evaluation of origin of mineralization. As well, most assumptions and calculations are testable.

5.2.1. How Much Li Was Initially Present in the Intra-Caldera Tuffaceous Sediments?

First, how much Li did the tuffaceous sediments contain before diagenesis? We consider that a best estimate is that the sediments covered 700 km2 of caldera (i.e., the caldera area without the resurgent dome), had an average thickness of 160 m, a density of 2, and an original Li content of 100 ppm based on our analyses of tephra (Table S1); with these values, the sediments contained an original 22.4 Mt Li (Table 3A). A maximum, and we consider unlikely, amount of contained Li is 40 Mt using the full 1000 km2 caldera area, 200 m average thickness, and 100 ppm original Li content.

5.2.2. How Much Li Is Present in Tuffaceous Sediments Now?

Using different assessment methods explained below, Lithium Nevada and Jindalee Resources have publicly announced Li mineralization totaling 7.8 Mt Li in a small part of the McDermitt caldera (Table 3C) [5,7,15,16,17,18]. This value alone is 35% of our best estimate of initial total Li of 22.4 Mt and 20% of our unlikely maximum of 40 Mt. The Lithium Nevada contribution is for their measured, indicated, and inferred values in the Thacker Pass deposit and the four Li-rich lenses (Figure 5; Table 3) [7,15,16]. The Jindalee contribution is their Exploration Target for their 27 km2 project area [18].
Because the resource estimates were done different ways, we briefly review how they were done and attempt to calculate a best estimate of total Li in the different exploration areas (Figure 5). The Li resource estimate for the ~4 km2 Thacker Pass deposit used the requirements of National Instrument 43–101 rules and guidelines established by the Canadian Institute of Mining Metallurgy and Petroleum Definition Standards for Mineral Resource and Mineral Reserves [95], an approach commonly used in North America. Lithium contents of Lithium Nevada’s North, North-Central, South-Central, and South lens (Figure 5) are historical estimates from [16]. Estimated Jindalee Resources used the guidelines of the Australasian Code for Reporting of Exploration Results, Mineral Resources and Ore Reserves [47]. Under these guidelines, Jindalee has done surface mapping and drilled 13 widely spaced core holes across 2/3 of their 27 km2 project area. Based on the outcrop and interpolation between drill holes, i.e., guidelines of [47], Jindalee reported an independently estimated, mid-point Exploration Target of 4.3 Mt contained Li using a 1000 ppm Li cutoff, 3100 Mt sediment, and 1400 ppm average Li grade for their project area [18] (Table 3C).
We have attempted to match the Jindalee JORC [47] calculation for an area around the Thacker Pass part of Lithium Nevada’s claim areas, but outside the Thacker Pass deposit, using publicly available data [7,15,16,46] (Figure 5). Our calculations are done solely to attempt to evaluate the total amount of Li in the caldera and compare this amount to our estimated original Li content of intracaldera tuffaceous sediments (Table 3A) to evaluate mechanisms of Li mineralization. We emphasize that our calculations have no implications for the best way to estimate resources, mining potential of any deposit or area in the McDermitt caldera, economics of mining, or the possibility of finding additional resources. Using this approach, a 9 km2 part of the Thacker Pass area, outside the Thacker Pass deposit, has sufficient drill hole information to roughly calculate an additional 1.84 Mt Li based on 9 drill holes, average Li of 3062 ppm, and a cut-off of 2000 ppm Li (data for a cut-off of 1000 ppm are not available) (Table 3C). Additional Li resources are likely present in the Thacker Pass area (Figure 5), but released data are insufficient for us to calculate them. Combining this value with all other estimates, a total area of approximately 58 km2 contains approximately 9.7 Mt Li. The area of 58 km2 is only 8% of the total area of intra-caldera tuffaceous sediments, but 9.7 Mt Li is 43% of our best estimate of an original 22.4 Mt Li in solid intra-caldera tuffaceous sediments and 24% of an unlikely maximum of 40 Mt Li (Table 3C). Extrapolating the amount of Li in the 58 km2 area over the entire 700 km2 area would suggest a total of approximately 120 Mt Li in the caldera. Although this extrapolation is unreasonable given that the smaller area represents parts that have established high Li contents, it suggests the magnitude of the problem.
Further qualitative evaluation of total Li in the caldera can be done by considering publicly available data on Li contents elsewhere in the caldera (Figure 5, Table 3). A striking point is that entire sections of tuffaceous sediments—surface to the underlying McDermitt Tuff—throughout the southern, western, and northern parts of the caldera are Li rich [15,17]. All reported drill holes and 1 outcrop section have high Li through all or almost all of the section. Obviously, all except the outcrop section are exploration and development drill holes that would be expected to focus on the best prospects.
Our favored origin of mineralization, leaching of Li from glass in the tuffaceous sediments by CHSD, implies that some parts of the sedimentary section should be depleted in Li. However, the data of Figure 5, Table 3 and Table S1 show almost no evidence for depletion in any examined part of the caldera. Drill hole WLC58 in the southern part of the caldera is approximately 0.6 km southeast of the Thacker Pass deposit (Figure 5), and therefore indicates Li variation outside of a defined deposit. The lower half of WLC58 has grades and thicknesses that would constitute part of the resource within the planned pit area if it were not so much deeper than the near-surface part of the Thacker Pass deposit. The upper half of the section is still significantly enriched in Li, with assays as high as 3510 ppm; the entire 188 m section averages 1659 ppm and has a lowest assay of 61 ppm; only 12 assays from the 106 for the entire section are less than a high background content of 200 ppm (Table 3B).
The least Li enriched sedimentary section in the caldera is the surface section in the northern part of the caldera [5], which showed a plot of %Li versus outcrop distance without specific Li contents. Based on the plot, the average Li content of the 68 m thick section is 590 ppm (Table 3B), and about half of the section probably had background levels of Li, including a 4 m thick section possibly with essentially no Li (Figure 5).
Lack of data for the eastern half of the caldera, other than that surface samples are anomalous, is the biggest constraint on estimating total Li. However, unless the entire eastern side is depleted, i.e., Li was extracted from there and transferred en-masse to the western side, we suggest not enough Li was available to generate the existing Li abundance in the caldera. Therefore, despite the mineralogical evidence that CHSD was essential in mobilizing and focusing Li mineralization and the large amount of Li that can be supplied by CHSD of tuffaceous sediments, that process acting on the tuffaceous sedimentary deposits alone may not have been sufficient to provide all the Li.

5.2.3. Possible Additional Sources of Li

(1) We have underestimated the initial amount of Li in the tuffaceous sediments, presumably in glass that could dissolve to supply Li, or the initial thickness of sediments. Thirteen analyses of glassy tephra samples range from 14–143 ppm Li, with a mean of 69 ± 48 ppm (Table S1). In contrast, Rytuba and Glanzman [6] reported an average of 230 ppm in unaltered tuffaceous sediments, more than triple our average, but did not report how many samples were analyzed, individual values, or what analytical method was used. However, their data table suggests it was emission spectroscopy, an old, low-accuracy and precision method [96]. Their plot of Li content in a drill hole in an unspecified location in the western part of the caldera shows values similar to those in Figure 5 [5], which suggests their data are reasonable [6]. Regardless, we consider the modern analytical data, which are consistent between company and our research data, are the best indication of Li contents.
Maximum preserved thickness of sediments in the caldera is about 200 m, with similar maximum thicknesses in the northern and southern parts of the caldera (Figure 5) [7,17,18,19,40]. Although the caldera has been eroded, and upper parts of the section are missing in structurally high areas such as the western lenses, no evidence exists for removal of a much greater section.
(2) Some of the extremely high, magmatic Li concentrations indicated by quartz-hosted melt inclusions [14,50] managed to get into the diagenetic water system. Hofstra et al. [50] and Benson et al. [14] interpreted that most magmatic Li exsolved into an aqueous phase as the magma neared the surface and/or erupted. Some of this exsolved Li and other volatiles could have coated glass shards or even been trapped in unbroken gas bubbles in pumice. Upon deposition of tephra in the McDermitt caldera, the first contact with water would wash off any shard coatings [50], and any mechanical or diagenetic process that broke down pumice would release trapped Li to groundwater. This entrapment and leaching mechanism were first proposed for magmatic U [97]. How much Li could be trapped and recycled this way versus how much would simply be lost to the atmosphere during magmatic degassing is unknown. However, even a small fraction could greatly increase the amount of Li provided to the McDermitt caldera basin.
(3) Hydrothermal activity immediately after caldera collapse could have introduced Li into groundwater. A residual magma chamber existed immediately after collapse. As the chamber cooled and solidified, volatile exsolution could have transferred Li into a hydrothermal fluid. The hydrothermal fluid could have reacted with surrounding rocks, generating hydrothermal mineral deposits, or interacted with meteoric groundwater [14]. Interacting with meteoric groundwater would enrich Li in the water that evolved to become the alkaline, saline diagenetic water. A small fraction of hydrothermal, approximately 200–300 °C water with a very high Li content probably would have no observable effect on the temperature of the combined water. Hydrothermal discharge shortly after caldera collapse would have been into the oldest and stratigraphically thinnest parts of the sedimentary section. Such discharge could have generated the basal silicified zone. However, this zone has notably low Li, and we do not know at what temperature it formed. Late, ca. 16.1 Ma, Icelandic magmatism could have repeated the hydrothermal contribution process when a thicker sedimentary sequence was present.
The U–Zr deposits of the caldera, e.g., the Moonlight Mine (Figure 2), probably formed from just such a hydrothermal system [27]. No data exist on Li in the U–Zr deposits. Precipitation of U-rich zircon at the Moonlight Mine and similar U–Zr deposits along the west side of the caldera probably would have depleted U and Zr from the hydrothermal fluid, which might partly explain the lack of U enrichment in the Li deposits.
We conclude that either of sources 2 and 3, which are variations on magmatic degassing, are possible, whereas source 1 is unlikely. Lithium mineralization could have a hydrothermal contribution, but CHSD was the primary mechanism for distributing Li throughout the caldera.

5.3. Implications for Additional Li Deposits

The definite diagenesis and possibility of a magmatic volatile or hydrothermal input to diagenetic water has several implications for regional exploration. If diagenesis alone or diagenesis with input of magmatic volatiles coated on shards were the only processes, other calderas in the area that have similar intra-caldera tuffaceous sediments (e.g., Virgin Valley, High Rock, and the Whitehorse area; Figure 1) could have similar Li mineralization. If hydrothermal input is required, the McDermitt caldera may be unique. The McDermitt caldera has abundant hydrothermal systems, whereas they are absent among other early Yellowstone hotspot calderas [19,27,28].
If the McDermitt and other middle Miocene magmas really had the extremely high Li contents indicated by Benson et al. [14], purely hydrothermal Li deposits are possible, although none have been found. On one hand, explosive eruption of caldera-forming tuff should disperse most magmatic Li. On the other, degassing of residual magma after ash-flow eruption could still have been a major source of Li.

5.4. Relationship to Li Brines

Lithium deposits in the McDermitt caldera may be the solidified remnants of Li brines. Alkaline, saline Li-rich brines such as in Clayton Valley (Figure 1) and around the world are present in closed, extensional basins that contain abundant tuffaceous material that has undergone or is undergoing diagenesis [2,13,98,99,100,101,102]. The source of Li in brines is debated but includes both diagenesis of the tuffaceous deposits and hydrothermal input. Mineralogy of brine host rocks has not been examined extensively but includes Li smectite (hectorite) and mixed smectite-illite in Clayton Valley [57,102]. The McDermitt caldera basin and these extensional basins are geologically similar and mostly differ only in mechanism of formation, caldera collapse versus extensional faulting. Variations in size, composition of sediment fill (e.g., proportions of tuffaceous versus non-tuffaceous material, and character of non-tuffaceous fill, whether silicic or carbonate), amount and composition of input water (in equilibrium with tuffaceous rocks, carbonates, etc.), and rate of evaporation mean no two alkaline, saline diagenetic systems will be identical. As a prime example, a lithium-boron deposit at Railroad Ridge near Clayton Valley (Figure 1) may be another solidified brine with the distinctive addition of B [103]. Rowe and Reynolds [103] describe the Rhyolite Ridge deposit as occurring in altered tuffaceous sediments deposited in an evaporative, alkaline lake in an extensional basin. Lithium occurs as smectite (hectorite) and mixed layer illite-smectite; authigenic K-feldspar is also present. Limestone and calcite-rich marl are major components of the Rhyolite Ridge sedimentary package, and pre-Cenozoic limestone is a prominent part of the surrounding basement.

5.5. Further Work

Our work greatly increases understanding of the characteristics and possible origin of the McDermitt Li deposits and has implications for both other clay-type and brine Li deposits. However, much more research obviously is needed to fully characterize the McDermitt deposits and elucidate their origin. The existing willingness of exploration companies to collaborate and their abundant drill holes, core, and cuttings at McDermitt greatly facilitate such research.
Our most detailed work is at the Thacker Pass deposit. Previous work suggests a similar diagenetic mineral assemblage is present elsewhere in the caldera [5,6]. Nevertheless, much more mineralogical and geochemical characterization is needed throughout the caldera, including to what extent Li mineralization is developed in the eastern part of the caldera. Diagenetic mineral assemblages in saline, alkaline lakes are generally concentrically zoned [10,66]. The only current data on zoning is a generalized depiction based on surface mineralogy [5], which leaves the zoning question open.
Additional dating of Li mineralization is needed, an avenue we are pursuing. Our one date on K-feldspar demonstrates that the fine-grained authigenic mineral, which is widespread in the intra-caldera tuffaceous sediments [5], can be precisely dated. Dating of K-feldspar more widely could reveal the overall duration of alteration, whether a prolonged episode, our preferred interpretation, or a brief event. An intriguing possibility is to date Li illite (tainiolite?; Table 4) which would specifically date Li mineralization, not just the spatially related K-feldspar.
How much total Li is present, and what Li sources are required or indicated by deposit characteristics are major questions. Can diagenesis of tuffaceous sediments provide all that is needed or is an additional—possibly hydrothermal—source required? Examination of melt inclusions in phenocrysts of McDermitt Tuff and tephra in the tuffaceous sediments would allow further quantification of both diagenetic and hydrothermal sources. A major uncertainty is in how much Li is present in tuffaceous sediments in the eastern part of the caldera, which has received little exploration to date.
Temperature of formation of the Li deposits is a related uncertainty. Our mineralogical, geochemical, and geochronological data allow low temperature of formation. However, if an additional Li source is required, introduction by hydrothermal fluids resulting from degassing of residual magma is a likely possibility. Mixing of meteoric and hydrothermal fluids could have generated a basin-wide, moderate temperature (<100 °C) fluid and locally a higher temperature (approximately 200 °C) fluid at discharge locations. Fluid inclusion thermometry of alteration minerals, a classic approach in economic geology, might be difficult in the mostly fine-grained alteration minerals—microcrystalline quartz, fluorite, and calcite. Vitrinite reflectance or pyrolysis data on organic matter might also be useful.
Isotopic data to characterize deposits and identify possible Li sources could be particularly useful [93,94]. Our geochemical data, and data on different rhyolite suites more broadly [14,37], indicate that rhyolites with a substantial crustal component have higher Li contents than peralkaline rhyolites that mostly interacted with accreted arc terrane. The different rhyolite suites have different radiogenic isotope compositions [34,35] and possibly different Li isotope compositions that could distinguish types and amounts of mantle and crustal contributions to the tuffaceous sediments and Li deposits [104,105]. Application of Li isotopes to the mobility of Li during magmatic degassing would greatly help evaluate the possible contribution of that process to Li mineralization [104]. Finally, Li isotopes might also help test temperature of formation of Li smectite and illite in McDermitt deposits.

6. Conclusions

Lithium mineralization is widespread in intra caldera tuffaceous sediments of the ca. 16.4 Ma McDermitt caldera and constitutes possibly the world’s largest Li clay resource. The most thoroughly studied Thacker Pass Li deposit contains a vertically zoned assemblage of Li-rich smectite (hectorite), Li-rich illite (tainiolite?), analcime, K-feldspar, and minor calcite, dolomite, and albite. The greatest Li enrichment is in the lower part of the sedimentary section, where Li occurs as illite. The elements K, Rb, Mo, As, and Sb are enriched along with Li. The mineral assemblage and at least a substantial part of Li enrichment originated through closed hydrologic system diagenesis (CHSD) of the host tuffaceous sediments in the closed caldera basin. An 40Ar/39Ar date of 14.9 Ma on K-feldspar in the Thacker Pass deposit is long after caldera igneous activity ended and consistent with diagenesis proceeding over a significant time span. The temperature of diagenesis is uncertain but most likely in the range 25 °C to 70 °C.
The amount of Li concentrated in zones of mineralization in the intra-caldera tuffaceous sediments is difficult to estimate precisely but appears to exceed the amount that could be derived only from diagenesis of the original tuffaceous sediments. This discrepancy suggests another Li source is required, which could be: (1) exsolved magmatic Li coating glass or trapped in unbroken bubbles in pumice. Dissolution of glass and mechanical breakdown and dissolution of pumice would quickly release this trapped Li to a diagenetic fluid upon or immediately following intra-caldera deposition. (2) Li-rich hydrothermal fluid derived from residual magma could mix with early diagenetic fluid shortly after caldera collapse during early intra-caldera tuffaceous sediment deposition or slightly later, during intrusion of ca. 16.1 Ma icelandite bodies. This hydrothermal source would only be available during initial sediment deposition.

Supplementary Materials

The following are available online at https://www.mdpi.com/2075-163X/10/1/68/s1, Table S1: Chemical analyses of tephra and altered tephra in the McDermitt caldera, Table S2: Comprehensive 40Ar/39Ar Analytical Data.

Author Contributions

S.B.C. did all of the XRD analysis and interpretation. C.D.H. did most of the geologic mapping, all the 40Ar/39Ar dating, and recognition that CHSD is a major feature of the sediments. Both participated in geochemical data interpretation and model development. All authors have read and agreed to the published version of the manuscript.

Funding

Funding for this project came partly from the US Department of Energy-US DOE. Yucca Mountain Project Office, Las Vegas, NV (contract 1950125-03). S.B.C. acknowledges considerable support from Western Lithium (Lithium Nevada Inc.) for the mineralogical studies.

Acknowledgments

We acknowledge considerable support and discussion with numerous geologists: Dennis Bryan, Tom Benson, Randall Burns (Lithium Nevada); Pip Darvall, Sara Holden (Jindalee Resources); and Lisa Stillings (US Geological Survey). The initial manuscript was reviewed by three Minerals reviewers and Tom Benson. 40Ar/39Ar dating was done at the New Mexico Geochronology Research Laboratory, under the highly capable guidance of Matt Heizler and Bill McIntosh.

Conflicts of Interest

The authors declare no competing interest.

References

  1. Gruber, P.W.; Medina, P.A.; Keoleian, G.A.; Kesler, S.E.; Everson, M.P.; Wallington, T.J. Global lithium availability: A constraint for electric vehicles? J. Ind. Ecol. 2011, 15, 760–775. [Google Scholar] [CrossRef]
  2. Kesler, S.E.; Gruber, P.W.; Medina, P.A.; Keolian, G.A.; Everson, M.P.; Wallington, T.J. Global lithium resources: Relative importance of pegmatite, brine and other deposits. Ore Geol. Rev. 2012. [Google Scholar] [CrossRef]
  3. Vikstrom, H.; Davidson, S.; Hook, M. Lithium availability and future production outlooks. Appl. Energy 2013, 110, 252–266. [Google Scholar] [CrossRef] [Green Version]
  4. Dessemond, C.; Lajoie-Leroux, F.; Soucy, G.; Laroche, N.; Magnan, J.-F. Spodumene: The lithium market, resources, and processes. Minerals 2019, 9, 334. [Google Scholar] [CrossRef] [Green Version]
  5. Glanzman, R.K.; Rytuba, J.J. Zeolite-Clay Mineral Zonation of Volcaniclastic Sediments within the McDermitt Caldera Complex of Nevada and Oregon; U.S. Geological Survey Open-File Report 79-1688; U.S. Geological Survey: Menlo Park, CA, USA, 1979; 25p.
  6. Rytuba, J.J.; Glanzman, R.K. Relation of Mercury, Uranium, and Lithium Deposits to the McDermitt Caldera Complex, Nevada–Oregon; Nevada Bureau of Mines and Geology Report 33; Nevada Bureau of Mines and Geology: Reno, NV, USA, 1979; pp. 109–117. [Google Scholar]
  7. Advisian. Independent Technical Report for the Thacker Pass Project, Humboldt County, Nevada, USA. 2018. Available online: https://www.lithiumamericas.com/_resources/pdf/investors/technical-reports/thacker-pass/Technical-Report-Thacker-Pass.pdf (accessed on 12 March 2019).
  8. Vikre, P.G.; Benson, M.E.; Bleiwas, D.I.; Colgan, J.P.; Cossette, P.M.; DeAngelo, J.; Dicken, C.L.; Drake, R.M., II; du Bray, E.A.; Fernette, G.L.; et al. Geology and Mineral Resources of the Sheldon-Hart Mountain National Wildlife Refuge Complex (Oregon and Nevada), the Southeastern Oregon and North-Central Nevada, and the Southern Idaho and Northern Nevada (and Utah) Sagebrush Focal Areas (ver. 1.1, October 28, 2016); U.S. Geological Survey Scientific Investigations Report 2016–5089–B; U.S. Geological Survey: Reston, VA, USA, 2016; 224p. [CrossRef] [Green Version]
  9. Hay, R.L. Zeolites and Zeolitic Reactions in Sedimentary Rocks; Geological Society of America Special Paper 85; Geological Society of America: Boulder, CO, USA, 1966; 130p. [Google Scholar]
  10. Hay, R.L. Geologic occurrence of zeolites and some associated minerals. Pure Appl. Chem. 1986, 58, 1339–1342. [Google Scholar] [CrossRef]
  11. Surdam, R.C. Zeolites in closed hydrologic systems. In Mineralogy and Geology of Natural Zeolites, Mineralogical Society of America Short Course Notes; Mumpton, F.A., Ed.; Mineralogical Society of America: Chantilly, VA, USA, 1977; Volume 4, pp. 65–91. [Google Scholar]
  12. Langella, A.; Cappelletti, P.; de Gennaro, R. Zeolites in closed hydrologic systems. Rev. Mineral. Geochem. 2001, 45, 235–260. [Google Scholar] [CrossRef]
  13. Davis, J.R.; Friedman, I.; Gleason, J.D. Origin of the Lithium-Rich Brine, Clayton Valley, Nevada; U.S. Geological Survey Bulletin 1622; U.S. Geological Survey: Reston, VA, USA, 1986; pp. 131–138.
  14. Benson, T.R.; Coble, M.A.; Rytuba, J.J.; Mahood, G.A. Lithium enrichment in intracontinental rhyolite magmas leads to Li deposits in caldera basins. Nat. Commun. 2017, 8. [Google Scholar] [CrossRef]
  15. Eggleston, T. Kings Valley Lithium Project, Nevada USA; NI 43-101 Technical Report; AMEC E&C Services Inc.: Phoenix, AZ, USA, 2008; 117p. [Google Scholar]
  16. SRK Consulting. Independent Technical Report for the Lithium Nevada Property, Nevada, USA. Lithium Americas Corp. 2016. Available online: http://www.lithiumamericas.com/LAC_NR_June_21_2016_FINAL.pdf (accessed on 12 May 2017).
  17. Jindalee Resources. ASX Release October 2019. Available online: https://www.jindalee.net/jrl/wp-content/uploads/austocks/jrl/2019_10_29_JRL_d1e0d7a895a9dd9c1156709f10528090.pdf (accessed on 5 November 2019).
  18. Jindalee Resources. ASX Release November 2019. Available online: https://www.jindalee.net/jrl/wp-content/uploads/austocks/jrl/2019_11_13_JRL_ef01ce5bf168c689e400d07583281067.pdf (accessed on 13 November 2019).
  19. Henry, C.D.; Castor, S.B.; Starkel, W.A.; Ellis, B.S.; Wolff, J.A.; Laravie, J.A.; McIntosh, W.C.; Heizler, M.T. Geology and evolution of the McDermitt caldera, northern Nevada and southeastern Oregon, USA. Geosphere 2017, 13, 1066–1112. [Google Scholar] [CrossRef] [Green Version]
  20. Camp, V.E.; Ross, M.E.; Duncan, R.A.; Jarboe, N.A.; Coe, R.S.; Hanan, B.B.; Johnson, J.A. The Steens Basalt. Earliest lavas of the Columbia River Basalt Group. In The Columbia River Flood Basalt Province; Reidel, S.P., Camp, V.E., Ross, M.E., Wolff, J.A., Martin, B.S., Tolan, T.L., Wells, R.E., Eds.; Geological Society of America Special Paper 497; Geological Society of America: Boulder, CO, USA, 2013; pp. 87–116. [Google Scholar] [CrossRef]
  21. Coble, M.A.; Mahood, G.A. Initial impingement of the Yellowstone plume located by widespread silicic volcanism contemporaneous with Columbia River flood basalts. Geology 2012, 40, 655–658. [Google Scholar] [CrossRef]
  22. Benson, T.R.; Mahood, G.A.; Grove, M.J. Geology and 40Ar/39Ar geochronology of the middle Miocene McDermitt volcanic field, Oregon and Nevada: Silicic volcanism associated with propagating flood basalt dikes at initiation of the Yellowstone hotspot. Geol. Soc. Am. Bull. 2017, 129, 1027–1051. [Google Scholar] [CrossRef]
  23. Brueseke, M.E.; Hart, W.K. Geology and Petrology of the Mid-Miocene Santa Rosa-Calico Volcanic Field, Northern Nevada; Nevada Bureau of Mines and Geology Bulletin 113; Nevada Bureau of Mines and Geology: Reno, NV, USA, 2008. [Google Scholar]
  24. Hausback, B.; Smith, J.; Henry, C.D.; Hilton, R.P.; McIntosh, W.C.; Heizler, M.T.; Noble, D.C. The High Rock caldera complex, NW Nevada: Geologic mapping, volcanology, geochemistry, and ultra-high precision 40Ar/39Ar dating of early Yellowstone hotspot magmatism. In Proceedings of the 2012 Fall Meeting, AGU, San Francisco, CA, USA, 3–7 December 2012. the Abstract V33B-2856. [Google Scholar]
  25. Coble, M.A.; Mahood, G.A. Geology of the High Rock caldera complex, northwest Nevada, and implications for intense rhyolitic volcanism associated with flood basalt magmatism and the initiation of the Snake River Plain-Yellowstone trend. Geosphere 2016, 12, 58–113. [Google Scholar] [CrossRef] [Green Version]
  26. Wypych, A.; Hart, W.; Scarberry, K.; McHugh, K.; Pasquale, S.A.; Legge, P.W. Geologic map of the Hawks Valley–Lone Mountain region, Harney County, Oregon; Oregon Department of Geology and Mineral Industries Open-File Report 0–11–12; Oregon Department of Geology and Mineral Industries: Portland, OR, USA, 2011; 28p.
  27. Castor, S.B.; Henry, C.D. Geology, geochemistry, and origin of volcanic rock-hosted uranium deposits in northwestern Nevada and southeastern Oregon. Ore Geol. Rev. 2000, 16, 1–40. [Google Scholar] [CrossRef]
  28. Ellis, B.S.; Wolff, J.A.; Boroughs, S.; Mark, D.F.; Starkel, W.A.; Bonnichsen, B. Rhyolitic volcanism of the central Snake River Plain: A review. Bull. Volcanol. 2013, 75, 745. [Google Scholar] [CrossRef]
  29. Pierce, K.L.; Morgan, L.A. The track of the Yellowstone hotspot: Volcanism, faulting, and uplift. Geol. Soc. Am. Mem. 1992, 179, 1–53. [Google Scholar]
  30. Pierce, K.L.; Morgan, L.A. Is the track of the Yellowstone hotspot driven by a deep mantle plume?—Review of volcanism, faulting, and uplift in light of new data. J. Volcanol. Geotherm. Res. 2009, 188, 1–25. [Google Scholar] [CrossRef]
  31. John, D.A.; Wallace, A.R.; Ponce, D.A.; Fleck, R.B.; Conrad, J.E. New perspectives on the geology and origin of the northern Nevada rift. In Geology and Ore Deposits 2000: The Great Basin and Beyond: Geological Society of Nevada Symposium Proceedings; Cluer, J.K., Price, J.G., Struhsacker, E.M., Hardyman, R.F., Morris, C.L., Eds.; Geological Society of Nevada: Reno, NV, USA, 2000; pp. 127–154. [Google Scholar]
  32. Streck, M.J.; Ferns, M.L.; McIntosh, W.C. Large, persistent rhyolitic magma reservoirs above Columbia River Basalt storage sites: The Dinner Creek Tuff eruptive center, eastern Oregon. Geosphere 2015, 11, 226–235. [Google Scholar] [CrossRef]
  33. Min, K.; Mundil, R.; Renne, P.R.; Ludwig, K.R. A test for systematic errors in 40Ar/39Ar geochronology through comparison with U/Pb analysis of a 1.1 Ga rhyolite. Geochim. Cosmochim. Acta 2000, 64, 73–98. [Google Scholar] [CrossRef]
  34. Kuiper, K.F.; Deino, A.; Hilgen, F.J.; Krijgsman, W.; Renne, P.R.; Wijbrans, J.R. Synchronizing rock clocks of Earth history. Science 2008, 320, 500–504. [Google Scholar] [CrossRef] [Green Version]
  35. Mahood, G.A.; Benson, T.R. Using 40Ar/39Ar ages of intercalated silicic tuffs to date flood basalts. Precise ages of Steens Basalt Member of the Columbia River Basalt. Earth Planet. Sci. Lett. 2017, 459, 340–351. [Google Scholar] [CrossRef] [Green Version]
  36. Rytuba, J.J.; McKee, E.H. Peralkaline ash flow tuffs and calderas of the McDermitt volcanic field, southeast Oregon and north central Nevada. J. Geophys. Res. 1984, 89, 8616–8628. [Google Scholar] [CrossRef]
  37. McIntosh, W.C.; Heizler, M.; Peters, L.; Esser, R. 40Ar/39Ar Geochronology at the New Mexico Bureau of Geology and Mineral Resources; New Mexico Bureau of Geology and Mineral Resources Open File Report OF-AR-1; New Mexico Bureau of Geology and Mineral Resources: Socorro, NM, USA, 2003; 10p. [Google Scholar]
  38. Steiger, R.H.; Jäger, E. Subcommission on geochronology. Convention on the use of decay constants in geo-and cosmochronology. Earth Planet. Sci. Lett. 1977, 36, 359–362. [Google Scholar] [CrossRef]
  39. Yates, R.G. Quicksilver Deposits of the Opalite District, Malheur County, Oregon, and Humboldt County, Nevada; U.S. Geological Survey Bulletin 931-N; U.S. Geological Survey: Reston, VA, USA, 1942; pp. 319–348.
  40. Wallace, A.B.; Roper, M.W. Geology and uranium deposits along the northeastern margin, McDermitt caldera complex, Oregon. In Uranium in Volcanic and Volcaniclastic Rocks; AAPG Studies in Geology; Goodell, P.C., Waters, A.C., Eds.; American Association of Petroleum Geologists: Tulas, OK, USA, 1981; pp. 73–79. [Google Scholar]
  41. Hetherington, M.J.; Cheney, E.S. Origin of the opalite breccia at the McDermitt mercury mine, Nevada. Econ. Geol. 1985, 80, 1981–1987. [Google Scholar] [CrossRef]
  42. McCormack, J.K. Paragenesis and Origin of Sediment-Hosted Mercury ore at the McDermitt Mine, McDermitt, Nevada. Master’s Thesis, University of Nevada, Reno, NV, USA, 1986; 97p. [Google Scholar]
  43. Greene, R.C. Volcanic Rocks of the McDermitt Caldera, Nevada–Oregon; U.S. Geol. Surv. Open-File Rept. 76–753; U.S. Geological Survey: Menlo Park, CA, USA, 1975.
  44. Castor, S.B.; Mitchell, T.P.; Quade, J.G. Vya Quadrangle, Nevada, California and Oregon; US Dept. of Energy Open-File Report PGJ/F135; U.S. Department of Energy: Grand Junction, CO, USA, 1982.
  45. Best, M.G.; Christiansen, E.H. Origin of broken phenocrysts in ash-flow tuffs. Geol. Soc. Am. Bull. 1997, 109, 63–73. [Google Scholar] [CrossRef] [Green Version]
  46. Lithium Nevada. 2018. Available online: https://www.lithiumamericas.com/news/lithium-americas-provides-updated-resource-estimate-for-the--lithium-nevada-project (accessed on 7 December 2019).
  47. JORC. The JORC Code. In Australasian Code for Reporting of Exploration Results, Mineral Resources and Ore Reserves, 2012 ed.; The Joint Ore Reserves Committee of the Australasian Institute of Mining and Metallurgy, Australian Institute of Geoscientists and Minerals Council of Australia (JORC): Carlton, Victoria, Australia, 2012; Available online: http://www.jorc.org/docs/jorc_code2012.pdf (accessed on 1 November 2019).
  48. Starkel, W.A.; Wolff, J.A.; Ellis, B.S.; Henry, C.D.; Rowe, M.C. Petrogenesis of the eruptive products at the mid-Miocene McDermitt caldera center, northern Nevada and southern Oregon. In Proceedings of the 2012 AGU Fall Meeting, San Francisco, CA, USA, 3–7 December 2012. Abstract V31C-2807. [Google Scholar]
  49. Henry, C.D.; John, D.A. Magmatism, ash-flow tuffs, and calderas of the ignimbrite flareup in the western Nevada volcanic field, Great Basin, USA. Geosphere 2013, 9, 951–1008. [Google Scholar] [CrossRef] [Green Version]
  50. Hofstra, A.H.; Todorov, T.I.; Mercer, C.N.; Adams, D.T.; Marsh, E.E. Silicate melt inclusion evidence for extreme pre-eruptive enrichment and post-eruptive depletion of lithium in silicic volcanic rocks of the western United States. Implications for the origin of lithium-rich brines. Econ. Geol. 2013, 108, 1691–1701. [Google Scholar] [CrossRef]
  51. Brueseke, M.E.; Callicoat, J.S.; Hames, W.; Larson, P.B. Mid-Miocene rhyolite volcanism in northeastern Nevada. The Jarbidge Rhyolite and its relationship to the Cenozoic evolution of the northern Great Basin (USA). Geol. Soc. Am. Bull. 2014, 126, 1047–1067. [Google Scholar] [CrossRef]
  52. Rytuba, J.J. Geology and Ore Deposits of the McDermitt Caldera, Nevada-Oregon; U.S. Geological Suarvey Open-File Report 76-535; U.S. Geological Survey: Menlo Park, CA, USA, 1976; 9p.
  53. Noble, D.C.; McCormack, J.K.; McKee, E.H.; Silberman, M.L.; Wallace, A.B. Time of mineralization in the evolution of the McDermitt caldera complex, Nevada–Oregon, and the relation of middle Miocene mineralization in the northern Great Basin to coeval regional basaltic magmatic activity. Econ. Geol. 1988, 83, 859–863. [Google Scholar] [CrossRef]
  54. Rytuba, J.J.; John, D.A.; Foster, A.; Ludington, S.D.; Kotlyar, B. Hydrothermal Enrichment of Gallium in Zones of Advanced Argillic Alteration–Examples from the Paradise Peak and McDermitt ore Deposits; U.S. Geological Survey Bulletin 2209C; U.S. Geological Survey: Reston, VA, USA, 2003; 16p.
  55. Hudson, D.M. Analysis of Diamond Drill Holes WLC-005c, WLC-011c, WLC-012c, WLC-019c, Thacker Pass Project, Humboldt County, Nevada; Unpublished Report; Western Lithium Corporation: Reno, NV, USA, 2008; 41p. [Google Scholar]
  56. Odom, I.E. Hectorite deposits in the McDermitt caldera of Nevada. Soc. Min. Eng. Prepr. 1992, 1992, 586–589. [Google Scholar]
  57. Morissette, C.L. The Impact of Geological Environment on the Lithium Concentration and Structural Composition of Hectorite Clays. Master’s Thesis, University of Nevada-Reno, Reno, NV, USA, 2012. [Google Scholar]
  58. Poppe, L.J.; Paskevich, V.F.; Hathaway, J.C.; Blackwood, D.S. A Laboratory Manual for X-ray Powder Diffraction. U.S. Geological Survey Open-file Report 01-041, CD-ROM; 2001. Available online: http://pubs.usgs.gov/of/2001/of01-041/htmldocs (accessed on 10 May 2012).
  59. Deer, W.A.; Howie, R.A.; Zussman, J. An Introduction to the Rock-Forming Minerals; Longmans: London, UK, 1966; p. 528. [Google Scholar]
  60. Anthony, J.W.; Bideaux, R.A.; Bladh, K.W.; Nichols, M.C. (Eds.) Handbook of Mineralogy; Mineralogical Society of America: Chantilly, VA, USA, 1995; Available online: http://www.handbookofmineralogy.org/ (accessed on 28 February 2019).
  61. Mineralienatlas. Trilithionite. Available online: https://www.mineralienatlas.de/lexikon/index.php/MineralData?mineral=Trilithionit (accessed on 20 September 2019).
  62. Ames, L.L.; Sand, L.B.; Goldich, S.S. A contribution on the Hector, California bentonite deposit. Econ. Geol. 1958, 53, 22–37. [Google Scholar] [CrossRef]
  63. Gaudette, H.E.; Eades, J.L.; Grim, R.E. The nature of illite. Clays Clay Miner. 1964, 13, 33–48. [Google Scholar] [CrossRef]
  64. Kerr, P.F.; Hamilton, P.K.; Pill, R.J. Reference Clay Minerals, American Petroleum Institute Research Project 49; Columbia University: New York, NY, USA, 1950. [Google Scholar]
  65. Mineral Resources Data System. McDermitt Mine. 2019. Available online: https://mrdata.usgs.gov/mrds/show-mrds.php?dep_id=10197229 (accessed on 21 August 2018).
  66. Turner, C.E.; Fishman, N.S. Jurassic Lake T’oo’dichi’: A large alkaline, saline lake, Morrison Formation, eastern Colorado Plateau. Geol. Soc. Am. Bull. 1991, 103, 538–558. [Google Scholar] [CrossRef]
  67. Boles, J.R.; Franks, S.G. Clay diagenesis in Wilcox sandstones of southwest Texas. Implications of smectite diagenesis on sandstone cementation. J. Sediment. Petrol. 1979, 49, 55–70. [Google Scholar]
  68. Bourdelle, F.; Parra, T.; Beyssac, O.; Chopin, C.; Vidal, O. Clay minerals as geo-thermometer: A comparative study based on high spatial resolution analyses of illite and chlorite in Gulf Coast sandstones (Texas, USA). Am. Mineral. 2013, 98, 914–926. [Google Scholar] [CrossRef]
  69. Perry, E.; Hower, J. Burial diagenesis in Gulf Coast pelitic sediments. Clays Clay Miner. 1970, 18, 165–177. [Google Scholar] [CrossRef]
  70. Milliken, K.L.; Land, L.S.; Loucks, R.J. History of burial diagnesis determined from isotopic geochemistry, Frio Formation, Brazoria County, Texas. Am. Assoc. Pet. Geol. Bull. 1981, 65, 1397–1413. [Google Scholar]
  71. Helmold, K.P.; van de Kemp, P.C. Diagenetic Mineralogy and Controls on Albitization and Laumontite Formation in Paleogene Arkoses, Santa Ynez Mountains, California, Clastic Diagenesis; American Association of Petroleum Geologists Memoir 37; McDonald, D.A., Surdam, R.C., Eds.; American Association of Petroleum Geologists: Tulsa, OK, USA, 1984; pp. 239–276. [Google Scholar]
  72. Gold, P.B. Textures and geochemistry of authigenic albite from Miocene sandstones, Louisiana Gulf Coast. J. Sediment. Petrol. 1987, 57, 353–362. [Google Scholar]
  73. Bish, D.L.; Aronson, J.L. Paleogeothermal and paleohydrologic conditions in silicic tuff from Yucca Mountain, Nevada. Clays Clay Miner. 1993, 41, 148–161. [Google Scholar] [CrossRef]
  74. Jones, B.F.; Weir, A.H. Clay minerals of Lake Abert, an alkaline, saline lake. Clays Clay Miner. 1983, 31, 161–172. [Google Scholar] [CrossRef]
  75. Singer, A.; Stoffers, P. Clay mineral diagenesis in two East African lake sediments. Clay Miner. 1980, 15, 291–307. [Google Scholar] [CrossRef]
  76. Turner-Peterson, C.E.; Fishman, N.S.; Owen, D.E. Low-temperature formation of illite–Implications for clay geothermometry and hydrocarbon generation. U.S. Geol. Surv. Circ. 1989, 1025, 62–63. [Google Scholar]
  77. Cole, R.D. Depositional environments of oil shale in the Green River Formation, Douglas Creek Arch, Colorado and Utah. In Geology and Energy Resources; Picard, M.D., Ed.; Uinta basin of Utah; Utah Geological Association: Salt Lake City, UT, USA, 1985; pp. 211–224. [Google Scholar]
  78. Williamson, B.M. Formation of authigenic silicate minerals in Miocene volcaniclastic rocks, Boron, California. Master’s Thesis, University of California, Santa Barbara, CA, USA, 1987; 89p. [Google Scholar]
  79. Nuccio, V.F.; Johnson, R.C. Surface vitrinite-reflectance map of the Uinta, Piceance, and Eagle basins area, Utah and Colorado. In U.S. Geological Survey Miscellaneous Field Studies Map MF-2008-B, Scale 1:500,000; U.S. Geological Survey: Reston, VA, USA, 1988. [Google Scholar]
  80. Christ, C.L.; Garrels, R.M. Relations among sodium borate hydrates at the Kramer deposit, Boron, California. Am. J. Sci. 1959, 257, 516–528. [Google Scholar] [CrossRef]
  81. Fournier, R.O. The behavior of silica in hydrothermal solutions. In Geology and Geochemistry of Epithermal Systems, Reviews in Economic Geology; Berger, B.R., Bethke, P.M., Eds.; Society of Economic Geologists: El Paso, TX, USA, 1985; Volume 2, pp. 45–61. [Google Scholar]
  82. Nash, D.J.; Hopkinson, L. A reconnaissance laser Raman and Fourier transform infrared survey of silcretes from the Kalahari Desert, Botswana. Earth Surf. Process. Landf. 2004, 29, 1541–1558. [Google Scholar] [CrossRef]
  83. John, D.A. Miocene and early Pliocene epithermal gold-silver deposits in the northern Great Basin, western United States: Characteristics, distribution, and relationship to magmatism. Econ. Geol. 2001, 96, 1827–1853. [Google Scholar] [CrossRef] [Green Version]
  84. Berger, B.R.; Silberman, M.L. Relationships of trace-element patterns to geology in hot-spring-type precious-metal deposits. In Geology and Geochemistry of Epithermal Systems: Society of Economic Geology Reviews in Economic Geology; Berger, B.R., Bethke, P.M., Eds.; Society of Economic Geologists: El Paso, TX, USA, 1985; Volume 2, pp. 233–247. [Google Scholar]
  85. Mercer, C.N.; Hofstra, A.H.; Todorov, T.I.; Roberge, J.; Burgisser, A.; Adams, D.T.; Cosca, M. Pre-eruptive conditions of the Hideaway Park topaz rhyolite: Insights into metal source and evolution of magma parental to the Henderson porphyry molybdenum deposit, Colorado. J. Petrol. 2015, 56, 645–679. [Google Scholar] [CrossRef] [Green Version]
  86. Langmuir, D. Uranium solution-mineral equilibria at low temperatures with applications to sedimentary ore deposits. Geochim. Cosmochim. Acta 1978, 42, 547–569. [Google Scholar] [CrossRef]
  87. Harshman, E.N.; Adams, S.S. Geology and Recognition Criteria for Roll-Type Uranium Deposits in Continental Sandstones; Final Report; GJBX-1(81); U.S. Department of the Interior: Grand Junction, CO, USA, 1980; 185p. [Google Scholar]
  88. Hall, S.M.; Mihalasky, M.J.; Tureck, K.R.; Hammarstrom, J.M.; Hannon, M.T. Genetic and grade and tonnage models for sandstone-hosted roll-type uranium deposits, Texas Coastal Plain. Ore Geol. Rev. 2017, 80, 716–753. [Google Scholar] [CrossRef]
  89. Hostetler, P.B.; Garrels, R.M. Transportation and precipitation of uranium and vanadium at low temperatures with special reference to sandstone-type uranium deposits. Econ. Geol. 1962, 57, 157–167. [Google Scholar] [CrossRef]
  90. Henry, C.D.; Duex, T.W. Uranium in Diagenesis of the Pruett, Duff, and Tascotal Formations, Trans-Pecos Texas, Uranium in Volcanic and Volcaniclastic Rocks; American Association of Petroleum Geologists Studies in Geology No. 13; American Association of Petroleum Geologists: Tulsa, OK, USA, 1981; pp. 167–180. [Google Scholar]
  91. Walton, A.W.; Galloway, W.E.; Henry, C.D. Release of uranium from the volcanic glass in sedimentary sequences: An analysis of two systems. Econ. Geol. 1981, 76, 69–88. [Google Scholar] [CrossRef]
  92. Henry, C.D.; Elson, H.B.; McIntosh, W.C.; Heizler, M.T.; Castor, S.B. Brief duration of hydrothermal activity at Round Mountain, Nevada determined from 40Ar/39Ar geochronology. Econ. Geol. 1997, 92, 807–826. [Google Scholar] [CrossRef] [Green Version]
  93. Sheppard, R.A.; Gude, A.J. Distribution and Genesis of Authigenic Silicate Minerals in Tuffs of Pleistocene Lake Tecopa, Inyo County, California, 3rd ed.; U.S. Geological Survey Professional Paper 597; U.S. Geological Survey: Reston, VA, USA, 1968; 38p.
  94. Taylor, M.W.; Surdam, R.C. Zeolite reactions in the tuffaceous sediments of Teels Marsh, Nevada. Clays Clay Miner. 1981, 29, 341–352. [Google Scholar] [CrossRef]
  95. Canadian Institute of Mining. Metallurgy and Petroleum (CIM) Definition Standards for Mineral Resources and Mineral Reserves. 2014. Available online: https://mrmr.cim.org/en/standards/canadian-mineral-resource-and-mineral-reserve-definitions/ (accessed on 10 January 2018).
  96. Annell, C.S. Spectrographic Determination of Volatile Elements in Silicates and Carbonates of Geologic Interest Using an Argon d-c Arc; U.S. Geological Survey Profes-sional Paper 575-C; U.S. Geological Survey: Reston, VA, USA, 1967; pp. C132–C136.
  97. Taylor, P.C.; Stoiber, R.E. Soluble material on ash from active Central American volcanoes. Geol. Soc. Am. Bull. 1973, 84, 1031–1042. [Google Scholar] [CrossRef]
  98. Kunasz, I.A. Geology and Geochemistry of the Lithium Deposit in Clayton Valley, Esmeralda County, Nevada. Ph.D. Thesis, The Pennsylvania State University, State College, PA, USA, 1970. [Google Scholar]
  99. Price, J.G.; Lechler, P.J.; Lear, M.B.; Giles, T.F. Possible volcanic source of lithium in brines in Clayton Valley, Nevada. In Geology and Ore Deposits 2000—The Great Basin and Beyond: Geological Society of Nevada Symposium; Cluer, J.K., Price, J.G., Struhsacker, E.M., Hardyman, R.F., Morris, C.L., Eds.; Geological Society of Nevada: Reno, NV, USA, 2000; pp. 241–248. [Google Scholar]
  100. Zampirro, D. Hydrogeology of Clayton Valley brine deposits, Esmeralda County, Nevada. Prof. Geol. 2005, 42, 46–54. [Google Scholar]
  101. Munk, L.; Jochens, H.; Jennings, M.; Bradley, D.; Hynek, S.; Godfrey, L. Geochemistry of lithium-rich brines in Clayton Valley, Nevada, USA. In Proceedings of the 11th SGA Biennial Meeting 2011, Antofogasto, Chile, 26–29 September 2011; pp. 217–219. [Google Scholar]
  102. Stillings, L.L.; Morissette, C. Lithium clays in sediments from closed-basin, evaporative lakes in the southwestern United States. Geol. Soc. Am. Abstr. Programs 2012, 44, 210. [Google Scholar]
  103. Rowe, B.; Reynolds, J. The Rhyolite Ridge project, Nevada: An example of a stratiform lithium-boron deposit of exhalative origin. Geol. Soc. Nev. Newsl. 2019, 35, 3. [Google Scholar]
  104. Ellis, B.S.; Szymanowski, D.; Magna, T.; Neukampf, J.; Dohmen, R.; Bachmann, O.; Ulmer, P.; Guillong, M. Post-eruptive mobility of lithium in volcanic rocks. Nat. Commun. 2018, 9, 1–9. [Google Scholar] [CrossRef] [Green Version]
  105. Meixner, A.; Sarchi, C.; Lucassen, F.; Becchio, R.; Caffe, P.J.; Lindsay, J.; Rosner, M.; Kasemann, S.A. Lithium concentrations and isotope signatures of Palaeozoic basement rocks and Cenozoic volcanic rocks from the Central Andean arc and back-arc. Miner. Depos. 2019. [Google Scholar] [CrossRef]
Figure 1. McDermitt caldera in relation to Yellowstone hotspot track (with volcanic centers and ages) and Columbia River Basalt Province. H: High Rock caldera; HV: Hawks Valley center; J: Jarbidge volcanic field; NNR: northern Nevada rift; S: Santa Rosa–Calico volcanic field; V: Virgin Valley caldera; W. Whitehorse and older calderas. RR: Rhyolite Ridge; CV: Clayton Valley. From [19,20,21,22,23,24,25,26,27,28,29,30,31,32]. CA—California; ID—Idaho; MT—Montana; NV—Nevada; OR—Oregon; UT—Utah; WA—Washington; WY—Wyoming.
Minerals 10 00068 g001
Figure 2. Simplified geologic map of the McDermitt caldera (Simplified from Reference [19]).
Minerals 10 00068 g002
Figure 3. (A) 4 m thick exposure of thin-bedded to laminated pale grey to green claystone and white to pale brown tuff overlain by alluvium, Hectatone pit 350 m east of proposed 2011 Lithium Nevada pit. Hammer, 30 cm long, for scale in lower right. (B) Core from 177.1 to 196.3 feet (54–60 m) in hole WLC165 showing gray to dark gray claystone with white tuff layers near the 181.7 ft. marker. Core intervals in these boxes range between 5690 and 7390 ppm Li, except interval containing tuff layers which has 1850 ppm Li. (C) Highly silicified laminated sediment; brown tuff feldspar-rich layer on right only partly silicified. Core sample WLC43-230.5. 410 ppm Li. (D) Mudstone with quartz grains, bitumen, and pyrite. Core sample WLC43-70.2 (21 m depth), plane polarized light, horizontal field = 0.8 mm. 4630 ppm Li. (E) Calcite rhombs replacing plate-like crystals in claystone. Original crystals cut across laminae. Core sample WLC45-268 (82 m). 5180 ppm Li. (F) Disseminated dolomite crystals and crystalline layers in claystone. Disseminated crystals cut across sedimentary laminae. Core sample WLC42-81.8 (25 m). 4310 ppm Li. (G) Fluorite layer in claystone with laminae displaced around fluorite crystals indicating the sediments were soft during crystallization. Core sample WLC67-199.2 (61 m). 6100 ppm Li. (H) White tuff layer in dark gray claystone, displaced by minor faults. White microcrystalline quartz veinlets occur along faults and irregularly in the tuff. Core sample WLC139-242 (74 m) in high-Li zone.
Minerals 10 00068 g003
Figure 4. Geochemical characteristics of rocks of the McDermitt caldera. Data from Reference [19]. (A) Total alkali (Na2O + K2O)-SiO2. (B) Peralkalinity versus alumina index. (C) Zr versus 104 × Ga/Al plot. (D) Li–SiO2. (E). Peralkalinity versus SiO2. (F) Li versus peralkalinity.
Minerals 10 00068 g004
Figure 5. Areas of Li mineralization identified by Lithium Nevada Inc. and Jindalee Resources Inc. with representative lithium contents of drill holes and outcrop. Tuffaceous sediments throughout the caldera are highly enriched in lithium.
Minerals 10 00068 g005
Figure 6. Fence diagram of drill holes with mineral zones. 2011 pit outline and drill hole locations are from Lithium Nevada’s Thacker Pass Project (Figure 5). Hole collar locations are in the same horizontal plane as the pit outline.
Minerals 10 00068 g006
Figure 7. General geology and distribution with depth of Li, K, As, Mo, and Rb in four drill holes across the Thacker Pass deposit. Hole locations within the deposit are shown in Figure 6.
Minerals 10 00068 g007
Figure 8. Thacker Pass XRD scans showing International Center for Diffraction Data (ICDD) mineral standards as colored vertical lines and d-spacing values (in angstroms) for peaks interpreted as clay peaks. In addition, major peaks for other minerals are albite (Ab), analcime (Anl), calcite (Cc), dolomite (Dol), goethite (G), K-feldspar (Kf), quartz (Qtz), and pyrite (Py). Where prominent, aluminum sample holder peaks labeled Al. (A) Pit sample of smectitic claystone with 2250 ppm Li from the Hectatone pit (see Figure 3A). (B) Transitional zone claystone with 2860 ppm Li, from about 58 m depth in hole WLC65. (C) Illitic claystone with 6920 ppm Li from 43 m depth in hole WLC43. (D) Lower transitional claystone with 1230 ppm Li from 58 m depth in hole WLC62.
Minerals 10 00068 g008
Figure 9. Series of XRD scans for bulk interval samples between 52 and 101 m in hole WLC65 with peaks showing Li contents, 001 d spacing, other major clay peaks (4.50, 2.59, and 1.51 angstroms), and peaks for analcime (Anl), quartz (Qtz), calcite (Cc), K-feldspar (Kf), and dolomite (Dol). Scans are color coded with blue = upper smectite zone, green = upper transitional clay zone, red = illite zone, and brown = lower transitional clay zone. All samples dried. Tops and bottoms of the intervals are rounded to nearest meter.
Minerals 10 00068 g009
Figure 10. Secondary scanning electron microscope images. (A) Fine illite grains with larger K-feldspar anhedra and bright pyrite cubes from sample WLC43-141.1 feet (43 m). Horizontal field of view = 30 µm. From interval with 6920 ppm Li. (B) High magnification image of illitic clay, showing pseudohexagonal plate morphology from sample WLC65-235 feet (72 m). Horizontal field of view = 2.5 µm. From interval with 6380 ppm Li. (C) Smectite with pyrite (bright) from sample WLC43-40 feet (12 m). Horizontal field of view = 12 µm. From interval with 2590 ppm Li. (D) Smectite(?) clay from the transitional (mixed) clay zone sample WLC65-176.6 feet (54 m). Horizontal field of view = 12 µm. From interval with 3690 ppm Li.
Minerals 10 00068 g010
Figure 11. Thin sections. (A) Irregularly interlayered brown clay and calcite in core sample WLC43-210 feet (64 m), plane polarized light, horizontal field = 3.2 mm. From interval with 1720 ppm Li. (B) Clayey sandstone, sample WLC65-206.7 feet (63 m), plane polarized light, horizontal field of view = 3.2 mm. Light-colored grains are quartz; interstices mostly filled with brown clay and black pyrite. Blue is epoxy-filled pore space. (C) Analcime crystals in tuff layer, smectite zone, sample WLC43-36.5 feet (11 m), plane polarized light, horizontal field = 0.8 mm. Mostly granular secondary quartz, brown mineral is smectite. From interval with 142 ppm Li. (D) Albite (bright) pseudomorphs probably after analcime in fine-grained tuff (gray), and pyrite (dark grains in vein), sample WLC62-94.5 feet (29 m), cross polarized light, horizontal field of view = 3.2 mm. From interval with 4070 ppm Li. (E). Laminated claystone with pyrite cubes and bitumen shards, illite zone, sample WLC43-141.1 feet (43 m), plane polarized light, horizontal field = 0.8 mm. From interval with 6920 ppm Li. (F) Fluorite (bright mass of cubic crystals) in sandy mudstone, base of illite zone, sample WLC65-238.6 feet (73 m), plane polarized light, horizontal field of view = 3.2 mm. Blue is epoxy. From interval with 5670 ppm Li.
Minerals 10 00068 g011
Figure 12. Interval lithium content plotted against d spacing for the 001 clay peak, drill holes WLC43, WLC62, WLC65, and WLC67.
Minerals 10 00068 g012
Figure 13. Plots of Li versus Mo, Mg, and F for bulk 1.5 m interval samples and select hand samples from WLC43. Crude positive correlation between Li and Mo suggests similar depositional mechanism for the two elements but that they probably occur in different minerals. The nearly linear correlation between Li and Mg for most samples suggests inclusion in the same mineral (the clay phases) while high Mg outliers probably indicate the presence of dolomite. The same relationship is shown between Li and F with high F outliers likely due to the presence of fluorite.
Minerals 10 00068 g013
Table 1. McDermitt Caldera: major volcanic, hydrothermal, and diagenetic events.
14.87 ± 0.05 Ma: Formation of diagenetic K-feldspar in Li-rich zone at Thacker Pass. Marks at least part of time of diagenesis and Li mineralization.
≤16.4 to ~14.9 Ma: Closed-hydrologic system diagenesis of the intracaldera tuffaceous sediments. Diagenesis probably started during earliest sediment deposition and was definitely occurring at 14.87 ± 0.05 Ma, the age of diagenetic K-feldspar.
Between ~16.4–16.1 Ma. Resurgent doming of the caldera. Late icelandite lavas (Ti) are the youngest caldera magmatism at 16.22 ± 0.13 and 16.08 ± 0.10 Ma.
≤16.45 ± 0.07 to ≤15.66 ± 0.04 Ma. As much as 200 m of tuffaceous sediments accumulated in the caldera. Deposition probably was continuous both pre- and post-resurgence.
16.32 ± 0.10 and ~16.3 ± 0.10 Ma. Hydrothermal activity generated the Moonlight and other western caldera U–Zr deposits and the McDermitt Hg mineralization along the northeastern caldera margin.
16.41 ± 0.02 Ma. Post-collapse icelandite lavas (Ti) were extruded widely in the caldera.
16.39 ± 0.02 Ma (n = 3). Eruption of the McDermitt Tuff (Tmt) and collapse of the McDermitt caldera.
16.38 ± 0.07 to 16.36 ± 0.02 Ma. Eruption of biotite–sanidine–quartz–plagioclase rhyolite lavas (Tbrh) near what became the eastern caldera margin.
16.40 ± 0.02 Ma. Eruption of sanidine–quartz–sodic amphibole peralkaline rhyolite lavas (Tpr) around what became the southern part of the caldera.
16.49 ± 0.02 Ma. Shallow intrusion of biotite–hornblende–quartz–sanidine–plagioclase rhyolite (Tbm) 5 km northeast of the caldera.
16.62 ± 0.02 Ma. Biotite–quartz–sanidine–plagioclase, metaluminous rhyolite lavas (Tbr) emplaced along what became the southwestern margin of the caldera.
16.69 ± 0.02 to 16.39 ± 0.02 Ma. Rhyolite lavas, including anorthoclase rhyolite (Tra) and aphyric high-Si rhyolite (Tar), erupted continuously until caldera formation.
≥16.69 ± 0.02 Ma. Steens Basalt lavas (Tb) erupted around the northwestern part of the caldera. Lavas became more silicic with time to icelandite and rhyolite.
Table 2. 40Ar/39Ar Ages of Tephra and Authigenic K-feldspar in Intra-Caldera Tuffaceous Sediments of the McDermitt Caldera.
Single Crystal Quartz Element Contents (ppm)
SampleLocationMaterialAge (Ma)±2σK/Ca±1σNMSWDPhenocrystsYZrNbLaLatitudeLongitude
H16-570Thacker Pass14 A, 1 P15.660.049.16.515/156.09No8746944.59441.69268−118.01311
H16-599AMajor tephra section, northwest7 P, 3 S15.900.030.180.0610/230.82No55388234642.06854−118.01309
H16-582Near Bretz Mine11 A15.990.0910.11.011/163.26No78398255542.04104−117.89405
H16-573East side in mostly covered area14 S16.010.08214.4100.314/1611.30Yes2063183641.81857−117.93480
H16-584Near Bretz Mine18 A16.220.181.00.418/2227.46No?97>500499942.03636−117.89437
H16-606Near Cordero Mine12 S16.200.04117.750.612/1524.16Yes1721614741.95060−117.84557
H16-592White Hill, north-central3 S16.450.0781.542.63/1113.98Yes86>500296742.06132−117.94683
Step Heating plateau±2σ%39Arstepsisochron±2σ40Ar/36Ari±2σtotal gas±2σLa
WLC43-180Thacker Pass Li depositK14.870.0554.47/1615.240.26172.978.114.920.03 41.70937−118.06157
N: number of grains used in age calculation/total number of grains analyzed. MSWD: mean square weighted deviation. A: anorthoclase, P: plagioclase, S: sanidine, K: authigenic K-feldspar. Ages in bold are best estimates of deposition age. All 40Ar/39Ar analyses done at the New Mexico Geochronological Research Laboratory (methodology in [19,37]). Neutron flux monitor Fish Canyon Tuff sanidine (FC-1); assigned age = 28.201 Ma (Kuiper et al., 2000) [34]. Minerals were separated from crushed, sieved samples by standard magnetic and density techniques, feldspars were leached with dilute HF to remove matrix, and all were handpicked. Decay constants after Min et al. (2000) [33]; λtotal = 5.463 × 10⁻¹⁰ yr−1. Isotopic abundances after Steiger and Jäger (1977) [38]; 40K/K = 1.167 × 10⁻⁴. Ages in bold are best estimates of deposition age.
Table 3. (A) Lithium originally available from tuffaceous sediments; (B) Lithium contents of drill hole and outcrop, McDermitt caldera; (C) Lithium contents of identified mineralization.
(A
(A
Calculation Depositional AreaThicknessVolumeMassExtractable Li (Mt)
(km3)(km)(km3)(t, density = 2)10 ppm100 ppm
Best estimate7000.161122.24 × 10112.222.4
Maximum10000.22004.00 × 10114.040.0
(B
(B
Li (ppm) Li (ppm)
Drill HoleLocationSection (m)1.5 m Intervals AssayedAverageMinimum# ≤1000# <200High Li Section (m)Average
WLC58SE of Thacker Pass deposit5 to 1931061659614112113 to 1373478
WLC43Thacker Pass deposit2 to 784526763114034 to 663941
WLC62Thacker Pass deposit5 to 58 3461 18 to 583844
WLC65Thacker Pass deposit4 to 104 2502 52 to 863970
WLC67Thacker Pass deposit7 to 916225188811437 to 68, 79 to 883420, 3400
MC82-009South Lens0 to 754822863707017 to 353655
MC83-059North Lens0 to 11072215821813018 to 453564
OutcropNorth caldera margin0 to 68NA590NANANA7 to 211650
(C
(C
Lithium Nevada, Thacker Pass Project
Li (ppm)Estimated Li (Mt)
Thacker Pass Deposit 1Area (km2)# Drill HolesRock (Mt)AverageCut-OffExp Tar 2Other43–101 1
Measured427524229482000 0.71
Indicatedsamesame14328642000 0.41
Inferredsamesame14729322000 0.43
total Thacker Pass4275 1.56 1
North lens 35.52117831002500 0.55
North-central lens 31.5105534002500 0.19
South-central lens 30.973437002500 0.12
South lens 39.85232133002500 1.06
Total lenses 3 1.92 3
Exploration Project 299600306220001.84
Total Lithium Nevada 5.32
Jindalee ResourcesExploration Target27133100140010004.34
Combined Lithium Nevada and Jindalee Resources 9.66
# <1000, 200 = number of assay intervals less than value; 200 used as maximum background. NA not applicable. Data [5,7,15,16,17,18,46]. Numbers in bold are cumulative values for areas cited. 1 43–101 compliant resource estimate based on 275 drill holes and 2000 ppm Li cut-off grade [7]. 2 Exp Tar: Exploration Target calculation from Jindalee used criteria of JORC (2012) [47], which is not 43–101 compliant [17,18]. # Drill Holes = number drill holes used in resource estimate. Exploration Target value for Lithium Nevada is our best estimate of equivalent calculation for their Thacker Pass area outside the Thacker Pass deposit, but using a 2000 ppm Li cut-off, which is what is available from Reference [46]. 3 Historical resource estimates from Reference [16].
Table 4. Chemical composition of lithium micas, McDermitt lithium-rich clay and illite.
ElementMicasMica? Clay?Clays
LepidolitePolylithioniteTrilithioniteTainioliteIllite (Tainiolite?)Smectite (Hectorite?)HectoriteIlliteIllite
WLC03-05WLC03-02
SiO247.8160.3246.4452.7756.0054.5959.9347.5358.89
TiO2 trace 2.000.570.130.010.670.84
Al2O328.4713.0027.20trace2.404.160.3623.5719.14
FeO0.04 1.89 trace3.240.27
Fe2O3 0.180.44 1.971.070.137.835.16
MnO0.910.120.801.380.030.01trace
MgO0.000.24 17.3817.7021.1826.631.722.14
CaOtrace0.72 0.111.250.980.191.65
Li2O3.646.185.512.432.751.411.24
Na2O0.862.040.551.220.490.142.390.140.44
K2O9.8611.049.9511.367.552.040.096.775.28
Rb2O0.90 0.100.04
Cs2O0.16 0.070.03
H20+2.521.702.004.234.129.043.098.346.19
F4.854.467.105.356.714.905.16
Total (norm.)100.00100.00100.00100.00100.00100.00100.00100.00100.00
LocationCaliforniaRussiaunknownRussiaMcDermittMcDermittCaliforniaIllinoisIllinois
Data source[60][60][61][60][57][57][62][63][64]
Total (norm.): all analyses are normalized to 100% total.

