1. Introduction
Retinal blood vessel segmentation and extraction of different features based on these vessel segments, such as tortuosity, width, length, angle and color are exploited for diagnosis and screening of numerous kinds of diseases such as diabetic retinopathy (DR), arteriosclerosis, hypertension, retinopathy of prematurity and choroidal neovascularization [
1,
2]. The retinal vessel segmentation is also a useful tool for computer-assisted surgery, multimodal image registration and biometric person identification [
2,
3,
4,
5]. Manual segmentation of retinal blood vessels is a time-consuming, subjective and boring task which must be performed by trained physicians. The medical community generally admits that the retinal vessel segmentation is one of the basic steps for the development of the retinal disease diagnosis systems [
6,
7]. A great number of studies related to retinal vessel segmentation have been published previously and these studies can be categorized into 3 main classes as kernel, classifier and tracking-based studies [
7].
Kernel-based studies convolve the image with the kernels having different orientations and sizes. Nonetheless, this type of studies needs long execution times when the kernels get larger and have to be applied with more than one orientation. In addition to these, the response of a specific kernel fits with only the vessels whose standard deviation resemble to Gaussian function of that kernel. Thus, the vessels which have unrelated profiles may not be detected by the kernel-based methods [
6]. In order to segment the retinal vessels, Chaudhuri et al. came up with a Gaussian function-based two-dimensional linear kernel [
8]. Hoover et al. performed vessel segmentation by merging local and region-based features of the retinal vessels via applying a threshold probing technique on the response image of a matched filter [
9]. Gang et al. detected retinal vessels by using a second order Gaussian filter whose amplitude is modified [
10]. Jiang and Mojon tried to detect the vessels via an adaptive local thresholding scheme using a verification-based multi-threshold probing framework [
11]. Al-Rawi et al. enhanced Chaudhuri et al.’s matched filter by using optimized parameters derived from an exhaustive search optimization step [
8,
12]. Cinsdikici and Aydin offered a retinal vessel segmentation method which is a combination of the matched filter and the ant colony algorithm [
13,
14]. Zhang et al. performed retinal vessel segmentation by an extended version of the matched filter which exploits the symmetric cross sectional property of the vessels [
15].
Classifier-based studies extract a feature vector and classify each pixel as vessel or non-vessel. The supervised and unsupervised methods were applied by the classifier-based studies. Nekovei and Ying offered a backpropagation Artificial Neural Network (ANN) for retinal vessel segmentation in angiography images [
16]. Sinthanayothin et al. proposed principal component analysis (PCA) and ANN for the detection of the optic disc, fovea, and retinal vessels [
17]. Niemeijer et al. offered a featured a vector for each pixel by exploiting the information from the green channel of the image and using the first and second order derivatives of Gaussian function-based matched filters having various scales [
18]. Later, Niemeijer classified the pixels using the k-Nearest Neighbor (k-NN) algorithm [
18,
19]. Soares et al. segmented the vessels via 2-D Gabor wavelet and supervised classification [
20]. Ricci and Perfetti classified the retinal vessel pixels using Support Vector Machine (SVM) and a feature vector composed by using line operators [
21]. Marin et al. proposed a retinal vessel segmentation method by classifying a 7-D feature vector derived from gray-level and moment invariant-based features via ANN [
22]. Tolias and Panas segmented vessels in the retinal angiogram images via a fuzzy C-means (FCM) clustering algorithm [
23]. Simo and de Ves segmented arteries, veins and the fovea in the retinal angiograms by using the Bayesian image analysis [
24]. Salem et al. offered a RAdius-based Clustering ALgorithm (RACAL) which uses a distance-based criterion in order to depict the distributions of the image pixels [
25]. Villalobos-Castaldi et al. segmented the vessels by using the texture information by merging the gray-level co-occurrence matrix (GLCM) and the local entropy data [
26].
Tracking-based studies start vessel tracking from at least one seed point and aim to trace whole vascular pattern step by step. This seed point may be set manually by user or automatically via morphological operations [
7]. This type of technique may be disadvantageous because the seed point requirement may cause the study remain as semi-automatic and missing any bifurcation point may result to lose the entire branch [
6]. Chutatape et al. performed the segmentation by tracking the vessels using Gaussian and Kalman filters [
27]. Quek and Kirbas offered a wave propagation and traceback mechanism which labels each pixel’s vesselness likelihood by using a dual-sigmoidal filter [
28]. Delibasis et al. proposed a vessel tracking algorithm which utilizes a parametric model of a vessel composed of a stripe [
29].
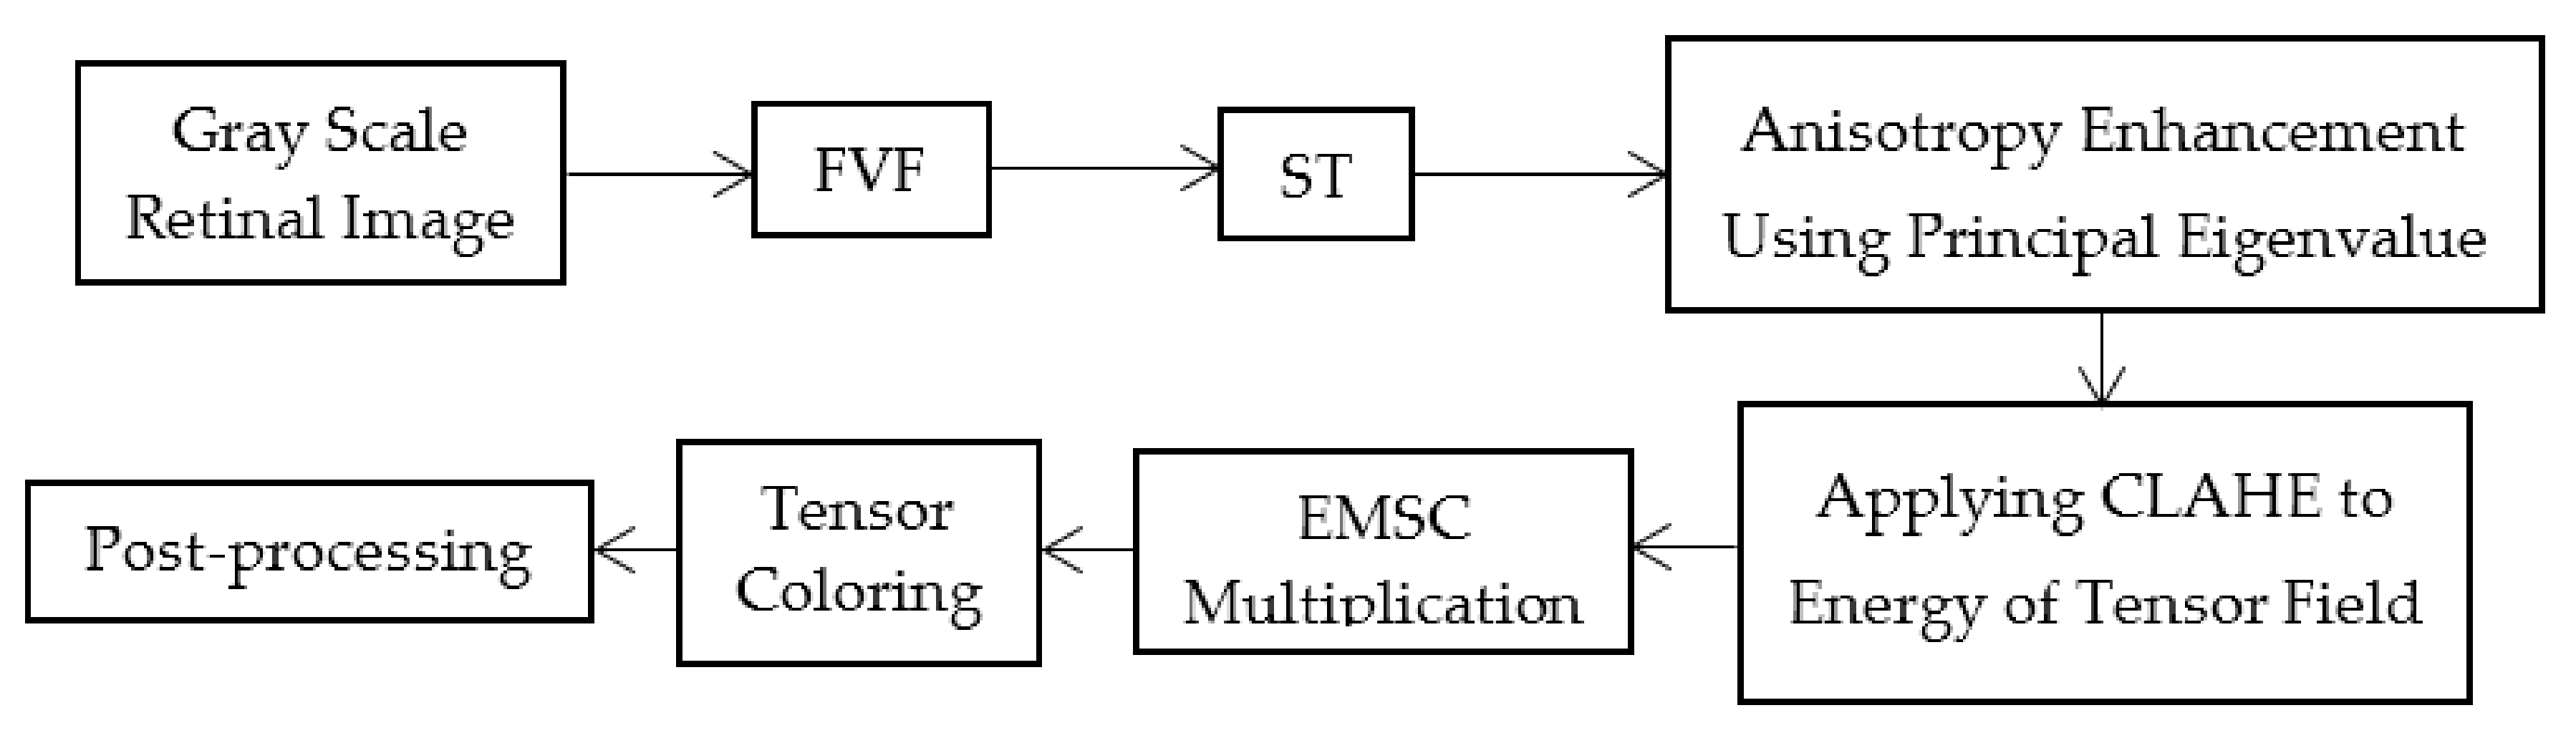
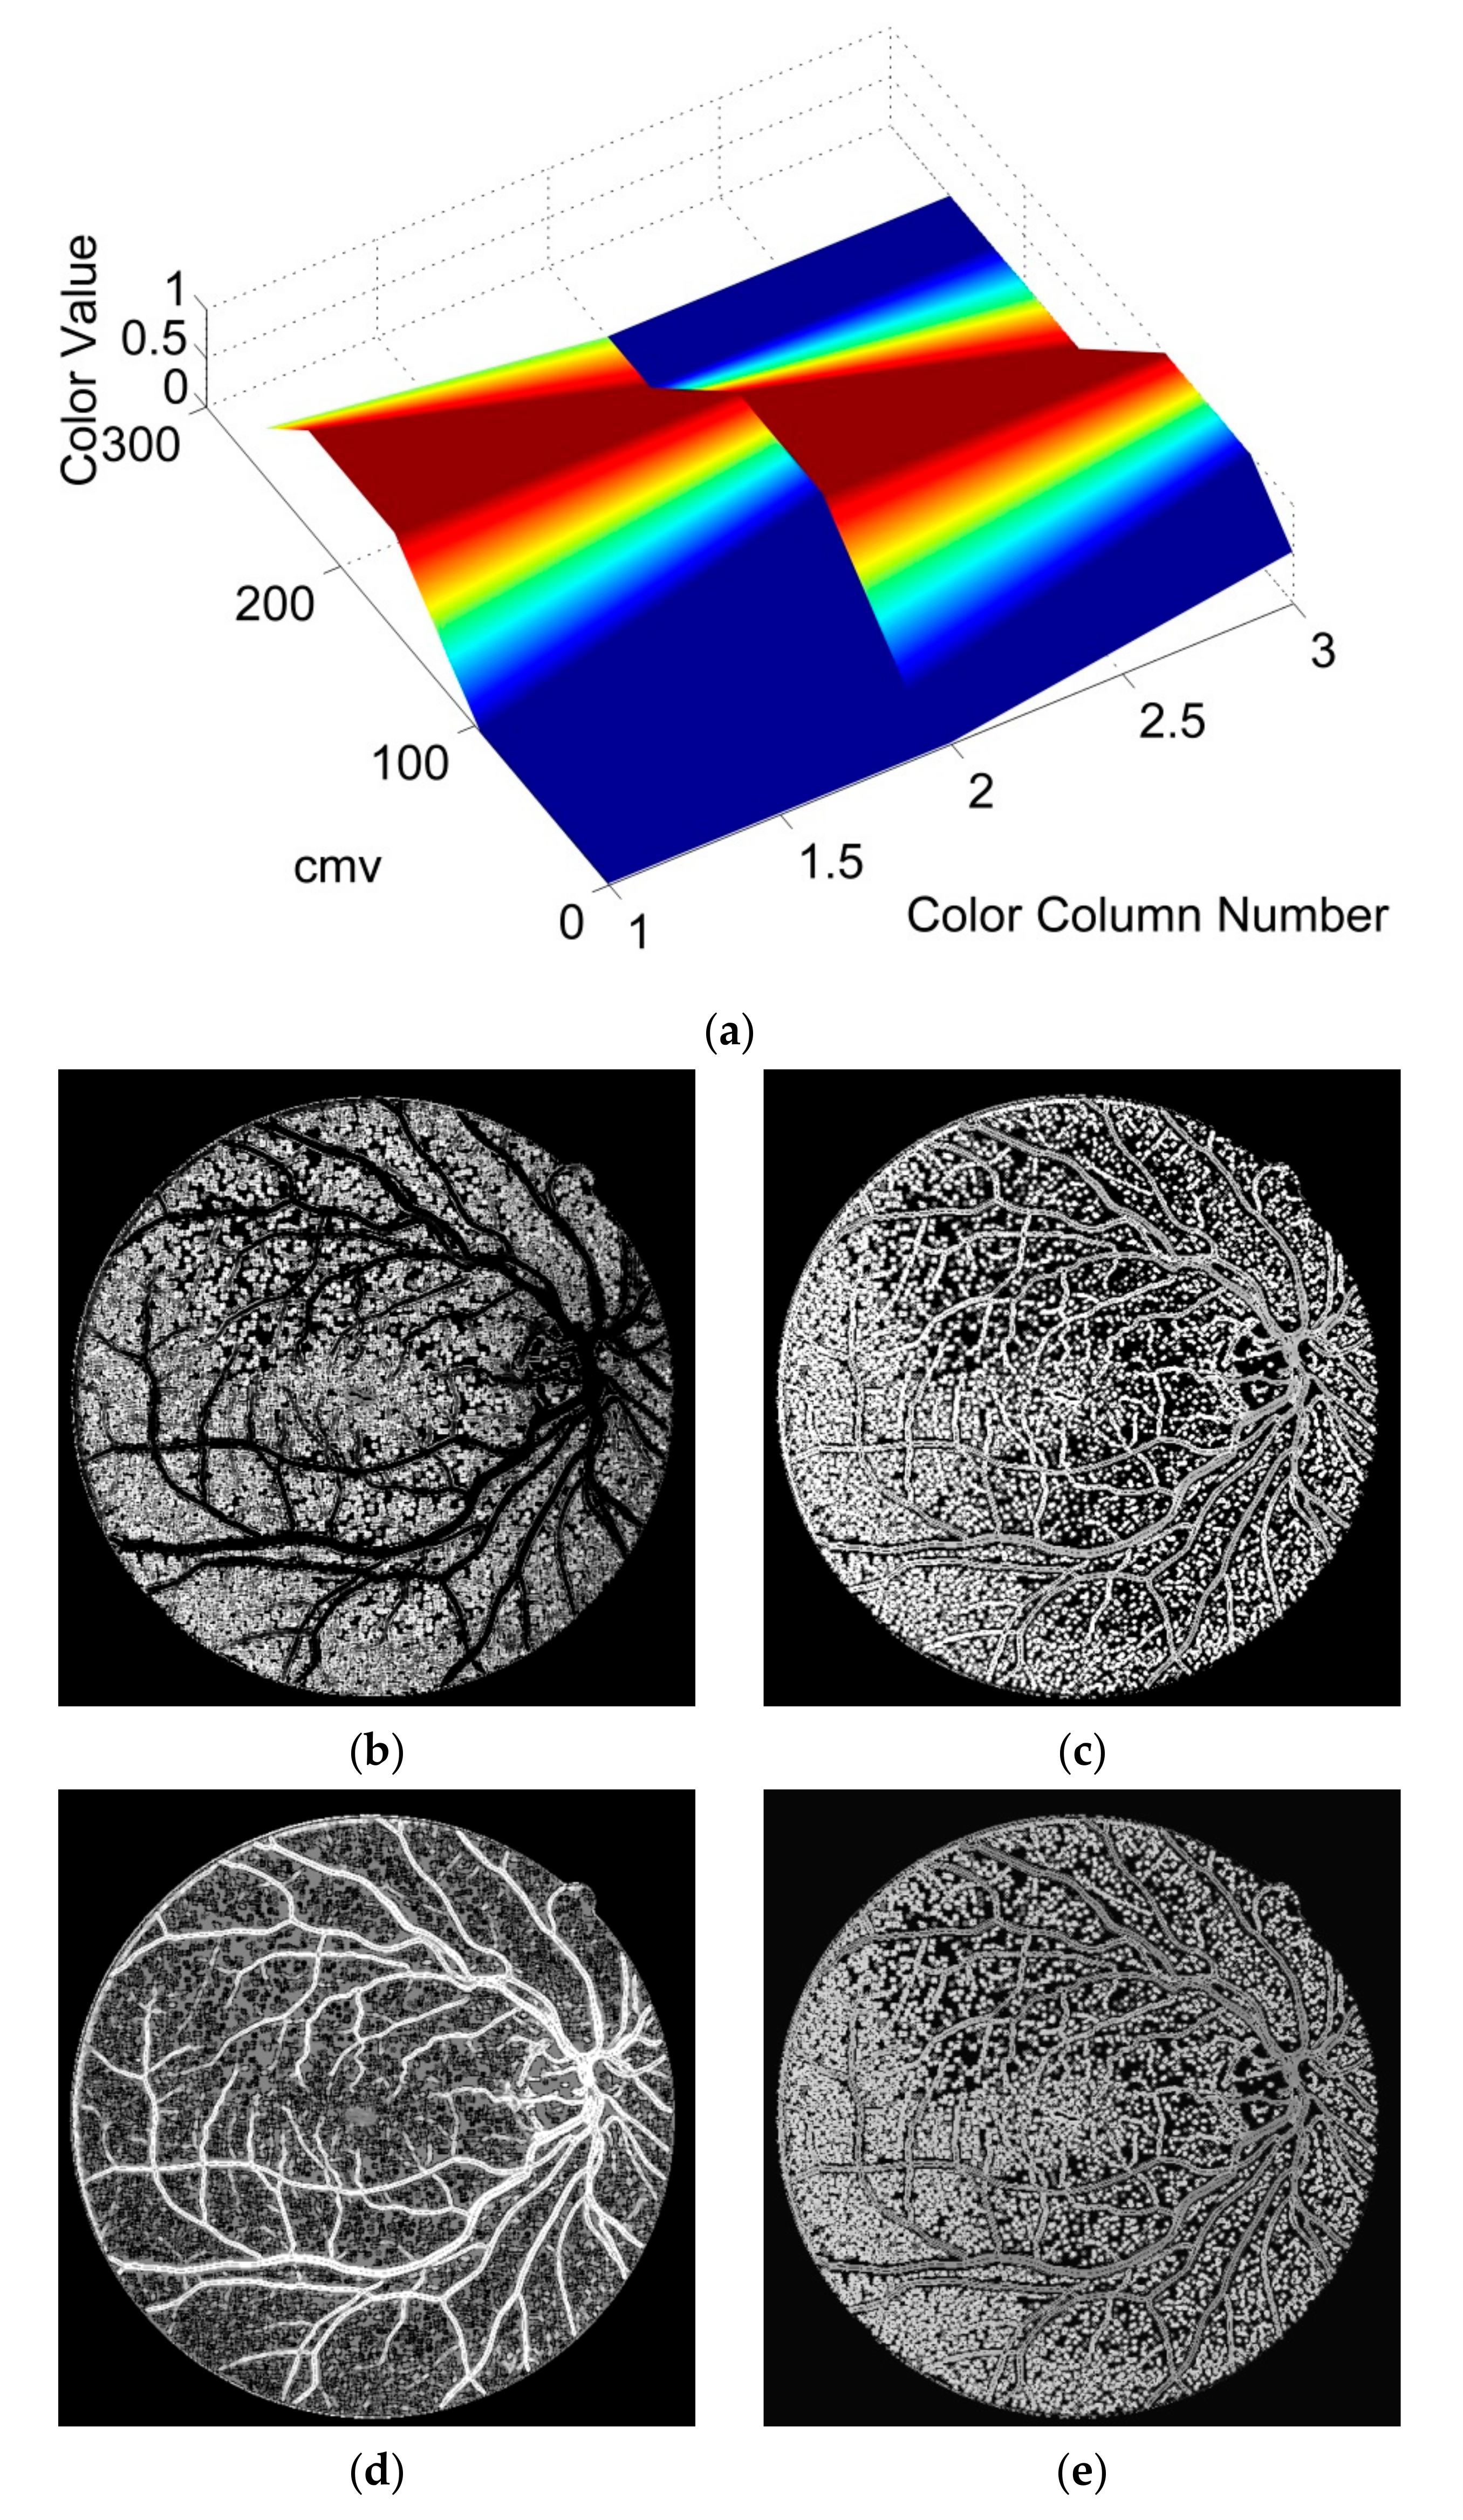
This study can be classified in the kernel-based category because of the Frangi Vesselness Filter (FVF) and Structure Tensor (ST) steps. However, FVF requires only a few different kernels not for different orientations but only for different scales. More and more, ST algorithm has a lightweight time complexity since it does not execute iteratively for various rotations and scales. The novel parts of this algorithm are utilizing ST as a vessel extraction technique followed by combining anisotropy enhancement function and applying Contrast Limited Adaptive Histogram Equalization (CLAHE) and enhanced mean surface curvature (EMSC) multiplication to the energy space of the tensor field as well as exploiting the coloring part of the tensor visualization method as a new segmentation algorithm. Although a great number of methods were developed, new retinal vessel segmentation techniques are needed still [
6]. This study proposes a fast method which extracts the main vessel arcs with a high sensitivity and reasonable accuracy. This article is the extended version of a previously presented conference paper [
30]. The main contribution of this article is reducing the false positive segmentation results especially occurring on the main vessel arc by using EMSC multiplication and ST instead of improved structure tensor (IST). Apart from that, this study is tested not only on DRIVE dataset but also on STARE and CHASE_DB1 datasets and higher performance results are obtained. Some extra post-processing steps such as lesion removal and small hole filling are also added to this study.
4. Discussion
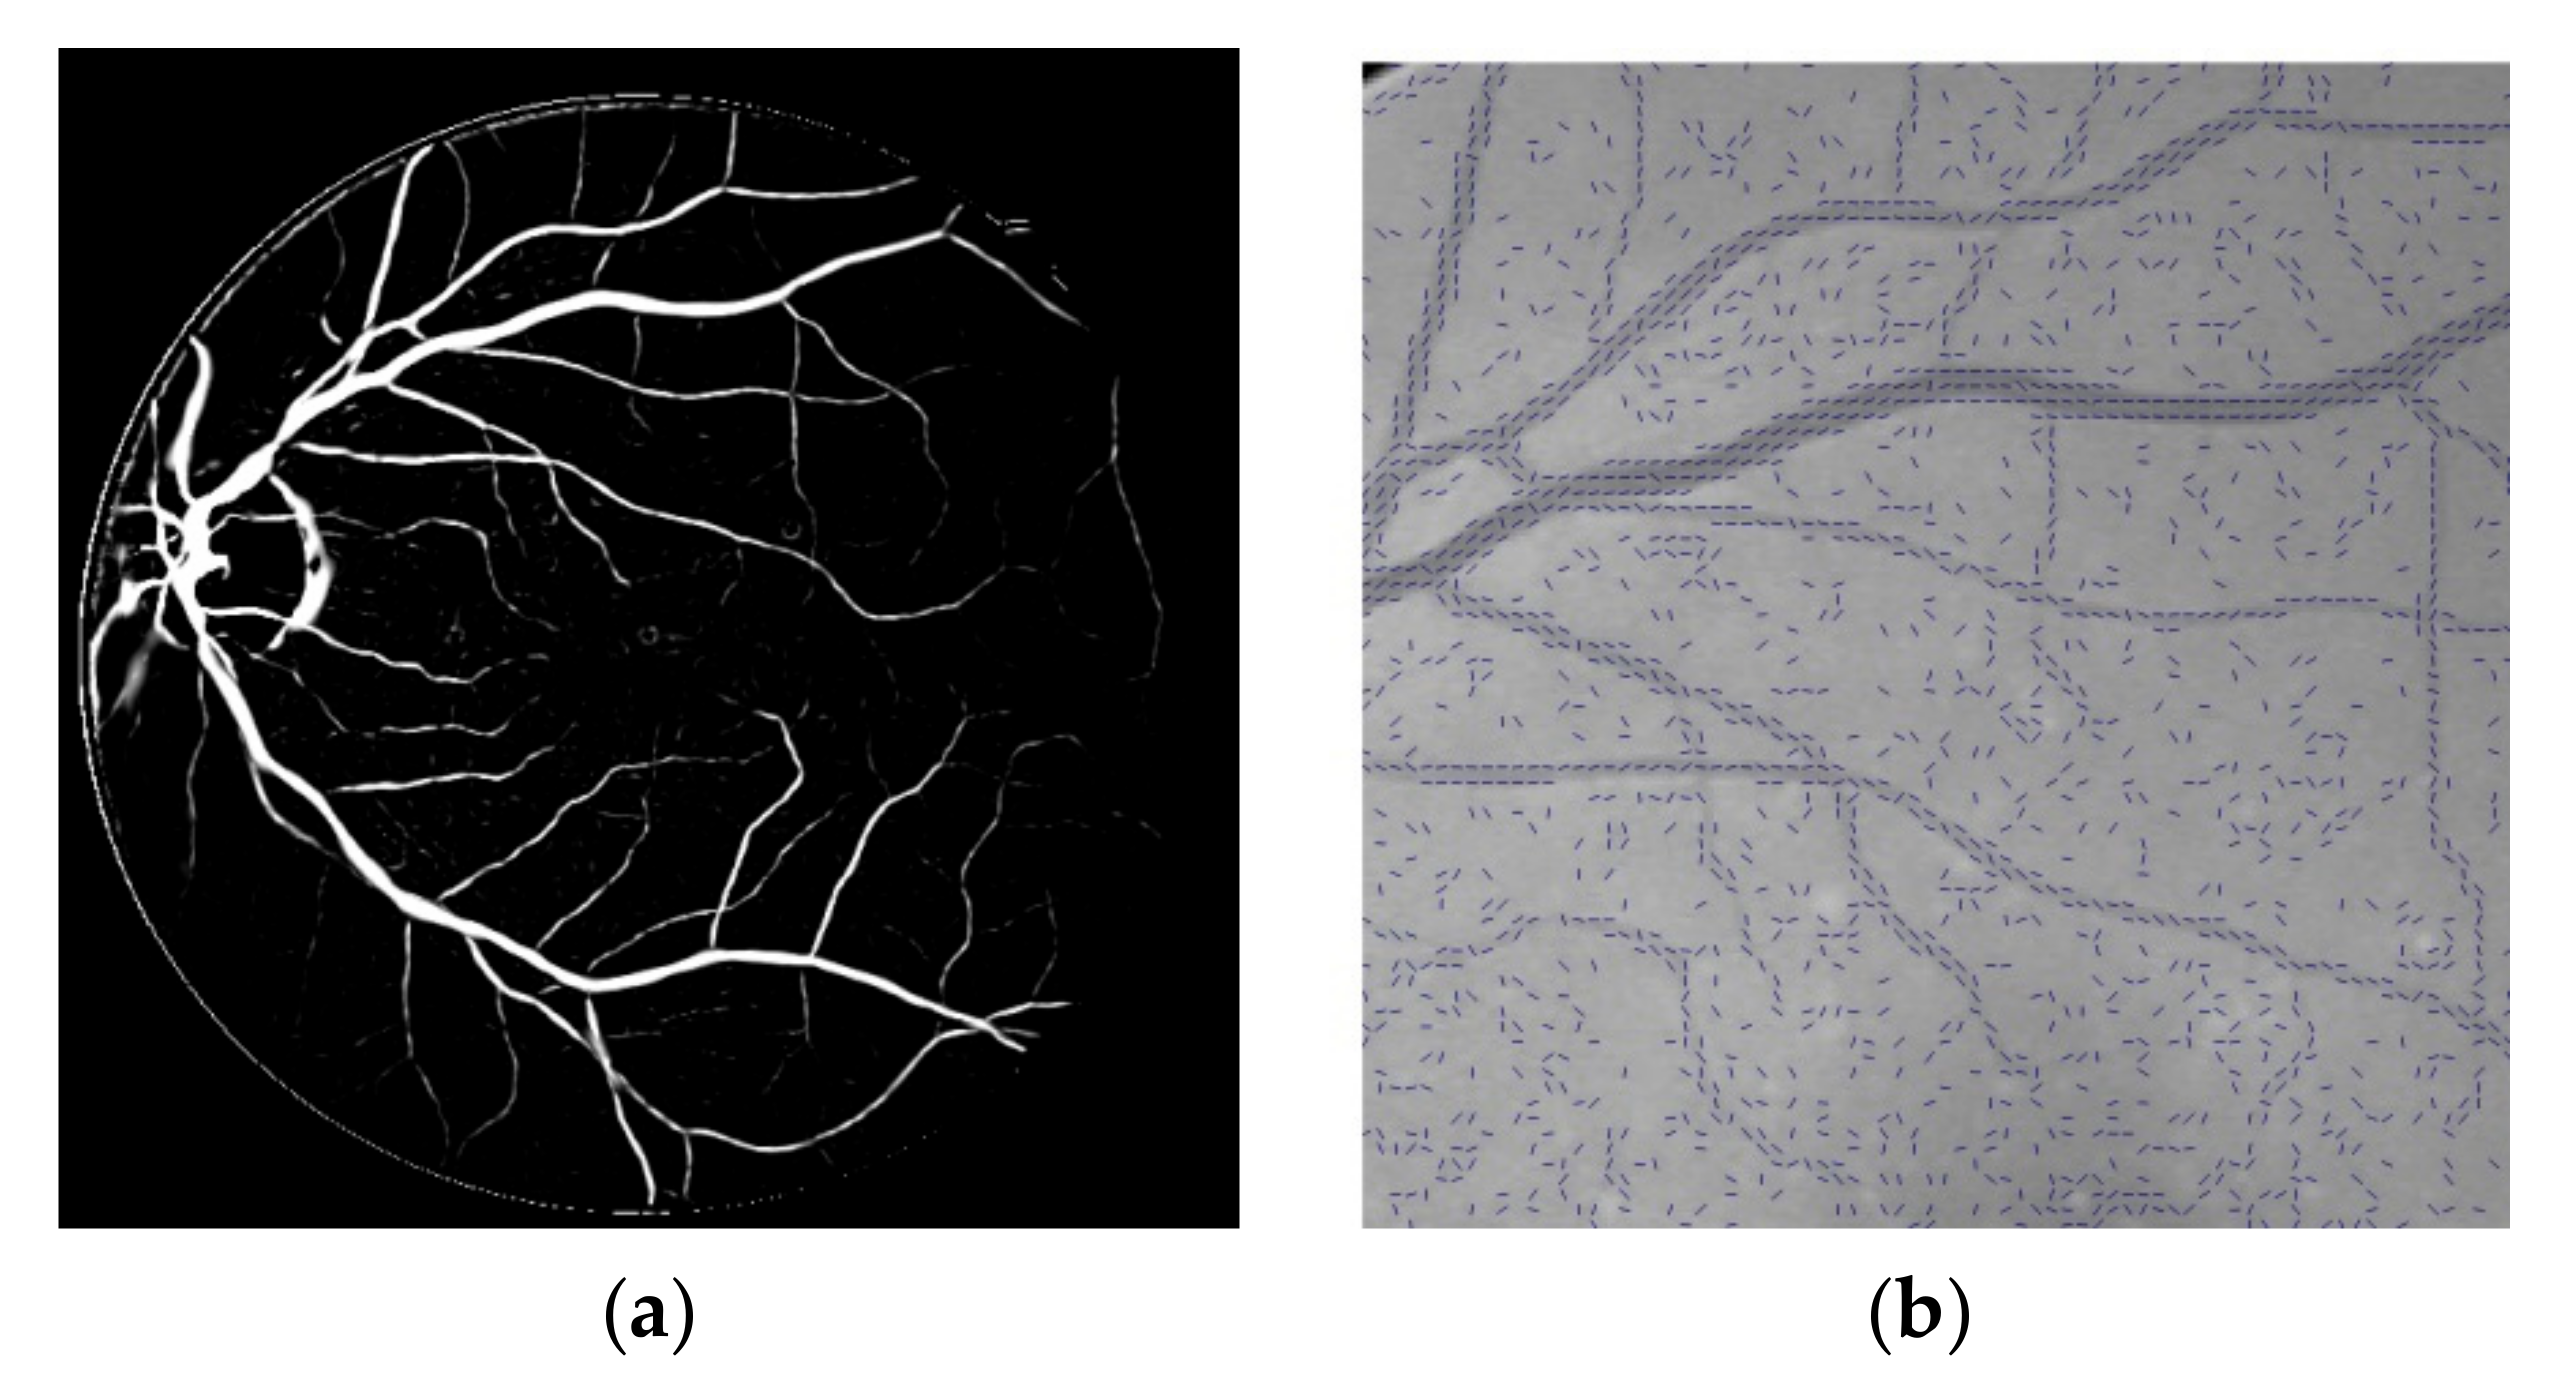
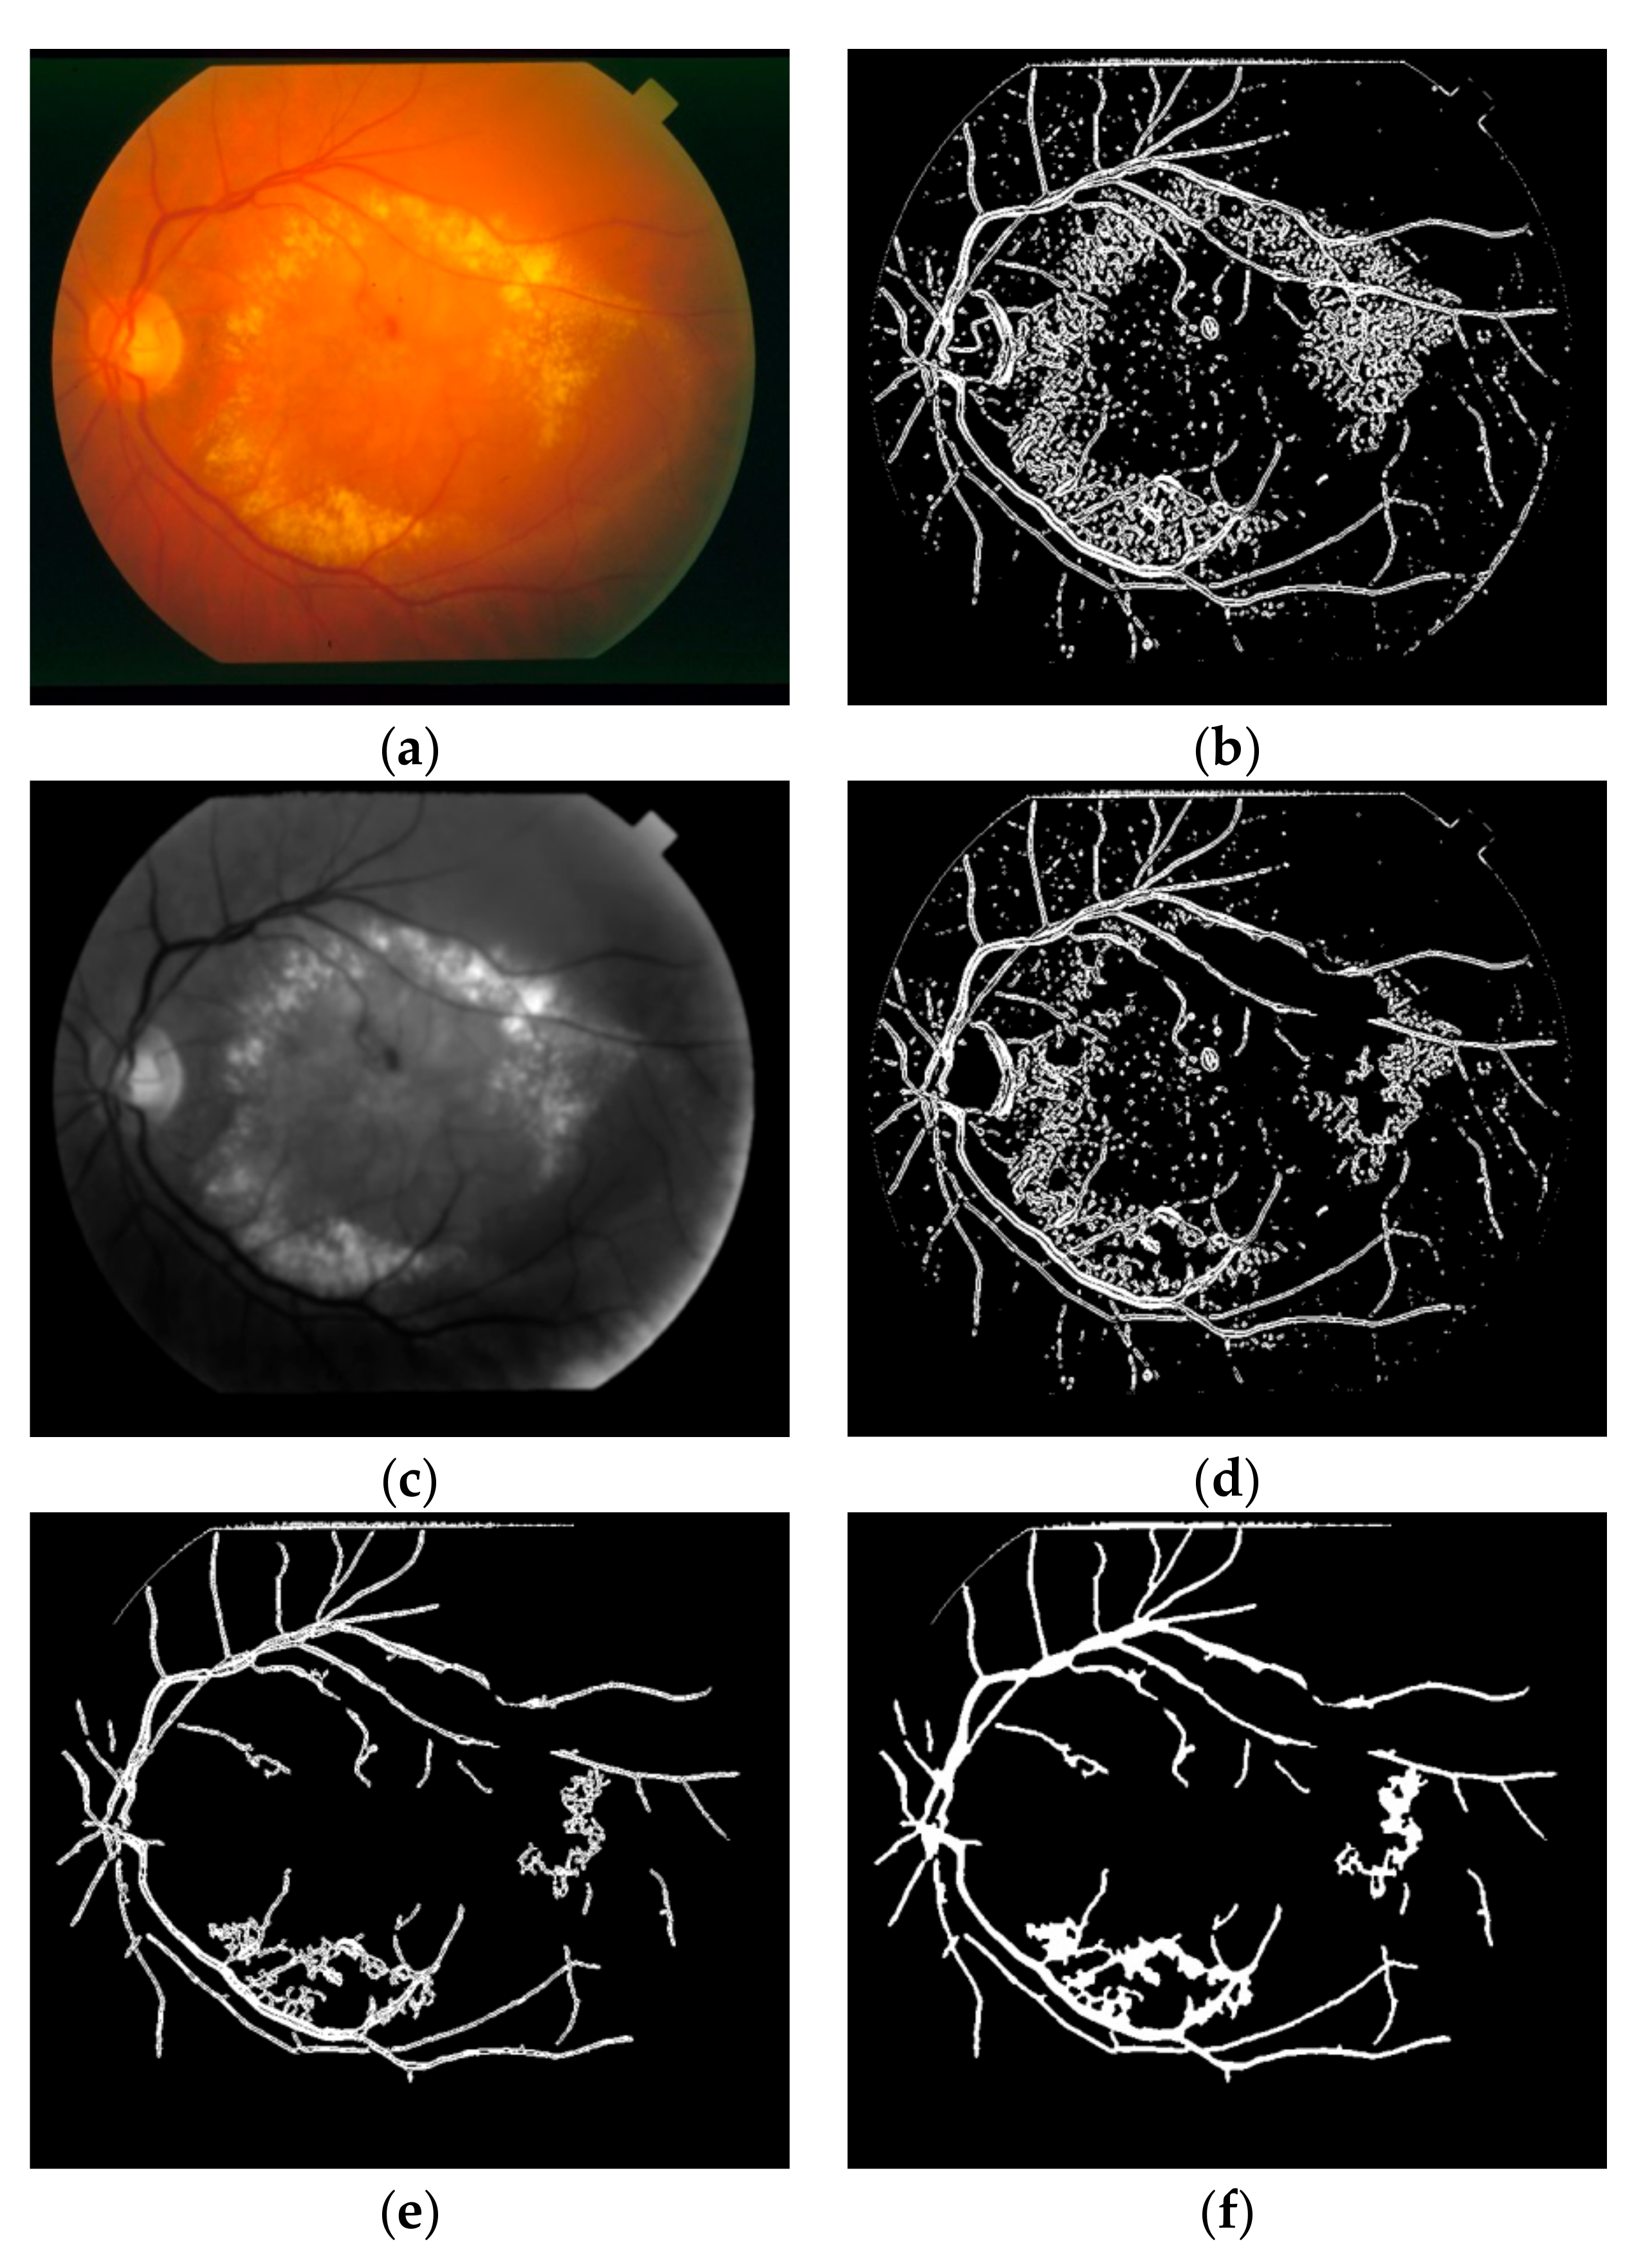
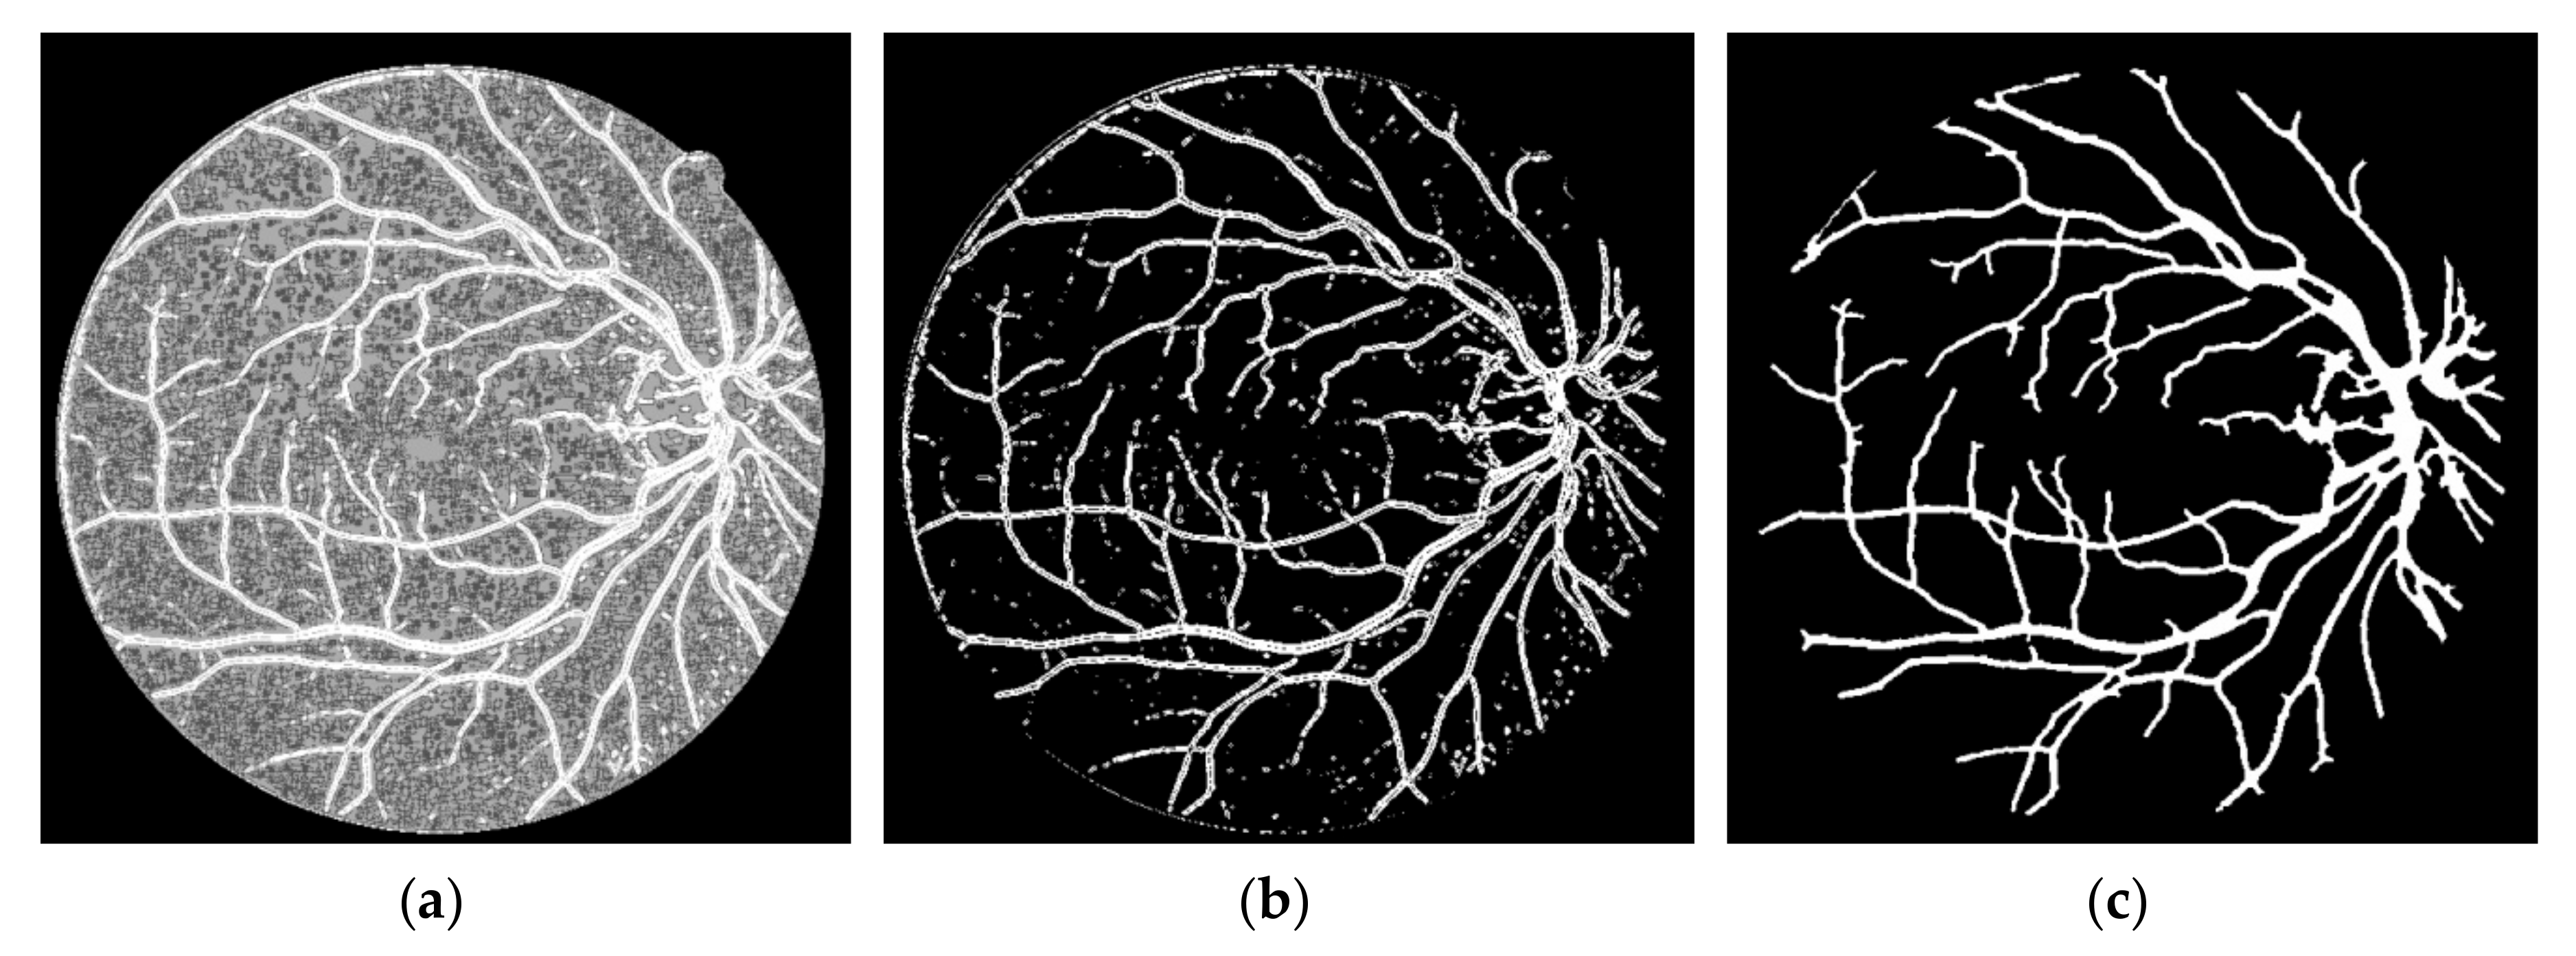
FVF is utilized as a useful preprocessing step in terms of only being able to focus on vessel-like regions. The ST method which is used in this study is successful on the edge extraction by using gradient information. Anisotropy Enhancement step of the 4-D tensor field contributed to vessel enhancement by not deforming the topology of the vessels but only emphasizing the vessel borders and regions. Applying CLAHE to the energy space is useful for normalizing the pixel values after anisotropy enhancement step. The EMSC multiplication step reduces the number of the false positive pixels which reside on the vessel borders even if it also causes a lot of small holes to occur on the vessels which are filled during post-processing. In this study, the proposed lesion removal procedure is also exploited successfully in order to eliminate the miscellaneous artefacts exaggerated by the FVF and ST.
This study does not require parameter calibration except for the parameters of FVF, EMSC and lesion removal criteria as well as can be used automatically for various retinal images having light inhomogeneity and different resolution values. In addition to these, this study offers a new approach for segmentation literature by utilizing tensor visualization technique which uses ellipsoids. As far as we know, this study is the first one in which the tensor coloring method is used for segmentation.
The performance results of the proposed study and the recent state of the art studies in the last two years are compared as in
Table 4,
Table 5 and
Table 6. This study suggests encouraging sensitivity, specificity, accuracy, AUC and execution time results with respect to the literature for DRIVE, STARE and CHASE_DB1 datasets. The performance results of the proposed study and the results of the other studies which are lower than the corresponding evaluation criterion is written as bold in the below tables. The sensitivity of this study is better than [
45,
47,
48,
49,
50,
51,
52] whereas its specificity is better than [
53] and its accuracy and AUC is respectively more successful than [
48] and [
45,
51] for DRIVE dataset as in
Table 4. The sensitivity of this study is more successful than [
45,
49,
51,
52,
54,
55] whereas the performance of its specificity is better than [
53,
55] and its accuracy and AUC is respectively higher than [
48,
53,
55] and [
45,
51] for STARE dataset as in
Table 5. The performance of the sensitivity of this study is higher than [
56] whereas its accuracy is more successful than [
57] for CHASE_DB1 dataset as in
Table 6. Performance comparison of the average execution times for DRIVE and STARE datasets between this study and some of the state of the art studies are given in
Table 7 [
52]. The algorithm of this study is implemented in MATLAB and executed in a PC with 2.2 GHz Intel core i7 CPU and 4 GB RAM.
One of the superiorities of this study with respect to the previous studies is its higher sensitivity values by not trading off the specificity and accuracy values dramatically. The other advantage of this study is that, as far as we know, it has the lowest execution time in the literature as shown in
Table 7 [
52]. The most important reason of the lower AUC values of this study is because of the fact that the previously mentioned calculation method of the AUC for the unsupervised algorithms yields lower values with respect to the supervised methods which can be crosschecked by looking sensitivity, accuracy and AUC values of the studies listed in
Table 4,
Table 5 and
Table 6 [
45,
46]. The proposed novel ST coloring-based vessel segmentation method can be utilized for different kind of micro tubular segmentation problems. This method can also be easily implemented on parallel software and hardware systems since the fact that the parallelizable structure of the employed tensor operations. The lesion removal algorithm which is proposed in this study can be exploited not only for the retinal image segmentation task but also for the different problems of medical image analysis.
This study can be beneficial for diagnosis of hypertension, retinopathy of prematurity, arteriosclerosis, choroidal neovascularization and diabetic retinopathy by providing the elegant sensitivity, specificity and accuracy metrics as well as execution speed [
1,
2]. In future, we will optimize all the parameters of this proposed retinal vessel segmentation algorithm via hyper parameter optimization techniques which will definitely improve its accuracy and speed.
5. Conclusions
In this study, the retinal vessel segmentation was performed with mean sensitivity of 0.8123, mean specificity of 0.9342, mean accuracy of 0.9183, mean AUC of 0.8732 and mean execution time of 6.104 s on DRIVE dataset. The vessel segmentation was achieved with mean sensitivity of 0.8126, mean specificity of 0.9442, mean accuracy of 0.9312, mean AUC of 0.8784 and mean execution time of 6.4525 s on STARE dataset.
The vessel detection was performed with mean sensitivity of 0.7246, mean specificity of 0.9453, mean accuracy of 0.9236, mean AUC of 0.8349 and mean execution time of 18.8370 s on CHASE_DB1 datasets. The proposed algorithm provided encouraging results especially by detecting main vessel arcs with reasonable sensitivity, specificity and accuracy values for 3 different publically available datasets and offering a new approach for segmentation literature by exploiting the coloring algorithm of the tensor visualization technique which uses ellipsoids.


