Article

The Selection of Wagons for the Internal Transport of a Logistics Company: A Novel Approach Based on Rough BWM and Rough SAW Methods

by
Željko Stević
1,
Dragan Pamučar
2,
Edmundas Kazimieras Zavadskas
3,*,
Goran Ćirović
4 and
Olegas Prentkovskis
5
1
Faculty of Transport and Traffic Engineering, University of East Sarajevo, Vojvode Mišića 52, 74000 Doboj, Bosnia and Herzegovina
2
Department of logistics, University of Defence in Belgrade, Pavla Jurisica Sturma 33, 11000 Belgrade, Serbia
3
Institute of Sustainable Construction, Faculty of Civil Engineering, Vilnius Gediminas Technical University, Sauletekio al. 11, LT-10223 Vilnius, Lithuania
4
College of Civil Engineering and Geodesy, Belgrade University, Hajduk Stankova 2, 11000 Belgrade, Serbia
5
Department of Mobile Machinery and Railway Transport, Faculty of Transport Engineering, Vilnius Gediminas Technical University, Plytinės g. 27, LT-10105 Vilnius, Lithuania
*
Author to whom correspondence should be addressed.
Symmetry 2017, 9(11), 264; https://doi.org/10.3390/sym9110264
Submission received: 30 September 2017 / Revised: 30 October 2017 / Accepted: 1 November 2017 / Published: 4 November 2017
(This article belongs to the Special Issue Civil Engineering and Symmetry)

Abstract

:
The rationalization of logistics activities and processes is very important in the business and efficiency of every company. In this respect, transportation as a subsystem of logistics, whether internal or external, is potentially a huge area for achieving significant savings. In this paper, the emphasis is placed upon the internal transport logistics of a paper manufacturing company. It is necessary to rationalize the movement of vehicles in the company’s internal transport, that is, for the majority of the transport to be transferred to rail transport, because the company already has an industrial track installed in its premises. To do this, it is necessary to purchase at least two used wagons. The problem is formulated as a multi-criteria decision model with eight criteria and eight alternatives. The paper presents a new approach based on a combination of the Simple Additive Weighting (SAW) method and rough numbers, which is used for ranking the potential solutions and selecting the most suitable one. The rough Best–Worst Method (BWM) was used to determine the weight values of the criteria. The results obtained using a combination of these two methods in their rough form were verified by means of a sensitivity analysis consisting of a change in the weight criteria and comparison with the following methods in their conventional and rough forms: the Analytic Hierarchy Process (AHP), Technique for Ordering Preference by Similarity to Ideal Solution (TOPSIS) and MultiAttributive Border Approximation area Comparison (MABAC). The results show very high stability of the model and ranks that are the same or similar in different scenarios.

1. Introduction

In the past decade, companies have recognized the significance of logistics for their complete system, as well as its outstanding importance in the global environment, as confirmed by Koskinen and Hilmola [1], in which the rationalization of basic logistics subsystems plays a key role. Transport is the most expensive logistics subsystem; that is, it causes the highest percentage of logistics costs. These costs are kept to a daily minimum, especially in large companies that have a large amount of transport movements on a daily basis. The research carried out in this paper relates to a paper manufacturing company, which is the largest company in its region and in its field, both from the aspect of the level of production, and in its efficiency of operations. However, by monitoring all of its logistics subsystems for a number of months, certain shortcomings were observed, as well as possibilities for making savings. In addition to the warehouse system of the company that currently represents one of the problems due to insufficient space for storing finished products, the internal transport is dominated by a certain amount of irrational movements of vehicles. To bring the logistics systems into a state of high rational functioning, a project was carried out to centralize the warehouse system that opens up new opportunities. As part of the project, since the company has railway infrastructure, it is necessary to redirect almost all of the internal transport to railway traffic, because it is well known that rail transport is cheaper than road transport. To achieve this, it is necessary to purchase at least two wagons that would meet the needs of internal transport. The paper defines a model of multi-criteria decision making consisting of eight wagons that represent the alternatives and eight criteria for their selection. In addition, a heterogeneous team of experts was formed to evaluate the elements of this model.
This paper has several objectives. The first objective is to improve the methodology for dealing with imprecision in the field of multi-criteria decision making by presenting the new Rough SAW algorithm. The second goal of this paper is to affirm the idea of rough numbers (RN) through a detailed presentation of the arithmetic operations with RN that are characteristic for multi-criteria decision making. Finally, the third goal of this paper is to bridge the gap in the methodology for evaluating the elements of internal transport, i.e., railway wagons, through a new approach to dealing with imprecision based on RN.
In addition to the introduction and conclusion, the paper has four sections (Section 2, Section 3, Section 4 and Section 5). Section 2 gives a literature review with an emphasis on the SAW method, while Section 3 is a description of the method used. The basic assumptions are given concerning rough numbers and the detailed algorithm is presented for the rough BWM and novel rough SAW methods. This section also presents a new linguistic scale for evaluating alternatives, depending on the type of criteria. Section 4 presents the selection of a wagon in the paper manufacturing company using the new rough SAW method. Section 5 is a sensitivity analysis that checks the stability of the model and the results obtained.

2. Literature Review

Multi-criteria decision making has wide application in all areas, and, when it comes to logistics, its transport subsystem is often used to select the type of transport [2,3]. A study on the evaluation and selection of sustainable transport means has been carried out [4] as well as the evaluation of transport systems in Brazil [5], the prioritization of the investments in transport infrastructure [6] and the selection of logistics providers [7,8], while, in another study [9], the evaluation of city logistics scenarios was carried out. The systematization of methods belonging to the field of multi-criteria decision making that are applied in the field of transport systems was carried out by Mardani et al. [10] in which the authors conclude that these methods are adequate and offer significant help when making decisions in the area of transportation. Turskis and Zavadskas [11] presented a new multi-criteria model in order to select a location for a logistics center, which is a commonly considered problem using multi-criteria methods [12,13]. Logistics systems are extremely important for the functioning of the complete supply chain, so almost every day the evaluation and selection of suppliers is carried out [8,14,15] and this is one of the most important steps in optimizing logistics systems.
The literature related to the application of different models of multi-criteria decision making considers two basic approaches: (1) multi-attribute decision making; and (2) multi-objective decision making. In each of these two approaches, there are a number of methods whose differences are primarily seen in different mathematical algorithms [16]. In addition to the difference in mathematical procedures, Pohekar and Ramachandran [16] point out that multi-criteria models can also be classified as deterministic, stochastic or fuzzy models. Clarsson and Fuller [17] presented the categorization of multi-criteria models by means of four basic units. One of the categorizations is value and utility theory approaches, which includes the application of models to determine the relative significance of the optimization criteria and the alternatives. Within this category, most of the methods rely on the weight values of the optimization criteria, and the basic representatives are: Simple Additive Weighting (SAW), Analytic Hierarchy Process (AHP), fuzzy conjuctive/disjunctive methods, fuzzy outranking methods and max-min methods. Of these methods, alongside the AHP method, the SAW method has had the most common modifications and the widest application in solving multi-criteria models [16,18]. The SAW method is still also well-known as the weighted linear combination or scoring method. Many authors decide to apply this simple mathematical apparatus to solve various multi-criteria problems [19,20,21,22]. In the literature, in addition to the traditional SAW method, its modifications based on fuzzy theory are also well-known [23,24,25,26,27].
Shameli et al. [20] presented the application of the traditional (crisp) SAW method for solving a practical model for information security risk assessment. In addition to the traditional SAW method, Shameli et al. [20] used the TOPSIS model and the fuzzy modification of the SAW method to compare the results obtained. Afshari et al. [28] used the traditional SAW model to solve the personnel selection problem in Iran. Deni et al. [24] used the fuzzy SAW (FSAW) model to select high achieving students at the faculty level. Gupta and Gupta [25] used the SAW model to analyze the existing system of vendor rating. Azzizollah et al. [29] applied the fuzzy Delphi method to the collection of expert opinions when selecting suitable maintenance strategies. In that study, the optimal maintenance strategy was proposed by applying the crisp SAW model. Chen [30] modified the SAW algorithm by applying interval-valued fuzzy (IVF) sets. The SAW method was also used to evaluate the efficiency of diesel locomotives [31], while Jakimavičius and Burinskiene [32] used it to evaluate development scenarios based on modeling transport systems. Because of its simple and reliable algorithm, the SAW method has found application in solving various problems, such as: selecting the optimal maintenance strategy [26], selecting locations [33,34], the machine tool selection problem [35], personnel selection [28,36], and comparative analysis without application [23,30].
This overview shows that the literature is familiar with the crisp SAW, FSAW and IVF SAW algorithms. Bearing in mind that the SAW method falls into the category of methods that have found the widest application in solving multi-criteria models [16,18], further development of the SAW method through the application of other uncertainty approaches is justified. To achieve the greatest objectivity in deciding and appreciating uncertainty in decision making, numerous uncertainty approaches have been developed in the field of multi-criteria decision making: fuzzy theory [37], rough theory [38,39], grey theory [40,41], Z numbers [42,43], etc. Today, in addition to fuzzy theory, the most commonly used theory for dealing with imprecision in the decision-making process is rough theory, that is, rough numbers [44,45,46,47]. Having in mind all the advantages of using rough theory [38,39] in the decision-making process, the authors have decided in this paper to show the modification of the SAW algorithm and BWM using rough numbers (RBWM-SAW), which is an original contribution.

3. Methods

3.1. Operations with Rough Numbers

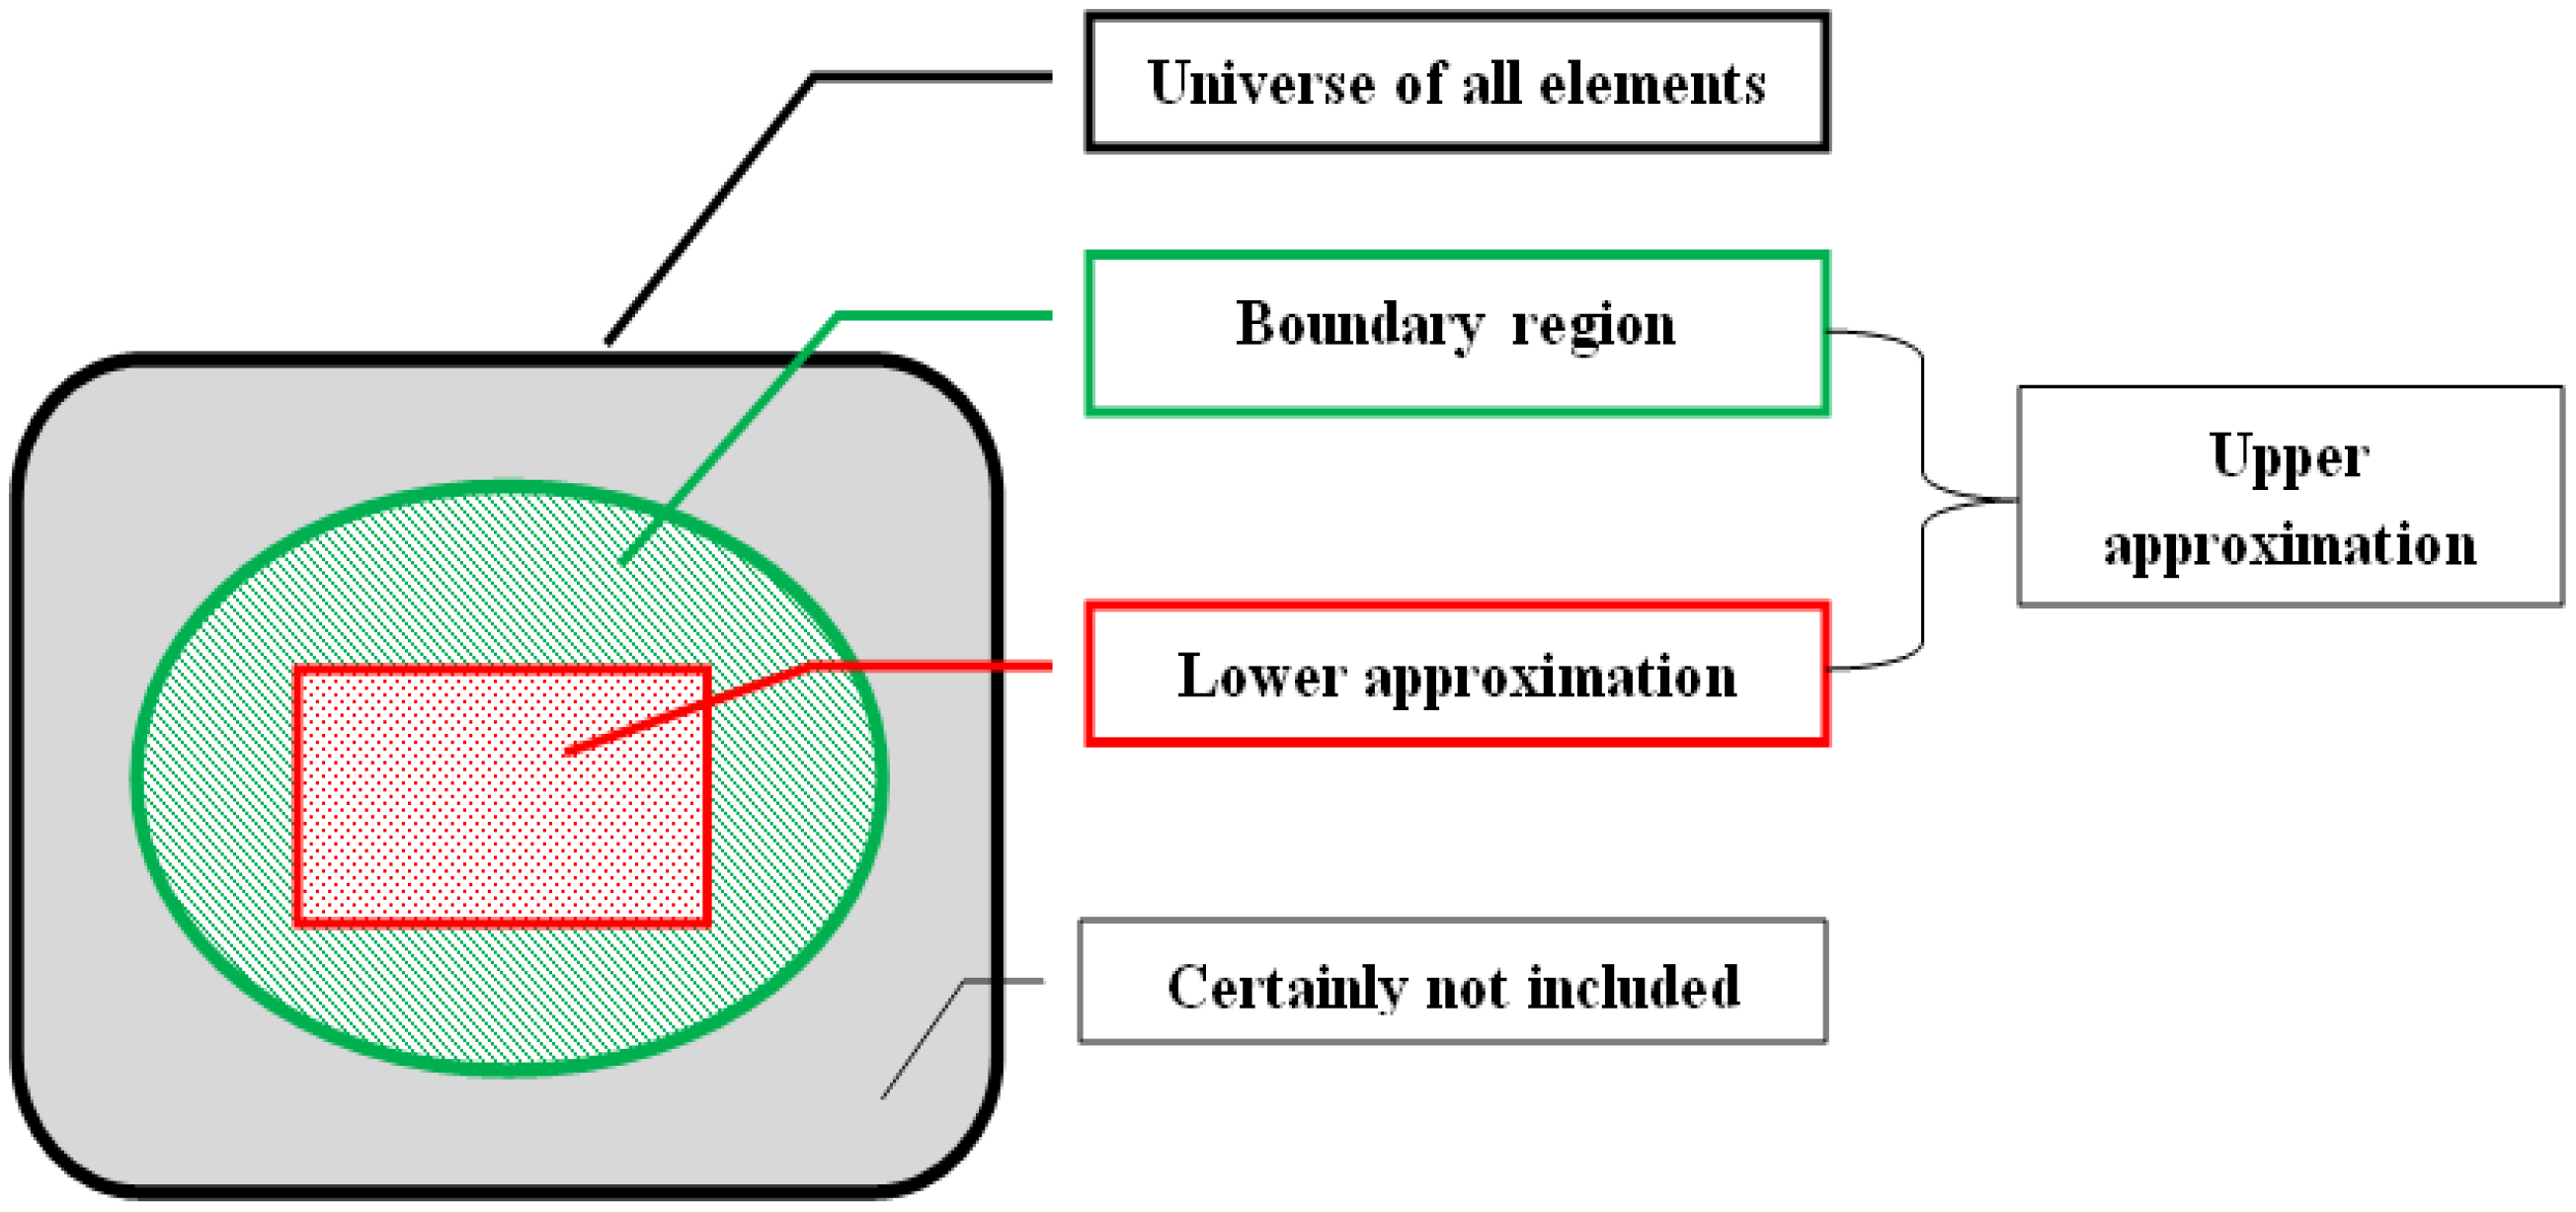
In rough set theory, any vague idea can be represented as a couple of exact concepts based on the lower and upper approximations. This is shown in Figure 1.
Suppose U is the universe which contains all the objects, Y is an arbitrary object of U, R is a set of t classes { G 1 , G 2 , , G t } that cover all the objects in U, R = { G 1 , G 2 , , G t } . If these classes are ordered as { G 1 < G 2 < < G t } , then Y U , G q R , 1 q t , by R (Y) we mean the class to which the object belongs, the lower approximation ( A p r ¯ ( G q ) ) , upper approximation ( A p r ¯ ( G q ) ) and boundary region ( B n d ¯ ( G q ) ) of class G q are, according to [48], defined as:
A p r ¯ ( G q ) = { Y U / R ( Y ) G q }
B n d ( G q ) = { Y U / R ( Y ) G q } = { Y U / R ( Y ) > G q } { Y U / R ( Y ) < G q }
Then, G q can be shown as rough number ( R N ( G q ) ), which is determined by its corresponding lower limit ( L i m ¯ ( G q ) ) and upper limit ( L i m ¯ ( G q ) ) where:
L i m ¯ ( G q ) = 1 M L { Y A p r ¯ ( G q ) } R ( Y )
L i m ¯ ( G q ) = 1 M U { Y A p r ¯ ( G q ) } R ( Y )
R N ( G q ) = [ L i m ¯ ( G q ) , L i m ¯ ( G q ) ]
where M L , M U are the numbers of objects that contained in A p r ¯ ( G q ) and A p r ¯ ( G q ) , respectively.
The difference between them is expressed as rough boundary interval ( I R B n d ( G q ) ) :
I R B n d ( G q ) = L i m ¯ ( G q ) L i m ¯ ( G q )
The operations for two rough numbers R N ( α ) = [ L i m ¯ ( α ) , L i m ¯ ( α ) ] and R N ( β ) = [ L i m ¯ ( β ) , L i m ¯ ( β ) ] according to Zhai et al. [49] are:
Addition (+) of two rough numbers RN(α) and RN(β)
R N ( α ) + R N ( β ) = [ L i m ¯ ( α ) + L i m ¯ ( β ) , L i m ¯ ( α ) + L i m ¯ ( β ) ]
Subtraction (−) of two rough numbers R N ( α ) and R N ( β )
R N ( α ) R N ( β ) = [ L i m ¯ ( α ) L i m ¯ ( β ) , L i m ¯ ( α ) L i m ¯ ( β ) ]
Multiplication (×) of two rough numbers R N ( α ) and R N ( β )
R N ( α ) × R N ( β ) = [ L i m ¯ ( α ) × L i m ¯ ( β ) , L i m ¯ ( α ) × L i m ¯ ( β ) ]
Division (/) of two rough numbers R N ( α ) and R N ( β )
R N ( α ) / R N ( β ) = [ L i m ¯ ( α ) / L i m ¯ ( β ) , L i m ¯ ( α ) / L i m ¯ ( β ) ]
Scalar multiplication of rough number R N ( α ) , where μ is a nonzero constant
μ × R N ( α ) = [ μ × L i m ¯ ( α ) , μ × L i m ¯ ( α ) ]

3.2. Best–Worst Method

The BWM [50] is one of the more recent methods. Some of the advantages that cause authors decide to use BWM are as follows: (1) in comparison with the AHP method, which until the establishment of this method was in comparable and most commonly used to determine weight coefficients [48], it requires a smaller number of pairwise comparisons (in the AHP method, the number of comparisons is n(n − 1)/2, while, for the BWM, the number of comparisons is 2n − 3; (2) weight coefficients determined using the BWM are more reliable, since comparisons in this method are made with a higher degree of consistency compared with the AHP method; (3) with most MCDM models (e.g., AHP), the degree of consistency checks whether the comparison of criteria is consistent or not, while, in BWM, the degree of consistency is used to determine the level of consistency because the outputs from BWM are always consistent; and (4) the BWM for pairwise comparison of the criteria requires only integer values, which is not the case with other MCDM methods (e.g., AHP) which also require fractional numbers.
To more comprehensively take into account the imprecision that appears in the group decision making process, a modification of the Best–Worst (BWM) method was carried out using rough numbers (RN). By using rough numbers, the need for additional information to determine the uncertainty of the intervals of the numbers is eliminated. This maintains the quality of the existing data in group decision making and the perceptions of the experts are expressed objectively in aggregated Best-to-Others (BO) and Others-to-Worst (OW) vectors. Since this is a recent method [50], there are not many BWM modifications in the literature. In the literature until now, the majority of authors have applied the traditional (crisp) BWM algorithm [50,51,52,53,54] and a modification of the BW method carried out with fuzzy numbers [55,56]. The approach presented in this chapter introduces RN, which secure a more objective evaluation of the criteria in cases where there is imprecision in the expert decisions. The proposed modification of BWM using RN (RBWM (the Rough Best–Worst Method)) makes it possible to consider doubts that arise during the expert evaluation of the criteria. The RBWM makes it possible to bridge the existing gap that exists in the BWM methodology by applying a new approach in treating imprecision that is based on RN. The next section presents the algorithm for the RBWM that includes the following steps:
Step 1. Determining the set of evaluation criteria. This starts from the assumption that the process of decision making involves m experts. In this step, experts consider the set of evaluation criteria and select the final set of criteria C = { c 1 , c 2 , c n } , where n represents the total number of criteria.
Step 2. Determining the most significant (most influential) and worst (least significant) criteria. The experts decide on the best and the worst criteria from the set of criteria C = { c 1 , c 2 , c n } . If the experts decide on two or more criteria as the best, or worst, the best and worst criteria are selected arbitrarily.
Step 3. Determining the preferences of the most significant (most influential) criteria (B) from set C over the remaining criteria from the defined set. Under the assumption that there are m experts and n criteria under consideration, each expert should determine the degree of influence of the best criterion B on the criteria j ( j = 1 , 2 , , n ). This is how we obtain a comparison between the best criterion and the other criteria. The preference of criterion B compared to the j-th criterion defined by the e-th expert is denoted with a B j e ( j = 1 , 2 , , n ; 1 e m ). The value of each pair a B j e takes a value from the predefined scale in interval a B j e { 1 , 9 } . As a result, a Best-to-Others (BO) vector is obtained:
A B e = ( a B 1 e ,   a B 2 e , ,   a B n e ) ; 1 e m
where a B j e represents the influence (preference) of the best criterion B over criterion j, whereby a B B e = 1 . This is how we obtain BO matrices A B 1 , A B 2 , …, A B m for each expert.
Step 4. Determining the preferences of the criteria from set C over the worst criterion (W) from the defined set. Each expert should determine the degree of influence of criterion j ( j = 1 , 2 , , n ) in relation to criterion W. The preference of criterion j in relation to criterion W defined by the e-th expert is denoted as a j W e ( j = 1 , 2 , , n ; 1 e m ). The value of each pair a j W e takes a value from the predefined scale in interval. As a result, an Others-to-Worst (OW) vector is obtained:
A W e = ( a 1 W e ,   a 2 W e , ,   a n W e ) ; 1 e m
where a j W e represents the influence (preference) of criterion j in relation to criterion W, whereby a W W e = 1 . This is how we obtain OW matrices A W 1 , A W 2 , …, A W m for each expert.
Step 5. Determining the rough BO matrix for the average answers of the experts. Based on the BO matrices of the experts’ answers A B e = [ a B j e ] 1 × m n , we form matrices of the aggregated sequences of experts A B * e
A B * e = [ a B 1 1 , a B 1 2 , , a B 1 m ;   a B 2 1 ; a B 2 2 ; ; a B 2 m ,   ,   a B n 1 ; a B n 2 , , a B n m ] 1 × m n
where a B j e = { a B j 1 , a B j 2 , , a B n m } represents sequences by means of which the relative significance of criterion B is described in relation to criterion j. Using Equations (1)–(6), each sequence a B j e is transformed into rough sequence R N ( a B j e ) = [ L i m ¯ ( a B j e ) ,   L i m ¯ ( a B j e ) ] , where L i m ¯ ( a B j e ) represents the lower limit and L i m ¯ ( a B j e ) represents upper limit of the rough sequence R N ( a B j e ) .
Thus, for sequence R N ( a B j e ) , we obtain a BO matrix A B * 1 , A B * 2 , …, A B * m . By applying Equation (16), we obtain the average rough sequence of the BO matrix:
R N ( a ¯ B j ) = R N ( a B j 1 , , a B j e ) = [ a ¯ B j L , a ¯ B j U ]
where a ¯ B j L = 1 m e = 1 m a B j e L and a ¯ B j U = 1 m e = 1 m a B j e U , e represents the e-th expert ( e = 1 , 2 , , m ), R N ( a B j e ) represents the rough sequences. We thus obtain the averaged rough BO matrix of average responses A ¯ B ,
A ¯ B = [ a ¯ B 1 , a ¯ B 2 , , a ¯ B n ] 1 × n
Step 6. Determining the rough OW matrix of average expert responses. Based on the WO matrices of the expert responses A W e = [ a j W e ] 1 × n , as with the rough BO matrices, for each element a j W e , we form matrices of the aggregated sequences of the experts A W * e
A W * e = [ a 1 W 1 , a 1 W 2 , , a 1 W m ;   a 2 W 1 ; a 2 W 2 ; ; a 2 W m ,   ,   a n W 1 ; a n W 2 , , a n W m ] 1 × m n
where a j W e = { a j W 1 , a j W 2 , , a n W m } represents the sequence with which the relative significance of criterion j is described in relation to criterion W.
As in Step 5, using Equations (1)–(6), the sequences a j W e are transformed into rough sequences R N ( a j W e ) = [ L i m ¯ ( a j W e ) ,   L i m ¯ ( a j W e ) ] . Thus, for each rough sequence of expert e ( 1 e m ), a rough BO matrix is formed. Equation (19) is used to average the rough sequences of the OW matrix of the experts to obtain an averaged rough OW matrix.
R N ( a ¯ j W ) = R N ( a j W 1 , a j W 2 , , a j W e ) = { a ¯ j W L = 1 m e = 1 m a j W e L a ¯ j W U = 1 m e = 1 m a j W e U
where e represents the e-th expert ( e = 1 , 2 , , m ), R N ( a j W ) represents the rough sequences. Thus, we obtain the averaged rough OW matrix of average responses A ¯ W
A ¯ W = [ a ¯ 1 W , a ¯ 2 W , , a ¯ n W ] 1 × n
Step 7. Calculation of the optimal rough values of the weight coefficients of the criteria [ R N ( w 1 ) , R N ( w 2 ) , , R N ( w n ) ] from set C . The goal is to determine the optimal value of the evaluation criteria, which should satisfy the condition that the difference in the maximum absolute values (21)
| R N ( w B ) R N ( w j ) R N ( a B j ) | a n d | R N ( w j ) R N ( w W ) R N ( w j W ) |
for each value of j is minimized. To meet these conditions, the solution that satisfies the maximum differences according to the absolute value | R N ( w B ) R N ( w j ) R N ( a B j ) | and | R N ( w j ) R N ( w W ) R N ( w j W ) | should be minimized for all values of j. For all values of the interval rough weight coefficients of the criteria R N ( w j ) = [ L i m ¯ ( w j ) ,   L i m ¯ ( w j ) ] = [ w j L , w j U ] the condition is met that 0 w j L w j U 1 for each evaluation criterion c j C . The weight coefficient w j belongs to interval [ w j L , w j U ] , that is, w j L w j U for each value j = 1 , 2 , , n . On this basis, we can conclude that in the case of the rough values of the weight coefficients of the criteria, the condition is met that j = 1 n w j L 1 and j = 1 n w j U 1 . In this way, the condition is met that the weight coefficients are found at interval w j [ 0 , 1 ] , ( j = 1 , 2 , , n ) and that j = 1 n w j = 1 .
The previously defined limits will be presented in the following min-max model:
min max j { | R N ( w B ) R N ( w j ) R N ( a B j ) | , | R N ( w j ) R N ( w W ) R N ( w j W ) | } s . t . { j = 1 n w j L 1 j = 1 n w j U 1 ; w j L w j U , j = 1 , 2 , , n w j L , w j U 0 , j = 1 , 2 , , n
where R N ( w j ) = [ L i m ¯ ( w j ) ,   L i m ¯ ( w j ) ] = [ w j L , w j U ] is the rough weight coefficient of a criterion.
Model (22) is equivalent to the following model:
min ξ s . t . { | w B L w j U a ¯ B j U | ξ ;   | w B U w j L a ¯ B j L | ξ ; | w j L w W U a ¯ j W U | ξ ;   | w j U w W L a ¯ j W L | ξ ; j = 1 n w j L 1 ; j = 1 n w j U 1 ; w j L w j U , j = 1 , 2 , , n w j L , w j U 0 , j = 1 , 2 , , n
where R N ( w j ) = [ w j L , w j U ] represents the optimum values of the weight coefficients, R N ( w B ) = [ w B L , w B U ] and R N ( w W ) = [ w W L , w W U ] represents the weight coefficients of the best and worst criterion respectively, while R N ( a ¯ j W ) = [ a ¯ j L , a ¯ j U ] and R N ( a ¯ B j ) = [ a ¯ B j L , a ¯ B j U ] , respectively, represent the values from the average rough OW and rough BO matrices (see Equations (17) and (20)).
By solving model (23) we obtain the optimal values of the weight coefficients for the evaluation criteria [ R N ( w 1 ) , R N ( w 2 ) , , R N ( w n ) ] and ξ * .
The consistency ratio is a very important indicator by means of which we check the consistency of the pairwise comparison of the criteria in the rough BO and rough OW matrices.
Definition 1.
Comparison of the criteria is consistent when condition R N ( a B j ) × R N ( a j W ) = R N ( a B W ) is fulfilled for all criteria j, where R N ( a B j ) , R N ( a j W ) and R N ( a B W ) respectively represent the preference of the best criterion over criterion j, the preference of criterion j over the worst criterion, and the preference of the best criterion over the worst criterion.
However, when comparing the criteria it can happen that some pairs of criteria j are not completely consistent. Therefore, the next section defines the consistency ratio (CR), which gives us information on the consistency of the comparison between the rough BO and rough OW matrices. To show how the CR is determined, we start from a calculation of the minimum consistency when comparing the criteria, which is explained in the following section.
As previously indicated, pairwise comparison of the criteria is carried out based on a predefined scale in which the highest value is 9 or any other maximum from a scale defined by the decision maker. The consistency of the comparison decreases when R N ( a B j ) × R N ( a j W ) is less or greater than R N ( a B W ) ; that is, when R N ( a B j ) × R N ( a j W ) R N ( a B W ) . It is clear that the greatest inequality occurs when R N ( a B j ) and R N ( a j W ) have the maximum values that are equal R N ( a B W ) , which continues to affect the value of ξ . Based on these relationships we can conclude that
[ R N ( w B ) / R N ( w j ) ] × [ R N ( w j ) / R N ( w W ) ] = R N ( w B ) / R N ( w W )
As the largest inequality occurs when R N ( a B j ) and R N ( a j W ) have their maximum values, then we need to subtract the value of ξ from R N ( a B j ) and R N ( a j W ) and add R N ( a B W ) . Thus, we obtain Equation (25):
[ R N ( a B j ) ξ ] × [ R N ( a j W ) ξ ] = [ R N ( a B W ) + ξ ]
Since for the minimum consistency R N ( a B j ) = R N ( a j W ) = R N ( a B W ) applies, we present Equation (25) as
[ R N ( a B W ) ξ ] × [ R N ( a B W ) ξ ] = [ R N ( a B W ) + ξ ] ξ 2 [ 1 + 2 R N ( a B W ) ] ξ + [ R N ( a B W ) 2 R N ( a B W ) ] = 0
Since we are using rough numbers, and if there is no consensus between the DM on their preferences of the best criterion over the worst criterion, then R N ( a B W ) will not have a crisp value but we will use R N ( a ¯ B W ) = [ a ¯ B W L , a ¯ B W U ] . Since for RN the condition a ¯ B W L a ¯ B W U applies, we can conclude that the preference of the best criterion over the worst cannot be greater than a ¯ B W U . In this case, when we use upper limit a ¯ B W U for determining the value of CI, then all values connected with R N ( a ¯ B W ) can use the CI obtained for calculating the value of CR. We can conclude this from the fact that the consistency index, which corresponds to a ¯ B W U , has the highest value in interval [ a ¯ B W L , a ¯ B W U ] . Based on this conclusion, we can transform Equation (26) in the following way
ξ 2 ( 1 + 2 a ¯ B W U ) ξ + ( a ¯ B W U 2 a ¯ B W U ) = 0
By solving Equation (27) for the different values of a ¯ B W U , we can determine the maximum possible values of ξ , which is the CI for the R-BW method. Since we obtain the values of R N ( a ¯ B W ) , i.e., a ¯ B W U , based on the aggregated decisions of the DM, and these change the RN interval, it is not possible to predefine the values of ξ . The values of ξ depend on uncertainties in the decisions, since uncertainties change the RN interval. As explained in the algorithm for the R-BW method, interval [ a B W L , a B W U ] changes depending on uncertainties in evaluating the criteria.
If the DM agree on their preference for the best criterion over the worst then a B W represents the crisp value of a B W from the defined scale and then the maximum values of ξ apply for different values of a B W { 1 , 2 , , 9 } , Table 1.
In Table 1, the values a B W are taken from the scale { 1 , 2 , , 9 } which is defined in [50]. Based on CI (Table 1), we obtain the consistency ratio (CR)
C R = ξ * C I
The CR takes values from interval [ 0 , 1 ] , where values closer to zero show high consistency, while the values of CR closer to one show low consistency.

3.3. Rough SAW Method

As already mentioned in the previous section, the SAW method is a simple and easily applicable method of multi-criteria decision making. However, using only crisp numbers, it is impossible to obtain results that treat uncertainty and objectivity in an adequate way. Therefore, this paper continues by presenting a new approach that combines the SAW method and rough numbers. The Rough SAW method consists of the following steps:
Step 1: Define the problem that needs to be solved, which is made up of m alternatives and n criteria.
Step 2: Form a group of k experts, who evaluate the alternatives according to all the criteria using the following linguistic scale shown in Table 2.
Table 2 shows a new linguistic scale, based on which a group of experts evaluates the alternatives, taking into account the type of criteria (benefit or cost). In this method of solving engineering problems, it is very important that the evaluation of potential solutions is carried out in an adequate way, therefore implying the application of the mentioned scale. When we have criteria such as for example cost or income that can be shown quantitatively, there will be no complications in solving the problem as long as all criteria can be expressed quantitatively. However, this is not the case when evaluation is carried out using a linguistic scale (qualitative criteria) and when, right at the beginning of quantifying the criteria, there is an incorrect evaluation by experts, since the type of criteria has not been taken into account. If this is the case, it cannot be replaced later by normalization, and the application of a new scale is recommended.
Step 3: Convert individual matrices into a group rough matrix. It is necessary to transform each individual matrix of experts k1, k2, …, kn into a rough group matrix using Equations (1)–(6):
R G N = [ [ x 11 L , x 11 U ] [ x 21 L , x 21 U ] [ x m 1 L , x m 1 U ] [ x 12 L , x 12 U ] [ x 22 L , x 22 U ] [ x m 2 L , x m 2 U ] [ x 1 n L , x 1 n U ] [ x 2 n L , x 2 n U ] [ x m n L , x m n U ] ]
Step 4: Normalize the group matrix using Equations (30) and (31):
r i j = [ x i j L ; x i j U ] max [ x i j + L ; x i j + U ]   f o r   C 1 , C 2 , , C n ϵ B
[ x i j L ; x i j U ] denotes the values of the alternatives according to criteria from the initial rough group matrix, while max [ x i j + L ; x i j + U ] denotes maximum value of criterion if criterion belongs a set of benefit criteria.
r i j = min [ x i j L ; x i j U ] [ x i j L ; x i j U ]   f o r   C 1 , C 2 , , C n ϵ C
[ x i j L ; x i j U ] denotes the values of the alternatives according to criteria from the initial rough group matrix, while min [ x i j L ; x i j U ] denotes minimal value of criterion if criterion belongs a set of cost criteria.
The values are marked with “+” and “” to make it easier to recognize those which belong to different types of criteria.
The previously written equations can be more simply expressed as:
r i j = [ x i j L x i j + U ; x i j U x i j + L ]   f o r   C 1 , C 2 , , C n ϵ B
r i j = [ x i j L x i j U ; x i j U x i j L ]   f o r   C 1 , C 2 , , C n ϵ C
Then, a normalized matrix is obtained:
R n = [ [ r 11 L , r 11 U ] [ r 21 L , r 21 U ] [ r m 1 L , r m 1 U ] [ r 12 L , r 12 U ] [ r 22 L , r 22 U ] [ r m 2 L , r m 2 U ] [ r 1 n L , r 1 n U ] [ r 2 n L , r 2 n U ] [ r m n L , r m n U ] ]
r i j from matrix R n denotes normalized values obtained using Equations (30) and (31)
Step 5: Weight the normalized matrix:
V n = [ v i j L ; v i j U ] m x n v i j L = w J L × r i j L , i = 1 , 2 , m , j v i j U = w J U × r i j U , i = 1 , 2 , m , j
where wjL is the lower limit, and wjU is the upper limit of the weights of the criteria, expressed as rough numbers obtained using rough AHP or rough BWM as is the case in this paper.
Step 6: Sum all of the values of the alternatives obtained (summing by rows):
S = [ s i j L ; s i j U ]
Step 7: Rank the alternatives in descending order; that is, the highest value is the best alternative. To rank the potential solutions more easily, the rough number can be converted into a crisp number using the average value.
4. Case Study

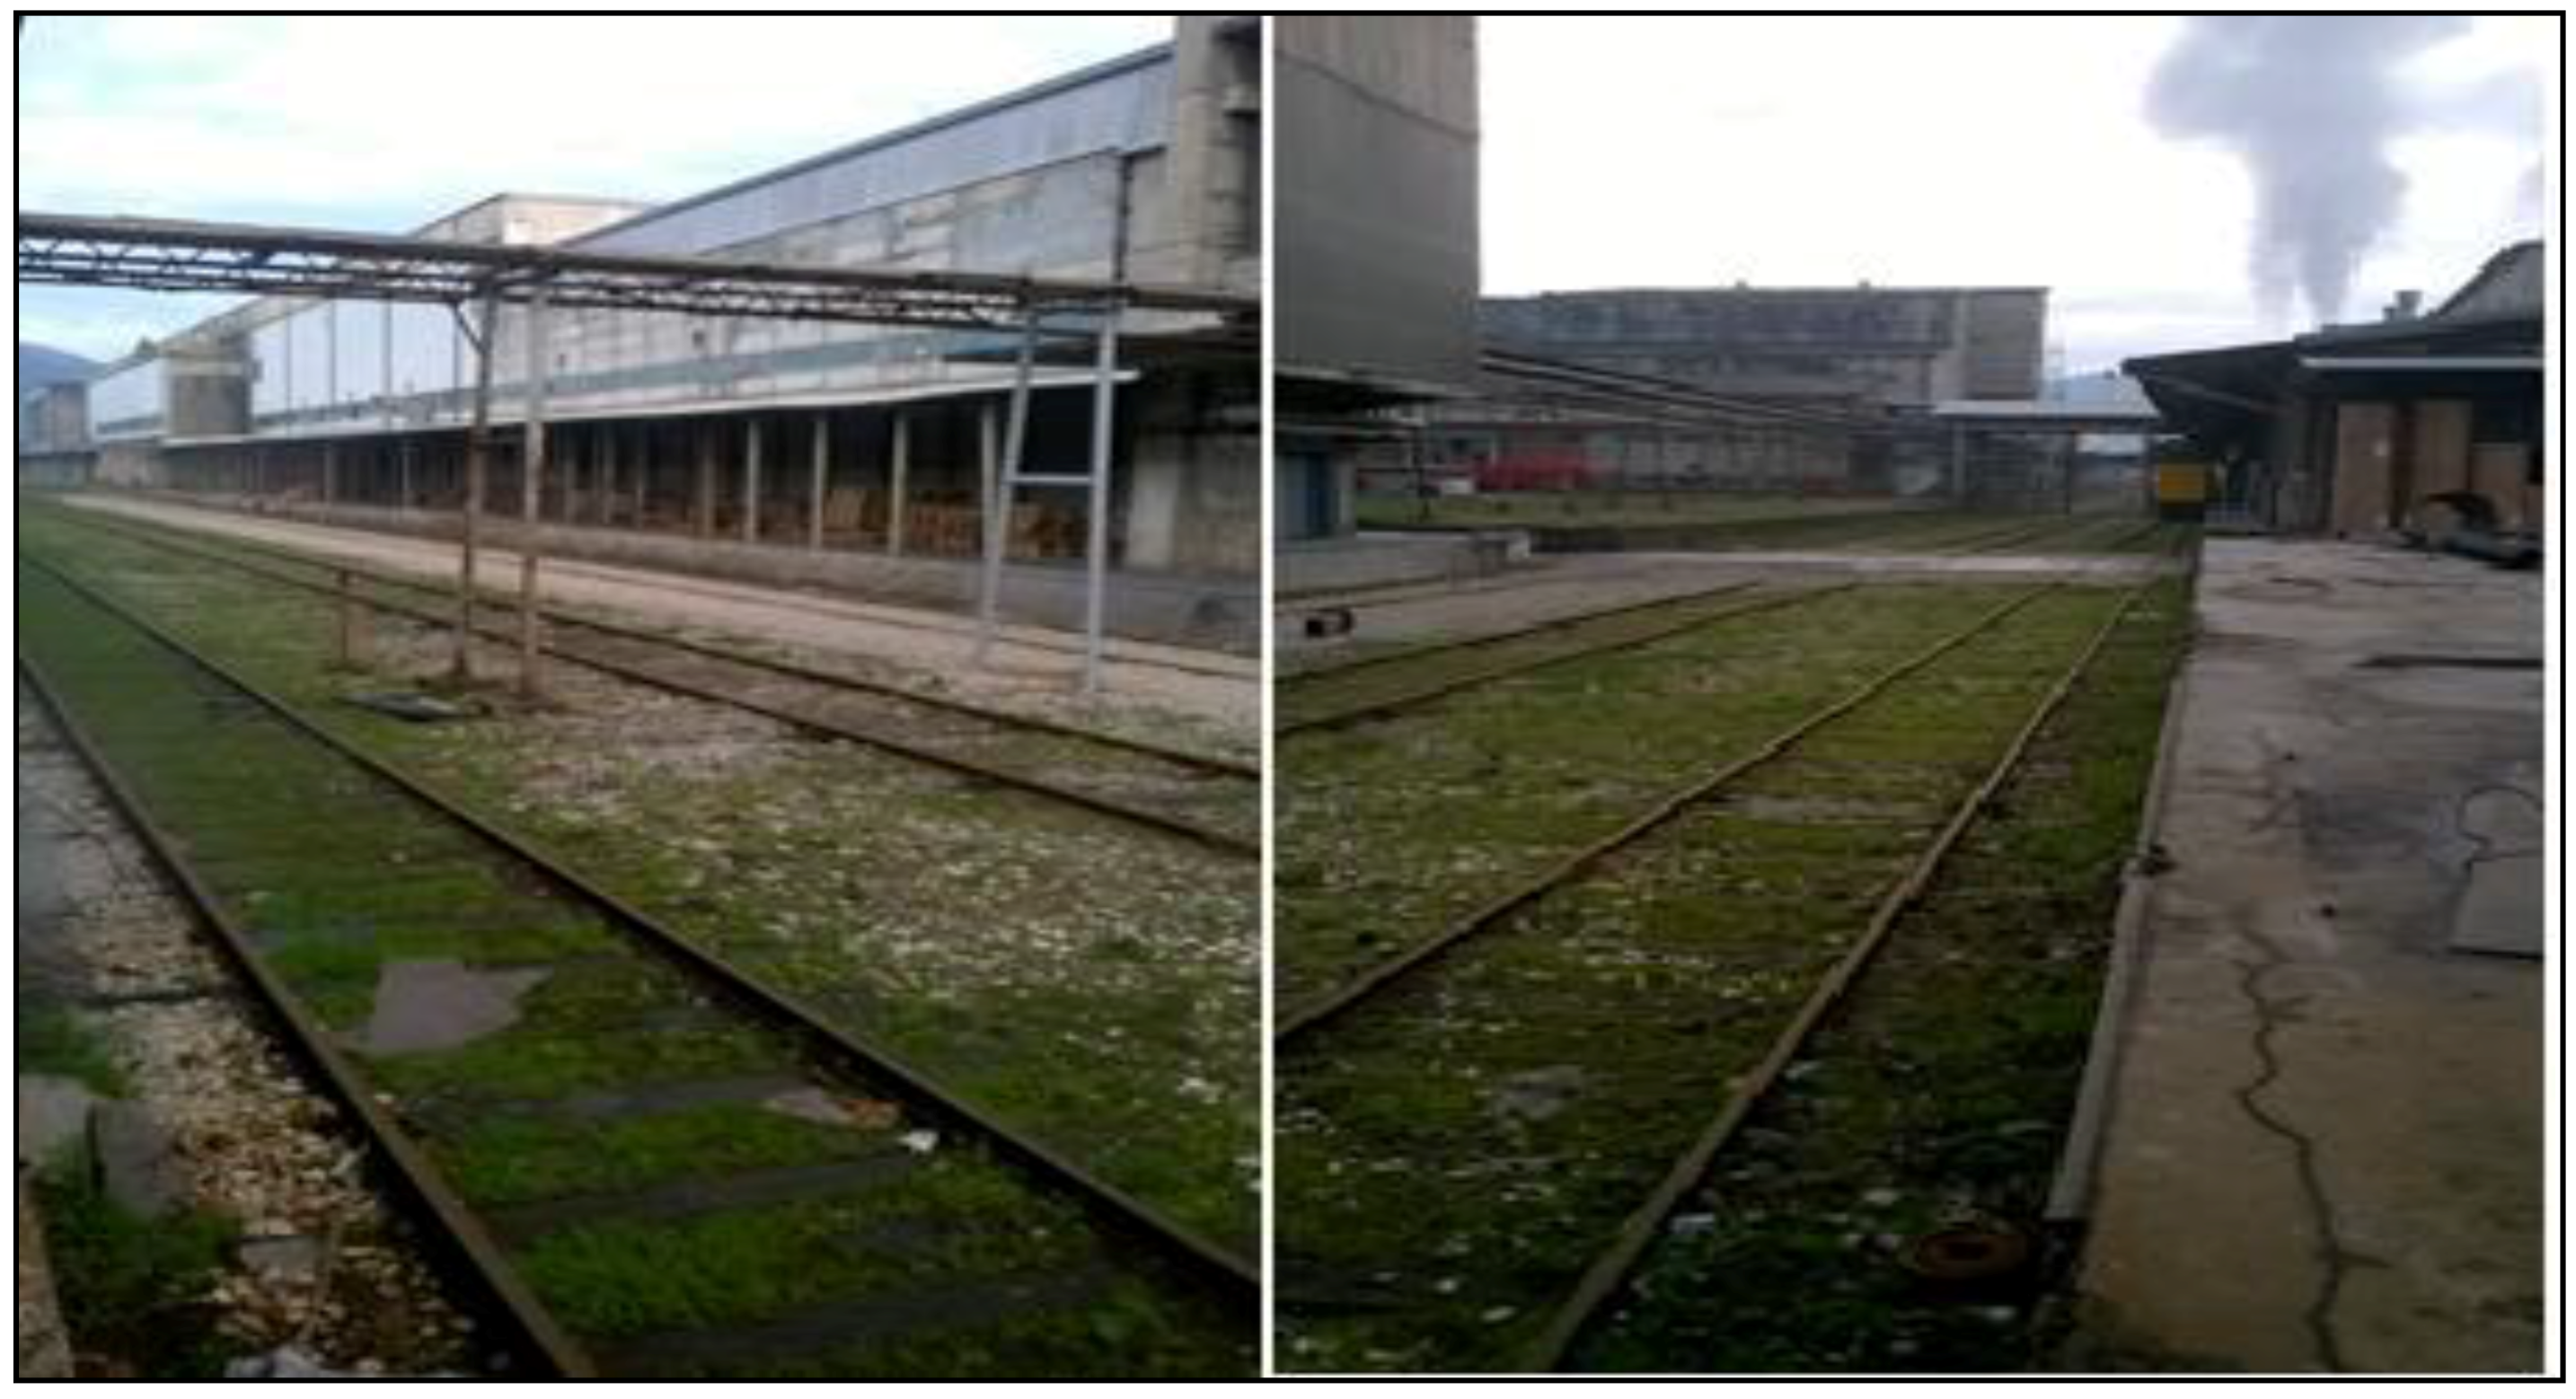
The company in which the research was carried out to select wagon for its internal transport is classified as a large company, since it has over 1000 workers and is an enormous elaborate complex that spreads over approximately 1,000,000 m2. As already stated at the beginning of the paper, it is a manufacturing company in which the logistics subsystem and processes are its dominant activities, starting from the procurement of raw materials for the manufacture of paper, through the production process, transport and storage to the dispatch of finished products to end users. The company continuously works in three shifts, thus it achieves a large volume of production on a daily basis and sells its finished products worldwide to more than forty countries. This is also evidenced by the fact that it is currently fifth in its total amount of exports for the entire territory of Bosnia and Herzegovina. At the beginning of 2017, a centralization project for the warehouse system of the company was carried out, which could greatly contribute to achieving significant savings on an annual basis and which recommends changes in its internal transport. Since there are five production machines spatially located close to the proposed central warehouse, it is necessary to deliver the finished products to it in an optimal manner with, of course, the lowest possible costs. To achieve this, it is necessary to perform a complete rationalization of the movement of vehicles within the logistics subsystem of internal transport. Currently, most of the internal transport is carried out by means of road transport which burdens the company’s logistics system with unnecessary costs. Most of this transport should be carried out by rail, since the company already has railway infrastructure installed as shown in Figure 2.
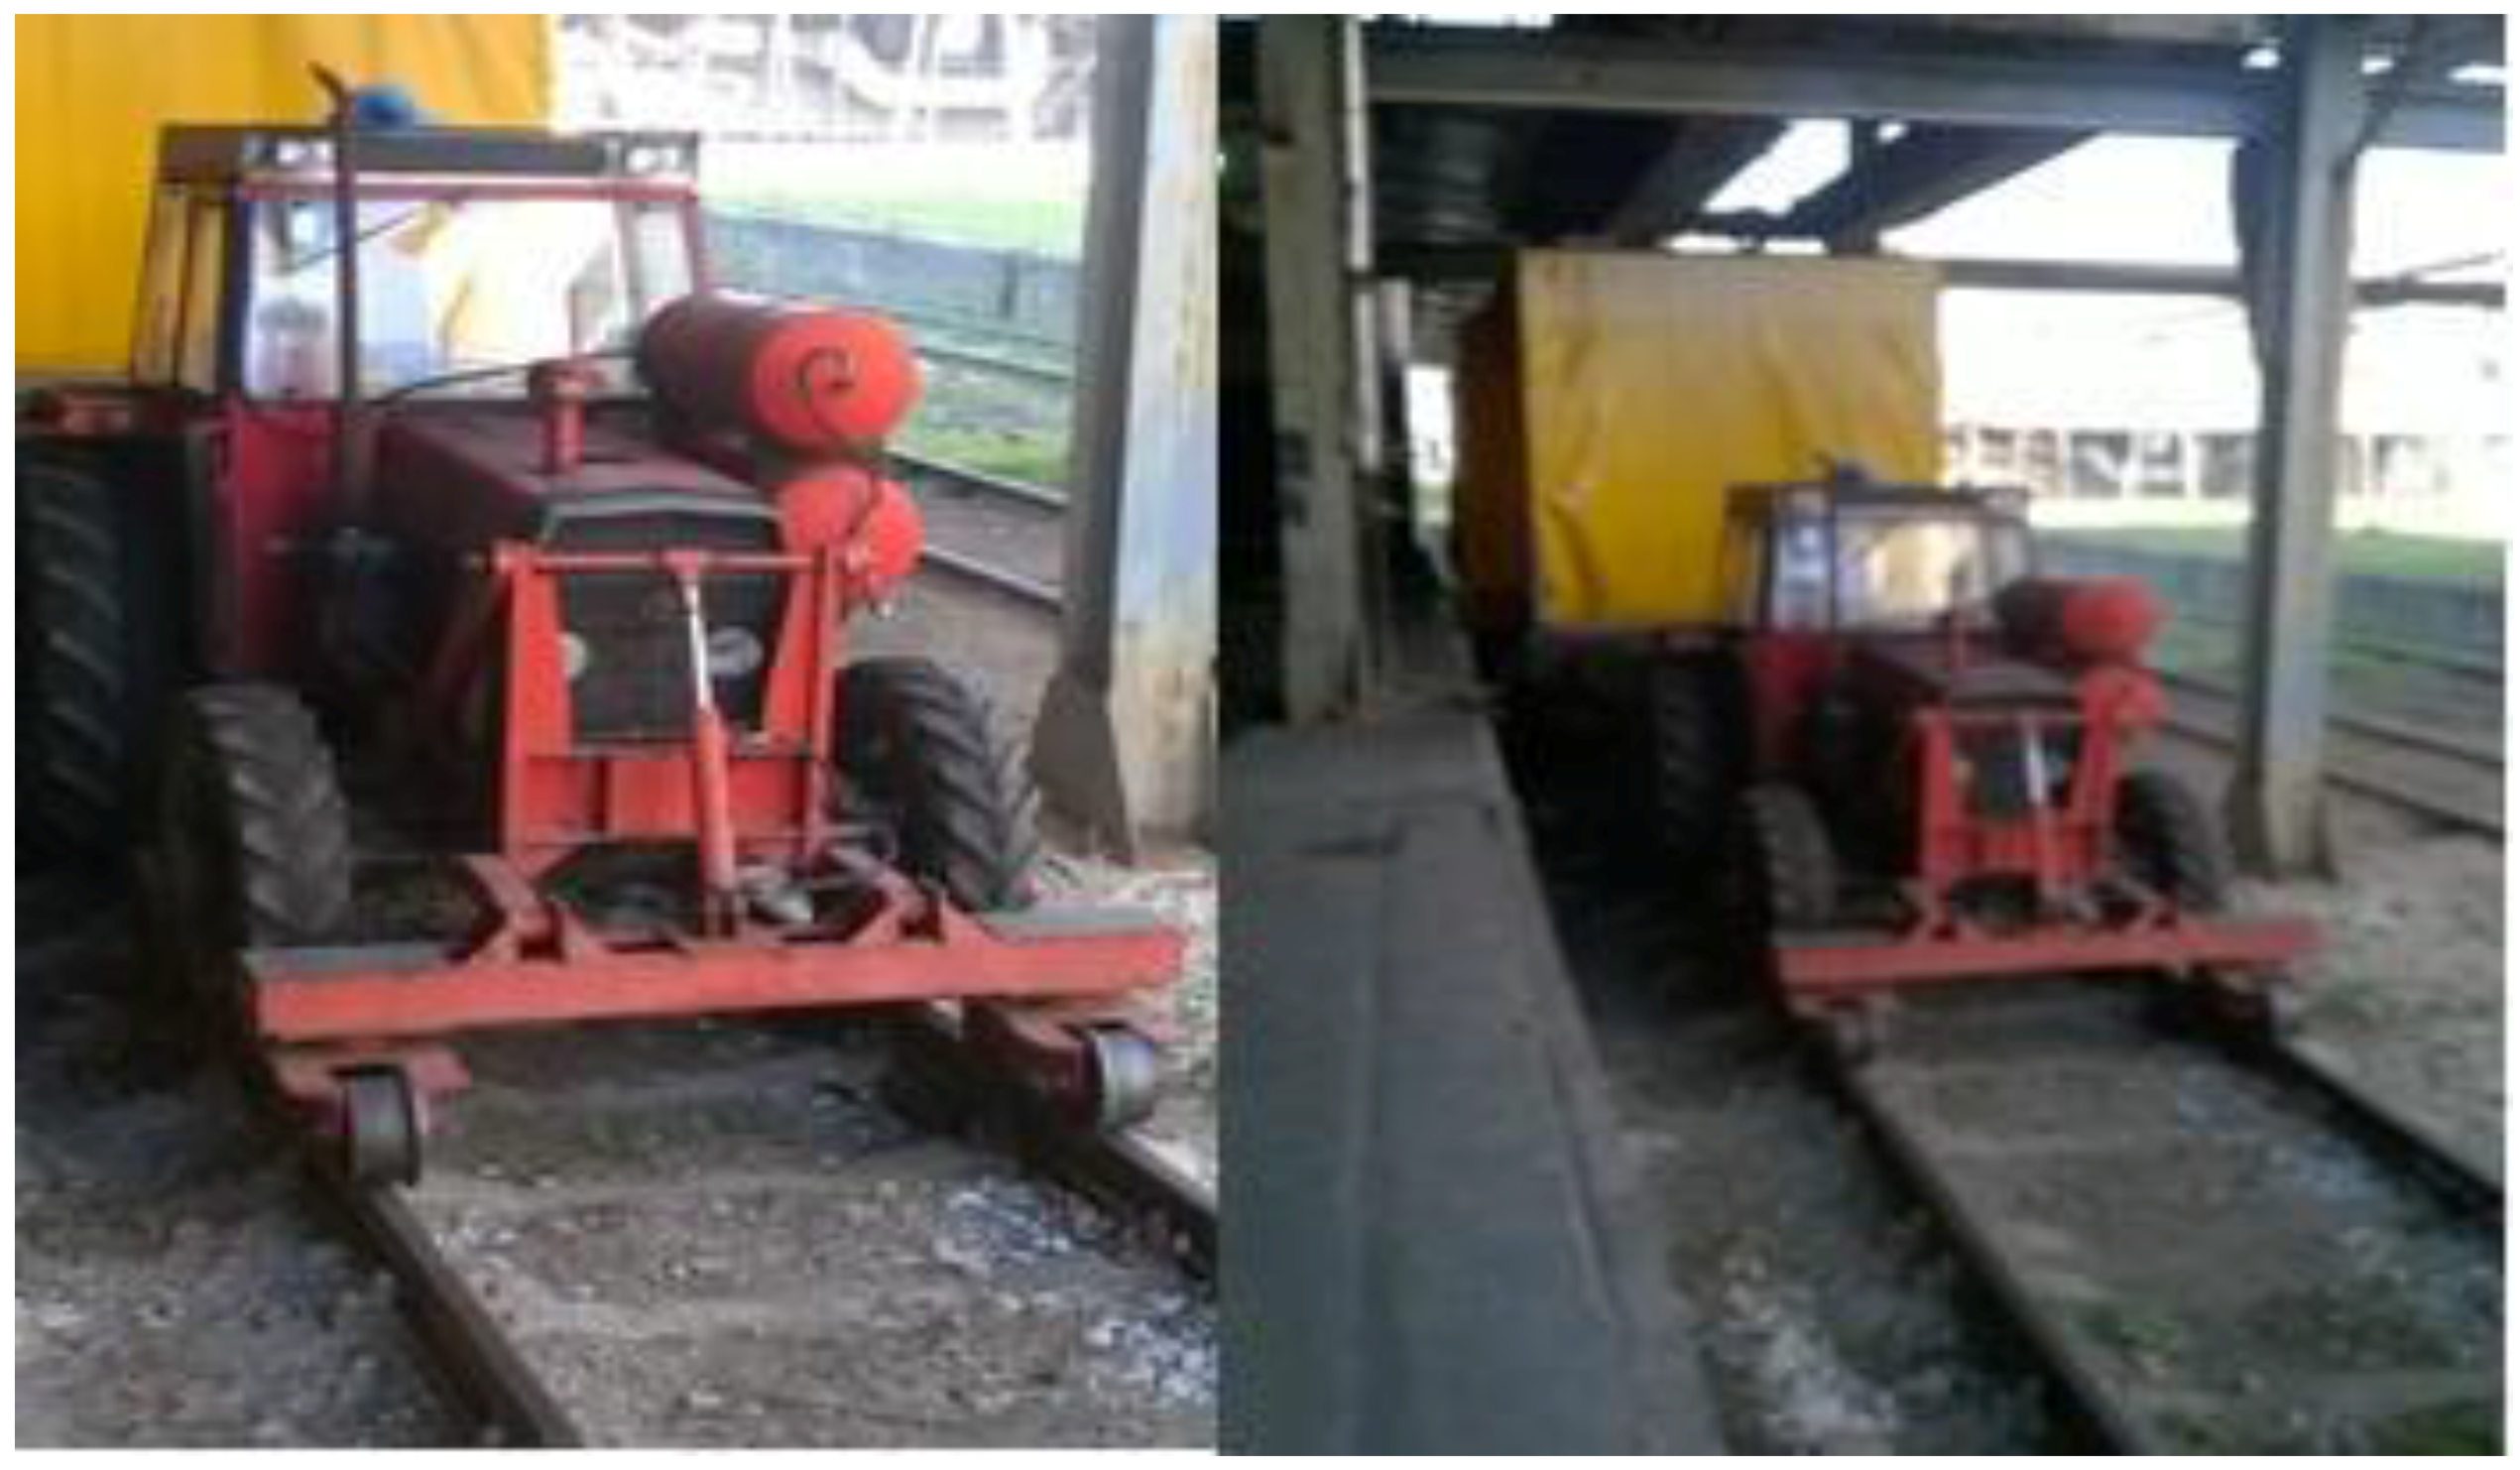
Currently, one small part of the internal transport is carried out in this way, for which the company uses one series S wagon (special open type flat wagon) which has been adapted to obtain a closed rail wagon. As a towing vehicle for this wagon, the company uses the loco tractor shown in Figure 3 which is the property of the company.
In order for the company to achieve the anticipated savings and to rationalize the movement of transport vehicles, it is necessary to purchase at least two second-hand wagons for the undisturbed running of the majority of the internal transport by rail network. To this end, a heterogeneous expert team was formed consisting of managers in the logistics subsystem of the company, two experts from the Ministry of Transport and Communication and long-time professors in the field of railway transport and logistics from Serbia and Bosnia and Herzegovina. The expert team, whose members were familiar with the situation in the company and its current needs and requirements, performed the first assessment of the criteria shown in Table 3 based on nine point scale.
To implement the RBWM algorithm, the experts determined the best (B) and the worst (W) criterion by consensus. On this basis, the experts determined the BO vectors (15) in which the advantage of B criterion over other criteria from the defined set was considered.
A B * = [ 2 2 2 2 2 2 3 2 3 3 2 2 3 3 6 5 6 5 5 6 5 1 1 1 1 1 1 1 5 4 5 5 4 4 5 6 7 6 7 7 6 6 7 8 8 8 7 8 7 8 9 9 9 8 9 8 ]
After defining the BO vector, the experts determined the OW vectors (18) in which the advantage of the remaining criteria over W criterion was defined from the defined set.
A B * = [ 8 8 8 8 8 7 8 7 7 6 7 7 7 6 5 4 5 5 4 4 5 8 9 9 9 9 9 8 6 6 6 5 5 6 6 3 3 3 2 2 3 3 3 2 3 2 2 2 3 1 1 1 1 1 1 1 ]
Evaluation of the criteria was carried out using the scale a B j e , a j W e { 1 , 9 } , where 1 indicates in significant domination, while 9 signifies exceptional domination. The expert comparisons through the BO and OW vectors are shown in Table 4.
Using Equations (1)–(6), the crisp expert evaluation shown in the BO and OW vectors were transformed into rough numbers (Table 5).
After transformation of the crisp values into RN, using Equations (16) and (19), the rough BO and OW expert matrices were transformed into aggregated RBO vectors (12)
A ¯ B = [ [ 2.02 ,   2.28 ] ; [ 2.3 ,   2.79 ] ; [ 5.17 ,   5.59 ] ; [ 1 ,   1 ] ; [ 4.29 ,   4.76 ] ; [ 6.17 ,   6.6 ] ; [ 7.3 ,   7.75 ] ; [ 8.3 ,   8.75 ] ]
and ROW vectors (20), Table 6.
A ¯ W = [ [ 7.7 ,   7.97 ] ; [ 6.46 ,   6.87 ] ; [ 4.29 ,   4.76 ] ; [ 8.47 ,   8.89 ] ; [ 5.46 ,   5.89 ] ; [ 2.46 ,   2.89 ] ; [ 2.17 ,   2.61 ] ; [ 1 ,   1 ] ]
Based on the RBO and ROW vectors, the optimal values of the rough weight coefficients of the criteria were calculated. Based on data from Table 6 and Equation (23), a nonlinearly constrained optimization problem was formed, which is represented by specific numbers.
min ξ s . t . { | w B L w 1 U 2.28 | ξ ; | w B L w 2 U 2.79 | ξ ; | w B L w 3 U 5.59 | ξ ; | w B L w 5 U 6.6 | ξ ; | w B L w 6 U 7.75 | ξ ; | w B L w 7 U 7.75 | ξ ; | w B L w 8 U 8.75 | ξ ; | w B U w 1 L 2.02 | ξ ; | w B U w 2 L 2.3 | ξ ; | w B U w 3 L 5.17 | ξ ; | w B U w 5 L 4.29 | ξ ; | w B U w 6 L 6.17 | ξ ; | w B U w 7 L 7.3 | ξ ; | w B U w 8 L 8.3 | ξ ; | w 1 L w W U 7.7 | ξ ; | w 2 L w W U 6.46 | ξ ; | w 3 L w W U 4.29 | ξ ; | w 4 L w W U 8.47 | ξ ; | w 5 L w W U 5.46 | ξ ; | w 6 L w W U 2.46 | ξ ; | w 7 L w W U 2.17 | ξ ; | w 1 U w W L 7.97 | ξ ; | w 2 U w W L 6.87 | ξ ; | w 3 U w W L 4.76 | ξ ; | w 4 U w W L 8.89 | ξ ; | w 5 U w W L 5.89 | ξ ; | w 6 U w W L 2.89 | ξ ; | w 7 U w W L 2.61 | ξ ; j = 1 8 w j L 1 ; j = 1 8 w j U 1 ; w j L w j U , j = 1 , 2 , , 8 w j L , w j U 0 , j = 1 , 2 , , 8
By solving the model presented, the optimal values of the rough weight coefficients of the criteria were obtained.
R N ( w 1 ) = [ 0.1708 ,   0.1780 ] , R N ( w 2 ) = [ 0.1864 ,   0.1900 ] , R N ( w 3 ) = [ 0.0942 ,   0.0987 ] , R N ( w 4 ) = [ 0.2358 ,   0.2391 ] , R N ( w 5 ) = [ 0.1191 ,   0.1202 ] , R N ( w 6 ) = [ 0.0632 ,   0.0811 ] , R N ( w 7 ) = [ 0.0527 ,   0.0554 ] , R N ( w 8 ) = [ 0.0431 ,   0.0473 ] .
By analyzing the rough weight coefficients of the optimality criteria, we see that the conditions j = 1 n w j L 1 and j = 1 n w j U 1 are satisfied, since j = 1 8 w j L = 0.9654 1 and j = 1 8 w j U = 1.0098 1 . In addition, the condition 0 w j L w j U 1 is also satisfied; that is, the general condition is satisfied that the values of the weight coefficients of the criteria are found in the interval w j [ 0 , 1 ] , ( j = 1 , 2 , , 8 ) .
By solving model Equation (23), the value of ξ * is obtained which is ξ * = 0.945412 . The value of ξ * is used to determine the consistency ratio (Equation (28)). Since we obtain the value of a ¯ B W that is a B W U based on the aggregated decisions of the experts, it is not possible in advance to define the consistency index ξ . Rezaei [50] defined the values of the consistency index ( ξ ) for crisp BWM. Since this is about RBWM, using Equation (27) for the value a B W U = 8.89 the value was defined for the CI ( max ξ ) = 5.1406 and the value CR = 0.183911 was obtained. Based on [50], the value obtained for the CR was considered satisfactory.
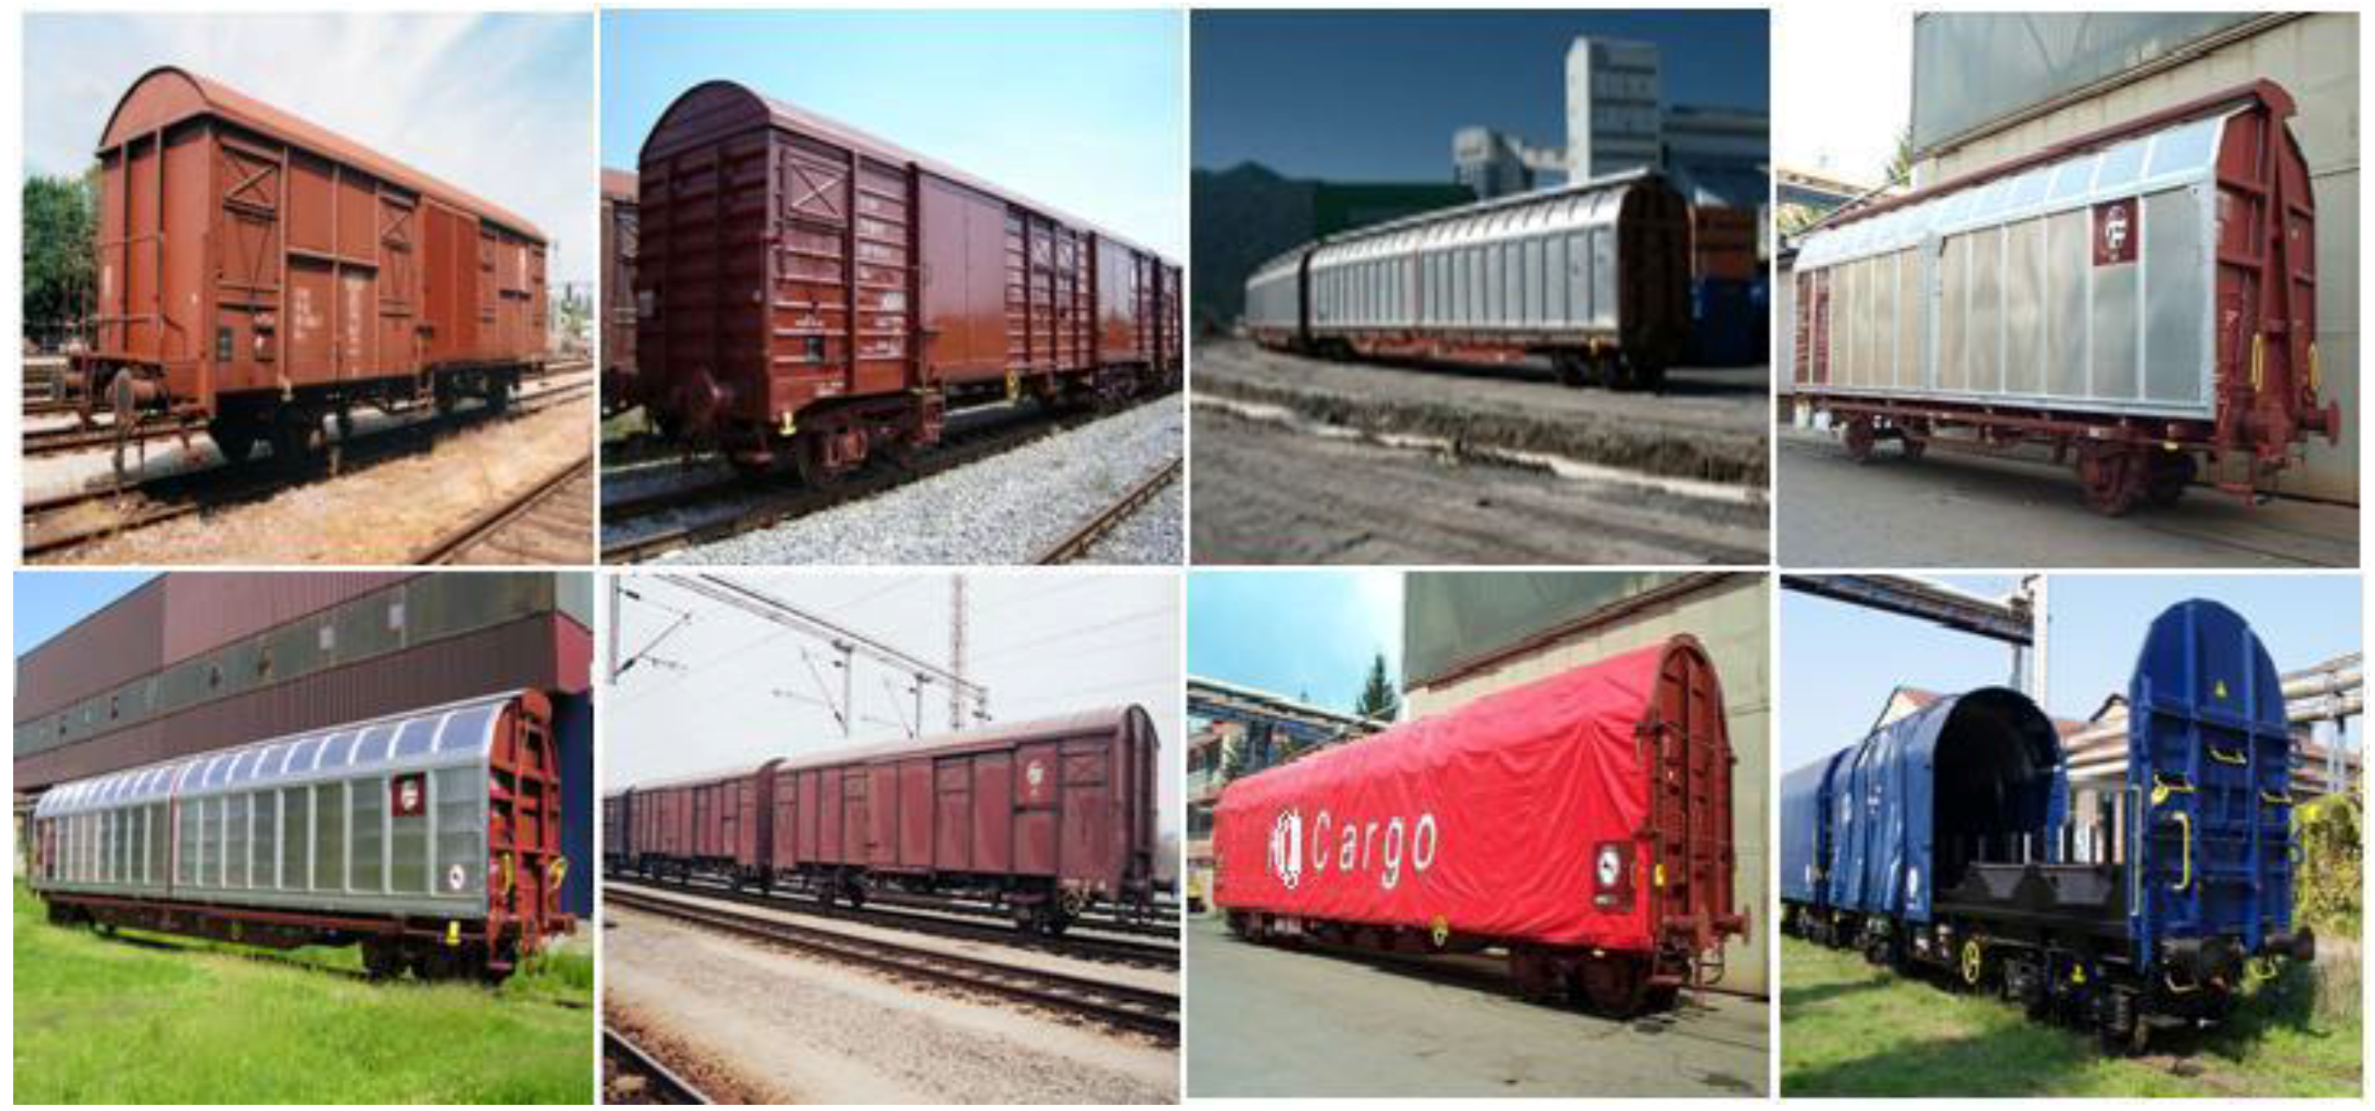
According to the weights obtained for the criteria, load capacity is the most important criterion for selecting a wagon, while the next most important are maintenance conditions and price of the wagon. Load capacity is an important factor in the field of rail transport, because by selecting suitable wagons from the aspect of capacity, costs are reduced and transport capacity is increased [57]. After obtaining the weight values of the criteria, the expert team carried out the evaluation of the alternatives (Figure 4) based on the defined linguistic scale (Table 2) in the second step of the Rough SAW method. Evaluation of the alternatives is shown in Table 7.
The Gbs-z is a two-axle closed wagon intended for the transport of different cargos that can be packaged or not. It is suitable for the transport of cargos subject to different atmospheric influences. Its capacity is 26 t. The Gas-z is a multi-purpose four-axle wagon designed for the transport of cargos that need to be protected against atmospheric influences. The important characteristic of this wagon is the limited capacity for manipulation in its interior only with a hand forklift. It is possible to adapt the doors to enable the use of other forklifts. Its load capacity is 57.5 t. The Habis is a four-axle closed wagon for the transport of cargos affected by different atmospheric influences. When the side sliding door opens, access to the loading area is gained at full height and up to half its length. This makes it possible to load goods mechanically more easily using forklifts. The load capacity is 50.7 t. The Hbis-z is a two-axle closed wagon suitable for the transport of cargos that are subject to different atmospheric influences. Similar to the previous wagon, access is gained to the loading area by means of a side sliding door. Its load capacity is 25 t. The Habbinss-z is a four-axle wagon with movable aluminum doors, two on each side, which makes it easier to manipulate the goods. It is used for transporting individual units and palletized goods that are subject to atmospheric influences. Its load capacity is 62 t. The Hrrs-z is a four-axle wagon obtained by connecting two wagons from the Gbs-z series. The wagon has two loading spaces with the same dimensions as the wagons in the Gbs-z series. It is built from an aluminum profile and it has two-part sliding side which are built in on each side and which make it possible for the doors to move freely along their guides on the wagon. It has the same function as the wagon from series G, but, because of its large volume, it is very suitable for the transport of bulky cargos. Its load capacity is 52 t. The wagon from series Rils-z is a four-axle flat wagon primarily intended for the transport of goods that must be protected against atmospheric influences. Its load capacity is 53 t. The wagon from the series Shimmns-z je is intended for transporting sheet metal plates that are loaded in a horizontal position and must be protected against atmospheric influences. It has built-in protective tarpaulin on wheeled carriers, by means of which the wagon is closed, sealing the tarpaulin on the front of the wagon. When the tarpaulin is opened, it releases two-thirds of the wagon-length for loading. Its load capacity is 68 t.
After evaluation of the alternatives by the expert team and converting the linguistic values into numerical ones, it was necessary to convert the individual matrices of each of the experts into a group matrix by applying Equations (1)–(6). An example of calculating the elements of the group matrix is presented in Table 8:
x ˜ 25 = { 3 , 7 , 3 , 5 , 5 , 1 }
L i m ¯ ( 1 ) = 1 , L i m ¯ ( 1 ) = 1 6 ( 3 + 7 + 3 + 5 + 5 + 1 ) = 4
L i m ¯ ( 3 ) = 1 3 ( 3 + 3 + 1 ) = 2.33 , L i m ¯ ( 3 ) = 1 5 ( 3 + 7 + 3 + 5 + 5 ) = 4.6
L i m ¯ ( 5 ) = 1 5 ( 3 + 3 + 5 + 5 + 1 ) = 3.4 , L i m ¯ ( 5 ) = 1 3 ( 7 + 5 + 5 ) = 5.67
L i m ¯ ( 7 ) = 1 6 ( 3 + 7 + 3 + 5 + 5 + 1 ) = 4 , L i m ¯ ( 7 ) = 7
R N ( x 25 1 ) = R N ( x 25 3 ) = [ 2.33 , 4.6 ] ; R N ( x 25 2 ) = [ 4 , 7 ] ; R N ( x 25 4 ) = R N ( x 25 5 ) = [ 3.4 , 5.67 ] ; R N ( x 25 6 ) = [ 1 , 4 ]
x 25 L = x 25 1 + x 25 2 + x 25 s + x 25 4 + x 25 5 + x 25 6 S = 2.33 + 4 + 2.33 + 3.4 + 3.4 + 1 6 = 2.74
x 25 U = x 25 1 + x 25 2 + x 25 s + x 25 4 + x 25 5 + x 25 6 S = 4.6 + 7 + 4.6 + 5.67 + 5.67 + 4 3 = 5.26
After carrying out normalization in the fourth step, using Equations (30)–(33), the normalized matrix shown in Table 9 was obtained, while the weighted normalized matrix was obtained using Equation (35). Normalization of the group matrix elements for benefit criteria was carried out in the following way:
r ˜ 25 = [ x i j L x i j + U , x i j U x i j + L ] = [ 2.74 8.51 , 5.26 6.78 ] r ˜ 25 = [ 0.32 , 0.78 ]
and for the cost criteria:
r ˜ 23 = [ x i j L x i j U , x i j U x i j L ] = [ 1.49 8.77 , 3.22 7.17 ] r ˜ 23 = [ 0.17 , 0.45 ]
After weighting the normalized matrix using Equation (35):
v 23 L = [ w 3 L × r 23 L , w 3 U × r 23 U ] = [ 0.17 × 0.094 , 0.45 × 0.099 ] v 23 L = [ 0 , 016 , 0.044 ]
the values were summed for all the alternative by rows and the final rank of the alternatives is obtained which is shown in Table 10. The ranking is carried out in descending order, whereby the highest value presents the best solution, and the lowest the worst. The table also shows the conversion of a rough number into a crisp number using the average values of the lower and upper limits of the rough number.
Alternative 8 represents the most acceptable solution according to the results obtained.

5. Sensitivity Analysis

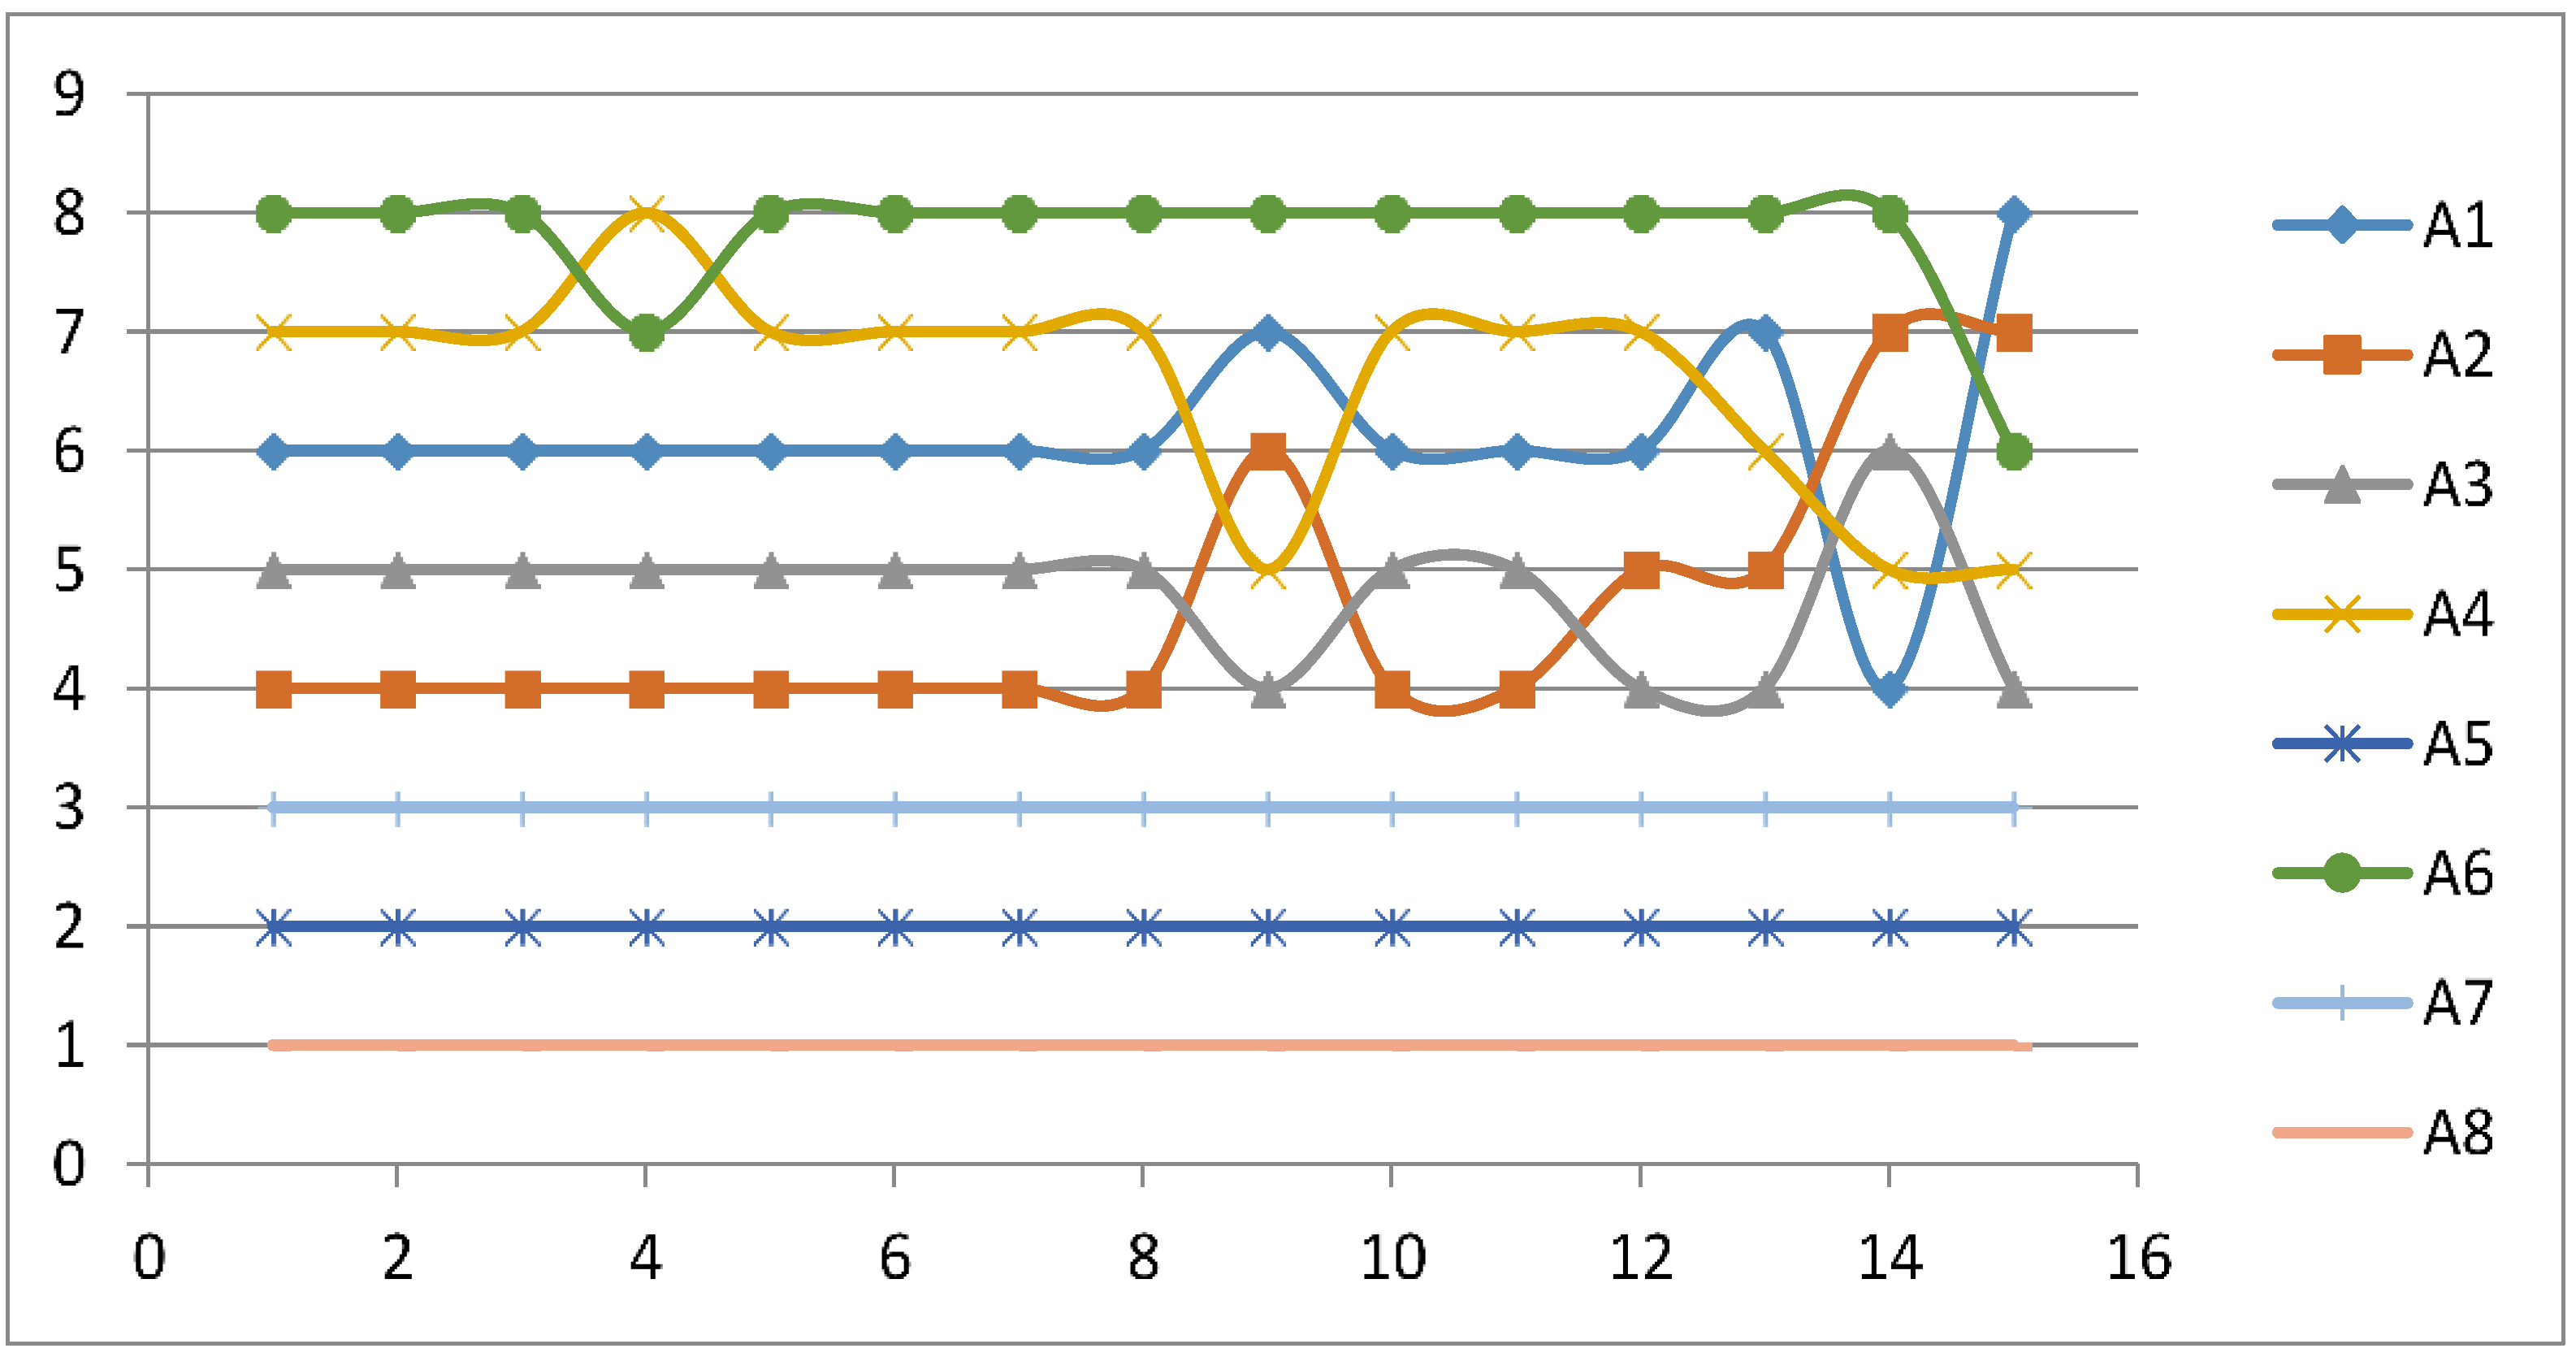
To determine the stability of the results, a sensitivity analysis was performed; the first part of which includes a change in the weights of the criteria through 15 different sets. In the first eight sets, the value of each criterion was increased by 14%, and those remaining were reduced by 2% of the value obtained by RBWM, respectively; in the ninth set, all of the criteria were equally important; in the 10th set, the first, second and fourth criteria (as the most important criteria) were reduced by 10%, while the values of other criteria remained unchanged; in the 11th set, the values of the three least influential criteria were increased by 25%; in the 12th set, the values of the two most influential criteria were reduced by 25%, and the values of the two least significant criteria were increased by 25%; in the 13th set, the values of the first four criteria were reduced by 30% each, and the values of the remaining four criteria were increased by 30% each; in the penultimate set of values, the two most important criteria were eliminated; and, in the final set, the values of the three most important criteria were eliminated, while the values of the remaining criteria remained unchanged. Figure 5 shows the ranks of alternatives across all sets.
Figure 5 shows the ranking of the alternatives through the sets that were formed and as can be seen alternative eight represents the best solution in all cases. The highest value of A8 is reached in the 11th and fourth sets, although there are completely different values for the weights of the criteria. In the first case, the advantage is given to the least important criteria by a whole quarter of their value, and in the second case the fourth most important criterion has an advantage of 14%. The lowest values for alternative A8 are in scenarios 14 and 15, since in these cases there is a reduction in the total number of criteria, based on which the decisions are made; that is, individual criteria are given a value of zero. In addition, Alternatives 5 and 7 do not change their original ranking and they are ranked in second and third places, respectively. The remaining alternatives generally retain their positions with certain changes. Alternative 2 is in fourth place in 10 sets, and in fifth and seventh position twice. Alternative 4 has a consistent ranking (its rank does not change) in 10 sets, where it is in seventh place, while in the fourth set it is in the last place. It is in fifth place twice, and sixth once. Alternative 6 is in last position for 12 sets, while it is once in seventh and once in sixth position.
The results show that assigning different weights to the criteria through the sets leads to a change in the ranks of individual alternatives, which confirms that the model is sensitive to changes in weight coefficients. However, we can conclude that the changes were not drastic, which also confirms the correlation of the ranks through the scenarios (Table 11).
The SCC values in Table 11 were obtained by comparing the initial ranks from the RBWM-SAW model (Table 10) with the ranks obtained through 15 sets. We see in Table 11 that there is a high correlation between the ranks, since, in 80% of the sets (13 sets), the SCC is greater than 0.845, while in three sets it is greater than 0.630. The average SCC value through all the scenarios is 0.837, which shows an extremely high correlation. Based on recommendations by Ghorabaee et al. [58], all SCC values over 0.8 show an extremely high correlation. Since 80% of the SCC values are significantly greater than 0.8, we can conclude that there is a very high correlation (closeness) of ranks and that the proposed ranking is confirmed and credible.
In addition to the stability shown by the first part of the sensitivity analysis, the proposed model was compared with other hybrid multi-criteria models. The hybrid models used for comparison of the results are shown in Table 12. The methods used to determine the weights of the criteria were the traditional AHP method [59], BWM [50] and the rough AHP method [49]. The following methods were used to rank the alternatives: TOPSIS [60], rough TOPSIS [44], SAW [61], MABAC [35] and rough MABAC [62]. The combinations of these methods and the ranking of alternatives are shown in Table 12.
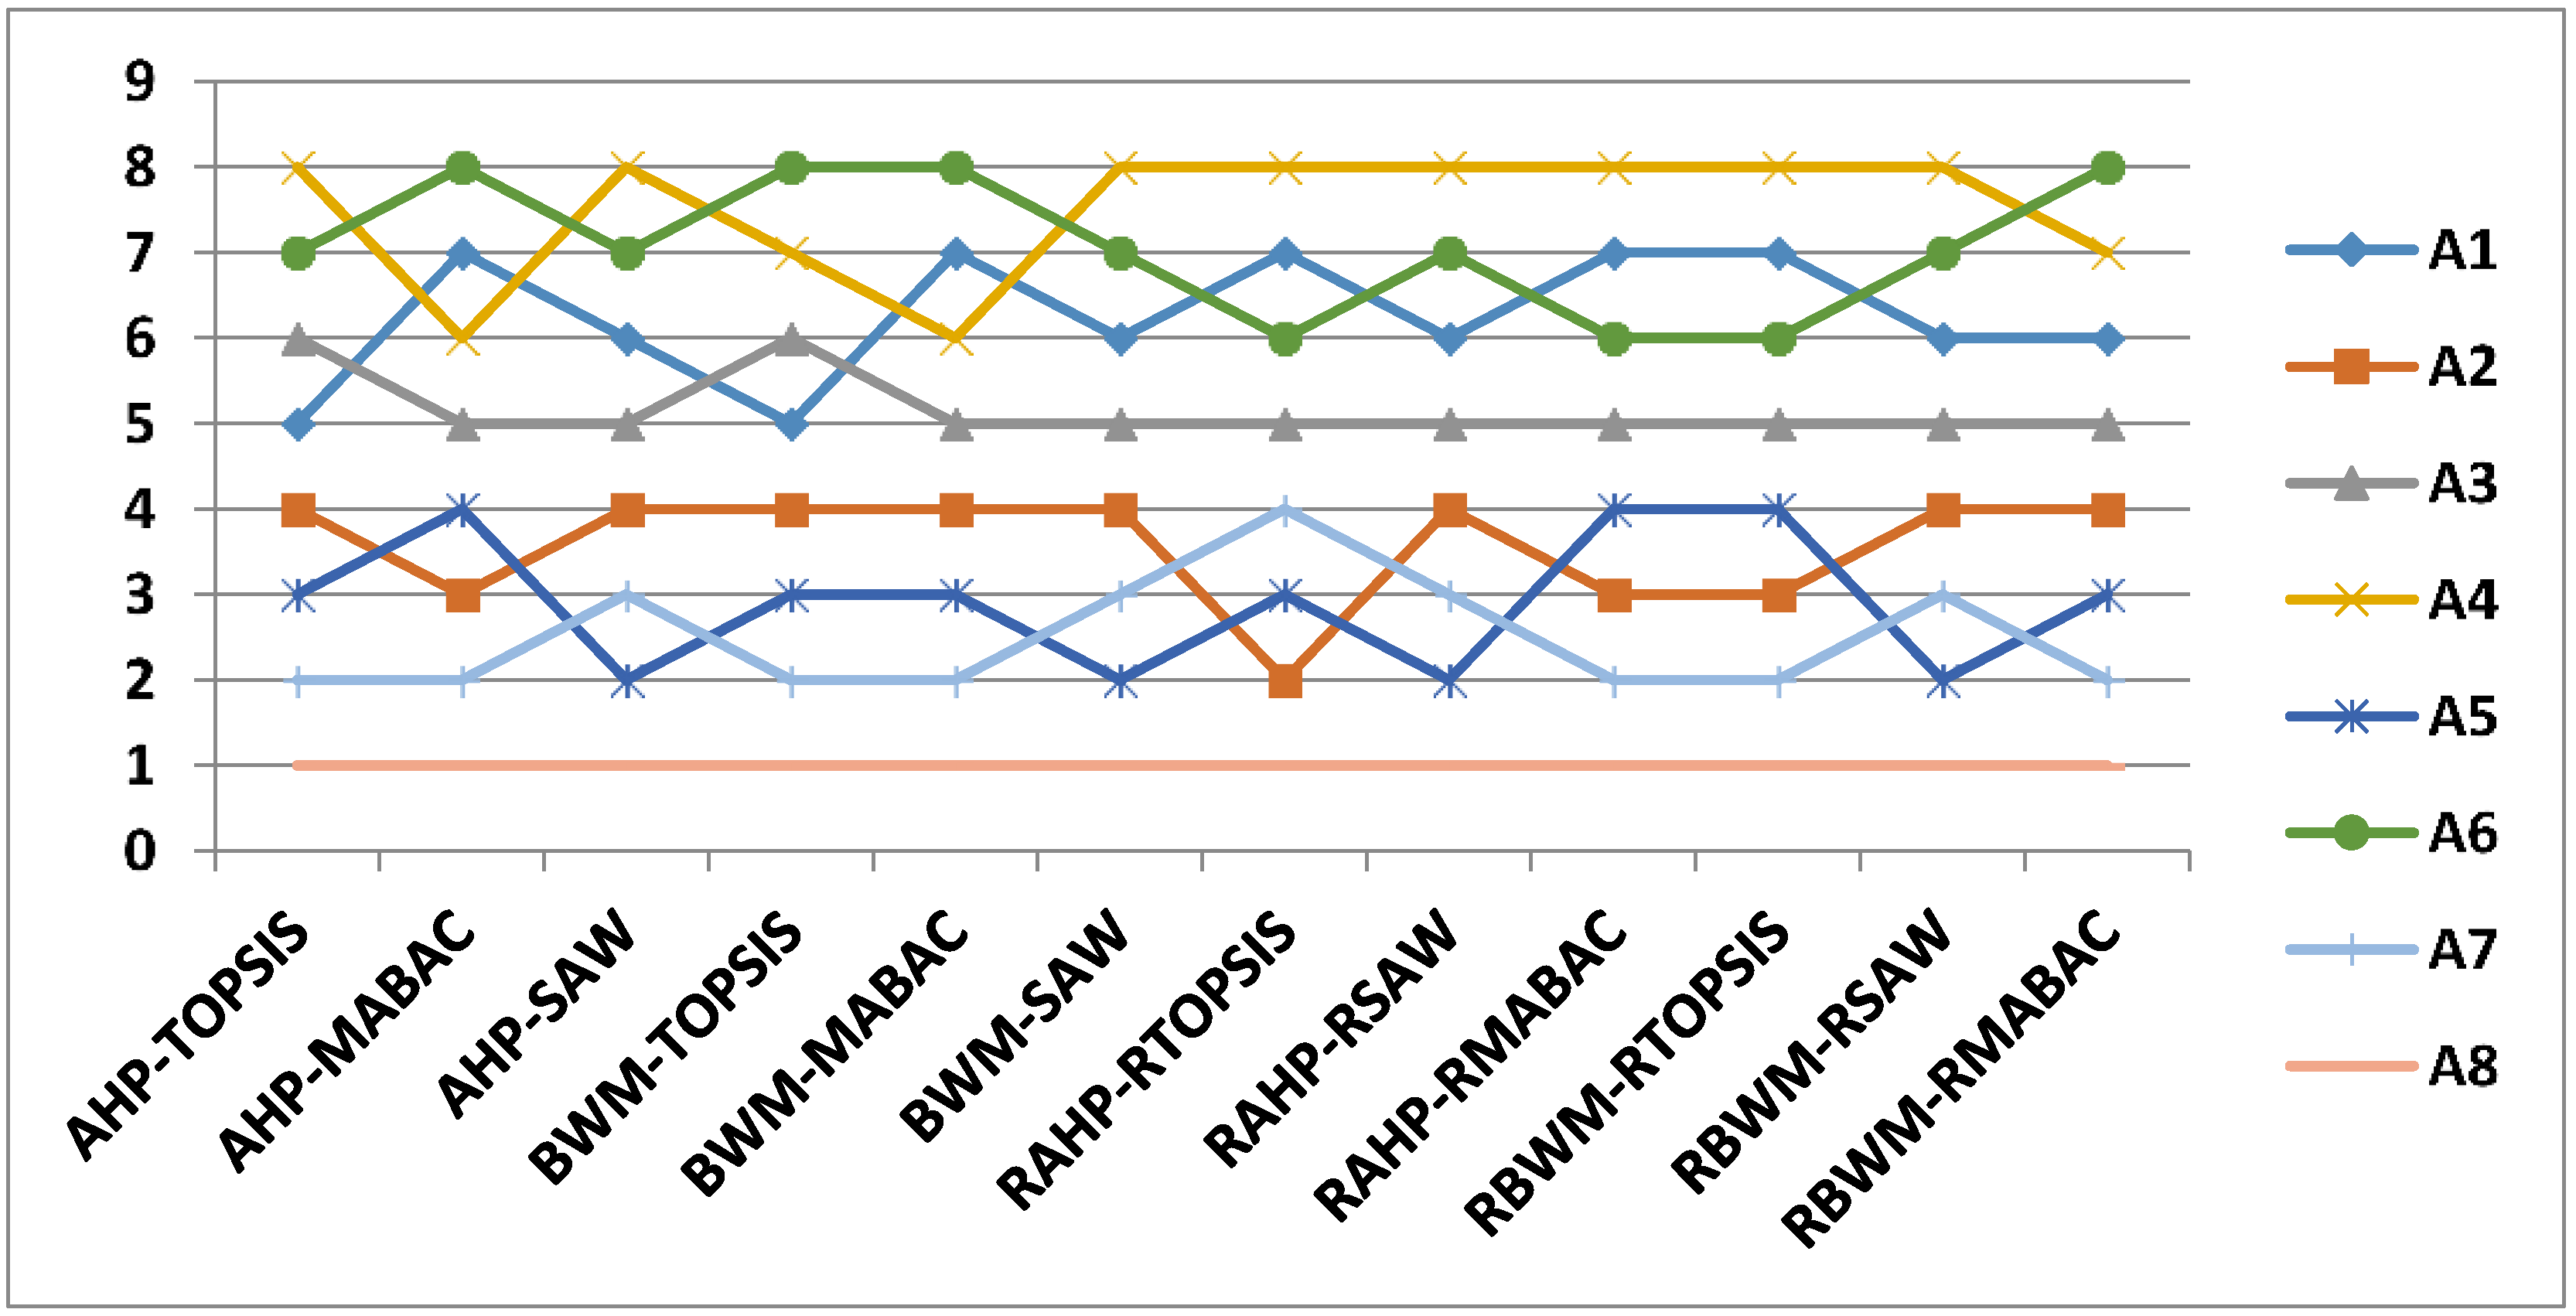
When comparing the results, a total of 12 hybrid models were formed, and the results for the models are shown in Table 12 and Figure 6. Figure 6 graphically presents the results of applying the 12 hybrid models.
Based on Figure 6, we notice that A8 represents the best solution in all 12 models, which is an adequate verification of the proposed model. Alternative 3 is in fifth position in 10 out of 12 combinations, and twice in sixth. The second position most often belongs to Alternative 7, which is the same number of times it appears in that position. When it comes to the ranking of the other alternatives there are some changes, but, in most cases, they retain their ranking obtained using the proposed new approach. The ranks obtained were compared with each other and with the initial ranking of the RBWM-SAW model. SCC was used to compare the ranks. The results obtained from comparing the 12 hybrid models are presented in Table 13.
In the next section, a comparison of the ranks from the 12 hybrid models with the initial ranks from Table 12 is carried out. The results are shown in Table 14.
We see in Table 13 and Table 14 that there is a high correlation between the ranks of the compared models. Since all the SCC values are significantly greater than 0.81, and the average values are 0.933 and 0.942, we can conclude that there is an extremely high correlation (closeness) between the proposed approach and the other models tested. Thus, we can conclude that the proposed RBWM-SAW model gives credible ranks.

6. Conclusions

The paper presents a new model for decision making, which is verified on the selection of wagons for carrying out the internal transport of a paper manufacturing company. It also presents a new scale for evaluating alternatives according to the criteria, depending on their type. In the case of qualitative assessment, which is a very common case in group decision making, from the outset, cost and benefit criteria are treated differently, which can be seen throughout the paper.
One of the contributions of this paper is the new RBWM-RSAW model that enables the objective aggregation of expert decisions with full consideration of their precision and subjectivity that prevail during group decision making. Another significant contribution of this paper is the development of the new RBWM and RSAW models, which contribute to the advancement of the literature that considers the theoretical and practical application of multi-criteria techniques. The proposed models allow the evaluation of alternatives despite the imprecision and lack of quantitative information in the decision-making process. The third contribution of the paper is to improve the methodology for evaluating railway wagons through a new approach for dealing with imprecision.
By using this hybrid model, it is possible to solve the problems of multi-criteria decision making in a simple way and make decisions that have a significant impact on achieving business efficiency, as is the case in this paper. By applying rough numbers in combination with these methods, imprecision in group decision making is taken into account and more objective results are obtained than with crisp approaches. It is very important to mention that the ranks of the alternatives obtained using the rough BWM and rough SAW were also confirmed through the application of the traditional SAW method. When it comes to determining the weight coefficients of the evaluation criteria, the results of the rough BWM were compared with the results given by the AHP, BWM and rough AHP algorithms and they were used to further check the stability of the initial solution. Analysis of the results showed that the ranks of the alternatives for the rough BWM-SAW algorithm fully correlated with the ranks obtained for the other methods.
Further research connected with this study concerns a post-analysis of the internal transport in the given company in order to verify the savings that arise from the proposed method of carrying out the internal transport. In terms of the area of multi-criteria decision making, further research directions relate to the application of rough numbers in combination with other methods and the attempt to develop new methods that would further enrich this widely applied field.

Author Contributions

Each author has participated and contributed sufficiently to take public responsibility for appropriate portions of the content.

Conflicts of Interest

The authors declare no conflict of interest.

References

  1. Koskinen, P.; Hilmola, O.P. Supply chain challenges of North-European paper industry. Ind. Manag. Data Syst. 2008, 108, 208–227. [Google Scholar] [CrossRef]
  2. Pereira, M.; Adelaide, M.; Resgate, L.; Telhada, J. Multicriteria Methodology to Mode of Transport Choosing—The Portuguese Case. In Proceedings of the XI Congreso Galego de Estatística e Investigación de Operacións, A Coruña, Galicia, Spain, 24–26 October 2013; pp. 1–15. [Google Scholar]
  3. Vashist, J.K.; Dey, A.K. Selection Criteria for a Mode of Surface Transport: An Analytic Hierarchy Process Approach. Amity Glob. Bus. Rev. 2016, 11, 86–95. [Google Scholar]
  4. Bai, C.; Fahimnia, B.; Sarkis, J. Sustainable transport fleet appraisal using a hybrid multi-objective decision making approach. Ann. Oper. Res. 2017, 250, 309–340. [Google Scholar] [CrossRef]
  5. Barbosa, S.B.; Ferreira, M.G.G.; Nickel, E.M.; Cruz, J.A.; Forcellini, F.A.; Garcia, J.; de Andrade, J.B.S.O. Multi-criteria analysis model to evaluate transport systems: An application in Florianópolis, Brazil. Transp. Res. Part A Policy Pract. 2017, 96, 1–13. [Google Scholar] [CrossRef]
  6. Tsamboulas, D.A. A tool for prioritizing multinational transport infrastructure investments. Transp. Policy 2007, 14, 11–26. [Google Scholar] [CrossRef]
  7. Keshavarz Ghorabaee, M.; Amiri, M.; Kazimieras Zavadskas, E.; Antuchevičienė, J. Assessment of third-party logistics providers using a CRITIC-WASPAS approach with interval type-2 fuzzy sets. Transport 2017, 32, 66–78. [Google Scholar] [CrossRef]
  8. Yazdani, M.; Zarate, P.; Coulibaly, A.; Zavadskas, E.K. A group decision making support system in logistics and supply chain management. Expert Syst. Appl. 2017, 88, 376–392. [Google Scholar] [CrossRef]
  9. Stević, Ž.; Tanackov, I.; Vasiljević, M.; Vesković, S. Evaluation in logistics using combined AHP and EDAS method. In Proceedings of the XLIII International Symposium on Operational Research, Belgrade, Serbia, 20–23 September 2016; pp. 309–313. [Google Scholar]
  10. Mardani, A.; Zavadskas, E.K.; Khalifah, Z.; Jusoh, A.; Nor, K.M. Multiple criteria decision-making techniques in transportation systems: A systematic review of the state of the art literature. Transport 2016, 31, 359–385. [Google Scholar] [CrossRef]
  11. Turskis, Z.; Zavadskas, E.K. A new fuzzy additive ratio assessment method (ARAS-F). Case study: The analysis of fuzzy multiple criteria in order to select the logistic centers location. Transport 2010, 25, 423–432. [Google Scholar] [CrossRef]
  12. Stević, Ž.; Vesković, S.; Vasiljević, M.; Tepić, G. The selection of the logistics center location using AHP method. In Proceedings of the 2nd Logistics International Conference, Belgrade, Serbia, 27–29 May 2015; pp. 86–91. [Google Scholar]
  13. Zhang, Y.; Zhang, Y.; Li, Y.; Liu, S.; Yang, J. A Study of Rural Logistics Center Location Based on Intuitionistic Fuzzy TOPSIS. Math. Probl. Eng. 2017, 2017, 2323057. [Google Scholar] [CrossRef]
  14. Stević, Ž.; Tanackov, I.; Vasiljević, M.; Novarlić, B.; Stojić, G. An integrated fuzzy AHP and TOPSIS model for supplier evaluation. Serb. J. Manag. 2016, 11, 15–27. [Google Scholar] [CrossRef]
  15. Tamošaitienė, J.; Zavadskas, E.K.; Šileikaitė, I.; Turskis, Z. A novel hybrid MCDM approach for complicated supply chain management problems in construction. Procedia Eng. 2017, 172, 1137–1145. [Google Scholar] [CrossRef]
  16. Pohekar, S.D.; Ramachandran, M. Application of multi-criteria decision making to sustainable energy planning—A review. Renew. Sustain. Energy Rev. 2004, 8, 365–381. [Google Scholar] [CrossRef]
  17. Carlsson, C.; Fullér, R. Fuzzy multiple criteria decision making: Recent developments. Fuzzy Sets Syst. 1996, 78, 139–153. [Google Scholar] [CrossRef]
  18. Zavadskas, E.K.; Turskis, Z.; Dejus, T.; Viteikiene, M. Sensitivity analysis of a simple additive weight method. Int. J. Manag. Decis. Mak. 2007, 8, 555–574. [Google Scholar] [CrossRef]
  19. Huang, Y.S.; Chang, W.C.; Li, W.H.; Lin, Z.L. Aggregation of utility-based individual preferences for group decision-making. Eur. J. Oper. Res. 2013, 229, 462–469. [Google Scholar] [CrossRef]
  20. Shameli, S.A.; Shajari, M.; Hassanabadi, M.; Jabbarifar, M.; Dagenais, M. Fuzzy-Multi-Criteria Decision-Making for Information Security Risk Assessment. Open Cybern. Syst. J. 2012, 6, 26–37. [Google Scholar] [CrossRef]
  21. Safavian, S.T.S.; Fataei, E.; Ebadi, T.; Mohamadian, A. Site Selection of Sarein’s Municipal Solid Waste Landfill Using the GIS Technique and SAW Method. Int. J. Environ. Sci. Dev. 2015, 6, 934. [Google Scholar] [CrossRef]
  22. Mokhtari, E.; Khamehchian, M.; Montazer, G.; Nikudel, M. Landfill Site Selection Using Simple Additive Weighting (SAW) Method and Artificial Neural Network Method; A Case Study from Lorestan Province, Iran. Int. J. Geogr. Geol. 2016, 5, 209–223. [Google Scholar] [CrossRef]
  23. Pamučar, D.S.; Božanić, D.; Ranđelović, A. Multi-criteria decision making: An example of sensitivity analysis. Serb. J. Manag. 2017, 12, 1–27. [Google Scholar] [CrossRef]
  24. Deni, W.; Sudana, O.; Sasmita, A. Analysis and Implementation Fuzzy Multi-Attribute Decision Making SAW Method for Selection of High Achieving Students in Faculty Level. Int. J. Comput Sci. 2013, 10, 674–680. [Google Scholar]
  25. Gupta, S.; Gupta, A. A Fuzzy Multi Criteria Decision Making Approach for Vendor Evaluation in a Supply Chain. Intersci. Manag. Rev. 2012, 2, 10–16. [Google Scholar]
  26. Kumar, M.; Jayaswal, P.; Kushwah, K. Exploring Fuzzy SAW Method for Maintenance Strategy Selection Problem of Material Handling Equipment. Int. J. Curr. Eng. Technol. 2013, 3, 600–605. [Google Scholar]
  27. Đorović, B.; Pamučar, D. Fuzzy mathematical model for design and evaluation of the logistic organisational structure. Econ. Comput. Econ. Cybern. Stud. Res. 2012, 36, 139–156. [Google Scholar]
  28. Afshari, A.; Mojahed, M.; Yusuff, R.M. Simple Additive Weighting approach to Personnel Selection problem. Int. J. Innov. Manag. Technol. 2010, 1, 511–515. [Google Scholar]
  29. Azizollah, J.; Mehdi, J.; Abalfazl, Z.; Farzad, Z. Using Fuzzy Delphi Method in Maintenance Strategy Selection Problem. J. Uncertain Syst. 2008, 2, 289–298. [Google Scholar]
  30. Chen, T.Y. Comparative analysis of SAW and TOPSIS based on interval-valued fuzzy sets: Discussions on score functions and weight constraints. Expert Syst. Appl. 2012, 39, 1848–1861. [Google Scholar] [CrossRef]
  31. Bureika, G. Study of traction rolling-stock using in lithuanian sector of railway line “Rail Baltica”. Transp. Probl. 2012, 7, 49–56. [Google Scholar]
  32. Jakimavičius, M.; Burinskiene, M. Assessment of Vilnius city development scenarios based on transport system modelling and multicriteria analysis. J. Civ. Eng. Manag. 2009, 15, 361–368. [Google Scholar] [CrossRef]
  33. Chou, S.Y.; Chang, Y.H.; Shen, C.Y. A fuzzy simple additive weighting system under group decision-making for facility location selection with objective/subjective attributes. Eur. J. Oper. Res. 2008, 189, 132–145. [Google Scholar] [CrossRef]
  34. Wang, Y.J. A fuzzy multi-criteria decision-making model based on simpleadditive weighting method and relative preference relation. Appl. Soft Comput. 2015, 30, 412–420. [Google Scholar] [CrossRef]
  35. Pamučar, D.; Ćirović, G. The selection of transport and handling resources in logistics centers using Multi-Attributive Border Approximation area Comparison (MABAC). Expert Syst. Appl. 2015, 42, 3016–3028. [Google Scholar] [CrossRef]
  36. Manokaran, E.; Senthilvel, S.; Subhashini, S.; Muruganandham, R.; Ravichandran, K. Mathematical Model for Performance Rating in Software industry—A study using Artificial Neural Network. Int. J. Sci. Eng. Res. 2012, 3, 4–7. [Google Scholar]
  37. Zadeh, L.A. Fuzzy sets. Inf. Control 1965, 8, 338–353. [Google Scholar] [CrossRef]
  38. Pawlak, Z. Rough Sets: Theoretical Aspects of Reasoning about Data; Springer: Berlin, Germany, 1991. [Google Scholar]
  39. Pawlak, Z. Anatomy of conflicts. Bull. Eur. Assoc. Theor. Comput. Sci. 1993, 50, 234–247. [Google Scholar]
  40. Kuang, H.; Kilgour, D.M.; Hipel, K.W. Grey-based PROMETHEE II with application to evaluation of source water protection strategies. Inf. Sci. 2015, 294, 376–389. [Google Scholar] [CrossRef]
  41. Arce, M.E.; Saavedra, A.; Míguez, J.L.; Granada, E. The use of grey-based methods in multi-criteria decision analysis for the evaluation of sustainable energy systems. Rev. Renew. Sustain. Energy Rev. 2015, 47, 924–932. [Google Scholar] [CrossRef]
  42. Kang, B.; Wei, D.; Li, Y.; Deng, Y. A Method of Converting Z-number to Classical Fuzzy Number. J. Inf. Comput. Sci. 2012, 9, 703–709. [Google Scholar]
  43. Azadeh, A.; Kokabi, R. Z-number DEA: A new possibilistic DEA in the context of Z-numbers. Adv. Eng. Inf. 2016, 30, 604–617. [Google Scholar] [CrossRef]
  44. Song, W.; Ming, X.; Wu, Z.; Zhu, B. A rough TOPSIS approach for failure mode and effects analysis in uncertain environments. Q. Reliab. Eng. Int. 2014, 30, 473–486. [Google Scholar] [CrossRef]
  45. Pamučar, D.; Mihajlović, M.; Obradović, R.; Atanasković, P. Novel approach to group multi-criteria decision making based on interval rough numbers: Hybrid DEMATEL-ANP-MAIRCA model. Expert Syst. Appl. 2017, 88, 58–80. [Google Scholar] [CrossRef]
  46. Pamučar, D.; Gigović, L.; Bajić, Z.; Janošević, M. Location selection for wind farms using GIS multi-criteria hybrid model: An approach based on fuzzy and rough numbers. Sustainability 2017, 9, 1315. [Google Scholar] [CrossRef]
  47. Pamučar, D.; Petrović, I.; Ćirović, G. Modification of the Best-Worst and MABAC methods: A novel approach based on interval-valued fuzzy-rough numbers. Expert Syst. Appl. 2018, 91, 89–106. [Google Scholar] [CrossRef]
  48. Zhu, G.N.; Hu, J.; Qi, J.; Gu, C.C.; Peng, J.H. An integrated AHP and VIKOR for design concept evaluation based on rough number. Adv. Eng. Inf. 2015, 29, 408–418. [Google Scholar] [CrossRef]
  49. Zhai, L.Y.; Khoo, L.P.; Zhong, Z.W. A rough set based QFD approach to the management of imprecise design information in product development. Adv. Eng. Inf. 2009, 23, 222–228. [Google Scholar] [CrossRef]
  50. Rezaei, J. Best-worst multi-criteria decision-making method. Omega 2015, 53, 49–57. [Google Scholar] [CrossRef]
  51. Rezaei, J. Best-worst multi-criteria decision-making method: Some properties and a linear model. Omega 2016, 64, 126–130. [Google Scholar] [CrossRef]
  52. Rezaei, J.; Wang, J.; Tavasszy, L. Linking supplier development to supplier segmentation using best worst method. Expert Syst. Appl. 2015, 42, 9152–9164. [Google Scholar] [CrossRef]
  53. Gupta, H. Evaluating service quality of airline industry using hybrid best worst method and VIKOR. J. Air Transp. Manag. 2017. [Google Scholar] [CrossRef]
  54. Wan Ahmad, W.N.K.; Rezaei, J.; Sadaghiani, S.; Tavasszy, L.A. Evaluation of the external forces affecting the sustainability of oil and gas supply chain using Best Worst Method. J. Clean. Prod. 2017, 153, 242–252. [Google Scholar] [CrossRef]
  55. Guo, S.; Zhao, H. Fuzzy best-worst multi-criteria decision-making method and its applications. Knowl.-Based Syst. 2017, 121, 23–31. [Google Scholar] [CrossRef]
  56. Hafezalkotob, A.; Hafezalkotob, A. A novel approach for combination of individual and group decisions. Appl. Soft Comput. 2017, 59, 316–325. [Google Scholar] [CrossRef]
  57. Bartuška, L.; Černá, L.; Daniš, J. Costs comparison and the possibilities of increasing the transport capacity with a selection of the appropriate railway wagons. NAŠE MORE Znanstveno-Stručni Časopis za More i Pomorstvo 2016, 63, 93–97. [Google Scholar]
  58. Keshavarz Ghorabaee, M.; Zavadskas, E.K.; Turskis, Z.; Antucheviciene, J. A new combinative distance-based assessment (CODAS) method for multi-criteria decision-making. Econ. Comput. Econ. Cybern. Stud. Res. 2016, 50, 25–44. [Google Scholar]
  59. Saaty, T.L. The Analytic Hierarchy Process; Mc Graw-Hill: NewYork, NY, USA, 1980. [Google Scholar]
  60. Hwang, C.L.; Yoon, K. Multiple Attributes Decision Making Methods and Applications; Springer: Berlin, Germany, 1981. [Google Scholar]
  61. MacCrimmon, K.R. Decision Making among Multiple-Attribute Alternatives: A Survey and Consolidated Approach; RAND Co.: Santa Monica, CA, USA, 1968. [Google Scholar]
  62. Roy, J.; Chatterjee, K.; Bandhopadhyay, A.; Kar, S. Evaluation and selection of Medical Tourism sites: A rough AHP based MABAC approach. arXiv, 2016; arXiv:1606.08962. [Google Scholar]
Figure 1. Elementary concept of rough set theory.
Symmetry 09 00264 g001
Figure 2. Industrial track within the company.
Symmetry 09 00264 g002
Figure 3. Loco tractor for carrying out internal transport.
Symmetry 09 00264 g003
Figure 4. Different types of wagon representing the alternatives.
Symmetry 09 00264 g004
Figure 5. Ranking of the alternatives through the scenarios.
Symmetry 09 00264 g005
Figure 6. Ranking of the alternatives according to different MCDM methods.
Symmetry 09 00264 g006
Table 1. Values of the consistency index (CI).
a B W 123456789
CI ( max ξ )0.000.441.001.632.303.003.734.475.23
Table 2. Linguistic scale for evaluating the alternatives depending on the type of criteria.
Linguistic ScaleFor Criteria Max Type (Benefit Criteria)For Criteria Min Type (Cost Criteria)
Very Poor (VP)19
Poor (P)37
Medium (M)55
Good (G)73
Very Good (VG)91
Table 3. The criteria defined for the selection of the wagon.
CriteriaCharacteristics and Meaning of the Criteria
C1Price of the wagonThe price of the second-hand wagon is the value expressed in monetary units
C2Maintenance conditionsThe maintenance conditions include the ease of maintaining the wagon, the possibility of personal maintenance, and the cost of maintaining the wagon, etc.
C3Exploitation timeSince the wagons are second-hand, their age and the time they spent in use can play a role in their selection.
C4Load capacityLoad capacity (bearing capacity) is a value expressed in tons i.e., the total mass that it is possible to place inside the wagon.
C5Manipulative convenienceManipulative convenience covers the ease of maneuverability by means of loading vehicles, in this case forklifts, and the possibility or impossibility of a forklift completely entering a wagon.
C6Time of last revisionThis is the time passed since the last regular inspection of the wagon.
C7State of the bandages and flanges of the wheelsThis is the quality and amount of wear and tear on the bandages and flanges of the wheels.
C8Ecological factorThe ecological factor includes the influence of the wagon on the environment, for example, noise produced by a wagon that can affect the psycho-physical condition of employees.
Table 4. BO and OW vectors of the expert assessments.
BOOW
CriteriaE1E2E3E4E5E6E7E1E2E3E4E5E6E7
C122222238888788
C223322337767776
C365655655455445
C411111118999998
C554554456665566
C667677663332233
C778887873232223
C889998981111111
Table 5. Rough BO and OW vectors of the expert assessments.
BO
CriteriaE1E2E3E4E5E6E7
C1[2, 2.1][2, 2.2][2, 2.2][2, 2.2][2, 2.2][2, 2.2][2.2, 3]
C2[2, 2.6][2.6, 3][2.5, 3][2, 2.5][2, 2.5][2.5, 3][2.4, 3]
C3[5.4, 6][5, 5.3][5.4, 6][5, 5.3][5, 5.3][5.3, 6][5, 5.2]
C4[1, 1][1, 1][1, 1][1, 1][1, 1][1, 1][1, 1]
C5[4.6, 5][4, 4.5][4.6, 5][4.4, 5][4, 4.4][4, 4.4][4.4, 5]
C6[6, 6.4][6.5, 7][6, 6.4][6.4, 7][6.3, 7][6, 6.2][6, 6.2]
C7[7, 7.6][7.6, 8][7.5, 8][7.5, 8][7, 7.4][7.5, 8][7, 7.3]
C8[8, 8.6][8.6, 9][8.5, 9][8.5, 9][8, 8.4][8.5, 9][8, 8.3]
OW
CriteriaE1E2E3E4E5E6E7
C1[7.9, 8][7.8, 8][7.8, 8][7.8, 8][7, 7.8][7.9, 8][7.7, 8]
C2[6.7, 7][6.7, 7][6, 6.6][6.7, 7][6.6, 7][6.5, 7][6, 6.5]
C3[4.6, 5][4, 4.5][4.6, 5][4.4, 5][4, 4.4][4, 4.4][4.4, 5]
C4[8, 8.7][8.8, 9][8.7, 9][8.6, 9][8.6, 9][8.5, 9][8, 8.5]
C5[5.7, 6][5.7, 6][5.6, 6][5, 5.6][5, 5.7][5.7, 6][5.5, 6]
C6[2.7, 3][2.7, 3][2.6, 3][2, 2.6][2, 2.7][2.7, 3][2.5, 3]
C7[2.4, 3][2, 2.3][2.4, 3][2, 2.3][2, 2.3][2, 2.3][2.3, 3]
C8[1, 1][1, 1][1, 1][1, 1][1, 1][1, 1][1, 1]
Table 6. Aggregated RBO and ROW vectors.
Best: C4RNWorst: C8RN
C1[2.02, 2.28]C1[7.70, 7.97]
C2[2.30, 2.79]C2[6.46, 6.87]
C3[5.17, 5.59]C3[4.29, 4.76]
C5[4.29, 4.76]C4[8.47, 8.89]
C6[6.17, 6.60]C5[5.46, 5.89]
C7[7.30, 7.75]C6[2.46, 2.89]
C8[8.30, 8.75]C7[2.17, 2.61]
Table 7. Assessment of the alternatives according to the criteria using the linguistic scale.
E1E2
C1C2C3C4C5C6C7C8C1C2C3C4C5C6C7C8
A1VGGVPPVPPMPVGVGPPVGPMVG
A2GGVPGPPMMGGMVGGMMG
A3PMMGGMGMVPPVGGMGGM
A4GMMPGMVGMPPVGPMGGM
A5VPMGVGGGVGMVPPVGVGMGVGM
A6PPGGMMPPPMGGMGPM
A7PGGGGGPMMPGGMGPM
A8PGVGVGGGPMPPVGVGMVGPM
E3E4
C1C2C3C4C5C6C7C8C1C2C3C4C5C6C7C8
A1VGPVPVGVPPPVPGMVPPPPPVP
A2GPVPMPPMPVGMPMMPVPVP
A3GMPPGMMPMGPMMPPP
A4MMPVGMMPPGGMPMPPP
A5MMMMVGGMMMPMGGVPPM
A6PPMPPGPPMMMMPPPM
A7MGMPGGMMGMGMGPPG
A8MGGGGGGMMGGGGPMG
E5E6
C1C2C3C4C5C6C7C8C1C2C3C4C5C6C7C8
A1VGGVPVPPPMGGMVPPVPMPM
A2GGVPGMMMVGGMVPGVPMMM
A3PMMMVGGGVGMMPGVGMMG
A4MMMVPVGGVGVGGMPPGMPM
A5VPMVGVGVGVGVGVGMMPVGVGMMG
A6PPGGGGPGMMPGVPMPM
A7PGVGGVGVGPVGMMMVGVGMMVG
A8PMVGVGVGVGPVGPMMVGVPMGG
Table 8. Group rough matrix.
A1A2A3A4A5A6A7A8
C1[1.22, 2.11][2.39, 2.95][4.74, 7.26][3.49, 5.22][6, 8][5.89, 6.78][4.53, 6.12][5.89, 6.78]
C2[4.74, 7.26][4.78, 6.51][4.4, 5.6][4.4, 5.6][3.89, 4.78][3.5, 4.5][4.78, 6.51][4.78, 6.51]
C3[8.39, 8.95][7.17, 8.77][4.06, 6.46][3.83, 6.07][2.22, 5.11][3.49, 5.22][2.53, 4.12][1.49, 3.22]
C4[1.89, 2.78][5.88, 7.47][4.78, 6.51][1.89, 2.78][7.17, 8.77][5.17, 6.77][5.12, 7.47][7.89, 8.78]
C5[1.6, 4.67][2.74, 5.26][6, 8][5.49, 7.22][6.78, 8.51][2.74, 5.26][6.53, 8.12][4.37, 7.42]
C6[6.39, 6.95][5.5, 6.5][3.88, 5.47][3.88, 5.47][2.58, 5.63][3.49, 5.22][2.53, 4.88][1.99, 4.78]
C7[3.5, 4.5][3.78, 4.89][4.78, 6.51][4.06, 7.22][5.28, 8.08][3, 3][3.22, 4.11][3.64, 5.72]
C8[2.32, 6.44][3.2, 6.8][3.99, 6.78][3.93, 6.17][5.23, 6.83][3.88, 5.47][5.64, 7.72][5.49, 7.22]
Table 9. Normalized matrix.
C1C2C3C4C5C6C7C8
A1[0.58, 1.73][0.65, 1.52][0.17, 0.38][0.22, 0.35][0.19, 0.69][0.29, 0.75][0.43, 0.85][0.32, 1.14]
A2[0.41, 0.88][0.66, 1.36][0.17, 0.45][0.67, 0.95][0.32, 0.78][0.31, 0.87][0.47, 0.93][0.44, 1.21]
A3[0.17, 0.45][0.61, 1.17][0.23, 0.79][0.54, 0.83][0.71, 1.18][0.36, 1.23][0.59, 1.23][0.55, 1.20]
A4[0.23, 0.60][0.61, 1.17][0.25, 0.84][0.22, 0.35][0.65, 1.06][0.36, 1.23][0.50, 1.37][0.54, 1.09]
A5[0.15, 0.35][0.54, 1.00][0.29, 1.45][0.82, 1.11][0.80, 1.26][0.35, 1.85][0.65, 1.53][0.72, 1.21]
A6[0.18, 0.36][0.48, 0.94][0.29, 0.92][0.59, 0.86][0.32, 0.78][0.38, 1.37][0.37, 0.57][0.54, 0.97]
A7[0.20, 0.47][0.66, 1.36][0.36, 1.27][0.58, 0.95][0.77, 1.20][0.41, 1.89][0.40, 0.78][0.78, 1.28]
A8[0.18, 0.36][0.66, 1.36][0.46, 2.16][0.90, 1.11][0.51, 1.09][0.42, 2.40][0.45, 1.08][0.76, 1.28]
Table 10. The results and ranking of the alternatives.
s i j L s i j U AVRank
A10.3640.9630.6646
A20.4690.9590.7144
A30.4540.9440.6995
A40.3770.8530.6158
A50.5291.1050.8172
A60.3920.8210.6067
A70.5001.0950.7973
A80.5531.2490.9011
Table 11. Spearman correlation coefficient (SCC) of the ranks through 15 sets.
SetSet 1Set 2Set 3Set 4Set 5Set 6Set 7Set 8
SCC0.8690.8690.8690.7020.8690.8690.8690.869
SetSet 9Set 10Set 11Set 12Set 13Set 14Set 15Average
SCC0.8690.8690.8690.7740.8450.9170.6310.837
Table 12. Ranking the alternatives by combining different methods.
AHP-TOPSISAHP-MABACAHP-SAWBWM-TOPSISBWM-MABACBWM-SAW
0.4155−0.08670.56360.4275−0.09370.5656
0.4844012230.65040.48540.09140.6374
0.41360.03550.60750.42260.04550.6165
0.3718−0.07860.49380.3907−0.05160.5198
0.48630.11840.71920.48530.12330.7242
0.3937−0.15480.52270.3838−0.16580.5207
0.50620.16620.67930.50920.17420.6893
0.58310.20410.75710.57010.20010.7601
RAHP-RTOPSISRAHP-RSAWRAHP-RMABACRBWM-RTOPSISRBWM-RSAWRBWM-RMABAC
0.41771.6916−0.63370.43470.6646−0.1696
0.55021.84741.29230.56230.71440.0754
0.47451.70250.84350.48850.69950.0665
0.38581.4008−1.05580.41180.6158−0.1967
0.54431.99821.04740.55540.81720.1583
0.45661.5067−0.39060.44560.6067−0.2168
0.52841.92932.47120.56820.79730.3412
0.57512.17712.55610.60410.90110.4371
Table 13. Correlation of the results of the hybrid models.
MethodsABCDEFGHIJKLAverage
A1.0000.8860.8330.9760.8380.8330.9760.8330.8810.8810.8330.8620.861
B-1.0000.8570.8330.9760.8570.8330.8570.9050.9050.8570.9520.894
C--1.0000.8100.9051.0000.9051.0000.9050.9051.0000.9520.938
D---1.0000.8620.8100.9520.8100.9290.9290.8100.8860.865
E----1.0000.9050.8100.9050.8810.8810.9050.9760.908
F-----1.0000.9051.0000.9050.9051.0000.9520.952
G------1.0000.9050.9290.9290.9050.8330.917
H-------1.0000.9050.9051.0000.9520.952
I--------1.0001.0000.9050.9050.953
J---------1.0000.9050.9050.937
K----------1.0000.9520.976
L-----------1.0001.000
Overall average0.933
A, AHP-TOPSIS; B, AHP-MABAC; C, AHP-SAW; D, BWM-TOPSIS; E, BWM-MABAC; F, BWM-SAW; G, RAHP-RTOPSIS; H, RAHP-RSAW; I, RAHP-RMABAC; J, RBWM-RTOPSIS; K, RBWM-RSAW; L, RBWM-RMABAC
Table 14. SCC comparison of the ranks by scenarios in relation to the initial rank.
ScenarioAHP-TOPSISAHP-MABACAHP-SAWBWM-TOPSISBWM-MABACBWM-SAWRAHP-RTOPSIS
SCC0.9520.9520.9520.9760.9760.9520.833
ScenarioRAHP-RSAWRAHP-RMABACRBWM-RTOPSISRBWM-RSAWRBWM-RMABACAverage
SCC0.9520.9050.9050.9521.0000.942