Impact Analysis of Economic Contributors on Knowledge Creation Activity by Using the Symmetric Decomposition Method


1
Department of Intellectual Property, College of Economics & Business Administration, Kyonggi University, 154-42 Gwanggyosan-Ro, Yeongtong-Gu, Suwon-Si, Gyeonggi-do 16227, Korea
2
Department of Industrial & Management Systems Engineering, College of Engineering, Kyunghee University, 1732 Deogyeong-Daero, Giheung-Gu, Yongin-Si, Gyeonggi-do 17104, Korea
3
Graduate School of Technology and Innovation Management, Hanyang University, 222 Wangsimni-ro, Seongdong-gu, Seoul 133-791, Korea
*
Author to whom correspondence should be addressed.
Symmetry 2017, 9(11), 251; https://doi.org/10.3390/sym9110251
Submission received: 14 September 2017
/
Revised: 23 October 2017
/
Accepted: 23 October 2017
/
Published: 26 October 2017
Abstract
:Recently, several studies using various methods for analysis have tried to evaluate factors affecting knowledge creation activity, but few analyses quantitatively account for the impact that economic determinants have on them. This paper introduces a non-parametric method to structurally analyze changes in information and communication technology (ICT) patenting trends as representative outcomes of knowledge creation activity with economic indicators. For this, the authors established a symmetric model that enables several economic contributors to be decomposed through the perspective of ICTs’ research and development (R&D) performance, industrial change, and overall manufacturing growth. Additionally, an empirical analysis of some countries from 2001 to 2009 was conducted through this model. This paper found that all countries except the United States experienced an increase of 10.5–267.4% in ICT patent applications, despite fluctuations in the time series. It is interesting that the changes in ICT patenting of each country generally have a negative relationship with the intensity of each country’s patent protection system. Positive determinants include ICT R&D productivity and overall manufacturing growth, while ICT industrial change is a negative determinant in almost all countries. This paper emphasizes that each country needs to design strategic plans for effective ICT innovation. In particular, ICT innovation activities need to be promoted by increasing ICT R&D investment and developing the ICT industry, since ICT R&D intensity and ICT industrial change generally have a low contribution to ICT patenting.
1. Introduction
The innovation policies of major developed countries generally focus on establishing a mission-driven innovative ecosystem which is related to business development and job creation due to recent economic recession trends. This ecosystem’s creation is also emphasized to enhance the efficiency and outcome quality in research and development (R&D) through performance evaluation management and inspection reinforcement, rather than new investment expansion. An in-depth analysis of R&D outcomes has become increasingly important for this reason.
The extent of R&D outcomes can normally be measured by using R&D expenditure data or the patent’s bibliographic information. As patent documents in particular contain much detailed information regarding the technology itself, the information in the patent document can be widely considered to be an index representing the size of technological activity and the invention process [1,2,3]. Thus, many academic papers have used patents as a proxy to represent the size of R&D outcomes (in a narrow sense), technological innovation and knowledge creation (in an extended meaning) [1,2,3,4,5,6,7,8,9,10,11].
Interest in them was primarily to empirically reveal whether, or even how, technological innovation and R&D outcomes could affect firms’ productivity, market and industry structures, and even a country’s economic growth [12,13,14,15]. Meanwhile, some other previous papers focused on how the external relationship with firms’ productivity, market and industry structures, and a country’s economic growth has adversely affected R&D outcomes, and furthermore, technological innovation [9,16,17,18,19,20,21]. However, these studies focused on using the patenting activity as an instrumental variable for innovation but did not look in-depth at the changes in the patenting activity itself.
Thus, recently, it has been attempted to analyze the core factors contributing to innovation outcomes in the manufacturing industry using the non-parametric method, especially decomposition analysis which can accommodate various economic indicators. Although decomposition analysis has been typically applied to analyze energy consumption trends and greenhouse gas emissions at national and industrial levels [22,23,24,25,26,27,28,29,30,31], it is starting to be widely utilized in recent years to evaluate the impact of other social factors influencing certain phenomena [32,33,34,35,36,37,38,39].
Kim and Marschke (2004) [33] determined changes in patent applications for the United States’ manufacturing industry from 1983 to 1992, and decomposed patenting changes into R&D expenditures and R&D productivity (the patent–R&D ratio) at the industry level. Their analysis revealed that computer hardware, electricity, and information and communication technology (ICT) devices led to patenting activity growth from 1983 to 1992. In addition, Pietro, Constantin, Keith, Alexander, and Mike (2010) [35] compared the United States’ private R&D investments with those in the European Union, and analyzed the cause of these differences by observing the industrial structural effects and intrinsic R&D investment effects from each region. The authors found that the European Union has relatively less business R&D investment than the United States due to differences in industry structure. Reinstaller and Unterlass (2012) [36] compared business sectors’ R&D intensities in 27 European Union countries, and analyzed the contributors to these differences, which included the national characteristics, industrial structure, industrial R&D intensity, and the interaction between industrial structure and R&D intensity. They determined that differences in R&D intensity across European Union countries depended on dynamic industrial structure rather than static national characteristics. Recently, Fujii (2016) [37], Fujii and Managi (2016) [38], and Fujii et al. (2016) [39] published research papers applying the decomposition method to patent analysis. Targeting several technology domains—green chemical technology, environmental technology, and biological technology—in Japan, they identified, through the Logarithmic Mean Divisia Index (LMDI) model (see Appendix A for more details on the methodology), the impacts of various determinants, including technology priority, technology share, and total patenting scale, on patenting activity.
These commonly show that the decomposition analysis methodology can be applied to the evaluation of R&D outcomes and determinants. Nevertheless, these studies also failed to incorporate many economic determinants of R&D performance from the microscopic to the macroscopic perspective. Considering that technological change and innovation cannot be generated separately from economic contributors, it is very important for academia and policy decision-making to identify the correlation between technology change and economic contributors with a holistic view. Therefore, the purpose of this study is to explain the change of patent application through economic indexes which can be measured from the microeconomic activity to the macroeconomic activity by using a structural mathematical model. This study analyzes technological change from a holistic economic point of view, which gives this paper great novelty compared to previous studies.
Specifically, this paper analyzed core contributors that aim to create knowledge in the ICT sector and which affect patenting activity, (The OECD (2002) [40] defines the ICT sector as a combination of manufacturing and service industries that capture, transmit, and display data and information electronically based on International Standard Industrial Classification (ISIC), Rev. 3.1. See OECD (2002) [40] for more details) by incorporating micro-level factors such as ICT R&D productivity and ICT R&D intensity, meso-level factors such as changes in structure and scale in the ICT industry to macro-level factors, such as overall manufacturing growth. We performed a country-level analysis using the LMDI model, a non-parametric approach and currently the most advanced methodology among decomposition methods, and conducted our comparative analysis across eight countries: Belgium, the Czech Republic, France, Germany, Italy, Korea, Spain, and the United States.
2. Model and Methodology
This paper builds an empirical model to evaluate the impact of economic contributors influencing ICT patenting by using the LMDI technique, currently the most advanced methodology. Researchers conducting the LMDI decomposition analysis must establish an identical equation form, which consists of the object variable and several factors preferentially.
The several factors introduced in this paper are based on many previous works that studied the determinants of innovation including the systematic analysis of technological development, known as the ‘National Innovation System (NIS)’ [16,17,18,19,20,21,41,42,43,44,45,46,47]. Smith (1996) [45] defines the NIS as follows: “the innovative performance of an economy depends not only on how the individual institutions (e.g., firms, research institutes, universities) perform in isolation, but on how they interact with each other as elements of a collective system of knowledge creation and use, and on their interplay with social institutions (such as values, norms, legal frameworks)”. This systematic analysis of national innovation emphasizes that innovations can be affected by the meso and macro environment as well as the R&D agent’s characteristics and efforts [48].
At the micro level, Teece (1996) [18] stressed that research on the rate and direction of firm-level innovation needs to understand the importance of organization, market structure, internal structure, and the business environment. In addition, Kwaku (2003) [20], and Jaumotte and Pain (2005) [21] analyzed how R&D investments, firms’ labor, and organization correlated with innovation outcomes. At the meso level, Schmookler (1966) [16], Binswanger (1974) [17], and Scherer and Harhoff (2000) [19] studied how market price and competition, and industrial structure affected technological innovation. Innovation activities depend not only on the interaction between the science and business sector but also on the market structure and economy of scale [41,47]. Meanwhile, at the macro level, Popp (2003) [48] and Johnstone, and Haščič, and Popp (2010) [22] analyzed how a country’s economic growth and government policy correlated with technological innovation.
However, most authors investigated the determinants’ impact on technological innovation by using an econometric analysis which resulted in the arbitrary and partial selection of determinants; they had a limitation in the systematic integration from microscopic factors to macroscopic factors. This paper tries to decompose the innovative performance of a country into the systematically integrated contributors, i.e., investment and efficiency in R&D at the micro level, industrial structure and scale at the meso level, and change of value-added in manufacturing at the macro level.
, or the ICT patent application for country N in period T, can be described as the following identical equation form.
Further details on each parameter are given in Table 1.
The first variable on the right-hand side, , is described as the outcome of a patent according to R&D expenditure, which represents the “R&D productivity” of sub-sector i in the ICT industry, referring to the works of Lanjouw and Schankerman (2004) [15] and WIPO (2011) [49]. The second variable, , accounts for the R&D expenditure on the value-added sub-sector i in the ICT industry. This, therefore, represents the “R&D intensity”, during which the R&D is enacted. While Cohen, Levin, and Mowery (1987) [50] built R&D intensity at the firm level by using data of business’ R&D expenditures and firm sizes, Reinstaller and Unterlass (2012) [36] introduced industry-specific R&D intensity through an equation identical to that in this paper. Additionally, Jaumotte and Pain (2005) [21] set national-level R&D intensity as the ratio of total R&D expenditures to gross domestic product. The third variable, , represents the “structural effect” within the ICT industry, during which the R&D is enacted because it accounts for the proportion of value added for sub-sector i in the whole ICT industry. The fourth variable, , can be interpreted as the ICT industry’s “scale effect”, during which R&D is enacted because it accounts for the entire ICT industry’s value-added effect on the overall manufacturing industry. The definitions and components of these indexes, specifically and , are generally accepted by much previous literature on decomposition analysis, including [28,29,30,36,51,52]. The fifth variable, , indicates the “overall manufacturing activity or volume effect of manufacturing”, during which the R&D is implemented, referring to the works of [53,54].
We note that a time lag arises between the object variable (i.e., the patent application) and several relevant factors because the patent application as a successful R&D activity outcome is affected by the industrial and economic situation in which R&D is enacted. Pakes and Griliches (1980) [55] and Hall, Griliches, and Hausman (1986) [56] researched the time lag effect of R&D investment on patenting activity. They found that, despite the limitation of data availability, the contemporaneous and lagged effects of R&D on patenting are significantly positive. Additionally, the World Intellectual Property Organization (WIPO) publishes R&D productivity as the ratio of one-year lagged patent applications to R&D investment (See the WIPO (2011) [49] for more details). Therefore, this paper assumes that a time lag of one year exists between conducting R&D and the applyication of the patents, referring to these studies.
The ICT patent applications in the period of T + 1 are described in Equation (2), following the same principle as Equation (1).
From Equations (1) and (2), the triggers for changes in ICT patent applications can be largely divided into ICT R&D perspectives, industry perspectives, and overall economic perspectives. In other words, R&D intensity and productivity are indexes related to R&D investment and performance, respectively. The ICT industry structure and scale are related to changes in the ICT industry’s structure and total volume of the ICT industry, respectively. Finally, overall manufacturing activity is not a factor affected by a specific industry but is linked to overall economic performance.
The change in ICT patenting from T to T + 1 can be decomposed into the five aforementioned factors, by applying the following symmetric and multiplicative scheme, following Equation (3).
represents the effects of R&D productivity change on ICT patenting, and represents the effects of R&D intensity. and describe the effects on ICT patenting by the change in structure and volume in the ICT industry, respectively. represents the effects of manufacturing activity on ICT patenting.
This paper applied the LDMI technique to quantify each factor’s effects, and the formulas are as follows:
3. Empirical Analysis
3.1. Linkage between Patent Classification and Industry Classification
As illustrated in Table 1, patent application data can be used to measure the object variable, and the contributors are measured by R&D expenditure and value-added data. The object variable’s data classification system differs from that of the determinants. The patent data provides technology information, and is classified by the International Patent Classification (IPC) system. The hierarchical IPC system classifies the patent into eight technological classes, from “human necessities (A)” to “electricity (H)”, and matches these with at least 1 of 640 codes. Meanwhile, R&D investment and value-added data can be classified by the International Standard Industrial Classification (ISIC) system, and ISIC Rev. 3 performs a hierarchical classification among 21 industrial classes, from “beverage and food (15)” to “recycle (37)”. We must link the IPC system to the ISIC system to decompose the object variable, including the technological information, into determinants involving industrial information.
This linkage can be determined by using a technology concordance table, which has evolved into various forms that differ by country or institution. Universities and intellectual property offices have investigated links between the domestic standard industry and patent classification systems [57,58]. These studies enabled the patent system to link with the domestic standard industry classification system but they were limited with regard to an international comparison since they did not coincide with the other countries’ systems. Therefore, some studies have identified a linkage between IPC and ISIC to solve this problem [58,59].
However, these studies still have limitations, in that they are not only time-consuming in matching IPC codes with the ISIC system, but also handle the process in a complicated way. The Fraunhofer Institute for Systems and Innovation Research (Fraunhofer ISI) of Germany, the Observatoire des Science et des Techniques (OST) of France, and the University of Sussex and Policy Research Unit (SPRU) of the United Kingdom cooperated in 2003 to establish a straightforward link between the IPC and ISIC. This resulted in the FOS (Fraunhofer/Observatoire/Sussex) Concordance Table. This method incorporates 44 technology fields and matches both ISIC and 640 IPC codes to these fields through one-to-one correspondence. Further, as with an inter-industry relation table, it provides an industry-weighting matrix for 44 technological fields, based on the patent distribution in each business sector.
The FOS Concordance table enables us to analyze and compare patenting changes across countries without being limited to a certain region, through the link between the IPC and ISIC. Additionally, a clear link exists between the patent and industry, and data handling and processing are simple due to the one-to-one correspondence between the IPC codes and industry classification. Therefore, the FOS Concordance table is used in this paper to link patent and industry classifications (The 17 IPC codes could not be classified by FOS Concordance because the IPC version was updated after the creation of the FOS Concordance. Therefore, this paper classified IPC codes into highly correlated technology fields based on their details. See Appendix B for the linkage between these IPC codes and the FOS Concordance technology field).
3.2. ICT Industry Classification
We must classify the ICT sector among the 44 technological fields to conduct a decomposition analysis. This research classifies the ICT industry based on the ISIC (Rev. 3.1) in 2002, excluding the “manufacturing of insulated wire and cable (3130)” and “manufacturing of industrial process control equipment (3313)” due to controversy over the ICT industry’s ambiguity. This paper selects four industries with a relatively high proportion of value added, that is, the “manufacturing of office, accounting, and computing machinery (3000)”, “manufacturing of electronic valves and tubes and other electronic components (3210)”, “manufacturing of television and radio transmitters and apparatus for line telephony and telegraphy (3220)”, and “manufacturing of television and radio receivers, sound or video recording or reproducing apparatus, and associated goods (3230)” in the ICT industry. Additionally, the OECD combines the “manufacturing of television and radio transmitters and apparatus for line telephony and telegraphy (3220)” and the “manufacturing of television and radio receivers, sound or video recording or reproducing apparatus, and associated goods (3230)” into “television, radio, and communications equipment” when providing data. This paper also combines the two sectors according to the OECD, and consequently, the ICT industry is divided into three different sub-sectors as the following Table 2.
3.3. Data
We conducted an empirical analysis of the eight OECD countries, including Belgium, the Czech Republic, France, Germany, Italy, Korea, Spain, and the United States, based on data availability. The United Kingdom, Japan, and other OECD countries could not be used because their R&D and value-added data are not subdivided into the aforementioned ICT industry sub-sectors.
Considering that the goal of this paper is to analyze the multi-level factors driving the changes in ICT patenting by decomposing it into several economic contributors, the empirical analysis of this paper focuses on the changes in ICT patenting only in the first decade of the 2000s when innovation activities in ICT manufacturing were mature and stable, as illustrated in Table 3. In fact, according to WIPO (2009) [60], the growth rate of PCT applications is considerably lower than in the past after the dot-com bubble collapse, year of 2000 (The business recession period during 2008–2009 is of little significance in our analysis because the period used for the analysis (from 2001 to 2009) was addressed based on the patent application data and this study considered a gestation period, a year lag between economic contributors—R&D, industrial structure, economic activity variables—and patent applications. Therefore, most of economic contributors’ data in this paper belongs to the period before the business recession. Even if some countries include data for 2008, this can be seen through the trends in patent applications. Meanwhile, it is known that R&D and value-added changes have not had an immediate impact on patent applications).
This paper used data for patent applications filed under the PCT, based on application date and inventor nationality. The PCT patent data are counted fractionally because the count is split by the number of nations when the patent is applied by several applicants with different nationalities. The PCT patent data, as classified by IPC, are provided by the category of “Patent by technology” in the OECD statistics database [61]. Regarding ICT R&D investment, this paper used ICT R&D expenditure data (in million USD, 2005 constant prices, and PPPs) provided by the category of “STAN R&D expenditure in Industry ISIC Rev. 3” in the OECD STAN database [62]. Finally, value-added data in the eight countries’ ICT industry comes from the UNIDO Industrial Statistics Database 2014 edition at the 3- and 4-digit level of ISIC (Revision 3 and 4) provided by the United Nations Industrial Development Organization [63].
4. Result and Discussion
The primary result of decomposing the ICT patenting changes is noted in Table 4. (The results of each country’s time series trend are provided in Appendix C). A qualitative interpretation of the results shows that if a numerical value of DTOT is greater than 1, this indicates an increase in ICT patenting, and otherwise, it means that ICT patenting has decreased during the analysis period. This method of interpretation also applies to the effects of determinants. Specifically, certain factors contribute to increases in ICT patent applications if they are greater than 1. On the contrary to this, they contribute to a decrease in ICT patent applications if they are lesser than 1.
Additionally, one can quantitatively analyze the results by converting a value subtracted from the result’s numerical value into a percentage. For example, the effects of R&D productivity (DRDPRO) and R&D intensity (DRDINT) on ICT patenting for Belgium are 2.0240 and 0.6224, respectively. This means that R&D productivity has a positive effect of 102.4%, but R&D intensity has a negative effect of −37.8% on the ICT patent application’s increase. Notably, each determinant’s quantitative effect is not an absolute impact contributing to changes in ICT patenting, but rather, a relative impact determined by an interaction between determinants.
The eight countries’ innovation activities in the ICT industry, that is ICT patenting, increased about two-fold during the analyzed period, as the average value of DTOT is noted as 1.88. Specifically, the United States is the only country in which ICT patenting has decreased by 2.6%, while others have experienced increases in ICT patent applications, from as little as 10.5% in Germany to as much as 267.4% in Korea.
It is especially interesting that the changes in ICT Patenting (DTOT) of each country generally have a negative relationship with the intensity of each country’s patent protection system of which the measurement index is suggested by Park (2008) [64] (Park (2008) [64] developed an index which indicates the strength of the patent protection system by scoring five factors—coverage (inventions that are patentable), membership in international treaties, duration of protection, enforcement mechanisms, and restrictions (for example, compulsory licensing in the event that a patented invention is not sufficiently exploited)—as shown in Appendix D. His study shows the strength of the patent protection system every five years from 1995 to 2005. This study considers the strength of the national patent protection system as the average value of 2000 and 2005) and many previous works related to patent policy. According to Park (2008) [64], the United States (4.88) has the strongest protection system, followed by the major western European countries such as Belgium (4.67), France (4.67), Italy (4.67), and Germany (4.5). On the other hand, Spain (4.33), Korea (4.23), and the Czech Republic (3.77) have relatively low strength among the eight countries.
4.1. The Effects of Micro Level’s Contributors on ICT Patenting
Despite this national variation, ICT R&D productivity has been a major driver, mostly contributing (on average, 164%) to an increase in ICT patenting. Figure 1 illustrates that all countries, except the Czech Republic and the United States, have experienced an improvement in ICT R&D productivity, contributing to an increase in ICT patenting. Furthermore, ICT R&D productivity can be specifically considered to be a key contributor compared to the other effects in Italy, Korea, and Spain.
A competitive and asymmetric market structure allows each firm to have different incentives for technological development, resulting in patent competition, and this competition returns to evolve the market structure asymmetrically [65,66]. Moreover, as technological competition intensifies and the cost and complexity of technology development increases, firms have been increasing their investment in developing technologies rather than basic research with the aim of pursuing innovation strategies to protect their technologies by patents [67,68,69].
In addition, there are various theoretical and empirical studies on the correlations between patent policy (or system) and patenting activities [70]. The strengthening of patent protection in terms of the institutional aspect has not only resulted in an increase in the patenting activity and the utilization of patents, but also accelerated the vertical integration of the knowledge-based industry [70,71,72,73,74]. However, in the ICT industry, this may result in unfavorable phenomena such as lower incentive for patenting due to the leading firm’s technological barrier and the appearance of a firm having only intangible assets, patent trolls. Some studies clarified that strengthened patent protection systems in industries with sequential and complex technological systems such as electronics, machinery, and ICT may accelerate firms’ patent thicket and hinder new firms entering the market and applying the patents [75,76,77].
As a result, deepened technological competition between firms and a strengthened patent system in the ICT industry may have affected the patent productivity of R&D by increasing the patent thickets and the patent trolls. Thus, especially in countries such as the United States, where the patent protection system is strictly working, one can interpret that the increase in patent applications compared to ICT R&D investment is relatively low due to numerous patent thickets and patent trolls. Therefore, it might be possible that ICT R&D productivity of the country, where the intensity of patent protection is relatively high, has little impact on patent application growth. On the other hand, in countries such as Korea and Spain, where the intensity of patent protection is relatively low, a relatively large number of patent applications have been filed compared to ICT R&D investment and it is presumed that ICT R&D productivity has a high positive impact on patent applications.
Alternatively, although the effects of ICT R&D intensity have helped ICT patenting increase in France and the United States, almost all other countries show low performance in ICT R&D intensity, which results in ICT patenting being offset by negative effects—21%on average. One can observe that France is the sole country with entirely positive effects of ICT R&D performance, while neither the intensity nor the productivity in ICT R&D contributes to an increase in ICT patenting in the Czech Republic. It is noteworthy that the United States has sought to increase ICT patenting by intensifying ICT R&D investment rather than improving R&D productivity, in contrast to other countries.
These results can also be explained by understanding the relationship between the patent policy and the R&D investment. Several studies show that strengthening patent policy positively affects R&D investment and economic growth [77,78,79,80,81]. Some studies focus on the simultaneous relationship between patent protection and R&D investment. That is, the demand for intellectual property (IP) protection can increase if significant R&D funding is invested in the industrial base. Furthermore, adversely, strengthening IP protection can induce high R&D intensity [79,80].
Therefore, it is not surprising that the United States, having a strong patent protection system, has experienced a significant increase in ICT R&D investment under the stable protection system, which results in its positive contribution (63%) to the increase in ICT patenting. In France, which also has a strong patent protection system, the impact of R&D intensity positively contributes to ICT patenting (34%). However, the other western European countries, Belgium (−38%), Italy (−45%), and Germany (−46%) have negative contributions of R&D intensity to ICT patenting. Although they have low contributions of R&D intensity to ICT patenting, their contributions are not as low as those of Korea (−50%) and Spain (−54%), which have relatively low protection strengths.
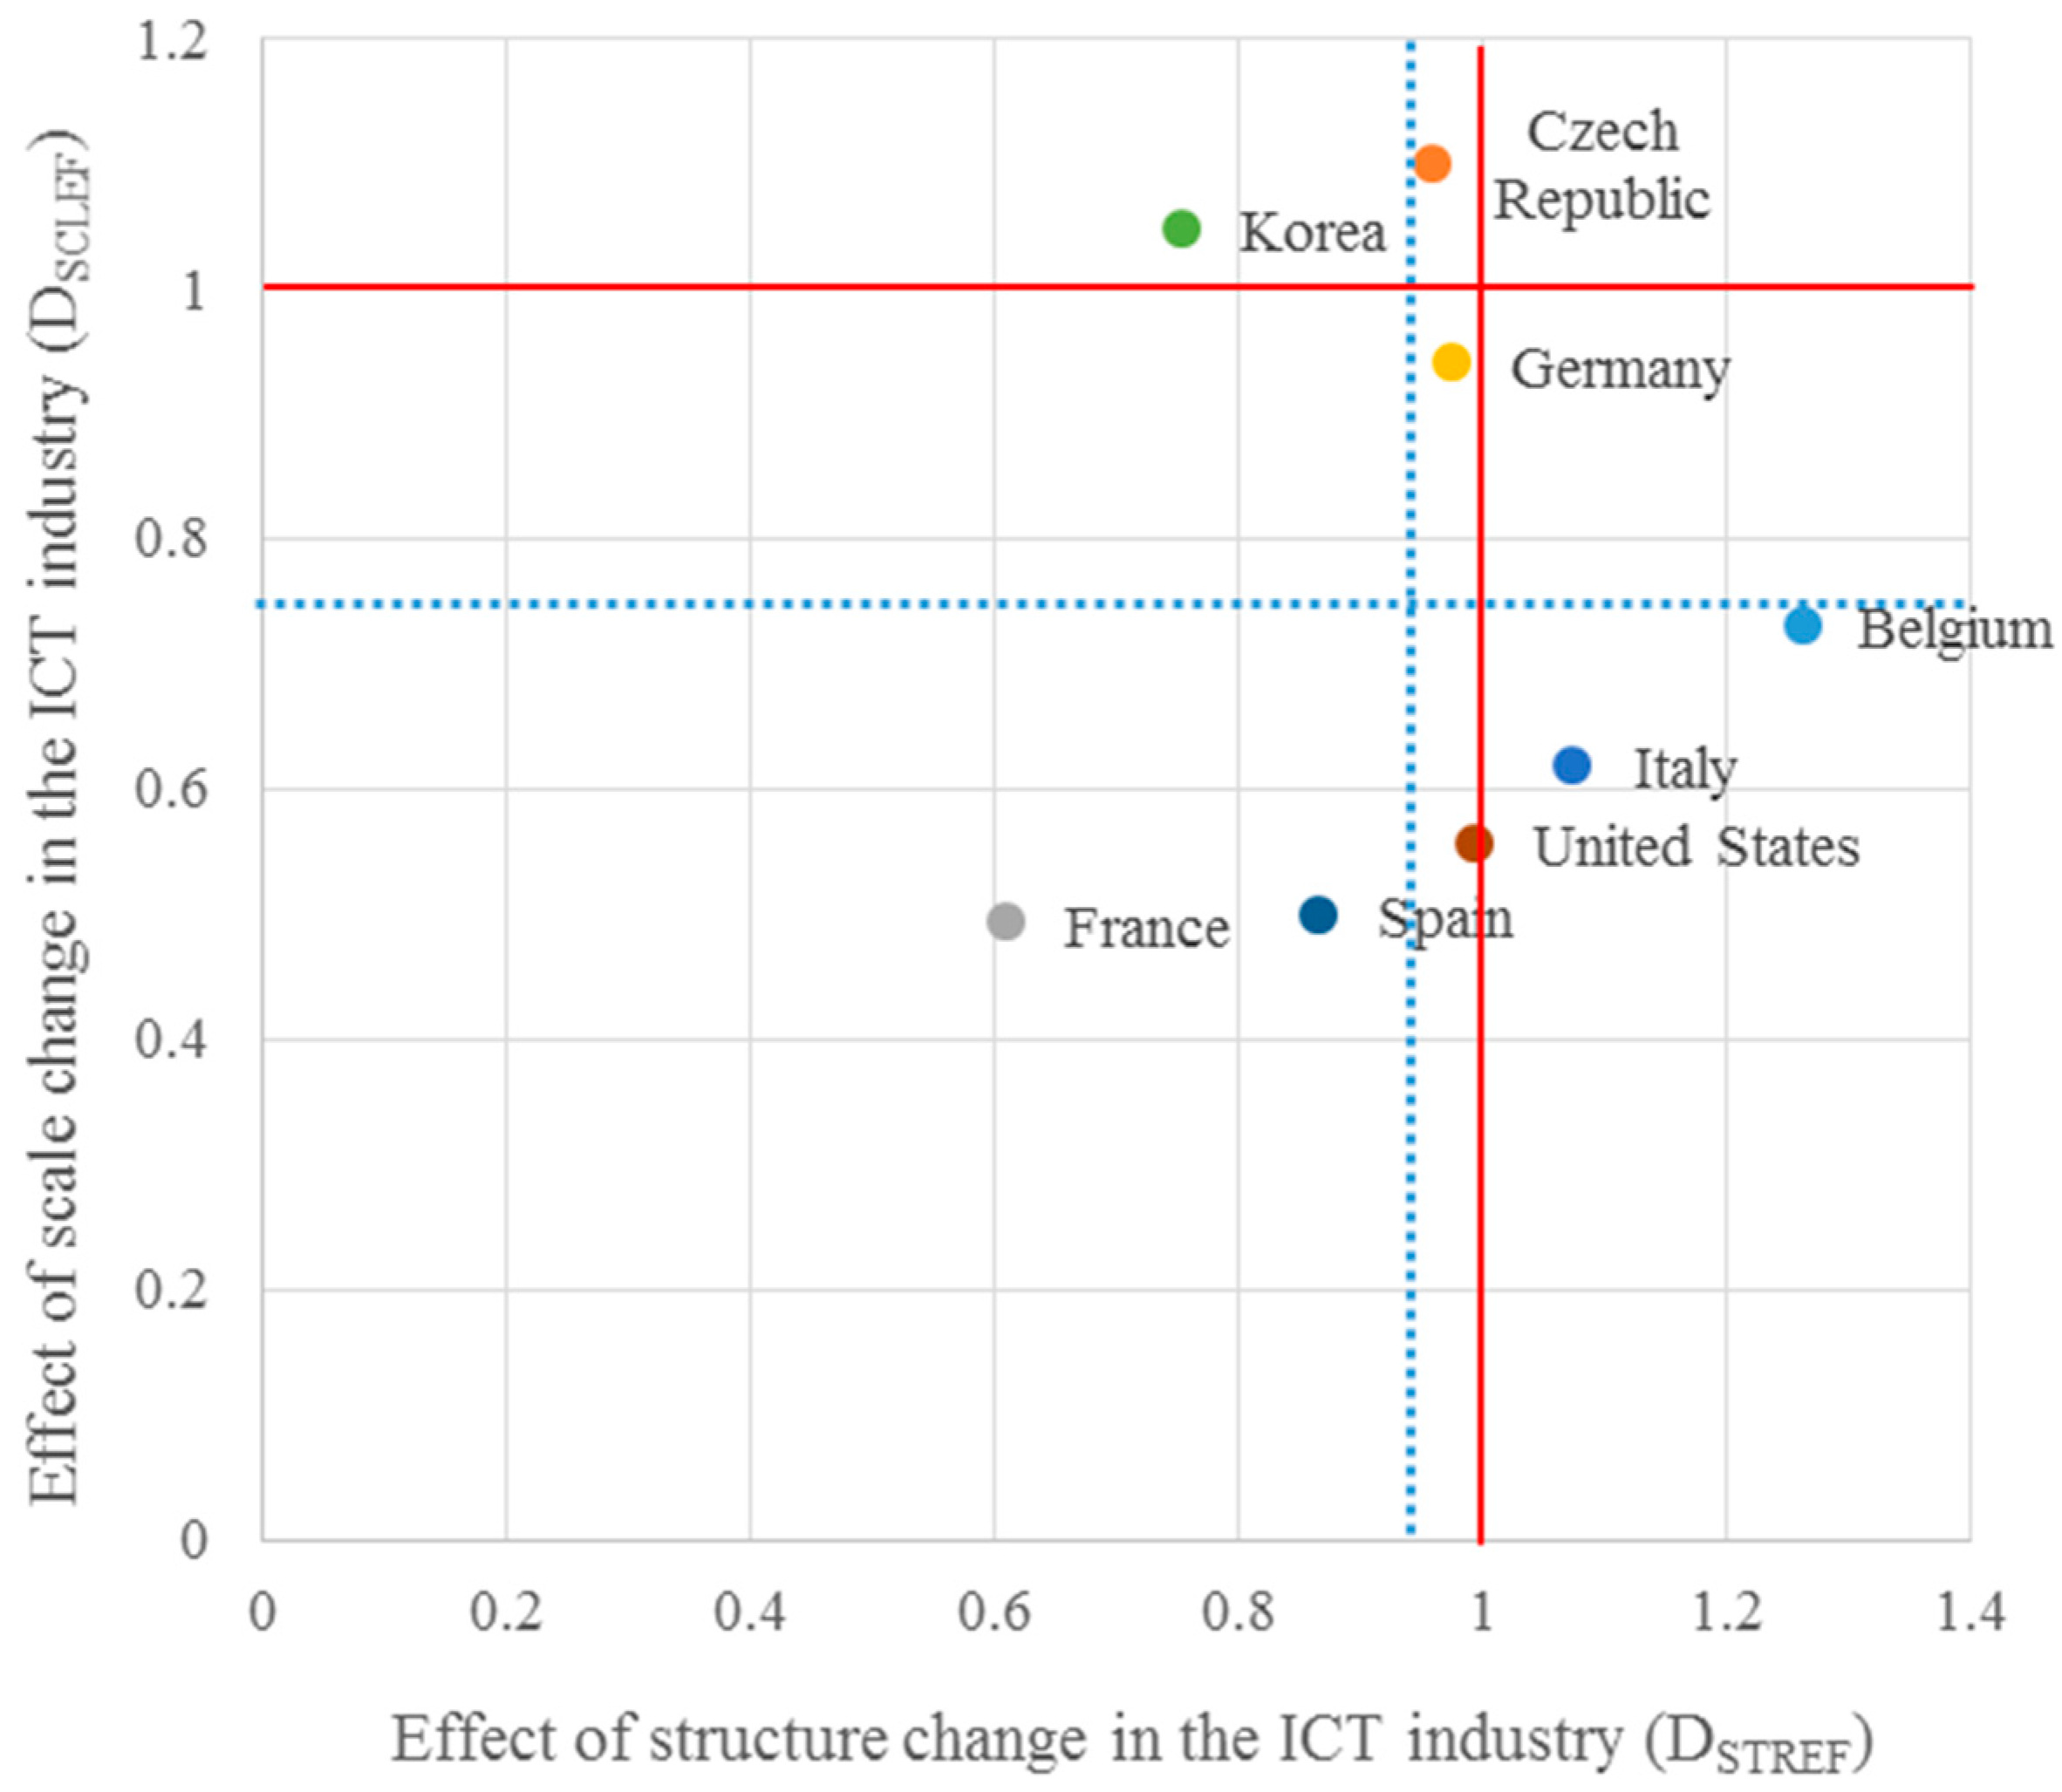
4.2. The Effects of Meso Level’s Contributors on ICT Patenting
Figure 2 presents an international comparison on the level of influence that the ICT industrial change has had on the increase in ICT patenting. The change in the ICT industry’s structure and scale has offset the increase in ICT patenting, with many countries negatively affected by structural change (on average −6%) and the scale change’s effect (average −25%) on ICT patenting. One can observe that no country is positively affected by both the structure and scale of the ICT industry. For example, a proportion of Korea’s “office machinery and computers” sector, which is one of the biggest ICT industry sub-sectors, has decreased significantly over time. Therefore, this change in structure may negatively affect ICT patent applications’ increase, while the growth of the ICT industry through public and private efforts in Korea has contributed to an increase in the ICT industry’s innovative activities.
Meanwhile, as mentioned above, some previous studies suggest that the strengthened patent system makes technology leaders establish the patent thickets easier, especially in industries with sequential and complex technological systems such as semiconductors, electronics, and ICT [75,76,77]. As a result, the technological barrier may have a detrimental effect on the industrial value-added [71,77,82].
In this paper, the effect of the ICT industry scale related to the change in the value-added of the ICT shows that countries with a high patent system protection level, such as France (−51%), the United States (−44%), and Italy (−38%) do not make a positive contribution to ICT patenting activities and offset other effects. On the other hand, in Korea (5%) and the Czech Republic (10%), where the protection strength is relatively low, the technological barriers by the patent thicket can be less and new firms can enter into the ICT industry easily. These might induce increases in the ICT industrial value-added, which positively contribute to ICT patenting.
4.3. The Effects of Macro Level’s Contributors on ICT Patenting
Increasing the overall manufacturing activity has significantly helped to increase ICT patenting, from as little as 14.9% in the United States to as much as 183.9% in the Czech Republic. Especially in the Czech Republic, overall, manufacturing activity has increased since 2003, which contributed to a 183.9% increase in ICT patenting. Additionally, the ICT industry’s scale growth has a positive effect of 10.1%. Thus, for the case of the Czech Republic, economic and industrial expansion leads to an increase in ICT patenting.
Meanwhile, unlike in other countries, results in Germany indicate that ICT patent application is generally stable, increasing by only 10.5% compared to 2001. Despite this stabilized ICT patenting, the growth of overall manufacturing activity significantly contributed to ICT patenting (77.2%) while the other four factors have a small or even negative contribution to ICT patenting.
This suggests that as a nation’s manufacturing and economy increase, ICT demand and opportunities increase by the application and convergence of ICT, which may lead to an increase in ICT patenting. Furthermore, one can infer that increased innovation by convergence between ICT and other manufacturing areas after 2000 may induce negative effects of ICT industrial change but positive effects of the overall manufacturing activity on ICT patenting.
5. Conclusions
This paper analyzed changes in ICT patenting trends as representative outcomes of ICT innovation, and decomposed several influential factors from the perspectives of ICT R&D performance, ICT industry change, and overall manufacturing growth. We accomplished this by not only linking the IPC and ISIC systems, but also by developing a methodology to analyze trends and determinants for ICT innovation by utilizing the LMDI technique. Further, we conducted an empirical analysis for some OECD countries: Belgium, the Czech Republic, France, Germany, Italy, Korea, Spain, and the United States.
This paper showed that all countries except the United States experienced an increase in ICT patent applications, from 10.5 to 267.4% during the analysis period, despite fluctuations in the time series. As a result of R&D performance, ICT R&D productivity is a dominant determinant for ICT patent application increase in almost all countries. Although the effects of ICT R&D intensity show mixed results based on country-specific conditions, this is not sufficient to increase ICT patent applications; therefore, the effect was relatively negative. Meanwhile, almost no countries experienced a positive influence of a change in the ICT industry’s structure and scale on ICT patent applications. This result may be related to the analysis period, during which such smart devices as smartphones, smart TVs, tablet PCs, and others were not earnestly developed and deployed. Nevertheless, to increase ICT patenting, it is necessary to restructure the ICT industry, as well as to expand its scale by developing new technologies and markets. Overall, manufacturing growth had a positive effect on all countries, despite regional deviations. This suggests that ICT patenting growth is heavily reliant on the economic situation, including the time and place. In other words, as a nation’s society and economy increase, the demand for ICT increases by the application and convergence of ICT, which may lead to an increase in ICT patenting.
This paper emphasizes that each country needs to design strategic plans for effective ICT innovation. In particular, ICT innovation activities need to be promoted, ICT R&D investment needs to be increased, and the ICT industry needs to be developed since ICT R&D intensity and ICT industrial change generally have a low contribution to ICT patenting.
Furthermore, considering that each country has a different bottleneck causing low performance ICT patenting, each country needs tailored strategies for efficient ICT patenting. For example, as France shows high performance in ICT R&D activity, but low performance in the ICT industry, the country must improve its ICT industry’s scale and structure to improve performance in ICT innovation. Meanwhile, in Italy and Belgium, expanding the scale of the ICT industry and increasing R&D investment will help improve ICT innovation activity. Lastly, Korea may benefit from employing a strategy to improve its ICT industry’s structure, as well as increasing R&D investment for more innovative outcomes.
This paper provides a basic framework for a structural approach to analyze changes in ICT innovation; meaningful implications for establishing policies for qualitative patenting growth; and the development of an ICT knowledge ecosystem. This study’s primary academic contribution involves applying a decomposition analysis to the new research field, analyzing technology innovation, and developing a new integrative and systemic structural model. Furthermore, this paper has importance and novelty in that it enables policy makers to have information and evidence on where to set their goals of long-term patent and innovation policies based on the structural correlations between micro, meso, and macroeconomic indicators and ICT patent activities. Future research should consider more diverse determinants related to ICT innovation, through a more advanced methodology and diverse data.
Author Contributions
All three authors contributed to the completion of the research. Kyunam Kim contributed to the concept and design of the paper and drew the outline of the paper. Jungwoo Shin contributed to the methodology and data work. Jae Young Choi contributed to the analysis of the data and modified the draft. Jae Young Choi and Kyunam Kim were in charge of the final version of the paper.
Conflicts of Interest
The authors declare no conflict of interest.
Appendix A. Theoretical Background of Decomposition Analysis
This paper illustrates a simple IDA methodology by introducing an example to decompose the change in energy intensity (The specific explanation can be found in the works of Ang (1994, 2005) [53,83] and Zhang and Ang (2001) [84]).
Overall energy intensity (e) is expressed as the overall energy consumption (E) in contrast to the overall value-added (V), and can be decomposed by the energy intensity of i industry (Ii) and the production proportion of i industry (Si).
When time changes from the standard (0) to comparison time (t), the change in energy intensity is as follows:
Equation (A1) is assumed to be a continuous function to analyze each factor’s impact on changes in energy intensity, and the differentiation and approximation is conducted as follows, in Equation (A3):
The residual is introduced in the approximation process, and the change in energy intensity is then decomposed into the change in each factor and residual.
As the Laspeyres and Paasche methods use fixed weights, they may be applied when the sources or weighted value data are insufficient, because these methods are intuitive and simply calculated. Sun (1999) [51] applied the “jointly created and equally distributed” principle to a decomposition analysis, which improved its accuracy and reliability. Ang, Zhang, and Choi (1998) [52] also devised the Logarithmic Mean Divisia Index (LMDI) using not the arithmetic mean, but the logarithmic mean-weighted value, to remove unexplained residuals:
Unlike the Laspeyres and Paasche methodologies, LMDI removes the unexplained residuals, satisfying the time and factor reversal tests. Moreover, the ease in interpreting the results and its convenience have made LMDI the most widely used approach in this field.
Appendix B. Linkage between the Unclassified IPC Codes and the Technology Field of FOS Concordance

Table A1.
Description of the unclassified IPC codes and linkage to the technology field of FOS concordance.
Table A1.
Description of the unclassified IPC codes and linkage to the technology field of FOS concordance.
| Code | Unclassified Code | Description of Code | Established Version or Date | Technology Field of FOS |
|---|---|---|---|---|
| A | A01P | BIOCIDAL, PEST REPELLENT, PEST ATTRACTANT OR PLANT GROWTH REGULATORY ACTIVITY OF CHEMICAL COMPOUNDS OR PREPARATIONS | Version 8 | 11 |
| A61Q | SPECIFIC USE OF COSMETICS OR SIMILAR TOILET PREPARATIONS | Version 8 | 13 | |
| B | B29K | INDEXING SCHEME ASSOCIATED WITH SUBCLASSES B29B, B29C OR B29D, RELATING TO MOULDING MATERIALS OR TO MATERIALS FOR REINFORCEMENTS, FILLERS OR PREFORMED PARTS, e.g., INSERTS | Version 4 | 17 |
| B29L | INDEXING SCHEME ASSOCIATED WITH SUBCLASS B29C, RELATING TO PARTICULAR ARTICLES | Version 4 | 17 | |
| B60W | CONJOINT CONTROL OF VEHICLE SUB-UNITS OF DIFFERENT TYPES OR FUNCTIONS; CONTROL SYSTEMS SPECIALLY ADAPTED FOR HYBRID VEHICLES; ROAD VEHICLE DRIVE CONTROL SYSTEMS FOR PURPOSES NOT RELATED TO THE CONTROL OF A PARTICULAR SUB-UNIT | Version 8 | 42 | |
| B82Y | SPECIFIC USES OR APPLICATIONS OF NANO-STRUCTURES; MEASUREMENT OR ANALYSIS OF NANO-STRUCTURES; MANUFACTURE OR TREATMENT OF NANO-STRUCTURES | 2011. 01 | 20 | |
| C | C07M | INDEXING SCHEME ASSOCIATED WITH SUBCLASSES C07B TO C07K, RELATING TO SPECIFIC PROPERTIES OF ORGANIC COMPOUNDS | Version 6 | 10 |
| C10N | INDEXING SCHEME ASSOCIATED WITH SUBCLASS C10M | Version 4 | 15 | |
| C12R | INDEXING SCHEME ASSOCIATED WITH SUBCLASSES C12C-C12Q, RELATING TO MICRO-ORGANISMS | Version 3 | 13 | |
| C13B | PRODUCTION OF SUCROSE; APPARATUS SPECIALLY ADAPTED THEREFORE | 2011. 01 | 25 | |
| C22K | - | - | ||
| C40B | COMBINATORIAL CHEMISTRY; LIBRARIES, e.g., CHEMICAL LIBRARIES, IN SILICO LIBRARIES | Version 8 | 15 | |
| F | F21W | INDEXING SCHEME ASSOCIATED WITH SUBCLASSES F21L, F21S and F21V, RELATING TO USES OR APPLICATIONS OF LIGHTING DEVICES OR SYSTEMS | Version 7 | 32 |
| F21Y | INDEXING SCHEME ASSOCIATED WITH SUBCLASSES F21L, F21S and F21V, RELATING TO THE FORM OF THE LIGHT SOURCES | Version 7 | 32 | |
| G | G01Q | SCANNING-PROBE TECHNIQUES OR APPARATUS; APPLICATIONS OF SCANNING-PROBE TECHNIQUES, e.g., SCANNING-PROBE MICROSCOPY | 2010. 01 | 38 |
| G06Q | DATA PROCESSING SYSTEMS OR METHODS, SPECIALLY ADAPTED FOR ADMINISTRATIVE, COMMERCIAL, FINANCIAL, MANAGERIAL, SUPERVISORY OR FORECASTING PURPOSES; SYSTEMS OR METHODS SPECIALLY ADAPTED FOR ADMINISTRATIVE, COMMERCIAL, FINANCIAL, MANAGERIAL, SUPERVISORY OR FORECASTING PURPOSES, NOT OTHERWISE PROVIDED FOR | Version 8 | 28 | |
| H | H04W | WIRELESS COMMUNICATION NETWORKS | 2009. 01 | 35 |
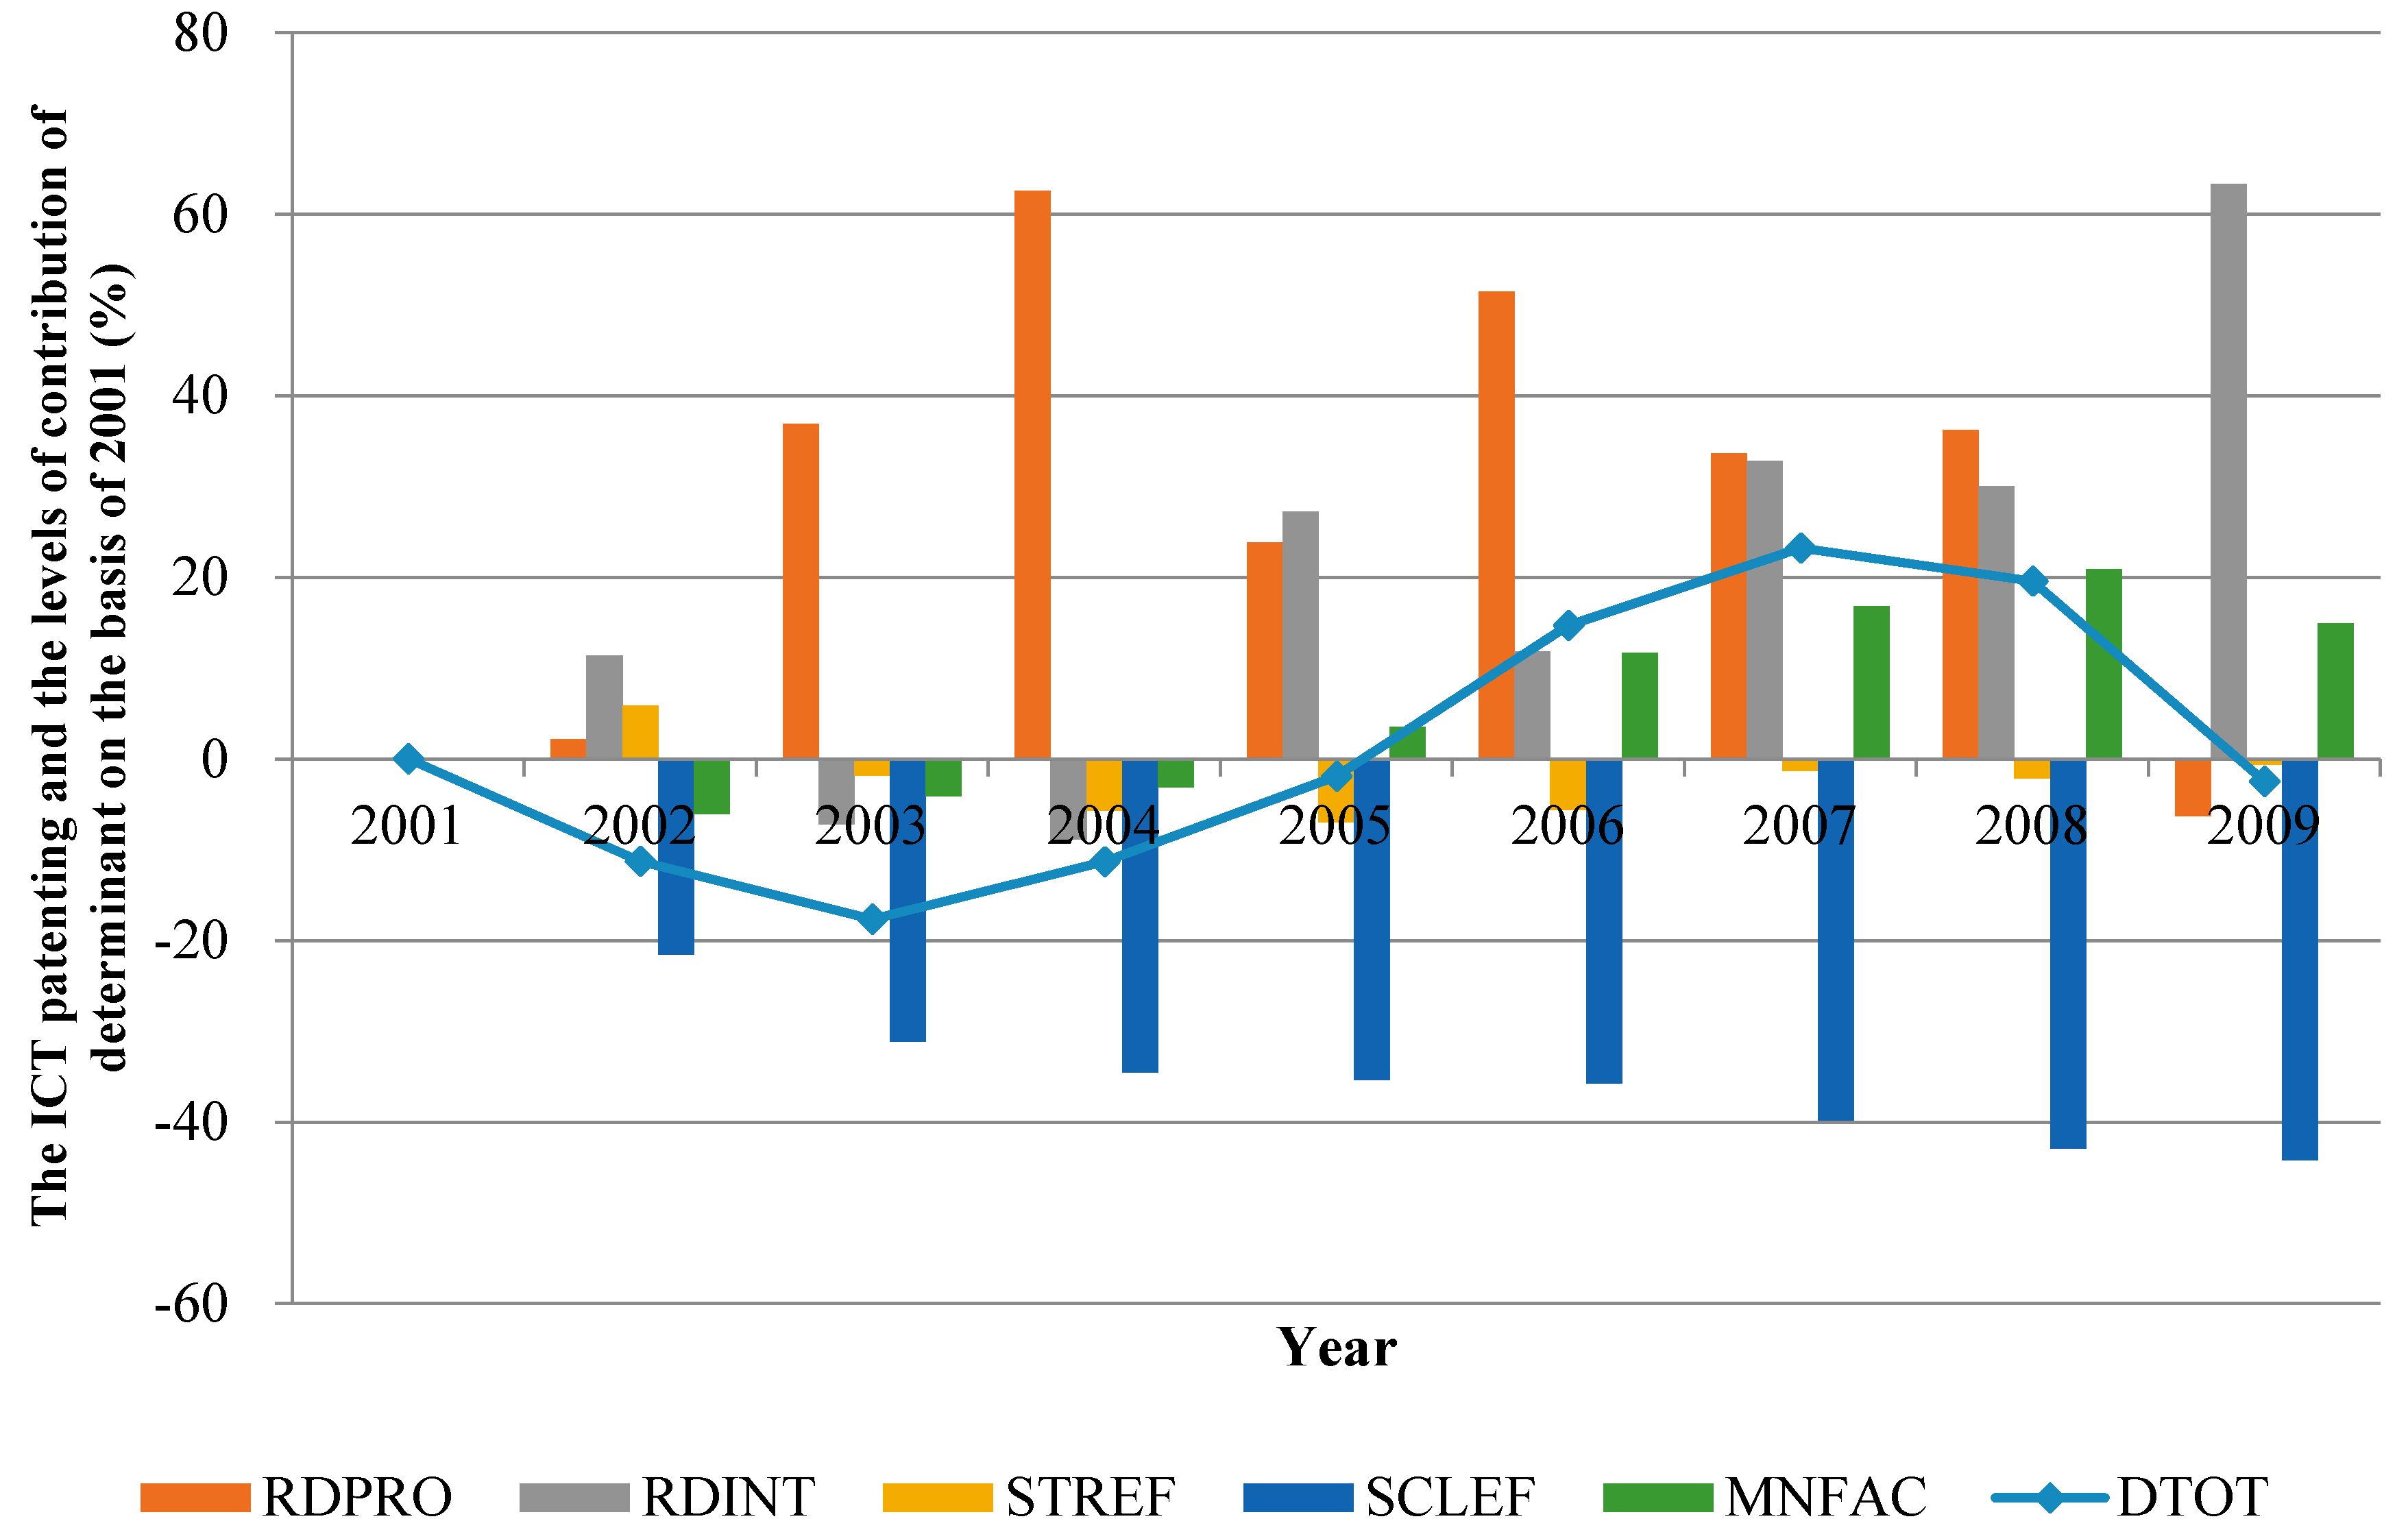
Appendix C. Each Country’s Time-Series Trend
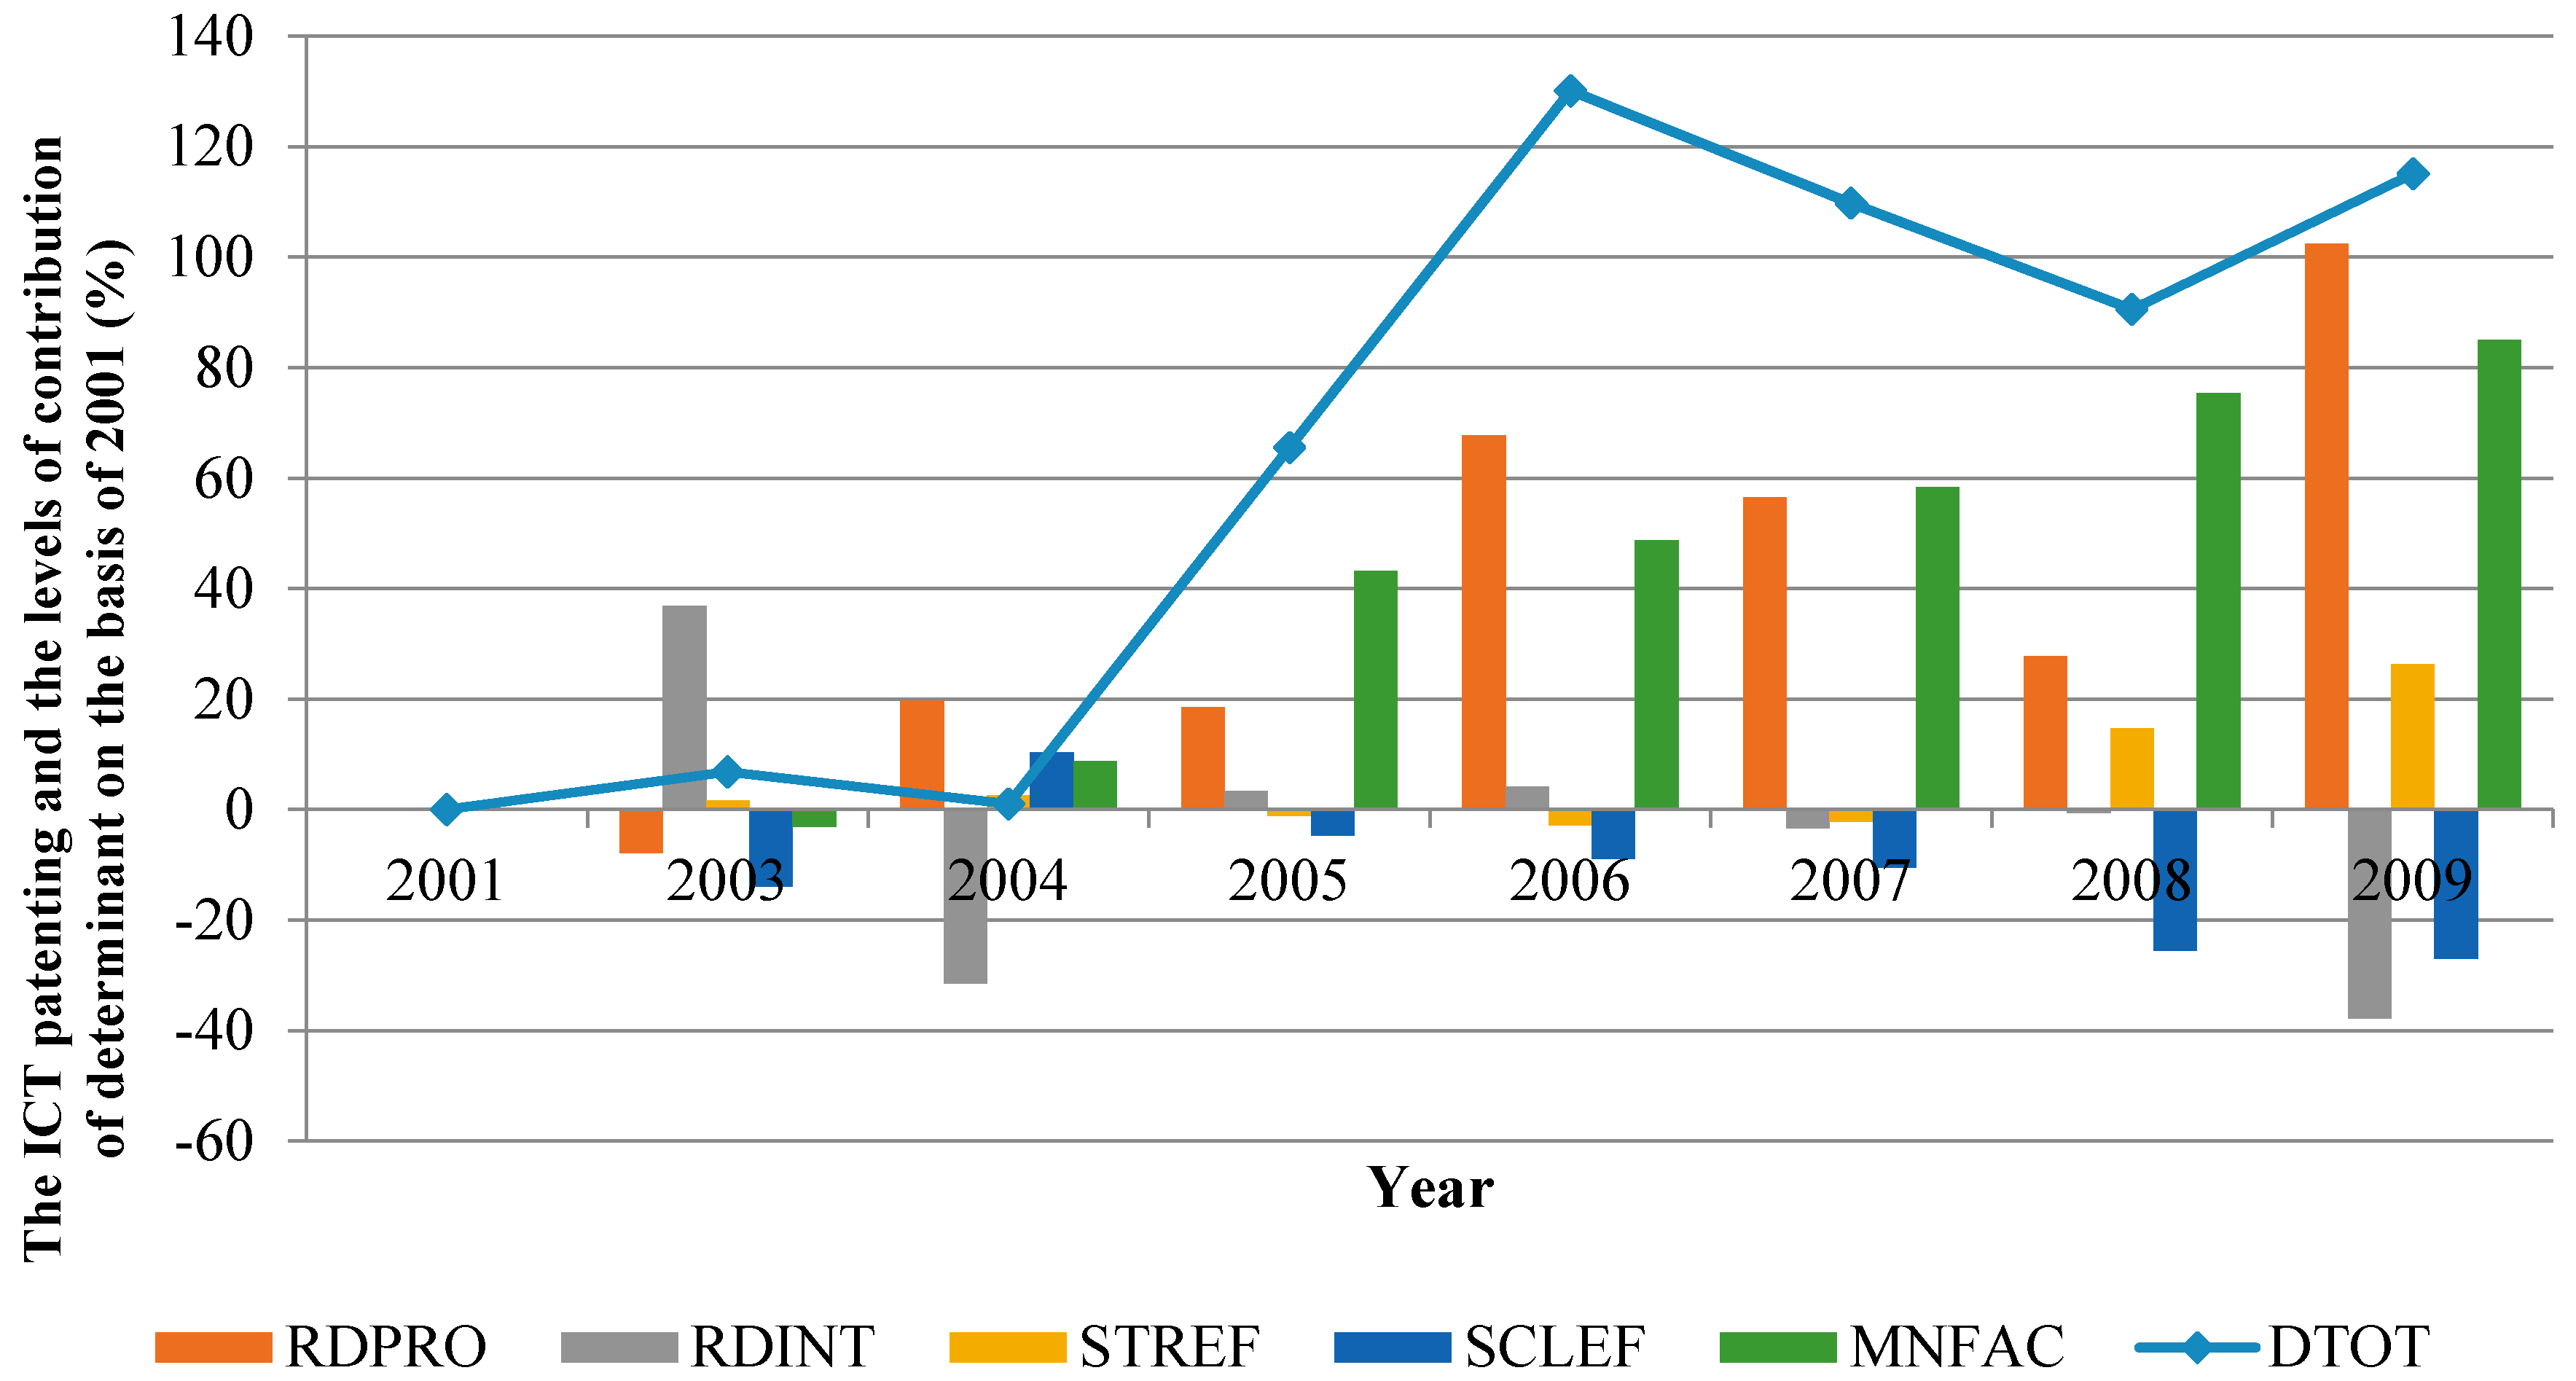
Figure A1.
Time-serial decomposition result of ICT patenting in Belgium.

Figure A2.
Time-serial decomposition results of ICT patenting in the Czech Republic.
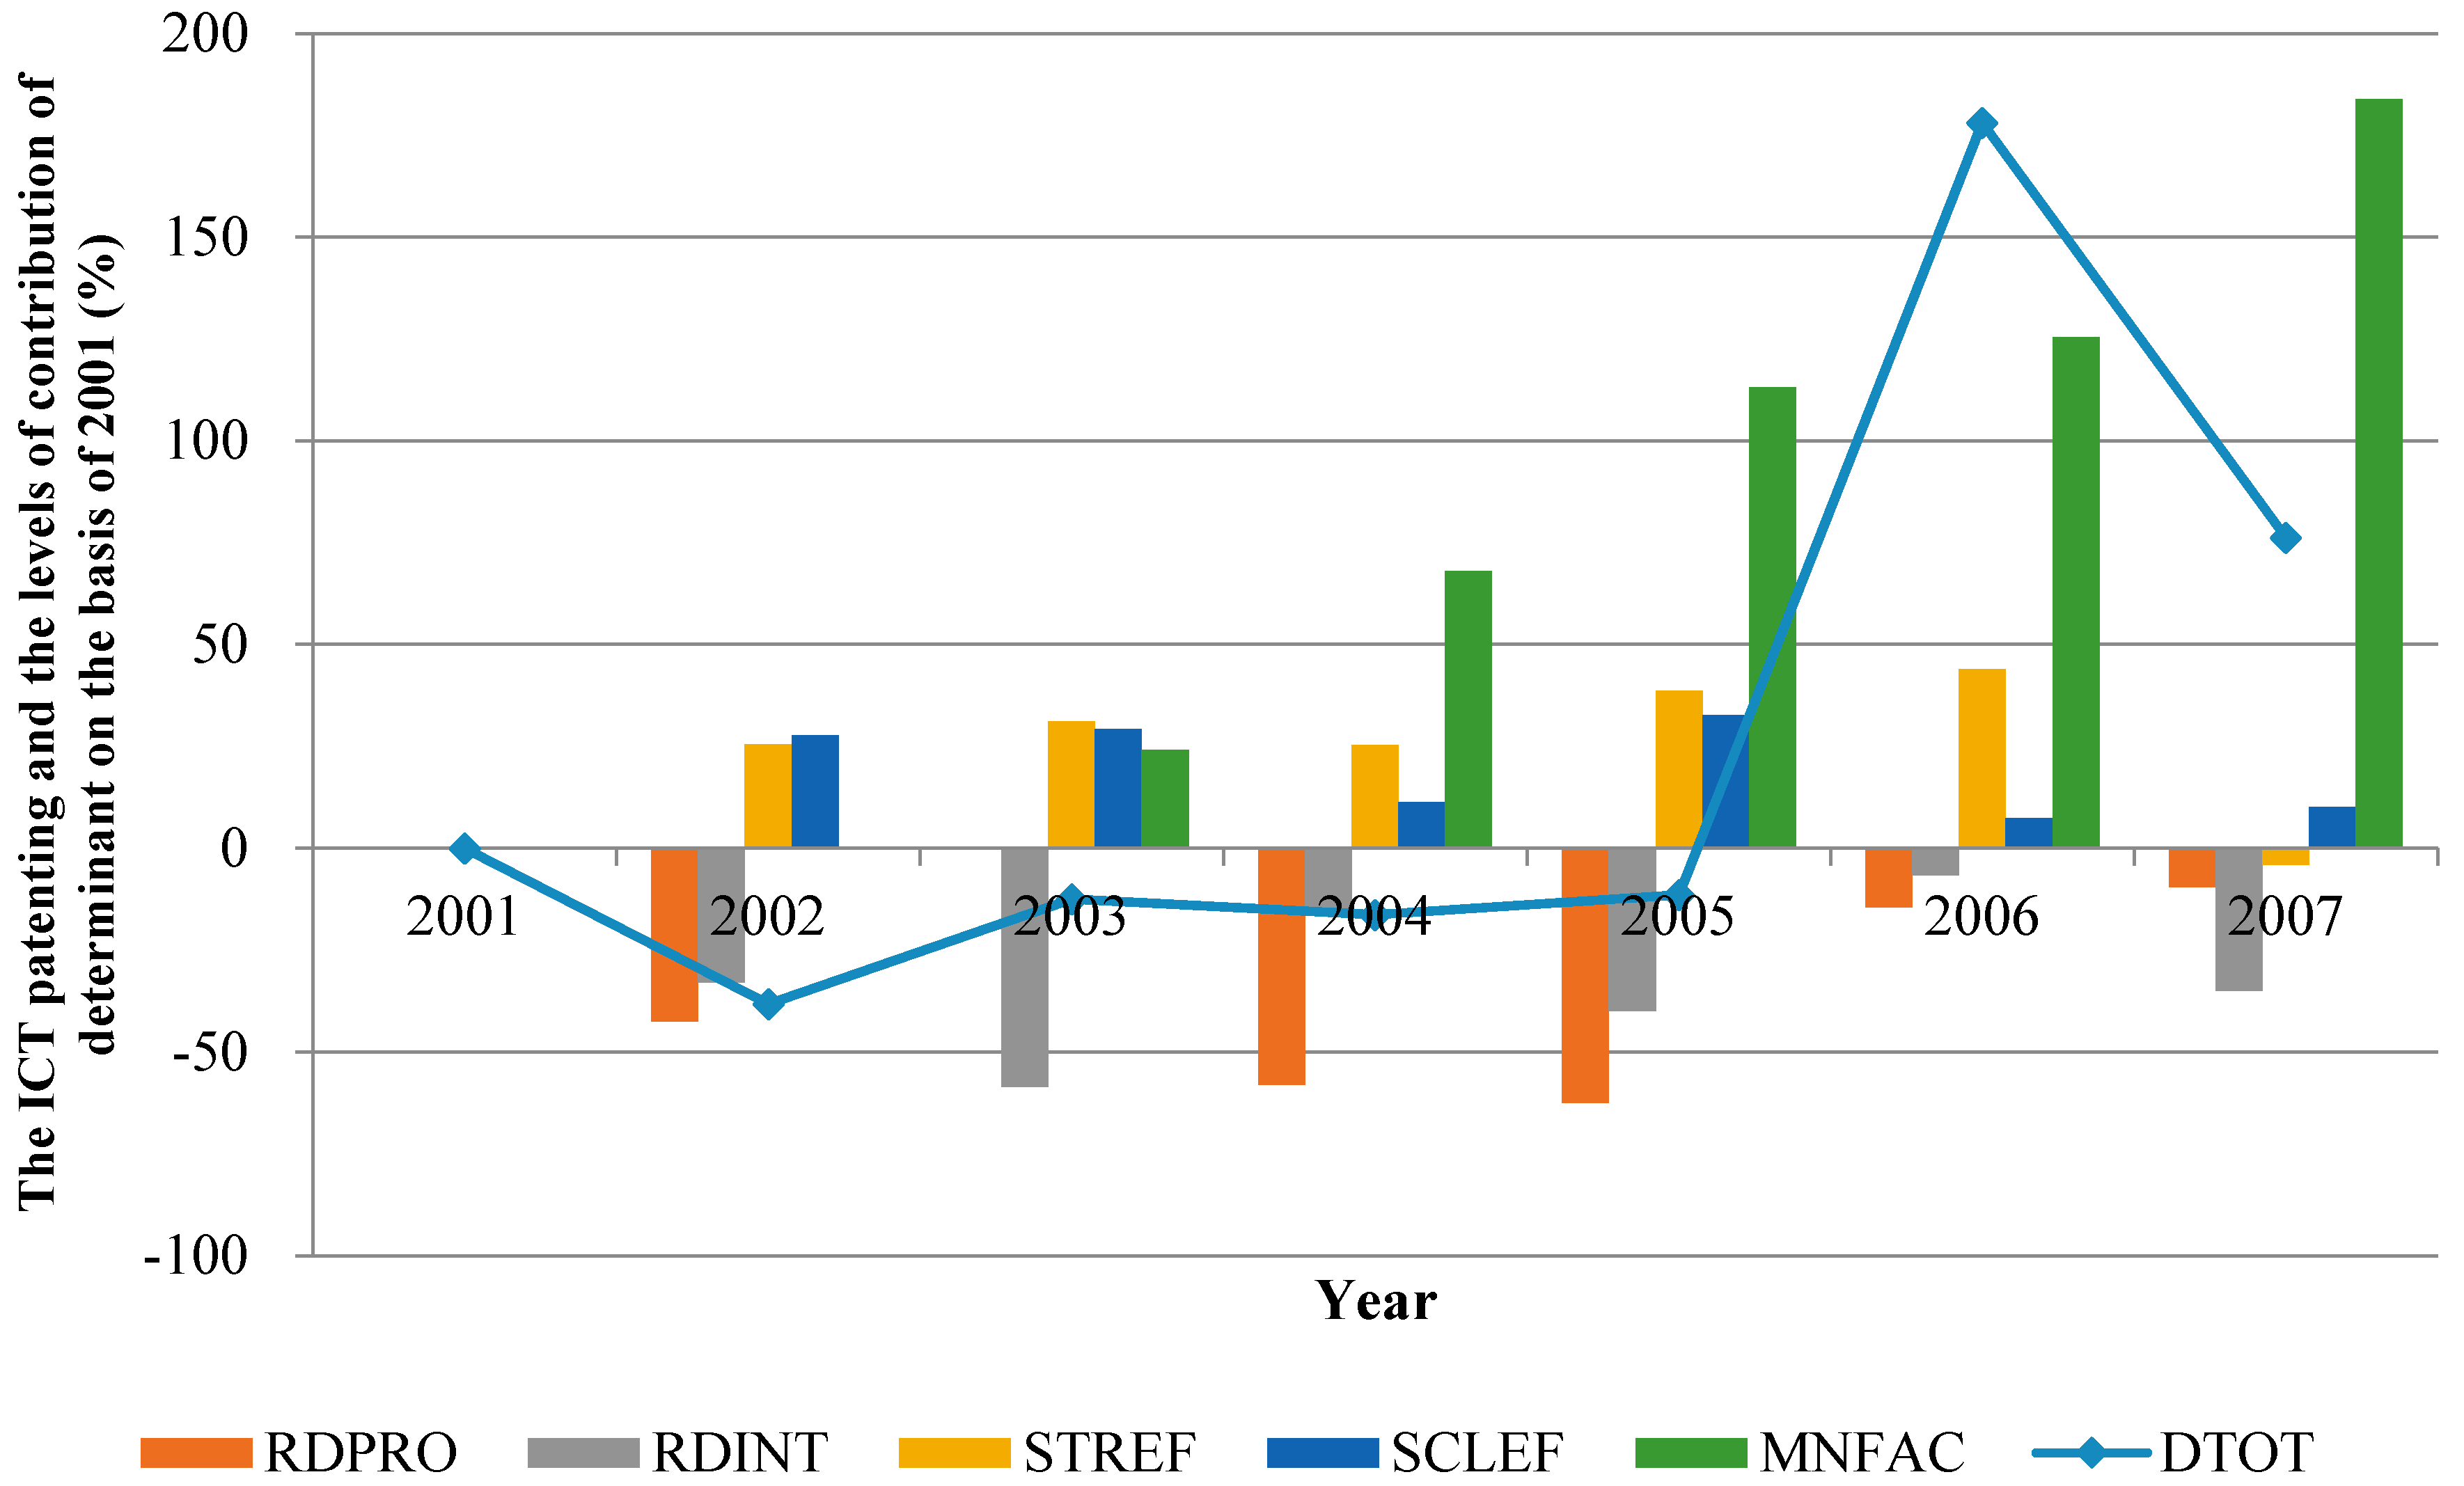
Figure A3.
Time-serial decomposition results of ICT patenting in France.
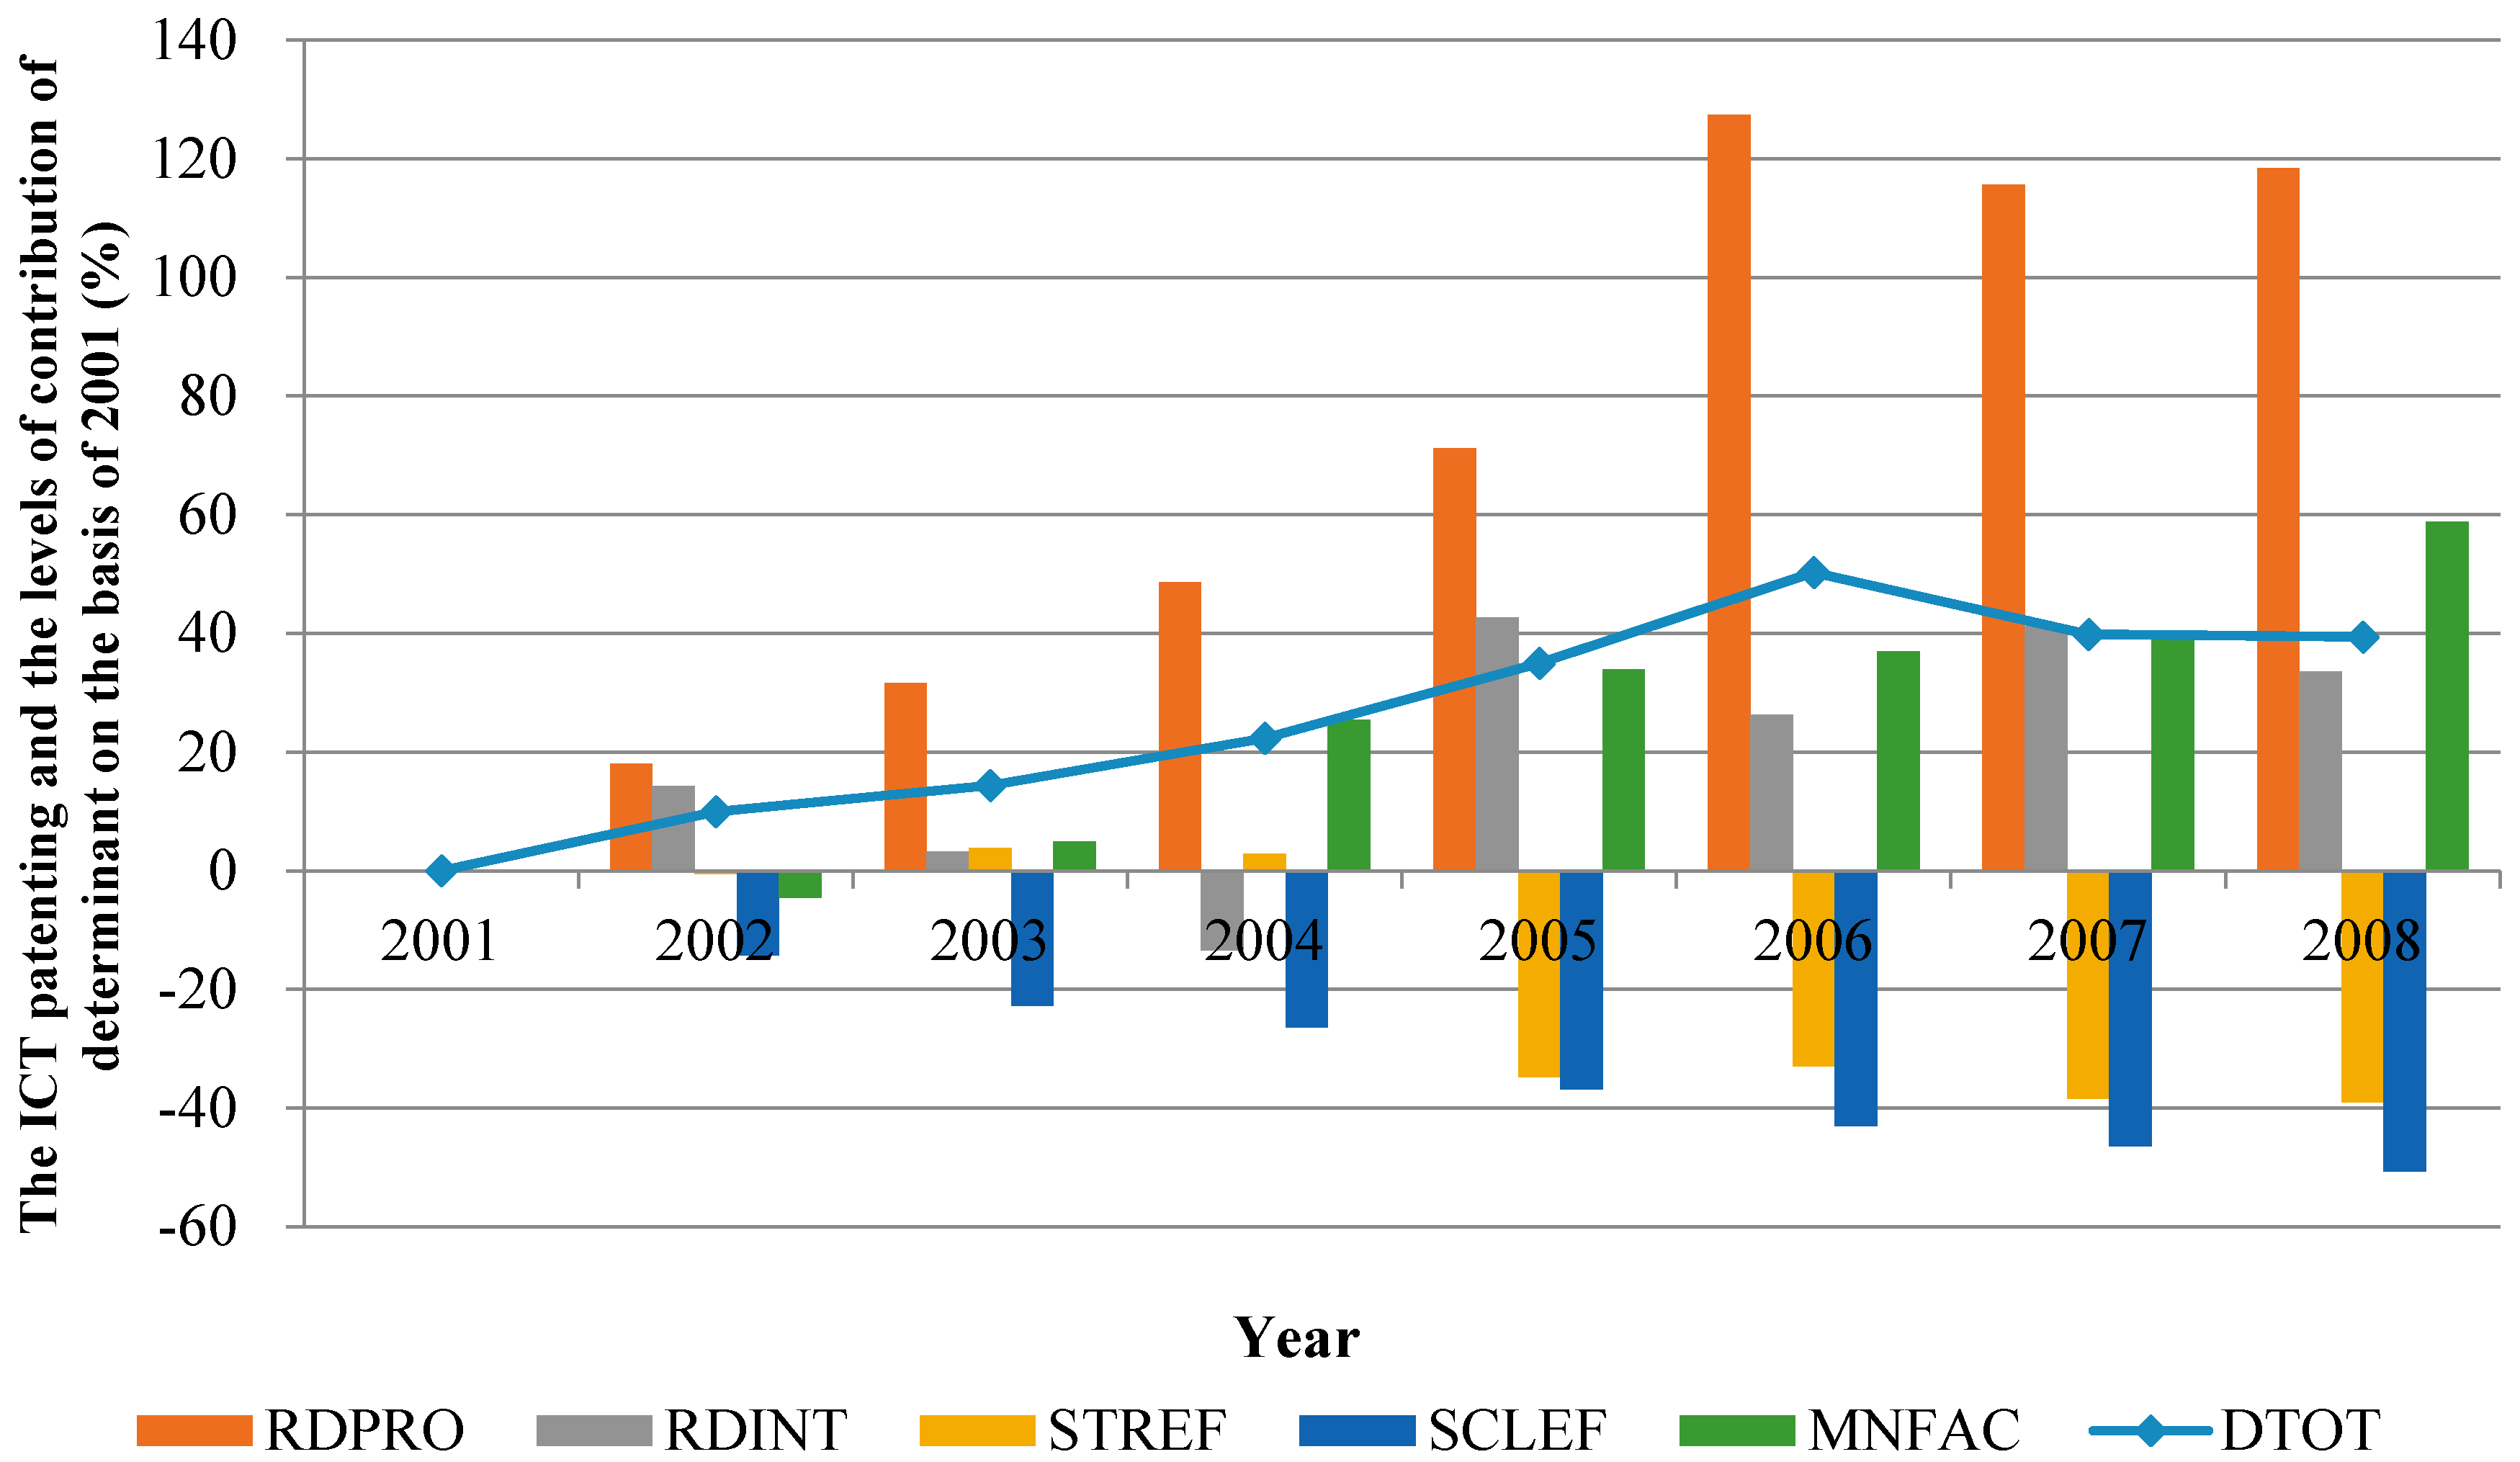
Figure A4.
Time-serial decomposition results of ICT patenting in Germany.

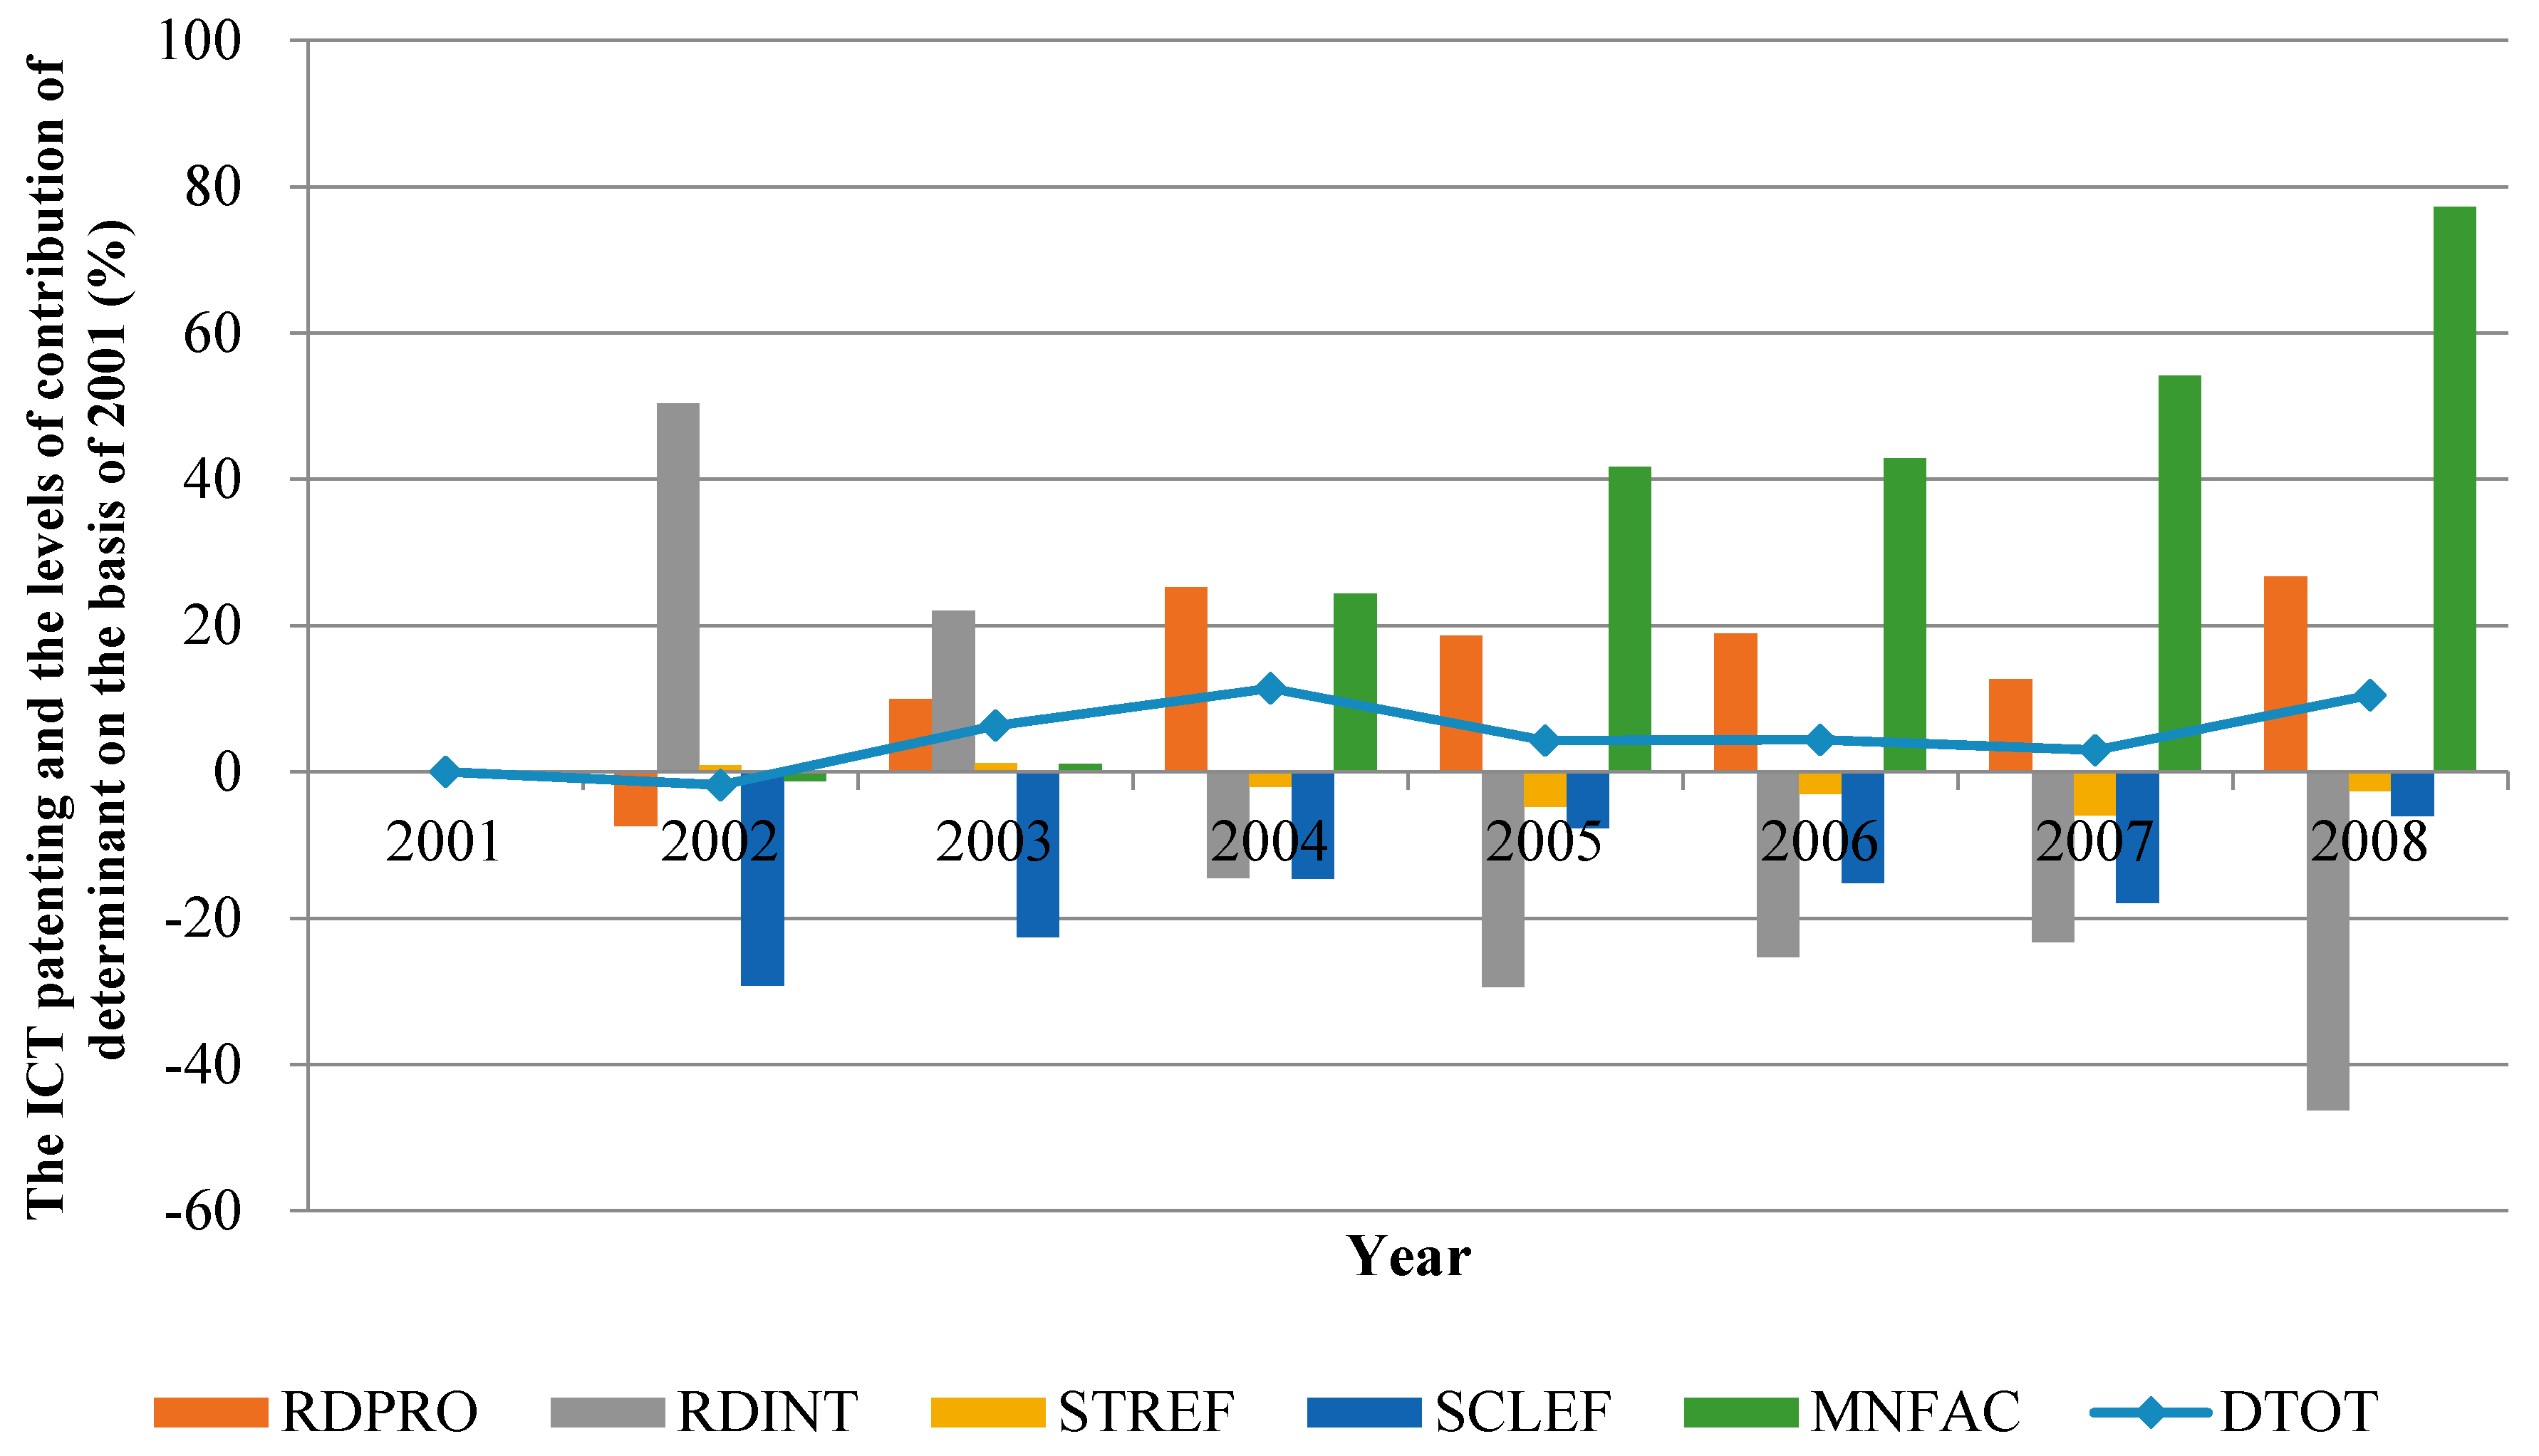
Figure A5.
Time-serial decomposition result of ICT patenting in Italy.
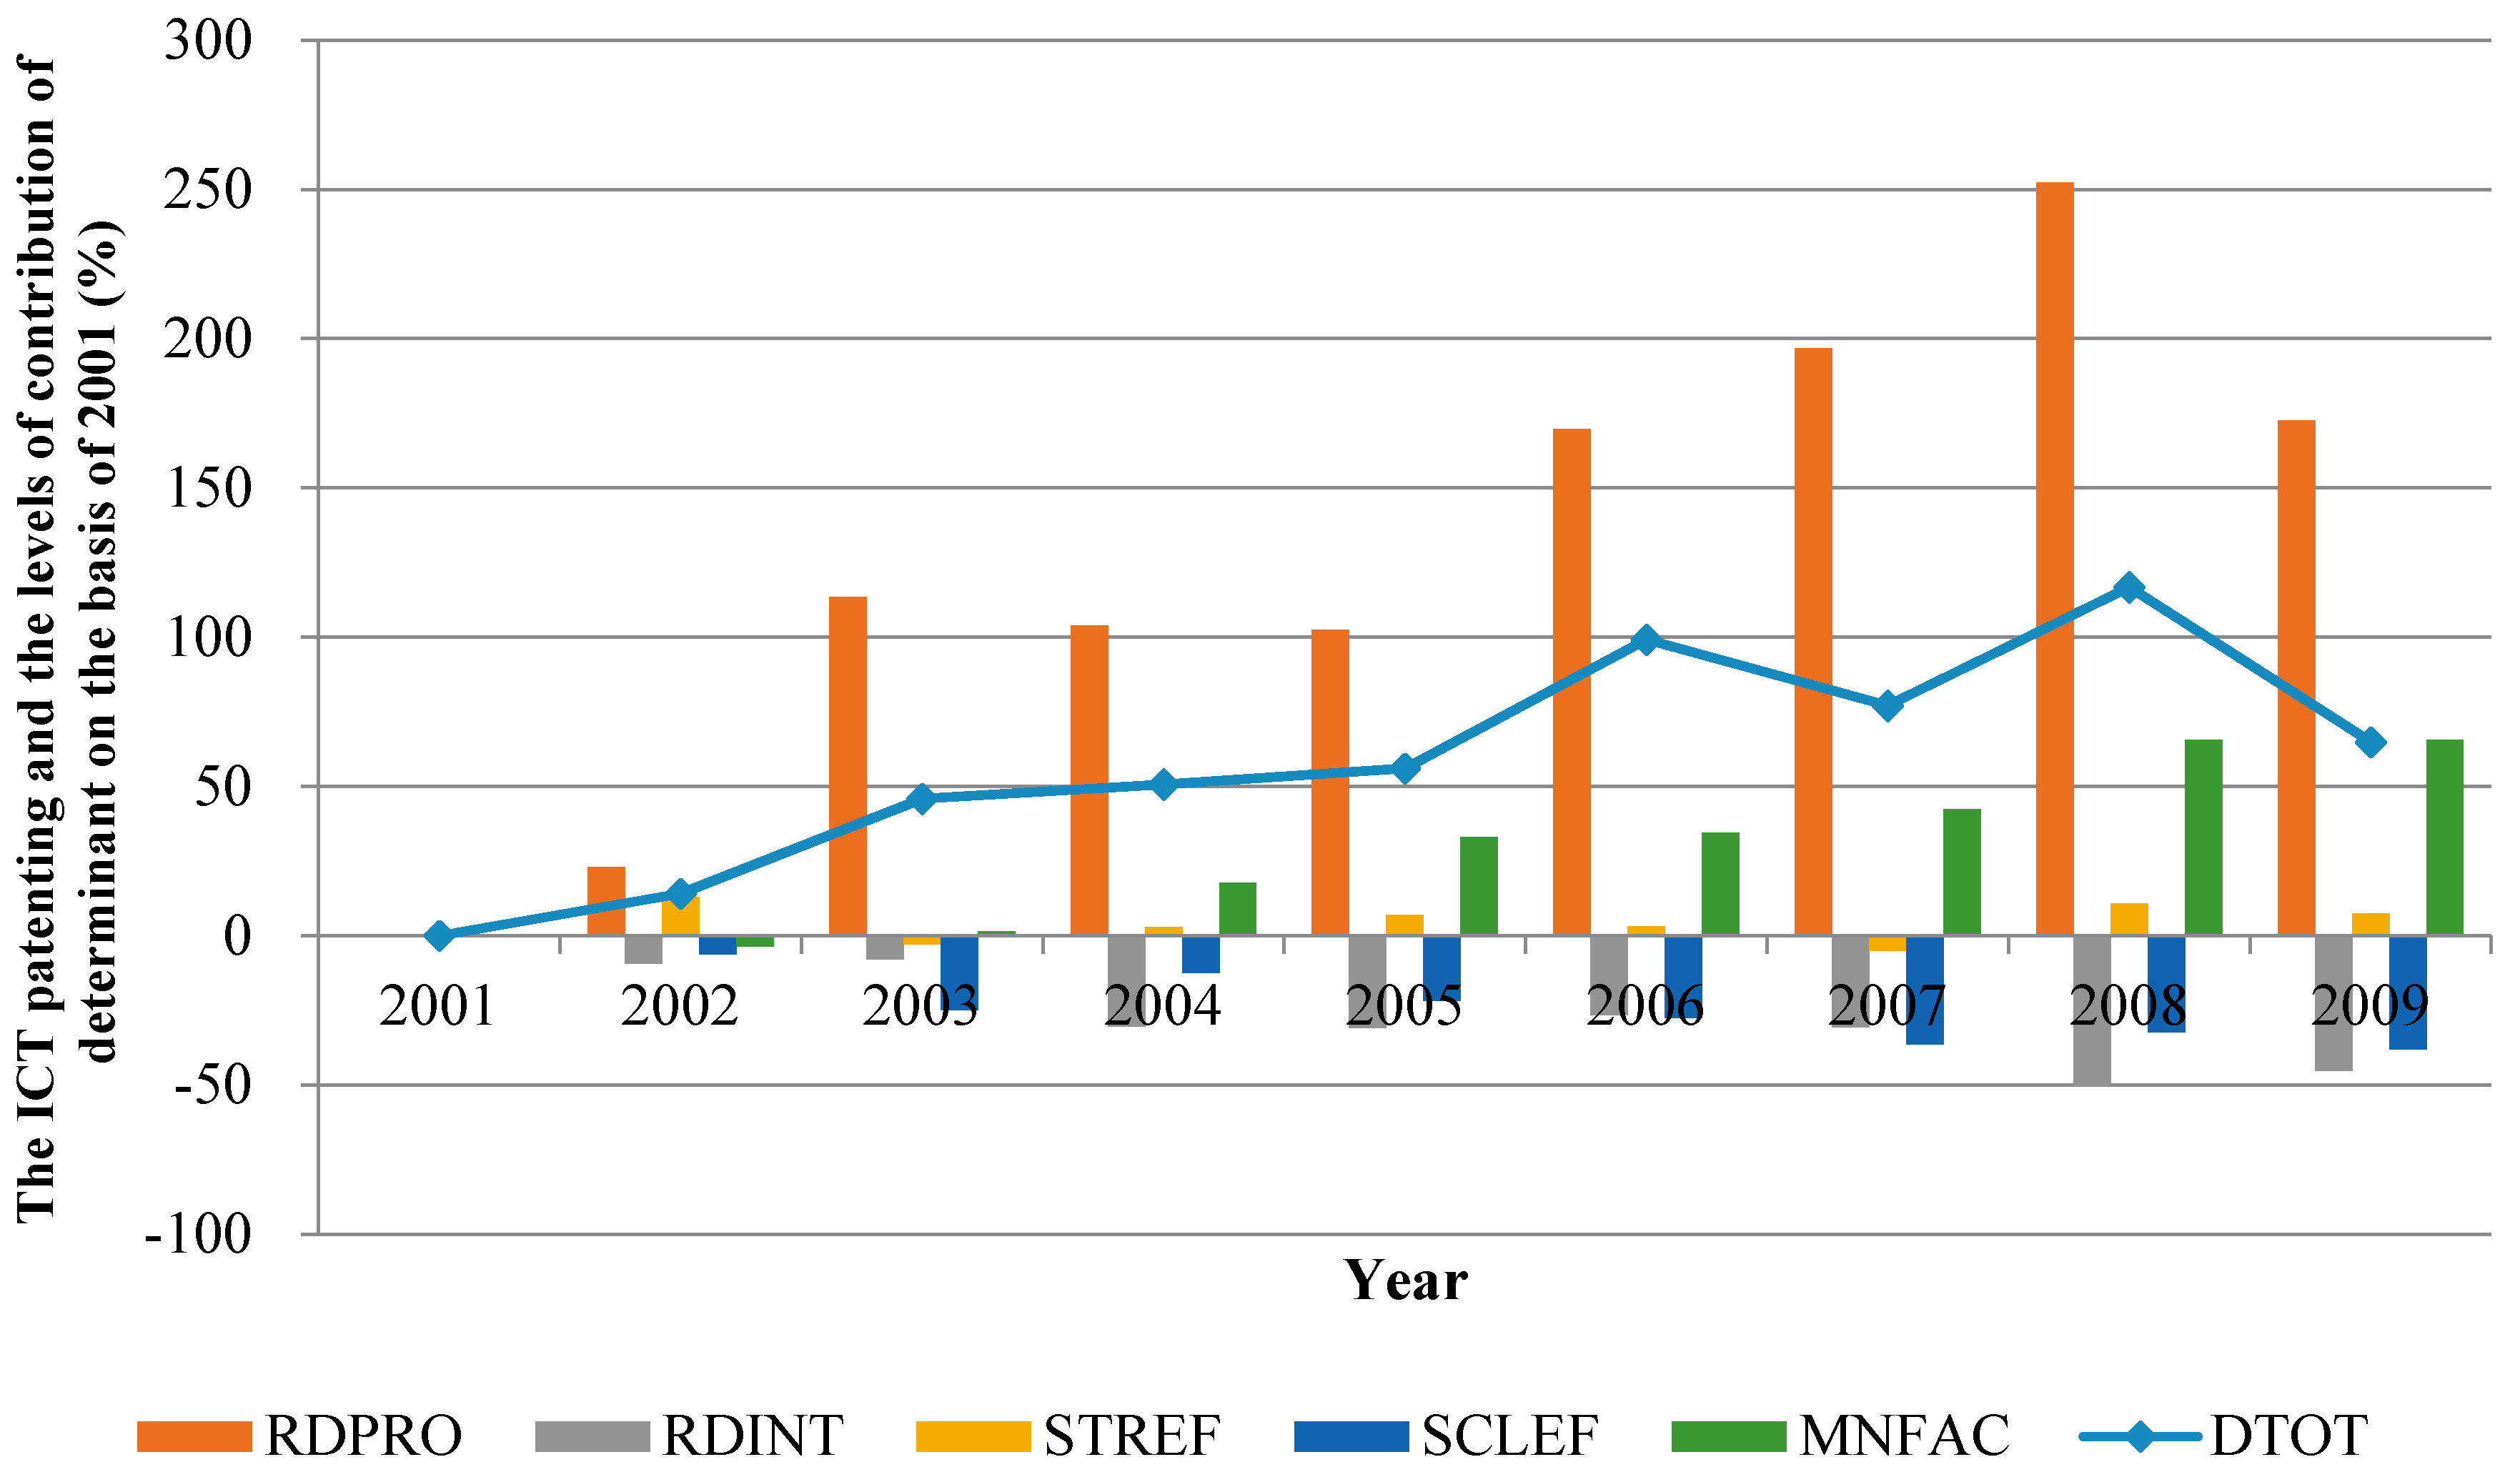
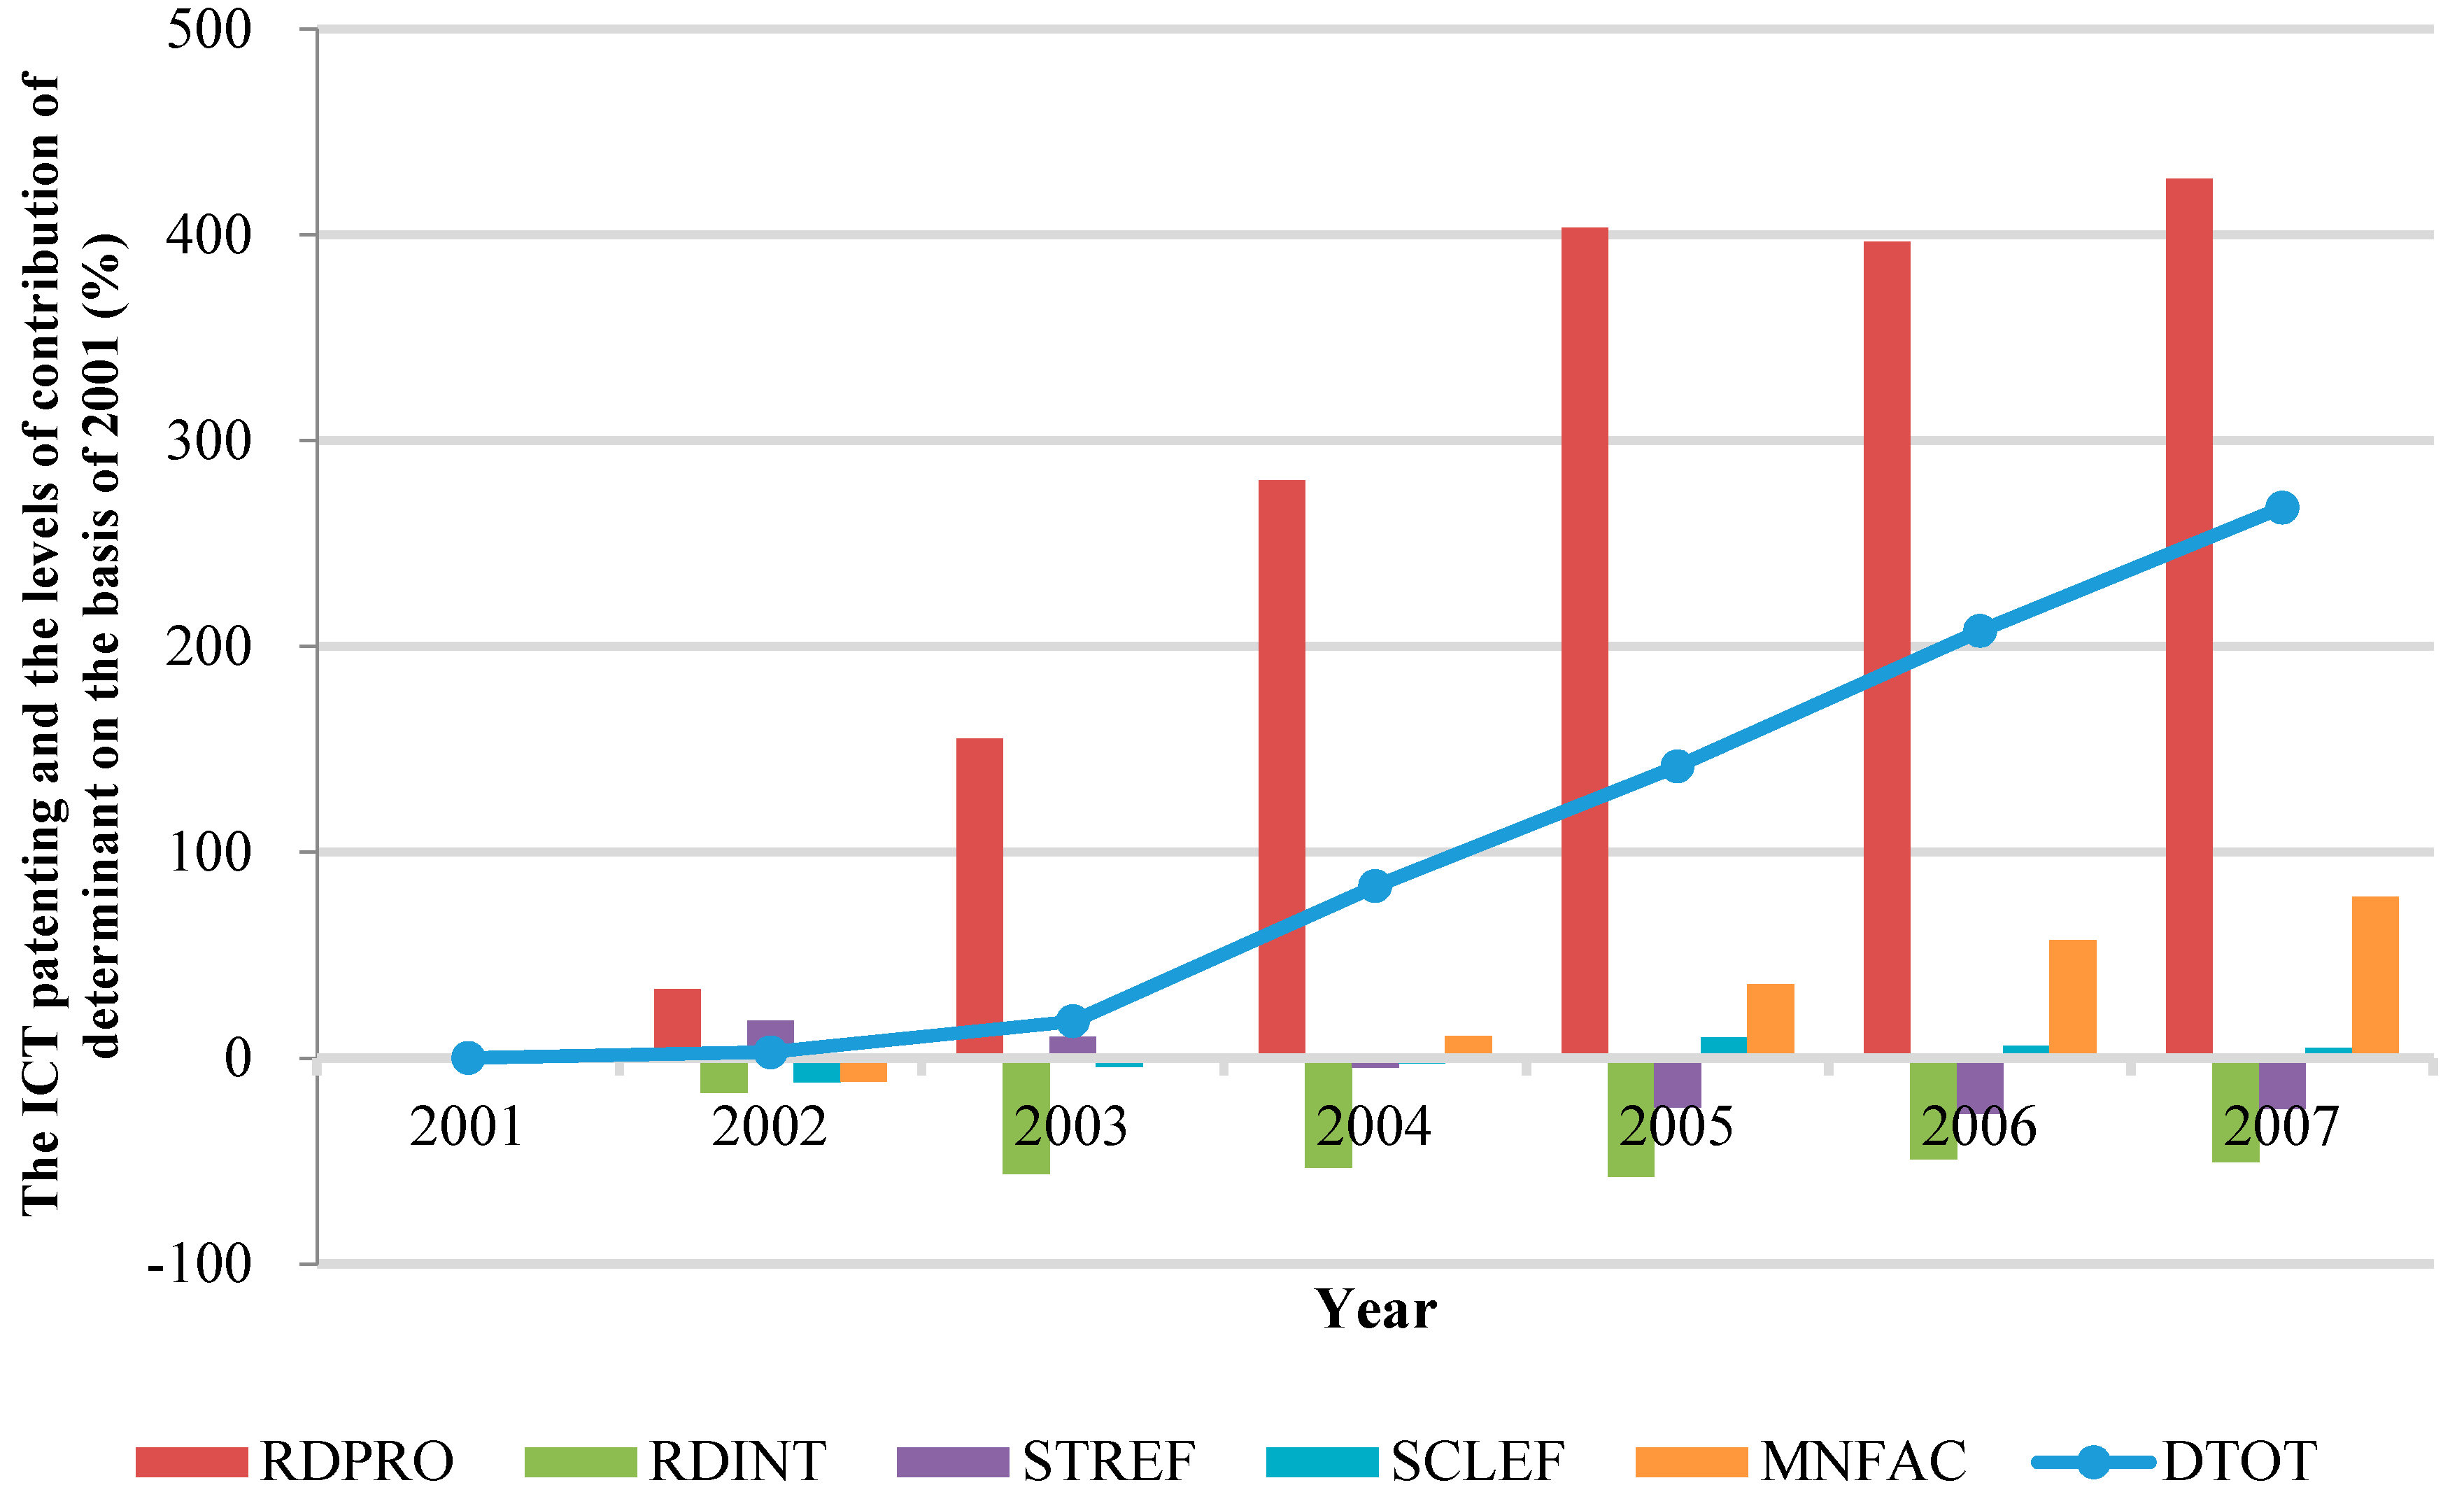
Figure A6.
Time-serial decomposition results of ICT patenting in Korea.

Figure A7.
Time-serial decomposition results of ICT patenting in Spain.
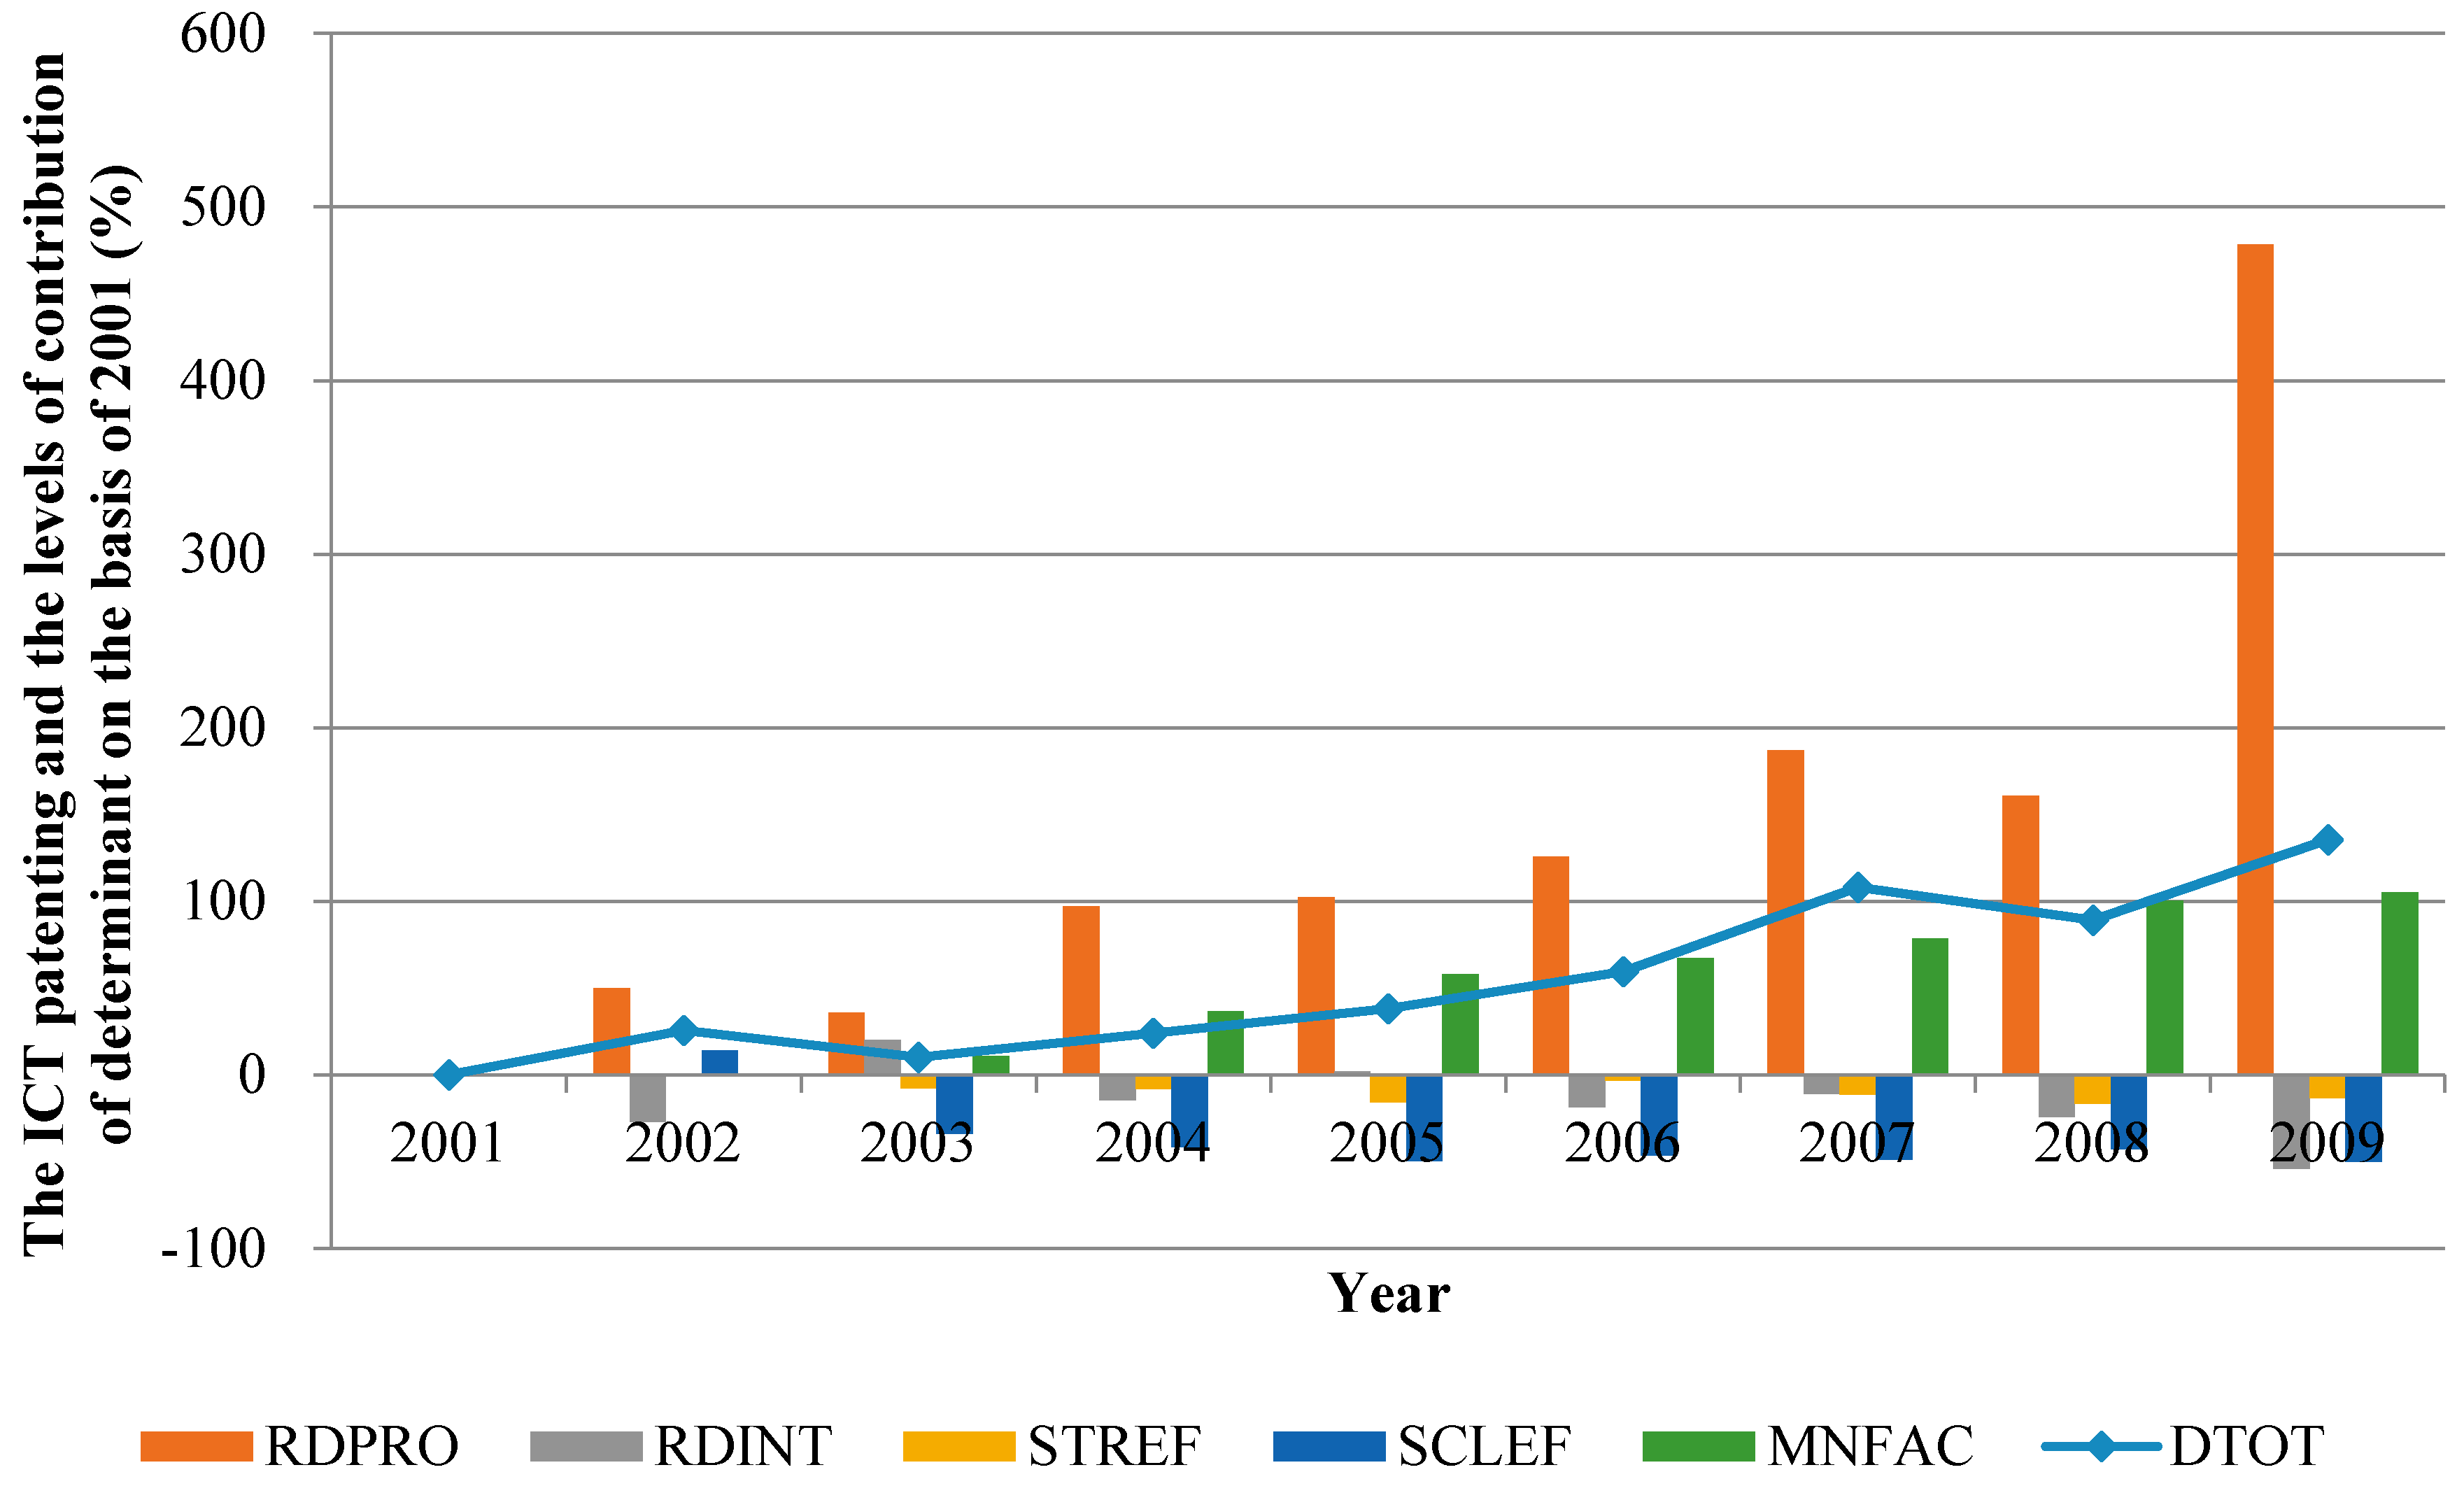
Figure A8.
Time-serial decomposition results of ICT patenting in the United States.

Appendix D. Enforcement of Patent Protection
Table A2.
Change in the strength of patent protection system
| Year | 2000 | 2005 | Average | |
|---|---|---|---|---|
| Country | ||||
| Belgium | 4.67 | 4.67 | 4.67 | |
| Czech Republic | 3.21 | 4.33 | 3.77 | |
| France | 4.67 | 4.67 | 4.67 | |
| Germany | 4.5 | 4.5 | 4.5 | |
| Italy | 4.67 | 4.67 | 4.67 | |
| Korea | 4.13 | 4.33 | 4.23 | |
| Spain | 4.33 | 4.33 | 4.33 | |
| United States | 4.88 | 4.88 | 4.88 | |
Source: Park (2008) [64].
References
- Archibugi, D. Patenting as an indicator of technological innovation: A review. Sci. Public Policy 1992, 19, 357–368. [Google Scholar]
- Nadiri, M.I. Innovations and Technological Spillovers; NBER Working Paper #4423; National Bureau of Economic Research: New York, NY, USA, 1993. [Google Scholar]
- Coombs, R.; Narandren, P.; Richards, A. A literature-based innovation output indicator. Res. Policy 1996, 25, 403–413. [Google Scholar] [CrossRef]
- Jaffe, A.B. Technological opportunity and spillovers of R&D: Evidence from firms’ patents, profit, and market value. Am. Econ. Rev. 1986, 76, 984–1001. [Google Scholar]
- Griliches, Z. Patent statistics as economic indicators: A survey. J. Econ. Lit. 1990, 28, 1661–1707. [Google Scholar]
- Porter, M.E.; Stern, S. Measuring the “Ideas” Production Function: Evidence from International Patent Output; NBER Working Paper No. 7891; National Bureau of Economic Research: Cambridge, MA, USA, 2000. [Google Scholar] [CrossRef]
- Jaffe, A.; Trajtenberg, M. Patents, Citations and Innovations; The MIT Press: Cambridge, MA, USA, 2002. [Google Scholar]
- Popp, D. Lessons from patents: Using patents to measure technological change in environmental models. Ecol. Econ. 2005, 54, 209–226. [Google Scholar] [CrossRef]
- Johnstone, N.; Haščič, I.; Popp, D. Renewable Energy Policies and Technological Innovation: Evidence Based on Patent Counts. Environ. Resour. Econ. 2010, 45, 133–155. [Google Scholar] [CrossRef]
- Kim, K.; Kim, Y. Role of policy ininnovation and international trade of renewable energy technology: Empirical study of solar PV and wind power technology. Renew. Sustain. Energy Rev. 2015, 44, 717–727. [Google Scholar] [CrossRef]
- Kim, K.; Heo, E.; Kim, Y. Dynamic Policy Impacts on a Technological-Change System of Renewable Energy: An Empirical Analysis. Environ. Resour. Econ. 2017, 66, 205–236. [Google Scholar] [CrossRef]
- Scherer, F.M. Interindustry Technology Flows and Productivity Growth. Rev. Econ. Stat. 1982, 64, 627–634. [Google Scholar] [CrossRef]
- Scherer, F.M. Using Linked Patent and R&D Data to Measure Interindustry Technology Flows. In R&D, Patents and Productivity; University of Chicago Press: Chicago, IL, USA, 1984; pp. 417–464. Available online: http://www.nber.org/chapters/c10061 (accessed on 26 October 2016).
- Jaffe, A. Real Effects of Academic Research. Am. Econ. Rev. 1989, 79, 957–970. [Google Scholar]
- Lanjouw, J.O.; Schankerman, M. Patent Quality and Research Productivity: Measuring Innovation with Multiple Indicators. Econ. J. 2004, 114, 441–465. [Google Scholar] [CrossRef]
- Schmookler, J. Invention and Economic Growth; Harvard University Press: Cambridge, MA, USA, 1966. [Google Scholar]
- Binswanger, H. A microeconomic approach to induced innovation. Econ. J. 1974, 84, 940–958. [Google Scholar] [CrossRef]
- Teece, D.J. Firm organization, industrial structure, and technological innovation. J. Econ. Behav. Organ. 1966, 31, 193–224. [Google Scholar] [CrossRef]
- Scherer, F.M.; Harhoff, D. Technology policy for a world of skew-distributed outcomes. Res. Policy 2000, 29, 559–566. [Google Scholar] [CrossRef]
- Kwaku, A.G. Differential Potency of Factors Affecting Innovation Performance in Manufacturing and Services Firms in Australia. J. Prod. Innov. Manag. 2003, 13, 35–52. [Google Scholar]
- Jaumotte, F.; Pain, N. From Ideas to Development: The Determinants of R&D and Patenting; OECD Economics Department Working Paper #457; ECO/WKP 44; OECD Publishing: Paris, France, 2005. [Google Scholar]
- Howarth, R.B.; Schipper, L.; Duerr, P.A.; Strøm, S. Manufacturing energy use in eight OECD countries: Decomposing the impacts of changes in output, industry structure and energy intensity. Energy Econ. 1991, 13, 135–142. [Google Scholar] [CrossRef]
- Torvanger, A. Manufacturing sector carbon dioxide emissions in OECD countries, 1973–87: A Divisia index decomposition to changes in fuel mix, emissions coefficient industry structure energy intensities and international structure. Energy Econ. 1991, 13, 168–186. [Google Scholar] [CrossRef]
- Ang, B.W. Decomposition methodology in industrial energy demand analysis. Energy 1995, 20, 1081–1095. [Google Scholar] [CrossRef]
- Lin, S.J.; Chang, T.C. Decomposition of SO2, NOx and CO2 emissions from energy use of major economic sector in Taiwan. Energy J. 1996, 17, 1–17. [Google Scholar] [CrossRef]
- Greening, L.A.; Davis, W.B.; Schipper, L. Decomposition of aggregate carbon intensity for the manufacturing sector: Comparison of declining trends from 10 OECD countries for the period 1971–1991. Energy Econ. 1998, 20, 43–65. [Google Scholar] [CrossRef]
- Kim, Y.; Worrell, E. International comparison of CO2 emission trends in the iron and steel industry. Energy Policy 2002, 30, 827–838. [Google Scholar] [CrossRef]
- Paul, S.; Bhattacharya, R.N. CO2 emission from energy use in India: A decomposition analysis. Energy Policy 2004, 32, 585–593. [Google Scholar] [CrossRef]
- Nag, B.; Parikh, J.K. Carbon emission coefficient of power consumption in India: Baseline determination from the demand side. Energy Policy 2005, 33, 777–786. [Google Scholar] [CrossRef]
- Lise, W. Decomposition of CO2 emissions over 1980–2003 in Turkey. Energy Policy 2006, 34, 1841–1852. [Google Scholar] [CrossRef]
- Kalirajan, K.P.; Obwona, M.B.; Zhao, S. A Decomposition of Total Factor Productivity Growth: The Case of Chinese Agricultural Growth before and after Reforms. Am. J. Agric. Econ. 1996, 78, 331–338. [Google Scholar] [CrossRef]
- Oosterhaven, J.; Hoen, A.R. Preferences, technology, trade and real income changes in the European Union: An intercountry decomposition analysis for 1975–1985. Ann. Reg. Sci. 1998, 32, 505–524. [Google Scholar] [CrossRef]
- Kim, J.; Marschke, G. Accounting for the recent surge in U.S. patenting: Changes in R&D expenditures, patent yields, and the high tech sector. Econ. Innov. New Technol. 2004, 13, 543–558. [Google Scholar]
- Johnson, P. Differences in Regional Firm Formation Rates: A Decomposition Analysis. Entrep. Theory Pract. 2004, 28, 431–445. [Google Scholar] [CrossRef]
- Pietro, M.P.C.; Constantin, C.; Keith, S.; Alexander, T.; Mike, T. Does Europe perform too little corporate R&D? A comparison of EU and non-EU corporate R&D performance. Res. Policy 2010, 39, 523–536. [Google Scholar]
- Reinstaller, A.; Unterlass, F. Comparing business R&D across countries over time: A decomposition exercise using data for the EU27. Appl. Econ. Lett. 2012, 19, 1143–1148. [Google Scholar]
- Fujii, H. Decomposition analysis of green chemical technology inventions from 1971 to 2010 in Japan. J. Clean. Prod. 2016, 112, 4835–4843. [Google Scholar] [CrossRef]
- Fujii, H.; Managi, S. Research and development strategy for environmental technology in Japan: A comparative study of the private and public sectors. Technol. Forecast. Soc. Chang. 2016, 112, 293–302. [Google Scholar] [CrossRef]
- Fujii, H.; Yoshida, K.; Sugimura, K. Research and development strategy in biological technologies: Patent data analysis in Japanese manufacturing firms. Sustainability 2016, 8, 351. [Google Scholar] [CrossRef]
- Organization for Economic Cooperation and Development (OECD). Measuring the Information Economy; OECD: Paris, France, 2002. [Google Scholar]
- Schumpeter, J.A. Capitalism, Socialism and Democracy; McGraw-Hill: New York, NY, USA, 1942. [Google Scholar]
- Mansfield, E. The Economics of Technical Change; Norton: New York, NY, USA, 1968. [Google Scholar]
- Lundvall, B.A. National Systems of Innovation: Towards a Theory of Innovation and Interactive Learning; Pinter: London, UK, 1992. [Google Scholar]
- Nelson, R.R. National Systems of Innovation: A Comparative Study; Oxford University Press: Oxford, UK, 1993. [Google Scholar]
- Smith, K. The Systems Challenge to Innovation Policy. In Industrie und Glueck; Polt, W., Weber, B., Eds.; Paradigmenwechsel in der Industrie- und Technologiepolitik: Vienna, Austria, 1996. [Google Scholar]
- Freeman, C. The ‘National Innovation Systems’ in historical perspective. Camb. J. Econ. 1995, 19, 5–24. [Google Scholar]
- Organization for Economic Cooperation and Development (OECD). Managing National Innovation Systems; OECD: Paris, France, 1999. [Google Scholar]
- Popp, D. Pollution control innovations and the Clean Air Act of 1990. J. Policy Anal. Manag. 2003, 22, 641–660. [Google Scholar] [CrossRef]
- World Intellectual Property Organization (WIPO). World Intellectual Property Indicators; WIPO Economics & Statistics Series (WIPO Publication No. 941E); WIPO: Geneva, Switzerland, 2011. [Google Scholar]
- Cohen, W.M.; Levin, R.C.; Mowery, D.C. Firm Size and R&D Intensity: A Re-Examination; Working Paper No. 2205; National Bureau of Economic Research: New York, NY, USA, 1987. [Google Scholar]
- Sun, J.W. Decomposition of aggregate CO2 emissions in the OECD: 1960–1995. Energy J. 1999, 20, 147–155. [Google Scholar] [CrossRef]
- Ang, B.W.; Zhang, F.Q.; Choi, L.H. Factorizing changes in energy and environmental indicators through decomposition. Energy 1998, 23, 489–495. [Google Scholar] [CrossRef]
- Ang, B.W. The LMDI approach to decomposition analysis: A practical guide. Energy Policy 2005, 33, 867–871. [Google Scholar] [CrossRef]
- Cialani, C. Economic growth and environmental quality: An econometric and a decomposition analysis. Manag. Environ. Qual. Int. J. 2007, 18, 568–577. [Google Scholar] [CrossRef]
- Pakes, A.; Griliches, Z. Patents and R&D at the firm level: A first report. Econ. Lett. 1980, 5, 377–381. [Google Scholar]
- Hall, B.H.; Griliches, Z.; Hausman, J.A. Patents and R&D: Is There a Lag? Int. Econ. Rev. 1986, 27, 265–284. [Google Scholar]
- Evenson, R.; Putnam, J. The Yale-Canada patent Flow Concordance; Economic Growth Centre Working Paper; Yale University: New Haven, CT, USA, 1988. [Google Scholar]
- Schmoch, U.; Laville, F.; Patel, P.; Frietsch, R. Linking Technology Areas to Industrial Sectors; Final Report to the European Commission, DG Research; Fraunhofer ISI: Karlsruhe, Germany, 2003. [Google Scholar]
- Verspagen, B.; Morgastel, T.V.; Slabbers, M. MERIT Concordance Table: IPC-ISIC; Revision 2; MERIT Research Memorandum 2/94-004; MERIT: Maastricht, The Netherlands, 1994. [Google Scholar]
- World Intellectual Property Organization. World Intellectual Property Indicators; World Intellectual Property Organization: Geneva, Switzerland, 2009. [Google Scholar]
- OECD StatExtracts. Patent by Technology; OECD: Paris, France, 2014; Available online: http://stats.oecd.org/index.aspx (accessed on 10 December 2014).
- OECD StatExtracts. STAN R&D Expenditure in Industry ISIC; Revision 3; OECD: Paris, France, 2014; Available online: http:// stats.oecd.org/index.aspx (accessed on 10 December 2014).
- United Nations Industrial Development Organization (UNIDO). Industrial Statistics Database 2014 Edition at the 3- and 4-Digit Level of ISIC Rev. 3. 2014. Available online: http://www.unido.org/resources/stastics/statistics/indstat4-2015-edition.html (accessed on 10 December 2014).
- Park, W.G. International patent protection: 1960–2005. Res. Policy 2008, 37, 761–766. [Google Scholar] [CrossRef]
- Gilbert, R.; Newbery, D. Pre-emptive Patenting and the Persistence of Monopoly. Am. Econ. Rev. 1982, 74, 514–526. [Google Scholar]
- Vickers, J. The Evolution of market structure when there is a sequence of innovations. J. Indus. Econ. 1986, 35, 1–12. [Google Scholar] [CrossRef]
- Backer, S.; Mezzetti, C. Disclosure as a Strategy in the Patent Race. J. Law Econ. 2005, 48, 173–194. [Google Scholar] [CrossRef]
- Auerswald, P.; Branscomb, L.; Demos, N.; Min, B.K. Understanding Private-Sector Decision Making for Early-Stage Technology Development: A “Between Invention and Innovation Project”; Report No. NIST GCR 02-841A; National Institute of Standards and Technology, US Department of Commerce: Gaithersburg, MD, USA, 2005.
- Dalmarco, G.; Dewes, M.F.; Zawislak, P.A.; Padula, A.D. Universities’ Intellectual Property: Path for Innovation or Patent Competition? J. Technol. Manag. Innov. 2011, 6, 159–170. [Google Scholar] [CrossRef]
- Hall, B.H. Patents and patent policy. Oxf. Rev. Econ. Policy 2007, 23, 568–587. [Google Scholar] [CrossRef]
- Hall, B.H.; Ziedonis, R.H. The Patent Paradox Revisited: An Empirical Study of Patenting in the US Semiconductor Industry, 1979–1995. RAND J. Econ. 2001, 32, 101–128. [Google Scholar] [CrossRef]
- Lerner, J. Patent Policy Shifts and Innovation over 150 Years. Am. Econ. Rev. 2002, 92, 221–225. [Google Scholar] [CrossRef]
- Arora, A.; Merges, R.P. Specialized Supply Firms, Property Rights, and Firm Boundaries. Ind. Corp. Chang. 2004, 13, 451–475. [Google Scholar] [CrossRef]
- Arora, A.; Ceccagnoli, M.; Cohen, W. R&D and the Patent Premium. Int. J. Ind. Organ. 2008, 26, 1153–1179. [Google Scholar]
- Cohen, W.M.N.; Richard, R.; Walsh, J.P. Protecting Their Intellectual Assets: Appropriability Conditions and Why U.S. Manufacturing Firms Patent (or Not); National Bureau of Economic Research Working Paper Series No.7552; National Bureau of Economic Research: Cambridge, MA, USA, 2000. [Google Scholar]
- Bessen, J.; Maskin, E. Sequential innovation, patents, and imitation. RAND J. Econ. 2009, 40, 611–635. [Google Scholar] [CrossRef]
- Woo, S.K.; Jang, P.; Kim, Y. Effects of intellectual property rights and patented knowledge in innovation and industry value added: A multinational empirical analysis of different industries. Technovation 2015, 43–44, 49–63. [Google Scholar] [CrossRef]
- Gould, D.M.; Gruben, W.C. The role of intellectual property rights in economic growth. J. Dev. Econ. 1996, 48, 323–350. [Google Scholar] [CrossRef]
- Park, W.G.; Ginarte, J.C. Intellectual Property Rights and Economic Growth, Contemporary. Econ. Policy 1997, 15, 51–61. [Google Scholar]
- Kanwar, S.; Evenson, R. Does Intellectual Property Protection Spur Technical Change? Oxf. Econ. Pap. 2003, 55, 235–264. [Google Scholar] [CrossRef]
- Allred, B.B.; Park, W.G. The influence of patent protection on firm innovation investment in manufacturing industries. J. Int. Manag. 2007, 13, 91–109. [Google Scholar] [CrossRef]
- Von Graevenitz, G.; Wagner, S.; Harhoff, D. How to measure patent thickets-a novel approach. Econ. Lett. 2011, 111, 6–9. [Google Scholar] [CrossRef]
- Ang, B.W. Decomposition of industrial energy consumption. Energy Econ. 1994, 16, 163–174. [Google Scholar] [CrossRef]
- Zhang, F.Q.; Ang, B.W. Methodological issues in cross-country/region decomposition of energy and environment indicators. Energy Econ. 2001, 23, 179–190. [Google Scholar] [CrossRef]
Figure 1.
Comparison of the ICT R&D determinants for the eight countries. Note: The solid line divides the positive effect and negative effect in each determinant, whereas the dotted lines indicate the average value for the eight countries in each determinant.
Figure 1.
Comparison of the ICT R&D determinants for the eight countries. Note: The solid line divides the positive effect and negative effect in each determinant, whereas the dotted lines indicate the average value for the eight countries in each determinant.
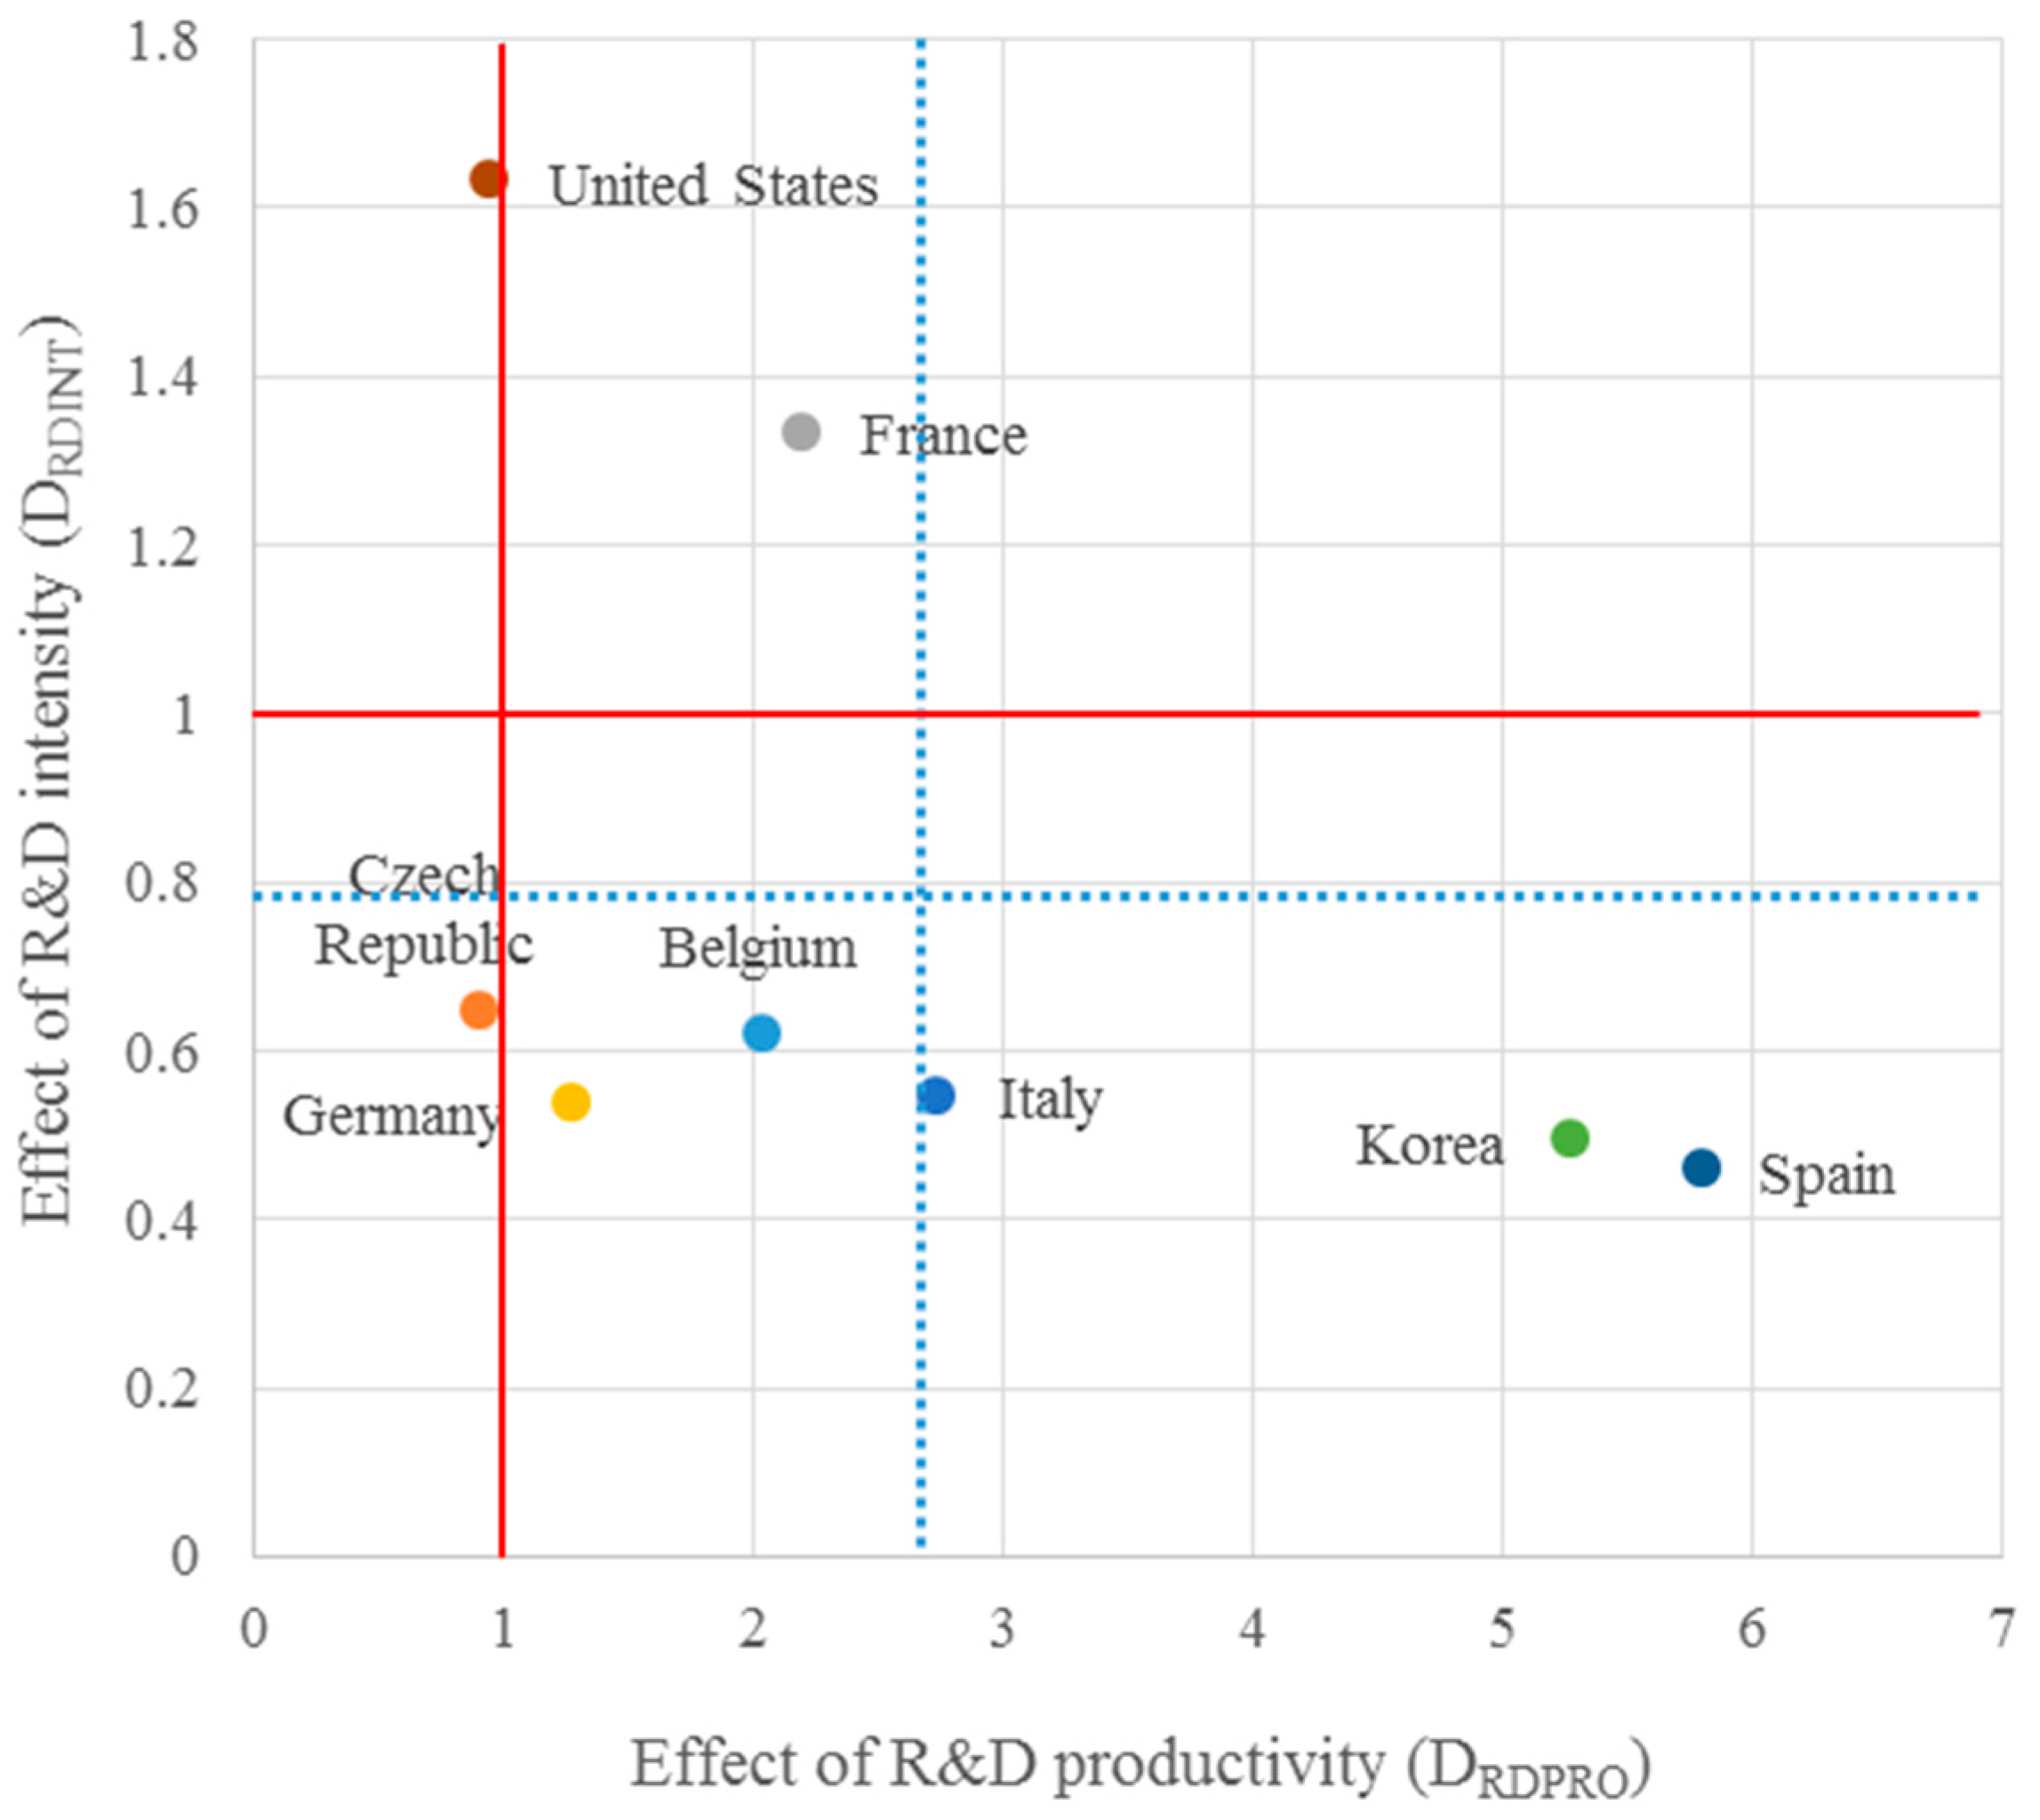
Figure 2.
Comparison of the ICT industrial determinants for the eight countries. Note: The solid line divides the positive effect and negative effect in each determinant, whereas the dotted lines indicate the average value for the eight countries in each determinant.
Figure 2.
Comparison of the ICT industrial determinants for the eight countries. Note: The solid line divides the positive effect and negative effect in each determinant, whereas the dotted lines indicate the average value for the eight countries in each determinant.

Table 1.
Explanation of each parameter.
| Parameter | Specific Substance |
|---|---|
| Total patent application of the ICT industry in period T | |
| Patent application of sub-sector i in the ICT industry in period T | |
| Business R&D expenditure of sub-sector i in the ICT industry in period T − 1 | |
| Total value added for 44 industries, including ICT, in period T − 1 | |
| Value added for the ICT industry in period T − 1 | |
| Value added for sub-sector i in the ICT industry in period T − 1 |
Table 2.
ICT industry classification for decomposition analysis.
| Sub-Sector of ICT Industry by ISIC | ISIC Code | Field No. | Field Description of FOS Concordance |
|---|---|---|---|
| Office Machinery and Computers | 3000 | 28 | Office machinery and computers |
| Electronic Components | 3210 | 34 | Electronic components |
| Television, Radio, and Communications Equipment | 3220 | 35 | Signal transmission, telecommunications |
| 3230 | 36 | Television and radio receivers, audiovisual electronics |
Table 3.
Basic statistics for the empirical analysis.
| Country | Analysis Period (Based on Patent Data) | Average of ICT Patent Applications (No., Fractional Count) | Average of ICT R&D Expenditure (US $) | Average of Value-Added in ICT Industry (US $) | Average of Value-Added in Total Industry (US $) |
|---|---|---|---|---|---|
| Belgium | 2001–2009 | 118.00 | 4.59 ×10⁸ | 2.07 × 10⁹ | 4.92 × 10¹⁰ |
| Czech Republic | 2001–2007 | 12.12 | 6.00 × 10⁷ | 6.60 × 10⁸ | 1.91 × 10¹⁰ |
| France | 2001–2008 | 1302.42 | 3.24 × 10⁹ | 1.03 × 10¹⁰ | 2.29 × 10¹¹ |
| Germany | 2001–2008 | 2620.64 | 4.67 × 10⁹ | 1.62 × 10¹⁰ | 4.8 × 10¹¹ |
| Italy | 2001–2009 | 307.67 | 1.15 × 10⁹ | 5.88 × 10⁹ | 2.41 × 10¹¹ |
| Korea | 2001–2007 | 1522.62 | 9.52 × 10⁹ | 4.97 × 10¹⁰ | 2.41 × 10¹¹ |
| Spain | 2001–2009 | 151.78 | 3.09 × 10⁸ | 1.69 × 10⁹ | 1.40 × 10¹¹ |
| United States | 2001–2009 | 13,618.49 | 3.54 × 10¹⁰ | 1.49 × 10¹¹ | 2.10 × 10¹² |
Table 4.
Decomposition results of the change in ICT patenting.
| Country | Period | Change in ICT Patenting (DTOT) | Effect of R&D Productivity (DRDPRO) | Effect of R&D Intensity (DRDINT) | Effect of Industrial Structure (DSTREF) | Effect of Industry Scale (DSCLEF) | Effect of Manufacturing Activity (DMNFAC) |
|---|---|---|---|---|---|---|---|
| Belgium | 2001–2009 | 2.1513 | 2.0240 | 0.6224 | 1.2636 | 0.7304 | 1.8504 |
| Czech Republic | 2001–2007 | 1.7624 | 0.9038 | 0.6499 | 0.9599 | 1.1010 | 2.8391 |
| France | 2001–2008 | 1.3943 | 2.1837 | 1.3365 | 0.6098 | 0.4934 | 1.5877 |
| Germany | 2001–2008 | 1.1051 | 1.2673 | 0.5375 | 0.9740 | 0.9400 | 1.7720 |
| Italy | 2001–2009 | 1.6486 | 2.7260 | 0.5486 | 1.0745 | 0.6191 | 1.6570 |
| Korea | 2001–2007 | 3.6744 | 5.2710 | 0.4951 | 0.7540 | 1.0482 | 1.7816 |
| Spain | 2001–2009 | 2.3553 | 5.7855 | 0.4599 | 0.8655 | 0.4989 | 2.0503 |
| United States | 2001–2009 | 0.9752 | 0.9375 | 1.6336 | 0.9937 | 0.5577 | 1.1489 |
| Average Effect of Determinants for the Eight Countries | 1.8833 | 2.6374 | 0.7854 | 0.9369 | 0.7486 | 1.8359 | |
© 2017 by the authors. Licensee MDPI, Basel, Switzerland. This article is an open access article distributed under the terms and conditions of the Creative Commons Attribution (CC BY) license (http://creativecommons.org/licenses/by/4.0/).
Share and Cite
MDPI and ACS Style
Kim, K.; Shin, J.; Choi, J.Y. Impact Analysis of Economic Contributors on Knowledge Creation Activity by Using the Symmetric Decomposition Method. Symmetry 2017, 9, 251. https://doi.org/10.3390/sym9110251
AMA Style
Kim K, Shin J, Choi JY. Impact Analysis of Economic Contributors on Knowledge Creation Activity by Using the Symmetric Decomposition Method. Symmetry. 2017; 9(11):251. https://doi.org/10.3390/sym9110251
Chicago/Turabian StyleKim, Kyunam, Jungwoo Shin, and Jae Young Choi. 2017. "Impact Analysis of Economic Contributors on Knowledge Creation Activity by Using the Symmetric Decomposition Method" Symmetry 9, no. 11: 251. https://doi.org/10.3390/sym9110251
Note that from the first issue of 2016, this journal uses article numbers instead of page numbers. See further details here.