Abstract
This study develops a model for essay scoring and article relevancy. Essay scoring is a costly process when we consider the time spent by an evaluator. It may lead to inequalities of the effort by various evaluators to apply the same evaluation criteria. Bibliometric research uses the evaluation criteria to find relevancy of articles instead. Researchers mostly face relevancy issues while searching articles. Therefore, they classify the articles manually. However, manual classification is burdensome due to time needed for evaluation. The proposed model performs automatic essay evaluation using multi-text features and ensemble machine learning. The proposed method is implemented in two data sets: a Kaggle short answer data set for essay scoring that includes four ranges of disciplines (Science, Biology, English, and English language Arts), and a bibliometric data set having IoT (Internet of Things) and non-IoT classes. The efficacy of the model is measured against the Tandalla and AutoP approach using Cohen’s kappa. The model achieves kappa values of 0.80 and 0.83 for the first and second data sets, respectively. Kappa values show that the proposed model has better performance than those of earlier approaches.
1. Introduction
This study is related to automatic text assessment for evaluation of text data. Automatic assessment of text can be defined as a classification approach that has input features in the text that are mapped to well-marked output, such as an essay score or article classification. The input and output can be statistically related to each other for any future occasion of input text to output label.
Teacher and researcher collaboration is very useful to deliver the latest research to students [1], but both fields are separate when they work individually. They have an issue of evaluation e.g., teachers assessing students in the education field and researchers classifying the research articles in bibliometric fields. In the field of education, assessment (summative or formative) is often categorized as either objective or subjective. Objective assessment is a form of questioning that has a single correct answer. Subjective assessment is a form of questioning that may have more than one correct answers or more than one way of expressing the correct answer. There are various types of objective and subjective questions. Objective questions include true/false, multiple choice, multiple response and matching questions. Subjective questions include extended-response questions. Objective assessment is well suited for the increasingly popular computerized or online assessment formats. However, concern has been expressed that such formats may not always be assessing what the teacher believes they are, partly because they require “the recognition of the answer, rather than the construction of a response” [2]. The intellectual procedures assess how very different students respond when they are asked to build a response from their own with no prompts from the question [3]. Since traditional paper-based assessment attributes higher value to short answer items, so research in Computer Assisted Assessment (CAA) systems has resulted in sophisticated response-matching techniques. Such recent developments enable automatic marking of longer free text-answers [4].
In the field of bibliometric research, researchers may need to find as many relevant publications as possible in their research domains for a better understanding of research trends [5,6]. While searching articles from a scholarly database, results contain many irrelevant articles, and scholars have to classify the results manually to proceed with their research [7]. This is time-consuming and human inconsistency in behavior can lead to incorrect classifications. The automatic process of classification of research articles is addressed by the proposed model.
The proposed model is implemented in text data sets with labels in order to train the model. It uses unigram and bigram, Word2vec [8], and text statistics for feature extraction, whereas for essay scoring, regular expressions (RE) are used as features. The important features are selected by using the Boruta algorithm [9] and these features are trained with supervised training models, i.e., Random Forest (RF) [10] and Gradient Boosting Machine (GBM) [11].
This paper is organized in the following way: Section 2 discusses the related work, background and literature review. Section 3 describes the architecture of the proposed model and Section 4 is about the experiment. Results and analysis is given in Section 5. Finally, conclusions are drawn in Section 6.
2. Related Work and Literature Review
The proposed model is applied to the field of education for essay scoring and to the field of bibliometric study for research article relevancy or classification of articles. Our research work is closely related to the work of [12,13]. In Tandalla’s approach, multi-features, including RE from text, are extracted and trained on RF and GBM. The proposed approach uses the same model for training but is different in feature extractions. Similarly, in Ramachandran’s approach, the authors select two types of features: text patterns containing content tokens, and text patterns containing sentence-structure information. Then, these features are used in RF and GBM training models. This approach works slightly better, compared to Tandalla's method. For research article relevancy, “Proving Ground for Social Network analysis in the emerging research area “Internet of Things” (IoT)” (PGSN-IoT) [7] uses only features of Word2vec for training purposes, and the model is trained only on GBM.
2.1. Background
This part describes the background of the model proposed in this article. The system is developed in different modules. Therefore, each module including the background is discussed in this section. Feature extraction and selection are different approaches that have been considered with multiple aspects. The Bag Of Words (BOW) approach [14] is the most commonly used approach for feature extraction. In this technique, the order of terms is not considered. Text documents are represented with weighted frequencies (i.e., the term frequency-inverse document frequency [15] of the sole terms in the collection). As each unique term is used in the construction of the feature set, even a collection including a small number of documents may be expressed with thousands of features. Excessive numbers of features may have negative effects on both classification accuracy and computational time. Therefore, most scholars are concerned with the feature selection stage in order to overcome these kinds of negative effects. Word2vec tackles this problem by capturing the context of words, while, at the same time, reducing the extent of the data. It actually has two different approaches: Continuous Bag Of Words (CBOW) and the skip-gram. In the CBOW method, the goal is to predict a word given the surrounding words, and skip-gram is its reverse. In our proposed model, the features are extracted using skip-gram. It predicts a window of words given a single word by using artificial neural networks such as the classification algorithm. Initially, each word in the vocabulary is a random N-dimensional vector. During training, the algorithm learns the optimal vector for each word using the skip-gram method. These word vectors now capture the context of surrounding words. This can be seen by using basic algebra to find word relations (e.g., “uncle” − “man” + “woman” = “aunt”). These word vectors can be fed into a classification algorithm. The advantage is that we now have some word context. The other two features are RE and text statistics. RE extracts specific patterns from the essay’s text and text statistics calculate the statistics of the text. Both are important features for training purposes. The most important is the weight of the features, which is a selection of important features computed with Boruta [9]. This algorithm takes the input from all mentioned features extracted from the text data, and they become the input of the algorithm. It produces the relevant corresponding features as input for training models. The work of the Boruta algorithm is an iterative process, and in each iteration, the aim is to remove features from the original features that, according to a z-score, are less relevant. The basic component of Boruta is the utilization of shadow attributes. The shadow attributes are pseudo-features that are added to the original attributes and produced by taking existing features and shuffling the values of those features. After generating the shadow attributes, random forest trees are built. Later, z-scores obtained by the original features are compared to the z-scores obtained by the shadow attributes. If the z-score of the original feature is greater than the maximum z-score of the shadow feature, it is considered relevant; if it is less than the minimum of the shadow feature, it is considered irrelevant and dropped from the features. The next module is training or learning on the relative features with RF and GBM.
RF is a supervised learning algorithm established on machine learning theory that belongs to the family of ensemble methods. It employs a supervised learning methodology whereby information from labeled data sets (the training set) is captured and used to derive predictions and then to build a model. RF is an increasingly popular technique for a variety of tasks in classification, prediction, detailed study of variable significance, variable selection, and outlier reveal [16]. To reveal patterns that exist in data, the decision trees in RF are grown through the joining of several correctly selected machine learning algorithms.
Figure 1 shows that an RF is comprised of a set of B decision trees (tree1, tree2, …, treeB), with each tree having a class label (k1, k2, …, kB) that is used to get a k voted class label. Prediction is made by aggregating the predictions of the weak learners. To classify a new object from an input vector, it passes the sample vector to each of the trees in the forest. Each tree will classify the new object, and the classification results of each tree are combined. The chosen classification for the new object is one that has the most votes over all the classification trees in the forest. As the number of trees grow via RF increase, the test set error rates converge to a limit, meaning that there is no over-fitting in large RFs [10].
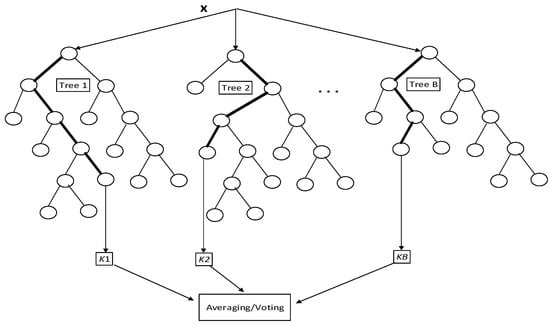
Figure 1.
Architecture of a random forest.
In GBM, the learning procedure sequentially fits new models to provide a more accurate estimate of the response variable. The principle idea behind this algorithm is to construct the new base learners to be maximally correlated with the negative gradient of the loss function associated with the whole ensemble. Applied loss functions can be arbitrary, but to give better intuition, if the error function is the classic squared-error loss, the learning procedure would result in consecutive error-fitting. This high flexibility makes GBM highly customizable to any particular data-driven task. It introduces a lot of freedom into the model design, thus making the choice of the most appropriate loss function a matter of trial and error. However, boosting algorithms are relatively simple to implement, which allows one to experiment with different model designs. A particular GBM can be designed with different base-learner models on board. The commonly used base-learner models can be classified into three distinct categories: linear models, smooth models, and decision trees. These trees are commonly parameterized with the number of splits, or equivalently, the interaction depth. Given a particular learning task, one can consider different loss functions, Ψ(y, f), to exploit. Loss-functions can be classified according to the type of response variable, y. Specific boosting algorithms have been derived for various families of response, among which are regression, classification, and time-to-event analysis tasks. Exploiting shrinkage in learning allows the decision-tree GBM to capture more continuity in the modeled effects. The same effect of smoothing the decision-tree ensemble would also hold true for higher dimensional data, and that is why authors claim it is desirable to train GBMs with infinitesimal step-sizes [9,17].
2.2. Literature Review
This section highlights a literature review regarding essay scoring and article classification, but the main focus is on essay scoring because the motivation of this study is to develop a system for scoring short-response essays. In education, the CAA system is still a hot topic, particularly in essay marking. There have been many works in this field, but they are specific to the particular domains.
CAA systems can be distinguished by the way they primarily evaluate essays, either for style or for content, or both. The examples of style based systems are Project Essay Grade (PEG) [18] and Paperless School free-text Marking Engine (PS-ME) [19], while Intelligent Essay Assessor (IEA) [20], LightSIDE [21] and Markit [22] are content based. The most well-known available system for e-assessment of free text is e-rater [23], an automatic essay scoring system that provides good agreement with human grading when the focus is on both style and content. The other well-known names in this category are IntelliMetric [24], Bookette [25] and Autoscore [26]. However, the systems described in the current paper are designed to focus on evaluation of the content for what is written, rather than the style of the writing.
Another distinct criterion is the approach adopted for assessing style and/or content. The most important approaches found in existing CAA systems are statistical: Latent Semantic Analysis (LSA), Natural Language Processing (NLP) and a combination of LSA and NLP. The first CAA systems, which focus on statistical approaches, capture structural similarity in texts [27]. The other systems included in this category are the Bayesian Essay Test Scoring sYstem (BETSY) [28], PEG, LightSIDE and Schema Extract Analysis and Report (SEAR) [29]. The LSA systems do more than a simple analysis of co-occurring terms. In fact, they introduce two new approaches to the problem: comparison based on a corpus, and an algebraic technique that identifies similarities between two texts with different words [30]. Generalized Latent Semantic Analysis [31] is accompanied by LSA. The latest systems are based on NLP techniques with LSA combinations and can do intelligent analyses that capture the semantic meaning of free-text documents. The well-known NLP systems are e-rater, IntelliMetric, Bookette, Autoscore and PS-ME. An example of combo methodology is IEA.
The recent approaches of features extractions adopted by the research for essay scoring are regular expressions and semantic evaluation e.g., Tandalla and Rodrigues use the regular expressions as features, as described in Section 3.3.2, and Ramachandran’s approach [13] is extracting text patterns containing content tokens and text patterns containing sentence-structure information with the attributes of semantics.
More recently, educational data mining (EDM) has emerged as a relevant research field [32]. EDM aims to provide insight into instructional practices and student learning, often using data from assessments and learning experiences, both formal and informal [33]. The works concerning EDM have been organized into four functionalities: student modeling, tutoring, content, and assessment [34]. Regarding assessment, which is more closely related to our work, several recent works can be mentioned. Team Analytics [35] is an instructional tool that facilitates the analysis of the student collaboration process by creating dynamic summaries of team member contributions over time. Lopez [36] developed a specific Moodle mining tool that predicts final marks on the basis of forum data in a Moodle course. The authors compare the performance and usefulness of different data mining techniques for classifying university students through the use of different data sets from Moodle courses. Another work studied the patterns that emerge in learning situations that are favorable and challenging [37]. Authors capture strategies of high and low performing students’ actions in different learning activities. Results show that, during favorable learning activities, both groups of students tend to make similar choices. However, during challenging activities, groups of high achieving students adopt deep learning while other groups does not. An interactive environment called Science Assessments [38] is being developed to assess students’ inquiry skills as they engage in an inquiry using science micro-worlds. Supporting assessment and provision of scaffolding environment develops inferences of students’ skills based on developed models through a combination of text replay tagging, a method for rapid manual coding of student log files, and educational data mining. The latest assessment work [39] is specific to one history subject.
The proposed model is useful for both summative and formative assessment in subjective questions asked by the students. It evaluates essays on the basis of content; therefore, it has general application in the fields of text mining and EDM. The proposed model is implemented as well to find the relevancy of articles.
3. Proposed System Architecture
The proposed system is divided into three modules: (1) preprocessing the text data; (2) feature extraction and selection; and (3) training and testing the model. The data flow model with their components is depicted in Figure 2. At one end, text is fed as input to the system, and at the other end, predictive results are generated as output. The raw text with labels becomes the input to the preprocessing module, where spelling correction and stemming occurs. Then, multiple features are extracted from the text, including n-grams, RE, Word2vec, and text statistics of the data. Thereafter, important features are selected by the Boruta algorithm for training purposes. Then, these features are trained on two different training models: RF and GBM. Later, the average output of both models is calculated, which is the final prediction. Furthermore, prediction accuracy is calculated by the kappa’s value. The model is implemented in two different data sets. In the following segments, a closer look is taken at each of the depicted modules, their parts, and the theoretical footing. The proposed model is implemented in two data sets.
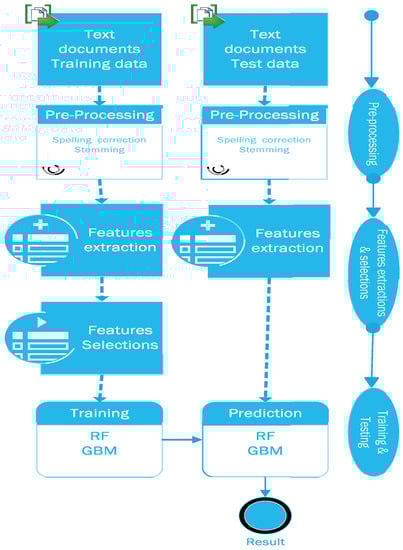
Figure 2.
Data flow of proposed model.
3.1. Data Sets
Public availability of experimental data sets would accelerate progress in this field. This would allow researchers and organizations to compare their systems with others in the same data sets with the same evaluation methodology. Although there is a shortage of data sets that are publicly available for research purposes [40] in this field, few data sets are publicly available including Kaggle, which we use in our experiment. Another reason to choose these data sets is that they have already been tested under different approaches. Therefore, the efficiency of the proposed model can be tested and compared. First, a data set is selected for assessing open-text essays using Kaggle short answer scoring [41] and second is about article relevancy used by [7].
3.2. Preprocessing
To predict better accuracy in text mining, the preprocessing stage is very important because it creates the foundation for any prediction model. Refs. [42,43] suggest that feature selection is a very important stage in addition to feature extraction and classification. The selected data are moved to the preprocessing module in order to transform data to suit the learning algorithms, ultimately resulting in quality output. These include data cleaning, spelling correction and stemming. The spelling correction is done by Peter Norvig’s spelling [44] corrector who handles the jargon words as well e.g., vinegar is common to set 1, trna in sets 5 and 6. The misspelled words are corrected for better performance of the model. After correcting the misspelled words, all words are stemmed using the Porter Stem algorithm [45]. Stemming helps in the process by reducing any word to its root.
3.3. Feature Extraction and Selection
Feature extraction is a process of extracting numerical information from raw text documents. After this process, any classifier can implement the text classification process by predicting the label of the document. The research community working in this field is still studying how to improve the performance of text classification by combining various preprocessing [43,46], feature extraction [47], feature selection [42,48], and ensemble methods [49]. The following features are extracted for the proposed model:
3.3.1. N-Grams
The n-grams are used in the forms of bigrams and unigrams as features for learning the machine models. The example of features extraction in terms of unigrams and bigrams are exhibited in Table 1.

Table 1.
Feature extraction.
3.3.2. Regular Expression
These features are only used in essay marking because they show whether the specific answer exists in the essay or not. For instance, to find out if an essay contains the idea “to know what type of vinegar” the following regular expressions will search to determine if the concept is present:
- ((type)|(kind)|(brand)) of vinegar
- ((concentr)|( \w?h)|(acid)) (\w+ ){0,5}vinegar
- vinegar (\w+ )?((concentr)|(acid))
- know (\w+ )?vinegar (\w+ )?((us)|(need))
Thus, the RE search for each answer returns a list containing zeros or ones: ones if the essay has a regular expression for the answer—zeros, if it does not. The same approach is adopted for REs as used in [12].
3.3.3. Word2vec
Word2vec helps with feature extraction because, in our model, if this feature is missing, we cannot optimize the kappa values in essay scoring. Word2vec takes a text corpus as input and produces the word vectors as output. It first constructs a vocabulary from the training text data and then learns vector representations of words. The resulting word vector file is used as the features for the proposed model.
3.3.4. Text Statistics
Text statistics is also used in the proposed model, e.g., the length of the text, the number of sentences, the number of words, and the average length of sentences. In essay scoring, some text has a low length but a maximum score, and, conversely, an essay can have a long text but a minimum score; therefore, we consider this feature to get the maximum accuracy in the prediction. Now, an example of a single-record data set of essay scoring is picked for feature extraction and the extracted features mentioned above are shown in Table 1.
In Table 1, we show the sample text for the essay scoring. First, the method performs preprocessing, where misspelled words are corrected and stemmed. After that, different regular-expression scanning of the text is applied to find specific formats in the text (if they exist), assigning 1, if so—zero, otherwise. Next, it finds unigrams and bi-grams in the text and then considers the statistics of the essay. At the end, all similar words with a similarity score are calculated for feature selection, e.g., “if” ([[“unless”, 0.688], [“anyway”, 0.645], [“even”, 0.629], [“whether”, 0.611], [“not”, 0.609]].
3.3.5. Feature Selection
The features are extracted and selected to find important features that best fit the training model. A variety of methods have been proposed by the research community to cater to the problem of feature selection. Ref. [50] presented a reasonable study of five feature-selection criteria for text categorization: document frequency, information gain, mutual information, an χ2-test test, and term strength. However, in our case, we prefer the Boruta algorithm because of its emphasis on relative features. The Boruta algorithm is a wrapper built around the random forest classification. A good discussion outlining why finding all relevant attributes is important is given by [51]. The feature selection procedures in our proposed model using the Boruta algorithm are described in Algorithm 1. The process takes the input from all mentioned features extracted from the text data, and they become the input for the Boruta algorithm. It produces the relevant corresponding features as input for training models. The work of the Boruta algorithm is iterative, and, in each iteration, the aim is to remove features from the original features that, according to a z-score, are less relevant. The basic component of Boruta is the utilization of shadow features. The shadow attributes are pseudo-features that are added to the original attributes and produced by taking existing features and shuffling the values of those features. After generating the shadow attributes, the procedure proceeds by building random forest trees and comparing the z-scores obtained by the original features to the z-scores obtained by the shadow attributes. If the z-score of the original feature is greater than the maximum z-score of the shadow feature, it is considered relevant; if it is less than the minimum of the shadow feature, it is considered irrelevant and dropped from the features.
| Algorithm 1. Boruta Algorithm |
| 1: procedure 2: Input // Original features 3: Output // Relative features from original features 4: O //Original features matrix 5: S //Shadow features matrix 6: J = [O S] // Merging the features 7: Z = RandomForest(J) //Applying RF and get Z score 8: for (Z←1 to n) do // n is number of total features 9: if (Sz > Max (Oz)) then //comparing the Z score 10: Rel-F←Xz // Related Features 11: else 12: if (Sz < Min (Oz)) then 13: N-Rel-F←Xz // Non related features, drop it. 14: end if 15: end if 16: end for 17: end procedure |
3.4. Training the Model
Textual data are characteristically categorized by vastly dimensional feature spaces [52], so it is vital that the picked classifier performs well within this framework. Thus, the main concern when choosing a text classification method is the prediction correctness of the classifier. Since the dimensionality of textual data raises the risk of excessive listing when building the decision trees, an equally important part to consider is the classifier's feature selection i.e., the tendency of the classifier to over-fit the training data during classification [52]. Considering all of the factors, two ensemble models have been selected: RF and GBM.
3.4.1. Random Forest
RF is an ensemble learning model and it is very efficient in mixing the features in our case and providing a good prediction. It also presents a good solution for classification of sparse data sets, data sets with errors, and data sets with missing values [53]. The Random forest algorithm for training the related features is described in Algorithm 2. For example, for a training data set with N cases, a training sample set of size N is selected, with replacement, from a training set that has a number of input features M. Input variable m does not change during the process of tree building (where m ≤ M) such that, at each node, m variables are randomly selected, and the best split on these m is used to split the node. Since pruning is not performed, random feature selection grows the size of trees. After several repetitions, weak leaners (predictors) are collected to end this process. Low bias, low correlation and high variance are achieved by the inclusion of randomness [10].
| Algorithm 2. Random Forest |
| 1: for b = 1 to B: // b is initial tree to build forest B (a) Draw a bootstrap sample Z of size N from the training data i.e., relative features. (b) Grow a random forest tree Tb to the bootstrapped data, by re-cursively repeating the following steps for each terminal node of the tree, until the minimum node size nmin is reached. i. Select m variables at random from the p variables. ii. Pick the best variable/split-point among the m. iii. Split the node into two daughter nodes. 2: Output the ensemble of trees {Tb}1B. 3: To find the prediction on this trained data at point x with regression mode Regression: |
3.4.2. Gradient Boosting Machine
GBM performs very well while mixing heterogeneous features in our study, but it should be first weighted through Boruta. GBMs have shown considerable success in not only practical applications, but also in various machine-learning and data-mining challenges [54,55,56,57]. The functionality of the GBM algorithm is described briefly in Algorithm 3. Inputs to the algorithm are relative features. In the proposed system, a decision tree is selected because the structure of a decision tree naturally encodes and models the interactions between predictor variables. Since we consider regression, we therefore select the Gaussian L2 loss function.
| Algorithm 3. Gradient Boosting Machine |
| 1: procedure 2: input data (x, y)Ni = 1 3:number of iterations M 4: choice of the loss-function Ψ(y, f) 5: choice of the base-learner model h(x, θ) 6: initialize with a constant 7: for t = 1 to M do 8: compute the negative gradient gt(x) 9: fit a new base-learner function h(x, θt) 10: find the best gradient descent step-size ρt: ρt = 11: update the function estimate: 13: end procedure |
3.4.3. Rational of Combining RF and GBM
The idea of ensemble learning is to build a prediction model by combining the strengths of a collection of models. Both models are efficient in mixing different types of features, and, in our approach, we merge all of the relevant features. Ensemble learning can be divided into two jobs: developing a foundation of base learners from the training data and combining them to form the merged predictor. Actually, GBM and RF belong to the ensemble method, but they use different approaches: GBM uses boosting while RF makes use of bagging. Boosting generates a tree model on the basis of a previous model, whereas the bagging model is built independently. Boosting ensemble uses a weighted majority vote while bagging uses a simple majority vote. The bagging reduces the variance, whereas boosting reduces the variance and bias of the base classifier. Therefore, boosting performs better on non-noisy data than that of bagging. Since both are different in operations with different limitations, combining them together helps to tackle the deficiency of each other. Due to variation of text data in length, structure and domain, a single model cannot perform better in our data sets. Therefore, the combining of GBM and RF provides a good kappa value on the selected features in the proposed system.
4. Experiment
The experiment is performed using i7-4770 @ 3.40GHz, with 8 GB memory operating on Windows 8.1 Pro 64-bit. Python 2.7 (Python Software Foundation, Wilmington, DE, USA) and RStudio (RStudio, Inc., Boston, MA, USA) are used for development of the system.
Two types of data sets are used for testing the model. The first is essays scoring, which has 10 different sets in four different subjects (Science, Biology, English, and English Language Arts) as shown in Table 2. The training data of 17,043 essays have scores (0, 1, 2, and 3) from two different human examiners, and, for the purposes of testing the model, 5732 essays are included. Second, the data set used by [7] regarding the relevancy of articles in the research area of bibliometric is shown in Table 3.
Table 2.
Data sets for essay scoring.
Table 3.
Data set for research articles.
It has two labels, or scores, (i.e., 1 and 0). These research articles, extracted from the Web of Science database for the period of 1993 to August 2015, are related to the IoT. They are labeled manually. The proposed model is tested using a training set of 815 abstracts (653 belonging to IoT, and 162 that do not) and a set of test data composed of 203 abstracts (162 belonging to IoT, and 41 that do not).
The first step is cleaning the data; all non-alphabetic characters (with the exception of periods) are replaced with spaces. Special treatment for set 10 in essay marking is applied because it makes reference to experimental numerical data, so there are some specific numbers that influence the score of the essays. Later, all capital letters are replaced by lowercase letters. In the next step, misspelled words are corrected and the spelling corrector also takes care of the jargon words. After correcting the misspelled words, all words are stemmed. A Python script described in Table 3 is developed for feature extraction. Then, important features are selected using Boruta that is present in the R package version 1.6.
Now, the model is trained on extracted features with RF and GBM. Inputs to the RF and GBM are relative features. These features are classified using decision tree of size 500. The package in R ‘randomForest’ version 4.6-12 for RF and package ‘gbm’ version 2.1.1 for GBM are used for training. Then, test data is utilized to get prediction values from both training models individually, and values are averaged to get the final result.
5. Result and Discussion
Evaluation of the proposed model can be done in different ways, but, in most cases (especially in essay scoring systems), a diversity of common metrics is used, such as Pearson’s and Spearman’s correlations, exact and adjacent degrees of agreement, precision and recall, F-measure, and the kappa metric. Although there are no particular metrics in the field of essay scoring that can be used for essay scoring, Ref. [58] observed several of them in their work:
- Correspondence in mean and standard deviations of the distributions of scores of human graders to that of the essay scoring system.
- Correlation, weighted kappa and percent agreement.
- Degree of difference between human–human agreement and automated–human agreement by the same agreement metrics.
During the kaggle public competition [41], the measuring criterion is a quadratic weighted kappa. It also became the ubiquitous evaluation measure used for essay scoring and text mining. An agreement statistic measured through a quadratic weighted kappa is an error metric that measures the degree of agreement between two evaluators (in our model, this is an agreement between the automated evaluation and the human score), and it bears likeness to the correlation coefficient. This metric typically ranges from 0 to 1, where 1 is for complete agreement between graders and system—zero, otherwise.
Suppose that a set of essay responses, Eresps, has N possible ratings (1, 2, …, N), and that each essay response, eresp, is characterized by a tuple (ErespP, ErespQ), which corresponds to its scores by human grader P and the proposed system Q. The metric is calculated using Equation (1):
Here, ω are weights, O is a matrix of observed ratings, and E is a matrix of expected ratings. In the execution of our model, the following matrix is observed with a kappa’s value of 0.80. The interpretation of kappa value is defined in Table 4.
Table 4.
Kappa value interpretation.
The proposed approach is compared with the Tandalla and Ramachandran approaches. The proposed approach is an optimized form of Tandalla, which does not consider the text features of Word2vec and statistics. In Ramachandran’s approach, the author uses word order graphs to identify important patterns from human-provided rubric texts and top-scoring student answers. Related words are determined by applying semantic metrics, and these related words can show alternative answers. Details of a comparison of the results of different approaches are shown in Table 5. The results clearly show that the proposed approach is better than the Tandalla and Ramachandran approaches. In Table 5, set 6 has a low value. The reason for selection of the skip-gram model is that it is not good with very short-length essays. With set 6, the test data set includes 599 essays for testing, but it has 33 essays with single-word responses, while 31 essays have two words, 23 have three-word responses from the students, and two essays have no words. Word2vec is not fruitful in this case because, when features are extracted from these 89 essays and mixed with other features, it leads to the wrong prediction because of the limitations of the skip-gram model [59].
Table 5.
Kappa value comparison of different approaches.
Essay set 1 is related to the subject of science, and the Ramachandran’s approach has 0.01 improved value from Tandalla, but the proposed model outperforms both approaches. Similarly, essay sets 2 and 10 are also under the subject of science, and our method also provides better results for these sets. The subject of biology is in sets 5 and 6, but our approach only works better with set 5, falling behind in accuracy with set 6 due to the above-mentioned reasons. The remaining sets fall under the subject of English, and the proposed approach performs better. Similarly, the overall kappa value achieved is 0.80, which is 0.03 higher than Tandalla and 0.02 higher than Ramachandran. Regarding the differences between high disagreement and high agreement, the answers for set 1 are concrete facts as compared to set 7. It is easier to construct manual regular expressions compared to set 7, e.g., “The students need to say what the samples are. They need to”. The human grader assigned score 3 and our system also predicts the same. Because RE captures the pattern, if it is missing a pattern, it will be covered by Word2vec features because it has the context of each word in the sentences, and even simple text such as “they need “ is assigned score 3, due to features of Word2vec. Then, we consider lengthy text such as “What the group of students did was determine the mass of different samples. So what I would do: what they did in the beginning or in the investigation, I would use the samples and do another experiment with the samples” with a score of zero. Here, the response from the student is missing. Although it has lot of text, it is not specific or the actual context. In this case, three features are working well: RE, Word2vec and text statistics. The length of the text has an important role in training with text statistics features because some texts are lengthy but have low scores, and vice versa. During training, a lot of essays are used for training that have a maximum text but a low score. The consistency in learning is precise due to selections of features with weights and training models. The selections of training models also have an important role because RF belongs to bagging and GBM to boosting. Therefore, training with both of these models overcomes the deficiency of one another. It is also worth mentioning the inter-agreement between the proposed method and the human grader, as shown in Table 6.
Table 6.
Proposed vs. Human.
In Table 6, an agreement between the proposed model and the human grader shows that there is good inter-agreement in our approach at scores of 0, 1, and 2 with the human grader. The proposed approach is very good at 0 and 1. Therefore, we also apply the model to other data sets used in PGSN-IoT that have two labels of outcomes, and the kappa value is 0.83. Prediction with this approach compared with the PGSN-IoT is displayed in Table 7.
Table 7.
Proposed vs. PGSN-IoT.
Table 7 shows a comparison between the PGSN-IoT and the proposed model. It shows that the agreement of the proposed model is better than the PGSN-IoT. The results clearly show that prediction of negative (-ive) agreement is double, and prediction of positive (+ive) agreement is 0.81, compared to the previous model that is 0.76, and the overall result is 0.06 better than the approach used in PGSN-IoT.
6. Conclusions
This study develops a new model for prediction in the field of text mining. The proposed model outperforms Tandalla, Ramachandran and PGSN-IoT approaches in terms of efficiency measured in kappa values. The proposed model is applied in the fields of education and bibliometrics. The prediction results are better in the mentioned fields, especially if the label is binary. The model is tested on two data sets and provides higher kappa values than previous approaches. The first data set is essay marking, which compares human and automated essay scores. A previous study on the same data set produced kappa values of 0.77 and 0.78 by Tandalla and Ramachandran, but the proposed model shows an improved kappa value of 0.80. The kappa value on second data set is 0.83, which is also better than the approach used in PGSN-IoT. The proposed model can provide timely feedback on open-ended texts to be evaluated. The current study gives research support for the use of automated scoring of essay tests as a substitute for human scoring. The model also determines whether research articles belong to a specific category or not.
Acknowledgments
This research was supported by the National Research Foundation of Korea (NRF) grant funded by the Korea government (MEST) (No. NRF-2016R1A2B1014843) for the second author (Byung-Won On), and is also supported by the Ministry of Trade, Industry & Energy (MOTIE, Korea) under the Industrial Technology Innovation Program, No. 10063130, by the Basic Science Research Program through the National Research Foundation of Korea (NRF) funded by the Ministry of Education (2016R1A2B4007498), and the MSIP (Ministry of Science, ICT and Future Planning), Korea, under the ITRC (Information Technology Research Center) support program (IITP-2016-R2718-16-0035) supervised by the IITP (Institute for Information & communications Technology Promotion) for the fourth author (Gyu Sang Choi).
Author Contributions
All authors of this article discussed the contents of the manuscript and actively contributed in the preparation and the practical implementation. Byung-Won On and Gyu Sang Choi raised the idea and closely observed the base model used for comparison. They also provided critical insight and discussion. Arif Mehmood conducted the experiment in programming languages Python and R. Ingyu Lee made suggestions and contributed to the feature extraction and feature selection section. All authors mentioned read and approved the final manuscript.
Conflicts of Interest
The authors declare no conflict of interest.
References
- Brown, J.C.; Bokor, J.R.; Crippen, K.J.; Koroly, M.J. Translating current science into materials for high school via a scientist–teacher partnership. J. Sci. Teach. Educ. 2014, 25, 239–262. [Google Scholar] [CrossRef]
- Nicol, D. E-assessment by design: Using multiple-choice tests to good effect. J. Furth. High. Educ. 2007, 31, 53–64. [Google Scholar] [CrossRef]
- Mitchell, T.; Russell, T.; Broomhead, P.; Aldridge, N. Towards Robust Computerised Marking of Free-Text Responses. In Proceedings of the 6th CAA Conference, Loughborough University, London, UK, July 2002.
- Butcher, P.G.; Jordan, S.E. A comparison of human and computer marking of short free-text student responses. Comput. Educ. 2010, 55, 489–499. [Google Scholar] [CrossRef]
- Datta, R.; Joshi, D.; Li, J.; Wang, J.Z. Image retrieval: Ideas, influences, and trends of the new age. ACM Comput. Surv. (CSUR) 2008, 40, 5. [Google Scholar] [CrossRef]
- Wilson, T.D. Recent trends in user studies: Action research and qualitative methods. Inf. Res. 2000, 5, 5-3. [Google Scholar]
- Mehmood, A.; Choi, G.S.; Feigenblatt, O.F.; Park, H.W. Proving ground for social network analysis in the emerging research area “Internet of Things”(IoT). Scientometrics 2016, 109, 185–201. [Google Scholar] [CrossRef]
- Mikolov, T.; Chen, K.; Corrado, G.; Dean, J. Efficient estimation of word representations in vector space. arXiv 2013. [Google Scholar]
- Kursa, M.B.; Rudnicki, W.R. Feature selection with the Boruta package. J. Stat. Softw. 2010, 36, 1–13. [Google Scholar] [CrossRef]
- Breiman, L. Random forests. Mob. Learn. 2001, 45, 5–32. [Google Scholar] [CrossRef]
- Friedman, J.H. Greedy function approximation: A gradient boosting machine. Ann. Stat. 2001, 29, 1189–1232. [Google Scholar] [CrossRef]
- Tandalla, L. Scoring Short Answer Essays. ASAP Short Answer Scoring Competition–Luis Tandalla’s Approach. 2012. Available online: https://kaggle2.blob.core.windows.net/competitions/kaggle/2959/media/TechnicalMethodsPaper.pdf (accessed on 17 September 2016).
- Ramachandran, L.; Cheng, J.; Foltz, P. Identifying patterns for short answer scoring using graph-based lexico-semantic text matching. In Proceedings of the Tenth Workshop on Innovative Use of NLP for Building Educational Applications, Denver, CO, USA, 04 June 2015; pp. 97–106.
- Joachims, T.A. Probabilistic of the Rocchio Algorithm with TFIDF for Text Categorization. In Proceedings of the 14th Internationa1 Conference on Machine Learning (ICML’97), Nasvile, TN, USA, 1997.
- Manning, C.D.; Raghavan, P.; Schutze, H. Introduction to Information Retrieval; Cambridge University Press: New York, NY, USA, 2008. [Google Scholar]
- Verikas, A.; Gelzinis, A.; Bacauskiene, M. Mining data with random forests: A survey and results of new tests. Pattern Recognit. 2011, 44, 330–349. [Google Scholar] [CrossRef]
- BUhlmann, P.; Hothorn, T. Boosting algorithms: Regularization, prediction and model fitting. Stat. Sci. 2007, 22, 477–505. [Google Scholar] [CrossRef]
- Page, E.B. Computer grading of student prose, using modern concepts and software. J. Exp. Educ. 1994, 62, 127–142. [Google Scholar] [CrossRef]
- Mason, O.; Grove-Stephensen, I. Automated Free Text Marking with Paperless School. In Proceeding of the 6th Conference, Loughborough University, London, UK, July 2002; pp. 213–219.
- Foltz, P.W.; Laham, D.; Landauer, T.K. The intelligent essay assessor: Applications to educational technology. Interact. Multimedia Electron. J. Comput.-Enhanc. Learn. 1999, 1, 939–944. [Google Scholar]
- Mayfield, E.; Rose, C.P. LightSIDE: Open source machine learning for text accessible to non-experts. In Invited Chapter in the Handbook of Automated Essay Grading; Routledge Academic Press: Abingdon, Oxon, UK, 2013. [Google Scholar]
- Williams, R.; Dreher, H. Automatically grading essays with Markit\copyright. J. Issues Inf. Sci. Inf. Technol. 2004, 1, 693–700. [Google Scholar]
- Attali, Y.; Burstein, J. Automated essay scoring with e-rater® V.2. J. Technol. Learn. Assess. 2006, 4. Available online: http://citeseerx.ist.psu.edu/viewdoc/download?doi=10.1.1.800.4773&rep=rep1&type=pdf (accessed on 17 September 2016). [Google Scholar] [CrossRef]
- Schultz, M.T. The IntelliMetric Automated Essay Scoring Engine-A Review and an Application to Chinese Essay Scoring. In Handbook of Automated Essay Evaluation: Current Applications and New Directions; Shermis, M.D., Burstein, J.C., Eds.; Routledge: New York, NY, USA, 2013; pp. 89–98. [Google Scholar]
- Rich, C.S.; Schneider, M.C.; D’Brot, J.M. Applications of automated essay evaluation in West Virginia. In Handbook of Automated Essay Evaluation: Current Applications and New Directions; Shermis, M.D., Burstein, J., Eds.; Routledge: New York, NY, USA, 2013; pp. 99–123. [Google Scholar]
- Shermis, M.D.; Hamner, B. Contrasting state-of-the-art automated scoring of essays: Analysis. In Annual National Council on Measurement in Education Meeting; National Council on Measurement in Education: Vancouver, BC, Canada, 2012; pp. 14–16. [Google Scholar]
- Page, E.B. The imminence of grading essays by computer. Phi Delta Kappan 1966, 47, 238–243. [Google Scholar]
- Rudner, L.M.; Liang, T. Automated essay scoring using Bayes’ theorem. J. Technol. Learn. Assess. 2002, 1. Available online: http://ejournals.bc.edu/ojs/index.php/jtla/article/viewFile/1668/1512 (accessed on 17 September 2016). [Google Scholar]
- Christie, J.R. Automated essay marking-for both style and content. In Proceedings of the Third Annual Computer Assisted Assessment Conference, Loughborough University, Loughborough, UK, June 1999.
- Thomas, P.; Haley, D.; DeRoeck, A.; Petre, M. E-assessment using latent semantic analysis in the computer science domain: A pilot study. In Proceedings of the Workshop on eLearning for Computational Linguistics and Computational Linguistics for eLearning, Geneva, Switzerland, 28 August 2004; Association for Computational Linguistics: Stroudsburg, PA, USA; pp. 38–44.
- Islam, M.M.; Hoque, A.L. Automated essay scoring using generalized latent semantic analysis. In Proceedings of the 2010 13th International Conference on Computer and Information Technology (ICCIT), Dhaka, Bangladesh, 23–25 December 2010; pp. 358–363.
- Baker, R.S.; Yacef, K. The state of educational data mining in 2009: A review and future visions. JEDM 2009, 1, 3–17. [Google Scholar]
- Romero, C.; Ventura, S.; Pechenizkiy, M.; Baker, R.S. (Eds.) Handbook of Educational Data Mining; CRC Press: Boca Raton, FL, USA, 2010.
- Pena-Ayala, A. Educational data mining: A survey and a data mining-based analysis of recent works. Exp. Syst. Appl. 2014, 41, 1432–1462. [Google Scholar] [CrossRef]
- Kim, J.; Shaw, E.; Xu, H.; Adarsh, G.V. Assisting Instructional Assessment of Undergraduate Collaborative Wiki and SVN Activities. In Proceedings of the 5th International Conference on Educational Data Mining (EDM), Chania, Greece, June 19–21 2012.
- Lopez, M.I.; Luna, J.M.; Romero, C.; Ventura, S. Classification via Clustering for Predicting Final Marks Based on Student Participation in Forums. In Proceedings of the 5th International Conference on Educational Data Mining (EDM), Chania, Greece, June 19–21 2012; pp. 148–151.
- Malmberg, J.; Jarvenoja, H.; Jarvela, S. Patterns in elementary school students′ strategic actions in varying learning situations. Instr. Sci. 2013, 41, 933–954. [Google Scholar] [CrossRef]
- Gobert, J.D.; Sao Pedro, M.A.; Baker, R.S.; Toto, E.; Montalvo, O. Leveraging educational data mining for real-time performance assessment of scientific inquiry skills within microworlds. JEDM 2012, 4, 111–143. [Google Scholar]
- Rodrigues, F.; Oliveira, P. A system for formative assessment and monitoring of students’ progress. Comput. Educ. 2014, 76, 30–41. [Google Scholar] [CrossRef]
- Zupanc, K.; Bosnic, Z. Advances in the Field of Automated Essay Evaluation. Informatica 2015, 39, 383. [Google Scholar]
- ASAP-SAS. Scoring Short Answer Essays. ASAP Short Answer Scoring Competition System Description, 2012. Available online: http://www.kaggle.com/c/asap-sas/ (accessed on 17 September 2016).
- Uysal, A.K.; Gunal, S. A novel probabilistic feature selection method for text classification. Knowl.-Based Syst. 2012, 36, 226–235. [Google Scholar] [CrossRef]
- Uysal, A.K.; Gunal, S. The impact of preprocessing on text classification. Inf. Process. Manag. 2014, 50, 104–112. [Google Scholar] [CrossRef]
- Norvig, P. How to Write a Spelling Corrector. Available online: http://norvig.com/spell-correct.html (accessed on 17 September 2016).
- Porter, M. Porter Stemming Algorithm. Available online: http://tartarus.org/martin/PorterStemmer/ (accessed on 17 September 2016).
- Dara, J.; Dowling, J.N.; Travers, D.; Cooper, G.F.; Chapman, W.W. Evaluation of preprocessing techniques for chief complaint classification. J. Biomed. Inf. 2008, 41, 613–623. [Google Scholar] [CrossRef] [PubMed]
- Vicient, C.; Sanchez, D.; Moreno, A. An automatic approach for ontology-based feature extraction from heterogeneous textual resources. Eng. Appl. Artif. Intell. 2013, 26, 1092–1106. [Google Scholar] [CrossRef]
- Wang, Y.; Liu, Y.; Feng, L.; Zhu, X. Novel feature selection method based on harmony search for email classification. Knowl.-Based Syst. 2015, 73, 311–323. [Google Scholar] [CrossRef]
- Yang, B.; Zhang, Y.; Li, X. Classifying text streams by keywords using classifier ensemble. Data Knowl. Eng. 2011, 70, 775–793. [Google Scholar] [CrossRef]
- Yang, Y.; Pedersen, J.O. A comparative study on feature selection in text categorization. ICML 1997, 97, 412–420. [Google Scholar]
- Nilsson, R.; Pena, J.M.; Bjorkegren, J.; Tegner, J. Consistent feature selection for pattern recognition in polynomial time. J. Mach. Learn. Res. 2007, 8, 589–612. [Google Scholar]
- Pandey, U.; Chakravarty, S. A survey on text classification techniques for e-mail filtering. In Proceedings of the 2010 Second International Conference on Machine Learning and Computing (ICMLC), Banglore, India, 9–11 Febuary 2010; pp. 32–36.
- Deng, X.B.; Ye, Y.M.; Li, H.B.; Huang, J.Z. An improved random forest approach for detection of hidden web search interfaces. In Proceedings of the 2008 International Conference on Machine Learning and Cybernetics, Kunming, China, 12–15 July 2008; Volume 3, pp. 1586–1591.
- Bissacco, A.; Yang, M.H.; Soatto, S. Fast human pose estimation using appearance and motion via multi-dimensional boosting regression. In Proceedings of the 2007 IEEE Conference on Computer Vision and Pattern Recognition, Minneapolis, MN, USA, 17–22 June 2007; pp. 1–8.
- Hutchinson, R.A.; Liu, L.P.; Dietterich, T.G. Incorporating Boosted Regression Trees into Ecological Latent Variable Models. AAAI 2011, 11, 1343–1348. [Google Scholar]
- Pittman, S.J.; Brown, K.A. Multi-scale approach for predicting fish species distributions across coral reef seascapes. PLoS ONE 2011, 6, e20583. [Google Scholar] [CrossRef] [PubMed]
- Johnson, R.; Zhang, T. Learning nonlinear functions using regularized greedy forest. IEEE Trans. Pattern Anal. Mach. Intell. 2014, 36, 942–954. [Google Scholar] [CrossRef] [PubMed]
- Shermis, M.D.; Burstein, J. Handbook of Automated Essay Evaluation: Current Applications and New Directions; Routledge: New York, NY, USA, 2013. [Google Scholar]
- Guthrie, D.; Allison, B.; Liu, W.; Guthrie, L.; Wilks, Y. A closer look at skip-gram modelling. In Proceedings of the 5th international Conference on Language Resources and Evaluation (LREC-2006), Genoa, Italy, 24–26 May 2006; pp. 1–4.
© 2017 by the authors; licensee MDPI, Basel, Switzerland. This article is an open access article distributed under the terms and conditions of the Creative Commons Attribution (CC-BY) license (http://creativecommons.org/licenses/by/4.0/).