1. Introduction
Symmetry is ubiquitous. It can be found in formations that have emerged in evolution, such as bird wings and bugs, and in physical structures like crystals, as well as in man-made objects like cars, buildings, or art. Symmetry as a concept refers to any manner, in which part of a pattern can be mapped onto another part of itself [
1]. While this can be done by translation (translational symmetry) or rotation (rotational symmetry), reflectional symmetry, in which a part of a pattern is mirrored along an axis, is special because it is highly salient for human observers [
2]. Reflectional symmetry has been linked to attractiveness in faces [
3] and it is thought to serve as an indicator of normal development, general health or the ability to withstand stress [
4,
5,
6]. Symmetry was linked to beauty not only in natural stimuli, but also in abstract patterns [
7]. Together, these findings suggest that the perception of symmetry is a general mechanism that plays an important role in our aesthetic judgment.
In mathematics, symmetry is a clean, formal concept of group theory. In contrast, symmetry detection in computer vision is faced with real world data, which can be noisy, ambiguous and even distorted. Nevertheless, several algorithms to detect symmetry in real world data have been proposed [
8,
9,
10]. Much work has been done regarding the detection of axes of symmetry in an image. Continuous symmetry, as described by [
11], measures the degree to which symmetry is present in a given shape (defined by a set of points). In the present article, we introduce a novel measure of continuous symmetry, which approximates the perception of natural images by human observers. The aim of this measure is to indicate to which degree reflectional symmetry is present in an arbitrary image. While this task is easily accomplished by humans, it is much harder for computers. One possibility to assign a measure of continuous symmetry to images is to compare luminance values along an axis of the image, as proposed in [
12]. However, this approach differs substantially from how humans perceive real-world scenes. Instead of comparing pixels, humans detect edges and group them into shapes, textures and, finally, into objects. Such grouping contributes to symmetry perception by humans. Shaker and Monadjemi [
13] proposed a symmetry measure that uses edge information in gray-scale images. Although this approach goes beyond the restricted usage of luminance intensity information, it does not take into account color and shapes. In the present article, we propose a novel algorithm that detects symmetry in a manner that is closer to how humans perceive symmetry. To this aim, we use filter responses from Convolutional Neural Networks (CNNs), which have gained huge popularity among computer vision researchers in recent years. The novelty of our measure is twofold: First, by using CNN filter responses, we take color and spatial frequency information into account, as done by the human visual system, namely by encoding color-opponent edges as well as color blobs and spatial frequency information [
14,
15]. Second, we show that features from higher CNN layers, where more abstract image content is represented [
16], can improve the prediction of symmetry judgements of human observers even further.
Although CNNs were first proposed more than two decades ago [
17,
18], they have become state-of-the-art technology for many computer vision tasks only recently, due to progress in computing technology, such as the introduction of graphic cards for calculations, and the availability of huge amounts of data for training. Currently, CNNs are being applied to object recognition tasks [
19,
20], image description [
21], and texture synthesis [
22], and they have conquered other areas like speech recognition [
23]. CNNs learn a hierarchy of different filters that are applied to an input image, enabling them to extract useful information. The training algorithm works in a supervised manner, which means that, given an input image, the output is compared to the target output so that an error gradient can be computed. Using backpropagation, parameters of the model are changed so that the error is minimized and the network gets better at solving the task at hand.
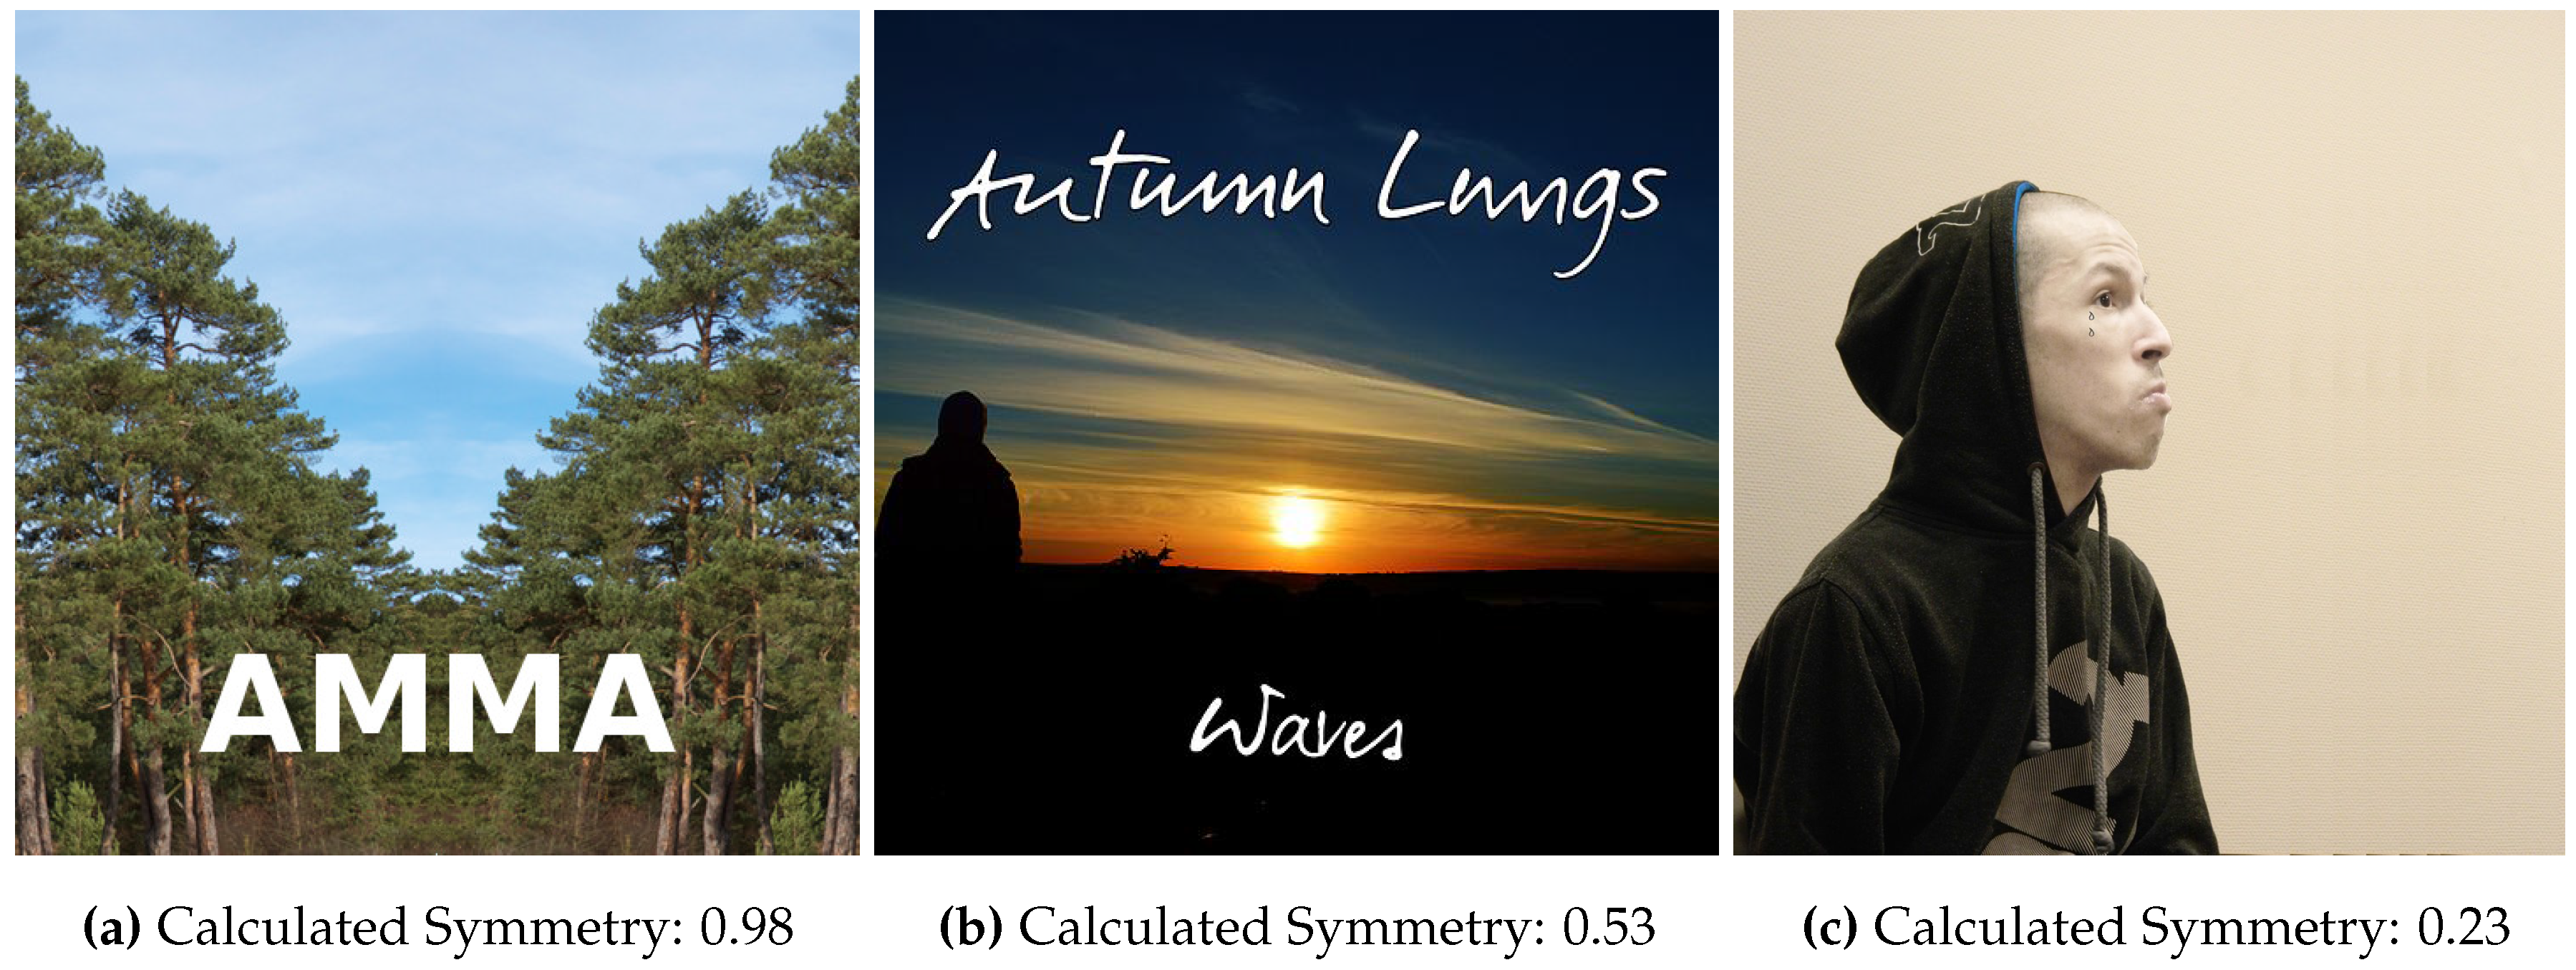
In our study, we use filter responses from CNNs that were trained on millions of images of objects [
24] for measuring continuous symmetry in images. To validate our results, we collected a dataset of 300 different CD album covers and asked human observers to rate them according to their left/right symmetry. CD album covers are especially suited for this task because they offer a wide variety and different degrees of symmetry. For each of the 300 images, the subjective symmetry ratings were compared to the symmetry measure obtained by our algorithm.
2. Materials and Methods
2.1. Measuring Continuous Symmetry Using Filter Responses from Convolutional Neural Networks
As mentioned above, CNNs learn a hierarchy of different filters that are applied to an input image. Filters reside on layers, where higher layers tend to extract more and more abstract features from an image, compared to the previous ones. Different layer types have been proposed and are investigated in ongoing research. The model we use in our experiments, referred to as
CaffeNet, was proposed by [
19] and is provided as a part of the Caffe Library [
24]. It consists of a total of 8 building blocks, each consisting of one or more different layer types:
Convolutional layers, in which the output of a previous layer is convolved with a set of different filters,
pooling layers, in which a subsampling of the previous layer is performed by taking the maximum over equally sized subregions, and
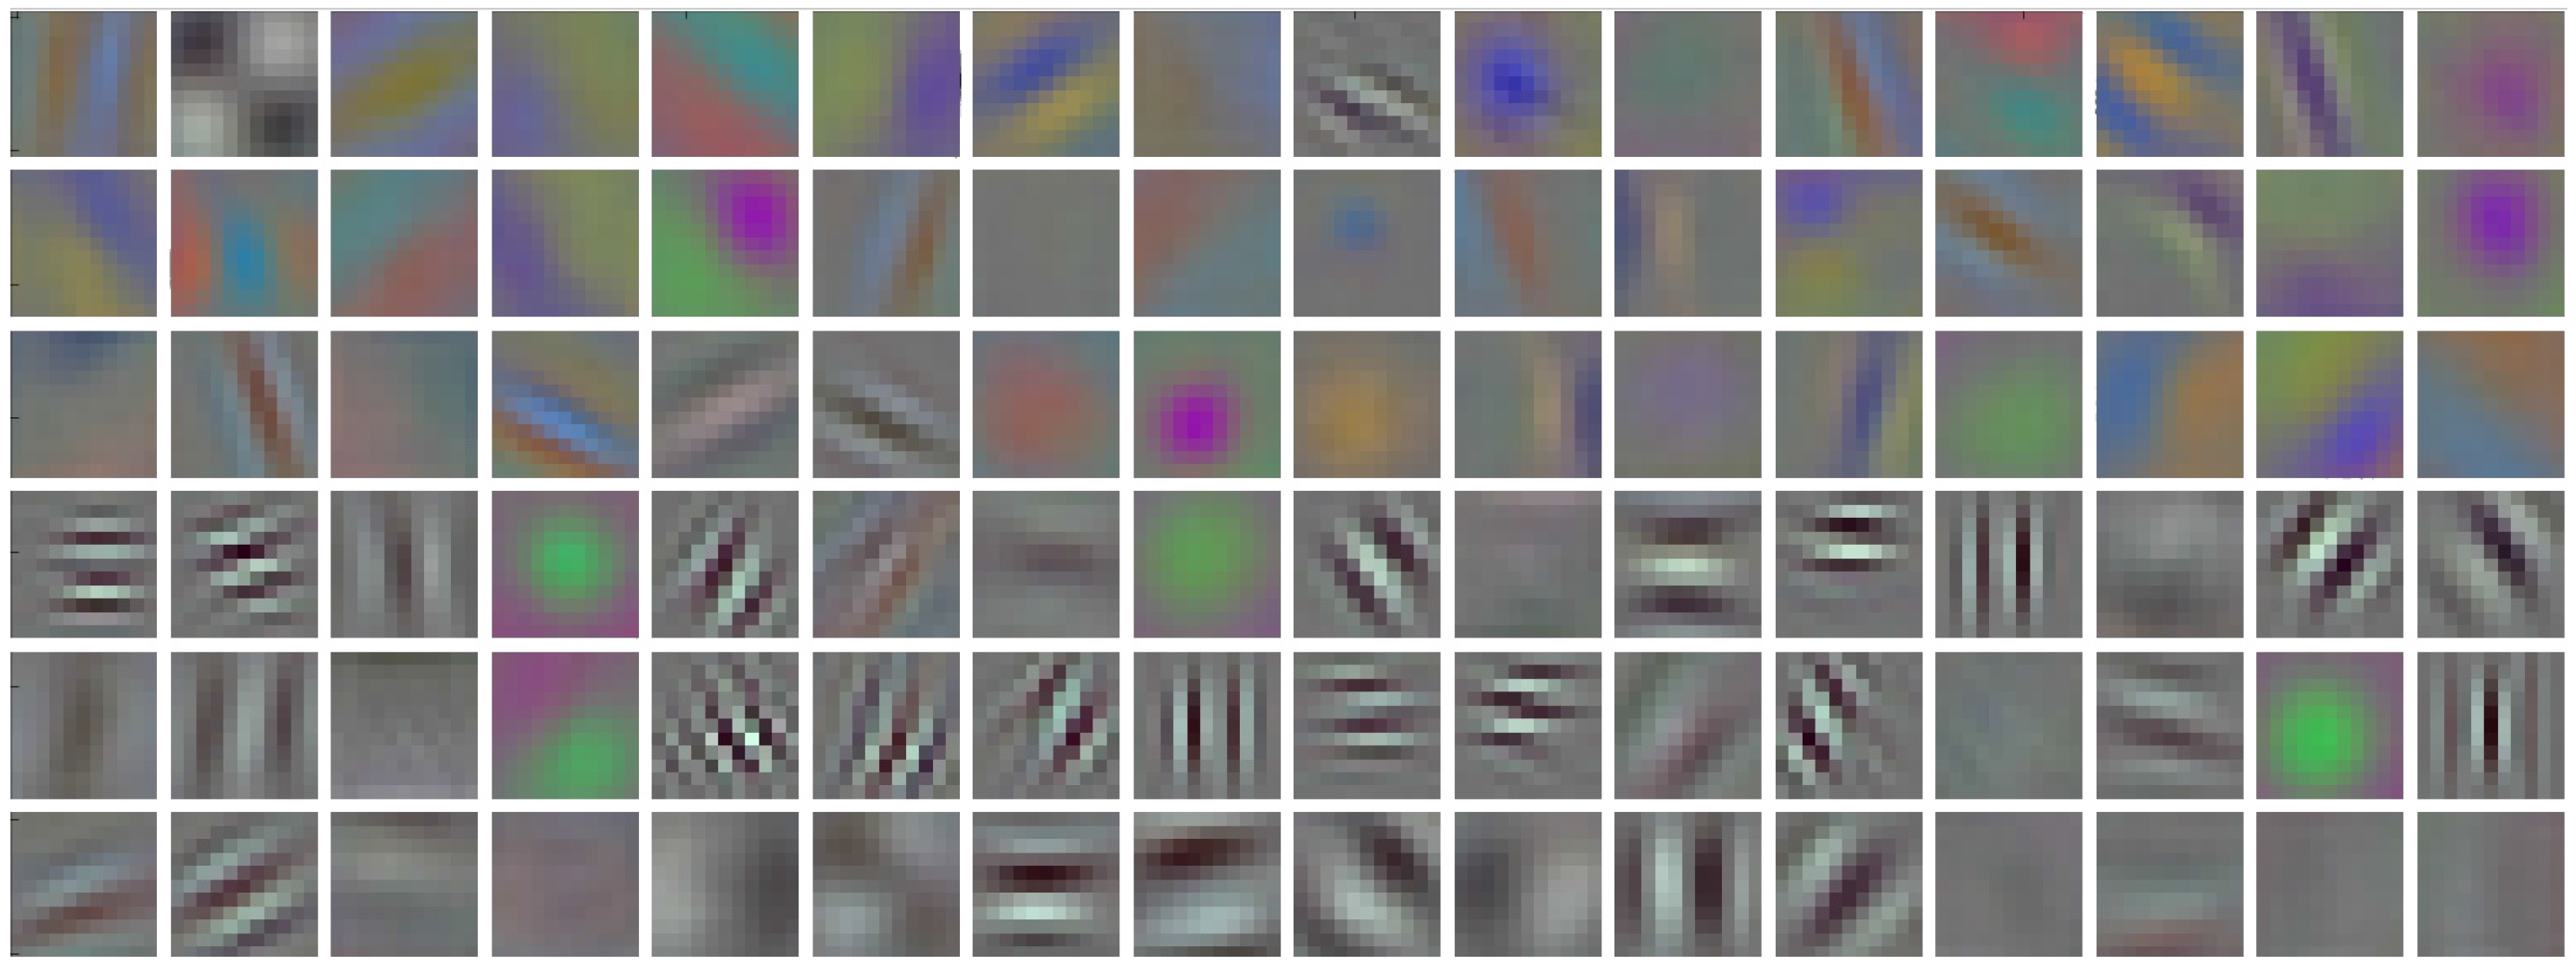
normalization layers, which perform a local brightness normalization. Several fully-connected layers that are stacked on top of a network learn to map extracted features onto class labels. Interestingly, the filters on the first layer tend do develop oriented Gabor-like edge detectors, akin to those found in human vision, when trained on huge datasets containing millions of natural images [
25] (see
Figure 1). In our experiments, we drop the fully connected layers on top, which allows us to resize the input to have a dimension of
pixels. Using this modification of the
CaffeNet model [
24], we propose an algorithm that measures continuous left/right mirror symmetry of natural images, as follows.
First, every image is fed to the network, which yields 96 filter response maps after the first convolutional layer, 256 after the second, 384 after the third and fourth, and 256 after the last convolutional layer. Using these filter responses, we then build a histogram of the maximum responses of equally sized, non-overlapping subregions of these maps, i.e., we perform a max-pooling operation over a grid of equally sized areas (patches). In the remainder of this article, a patch level of n refers to a tiling of the filter response maps into subregions.
Using convolutional layer , this procedures provides us with a max-pooling map , which has three dimensions: two positional parameters of the subimage, on which the max-pooling was performed, and one dimension that holds the maximum responses in that subimage for each filter. We then flip the image along the middle vertical axis and repeat the same procedure for the flipped version, which provides us with another five max-pooling maps .
In order to measure the reflectional symmetry of an image, we measure the asymmetry of the max-pooling maps
and
by calculating how different the right and the left side of any given image are, using the following equation:
where
x and
y iterate over all subimages and
f iterates over all filters on layer
l. Subtracting
from one yields our final measure of symmetry:
This measure is bounded between zero and one (for asymmetric images and for highly symmetric ones, respectively).
2.2. Image Dataset
In order to evaluate the algorithm proposed in
Section 2.1, we used a dataset of 300 CD album covers that were collected from the internet in 2015 (kindly provided by Ms. Maria Grebenkina, University of Jena School of Medicine). Images were equally distributed between three different music genres (classic music, pop music and metal music). All cover images had a resolution of
pixels, or were down-sampled to this size by bicubic interpolation if the original image had a higher resolution. A complete list of the 300 CD covers used in this study is provided in Supplementary Table S1. The dataset is made available on request for scientific purposes (please contact author C.R.).
2.3. Rating Experiment
Images of the 300 CD album covers (see above) were rated for their symmetry. Twenty participants (21–62 years old; Mean = 36 years; 6 male), mostly medical students or employees of the basic medical science department, participated in the experiment. All participants reported to have corrected-to-normal vision. Images were presented on a calibrated screen (EIZO ColorEdge CG241W, pixels resolution) on a black background. A chin rest ensured a constant viewing distance of 70 cm. The images extended pixels on the screen (, corresponding to degrees of visual angle).
The study design was conducted in line with the ethical guidelines of the Declaration of Helsinki on human participants in experiments. The Ethics Committee of Jena University Hospital approved the procedure. Prior to participating in the study, all participants provided informed written consent on the procedure of the study. The participants were tested individually in front of the screen in a shaded room with the windows covered by blinds. First, the experimenter gave the instructions for the experiment. The participant was asked to rate the presented image according its left/right symmetry. The participants started the experiment with a mouse click. Then, for the first trial, a fixation cross appeared on the screen for between 300 and 800 ms followed by the first image. The question displayed on the screen below the image was “How symmetric is this image?” The participant rated the presented images on a continuous scale that was visualized as a white scoring bar on the bottom of the screen. The extremes of the scale were labeled as “not symmetric” and “very symmetric”, respectively. Immediately after the response, the second trial with the next image was initiated, and so on. Images were presented in random order. After each of 100 trials, participants were allowed to take a rest for as long as they wished. The final symmetry rating value for each cover was defined as the median of the ratings of all 20 participants. To test for normality of the resulting data, D’Agostino and Pearson’s normality test [
26] was used.
3. Results
In order to validate the computer algorithm proposed in the present work, 20 participants rated the left/right symmetry of 300 covers from CD albums featuring pop music, metal music or classic music. For 97 covers, the distribution of ratings was not normally distributed (
). As a representative value for a cover, we thus decided to use the median of all ratings for this cover.
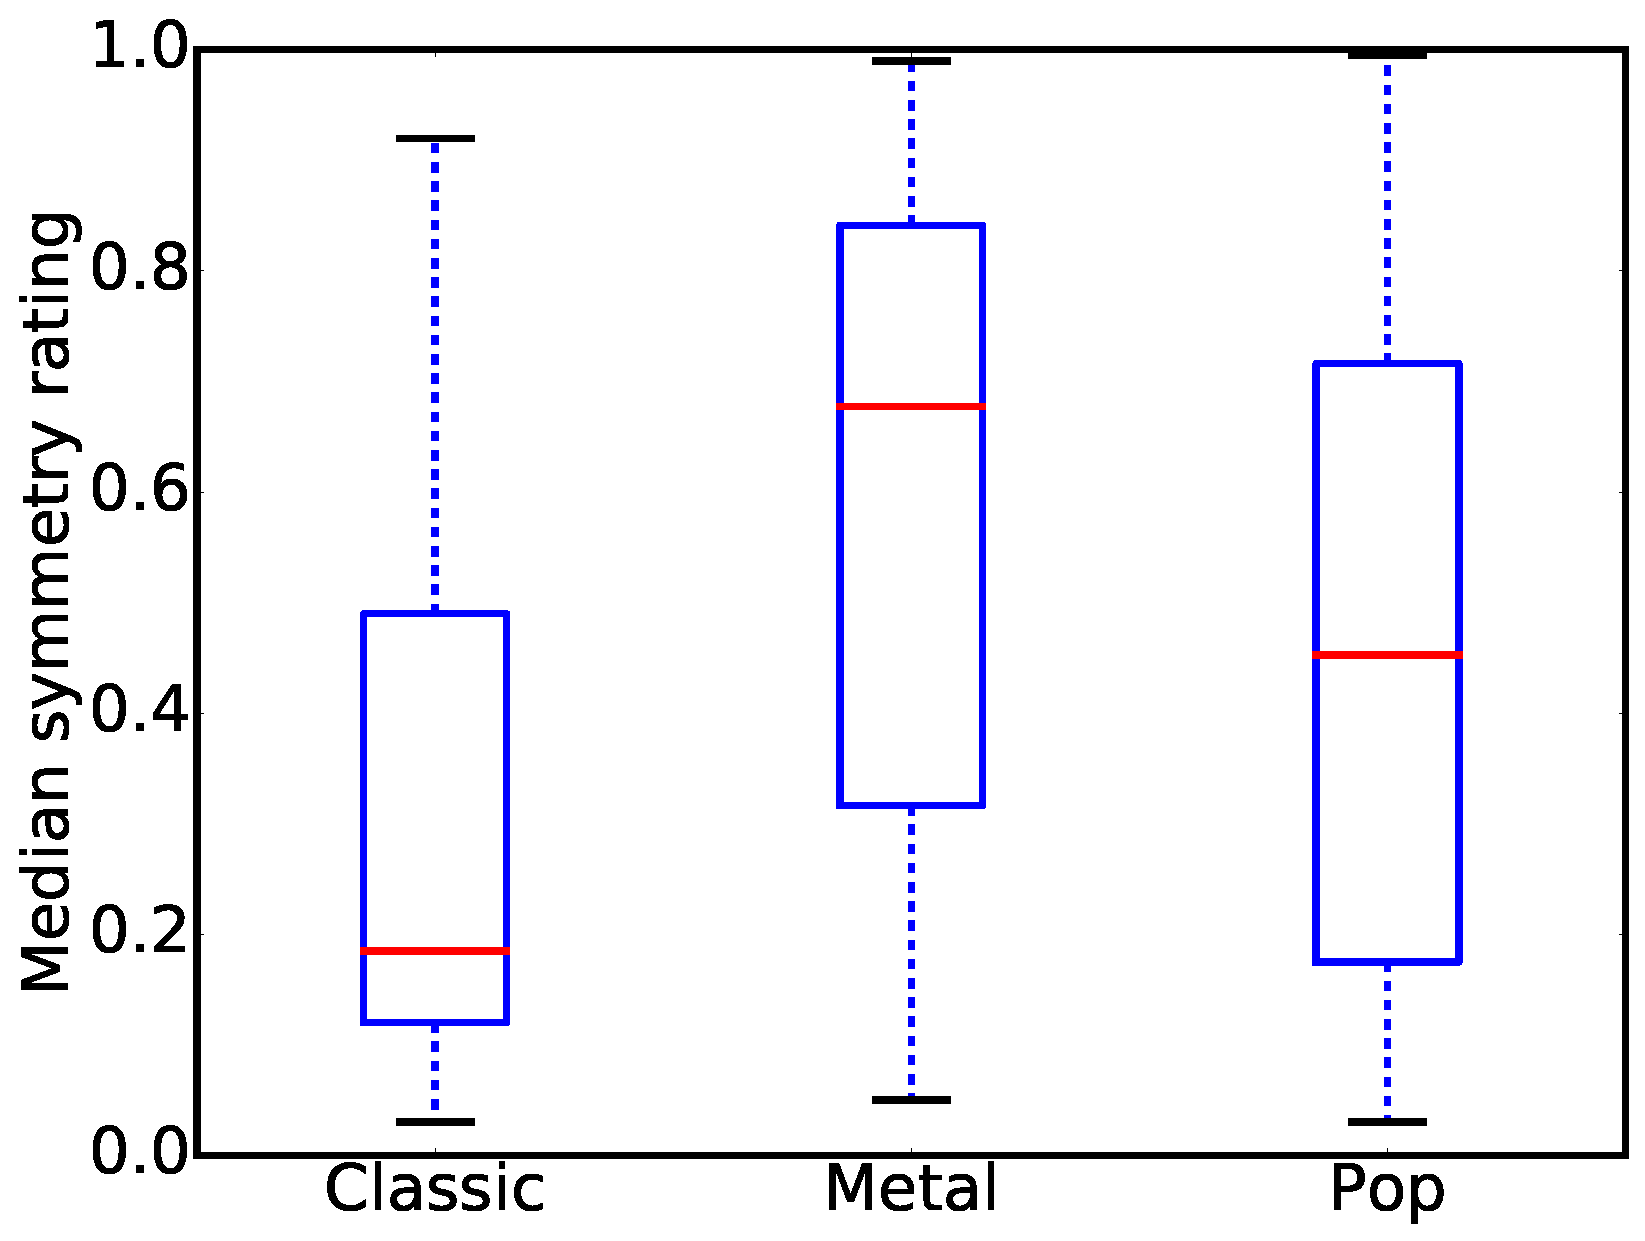
Figure 3 shows box-plot diagrams of the resulting subjective ratings for the three music genres. Median symmetry is highest for covers of metal music, intermediate for pop music, and lowest for covers of the classic genre. The symmetry ratings for all three music genres span a wide range of values, including extreme values. Consequently, the cover images seem sufficiently diverse with respect to their symmetry to serve as the ground truth in the validation of our model of left/right symmetry perception by human observers.
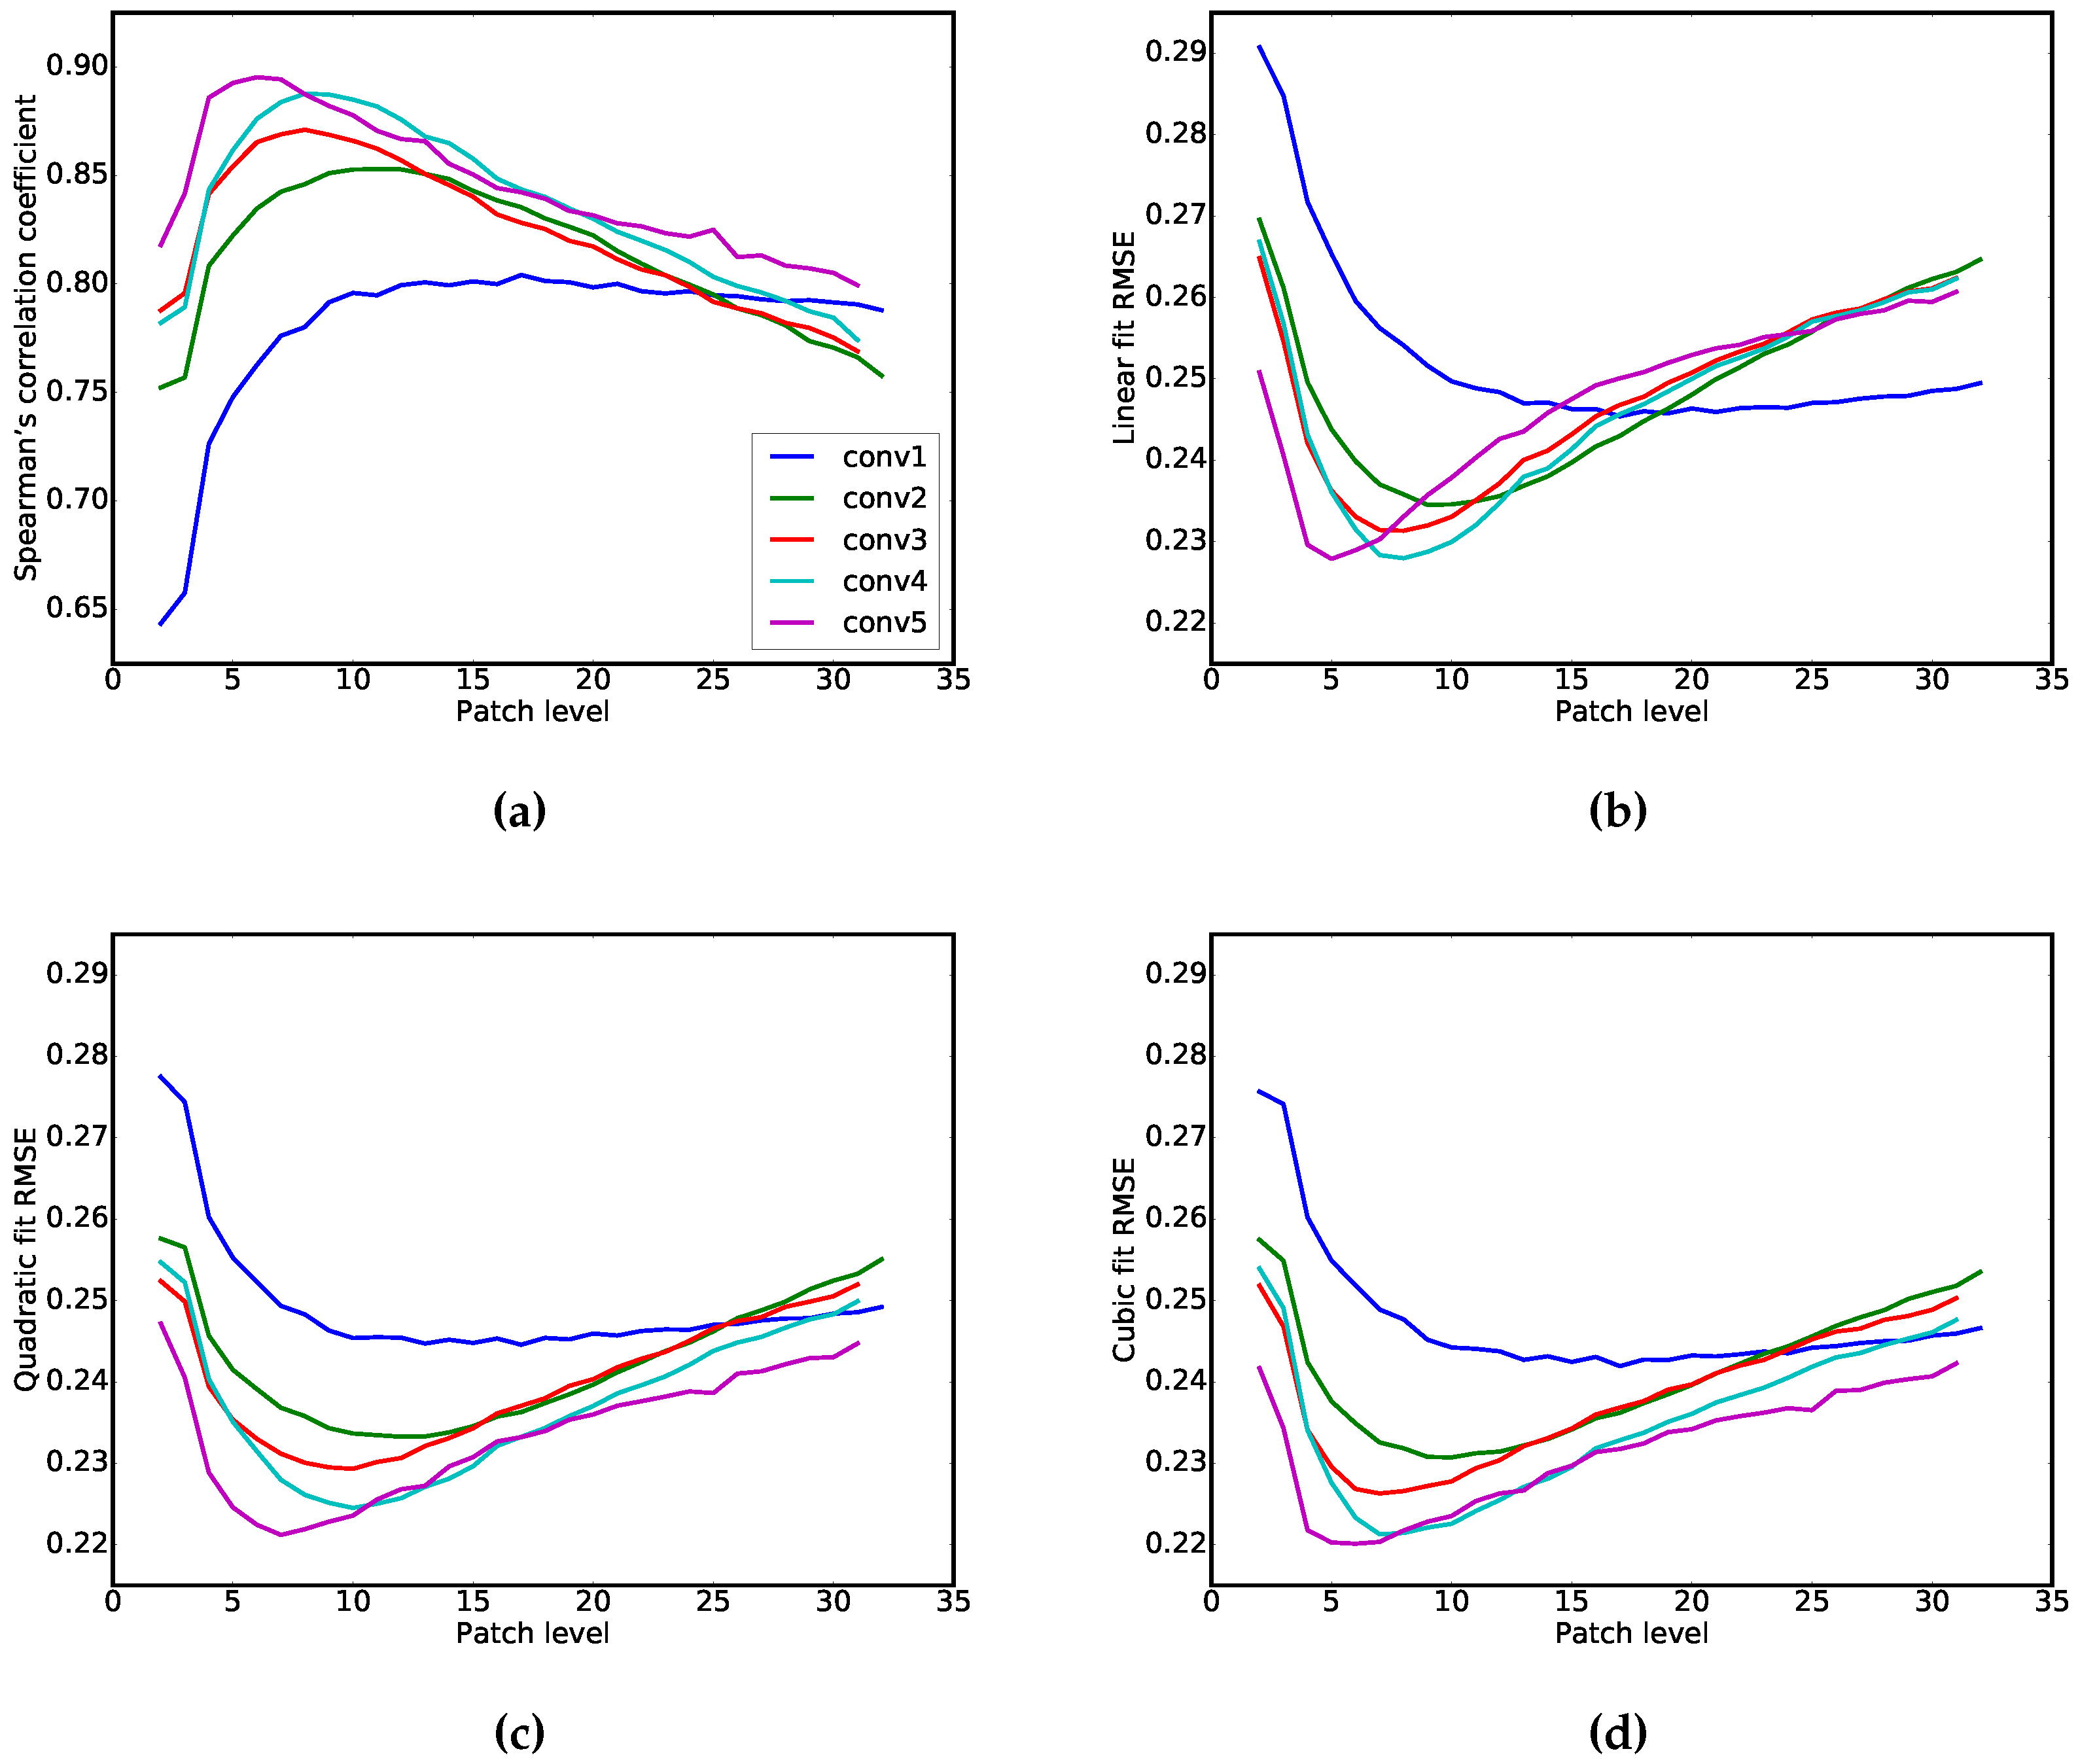
In order to maximize the correlation between the subjective ratings and the symmetry values calculated with our algorithm (see
Section 2.1), we modified the following two parameters: First, we are free to chose which of the five convolutional layers of the CaffeNet model serves as a basis for the calculations. Second, we can decide how many subregions to use in the max-pooling operation. We therefore tested all five layers of the model. In addition, for layers conv1 and conv2, we obtained results for patch levels 2–32 and, for the upper layers, for patch levels 2–31 (note that the number of patches is restricted by the size of the response maps, which is
pixels for layers above conv2). We calculated our measure of symmetry for each of these parameter configurations (see
Figure 2 for examples) and compared results with the human ratings. Because the distribution of ratings for many covers was not normally distributed (
, D’Agostino and Pearson’s normality test), Spearman’s rank coefficients were calculated.
Figure 4a plots the coefficients for the different model configurations. The correlation coefficients obtained for our model ranged from 0.64 (for convolutional layer 1 using patch level with 2 patches squared) to 0.90 (for convolutional layer 5 with 6 patches squared). Additionally, we provide the RMSE of a linear fit (
Figure 4b), a quadratic fit (
Figure 4c) and a cubic fit of the distributions (
Figure 4d) to better understand the relation between our measure and the subjective ratings. Resulting trends are similar to those of the correlation analysis (
Figure 4a); the quadratic and cubic models have a lower RMSE than the linear model, which indicates they provide a better fit of the relation between ratings and our measure.
For comparison, we implemented the symmetry measure recently proposed by [
12] and measured a correlation of 0.34 for their model. Thus, all configurations tested in our model outperformed the previously proposed method. We also tried to compare our results with the approach described in [
13]. However, due to missing details regarding the filtering process used in [
13], we were not able to reproduce their results.
In our model, convolutional layer 1 performed worst with 2 patches squared, but results for this layer improved when more patches were used, i.e., when we use more, but smaller max-pooling regions. A plateau is reached at around 10 patches squared with a maximum correlation of 0.80 peak at 17 patches (
Figure 4a).
Interestingly, the correlations between human ratings and our measure increase when higher layers of the network are used. For the second convolutional layer, the correlation peaks at 0.85 with 11 patches and then drops steadily as more patches are used, performing even worse than convolutional layer 1 at around 24 patches and above. The same can be observed for layers above layer 2 where the correlations peak at smaller number of patches and then drop rapidly. Specifically, the peak is reached at around 8 patches squared for layer 3 and 4, and at 6 patches squared for the highest (fifth) layer (see
Figure 4).
In
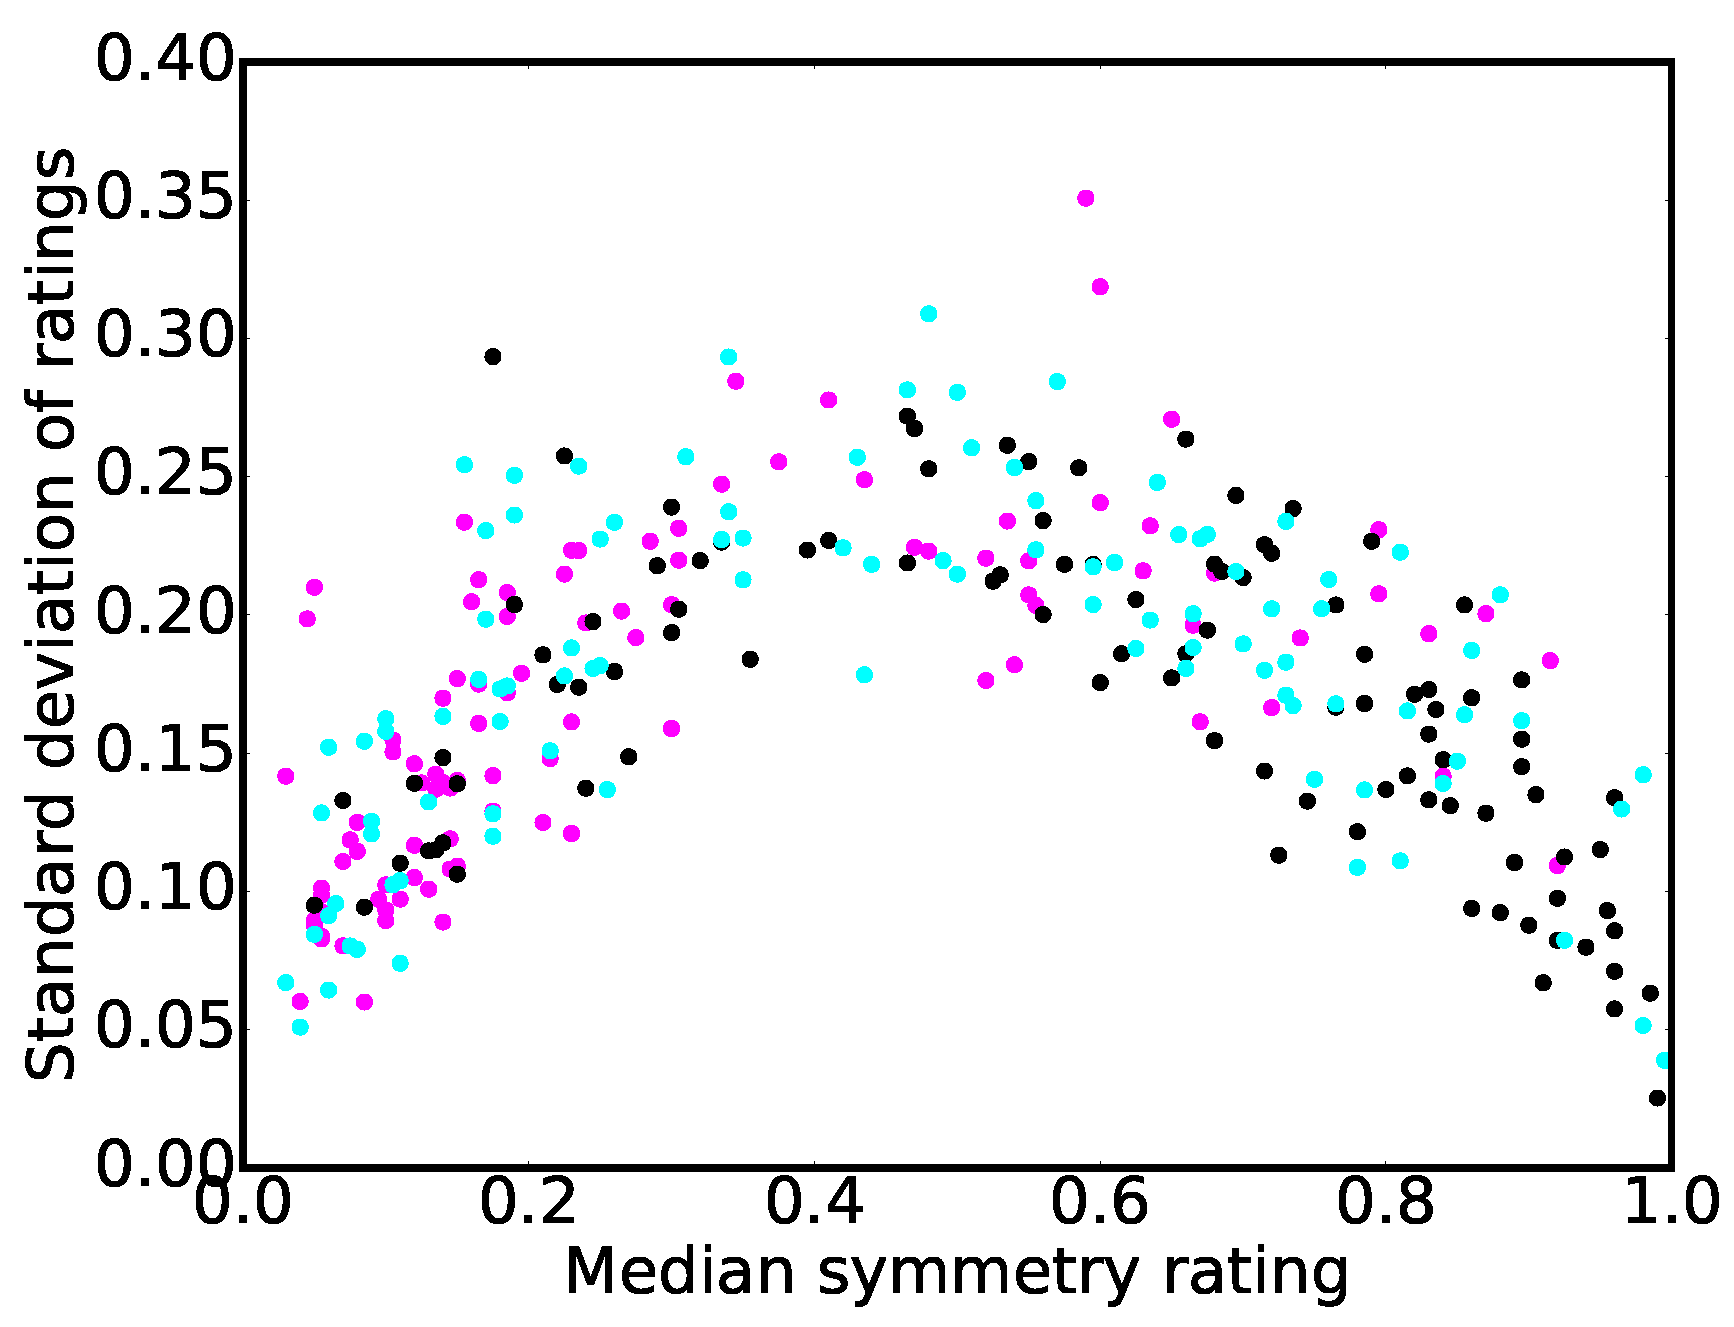
Figure 5, median symmetry ratings for each image are plotted as a function of the values calculated for two model configurations with high correlations. For both configurations, the rated and calculated values seem to correspond better at the extremes of the spectrum, i.e., for symmetry values closer to 0 or 1. In the mid-part of the spectrum, the two values correlated less well for the individual images. To visualize whether similar difference can also be observed at the level of individual observers,
Figure 6 plots the standard deviation of all ratings for each cover over its median rating. The resulting plot shows an inverse u-curve shape, which means that the standard deviation of ratings is lower for highly symmetric covers and highly asymmetric covers, i.e., at the extremes, compared to symmetry values at the mid-part of the rating spectrum. In conclusion, while people tended to agree whether an image is highly symmetric or highly asymmetric, judgments show a higher deviation for images not falling into one of the extremes.
4. Discussion
In the present study, we introduce a novel computational measure of left/right symmetry that closely matches human perception, as exemplified for symmetry ratings of 300 CD album covers by human participants. Using CNN filter responses in our measure has two main advantages. First, CNN filters of the first layer are thought to resemble edge detectors akin to those found in the human visual system (Gabor-like filters [
27]), as well as color detectors in form of color blobs and opponent color edges [
19,
25] (see
Figure 1 for an illustration of filters used on conv1, the first layer). Similar to human vision, we can take luminance, color and spatial frequencies in an image into account simultaneously by using features from lower layers of the CNN. Second, because features are becoming increasingly abstract when using higher layers for the max-pooling maps, our symmetry measure is more likely to reflect human perception of symmetry because it takes into account the grouping of visual elements in the images as well as more abstract image features.
The first advantage may explain why our method outperforms the symmetry measure based on intensity values [
12], which ignores color completely and does not deal with structural features like oriented edges. Furthermore, we group image regions over subimages (called
patches in the present work), which makes our measure more robust with regard to image features that are somewhat symmetric but not exactly mirrored. Comparing intensity values of pixels alone does not address this issue. However, although we demonstrated that our approach works well for music cover art, it remains to be investigated whether it can also be applied to other types of images.
The emergence of increasingly abstract features at higher layers of the CNN can explain some of the trends that we observed in our experiment at different layers and for different patch sizes. On the one hand, when the patches become too big, our measure does not perform well because there is not much local detail taken into account. On the other hand, when regions become exceedingly small, grouping of luminance values is no longer possible over larger areas and, consequently, our measure does not correlate well with the ground truth data (i.e., the subjective symmetry ratings). Higher-layer features seem to resemble human symmetry perception more closely, if patch size is optimal at higher layers (
Figure 4). We speculate that this resemblance can be explained by the fact that, when specific features or objects are prevalent in an image, larger patches are more tolerant regarding the exact position of these features or objects. For example, when people observe two faces in an image, one on the left side and one on the right side, the exact pixel positions of the faces are not critical for symmetry perception in our approach, as long as the faces have roughly corresponding positions with respect to the left/right symmetry axis.
Although the higher layers seem to resemble human symmetry perception of the CD album covers best, we cannot unconditionally recommend to use higher-layer features for getting the best results with other types of stimuli. Higher-layer features are not well understood yet, despite intense research [
16,
28,
29]. Yosinski et al. [
25] investigated how transferable learned features are between different tasks and found that the features from the first two layers only can be considered truly generic. Higher-layer features tend to be specific to the set of images that were used during training; this specificity may potentially limit their usefulness when novel images are encoded by the CNNs. Although we did not observe such a negative effect in our study, this potential problem should be kept in mind.
In order to evaluate the correlation between subjective ratings and calculated symmetry values, we measured Spearman’s rank (non-parametric) correlation. Thus, we did not exactly replicate the behavioral measures, but predicted their relative strength. We observed that quadratic and cubic models fit the relation between our measure and the subjective ratings better than a linear model, which indicates that the relation between the two measures is not strictly linear. In other words, our algorithm does not match the exact subjective ratings that one would get from human observers. Rather, the algorithm predicts the relative subjective impression of symmetry in sets of images. This correspondence is strongest when symmetry is either very prominent or almost absent. With intermediate degrees of symmetry, human observers tend to agree less on how symmetric an image is (
Figure 6). At the same time, the correspondence with the calculated values is less precise (
Figure 5).
5. Conclusions
We propose a novel computational method that was developed to predict human left/right symmetry ratings for complex, non-geometrical images, as exemplified by CD album covers. The aim of the model is to closely match subjective symmetry as judged by human observers. For this purpose, we used filters learned by CNNs because they are akin to receptive fields in the early human visual system and get more and more abstract at higher layers of the CNNs. In order to evaluate our method, we compared the results from the computational model with subjective ratings by 20 participants who assessed left/right symmetry in a dataset of 300 different album covers. We evaluated different model configurations by calculating the correlation between the computationally obtained results and the ratings by humans.
Results demonstrate that our algorithm outperforms a recently proposed method for measuring continuous symmetry in an image by comparing pixel intensities [
12]. Moreover, the correlation increased from 0.80 to 0.90 when we used filters from higher layers that focus on more abstract features. However, it remains to be established whether our approach also works for images other than album covers. For arbitrary images, we recommend to use second-layer features because they are known to be more universal than higher-layer features and lead to better results than first-layer features in our study.
In future research, we will use the proposed symmetry measure to study the role of symmetry in aesthetic perception, for example, by applying the measure to images of visual artworks and photographs.

