
Symmetry Extraction in High Sensitivity Melanoma Diagnosis

 , ,
, ,
Abstract
: Melanoma diagnosis depends on the experience of doctors. Symmetry is one of the most important factors to measure, since asymmetry shows an uncontrolled growth of cells, leading to melanoma cancer. A system for melanoma detection in diagnosing melanocytic diseases with high sensitivity is proposed here. Two different sets of features are extracted based on the importance of the ABCD rule and symmetry evaluation to develop a new architecture. Support Vector Machines are used to classify the extracted sets by using both an alternative labeling method and a structure divided into two different classifiers which prioritize sensitivity. Although feature extraction is based on former works, the novelty lies in the importance given to symmetry and the proposed architecture, which combines two different feature sets to obtain a high sensitivity, prioritizing the medical aspect of diagnosis. In particular, a database provided by Hospital Universitario de Gran Canaria Doctor Negrín was tested, obtaining a sensitivity of 100% and a specificity of 66.66% using a leave-one-out validation method. These results show that 66.66% of biopsies would be avoided if this system is applied to lesions which are difficult to classify by doctors.1. Introduction
A width spectrum of telemedicine models is available in our society. These models are based on the use of “Information and Communication Technologies (ICTs)” in order to provide clinical health care at a distance. In this context, telemedicine has brought the term e-health with it.
E-health is not only about telemedicine, but also covers all the new developments which have improved the quality of the diagnoses in hospitals. These new developments are using image and signal processing techniques to achieve more accurate diagnoses
Melanocytic diseases can be divided into two main groups. The first is composed of melanocytic nevus, which are benign accumulations of melanocytes, they are also known as moles. The second group is composed of melanomas. Melanomas are malignancies arising from melanocytes, mainly located on the skin (95%). Although they represent the 4% of the skin tumors, they cause 80% of deaths [1–4]. As in every cancer, its early detection is fundamental for recovery. Statistics show that if the melanoma is surgically removed when its thickness is lower than 1 mm, the patient will have a full recovery in 90%–95% of cases [5,6].
Taking into account the background, it can be divided into three developing groups. The first one is formed of studies which focus on the segmentation of the lesion. These tried to develop different techniques to detect the lesion and extract the region of interest from the image [7,8]. Techniques from second group applied some dermatologic rules, like the ABCD rule or seven-point checklist, to the images in order to evaluate different characteristics from the diseases [9]. The third group, the one which is composed of the most recent studies and the group where this system is located, is based on the use of classifiers. These techniques perform feature extraction to create the patterns for each of the classes to discriminate [10–18].
Although this work belongs to the third group and it uses well known features, its novelty is based on increasing the importance of the symmetry when feature extraction step is applied [19–22], since asymmetry shows an uncontrolled growth of cells, leading to melanoma cancer. As an important example of how the second and third group can be used together, in [10] a system architecture was presented based on Support Vector Machine which deals with the ABCD rule.
Standard ABCD dermatologic protocol has been source of numerous features extraction algorithms. According to each of the four evaluated aspects through the rule (Asymmetry, Borders, Color and Dermoscopic structures), the TDS (Total Dermoscopy Score) is calculated. To get the TDS value, the formula is obtained as follows:
Then the value obtained has the following conclusions that are 1.00 < TDS < 4.75—benign skin lesion, 4.75 < TDS < 5.45—suspicious, more than 5.45—melanoma. From the formula, one can sense the importance of symmetry (asymmetry), since its correction factor is the highest.
Related to A, the asymmetry of the disease, several methods for evaluation can be developed. In [12], a study of optimal axes for skin lesion asymmetry quantification showed the importance of the asymmetry and how it depends on the selected axes.
In [9], two values of asymmetry i.e., Asymmetry Index and Lengthening Index were computed. To evaluate border irregularity, four features were calculated, i.e., Compactness Index, Fractal Dimension, Edge Abruptness and Pigmentation Transition. The color distribution on the lesion was also computed to obtain the value of the parameter, C. Finally, diameter was used as D to calculate the TDS. The performance of the system showed an accuracy of 85%.
In [11], a set of global measurements of shape (aspect ratio, symmetry, compacity, etc.) and border irregularity [19] were computed from each lesion. More localized features of texture and color distribution were also extracted. Previous to their extraction, each lesion was decomposed into three sub-regions: the interior, the outer and inner. For each of the 476 benign lesions and 88 melanomas, a total number of 57 features were extracted. Performing decision trees combination via adaptive boosting and using 10 times–10 fold cross-validation, it was obtained a false positive rate of 4.62% for 95% sensitivity.
In [13,14], new methods were proposed to quantify border irregularity. Some of these methods consisted of applying gradient and Laplacian to the borders, computing irregularity using different equations [15], or evaluating the evolution of the radius along the lesion [5].
Color evaluation is used in the majority of the literature [9,16,17]. The differences are based on the color channels which were characterized in each of these works. These channels were Red-Green-Blue (RGB), Hue-Saturation-Value (HSV), Hue-Saturation-Intensity (HIS), and CIE Lab, which was defined by the Commission Internationale de l’éclairage.
Parameter D has been taken as the presence of dermoscopic structures in a few studies. This evaluation is a subjective part of ABCD rule which depends on the doctor evaluation. It was proposed in [5] in order to improve the results by adding methods to compute the presence of these structures. Other studies tried to replace D by the diameter of the lesion. In the present work, as the images were not captured at the same distance, it was not possible to measure the diameters of the different images.
As a third way to evaluate dermoscopic structures, texture of the image was characterized. In [16,23], different methods to compute the texture were proposed. One of them consists on calculating the gradient of the image. This method is also used in this work, evaluating both module and orientation of the gradient using Sobel masks.
ABCD rule and symmetry evaluation are well known techniques, reason why the feature extraction step of this work is based on both techniques.
Works grouped in the third group used Support Vector Machines and Neural Networks as classifiers, due to the nature of the features. Once features are extracted, the feature selection step is applied by analyzing what features are more discriminative. Then, the set is divided into training and testing subsets. Finally, the classifier uses both sets according to the selected techniques.
On contrast, the proposed approach uses two independent classifiers instead of only one. In this case, the system has been designed to use two Support Vector Machines with an independent set of features for each of them.
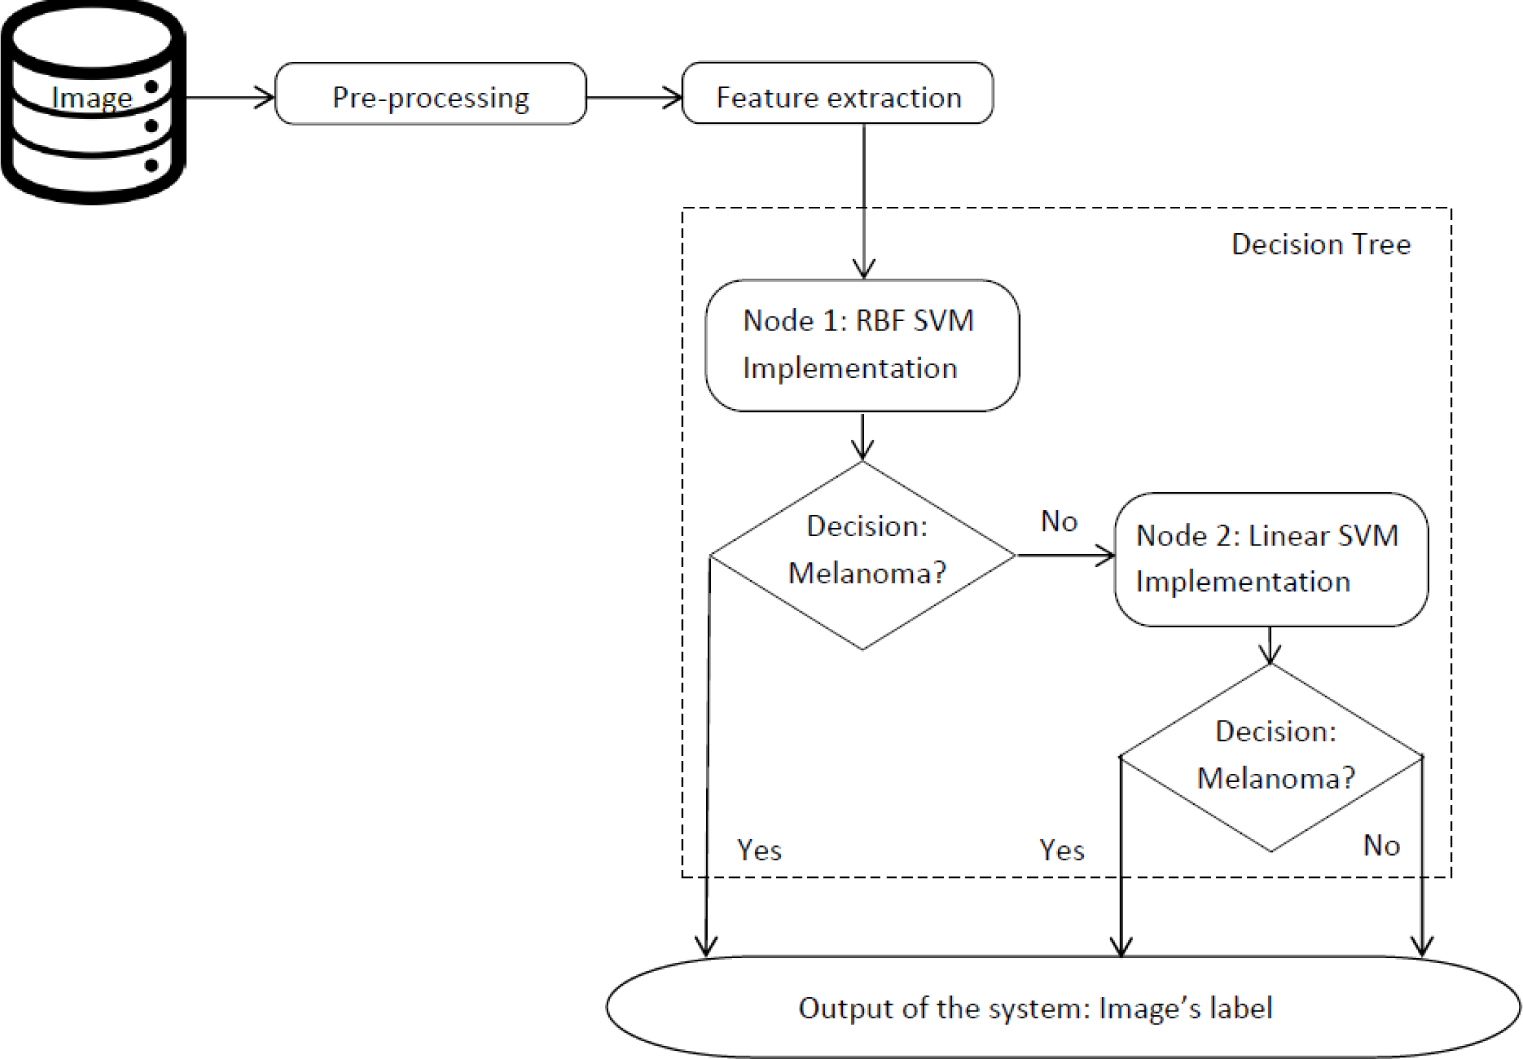
Another innovation of this work is to propose an approach from a medical point of view. It proposes a particular classification system composed by two classifiers in a tree structure where the sensitivity and the specificity reach up to 100% and 66.66%. It means this proposal always detects patients with melanoma cancer and avoids 66.66% of unnecessary biopsies when applying the system to lesions which are difficult to classify by doctors.
Therefore, the main contributions and innovations of this work are: (1) combination of sensitivity and specificity of the system to increase the medical character of the experiment; (2) symmetry as main measure to contribute to ABCD rule features (3) the strategy to combine both features set using the classification tree system (see Figure 1) and (4) an alternative method to label the testing samples. This presented architecture has shown an increase of the sensitivity over the methods compared. Another aspect which should be remarked on is the use of a database formed of seven types of melanocytic lesions.
The rest of this paper is organized as follows. Section 2 presents the proposed approach and methods based on a feature extraction stage related to ABCD rule, symmetry and support vector machines (SVM) classification. Section 3 introduces the database, results and discussions. The concluding remarks are presented in Section 4.
2. Materials and Methods
In this section, the proposed method is described in detail. To start with, the algorithms used to extract the features from the lesion are shown. Then, Support Vector Machines are introduced to show where the alternative labeling method is applied. Finally, the classification systems and the new method to label the samples are described.
2.1. Preprocessing
Before feature extraction, a preprocessing step is applied. This step focuses on noise removal, lesion detection and contour extraction.
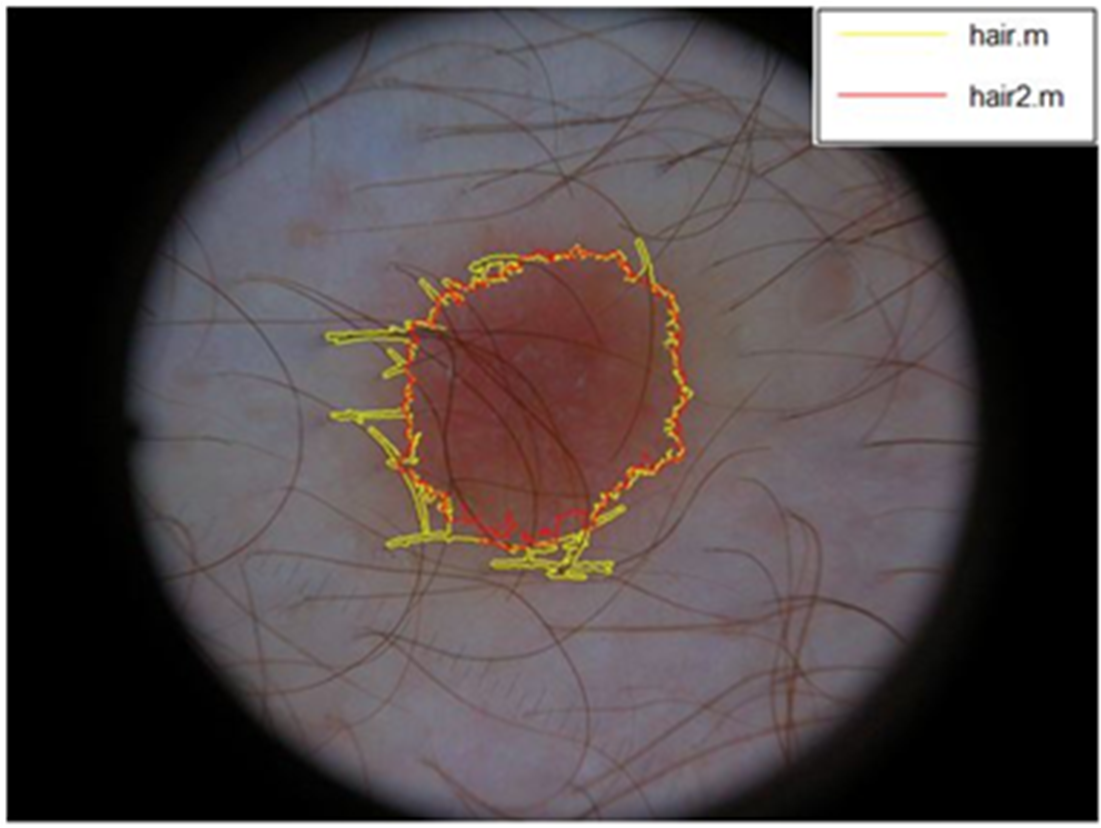
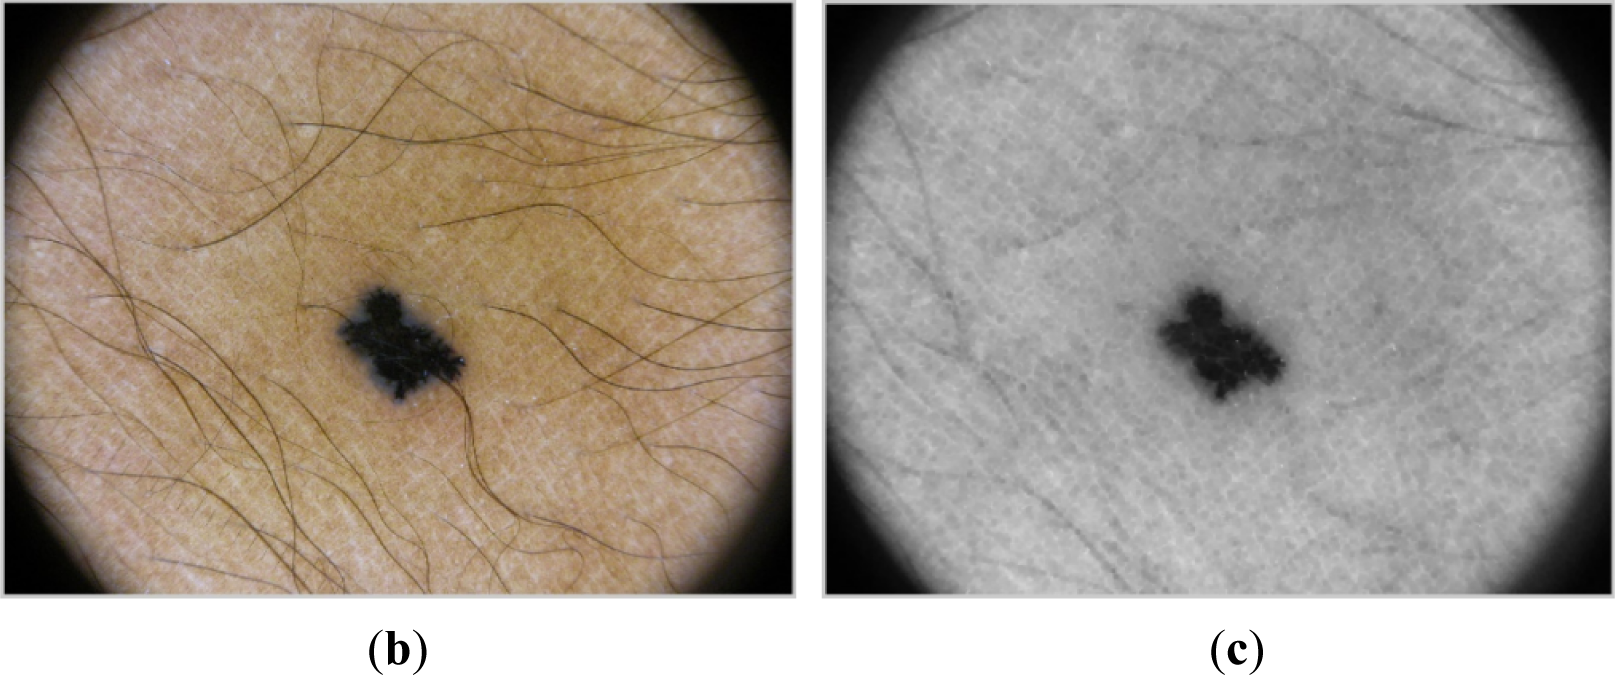
Noise is mainly represented by hair over the area of lesion which disturbs on contour extraction [24,25]. To remove possible hairs, the algorithm applies morphological operators [26] such as erosion and dilatation. This approach, depending on the structural element used, gives acceptable results (see Figure 2). “Disk” has been chosen as a structural element for the morphological operations listed above.
When possible hairs have been removed, the area of interest has to be detected [27]. If the grayscale image is directly binarized, a lesion will be a black object over white background due to lesions are darker than skin.
However, to make the detection easier, the lesion is desired to be a white object over black background. Therefore, complementary image of the grayscale image has to be processed.
Once the complementary image is obtained, it is binarized by applying Otsu’s method, calculating the threshold according to the processed image. Otsu’s method chooses the optimal threshold by maximizing the between-class variance with an exhaustive search. Otsu defined the between-class variance of the thresholded image as [28]:
Otsu’s method is applied to the central part of the image to avoid the influence of dermoscopy’s black borders when calculating the threshold. As dermoscopies are obtained with the lesion in the middle of the image, applying Otsu’s method to this area, we take into account skin and lesion colors.
Then, opening and closing operations are used to eliminate small objects and holes, respectively.
From all white objects with a considerable size, centroids and its Euclidean distances (Equation (3)) from the center of the image are calculated. After selecting the object with minimum Euclidean distance as main object, the rest are removed and the image is resized around it to optimize runtime.
To extract the contour of the lesion, dilatation operation is applied to the binarized image. Then, the binarized image is subtracted from the dilated one. Excellent results are obtained with the described method (see Figure 3). Hair does not affect to the contour of the lesion when using the new proposed algorithm. The contour is represented by a red perimeter. We were able to verify the results by visual inspection due to the clear aspect of the borders.
2.2. Feature Extraction
Feature extraction step is based on the ABCD dermatologic rule. Extracted features are emphasized by focusing on their symmetry information [19].
Extracted features are divided into two groups according with each of the two classifiers, as shown in Table 1.
First group is formed of features related to color and texture of the image. Color is characterized both in RGB, HSV, HSI and CIE Lab spaces. Texture is characterized using gradient of the image according to [16].
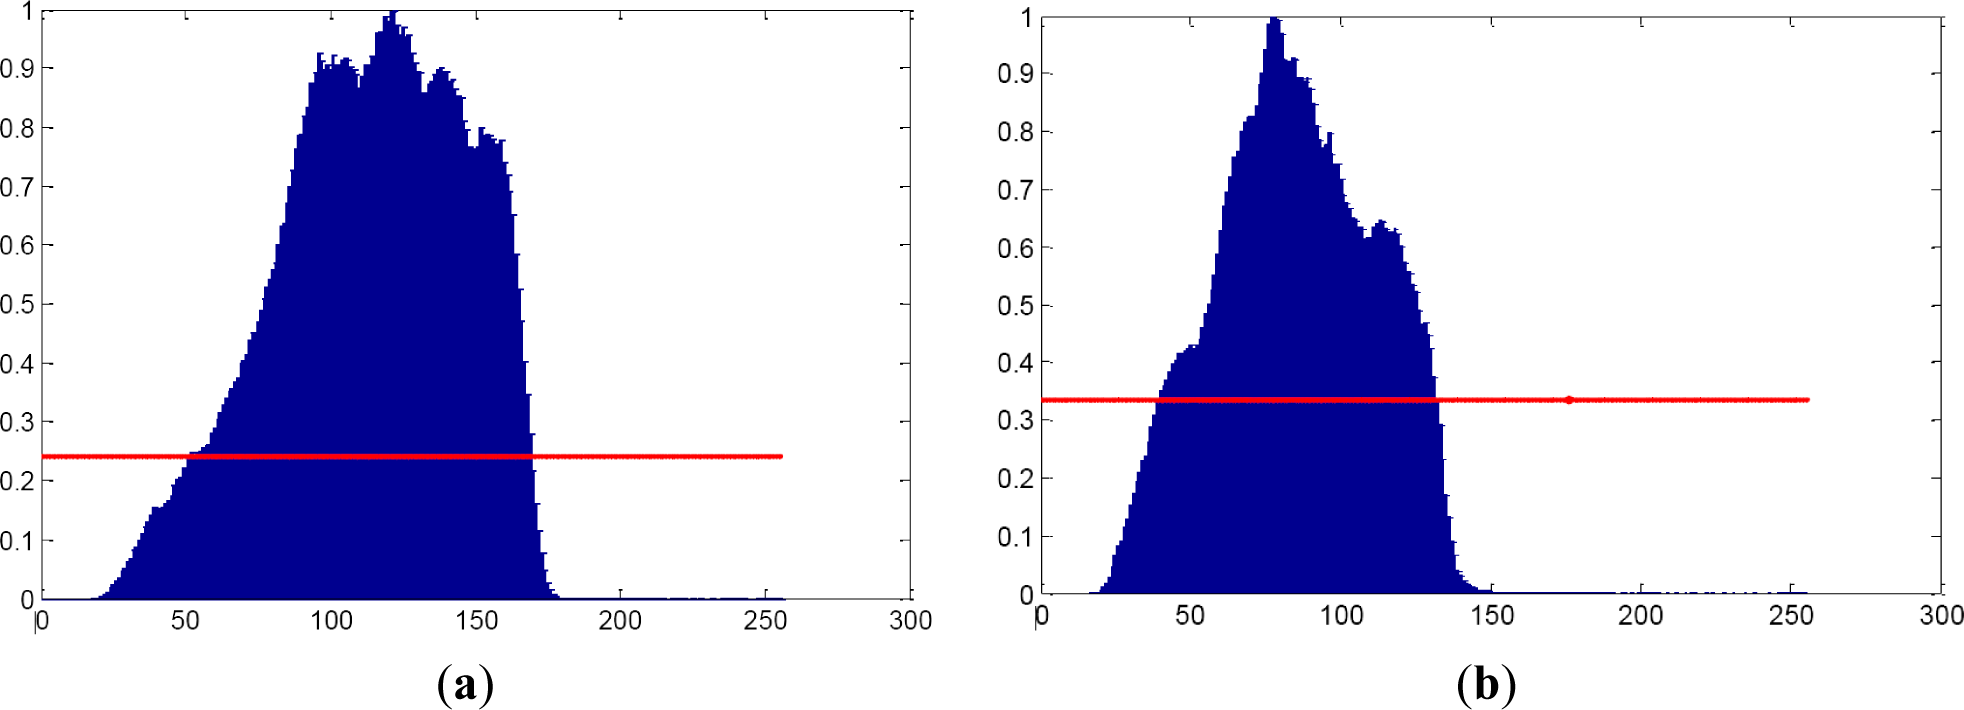
RGB color space is characterized by computing the width of the main lobes of both red, green, blue and grayscale histograms. The width is calculated according to the value obtained applying the equation below:
Color symmetry is being computed since information about number and width of lobes is being obtained. When a mole is computed, only a lobe is supposed to appear for each of the RGB components (see Figures 4 and 5).
R, G and B components are separated into 3 different vectors. Each of these vectors is evaluated by calculating its maximum and minimum values, means and standard deviations.
HSI, HSV and CIE Lab are also divided in three vectors. The difference for HSI evaluation is due to S channel and gives no information. Moreover, H and I channels have to be normalized because they depend on the tone of the skin around the lesion. HSV and CIE Lab are characterized with the exception of its means, which gives no practical information.
Finally, relative chromaticity is also calculated for RGB color space [14]. It is computed by using the equation below:
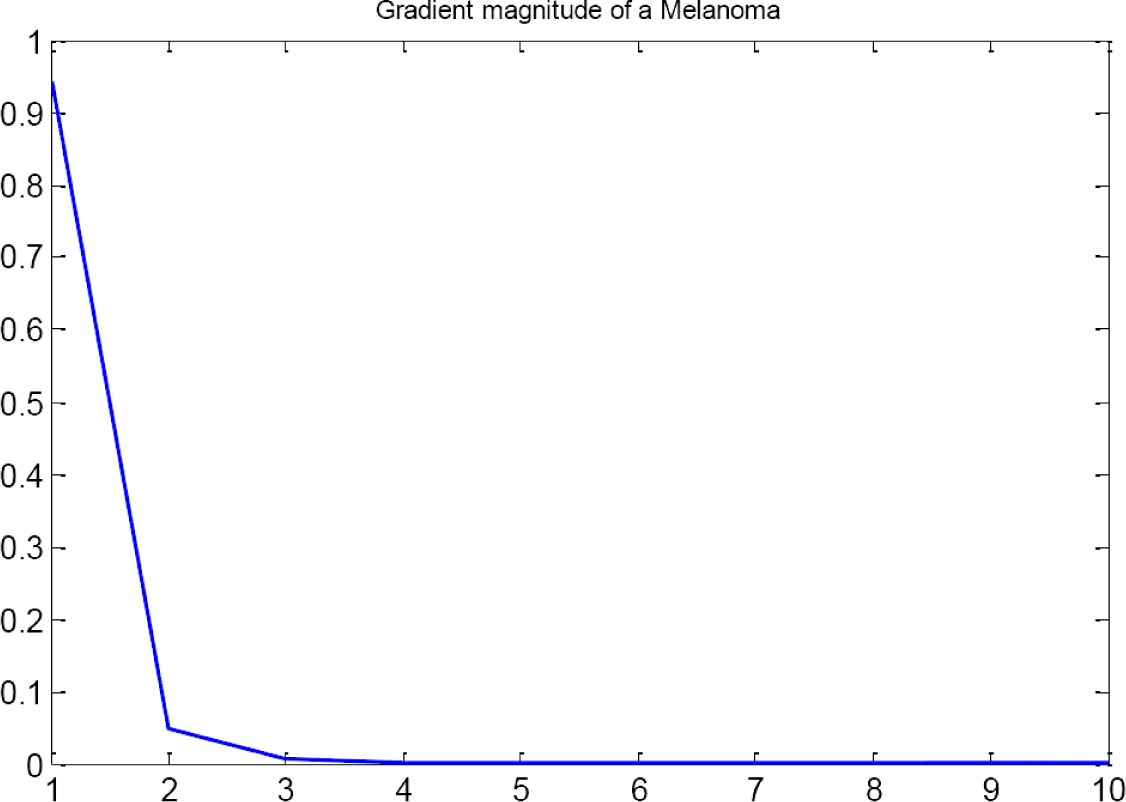
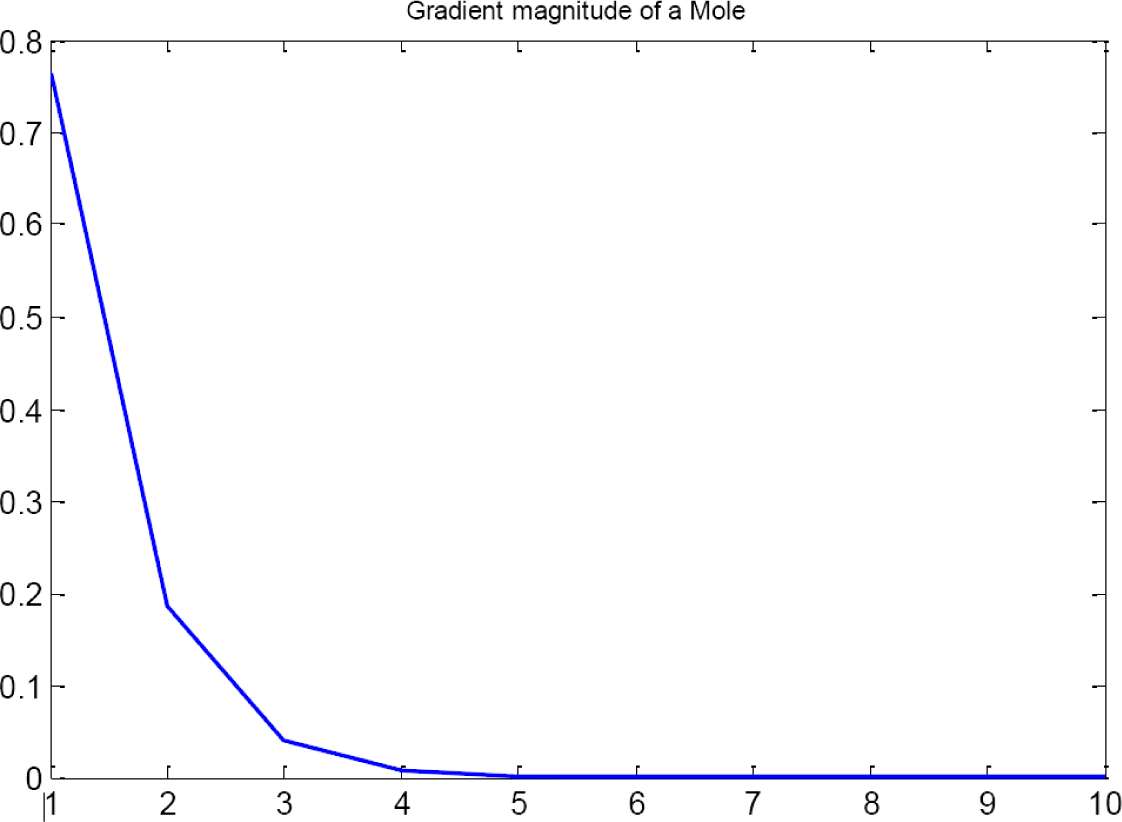
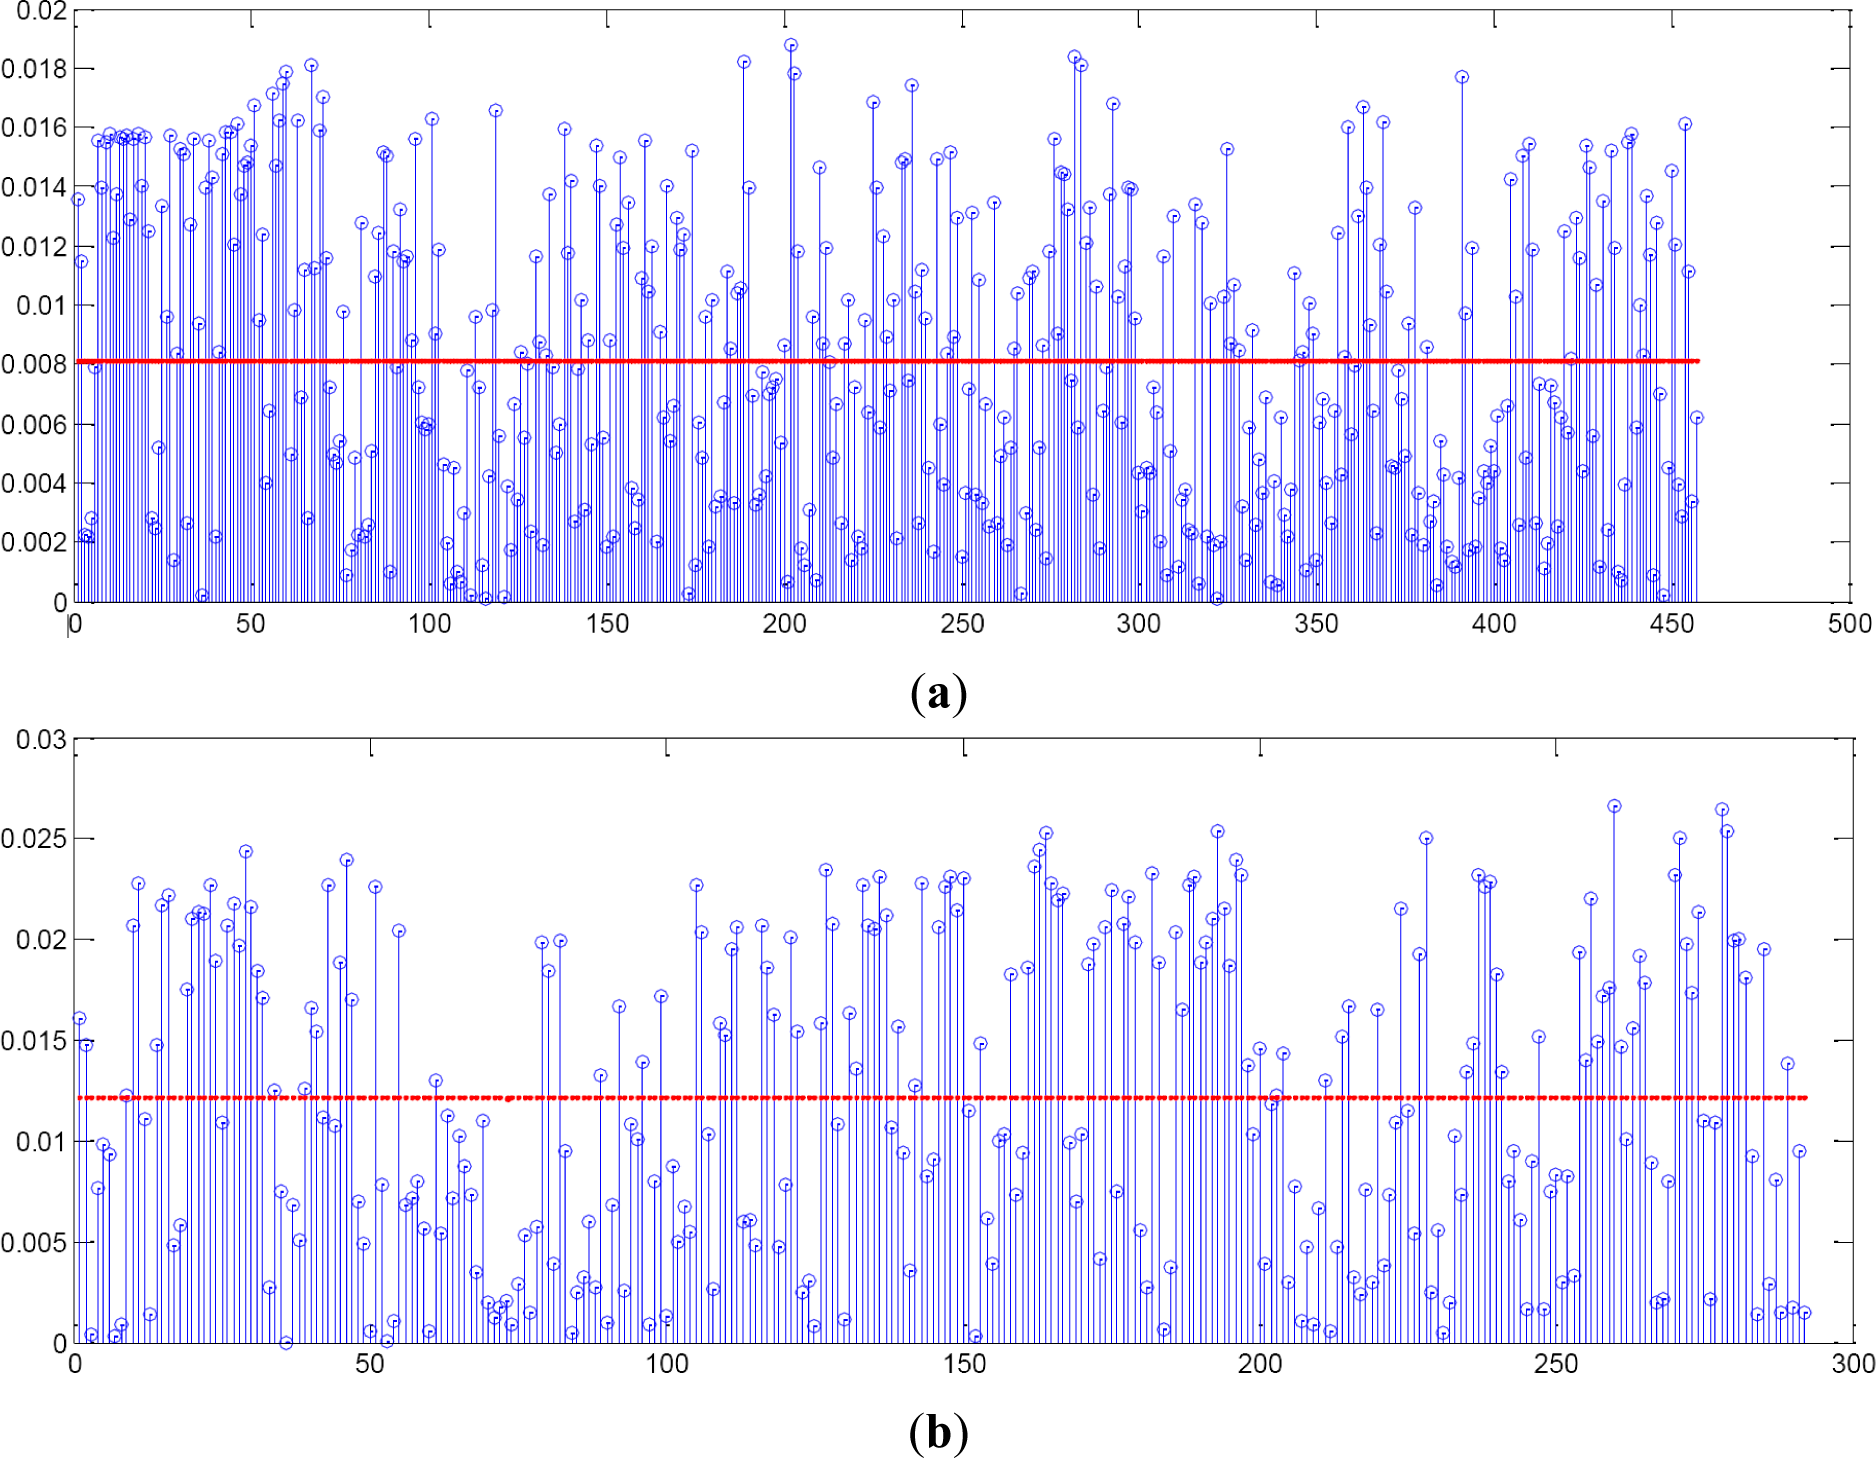
First group also evaluates the gradient of the image. Extracted features are based on the graphics of module and orientation (Figures 6 and 7). To compute the gradient, the following steps are applied [16]:
From RGB channel, it is selected the one with the highest entropy, i.e., the most informative channel. The entropy is measured according to the formula [29]:
In order to compute the image gradient, the gray level image of the selected channel is filtered using a Gaussian filter with σ = 2, and then the gradient vector is computed at each point g(x) = [g1(x) g2(x)]T using Sobel masks. The gradient magnitude and orientation are then computed as usual [30]:
Operator g(x) is used with two 3 × 3 kernels which are convolved with the original image to calculate approximations of the derivatives-one for horizontal changes g1(x), and one for vertical g2(x).
The gradient magnitude and orientation are then characterized by their histograms, using Ma = 10 and Mθ = 40 bins, respectively. The histogram for the gradient orientation is only computed in the area 5–35 instead of 1–40 because this is the area where the practical information is located (see Figures 6 and 7). There are no visual differences when evaluating both Gradient Magnitudes.
When a mole is computed, magnitude and orientation should tend to be 0 because of color distribution in a healthy lesion. This distribution should be symmetric, i.e., only one color in the lesion and without variances in its distribution, that means cell are growing under control.
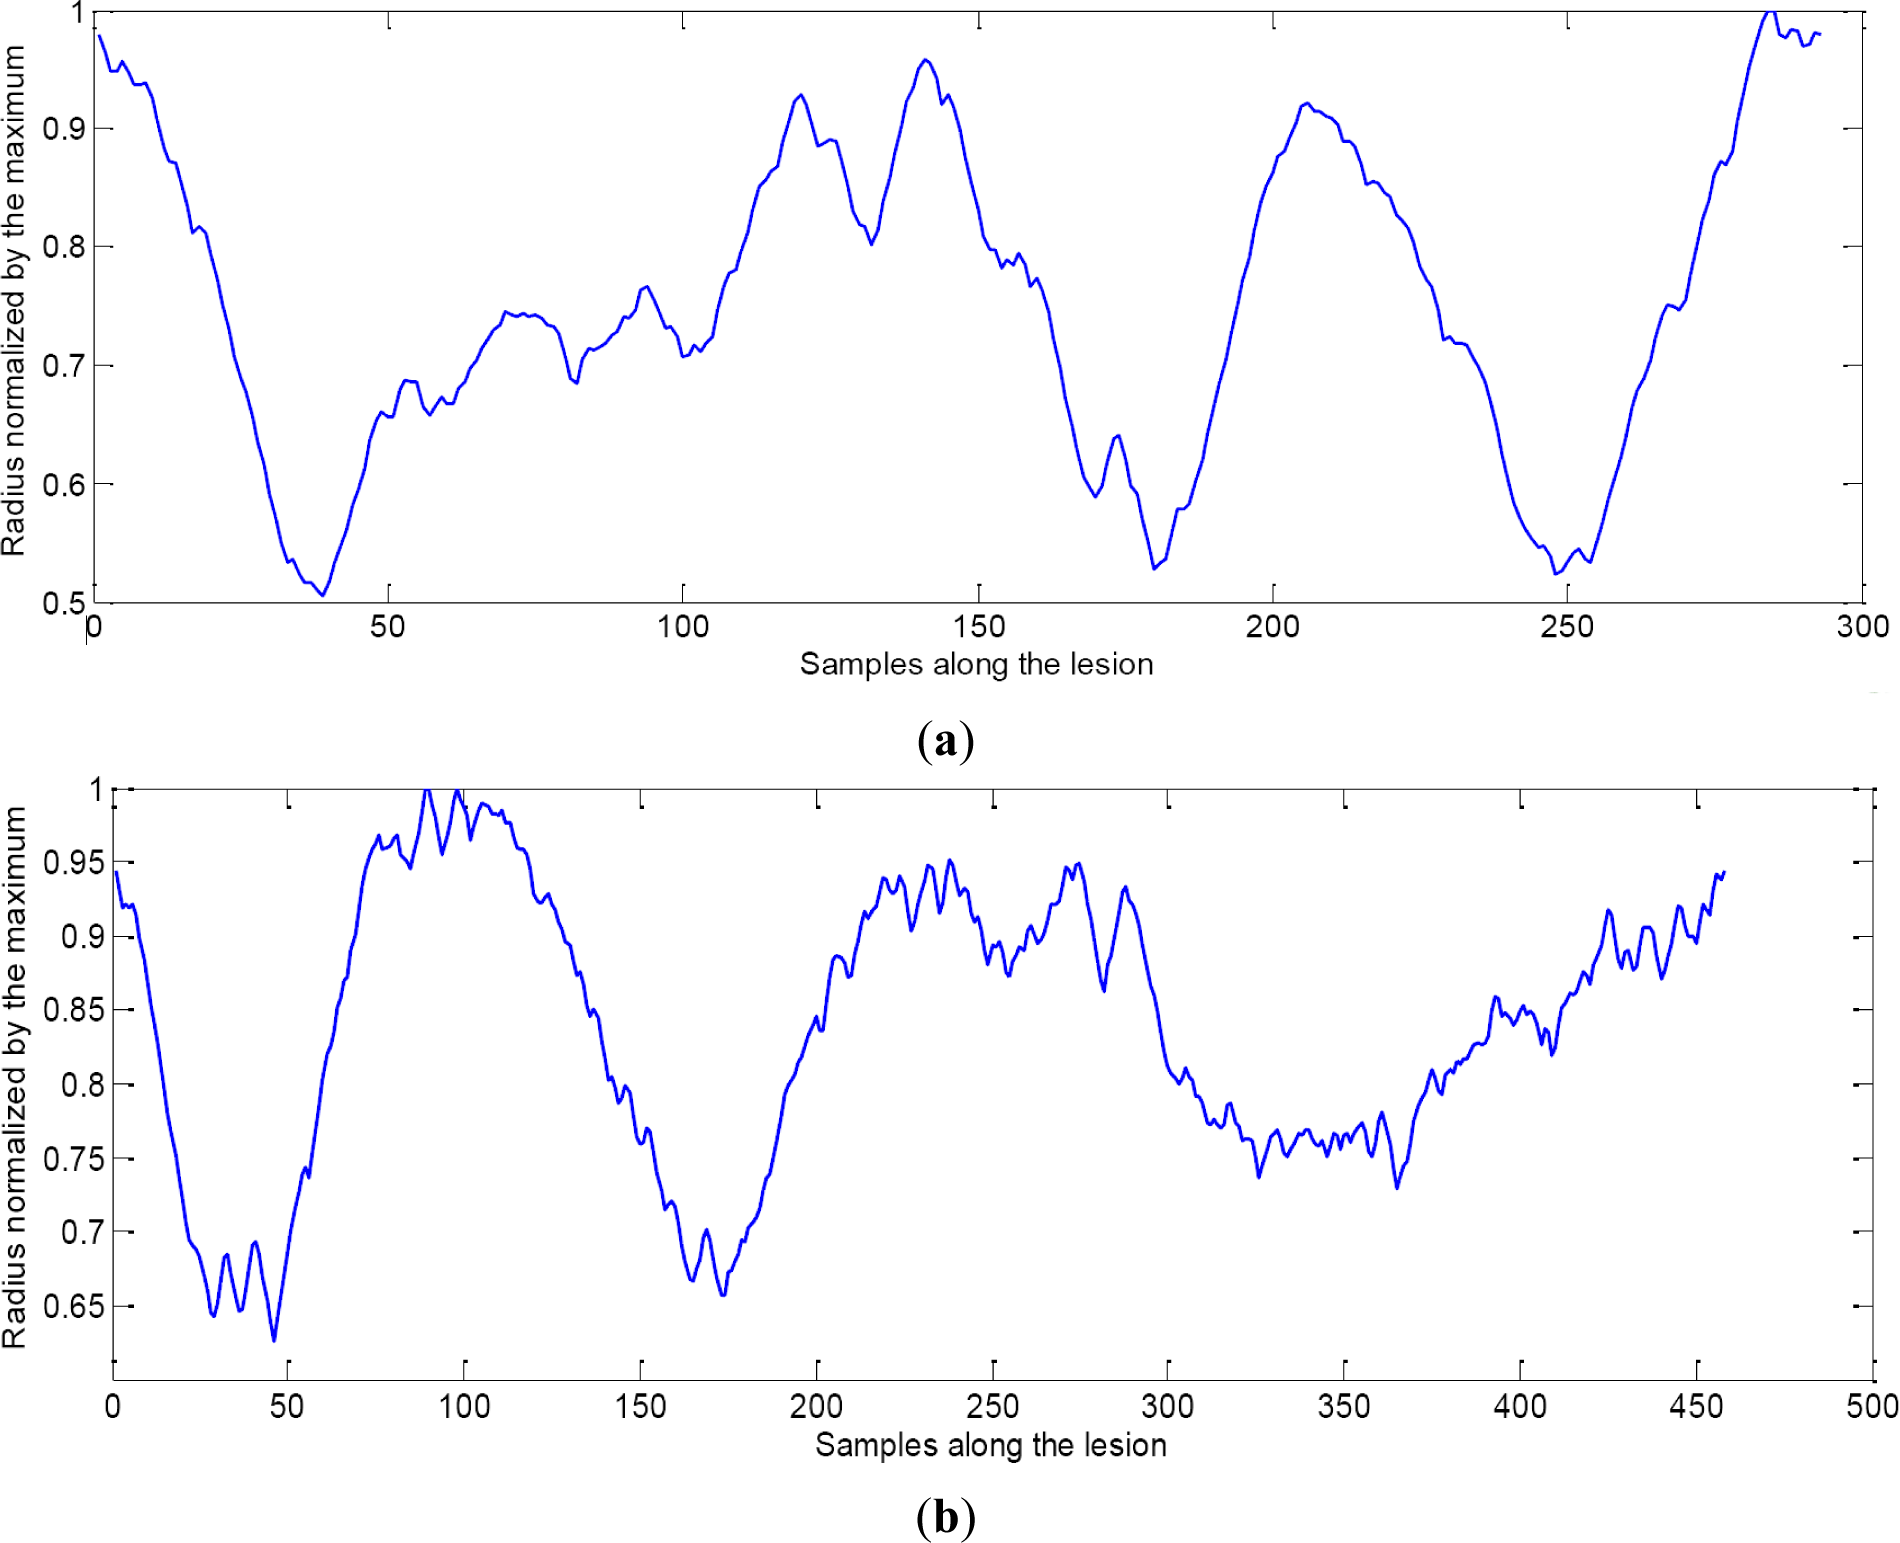
On the other hand, the second group is formed by the evaluation of the radius along the lesion. Mole’s evolution graphics should tend to be straight lines because of its supposed constant radius. However, graphics of Mole (see Figure 8b) and Melanoma (see Figure 8a) are very similar.
If gradient is applied to the graphics, differences between moles and melanomas can be observed (see Figure 9a,b). Mean and variance of the gradient are the features applied in order to discriminate between the two classes when evaluating the radius evolution.
The second group is also composed of geometric features [22]. These features are obtained applying the formulas below:
Circularity index (CRC): It explains the shape uniformity
Irregularity index (Ir):
As shown in Table 2, 42 features are extracted for each processed image, 36 for the first classifier and 6 for the second one. Each feature set is described in Table 1.
Despite being well-known features, novelty in feature extraction is applied when combining both features sets in order to increase the sensitivity (see Figure 1) and increasing the importance of the symmetry, mainly when extracting the feature from the first set.
2.3. Support Vector Machines (SVM)
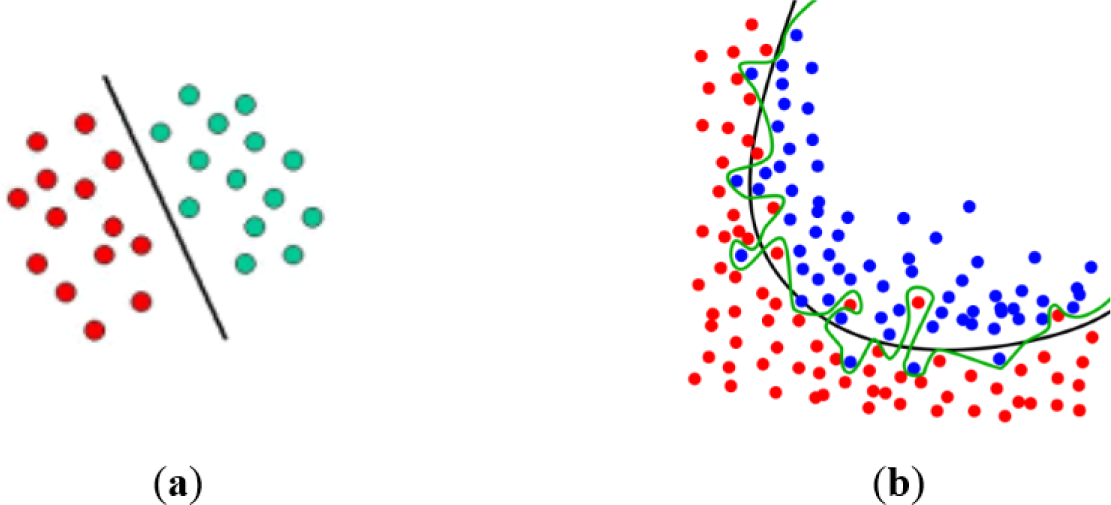
Depending on the applications, Support Vector Machines have shown to be powerful tools to solve classifying problems [31]. SVM are based on the concept of decision planes, which are defined by the decision limits [32]. A decision plane is the one which divides a set of objects formed of samples from different classes (Figure 10a,b).
In this work, different types of functions have been probed. The two used classifiers are linear and Gaussian (RBF) kernels. These are used for establishing the decision limit.
According to the nature of this experiment and the size of the database, both classifiers are used in a bi-class algorithm, trying to discriminate between the two classes (melanoma and mole).
2.4. Alternative Labeling Method
Once the system is trained and the separation hyperplane has been obtained, SVM applies its labeling method according to the Support Vectors computed. In accordance with the final decision, the corresponding class label of the test vector x is assigned as a decision of two states. This means that only two labels (“+1” and “−1”) are possible as this is a bi-class algorithm.
Before the assigning step, an alternative labeling method has been applied. SVM assigns a label to the testing sample according to the similarity between the sample and the Support Vectors generated for each of the two classes. The label is assigned according to the highest similarity. In this work, the alternative proposed method ensures a higher sensitivity by labeling the sample as malign lesion when the difference between both similarities is lower than a given threshold. The sample is labeled as malign when there is doubt about its nature.
2.5. Classification Tree System
The decision of implementing a decision tree as classifier is based on the fact that it is robust for noisy data and handles both semantic and numeric values, according to [33].
Our classification tree consists of applying two independent tests to each testing sample, so two labels are obtained, one per classifier (see Figure 1). The final label is the strictest one, so if one of the classifiers labels the sample as melanoma, the final label is also melanoma. This method ensures a high sensitivity for the proposed system.
Taking into account the results of each classifier, it was observed that the false negatives of the first classifier were correctly labeled using the second classifier.
To optimize runtime, the second classifier is only used when the first one produces a benign label.
This architecture also shows how visual symmetry does not always mean the disease is totally symmetric, since it can be asymmetric from the color distribution or radius evolution point of view, giving each classifier a different label.
3. Results and Discussion
This section presents and discusses the used database, the results obtained for each classifier, the improvements achieved by using the alternative method, the classification tree system and the information added by using symmetry information when extracting the features.
3.1. Database
The database used in this work contains 24 images for each of the two classes. The database was generated by Dr. Carretero, Head of Servicio de Dermatología at Hospital Universitario Doctor Negrín and his team (8 medical doctors), with images from 124 patients. For some of the patients, the databased contained different images taken in different consultations in order to evaluate the evolution of the lesion. All the images used in the database were labeled by the doctors. Some of the original images had to be discarded due to poor quality.
A dermatoscope (DermLite II hybrid m) was used to acquire the images. A detailed description of this database can be found in Tables 3 and 4.
In Table 4, it can be observed the distribution of the different kinds of lesions which compose the database. As it is shown, seven kinds of lesions were taken into account. This fact is also a new way of experimentation because previous systems used databases formed of only two kinds of lesions.
Dysplastic Nevus was catalogued as malign lesion since its diagnosis is usually precancerous.
The database size is small compared to other works, taking into consideration only 24 samples of melanomas and 24 of moles. This is because dermoscopic images are beginning to be obtained.
Malign and Benign classes are balanced, being not realistic since melanoma cases are much less than benign. However, benign class is composed of five different kinds of healthy lesions, not of normal moles, which are not frequently found in other works, which compare the melanoma against normal moles.
Intra-class and Inter-class variability was under consideration during different meetings with the medical team. In these meetings, different measures based on the ABCD rule were evaluated to detect the variability and select the best ones.
However, it was concluded that Inter-class and Intra-class variability was high due to the fact that the two classes were composed of different kinds of lesions. This fact is one of the reasons why decision tree architecture was selected to develop the final system.
3.2. Experiments and Results
The experiments were designed in order to increase the Sensitivity of the experiment. As discussed before, this point of view tries to emphasize the medical aspect of automatic cancer diagnosis, where false negatives are not allowed.
Experiments aim to set the parameters of both classifiers, combining them to obtain the highest possible sensitivity. Moreover, the alternative labeling method is also applied, trying different decision thresholds, to ensure false negatives are avoided.
Leave-one out validation method was applied to the experiments. It was repeated for all the 48 samples. Leave-one out validation was applied according to [34].
Results were evaluated based on the values of accuracy, sensitivity and specificity. These values are obtained according to Equations (11)–(13), respectively [35]:
Table 5 shows the results obtained for different thresholds when the Gaussian kernel was used with the features set number 2. Table 6 shows the best configuration for each of the classifiers. Linear classifier uses features set number 1 with a threshold value equal to 1. On the other hand, the non-linear classifier uses features set number 2 with a threshold value equal to 0.1.
Where Gamma, the inverse of the standard deviation of the Gaussian kernel, was set to 4 × 10⁻⁶ as a result of developing a heuristic method in order to obtain the best configuration for the SVM with Gaussian kernel. For this classifier, several configurations were tried depending on different combinations of threshold and gamma.
When both classifiers were combined to build the classification tree system, the results improved. The final performance is shown in Table 7. Table 8 shows the True Positives, True Negatives, False Positives and False Negatives obtained for both individual classifiers and for the final system.
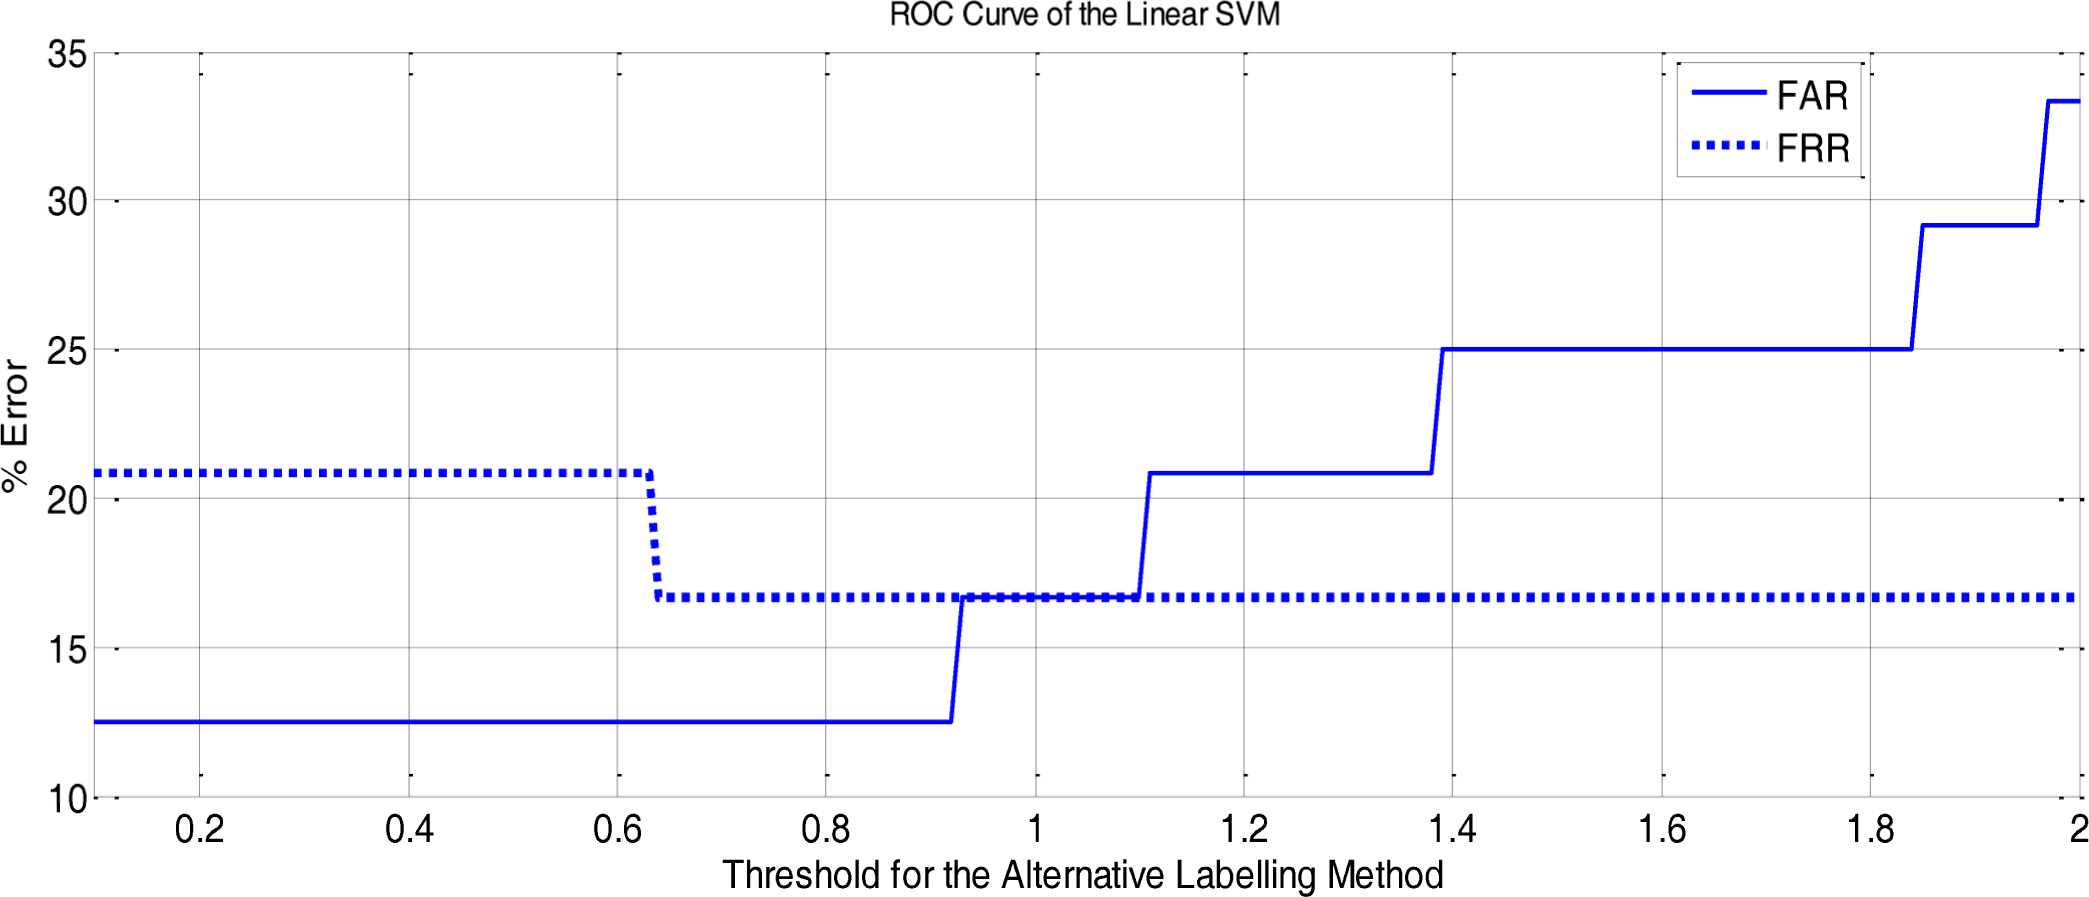
Figure 11 shows the False Acceptance Rate and the False Rejection Rate curves obtained with the Linear Classifier for different threshold configurations. The threshold is the one applied to the Alternative Labelling Method.
All the experiments have been performed on a commercial computer with a processor Intel(R) Core(TM) i7-4700MQ CPU 2.40 GHz, 8 GB RAM and using MatLab (Mathworks, Inc., Natick, MA, USA) software.
In Table 9, the analysis of the computational speed for the image processing step (pre-processing and feature extraction) and for the classification step is shown:
The high time consuming of the image processing step is due to the characteristics of the dermoscopic images (see Table 3).
3.3. Discussion
Based on previous experiments, some authors have considered the scientific aspect of the problem as the most important goal by prioritizing the final accuracy of their systems. Although in this experiment, similar features have been used, the aim was to prioritize the medical aspect, i.e., the sensitivity of the system. Thus, this work proposes both the alternative labeling method and the classification tree system as tools to achieve the highest sensitivity.
As it can observed, focusing on the sensitivity leads to obtaining false positives. These false positives mean additional tests should be applied by doctors in order to confirm the positive, but the system does not label any disease as a healthy mole.
Finally, a comparison between references of the state-of-the-art and the proposed approach is shown in Tables 10 and 11. While Table 10 offers a comparison between results, Table 11 shows a comparative between the compositions of the used databases.
Taking into account the difficulty to evaluate state-of-the-art approaches against this approach, because they do not use the same database, or classifier, in Table 10 it can be seen that the state-of-the-art approach performs better than this approach from the final accuracy point of view. However, if the sensitivity of the experiments is taken as the most important aspect, it means that all patients with cancer are detected, and this approach is the best system in the comparison.
Therefore, it can be concluded that the presented approach is a good and robust option to avoid false negatives when diagnosing melanoma cancer.
Moreover, this work shows how asymmetry in not only on the shape, but also on the color distribution, radius evolution, etc. Evaluating symmetry or asymmetry as it is done in this approach ensures avoiding false negatives due to the visual symmetry.
It can be concluded that symmetry gives important information when developing systems with high sensitivity, which are useful in experiments where false negatives should not be allowed.
4. Conclusions
An original approach has been built for automatic melanoma diagnosis, using feature extraction based on well-known techniques, but highlighting the symmetry of the information. The classification system has been designed as a decision tree with two different SVM classifiers, one with linear kernel and the other one using RBF kernel. The success rates are around 83.33% with the database provided by Hospital Universitario Doctor Negrín. However, the system gets a sensitivity of 100%, what means no false negatives are allowed in the experiments. This fact is the strongest point of the approach, since it has been developed to optimize the medical aspect of automatic diagnosis systems.
This approach shows a methodology which gives excellent results when applying it to images which are difficult to classify by doctors. Using this approach, a second opinion is given and 66.66% of biopsies could be avoided.
In future works, the authors plan to increase the database in order to improve the success rate, without reducing the obtained sensitivity.
Acknowledgments
This work has been developed based on the database provided by the Dermatology Service of Hospital Universitario de Gran Canaria Doctor Negrín. This work is supported by the Spanish Government, under Grant Becas de Colaboración (2014-15) No. 800241.
Author Contributions
Elyoenai Guerra-Segura: conception and design of the study, analysis of the data, interpretation of the data, drafting the article. Carlos M. Travieso-Gonzalez: interpretation of the data, drafting the article, critical revision of the manuscript. Jesús B. Alonso-Hernández: interpretation of the data, drafting the article, critical revision of the manuscript. Antonio G. Ravelo-Garcia: interpretation of the data, drafting the article, critical revision of the manuscript. Gregorio Carretero: elaboration of the database, link between the group and the Hospital, medical supervision of the study. All authors have read and approved the final manuscript
Conflicts of Interest
The authors declare no conflict of interest.
References
- Perera, E.; Gnaneswaran, N.; Jennens, R.; Sinclair, R. Malignant Melanoma. Healthcare 2014, 2, 1–19. [Google Scholar]
- Garraway, L.A.; Widlund, H.; Rubin, M.A. Integrative genomic analyses identify MITF as a lineage survival oncogene amplified in malignant melanoma. Nature 2005, 436, 117–122. [Google Scholar]
- Chin, L.; Garraway, L.A.; Fisher, D.A. Malignant melanoma: Genetics and therapeutics in the genomic era. Genes Dev. 2006, 20, 2149–2182. [Google Scholar]
- D’Orazio, J.; Jarrett, S.; Amaro-Ortiz, A.; Scott, T. UV Radiation and the Skin. Int. J. Mol. Sci. 2013, 14, 12222–12248. [Google Scholar]
- Garcia, B.; Mendez, A.; Ruiz, I.; Nunez, G.; Abtane, A. Skin Cancer Parameterization algorithm based on epiluminiscence image processing. Proceedings of the IEEE International Symposium on Signal Processing and Information Technology (ISSPIT), Sharjah, UAE, 14–17 December 2009; pp. 236–241.
- Rutkowski, P.; Zdzienicki, M.; Nowecki, Z.I.; van Akkooi, A.C.J. Surgery of Primary Melanomas. Cancers 2010, 2, 824–841. [Google Scholar]
- Malvehy, J.; Puig, S. Principios de Dermatoscopia; CEGE: Barcelona, Spain, 2002. [Google Scholar]
- Sirakov, N.M.; Mete, M.; Chakrader, N.S. Automatic boundary detection and symmetry calculation in dermoscopy images of skin lesions. Proceedings of the 18th IEEE International Conference on Image Processing (ICIP), Brussels, Belgium, 11–14 September 2011; pp. 1605–1608.
- Amaliah, B.; Fatichah, C.; Rahmat, R. ABCD feature extraction of image dermatoscopic based on morphology analysis for melanoma skin cancer diagnosis. J. Ilmu Komput. Inf. 2010, 3, 82–90. [Google Scholar]
- Guyon, I.; Barnhill, S.D. System and Method for Remote Melanoma Screening. WO/2011/087807 2011. [Google Scholar]
- Capdehourat, G.; Corez, A.; Bazzano, A.; Muse, P. Pigmented Skin Lesions Classification Using Dermatoscopic Images. Progress in Pattern Recognition, Image Analysis, Computer Vision, and Applications, Springer: Berlin, Germany; 2009; 5856, pp. 537–544. [Google Scholar]
- Clawson, K.M.; Morrow, P.J.; Scotney, B.W.; McKenna, D.J.; Dolan, O.M. Determination of optimal axes for skin lesion asymmetry quantification. Proceedings of the IEEE International Conference on Image Processing, San Antonio, TX, USA, 16 September–19 October 2007; 2, pp. II:453–II:456.
- Tanaka, T.; Yamada, R.; Tanaka, M.; Shimizu, K.; Tanaka, M.; Oka, H. A Study on the Image Diagnosis of Melanoma. Proceedings of the 26th Annual International Conference of the IEEE Engineering in Medicine and Biology Society, San Francisco, CA, USA, 1–5 September 2004; 1, pp. 1597–1600.
- Parolin, A.; Herzer, E.; Jung, C.R. Semi-Automated Diagnosis of Melanoma through the Analysis of Dermatological Images. Proceedings of the 23rd SIBGRAPI Conference on Graphics, Patterns and Images (SIBGRAPI), Gramado, Brazil, 30 August–3 September 2010; pp. 71–78.
- Kusumoputro, B.; Ariyanto, A. Neural network diagnosis of malignant skin cancers using principal component analysis as a preprocessor. Proceedings of the IEEE International Joint Conference on Neural Networks, Anchorage, AK, USA, 4–9 May 1998; 1, pp. 310–315.
- Marques, J.S.; Barata, C.; Mendonc, T. On the Role of Texture and Color in the Classification of Dermoscopy Images. Proceedings of the 34th Annual International Conference of the IEEE EMBS, San Diego, CA, USA, 28 August–1 September 2012; pp. 4402–4405.
- Maragoudakis, M.; Maglogiannis, I. Skin Lesion Diagnosis from Images Using Novel Ensemble Classification Techniques. Proceedings of the 10th IEEE International Conference on Information Technology and Applications in Biomedicine (ITAB), Corfu, Greece, 3–5 November 2010; pp. 1–5.
- Baldi, A.; Quartulli, M.; Murace, R.; Dragonetti, E.; Manganaro, M.; Guerra, O.; Bizzi, S. Automated Dermoscopy Image Analysis of Pigmented Skin Lesions. Cancers 2010, 2, 262–273. [Google Scholar]
- Di Gesu, V.; Tabacchi, M.E.; Zavidovique, B. Symmetry as an Intrinsically Dynamic Feature. Symmetry 2010, 2, 554–581. [Google Scholar]
- D’Amico, M.; Stanganelli, I. Qualitatite Assymetry Measure for Melanoma Detection. Proceedings of the IEEE International Symposium on Biomedical Imaging: Nano to Macro, Arlington, VA, USA, 15–18 April 2004.
- William, V.S.; Li, W.W.; Randy, H.M. Automatic detection of asymmetry in skin tumors. Comput. Med. Imaging Gr. 1992, 16, 191–197. [Google Scholar]
- Maglogiannisa, I.; Kosmopoulosb, D.I. Computational vision systems for the detection of malignant melanoma. Oncol. Rep. 2006, 15, 1027–1032. [Google Scholar]
- Garnavi, R.; Aldeen, M.; Bailey, J. Computer-Aided Diagnosis of Melanoma Using Border- and Wavelet-Based Texture Analysis. IEEE Trans. Inf. Techno. Biomed. 2012, 16, 1239–1252. [Google Scholar]
- Nguyena, N.; Lee, T.; Atkinsa, M. Segmentation of Light and Dark Hair in Dermoscopic Images: A Hybrid Approach Using a Universal Kernel. In Medical Imaging 2010: Image Processing; SPIE: San Diego, CA, USA, 2010; Volume 7623. [Google Scholar]
- Zagrouba, E.; Barhoumi, W. An Accelerated System for Melanoma Diagnosis Based on Subset Feature Selection. J. Comput. Inf. Technol. 2005, 1, 69–82. [Google Scholar]
- Gonzalez, R.C.; Woods, R.E.; Eddins, S.L. Digital Image Processing Using MATLAB; Pearson Prentice Hall: Upper Saddle River, NJ, USA, 2004. [Google Scholar]
- Image Thresholding and Image Segmentation, Available online: http://www.mathworks.es accessed on 1 October 2013.
- Otsu, N. A threshold selection method from gray level histograms. IEEE Trans. Syst. Man Cybernet. 1979, 9, 62–66. [Google Scholar]
- Shannon, C.E. A Mathematical Theory of Communication. Bell Syst. Techn. J. 1948, 27. [Google Scholar]
- Linda, S.; Stockman, G. Computer Vision; Prentice Hall: Upper Saddle River, NJ, USA, 2001. [Google Scholar]
- Cortes, C.; Vapnik, V.Ñ. Support vector networks. Mach. Learn. 1995, 20, 273–297. [Google Scholar]
- Burges, C.J.C. A Tutorial on Support Vector Machines for Pattern Recognition. In Data Mining and Knowledge Discovery; Kluwer Academic Publishers: Amsterdam, The Netherlands, 1998; Volume 2, 2, pp. 121–167. [Google Scholar]
- Olszewska, J.I. Semantic, Automatic Image Annotation based On Multi-Layered Active Contours and Decision Trees. Int. J. Adv. Comput. Sci. Appl. 2013, 4, 201–208. [Google Scholar]
- Arlot, S. A survey of cross-validation procedures for model selection. Static Surv. 2010, 4, 40–79. [Google Scholar]
- Wen, Z.; Nancy, Z.; Ning, W. Sensitivity, Specificity, Accuracy, Associated Confidence Interval and ROC Analysis with Practical SAS Implementations. Proceedings of the NESUG Proceedings: Health Care and Life Sciences, Baltimore, MD, USA, 14–17 November 2010; pp. 1–9.


| Feature Set | Description of the Features | Number of Features |
|---|---|---|
| 1 | Color evaluations using RGB, HSV, HSI and CIE Lab color spaces Evaluation of module and phase of image’s gradient | 36 |
| 2 | Radius evolution along the lesion Geometric features | 6 |
| Feature Set | Number of Features |
|---|---|
| 1 | 36 |
| 2 | 6 |
| Total number | 42 |
| Parameters | Details from the Database |
|---|---|
| Number of classes | 2 |
| Number of samples per class | 24 |
| Acquisition and quantification | sRGB (24 bits, 256 levels per channel) |
| Size | 2560 × 1920 pixels |
| Example | 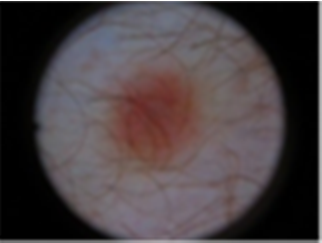 |
| Kind of Lesion | Number of Samples | Diagnosis | Example |
|---|---|---|---|
| Melanoma | 16 | Malign | 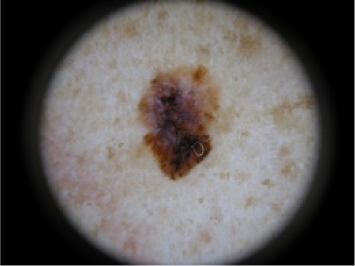 |
| Compound Nevus | 11 | Benign |  |
| Dysplastic Nevus | 8 | Malign | 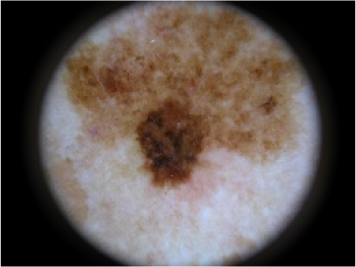 |
| Intradermal Nevus | 2 | Benign | 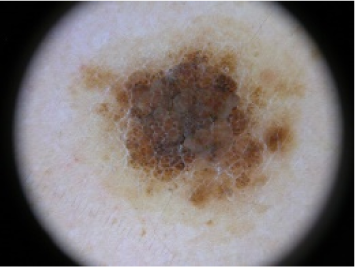 |
| Junctional Nevus | 4 | Benign | 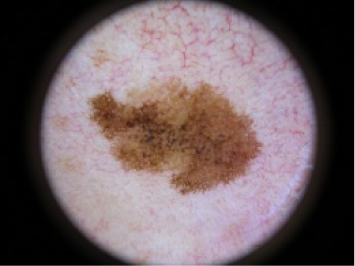 |
| Reed Nevus | 2 | Benign | 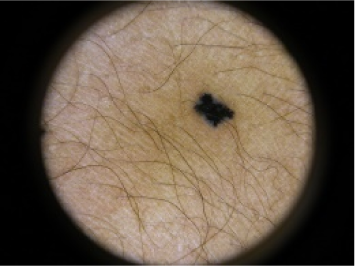 |
| Spitz Nevus | 5 | Benign | 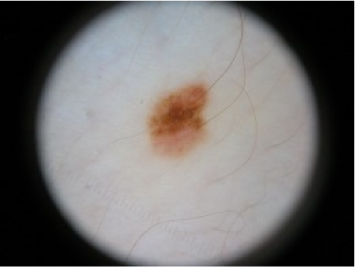 |
| Classifier | Threshold | Sensitivity | Specificity | Accuracy | Gamma |
|---|---|---|---|---|---|
| Gaussian kernel | 0.15 | 91.66% | 66.66% | 79.16% | 4 × 10⁻⁶ |
| Gaussian kernel | 0.10 | 91.66% | 70.83% | 81.25% | 4 × 10⁻⁶ |
| Gaussian kernel | 0.01 | 87.50% | 75.00% | 81.25% | 4 × 10⁻⁶ |
| Classifier | Threshold | Sensitivity | Specificity | Accuracy | Gamma |
|---|---|---|---|---|---|
| Linear | 1.00 | 83.33% | 83.33% | 83.33% | – |
| Gaussian kernel | 0.10 | 91.66% | 70.83% | 81.25% | 4 × 10⁻⁶ |
| Sensitivity | Specificity | Accuracy |
|---|---|---|
| 100% | 66.66% | 83.33% |
| Classifier | True Positives | False Positives | True Negatives | False Negatives |
|---|---|---|---|---|
| Linear | 20 | 4 | 20 | 4 |
| Gaussian kernel | 22 | 7 | 17 | 2 |
| Final system | 24 | 8 | 16 | 0 |
| Approach | Image Processing | Classification |
|---|---|---|
| Time consuming (s) | 13.98 ± 4.0316 | (19.38 ± 15.18) × 10−3 |
| Reference | Number of Samples (Benign/Melanoma) | Sensitivity | Specificity | Accuracy |
|---|---|---|---|---|
| [13] | 251 (181/70) | 90.00% | 98.30% | 94.00% |
| [16] | 163 (146/17) | 94.10% | 77.40% | 85.50% |
| [20] | 977(927/50) | 96.41% | 87.16% | 91.78% |
| [22] | 34 (14/20) | 93.00% | 100% | 97.00% |
| [25] | 200 | 71.30% | 93.50% | 82.00% |
| This proposal | 48 (24/24) | 100% | 66.66% | 83.33% |
© 2015 by the authors; licensee MDPI, Basel, Switzerland This article is an open access article distributed under the terms and conditions of the Creative Commons Attribution license (http://creativecommons.org/licenses/by/4.0/).
Share and Cite
Guerra-Segura, E.; Travieso-González, C.M.; Alonso-Hernández, J.B.; Ravelo-García, A.G.; Carretero, G. Symmetry Extraction in High Sensitivity Melanoma Diagnosis. Symmetry 2015, 7, 1061-1079. https://doi.org/10.3390/sym7021061
Guerra-Segura E, Travieso-González CM, Alonso-Hernández JB, Ravelo-García AG, Carretero G. Symmetry Extraction in High Sensitivity Melanoma Diagnosis. Symmetry. 2015; 7(2):1061-1079. https://doi.org/10.3390/sym7021061
Chicago/Turabian StyleGuerra-Segura, Elyoenai, Carlos M. Travieso-González, Jesús B. Alonso-Hernández, Antonio G. Ravelo-García, and Gregorio Carretero. 2015. "Symmetry Extraction in High Sensitivity Melanoma Diagnosis" Symmetry 7, no. 2: 1061-1079. https://doi.org/10.3390/sym7021061