
Teaching-Learning Activity Modeling Based on Data Analysis

 , ,
, ,
Abstract
: Numerous studies are currently being carried out on personalized services based on data analysis to find and provide valuable information about information overload. Furthermore, the number of studies on data analysis of teaching-learning activities for personalized services in the field of teaching-learning is increasing, too. This paper proposes a learning style recency-frequency-durability (LS-RFD) model for quantified analysis on the level of activities of learners, to provide the elements of teaching-learning activities according to the learning style of the learner among various parameters for personalized service. This is to measure preferences as to teaching-learning activity according to recency, frequency and durability of such activities. Based on the results, user characteristics can be classified into groups for teaching-learning activity by categorizing the level of preference and activity of the learner.1. Introduction
Today, we are living with an information overload. An increasing number of studies are carried out on data analysis to find extract valuable information about providing personalized service [1]. In the field of teaching-learning activities, numerous studies are carried out on learning analysis for personalized service as a result of growth in e-learning and collaborative learning [2]. The reason is that these activities can support a personalized teaching-learning activity taking into account the character of each person. The parameters for personalized service in the teaching-learning field include level of knowledge, learning objective, learning style, learning activity, motivation, and information collection by the learner [2]. Studies that utilize learning style as a parameter can be classified into questionnaire-based research and data-based studies, which use the questionnaire method and data analysis, respectively [3,4]. In the past, data were deduced by using a questionnaire in general to figure out the learning style of the person. Recently, however, an increasing number of studies have been carried out based on activity data of the learner [3]. This paper proposes a learning style recency-frequency-durability (LS-RFD) model to provide a teaching-learning activity according to the learning style of the learner. Based on this, data of teaching-learning activities are analyzed. This content of this paper consists of the following sections. Section 2 describes the theoretical background, and Section 3 deals with modeling of learning styles based on the elements of the teaching-learning activity. In Section 4, analysis is performed according to actual data, and finally, Section 5 offers conclusions from this study.
2. Literature Review
2.1. Adaptive Learning
Adaptive learning is personalized teaching-learning that provides the optimal environment for learning, taking into account the characteristics of each person for an effective teaching-learning activity. Such a method deduces personal characteristics and elements for support, which provide elements of the teaching-learning activity. That is to say, this learning method provides elements and contents of a personalized teaching-learning activity regarding various experiences, knowledge level, learning history, learning style, preferences, level of cognition, and motivation of the person. The goal is to provide personalized or self-determined learning for distinctive implementation of elements of the teaching-learning activity [2]. The studies on adaptive learning can be classified into those for adaptive content integration, proposals, paths of such activities and adaptive cooperation support [2,5,6]. The studies on adaptive content include models that use an intelligent system, teaching-learning activity analysis, a fuzzy user model, the learner’s profile and learning resources, and artificial intelligence [2]. In particular, the studies through teaching-learning activity analysis classify users by using analysis of data generated from interactions between the teaching-learning system and the learner, and on evaluation from a questionnaire on learning style, which classifies the user and proposes customized contents and learning paths [2]. Romero and colleagues carried out research on the collection of data from user activity logs, assessments, chat rooms, questionnaires, Wiki forums, and application of data for data mining by using Moodle [7]. Furthermore, Toth conducted a study on learning characteristics of the learner and preferred learning strategies by applying the recency-frequency-monetary (RFM) model and a data analysis method based on data on the interaction between learner and learning object. This was to find characteristics of preferred learning, the method, the strategy, and the pattern of the learning activity [8].
This study used the level of preference and patterns of the teaching-learning activity of each learner’s group for personalized learning.
2.2. Learning Style
We should be able to recognize and understand the characteristics of individuals and groups for smooth communication with them. For doing so, learning style or cognitive style are broadly used in the field of teaching-learning activities [9]. Learning style is the type of preference for learning that appears in each information process, which is a constant tendency of the learner and method toward handling each person’s knowledge. The reason is that a teaching-learning activity is based on various elements, including looking, listening, speaking and feeling [10]. Such styles indicate the tendency of the learner, meaning the preference as to teaching-learning method, and this is an important element that affects the learning procedure [11]. That is to say, learning style means the difference in measurements for recognition and utilization of personal information within information overload [12]. The learning style for individuals and groups can be classified according to cognition tendency, information processing, and preference as to teaching-learning environment [13]. Through this, the tendency toward information processing activity can classify the tendency by deducing characteristics of the person based on the person’s cognition and ability to learn information. Kolb, Felder and Silverman are the major scholars in this field. Kolb classifies information processing into two main categories: Concrete Experience—Abstract Conceptualization, and Active Experimentation—Reflective Observation. Felder and Silverman classify information processing into four main categories. Regarding perception of information, they classify the type of user according to sensory–intuitive elements. Furthermore, they classify user types based on visual–verbal elements for cognition of information. In addition, for information processing, user types are classified according to activity–reflective elements. Furthermore, regarding understanding of information, user types are classified based on sequential–global elements [10].
In this study, we attempt to utilize cognition of information and information processing, by which Felder and Silverman have proposed to deduce preferences in each group based on teaching-learning activity data.
2.3. RFM Model
The RFM model is used for classifying customer segmentation from a marketing perspective. This is mainly used as part of a strategy for optimization of loyalty and life value of customers according to results from figuring out and analyzing characteristics of the customer’s behavior [14].
The RFM model uses three evaluation elements; specifically, recency (R) measures how recently the customer has made a purchase, whereas frequency (F) measures the frequency of purchasing. Monetary (M) measures the amount of the purchases. Based on this, all elements are combined linearly and then scored. That is to say, personal information is quantified regarding the recency, frequency and amount of consumption. Then a weight value is added to the R, F and M values for calculation. This is defined as in the Equation (1) [15,16].
W1, W2 and W3 here refer to weighted values for each component. The RFM model is widely used for its simple principle, and makes it easy to figure out the characteristics of the customer in the group [17]. Cho and colleagues applied the RFM model and data analysis to deduce long-term excellent customers in estate agency advertisement [17]. Eom utilized the RFM model to quantitatively analyze and evaluate the level of activity of insiders to prevent security accidents caused by insiders [15]. Kang utilized the RFM model to enhance reliability of a ranking service for recommendations [16]. Chiu and colleagues utilized the RFM model to find excellent customers to provide satisfaction and reliability for customers in e-commerce [18]. Hu and colleagues utilized the RFM model to study recommendations of books preferred by users, according to the records on user activity in an e-library [14]. Further, Chang and colleagues utilized the RFM model to quantify learner’ activity in an e-learning environment [19].
In this study, the RFM model has been used to score various elements of a teaching-learning activity to figure out preferences for the teaching-learning activity in the learner group.
3. Learner Group Modeling Based on Teaching-Learning Activity
3.1. Overview
The learner group model is based on the model of Felder and Silverman, which is based on information processing among the learning styles to figure out characteristics of the learner. Furthermore, the elements of a teaching-learning activity are objectified according to the characteristics of cognition and the processing of information by which the model of Felder and Silverman proposes to deduce the learning style of the person [4,11,13].
The elements for deduction of the learning style are based on the contents and activities utilized for a learning management system.
For contents and elements of the activity, an attribute relation map was prepared to group them according to learning style.
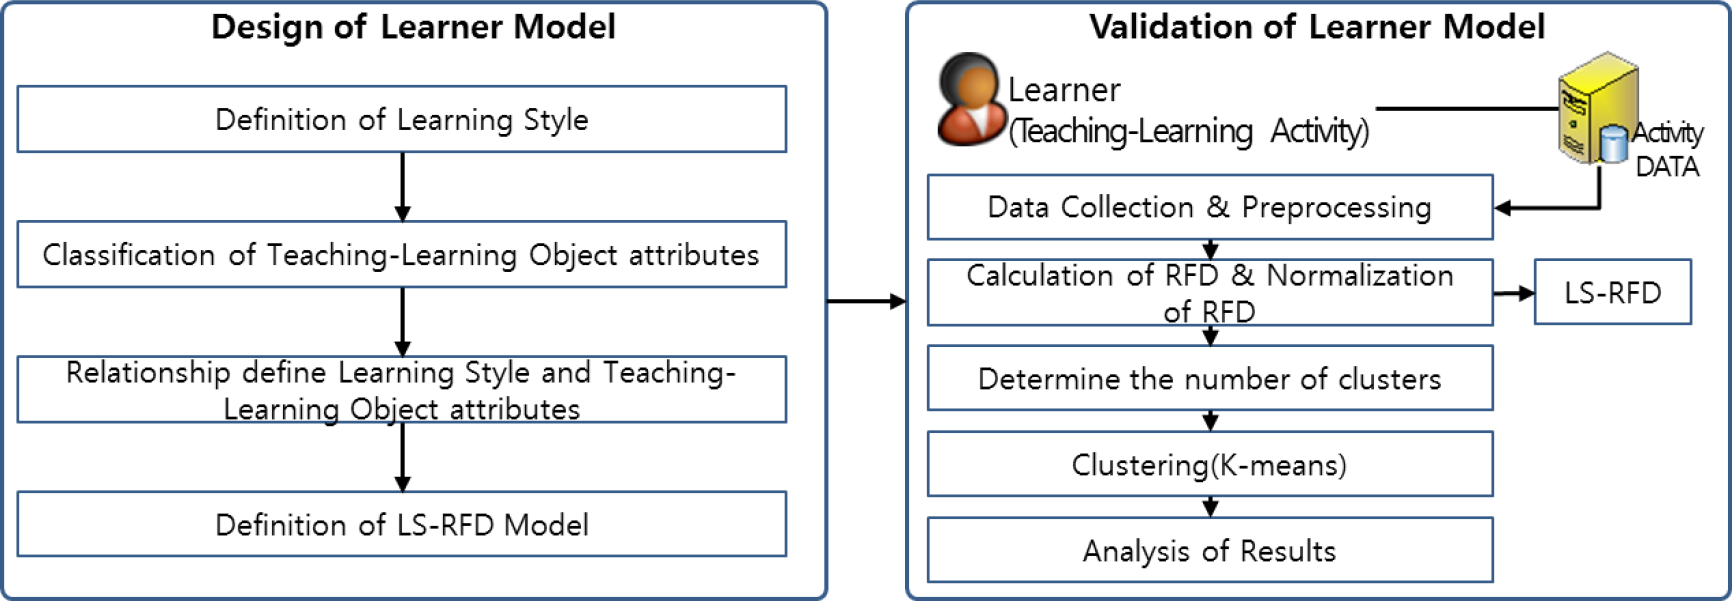
The learner group modeling process based on learning style is as shown in Figure 1 and is classified into learner group modeling and a model application procedure. First, the learner group modeling process defines the relation with the teaching-learning activity based on learning style, and then defines the LS-RFD model according to the result. In addition, the model is applied by obtaining LS-RFD values according to the teaching-learning activity, and then grouping.
3.2. Definition of Relation between Learning Style and Teaching-Learning Activity Elements
Adaptive or personalized learning is based on figuring out the personal characteristics of learners. For this, a visual–verbal element for cognition of information and an activity–reflective element for information processing are classified and applied in this study as seen Table 1, according to the model of Felder and Silverman [20,21]. Furthermore, the elements of the teaching-learning activity consist of lecture content, and blog, and group activity used for the learning management system to figure out the preference of each attribute [13,22,23]. The reason is that such elements of the activity contain the characteristics of the learning style and tendency of the user activity.
The attributes of a teaching-learning activity according to learning style are defined as a tuple as follows:
Teaching-learning activity element = {Blog, Discussion, Journal, Group, Notification, Message, Video content, Audio content, Text content}
Blog activity attribute, discussion activity attribute = {Read, Write, Comment}
Journal activity attribute, message activity attribute = {Read, Write}
Notification activity attribute = {Read}
Group activity attribute = {Group Activity, Individual Activity}
Contents activity attribute = {Visual Activity, Auditory Activity}
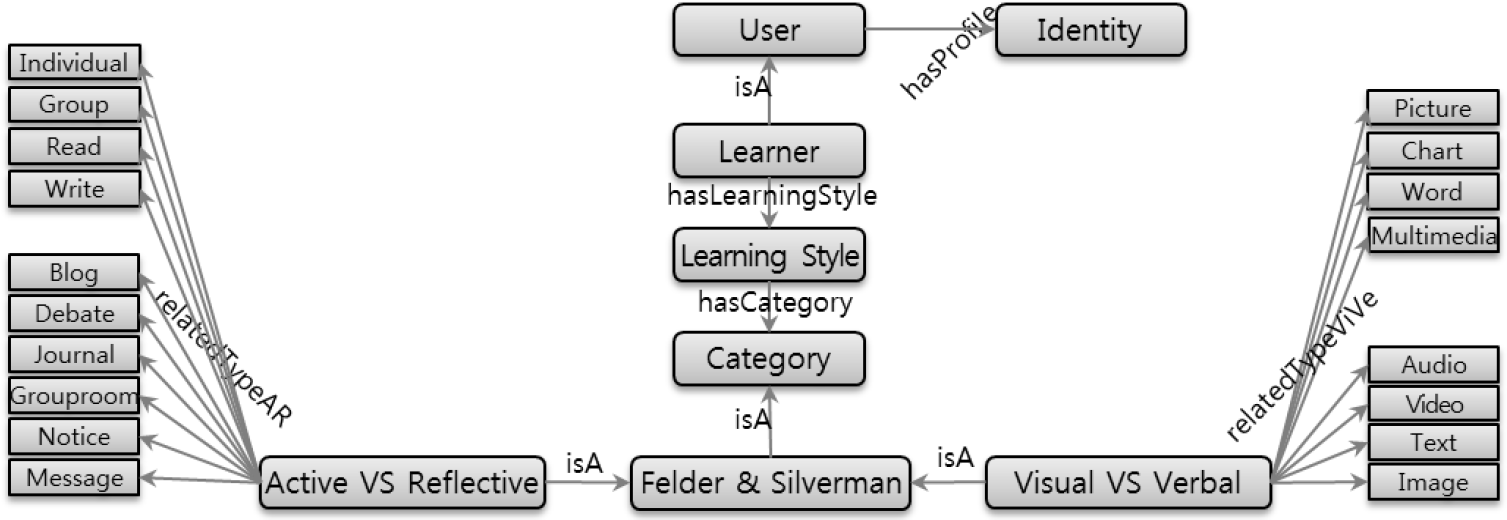
The relation between user learning style and teaching-learning activity is shown in the Figure 2. That is to say, the learner who is the user has a learning style, and this can be classified according to the cognition and processing of information [9,22,24].
First, the type of user regarding the cognition of information is classified into a group with a preference for visual elements, including figures, pictures, tables, charts and graphs, and into a group with preferences for verbal elements, including words and sentences. Furthermore, the user style according to the processing of information can be classified into a group with preferences for participation in group activity and discussion, which are executive activities, or into a group with preferences for reflective or passive elements, including personal activity, listening and thinking [12,13].
3.3. LS-RFD Model Based on RFM Model
This study suggests a learning style recency frequency durability method, which is based on the recency frequency monetary model, as a measurement for quantification of the elements of a teaching-learning activity according to learning style. This is to score the variables to figure out the characteristics of learners by using attributes of each element of the teaching-learning activity as parameters [14,19]. The LS-RFD model is based on the RFM model. However, it is not easy to measure the activities of subjects of the teaching-learning activity with actual amounts through the model. Therefore, durability is used instead of the monetary component. That is to say, recency, frequency and durability of the teaching-learning activity are scored. This can be presented as in the Equation (2).
RSi, FSi and DSi in the Equation above mean recency, frequency and durability of the teaching-learning activity, respectively. Furthermore, W1, W2, and W3 are weighted values and reflect importance of the RFD values.
Now, let us define Equation for calculating the value of R, F and D.
First, RSi means recency teaching-learning activity, and the Equation (3) for calculating this can be defined as follows. Where, D is the reference day of learning and Rd is the date of recent learning.
The reference day of learning needs to be reflected with learning cycle units and the date of recent learning needs to be the most recent date. Furthermore, based on this, Equation (4) calculates the average recency of learning for the entire period. Where, n means the entire learning cycle.
In addition, FSi means the frequency of the teaching-learning activity that Equation (5) calculates. Where, TD is the learning cycle unit and NA is the number of teaching-learning activities within the cycle unit.
In addition, Equation (6) calculates the average frequency of the teaching-learning activity within the entire learning period based on this. Where, n means the entire learning cycle.
DSi means the duration of the teaching-learning activity, and this can be calculated by using Equation (7). Where, di is the date of the learning activity, and NDA means the number of learning activities within the interval of learning activities.
Furthermore, Equation (8) calculates the average durability for the entire learning period. Where, L is the entire range of dates of learning, and DA is the number of learning days.
The values of R, F, and D, which have already been defined, vary according to their characteristics. Each value needs to be standardized within the range [0,1] to compare them with each other. The common Max-Min standardization method is used [18]. That is to say, Equation (9) provides such standardization. Where, Max and Min mean the maximum and minimum values, while Rd is the value of the relevant R, F, and D.
Meanwhile, W1, W2, and W3, which LS-RFD has suggested, are weighted values that can reflect the importance of the R, F, and D values. The measurements for the application of the weighted values include the Analytic Hierarchy Process and Pareto’s Rule 2:8, but the importance of R, F, and D are the same for this study. Accordingly, the LS-FRM score can be calculated with Equation (10).
4. Experimentation of Learner Group Model Based on Teaching-Learning Activity
4.1. Data Analysis by Using LS-RFD Model
In this study, the basic data of the number of teaching-learning activities and dates of participation are collected, the data cleaning is carried out, and the LS-RFD model is applied. Then, each value is calculated based on the elements of the teaching-learning activity to figure out its characteristics as this paper proposes. That is to say, to figure out the learning tendency for the cognition and processing of information, the LS-RFD values for the entire teaching-learning activity, the group activity and the lecture contents are calculated. Then, clustering of each activity group is carried out to compare and analyze the group characteristics.
Data on 41 participants out of a total of 47 (six had no teaching-learning activity) are in Table 2.
Based on the number of activities and dates of participation in all teaching-learning activities, group activities, and lecture content activities, RFD values were calculated by using the formula defined in Section 3.
First, the RFD values for the entire teaching-learning activity are in Table 3.
Furthermore, the RFD values for group activities are in Table 4.
In addition, the RFD values of lecture content activities are in Table 5.
The R, F, and D values are standardized to compare them against each other. The standardized Rst, Fst and Dst values for each activity are calculated using (9). First, the RFDst values for all teaching-learning object activities are in Figure 3.
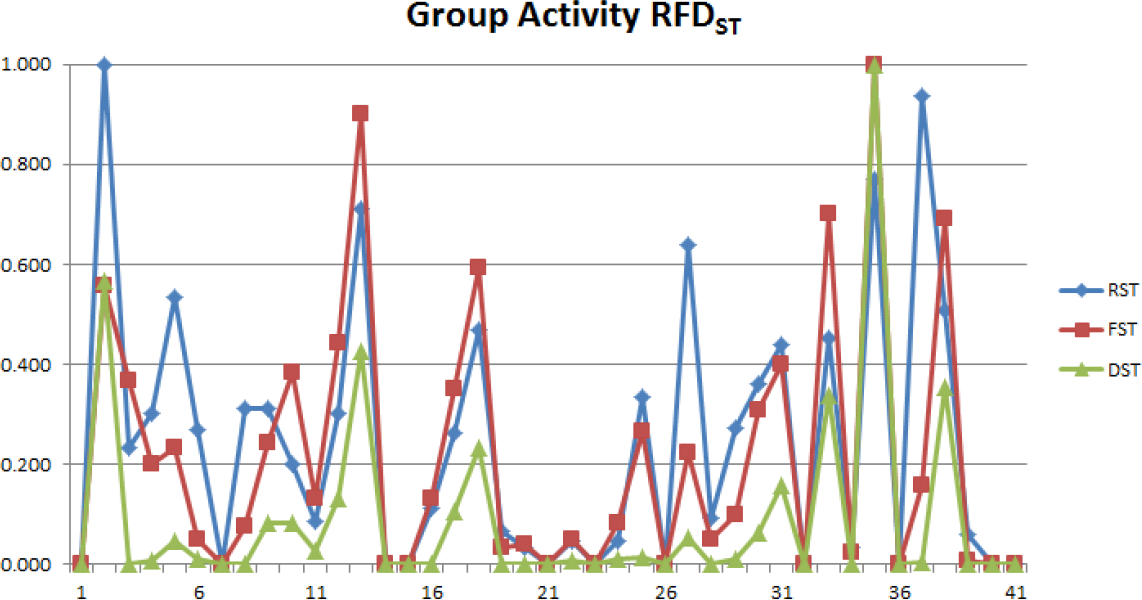
Next, RFDst values for group activities are shown in Figure 4.
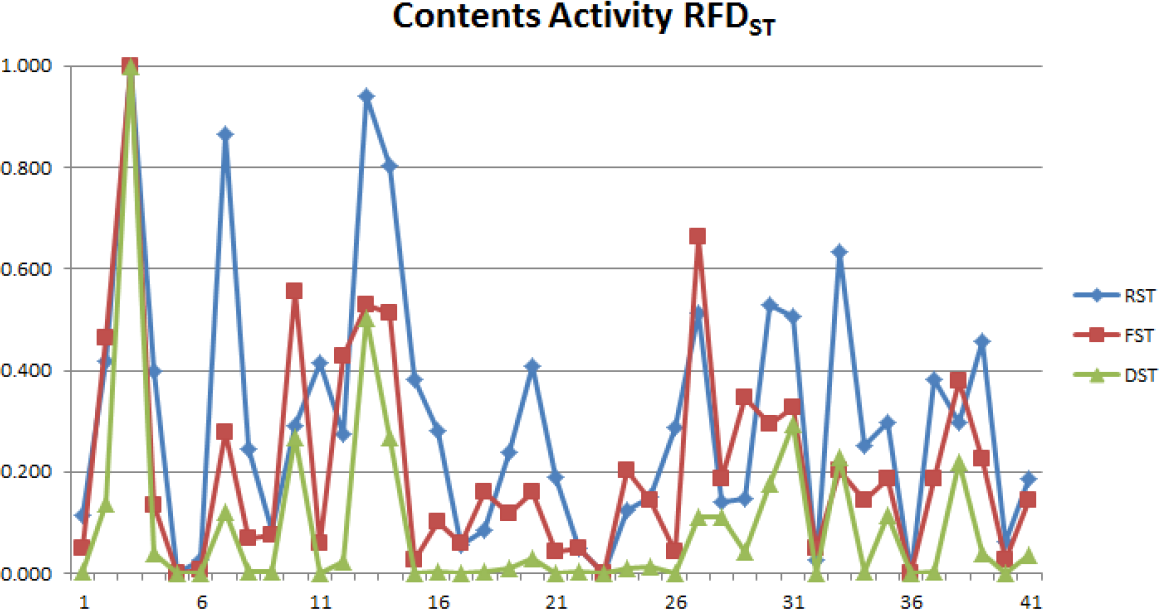
Furthermore, RFDst values for lecture content activities are shown in Figure 5.
Then, groups needed to be categorized according to their characteristics through clustering based on the standardized RFDst values. Clustering was conducted in two stages, including hierarchical and non-hierarchical clustering. Above all, clustering must be performed through a hierarchical method to deduce the most appropriate number of clusters. Based on the result, the number of clusters needs to be set, and non-hierarchical clustering is performed [25].
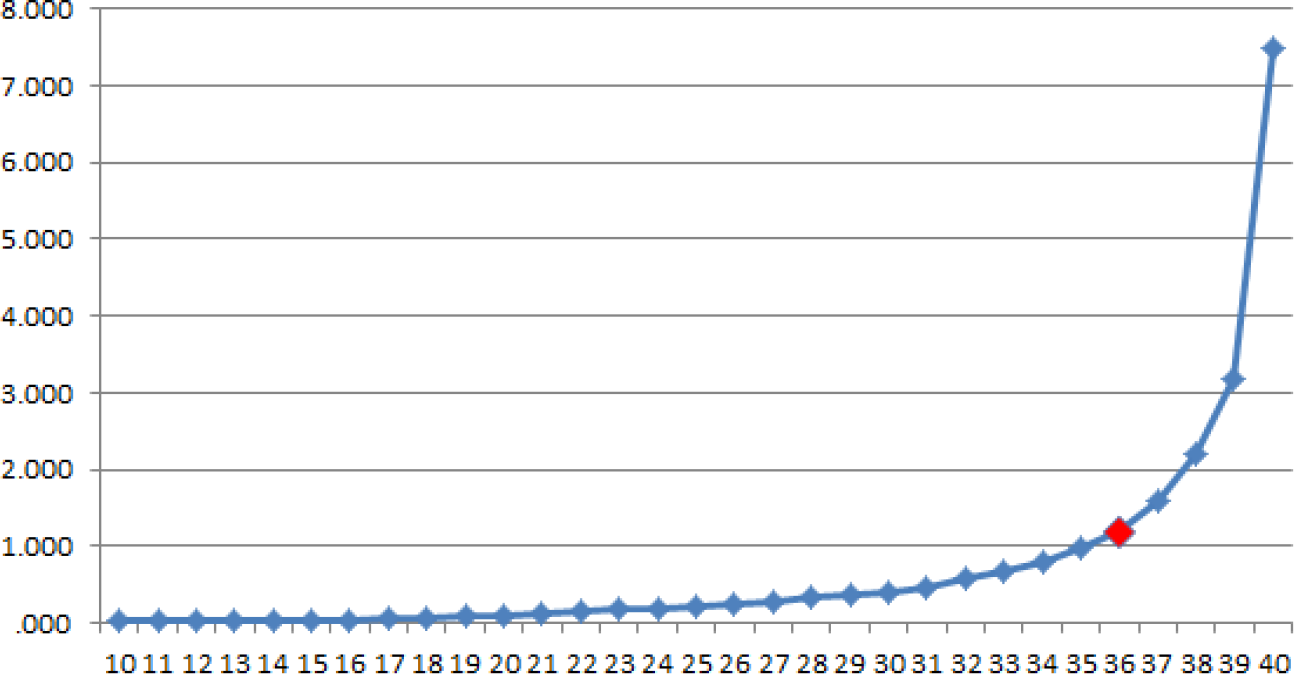
For hierarchical clustering, a correlation coefficient needs to be calculated by using the Ward method, as seen in Figure 6. In doing so, clustering can be performed in relation to 36, which is the largest changed. That is to say, it needs to be defined as K = 5 (K value = 41 − 36). This means dividing them into five groups is ideal.
Next, the K-means method, which is a non-hierarchical clustering method, is used to carry out RFDst clustering for the all teaching-learning activities, the group activities, and the lecture content activities [26]. The RFDst values for all teaching-learning activities are in Table 6, and Group 3 can be seen to be the most active; 14.6% of the people in teaching-learning activities were found to be active, while 19.5% exhibited a low level of activity.
The clustering for RFDst values for group activities are in Table 7, and Group 5 can be seen to be the most active, with 14.6% found to be the most active people, whereas 56.1% showed a low level of activity.
The RFDst values for lecture content activities are in Table 8, and Group 3 can be seen to be the most active, 9.8% and 51.2% found to be active and passive, respectively, for content activities.
Based on the results from the experiment so far, the RFDst values and activity levels for the all teaching-learning activities, group activities and lecture content activities are in Table 9.
ID 13 was found to participate in teaching-learning activities in the most active manner, whereas IDs 2, 3, 33, 35 and 38 participated in such activities in a relatively active manner as well. Meanwhile, ID 33 and 35 showed a high level of preference for group activities, but a low level of preference for lecture content activities. Further, ID 3 indicated a high level of preference for content activities but a low level of preference for group activities.
5. Conclusions
In this study, learning style attributes were utilized to figure out group characteristics of learners. In other words, a learners’ group model was designed according to the learning style of Felder and Silverman. In addition, the LS-RFD model was suggested to quantitatively calculate the level of the learner’s preferences for the activity from the elements of the teaching-learning activity. The LS-RFM model measures the preference for the teaching-learning activity based on recency, frequency and durability of the teaching-learning activity. In the experiment to which this model was applied, activities were classified into teaching-learning, group and lecture content activities. Then, the preferences of the learner for each attribute were classified into five levels. Based on this, the level of the teaching-learning activity and the preference for such an activity in the learner were figured out. This can be used as the basis for understanding learners. Based on this result, there needs to be further study into modeling learner styles to better figure out the learners’ characteristics. Finally, sophisticated studies need to be carried out on the model itself, and the results can be utilized for studies connected with personalized learning services.
Acknowledgments
This research was supported by the “Cross-Ministry Giga KOREA Project” of the Ministry of Science, ICT and Future Planning, Republic of Korea (ROK). [GK14P0100, Development of Tele-Experience Service SW Platform based on Giga Media].
Author Contributions
Kyungrog Kim and Nammee Moon conceived and designed the experiments; Yoo-Joo Choi and Mihui Kim performed the experiments; Jung-Woon Lee analyzed the data; Doo-Soon Park contributed reagents/materials/analysis tools; Kyungrog Kim wrote the paper.
Conflicts of Interest
The authors declare no conflict of interest.
References
- Kim, K.R.; Moon, N.M. Designing a social learning content management system based on learning objects. Multimed. Tools Appl. 2013, 64, 423–437. [Google Scholar]
- Goyal, M.; Yadav, D.; Choubey, A. E-learning: Current State of Art and Future Prospects. Int. J. Comput. Sci. Issues. 2012, 9, 490–499. [Google Scholar]
- El Haddiuoi, I.; Khaldi, M. Learner Behavior Analysis on an Online Learning Platform. Int. J. Emerg. Technol. Learn. 2012, 7, 22–25. [Google Scholar]
- Simsek, O.; Atman, N.; Inceoglu, M.M.; Arikan, Y.D. Diagnosis of Learning Styles Based on Active/Reflective Dimension of Felder and Silverman’s Learning Style Model in a Learning Management System, Computational Science and Its Applications ICCSA 2010; Springer: Berlin/Heidelberg, Germany, 2010; pp. 544–555. [Google Scholar]
- Lee, J.; Kim, D. Implementation of a Adaptive Learning System Supporting Dynamic Link. J. Korean Assoc. Inf. Educ. 2012, 16, 275–282. [Google Scholar]
- Esichaikul, V.; Lamnoi, S.; Bechter, C. Student modelling in adaptive e-learning systems. Knowl. Manag. E-Learn. 2011, 3, 342–355. [Google Scholar]
- Romero, C.; Ventura, S.; Garcia, E. Data mining in course management systems: Moodle case study and tutorial. Comput. Educ. Arch. 2008, 51, 368–384. [Google Scholar]
- Toth, P. Online learning behavior and web usage mining. Wseas Trans. Adv. Eng. Educ. 2013, 10, 71–81. [Google Scholar]
- Markovic, S.; Jovanovic, N. Learning style as a factor which affects the quality of e-learning. Sci. Bus. Media. 2011, 38, 303–312. [Google Scholar]
- Park, J. The Relationship between Individual Difference and Science Academic Achievement of High School Students; Department of Science Education, Graduate School, Gyeongsang National University: Jinju, Gyeongnam, Korea, 2010. [Google Scholar]
- Dung, P.Q.; Florea, A.M. An approach for detecting learning styles in learning management systems based on learners’ behaviours, Proceedings of the 2012 International Conference on Education and Management Innovation, Kuala Lumpur, Malaysia, 5–6 May 2012; 30, pp. 171–177.
- Yarandi, M.; Tawil, A.R.H.; Jahankhani, H.; Hosseini, S.A. Ontology-based Learner Modelling for Supporting Personalised e-Learning, Proceedings of the 2012 International Conference on Interactive Mobile and Computer Aided Learning, Amman, Jordan, 6–8 November 2012; pp. 113–118.
- Saberi, N.; Montazer, G.A. A New Approach for Learners’ Modeling in Elearning Environment Using LMS logs Analysis, Proceedings of the 6th National and 3rd International Conference of e-Learning and e-Teaching, Tehran, Iran, 14–15 February 2012; pp. 25–33.
- Hu, Y.H.; Lo, C.L.; Chung, F.I. Applying RFM Analysis to Library-Book Recommender Systems. Commun. ICISA. 2012, 13, 79–95. [Google Scholar]
- Eom, J.H.; The, Quantitative. Evaluation of a Level of Insider Activity using SFI Analysis Technique. J. Secur. Eng. 2013, 10, 113–122. [Google Scholar]
- Hanhoon, K. An Improved Naive Bayes Method and Senti Lexicon for Ranking and Sentiment Analysis of Places; Department of Computer Engineering, The Graduate School Sejong University: Seoul, Korea, 2013. [Google Scholar]
- Cho, K.H.; Park, H.C. A study on real estate customer segmentation using RFMP. J. Korean Data Inf. Sci. Soc. 2012, 23, 515–523, In Korean. [Google Scholar]
- Chiu, C.Y.; Lin, Z.P.; Chen, P.C.; Kuo, I.T. Applying RFM Model to evaluate the e-loyalty for information-based web site. Int. J. Electron. Bus. Manag. 2009, 7, 278–285. [Google Scholar]
- Chang, H.C.; Developing, EL-RFM. Model for Quantification Learner’s Learning Behavior in Distance Learning 2010, 4, V4-452–V4-454.
- Franzoni, A.L.; Assar, S. Student Learning Styles Adaptation Method Based on Teaching Strategies and Electronic Media. Educ. Technol. Soc. 2009, 12, 15–29. [Google Scholar]
- Fouad, K.M.; Harb, H.M.; Nagdy, N.M. Using Semantic Web to support Advanced Web-Based Environment. Int. J. Adv. Comput. Sci. Appl. 2011, 2, 120–129. [Google Scholar]
- Garcia, P.; Amandi, A.; Schiaffino, S.; Campo, M. Evaluating Bayesian networks’ precision for detecting students’ learning styles. Comput. Educ. 2007, 49, 794–808. [Google Scholar]
- Yoon, T.; Lee, J.H.; Cho, K. Advanced Learner’s Modeling based on Weighted Support Vector Data Description (SVDD). J. Korea Inf. Sci. Soc. Softw. Appl. 2013, 40, 45–52. [Google Scholar]
- Maryam, Y.; Abdel-Rahman, T.; Hossein, J. Ontologies for Personalised Adaptive Learning, Proceedings of the Advances in Computing and Technology, University of East London, London, UK, 19 January 2012.
- Lee, H.; Lim, J.H. Statistical Package for the Social Sciences 14.0 Manual; Bobmunsa: Kyung-Gi, Korea, 2008; pp. 418–445. [Google Scholar]
- Azadnia, A.H.; Ghadimi, P.; Aghdam, M.M. A Hybrid Model of Data Mining and MCDM Methods for Estimating Customer Lifetime Value, Proceedings of the 41st International Conference on Computers & Industrial Engineering, Los Angeles, CA, USA, 23–25 July 2012; pp. 80–85.


| Division | Characteristics of Learning Style | Teaching-Learning Activity Elements | |
|---|---|---|---|
| Cognition of Information | Visual | Remembers well what he/she has seen from picture, chart, video and presents it exactly | Video content |
| Verbal | Remembers well the words, sentences, what he/she heard and said and presents it with less detail | Audio content Text content | |
| Information Processing | Activity | He/she participates well in group activity, performs, discusses, explains and tests it. | Blog activity, discussion activity, group activity, sending messages |
| Reflective | Accesses the subject personally, after thinking and understanding enough | Checking notifications, blogs, discussions, and journals and receiving messages | |
| Division | The Number of Activities | Dates of Participation | ||||
|---|---|---|---|---|---|---|
| Min | Max | Mean | Min | Max | Mean | |
| All Activities | 14 | 419 | 132.07 | 1 | 28 | 11.17 |
| Group Activity | 0 | 120 | 25.76 | 0 | 13 | 3.46 |
| Lecture Content Activity | 0 | 119 | 25.00 | 0 | 14 | 5.20 |
| ID | Number of Learning Activities | Dates of Participation in Learning | R | F | D |
|---|---|---|---|---|---|
| 1 | 62 | 5 | 0.051 | 0.738 | 2.309 |
| 2 | 270 | 22 | 0.460 | 3.214 | 32.244 |
| 40 | 39 | 6 | 0.075 | 0.464 | 0.414 |
| 41 | 59 | 10 | 0.218 | 0.655 | 2.861 |
| ID | Number of Group Activities | Dates of Group Participation | R | F | D |
|---|---|---|---|---|---|
| 1 | 0 | 0 | 0.000 | 0.000 | 0.000 |
| 2 | 67 | 13 | 0.356 | 0.798 | 5.097 |
| 40 | 0 | 0 | 0.000 | 0.000 | 0.000 |
| 41 | 0 | 0 | 0.000 | 0.000 | 0.000 |
| ID | Number of Lecture Content Activities | Dates of Participation in Lecture Content Activity | R | F | D |
|---|---|---|---|---|---|
| 1 | 6 | 3 | 0.049 | 0.071 | 0.040 |
| 2 | 55 | 8 | 0.182 | 0.655 | 1.090 |
| 40 | 3 | 1 | 0.028 | 0.036 | 0.001 |
| 41 | 18 | 5 | 0.081 | 0.202 | 0.284 |
| Center | G1 | G2 | G3 | G4 | G5 |
|---|---|---|---|---|---|
| R | 0.114 | 0.590 | 1.000 | 0.384 | 0.709 |
| F | 0.088 | 0.710 | 1.000 | 0.219 | 0.392 |
| D | 0.016 | 0.774 | 0.686 | 0.073 | 0.194 |
| LSRFD(Average) | 0.073 | 0.691 | 0.895 | 0.225 | 0.432 |
| Level of Activity | Lowest | High | Highest | Low | Normal |
| Number of Clusters | 8 | 5 | 1 | 20 | 7 |
| Center | G1 | G2 | G3 | G4 | G5 |
|---|---|---|---|---|---|
| R | 0.062 | 0.628 | 0.704 | 0.305 | 0.770 |
| F | 0.034 | 0.688 | 0.205 | 0.329 | 1.000 |
| D | 0.003 | 0.384 | 0.034 | 0.072 | 1.000 |
| LSRFD(Average) | 0.033 | 0.567 | 0.315 | 0.235 | 0.923 |
| Level of Activity | Lowest | High | Normal | Low | Highest |
| Number of Clusters | 23 | 5 | 3 | 9 | 1 |
| Center | G1 | G2 | G3 | G4 | G5 |
|---|---|---|---|---|---|
| R | 0.441 | 0.323 | 1.000 | 0.870 | 0.124 |
| F | 0.180 | 0.472 | 1.000 | 0.440 | 0.079 |
| D | 0.093 | 0.134 | 1.000 | 0.298 | 0.010 |
| LSRFD(Average) | 0.238 | 0.310 | 1.000 | 0.536 | 0.071 |
| Level of Activity | Low | Normal | Highest | High | Lowest |
| Number of Clusters | 10 | 6 | 1 | 3 | 21 |
| ID | RFDs | Level of All Activities | Group RFD | Level of Group Activities | Content RFD | Level of Content Activities | Activity Sum |
|---|---|---|---|---|---|---|---|
| 3 | 0.537 | 3 | 0.201 | 2 | 1.000 | 5 | 10 |
| 33 | 0.743 | 4 | 0.496 | 4 | 0.354 | 2 | 10 |
| 2 | 0.677 | 4 | 0.709 | 4 | 0.339 | 3 | 11 |
| 35 | 0.793 | 4 | 0.923 | 5 | 0.199 | 2 | 11 |
| 38 | 0.581 | 4 | 0.518 | 4 | 0.298 | 3 | 11 |
| 13 | 0.895 | 5 | 0.679 | 4 | 0.658 | 4 | 13 |
© 2015 by the authors; licensee MDPI, Basel, Switzerland This article is an open access article distributed under the terms and conditions of the Creative Commons Attribution license (http://creativecommons.org/licenses/by/4.0/).
Share and Cite
Kim, K.; Choi, Y.-J.; Kim, M.; Lee, J.-W.; Park, D.-S.; Moon, N. Teaching-Learning Activity Modeling Based on Data Analysis. Symmetry 2015, 7, 206-219. https://doi.org/10.3390/sym7010206
Kim K, Choi Y-J, Kim M, Lee J-W, Park D-S, Moon N. Teaching-Learning Activity Modeling Based on Data Analysis. Symmetry. 2015; 7(1):206-219. https://doi.org/10.3390/sym7010206
Chicago/Turabian StyleKim, Kyungrog, Yoo-Joo Choi, Mihui Kim, Jung-Won Lee, Doo-Soon Park, and Nammee Moon. 2015. "Teaching-Learning Activity Modeling Based on Data Analysis" Symmetry 7, no. 1: 206-219. https://doi.org/10.3390/sym7010206