Chiral Liquid Crystals: Structures, Phases, Effects

Abstract
: The introduction of chirality, i.e., the lack of mirror symmetry, has a profound effect on liquid crystals, not only on the molecular scale but also on the supermolecular scale and phase. I review these effects, which are related to the formation of supermolecular helicity, the occurrence of novel thermodynamic phases, as well as electro-optic effects which can only be observed in chiral liquid crystalline materials. In particular, I will discuss the formation of helical superstructures in cholesteric, Twist Grain Boundary and ferroelectric phases. As examples for the occurrence of novel phases the Blue Phases and Twist Grain Boundary phases are introduced. Chirality related effects are demonstrated through the occurrence of ferroelectricity in both thermotropic as well as lyotropic liquid crystals. Lack of mirror symmetry is also discussed briefly for some biopolymers such as cellulose and DNA, together with its influence on liquid crystalline behavior.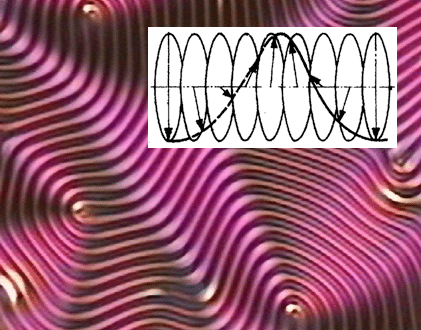
1. Introduction
Chirality [1–4] is related to symmetry, or one should better say to the lack thereof. Symmetry breaking is a phenomenon which can be observed in all parts of nature, living or not, large or small, molecular or macroscopic. Since the days when Louis Pasteur concluded that chiral crystals must be made up by asymmetric molecules [5], the study of chirality effects has been one of increasing academic and applicational interest. Today, it is well known that chirality, derived from the Greek word χειρ (kheir = hand), is a most common property. To state it with William Thomson, the latter Lord Kelvin: I call any geometrical figure or group of points “chiral”, and say it has chirality, if its image in a plane mirror, ideally realized, cannot be brought to coincide with itself [6]. Examples can be found everywhere.
1.1. Chirality
The lack of mirror symmetry is very common, with the most prominent example being that of our hands, which cannot be brought to coincide by application of symmetry elements of the first kind, translation and rotation. They are mirror images of each other, which can easily be felt by trying to put a right glove on the left hand. Very often chirality can be found in molecules, where the two mirror images (enantiomers) have equal fundamental properties, for example the melting point, but chiral properties of opposite handedness, where subtle molecular differences lead to profound changes. For example the molecule D-limenone smells of orange, while its mirror image L-limonene smells of lemon. Such subtle chirality effects are often employed in the design and action of drugs [7–9].
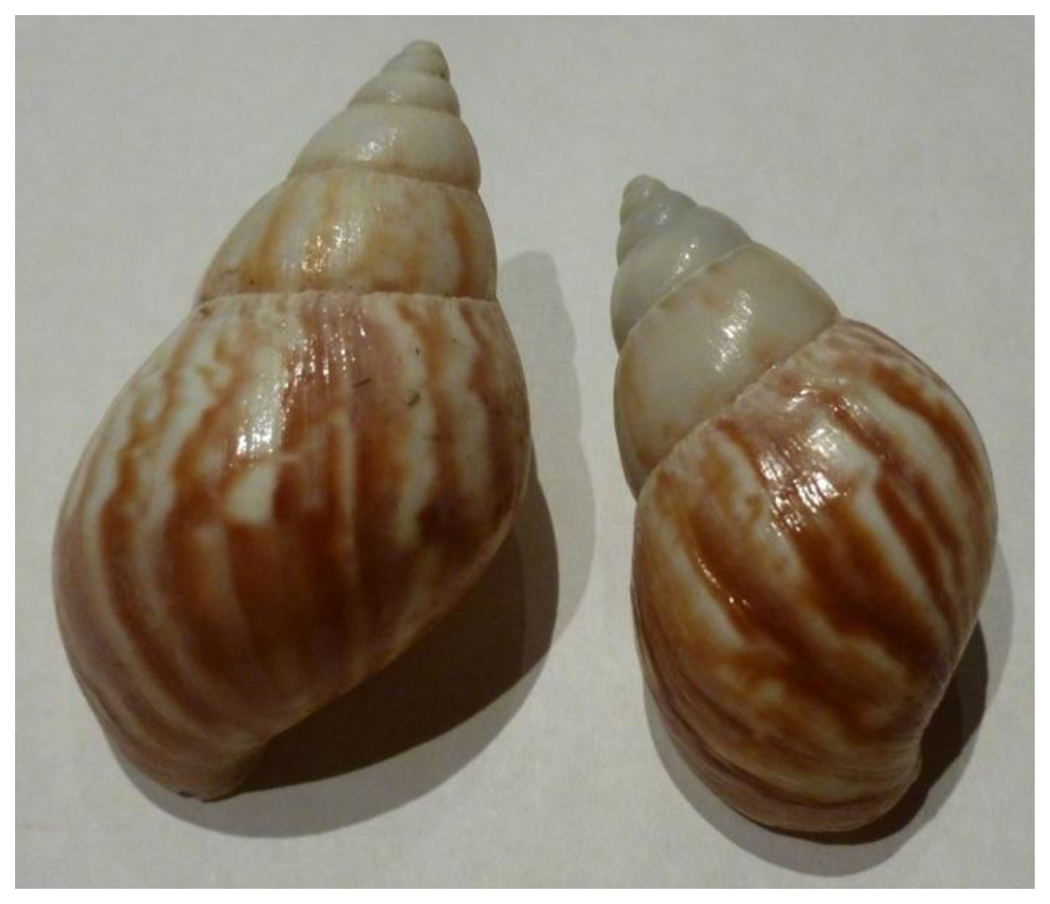
But chirality can also be found in other areas of life, for example plants and animals. The field bindweed plant Convolvulus arvensis exhibits right handed growth, while the trumpet honeysuckle Lonicera sempervirens grows in a left-handed fashion. Interesting examples may also be found in animal life, especially snails. As examples, Lymnaea peregra snail shells are right handed, while Laciniaria biplicata shells exhibit a left-handed spiral. Only seldom, species like the Cuban Liguus poeyanus are observed, which display an equal population of left- and right-handed shells (see also Figure 1 for a homochiral species). Coming back to the biomolecular scale, it is found that nature prefers a certain handedness. Given few exceptions, all proteins are formed by the 20 same amino acids, of which all except glycine are chiral and nearly exclusively formed by amino acids of the L-handedness. Like the proteins, also the nucleic acids DNA and RNA are found in nature, exhibiting a certain handedness. A single strand of the double helix DNA consists of a polymer backbone in which a chiral sugar group alternates with a phosphoric acid group. To the sugar groups the bases are attached which define the sequence of genetic makeup, i.e., the genetic code. In nucleic acids only D-sugars are contained, without exception.
Chirality though finds its way from the very small to the very large. The Beta decay of Cobalt, Co60, has been shown to exhibit handedness through the emission of nearly exclusively single handed electrons (right handed) and neutrinos (left handed), where the electron moves along the direction of the spin (called parity violation caused by the weak interaction). It has been argued that this may be the cause of the handedness of biologically active molecules such as amino acids and sugars. On the other end of the scale, it seems that galaxies exhibit a certain handedness [10–12], which is two-dimensional when spiral galaxies are projected onto a plane. More left handed spirals seem to be observed in the northern sky, while the southern sky shows more right handed ones.
Molecular chirality is generally brought about by an asymmetry of molecular groups, most often an asymmetrical substituted carbon atom. This is called a chiral center. Less often chirality is introduced via chiral axes or chiral planes. The designation of left and right handedness is done via the set of rules provided by Cahn, Ingold and Prelog (CIP-system) [13]. A measure of chirality on the other hand is not trivial to define [14]. Normally, only quantities which allow a comparison between two chiral objects (molecules) are presented, such as optical activity, circular dichroism (CD) or optical rotation dispersion (ORD). These are not measures of chirality. A chirality measure should be a steady, real function which is exactly zero when the object is achiral. It is sensible to normalise a chirality measure to an interval [0, 1]. This does not discriminate between enantiomers, one needs to introduce sign conventions to define left and right. Two classes of geometric chirality measures are possible. The first measures the deviation of a chiral object from an achiral reference object, and the second determines the difference between two enantiomers.
1.2. Chiral Liquid Crystals
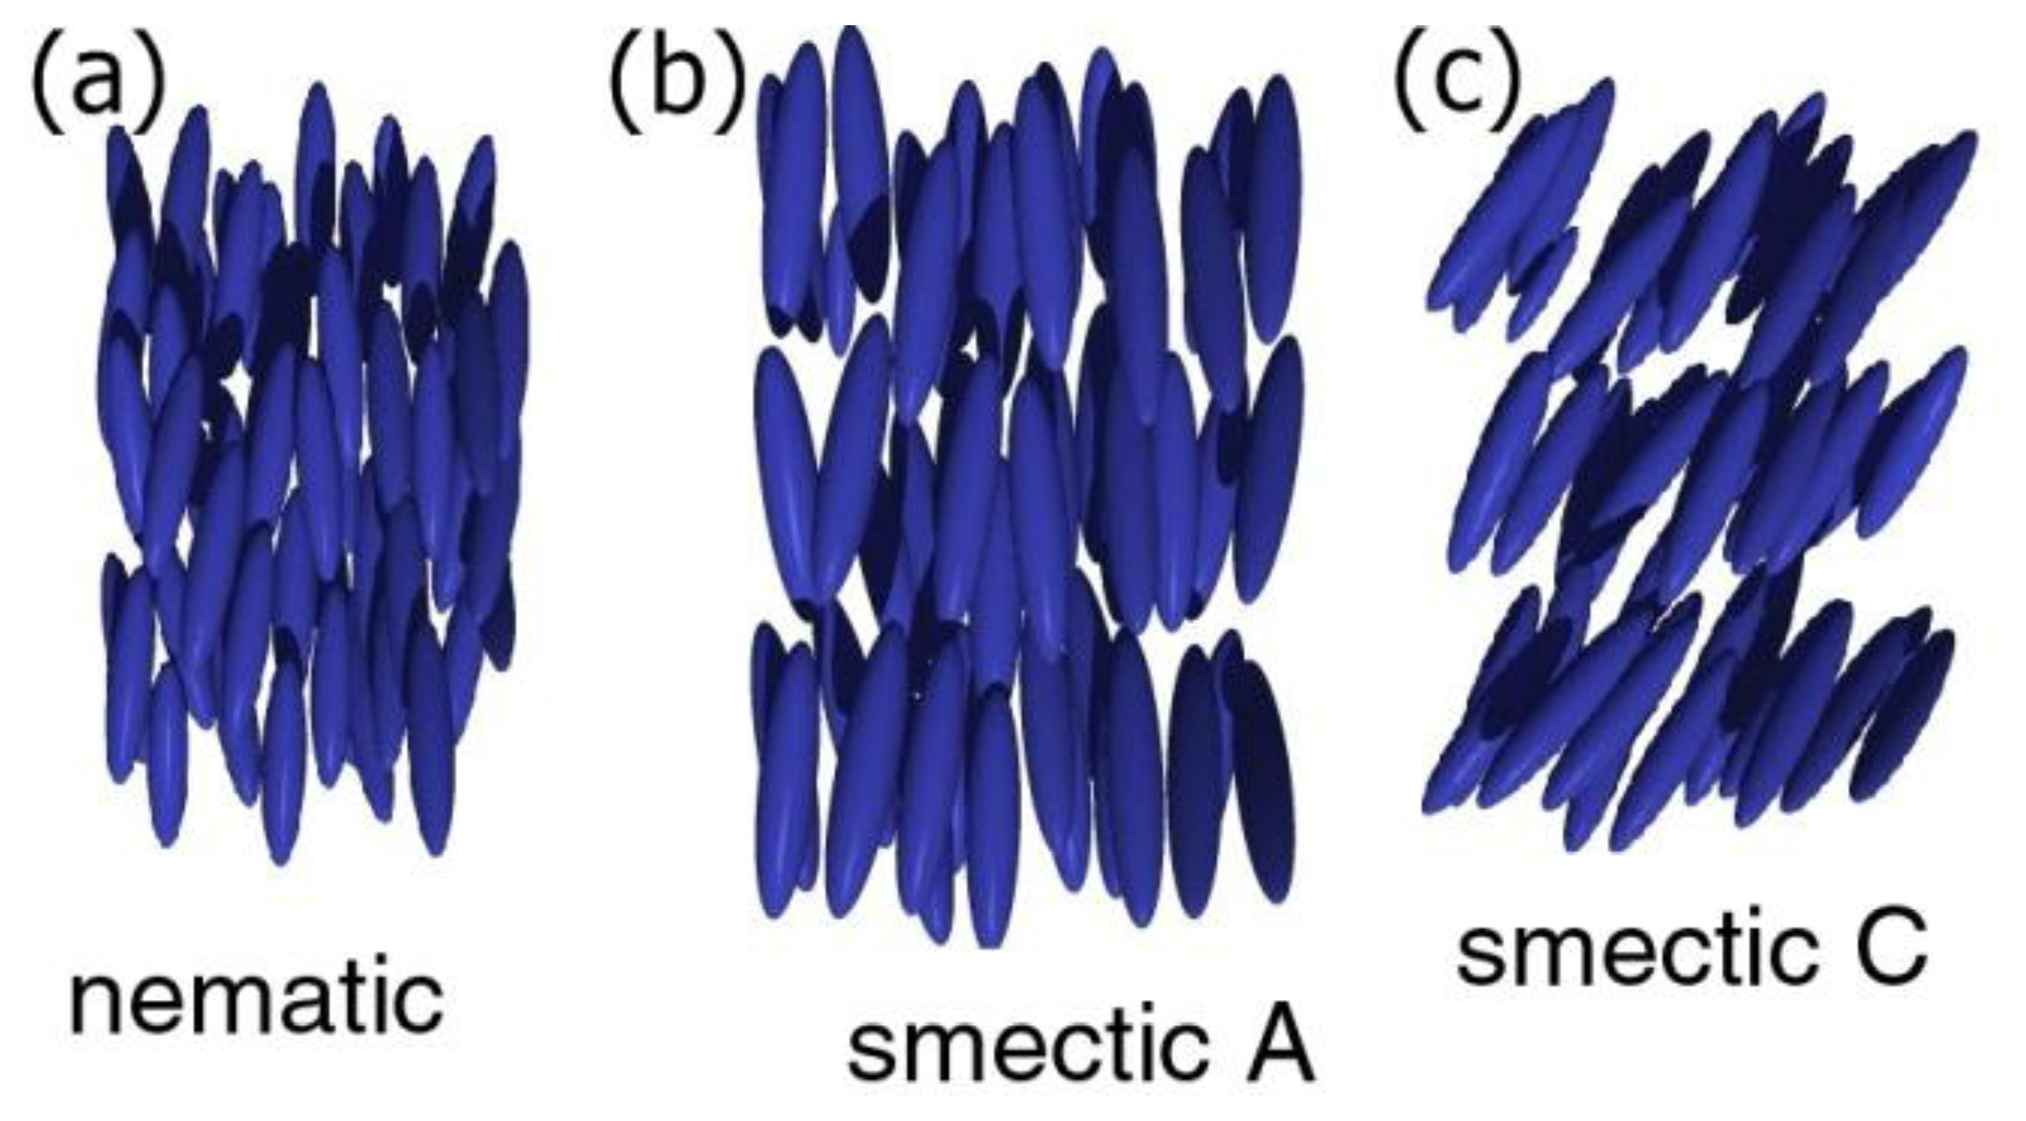
Liquid crystals [15–17] are a state of matter thermodynamically located between the isotropic liquid, and the three dimensionally ordered solid. They exhibit properties of flow, and at the same time physical quantities like refractive index, elastic constant, viscosity, dielectric constant or thermal and electrical conductivity, just to name a few, are anisotropic. A number of different liquid crystal phases, separated by first or second order phase transitions, are distinguished. At first, there are two classes of liquid crystals, thermotropic and lyotropic ones [18,19]. The former are observed by temperature change, while the latter form in the presence of solvents, often amphiphilic molecules in water. For thermotropic phases, which will represent the majority of discussion in this review, different phases are distinguished for molecules of varying shape. The two most prominent classes are calamitic phases consisting of rod-like molecules, and discotic phases of disk like mesogens [20]. The calamitic phase with the least order and highest symmetry is the nematic phase (Figure 2a), which exhibits solely orientation order of the long axis of elongated molecules, called the director n(r). Decrease in temperature eventually leads to the smectic phases, which in addition to the orientational order of the nematic phase exhibit one-dimensional positional order. The director can be parallel (smectic A, Figure 2b) or titled (smectic C, Figure 2c) with respect to the smectic layer normal. These phases can be seen as one-dimensional solids, or two-dimensional liquids. The two-dimensional class of phases with even higher order (less symmetry) are the hexatic phases, which show bond-orientational order within the smectic layers. At even lower temperatures, hexatic order can then extend across smectic layers. These phases are normally called soft solids.
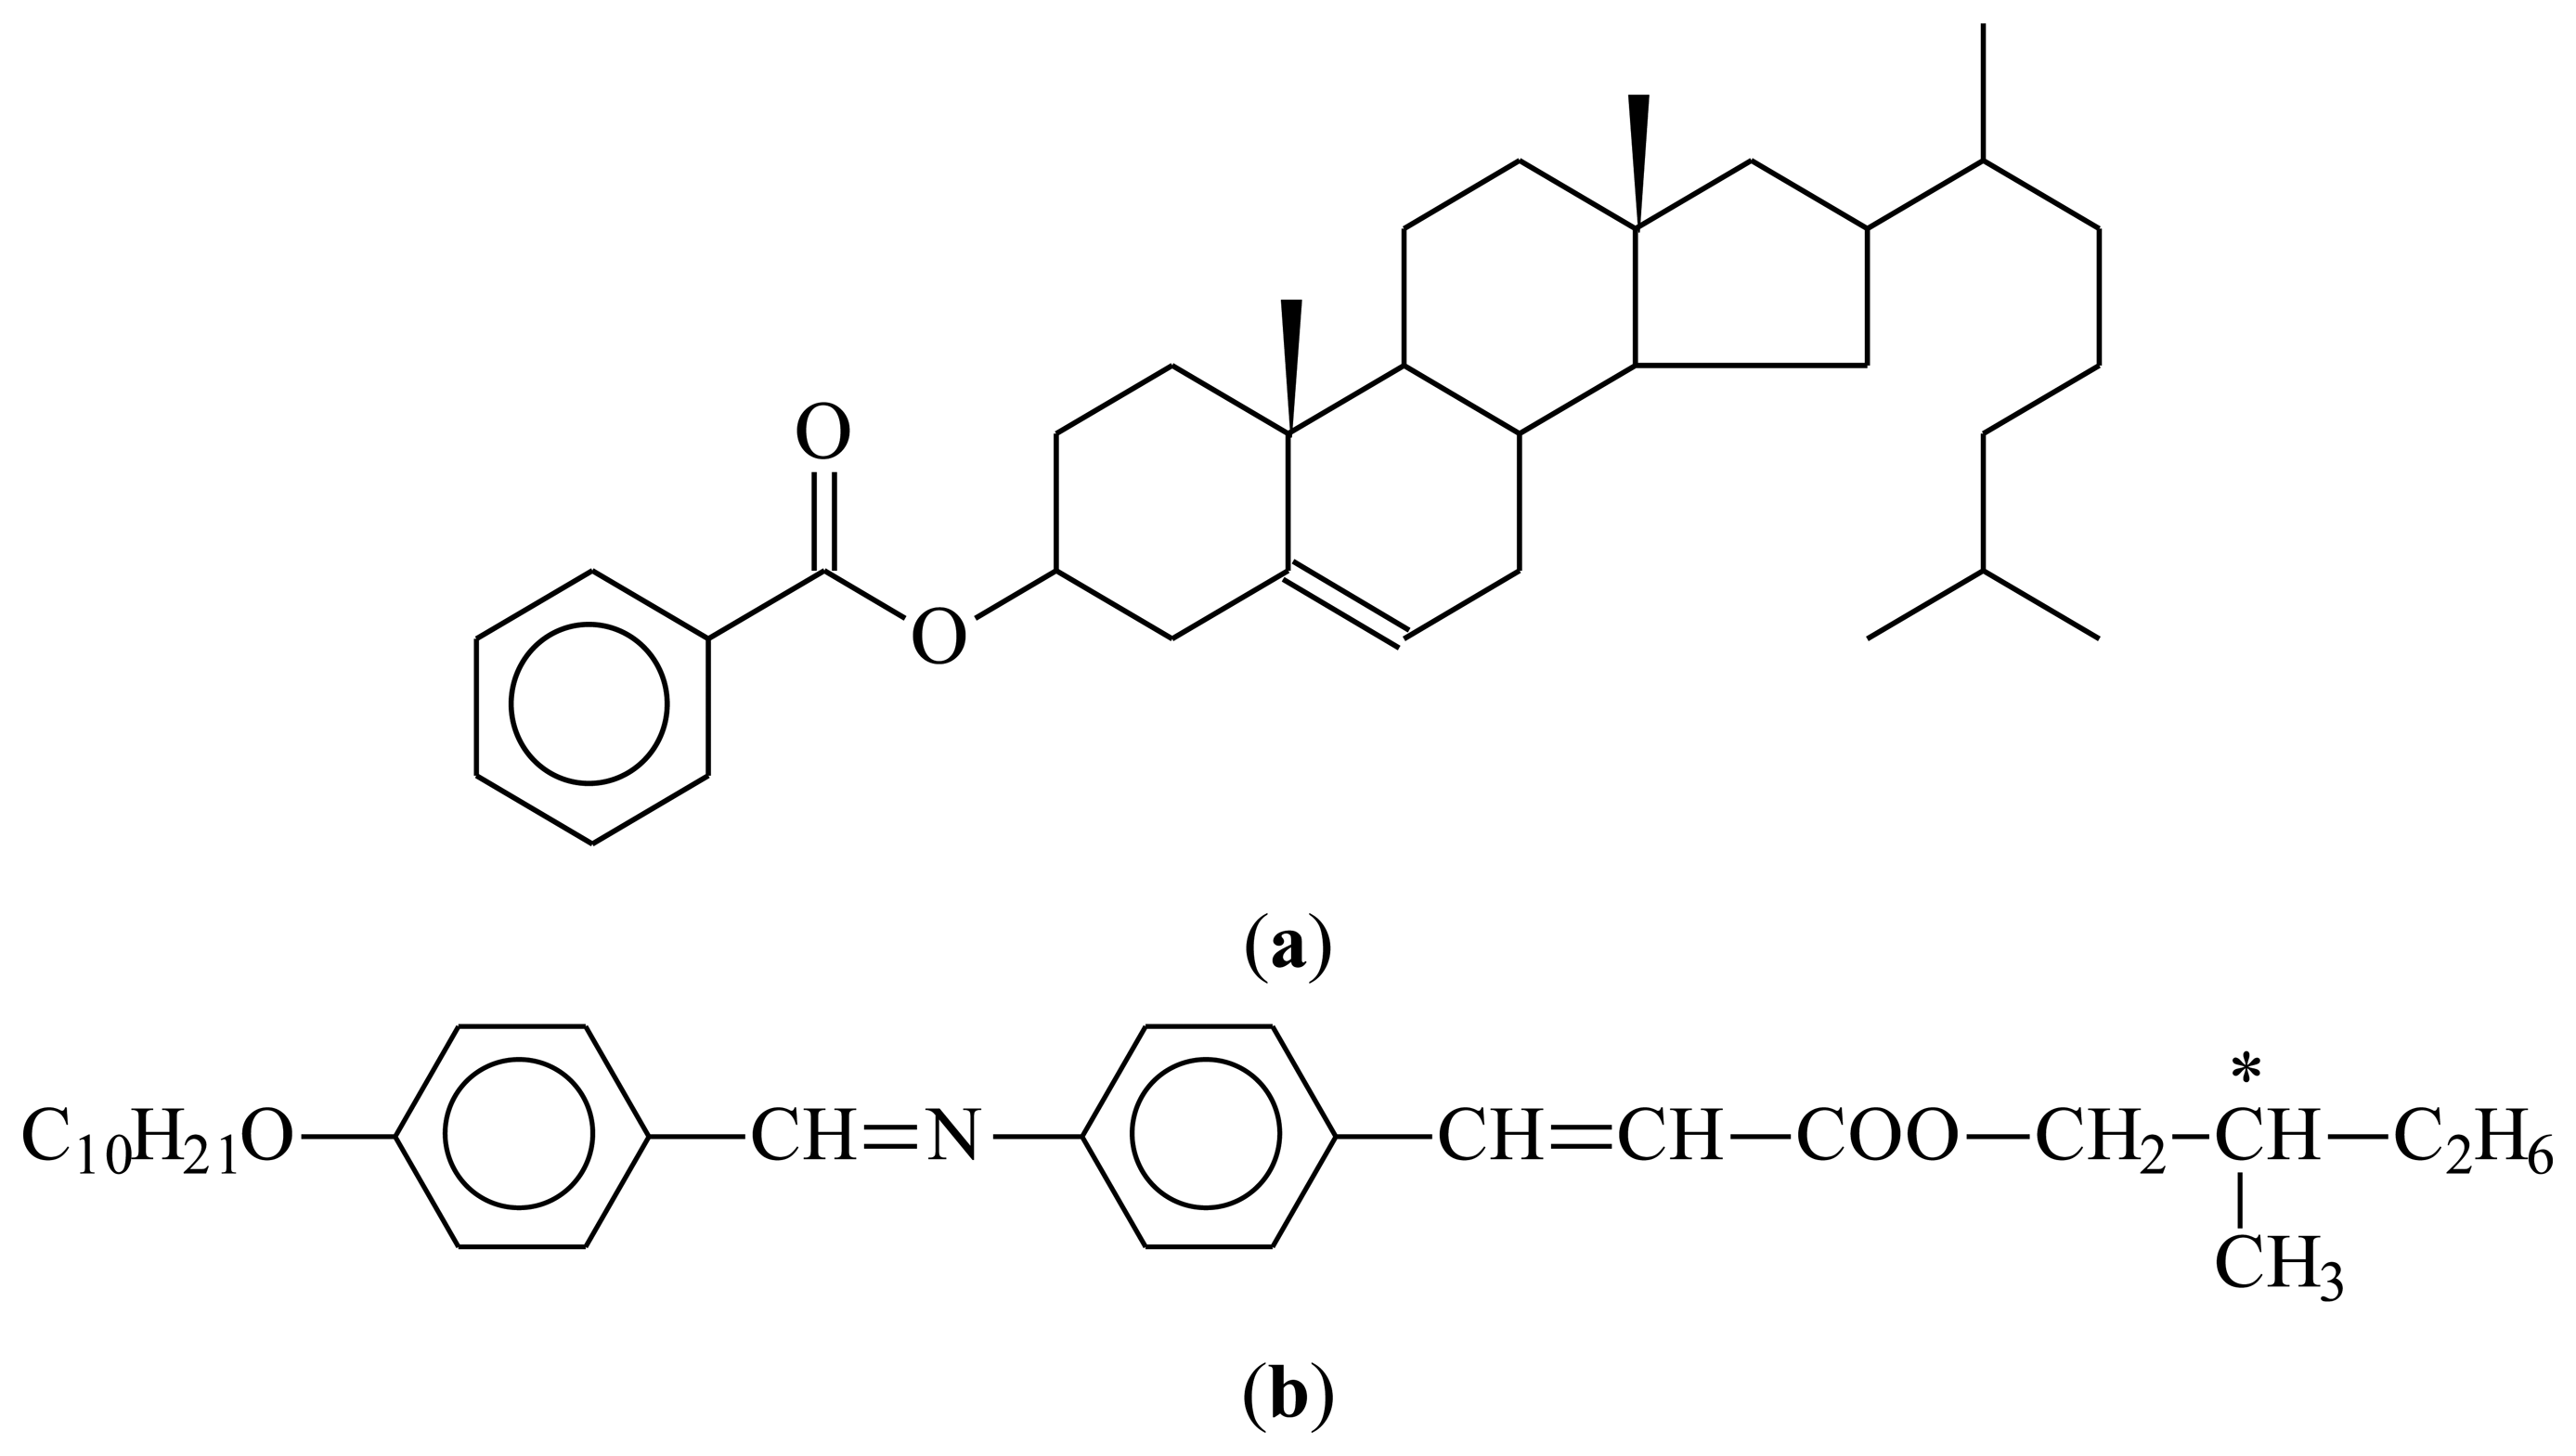
Liquid crystal molecules (mesogens), just as other molecules, can also be made chiral [21]. There are two principle ways to proceed, (i) including chirality within the molecule, mainly by substituting one or more of the carbon atoms asymmetrically by four different ligands. Also examples of mesogens with a chiral axis or plane are known, but much less common; (ii) adding mesogenic or non-mesogenic chiral dopants at varying concentration to an existing liquid crystal phase. Generally, for small concentrations below 5%–10% by weight, chirality related effects increase linearly with the concentration of dopant. For larger amounts, phase separation is often observed, especially if the mesogen and the chiral dopant are not similar in molecular shape. Some examples are depicted in Figure 3.
Just as for other molecules, the introduction of chirality to the system has a profound impact on the properties. Several phases exhibit helical superstructures, for example the chiral nematic or cholesteric phase, where the director describes a spiral in space along the z-direction according to Equation (1) with P defined as the pitch of the helix and φ0 defined as a constant which depends on the boundary conditions:
This will lead to the reflection of circular polarized light [22], which can be used in several applications. Also the chiral smectic C* phase exhibits a helix [23], which is related to the formation of a spontaneous polarization and the property of ferroelectricity. The helical superstructure is formed to locally compensate the spontaneous polarization. Not only chiral structures are observed, but also novel, frustrated phases which only exist in chiral materials, namely the Blue Phases [24] (BP) and the Twist Grain Boundary phases [25,26] (TGB (Figure 4)). Also the Blue Phases have recently led to novel display effects with superior properties over nematics. At last, there are numerous chirality related effects observed, which can be exploited in novel displays, light shutters, polarization modulators, lasers and other photonic devices, sensors and the like. The most obvious effect is molecular optical activity, as it is also observed for chiral, non-liquid crystalline materials. Other effects are structural optical activity, due to helical superstructures with a pitch in the visible range of the optical spectrum. Electric effects are for example the occurrence of ferroelectricity and antiferroelectricity, as well as the electroclinic effect, which is similar to the piezoelectric effect of solid state materials. All of these will be discussed in more detail below.
2. Helicity and the Chiral Nematic Phase
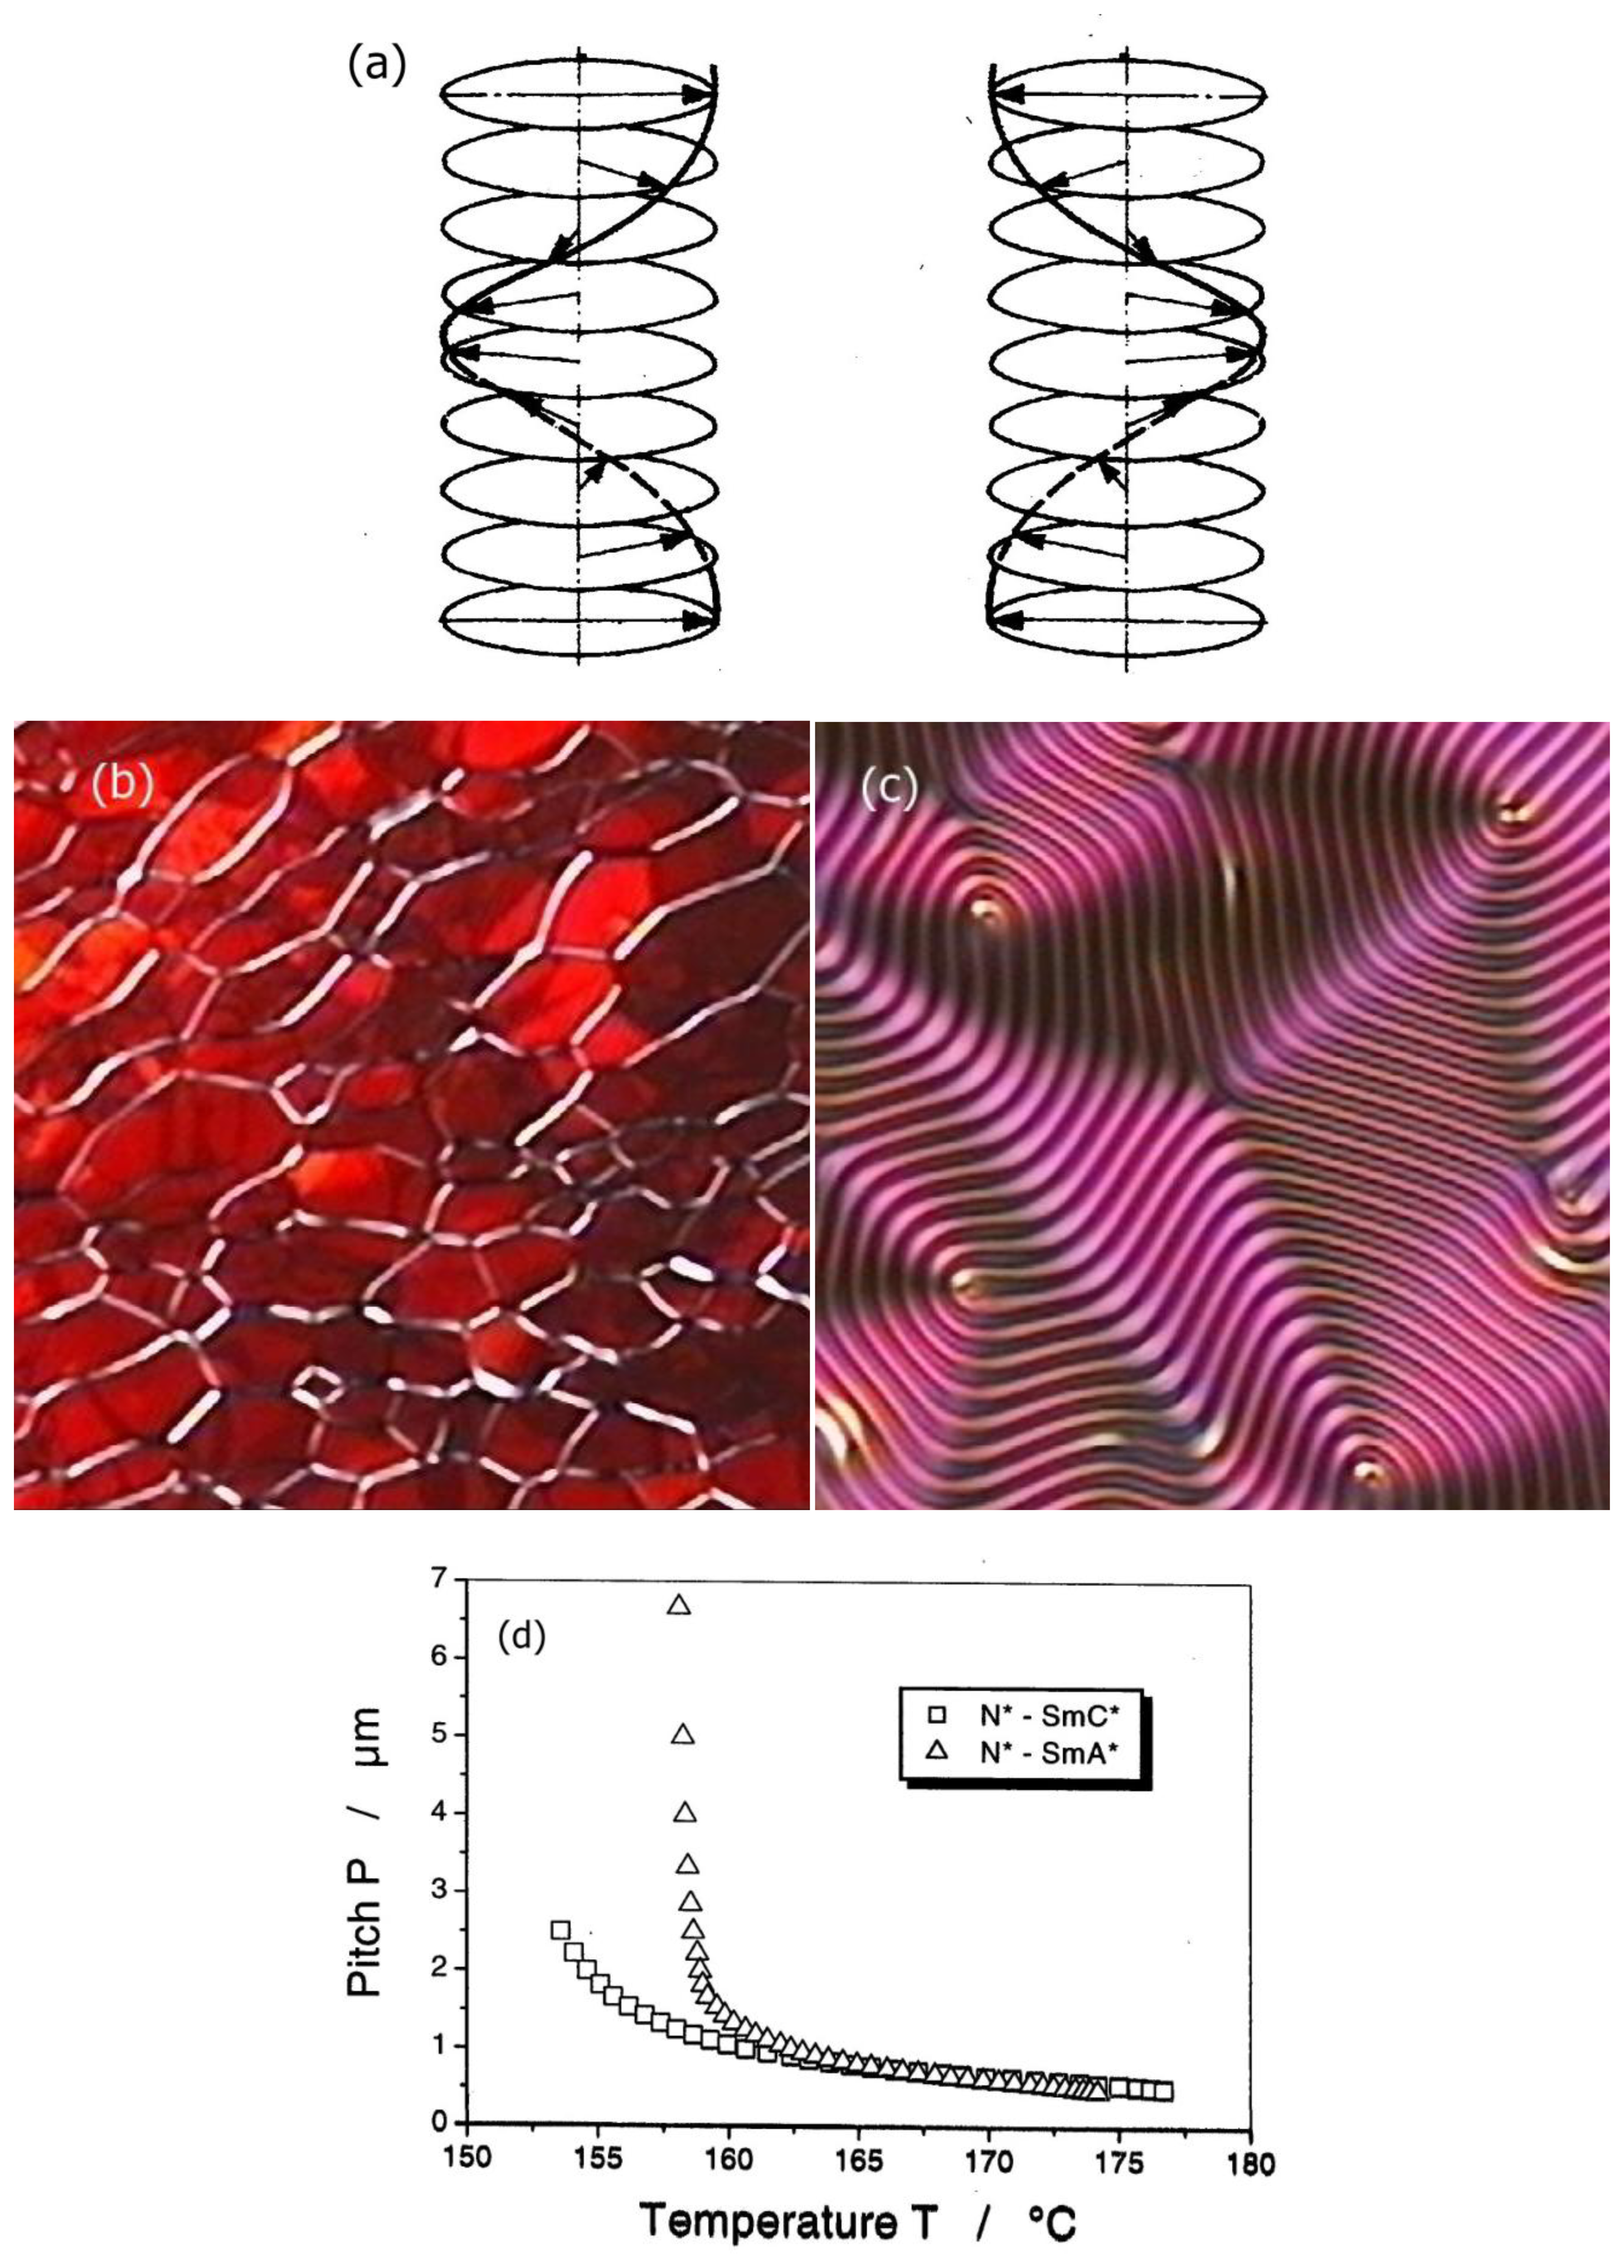
One of the most prominent manifestations of macroscopic symmetry breaking through molecular chirality can be observed through the helicity of the cholesteric or chiral nematic phase. In this case a spiralling structure is observed with the director twisting around an axis which is perpendicular to the long molecular axis. As expected, while one enantiomer produces a left handed helix, its mirror image produces a right handed one, as shown in Figure 5a. This is indicated by giving the pitch P a sign, which by convention is negative for a left-handed and positive for a right-handed helical superstructure. The pitch can be visualized in several different ways depending on the boundary conditions. For planar boundary conditions a so called Grandjean texture (Figure 5b) is observed with the helical axis perpendicular to the substrate, while for homeotropic boundary conditions (Figure 5c) an equidistant line pattern allows the determination of the pitch, as the former has a periodicity of P/2 [26].
2.1. Properties
The temperature dependence of the cholesteric pitch is such that the pitch decreases for increasing temperature. This, at first sight counterintuitive behavior, can descriptively be explained by a rotational analogue to thermal expansion. The molecules perform torsional vibrations in an anharmonic potential due to chirality. For increasing temperature the angle of these vibrations becomes larger, thus the pitch of the helix becomes shorter [27]. In reality, intermolecular interactions cause the anharmonic potential and thus the temperature dependence of the pitch. An example is depicted in Figure 5d for a N*-SmA* and a N*-SmC* transition. Approaching the smectic phase, the cholesteric pitch diverges, because its twist is incompatible with a layered structure.
Detailed pitch measurements as a function of temperature also allow the determination of critical exponents, which from prediction should be different for the transition into the SmA* and the SmC* phases. There has been a long standing debate about these exponents. Three main theoretical approaches have been presented: (i) de Gennes [28], predicting ν = 1/2 for N*-SmA* and ν = 3/4 for N*-SmC*; (ii) Chen and Lubensky [29] predicting ν = 1/2 for N*-SmA* and ν = 1 for N*-SmC*; and (iii) Chu and McMillan [30] predicting ν = 1/2 for N*-SmC*. Experimental evidence was controversial. For cholesteric phases with a wide temperature range and proposing a sensible temperature dependence of the pitch, which combines a natural pitch dependence in superposition with pretransitional effects, evidence for the Chen and Lubensky model has recently been provided with a critical exponent of ν = 1/2 for the cholesteric to smectic A* transition and ν = 1 for the cholesteric to smectic C* pitch divergence [31]. This specifically implies that fluctuations cannot be disregarded when describing these transitions.
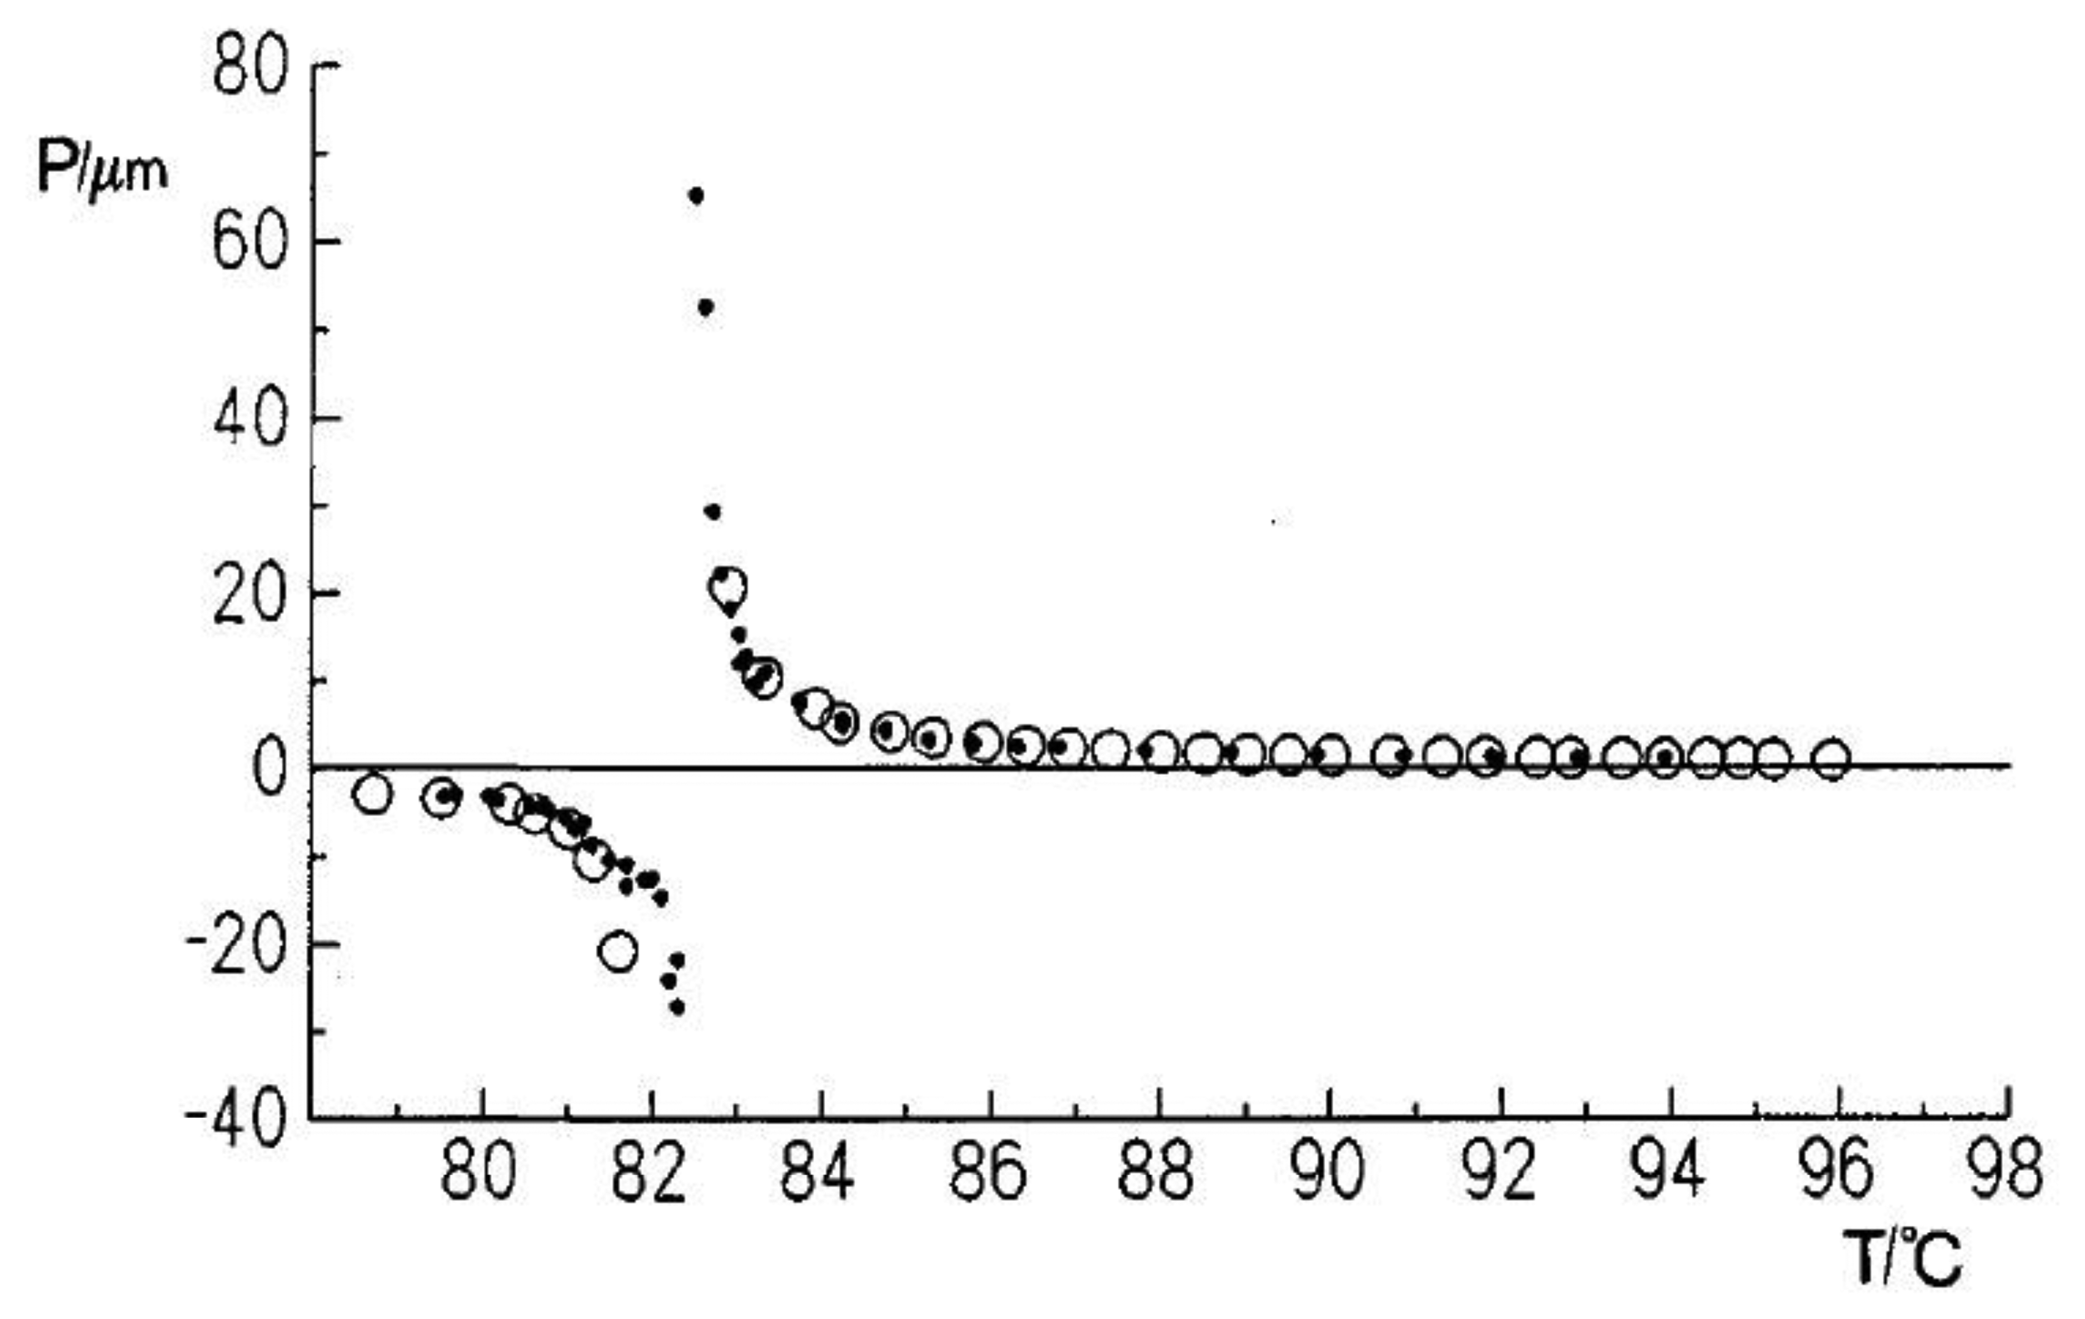
An interesting phenomena which is not too often observed is the so called cholesteric twist inversion [32–36]. While this is easily explained for mixtures of different components through a different temperature dependence of the pitch [37,38], it is much more surprising in a single component system. The helical superstructure changes its handedness simply by temperature variation, going through a nematic director configuration. An example is depicted in Figure 6. This at first seems to contradict the rules of Louis Pasteur. Nevertheless, it becomes apparent that all of these molecules incorporate at least two chiral elements, often chiral centers. It has been shown that the cholesteric twist inversion of single component systems can be explained by a superposition of the influences of each chiral center [39,40].
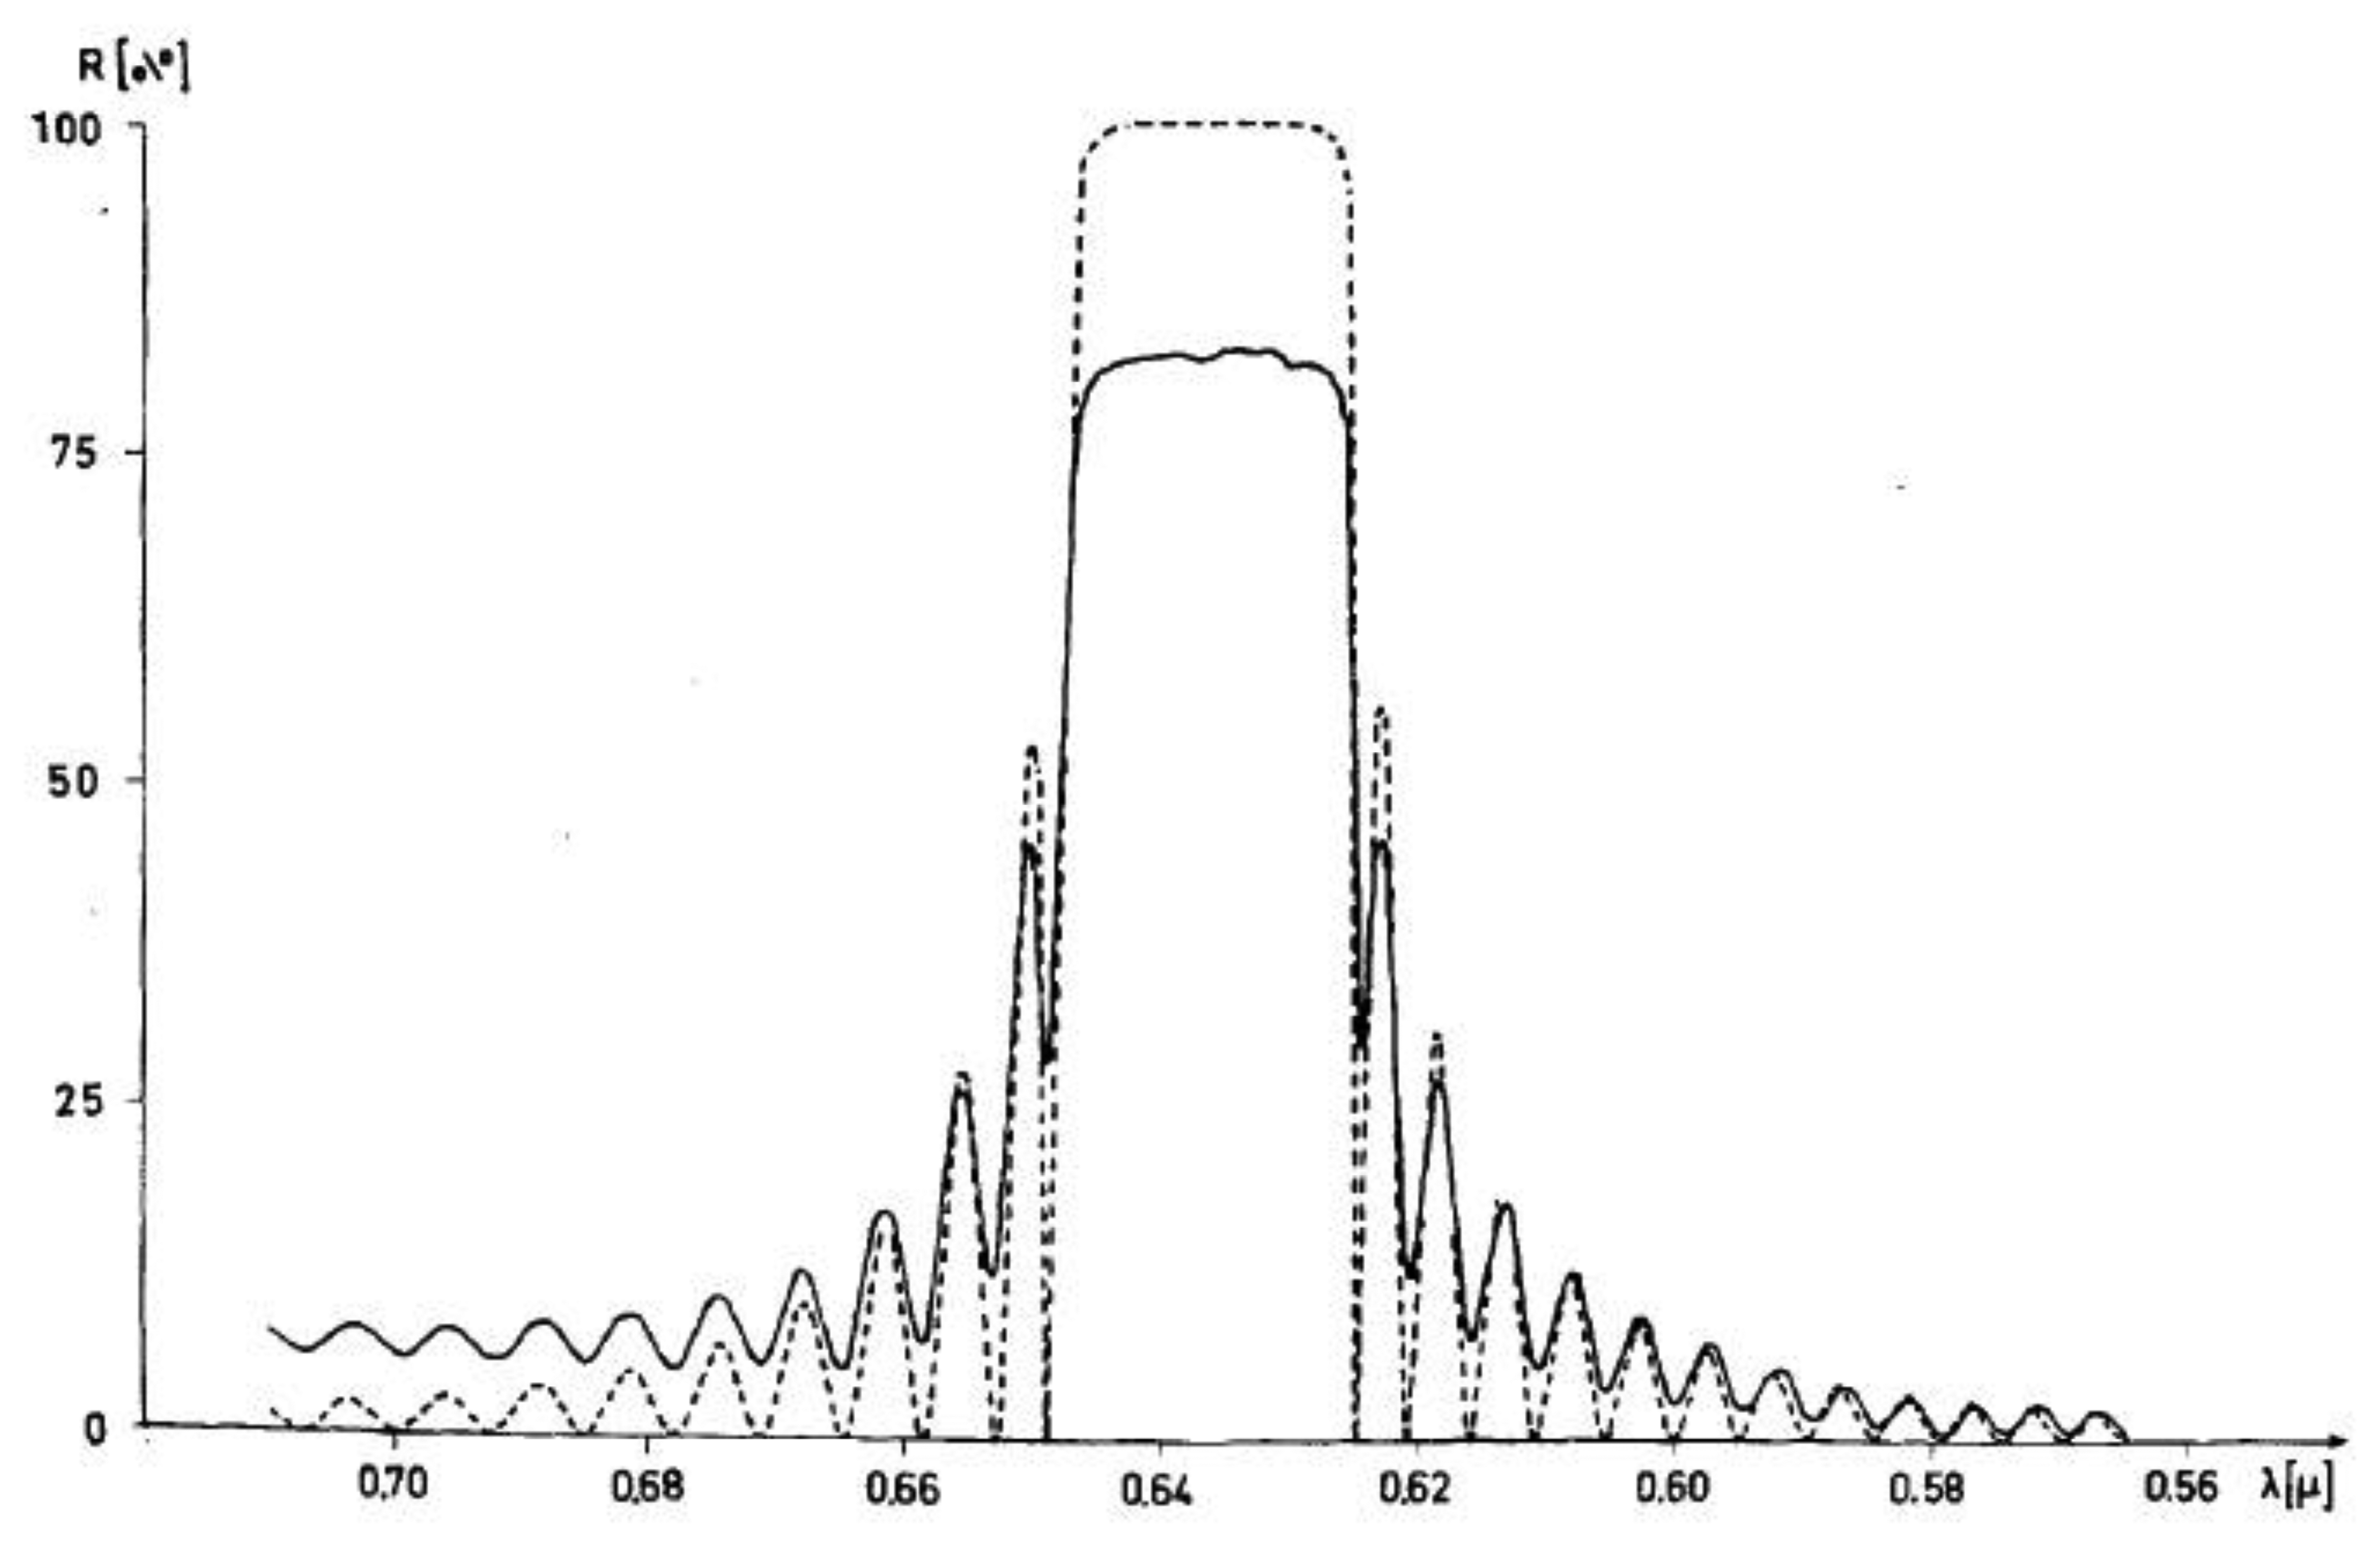
At last, of special interest are the optical properties of cholesteric phases. These are very similar to those already pointed out for Reusch's micar column and discussed in detail by de Vries [22]. Circular polarized light is reflected, which appears as beautiful color play when the pitch is smaller than about half a micrometer. The wavelength that is reflected is given by λ0 = <n>P where <n> is the average refractive index. The width of the reflection band is Δλ = ΔnP (see Figure 7). There is no simple and obvious relation between molecular handedness and that of the helical superstructure, (and thus the polarization of the selectively reflected light). Only, if one enantiomer forms a cholesteric that reflects a certain handedness, its mirror image will reflect the other circular polarization. First attempts to predict the helical handedness through knowledge of the molecular configuration are being made via combining experiments with theory and computer modeling, for example by the Ferrarini group ([41], and references therein). The optical effect of selective reflection occurs without the 180° phase shift originally observed for reflection off mirrors. It also does not change the handedness of the reflected light. The effect has been employed in several applications, such as temperature sensors in medical procedures [42,43], thermometers for wine and chilled beer, in the non-destructive detection of faults in solar cells [44] and other electronic components, all the way to the use in the fashion industry. But also nature has developed self-assembled structures with cholesteric properties, which will be discussed below.
2.2. Selective Reflection of Beetles
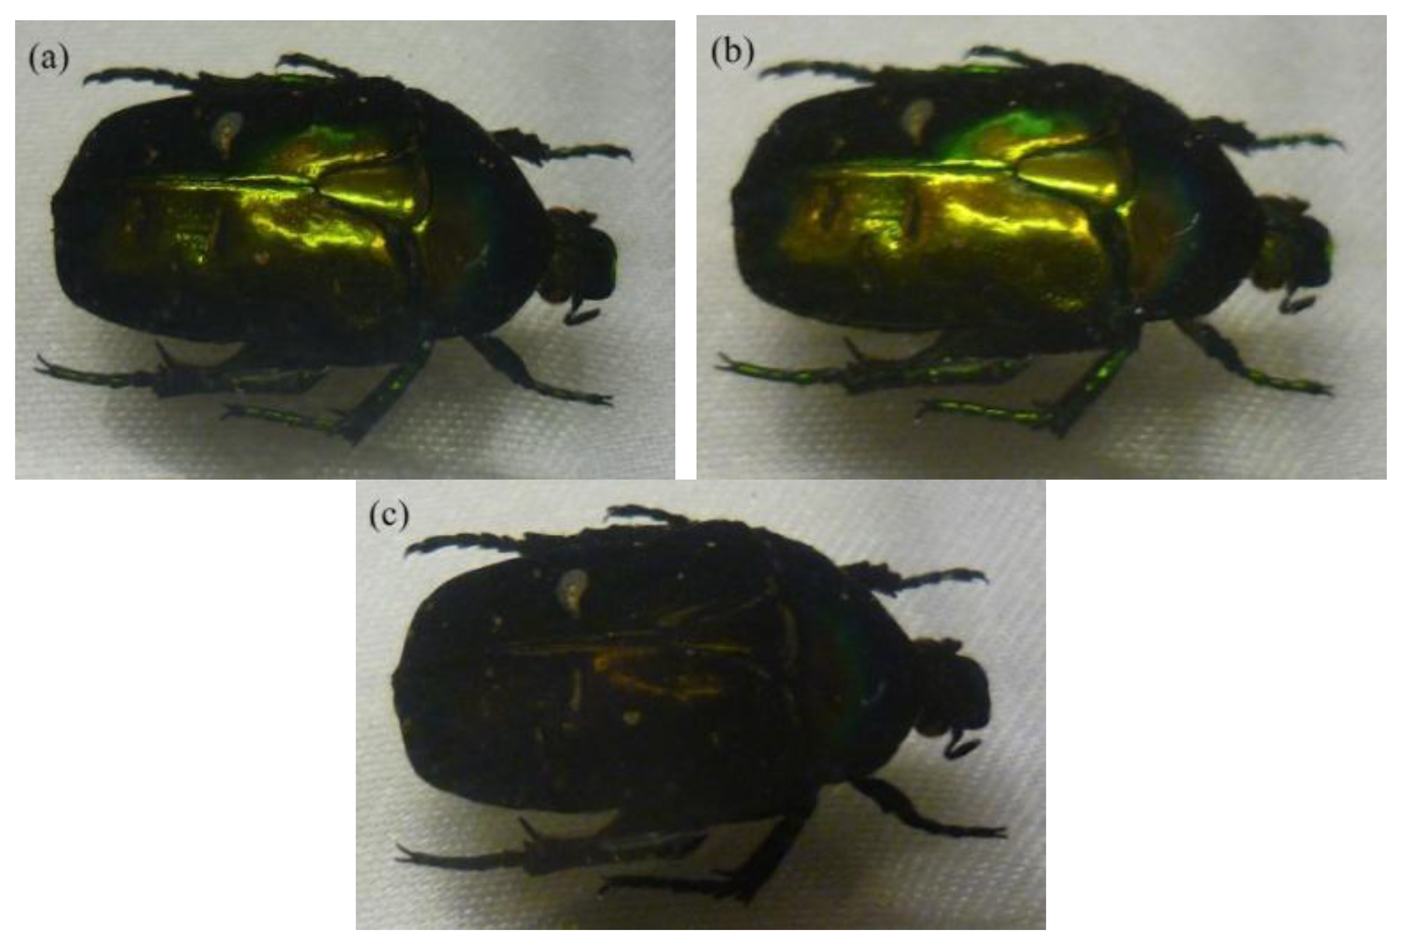
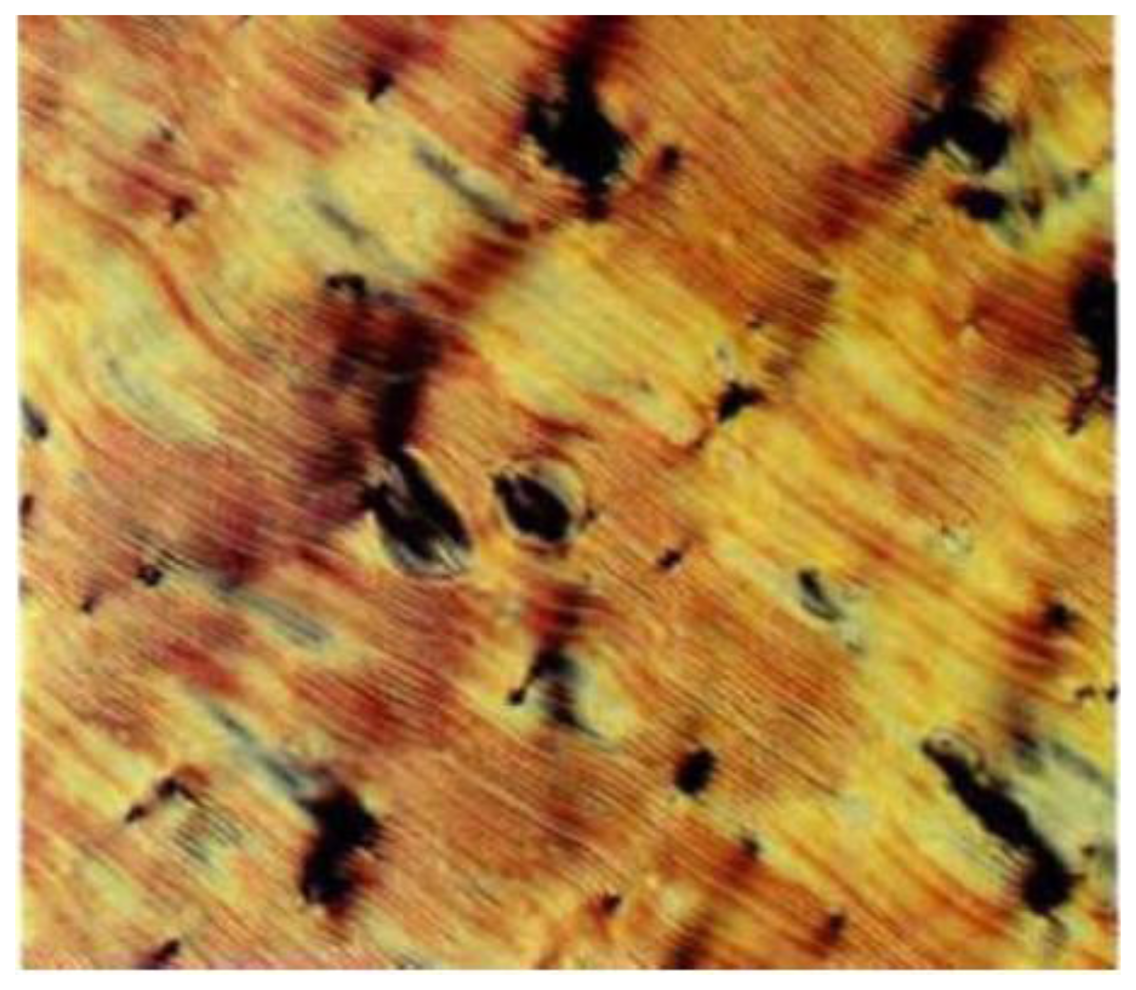
The iridescent colors of some species of beetles can be related to a macroscopic helical superstructure, much similar to that observed in cholesteric liquid crystals. The study of such beetles goes back to the work of Michelson more than a century ago [46], but novel effects are still being discovered [47]. The reflected color is generated in the elyra which contains chitin fibers in a protein layer, which change their orientation as to resemble a cholesteric liquid crystal. An example of a selectively reflecting beetle is depicted in Figure 8, viewed through a left- and a right-handed polarizer. In one case the iridescent color of the beetle is maintained, as it reflects circular polarized light of the same handedness, while in the other case the reflected light is absorbed and the beetle appears black.
2.3. Lyotropic Cellulose Materials
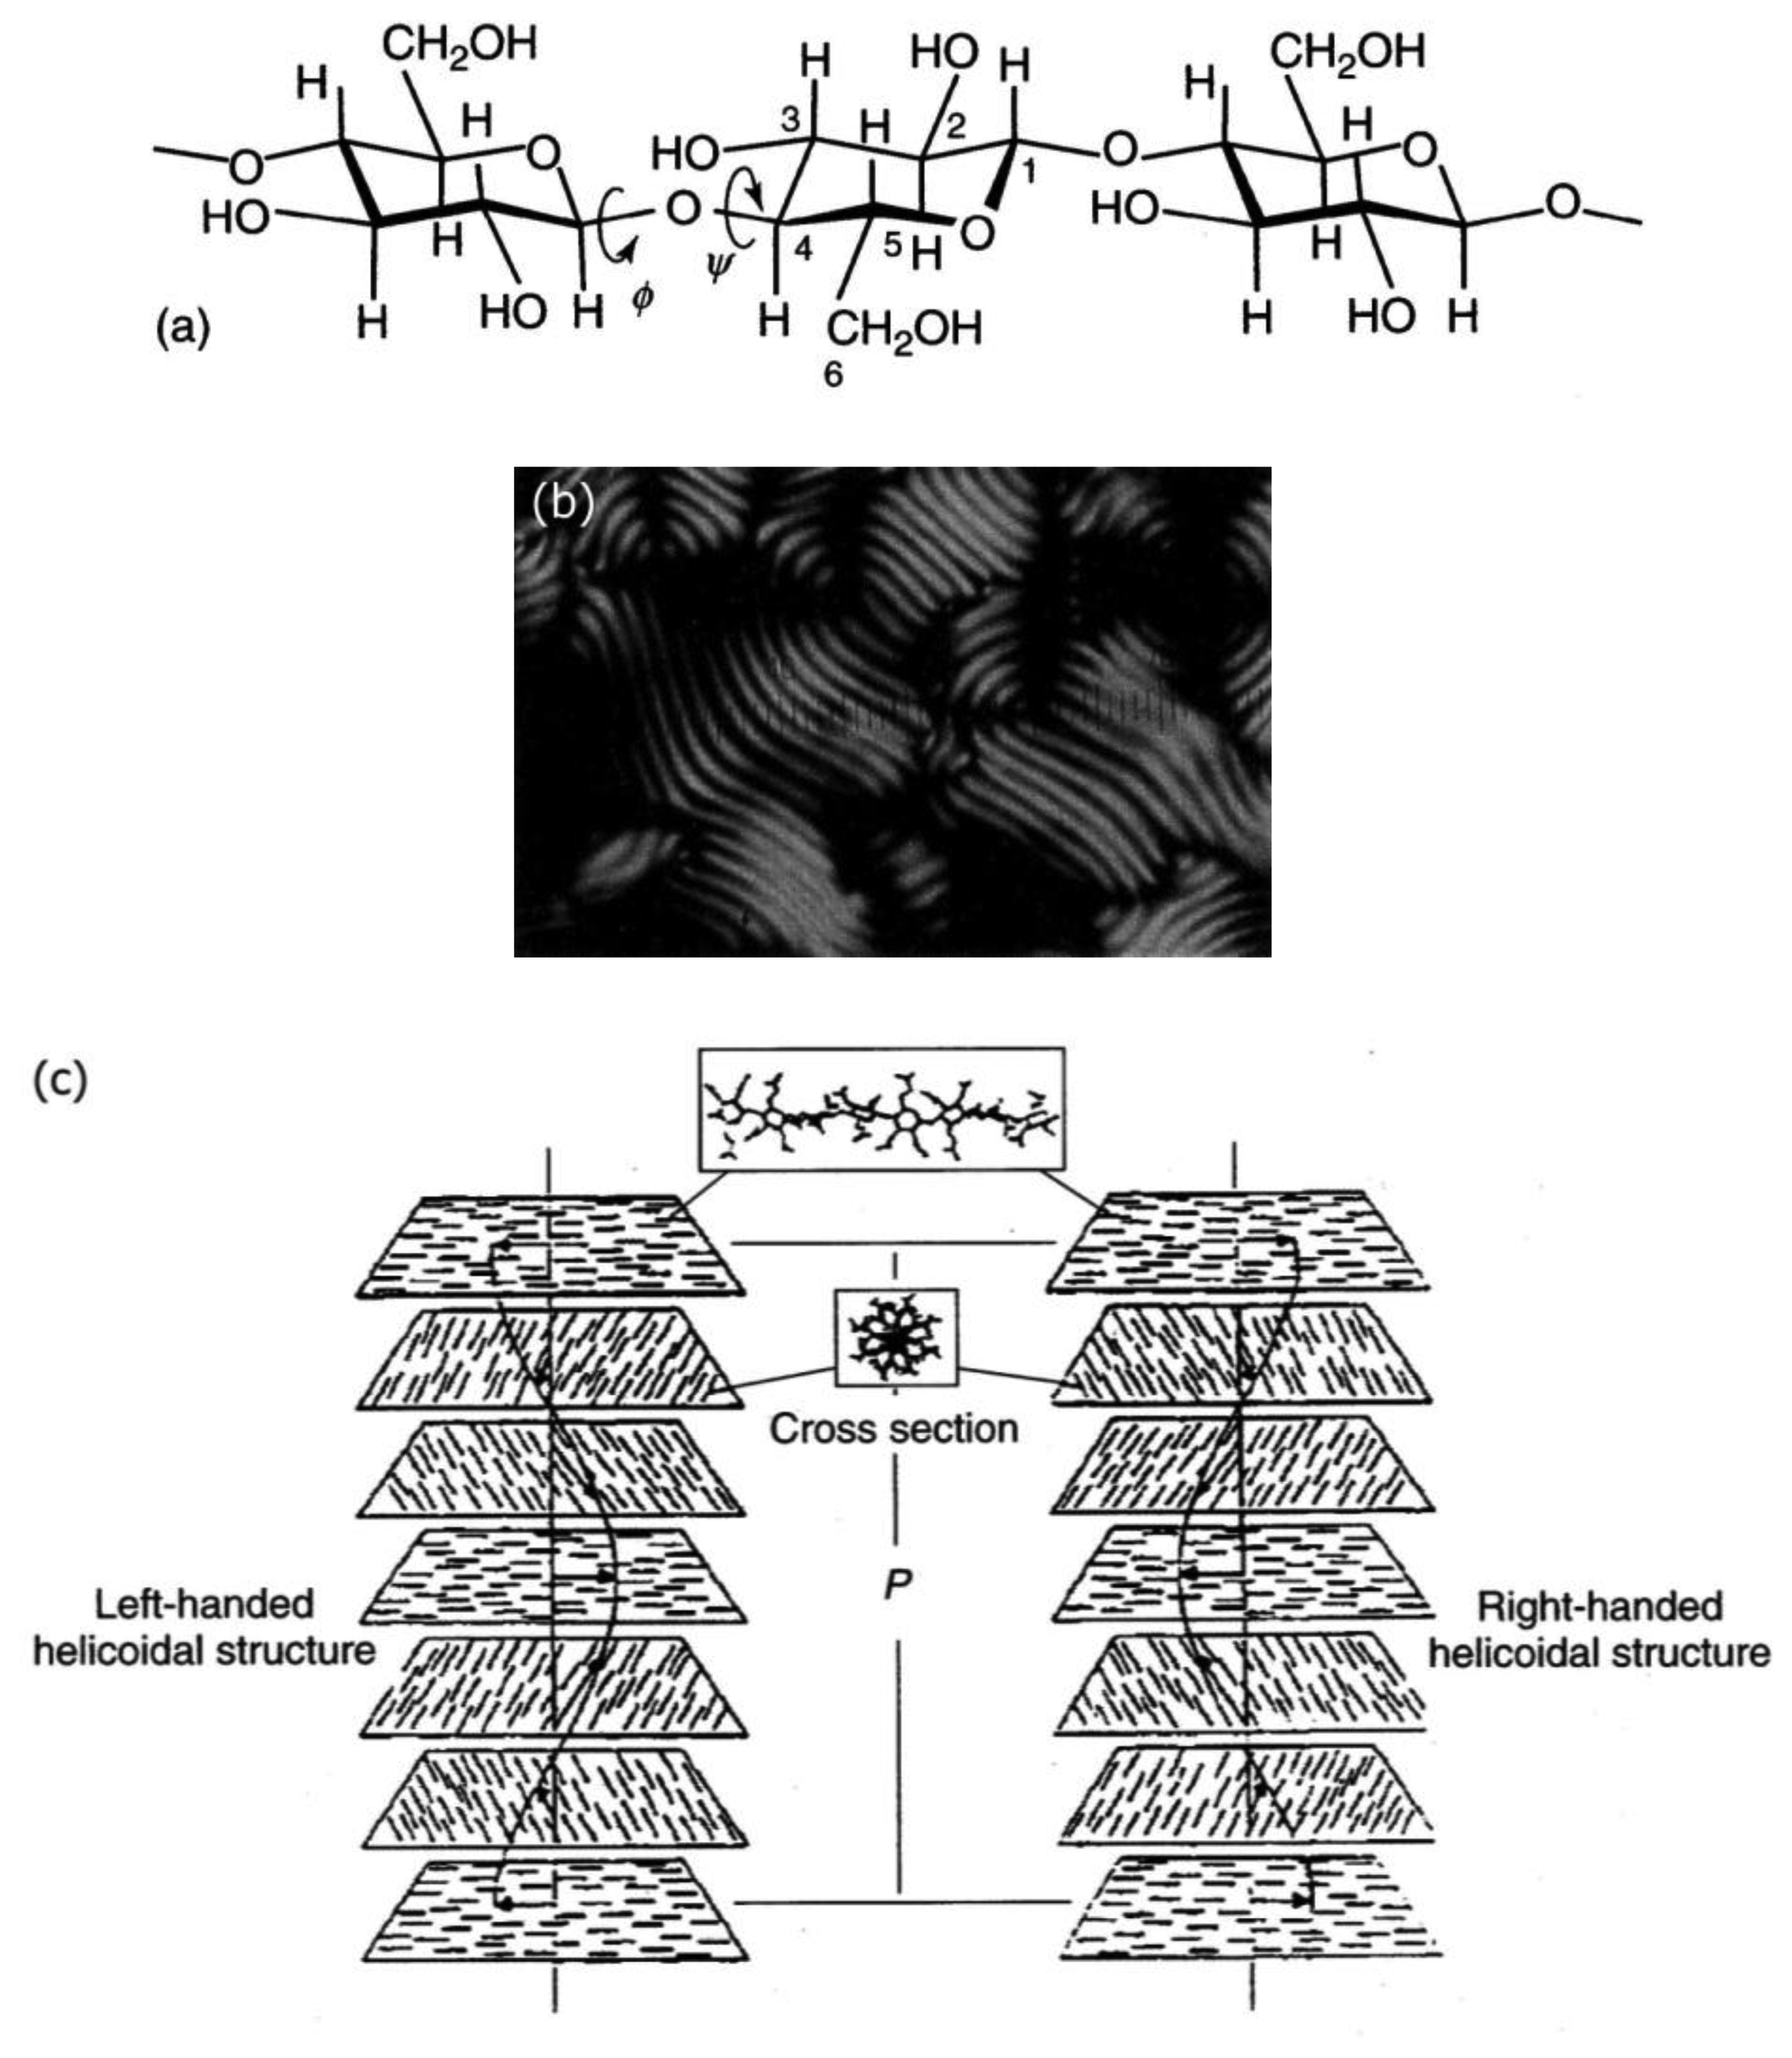
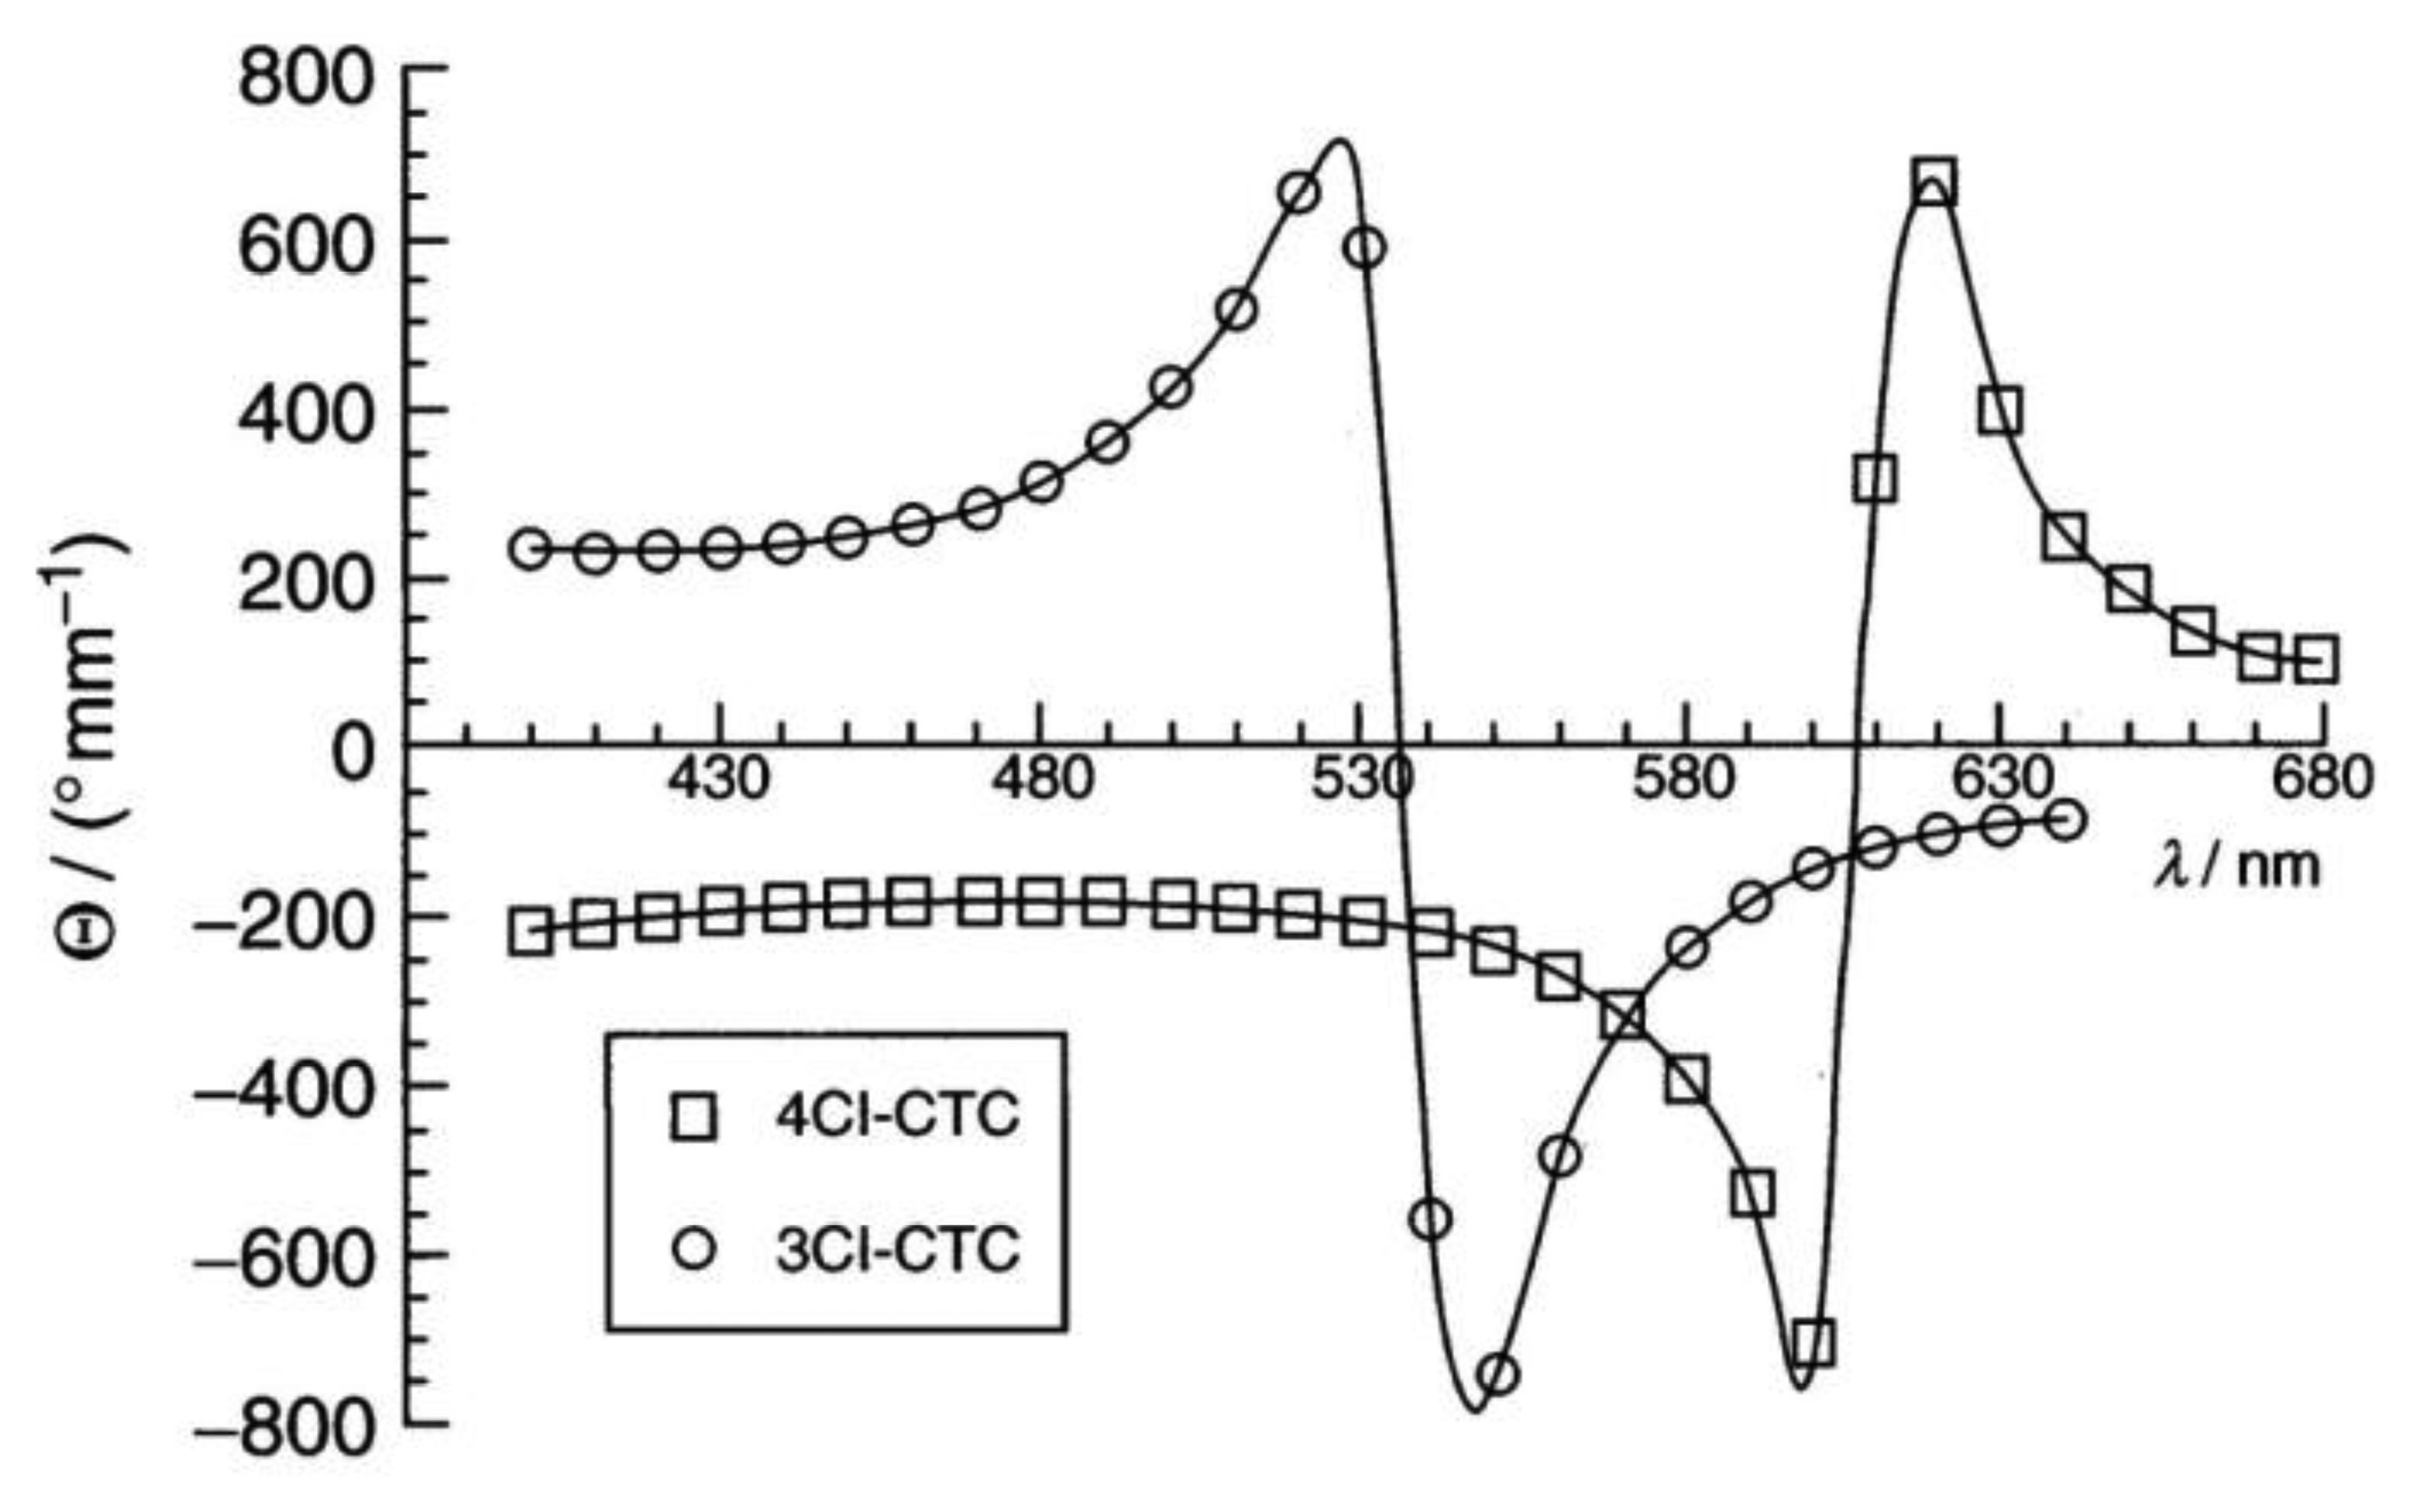
Cellulose [48] and its derivatives are chiral polysaccarides which are found largely in nature and are used as applications for example in construction materials or additives in food products. While they also show other liquid crystals, they most often exhibit lyotropic cholesteric phases (Figure 9a). The cholesteric structure and helicity of the phase can easily be seen via fingerprint textures with an equidistant line pattern (Figure 9b). In cellulose the individual polymer molecules are chiral on the molecular scale and form helical polymers on the larger, supermolecular scale. In solution, these supermolecular structures act like a large chiral calamitic molecule and form the cholesteric phase where the long axis of the supermolecular structure changes continuously in direction, perpendicular to the long axis. Thus, a cholesteric helix is formed (Figure 9c). For single component thermotropic cholesteric systems the temperature dependence and helical pitch are mostly straight forward. The pitch of molecules with opposite configuration exhibits opposite handedness. It most often decreases with increasing temperature and only very few examples are known with the opposite temperature dependence. For thermotropic mixtures the situation already becomes more complicated, as the helicity may change handedness when the concentration is varied. This demonstrates the effects of an interplay between molecular chirality and thermodynamics. For cellulose the situation becomes yet another step more complicated, as outlined above, and it follows that the temperature dependence and the pitch handedness is extremely complicated. For example the cholesteric pitch of the same cellulose molecule may have opposite handedness just by using a different achiral solvent. Or, the handedness is inverted by slightly increasing the length of the monomer, as depicted in Figure 10 by measurements of the optical rotation dispersion (ORD).
2.4. Cholesteric Phases of DNA
Together with proteins and carbohydrates, DNA (Deoxyribonucleic acid) and RNA (Ribonucleic acid) are extended biopolymers which are of uttermost importance for living organisms and most viruses. DNA comprises a double-stranded helix made of nucleotides composed of a nucleobase, a sugar and a phosphate. The substitution pattern of sugars and phosphates make the backbone. For increasing concentration DNA exhibits a liquid crystalline phase [49,50] which is most likely very similar to the Blue Phase (see below). For even higher concentration the cholesteric phase and other liquid crystal phases are observed. The chirality to induce this symmetry breaking stems from the helicity of the DNA double-helix and its handedness. For example, the DNA of the bacteria Escherichia coli exhibits anisotropic properties and a polarizing microscopic texture which show that of a cholesteric liquid crystalline phase. Also helical polypeptides like poly(γ-benzyl-L-glutamate), collagen and chitin show cholesteric liquid crystal phases in aqueous solution, depicted in Figure 11, exhibiting the cholesteric equidistant line pattern due to the helicity of the phase.
There is an interesting case of supermolecular chirality, the tobacco mosaic virus (TMV). TMV is a rod-like, single-stranded RNA virus where the RNA has a right handed twist. It shows a nematic liquid crystal phase at high aqueous concentrations. During the formation of the nematic phase, tactoids are observed with an achiral, i.e., mirror symmetric director field. This means that despite the chirality, the liquid crystal phase is nonchiral. The tactoid is mirror symmetric, because the helical pitch of the cholesteric phase is much larger than the size of the tactoid [51].
3. Chirality Induced Novel Phases
There exist several liquid crystal phases which only occur for molecules with a broken mirror symmetry. These are the so called “frustrated” phases, namely the Blue Phases and the Twist Grain Boundary phases. They result from a competition between chirality, which mainly implies the formation of helical superstructures, and thermodynamics, which favors the low temperature phase with a higher order, thus less symmetry. A consequence of this frustration is the normally very narrow temperature range of BP and TGB phases.
3.1. Blue Phases
Blue Phases [24,52,53] occur just at the transition between the isotropic liquid and the liquid crystal. They are only observed for “highly” chiral materials, i.e., for materials with cholesteric pitches below about one micrometer. For decreasing enantiomeric excess, the Blue Phases disappear. They were discovered in 1973 by Coates and Gray [54], but indeed very early reports go back all the way to the work of Friedrich Reinitzer [55] in 1888, the discoverer of the liquid crystalline state. In his work he shortly and qualitatively describes a color play phenomena which can only be attributed to the observation of the Blue Phase in cholesteryl benzoate. In fact, a large number of cholesteryl derived compounds do show the Blue Phase.
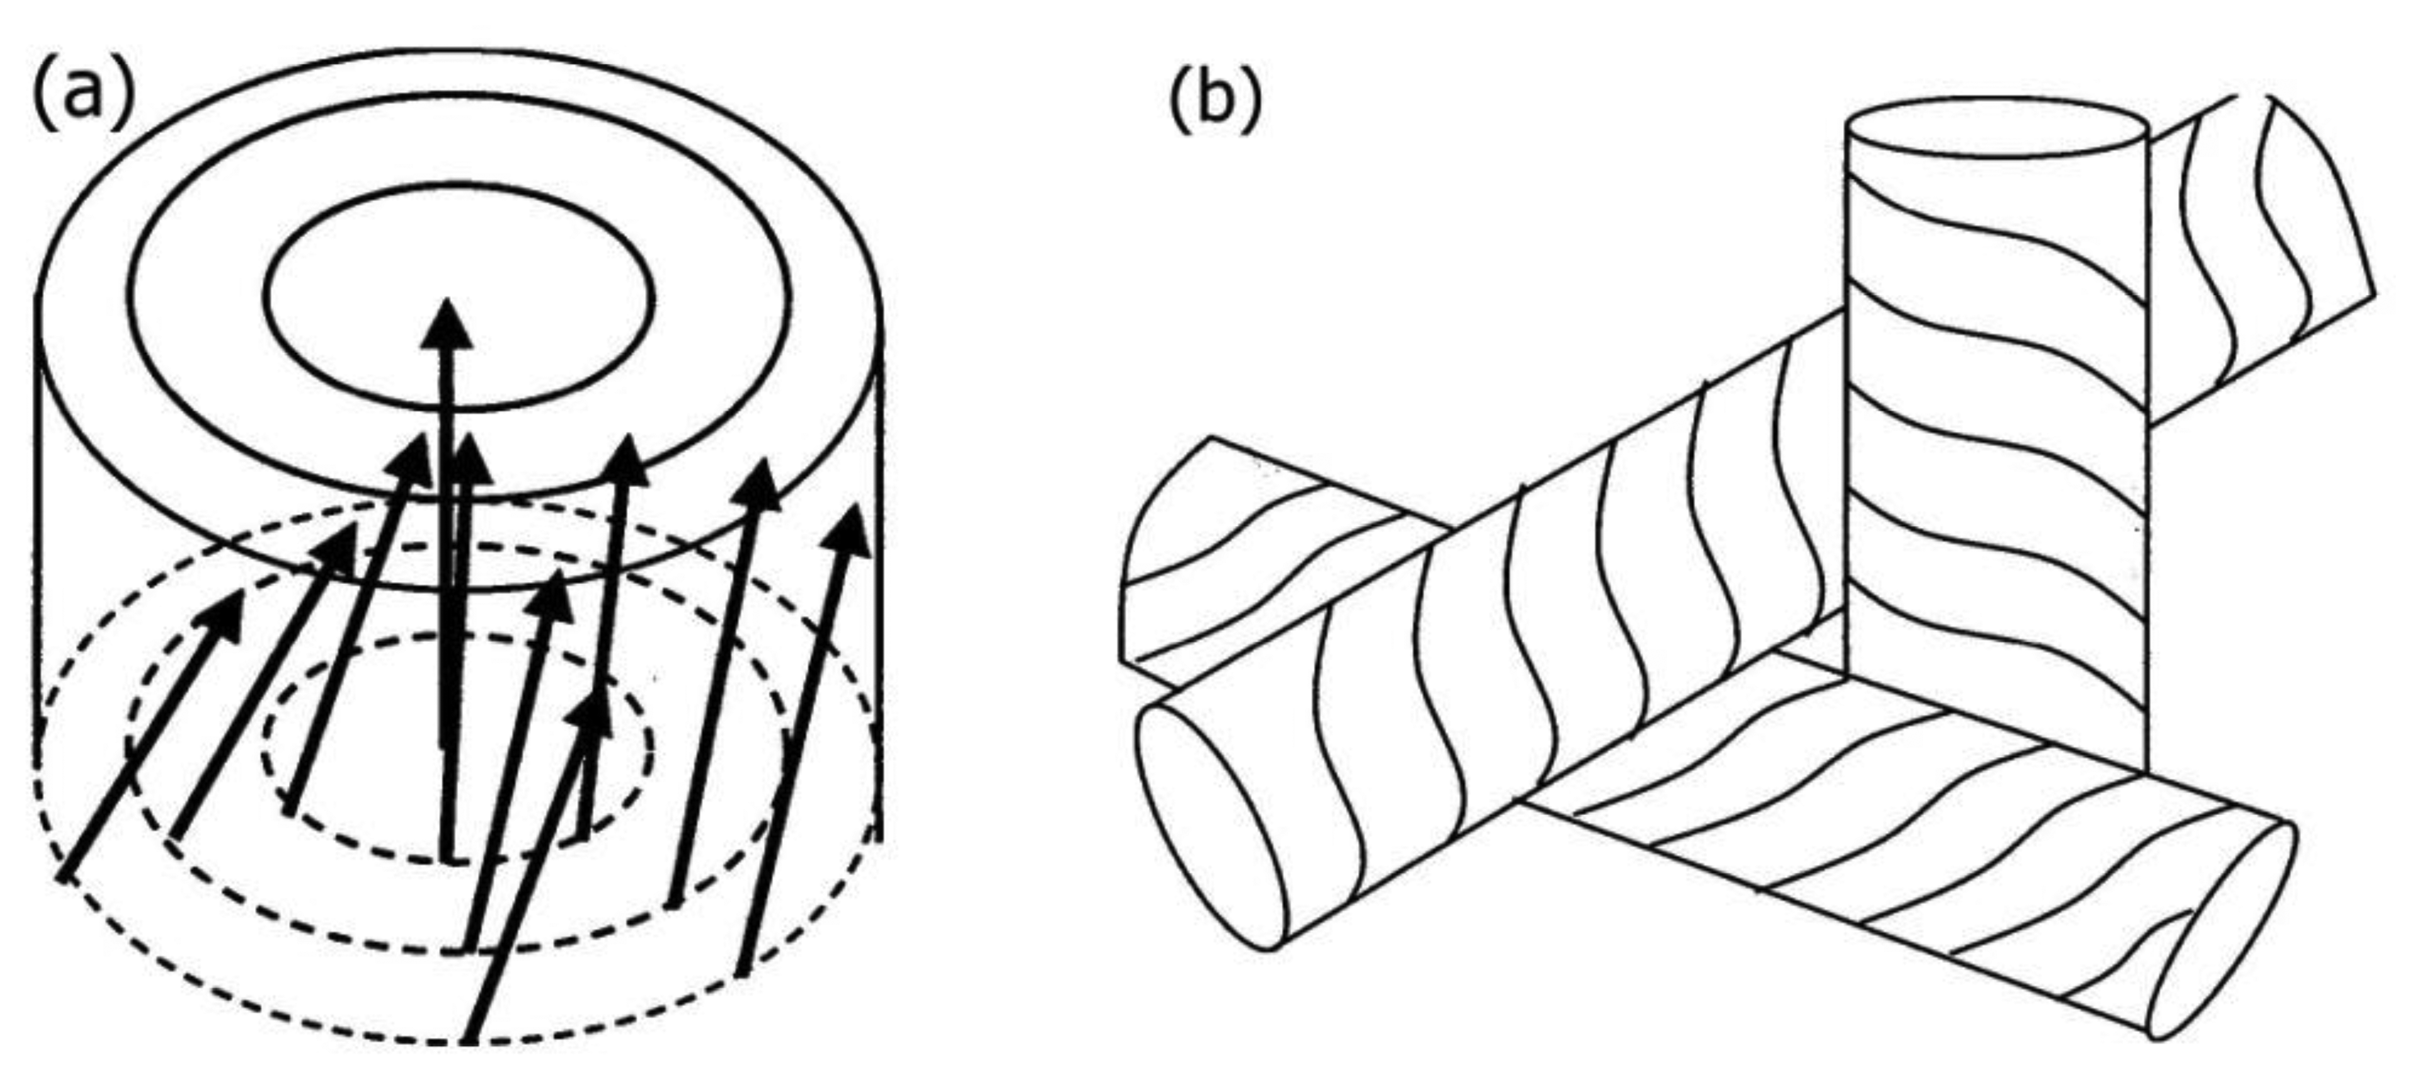
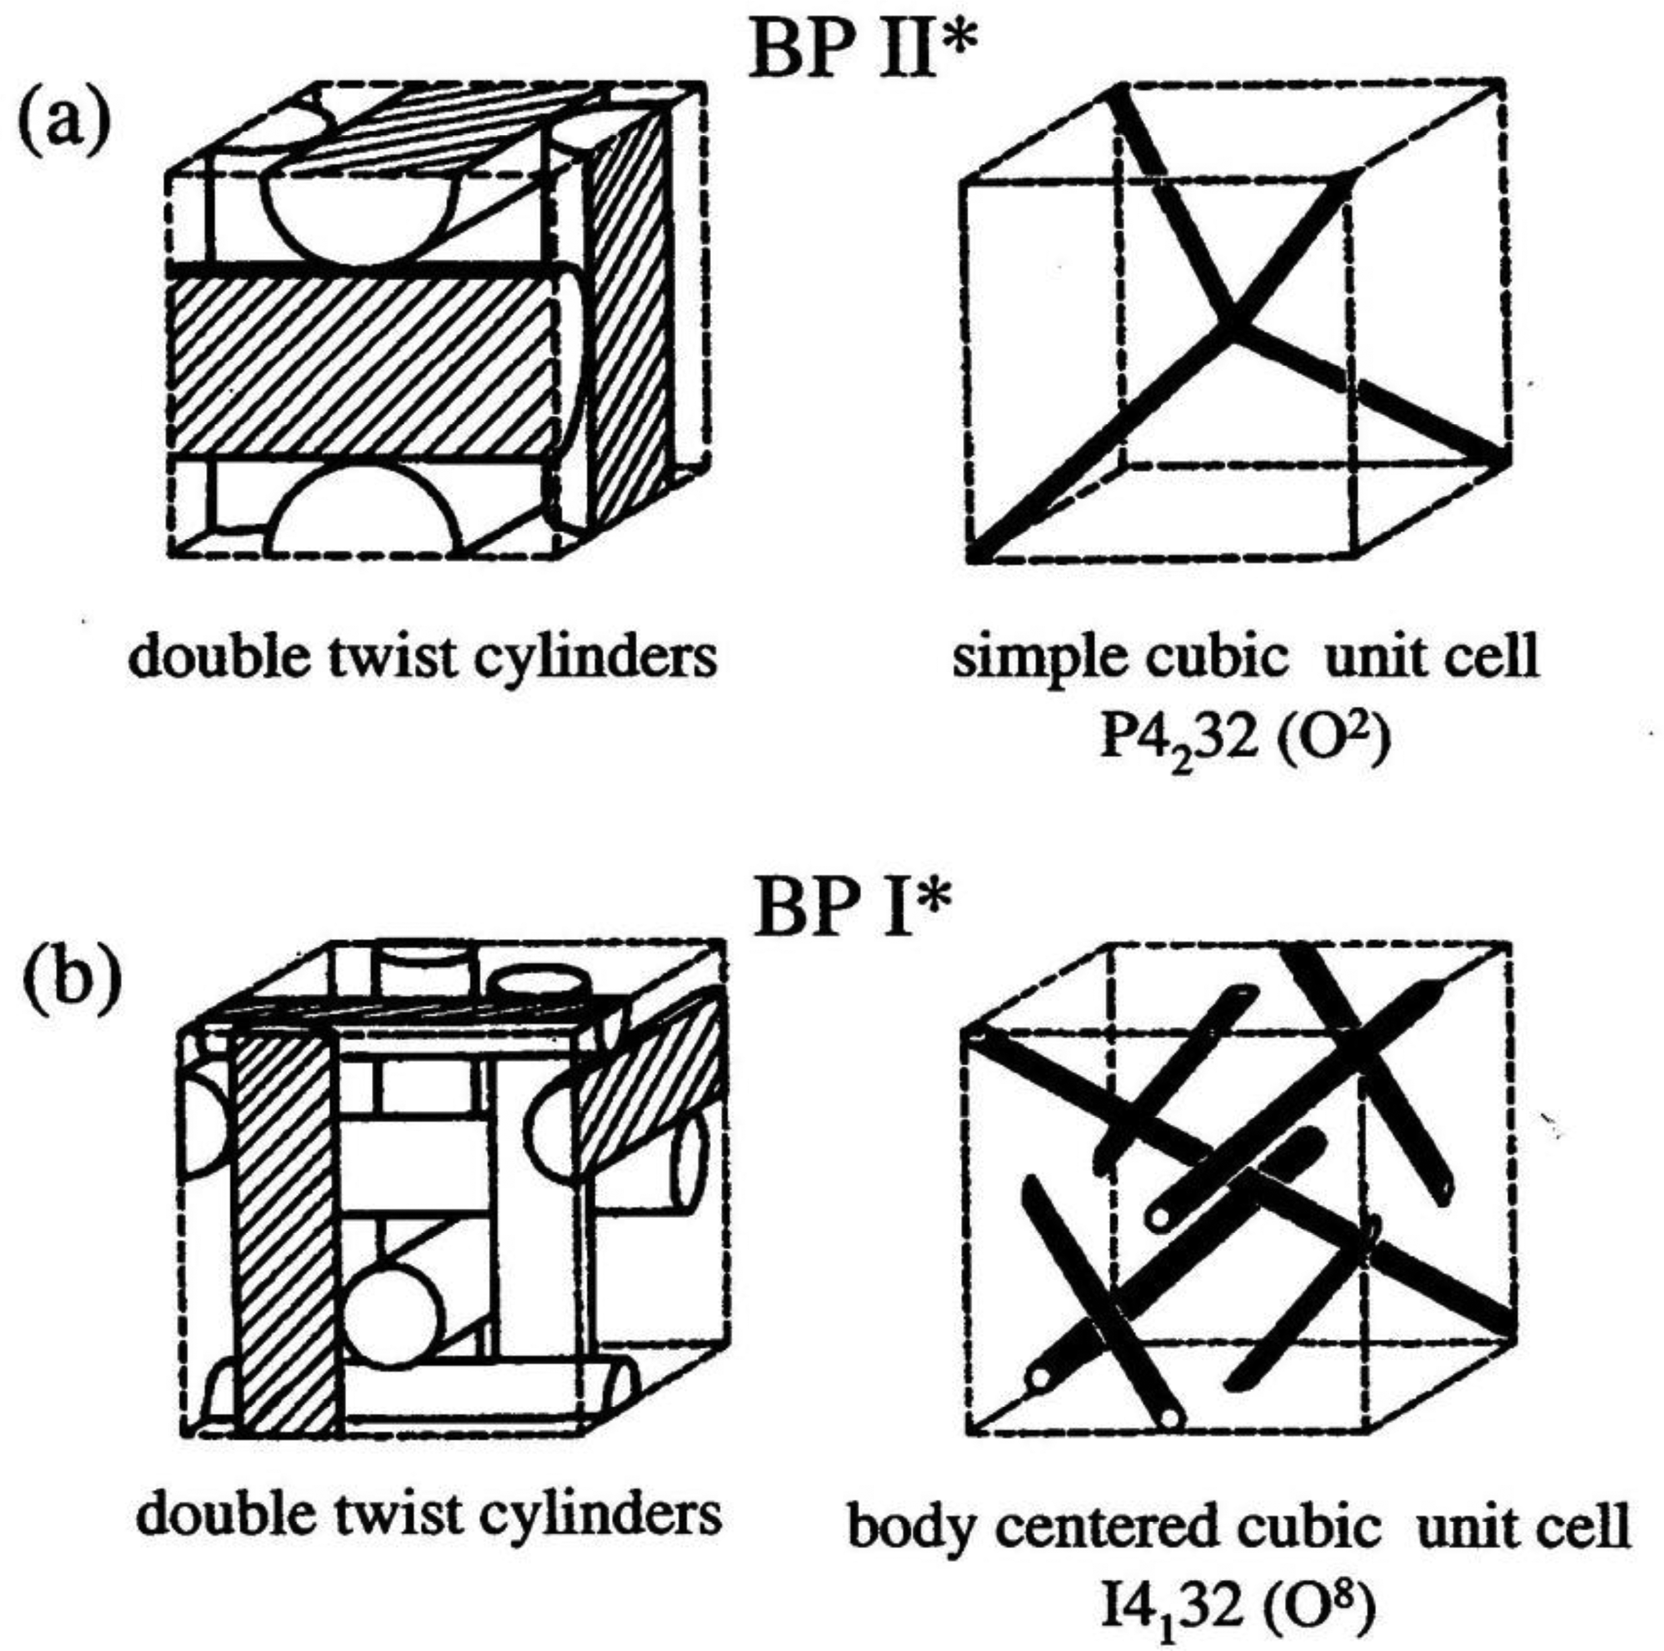
Three different types of Blue Phases (not counting smectic Blue Phases, which are still somewhat enigmatic) are known, designated as BPI, BPII and BPIII. The Blue Phases are cubic phases with a lattice of regular defects. At the highest temperature the BPIII is observed, which is an amorphous phase with a local cubic defect structure of short correlation length. The phase is normally quite hard to detect via optical microscopy, which also gave it its name “fog phase” or “Blue fog”. It reflects circular polarized light, which indicates a photonic structure with a helical superstructure where the reflection band is relatively broad when compared to the other Blue Phases or the cholesteric phase. The structural elements that comprise BPI and BPII are double twist cylinders as depicted in Figure 12a, where the director spirals around any radius of the cylinder. On a macroscopic scale three of the double twist cylinders arrange mutually perpendicular to each other. Such a structure cannot fill three-dimensional space without the introduction of defects (Figure 12b). It is found that BPII has a unit cell of lattice defects which is simple cubic (Figure 13a) and of the space group P4232. BPI at lower temperatures is body centered cubic (Figure 13b) with space group I4132. This can for example be inferred from Kossel diagrams in combination with other experimental techniques, and lattice parameters in the order of several hundred nanometers are observed [56] (Figure 13).
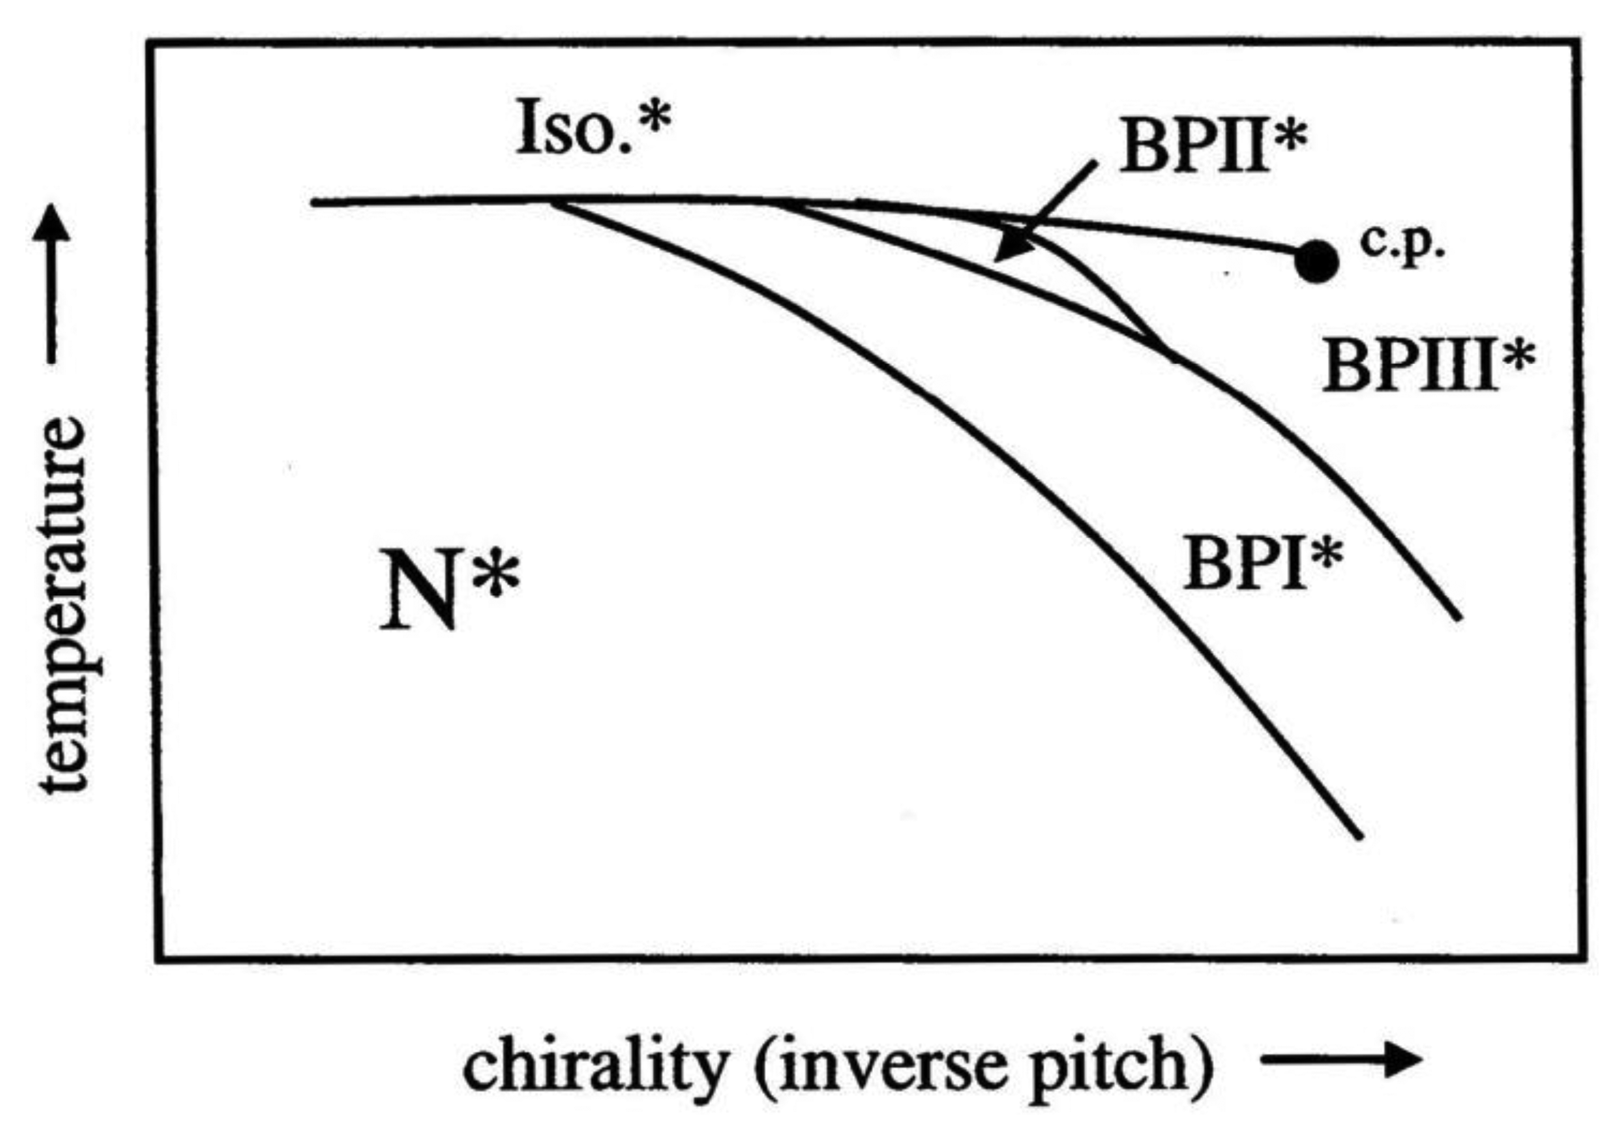
Being of cubic symmetry, the Blue Phases are optically isotropic, while the colors observed in polarizing microscopy are due to the orientations of the systems of double twist cylinders and the different defect lattice planes observed. The temperature-chirality diagram for the Blue Phases is depicted in Figure 14 in the vicinity of the isotropic to liquid crystal transition. The stability of BPI increases for increasing chirality. BPII is observed for intermediate chirality, while BPIII is located at the high chirality end of the diagram. The stability of the latter also increases until it terminates in a critical point.
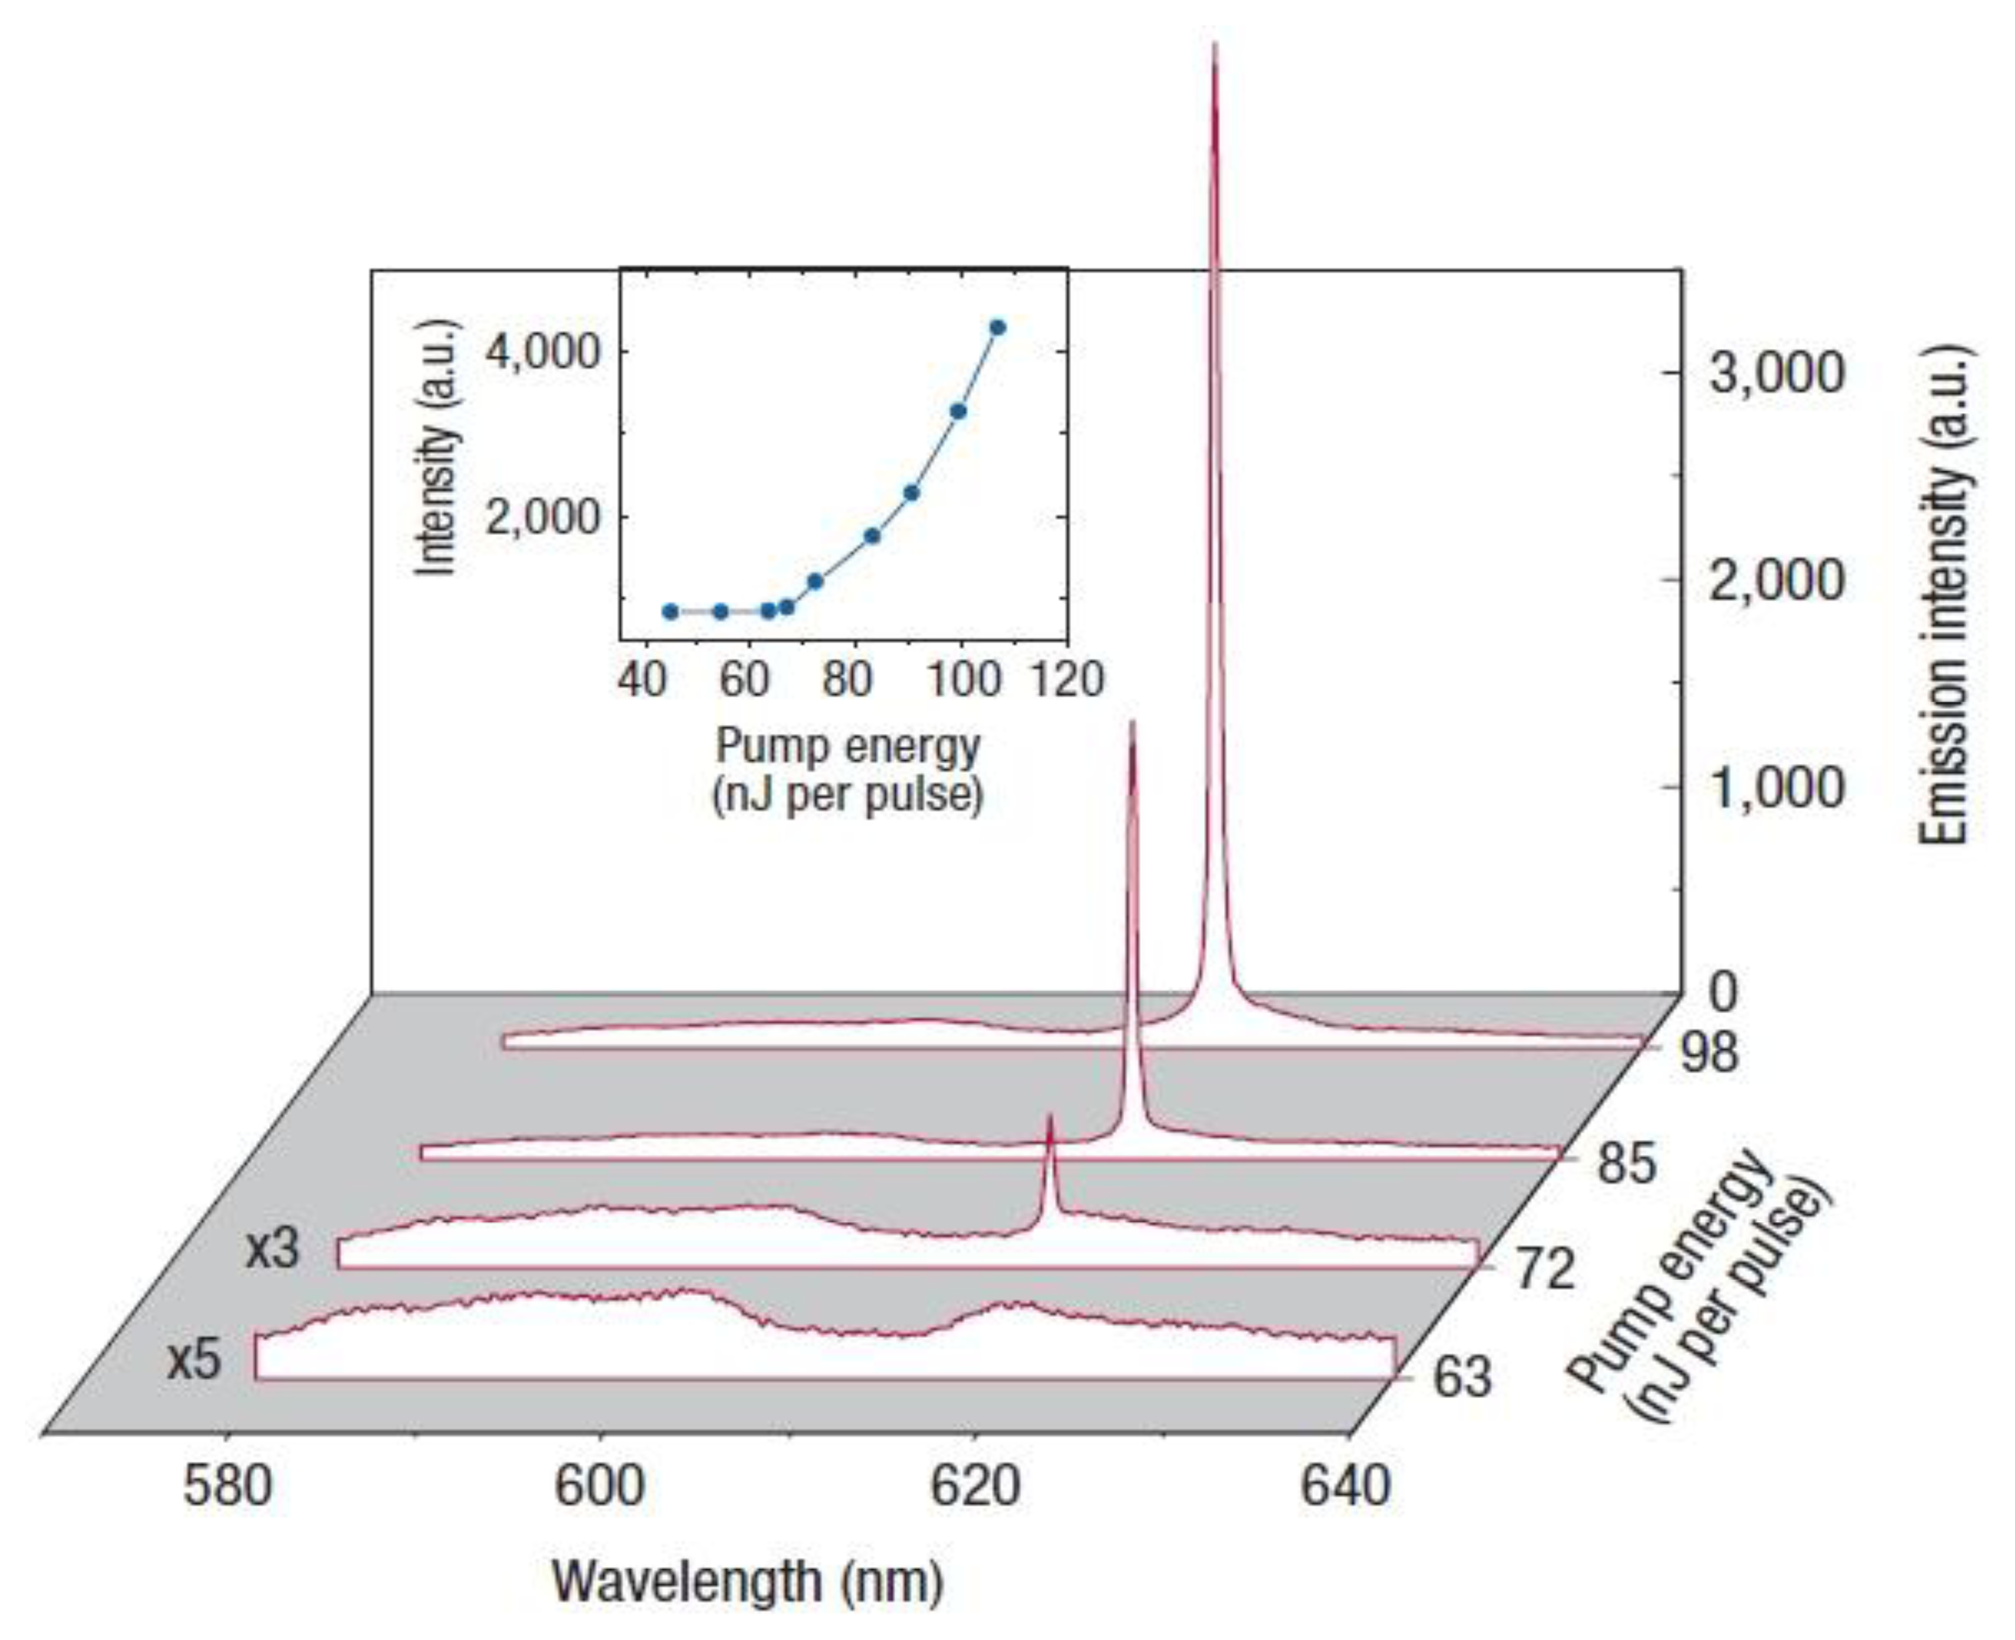
The Blue Phases are not only of fundamental importance, but also of interest from an applicational point of view. One example is the capability of lasing. Lasing has been demonstrated for cholesteric [57,58] and helical smectic C* phases [59], which can be regarded as a one-dimensional photonic bandgap material. The Blue Phases, with their three-dimensional defect structure offer the possibility of observing lasing in a self-assembled three-dimensional photonic liquid crystalline material. The first observation of lasing in a BPII phase was reported by Cao et al. [60] and is shown in Figure 15. A sharp peak can be seen at the low energy edge of the bandgap. A lasing threshold is observed, and the emitted intensity increases strongly with increasing pump energy, thereafter.
Recently, a new display mode has been proposed [61], which surprisingly employs the Blue Phase. While most displays use the nematic phase in one way or another, and some niche applications are based on ferroelectric liquid crystals, this new display mode utilizes the Kerr effect appearing in a polymer stabilized BP. The disadvantage of the small BP existence range needs to be overcome, which may be done by the design of new materials [62,63]. The advantages are then quite dominant, especially in the production process of displays, as the step of applying an alignment layer, and subsequent rubbing can be omitted. This implies less dust produced at display lines, which is responsible for much of the deficient panels produced. Also the switching speed is improved, which readily provides video rate displays that can be driven at higher frequencies, thus improving the quality of vision.
3.2. Twist Grain Boundary Phases
Twist Grain Boundary (TGB) phases [25] are located between the cholesteric and the fluid smectic phases. They occur through a competition between chirality (helicity) and the fact that twist distortions are not allowed in layered phases. TGB phases are therefore also frustrated phases. The smectic phase breaks up into blocks which are separated by a boundary comprised of an array of screw dislocations. The Twist Grain Boundary phases were first theoretically predicted in 1988 by Renn and Lubensky [64,65] by extending the de Gennes analogy between liquid crystals and superconductors [66] to chiral systems. Already one year later, the TGB phases were observed experimentally [67,68]. In the above mentioned analogy, the Twist Grain Boundary phase is the equivalent of the Abrikosov flux lattice phase of a type II superconductor. In the smectic A phase the twist penetrates the structure by a lattice of screw dislocations, like the magnetic flux lines penetrate the superconductor by a lattice of vortices. The nematic phase corresponds to a metal, while the smectic A phase represents the Meissner phase of the superconductor. In the chiral case, the cholesteric phase represents the normal metal in a magnetic field, and the Twist Grain Boundary phase that of the Abrikosov phase. The analogy can formally be carried further by regarding the liquid crystal twist as the magnetic induction, the twist penetration depth as the London penetration depth, chirality as the magnetic field, the elastic energy as the magnetic energy and the screw dislocation as a magnetic vortex.
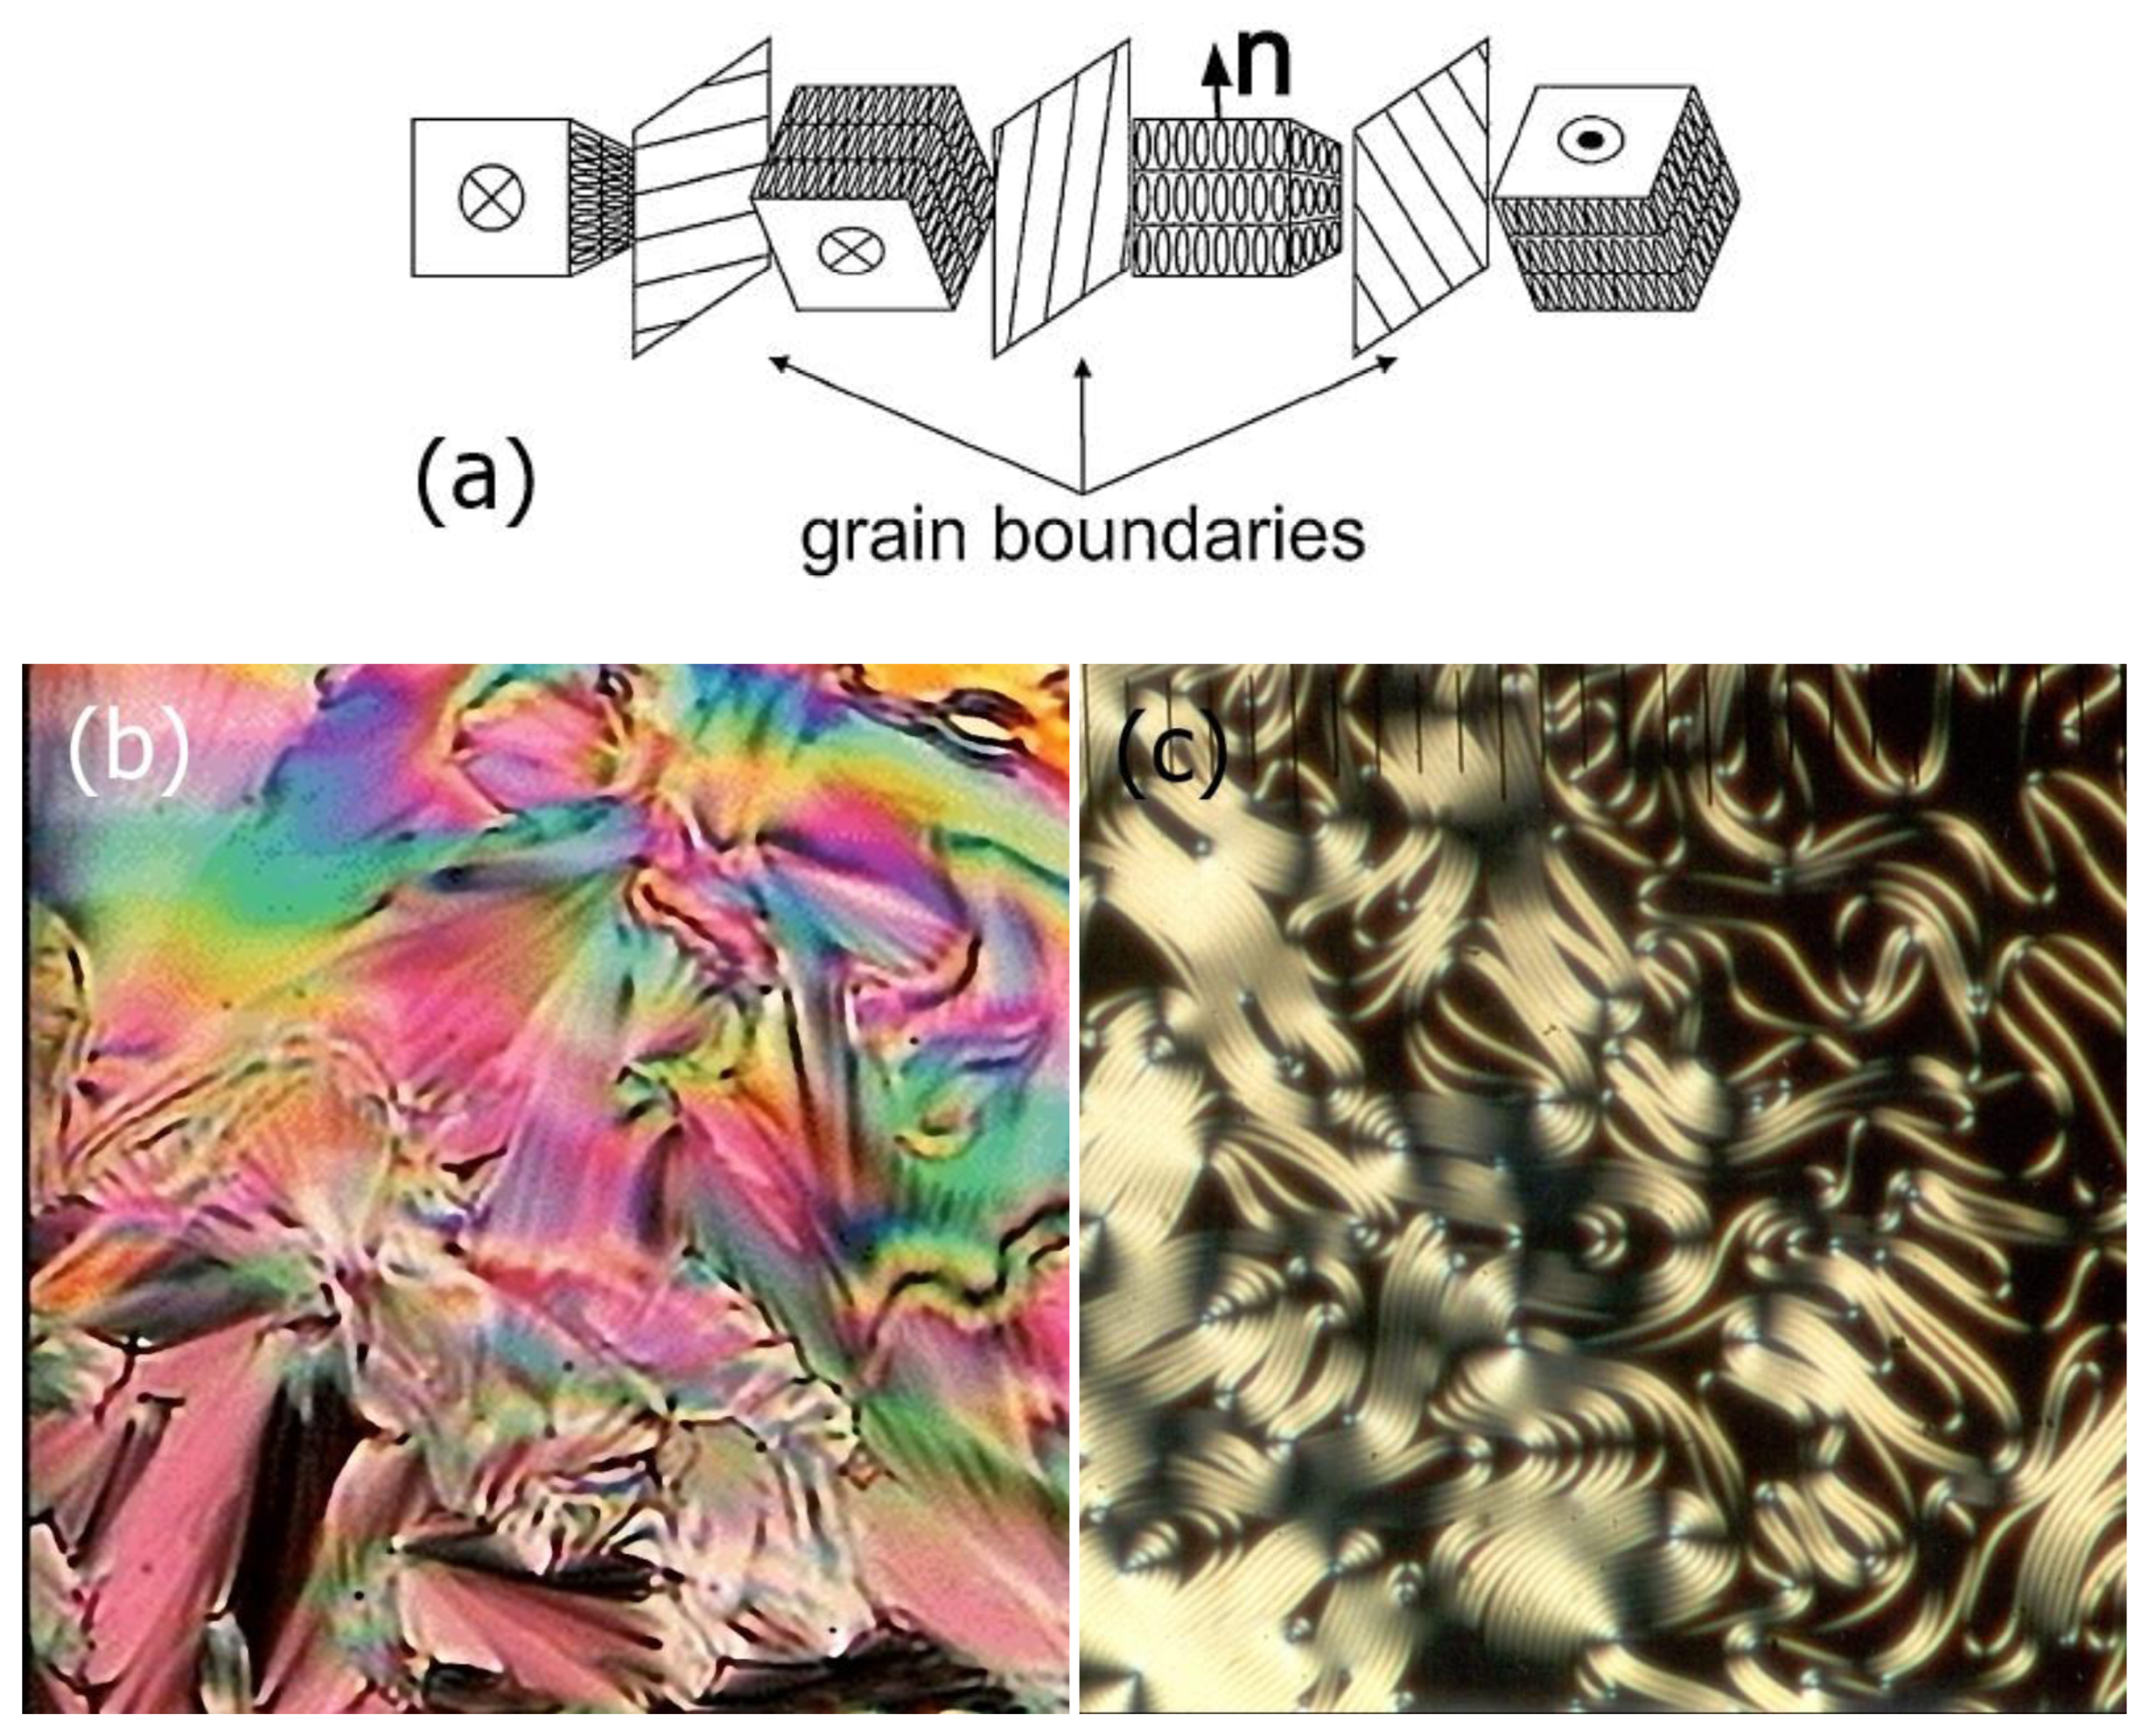
The structure of the TGB phase is comprised of fluid smectic layers (smectic A or smectic C), broken up into slabs of a width in the order of lb ∼100 nm. The grains are mediated by a regular lattice of screw dislocations with a distance on the order of ld ∼10 nm between them [69]. With a molecular length of about 3–4 nm, this leads to a pitch in the order of a few micrometers. A schematic representation of the TGB structure is depicted in Figure 16a. The helical axis is oriented perpendicular to the local molecular director, just as observed for the cholesteric phase. This is the reason why Twist Grain Boundary phases appear quite similar to chiral nematic phases when viewed in a polarizing microscope between two crossed polarizers. The texture under planar boundary conditions exhibits a Grandjean-like appearance with pitch steps in a temperature gradient (Figure 16b). For homeotropic boundary conditions the helical superstructure can be visualised via an equidistant line pattern, which is of the order of magnitude of the pitch length (Figure 16c).
It should be noted that the TGB structure can be both commensurate [70] or incommensurate [71,72], i.e., be comprised of an integer number or irrational number of blocks in a complete 2π twist. This has been demonstrated by Small Angle X-ray Scattering on oriented samples. The structure of individual blocks can be of the smectic A type or the smectic C type [73–75]. In the former case one speaks of the TGBA* phase, while for the latter structure, several different types of TGBC* phases have been proposed: (1) the smectic layer normal is perpendicular to the helical axis and the director is tilted with respect to the screw dislocations. The spontaneous polarization spirals around the twist axis; (2) the layer normal is tilted with respect to the screw dislocations and the director is parallel to the dislocations. The spontaneous polarization of each block is oriented along the helical axis; (3) the smectic layer planes are tilted with respect to the screw dislocations, while the director is parallel to them. The vector of the spontaneous polarization spirals around the direction of twist. The general structural features of the TGB phase are a layered structure, a helical superstructure, and a helix axis parallel to the smectic layer plane.
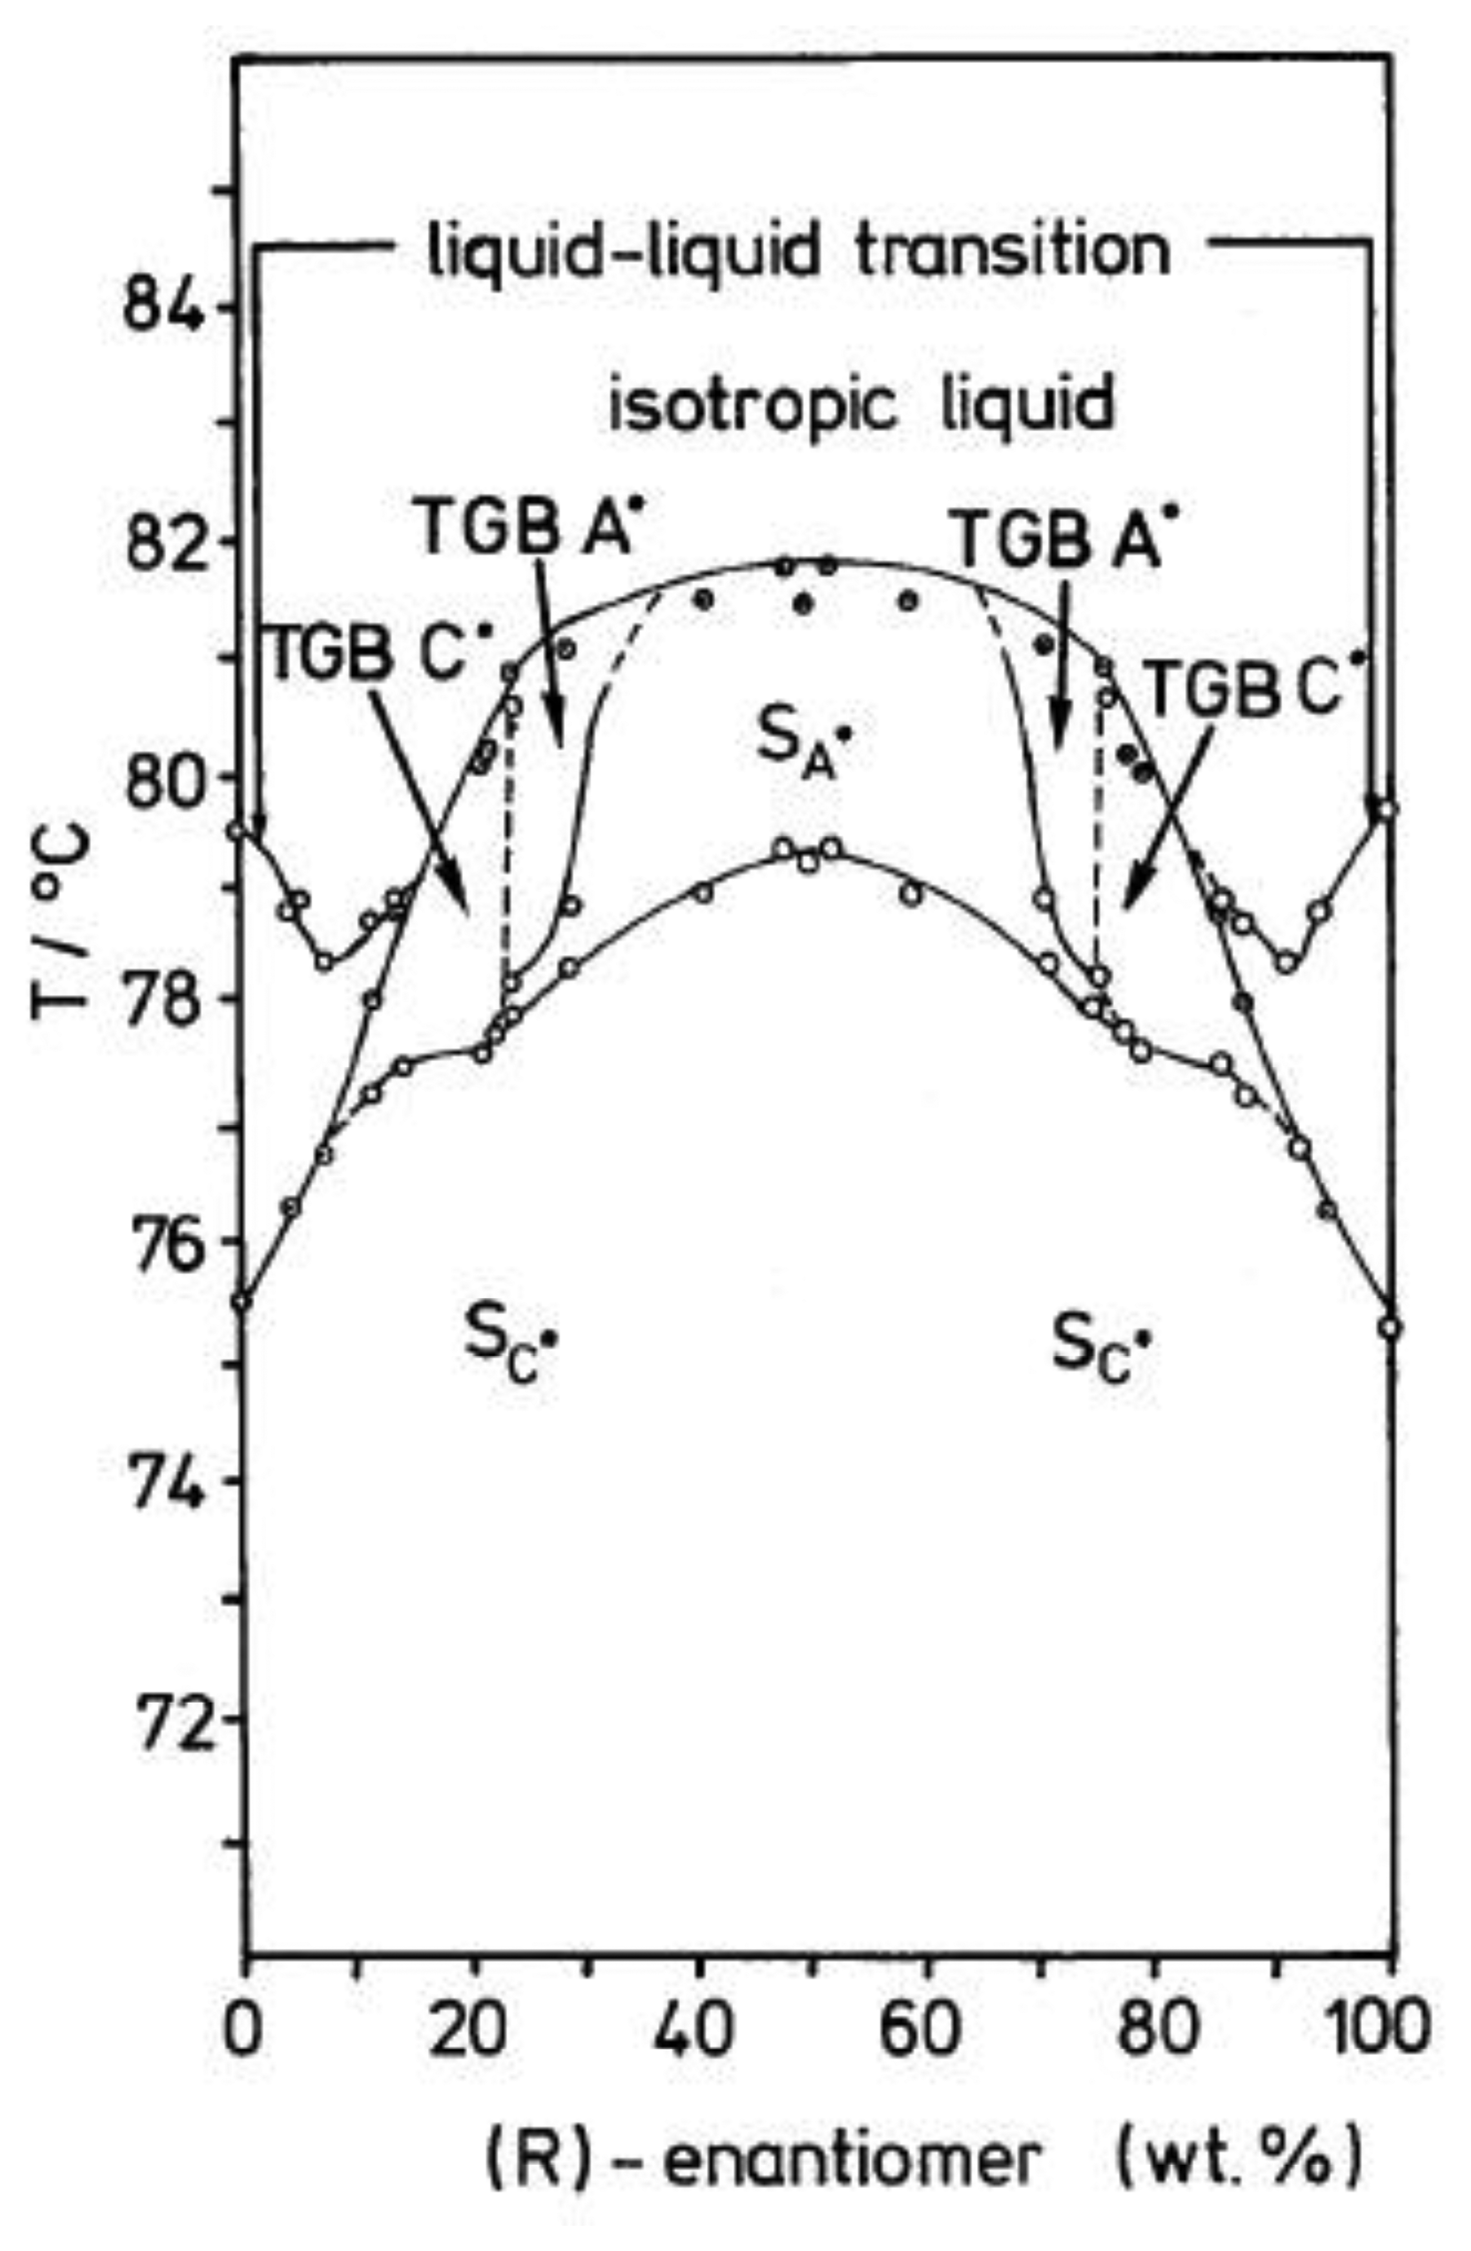
The TGB phases occur for highly chiral, calamitic mesogens. Being frustrated phases, their temperature range of stability is generally very small, of the order of ∼1 K. Theoretically, it is predicted that the TGB phase can in particular be observed in the vicinity of a N*-SmA*-SmC* triple point [76]. Figure 17 depicts a phase diagram for a mixture between the R- and S-form of a chiral mesogen. Below a certain chiral concentration, i.e., toward the racemic mixture, the TGBA* phase vanishes and gives place to a standard smectic A* phase.
4. New Electro-Optic Effects
Besides the normal dielectric effects, the Kerr effect, flexoelectricity and the like, there are some electro-optic switching effects which can only be observed in chiral liquid crystals. Most of these find their analogy in solid state physics with crystals of non-centrosymmetric point group.
4.1. Ferroelectric Liquid Crystals
The absence of mirror symmetry leads to a number of different smectic liquid crystals or soft crystal phases with structures which do not exhibit an inversion center. This symmetry breaking is observed namely for the chiral, tilted phases, such as the fluid SmC*, the hexagonal SmI* and SmF* phases, and the soft crystal phases J*, G*, K* and H* (the star (*) indicates a phase composed of chiral molecules). These phases show the property of pyroelectricity, thus the occurrence of a spontaneous polarization. If this spontaneous polarization PS can be reoriented between two stable states we speak of ferroelectricity [78,79]. A typical hysteresis curve is depicted in Figure 18.
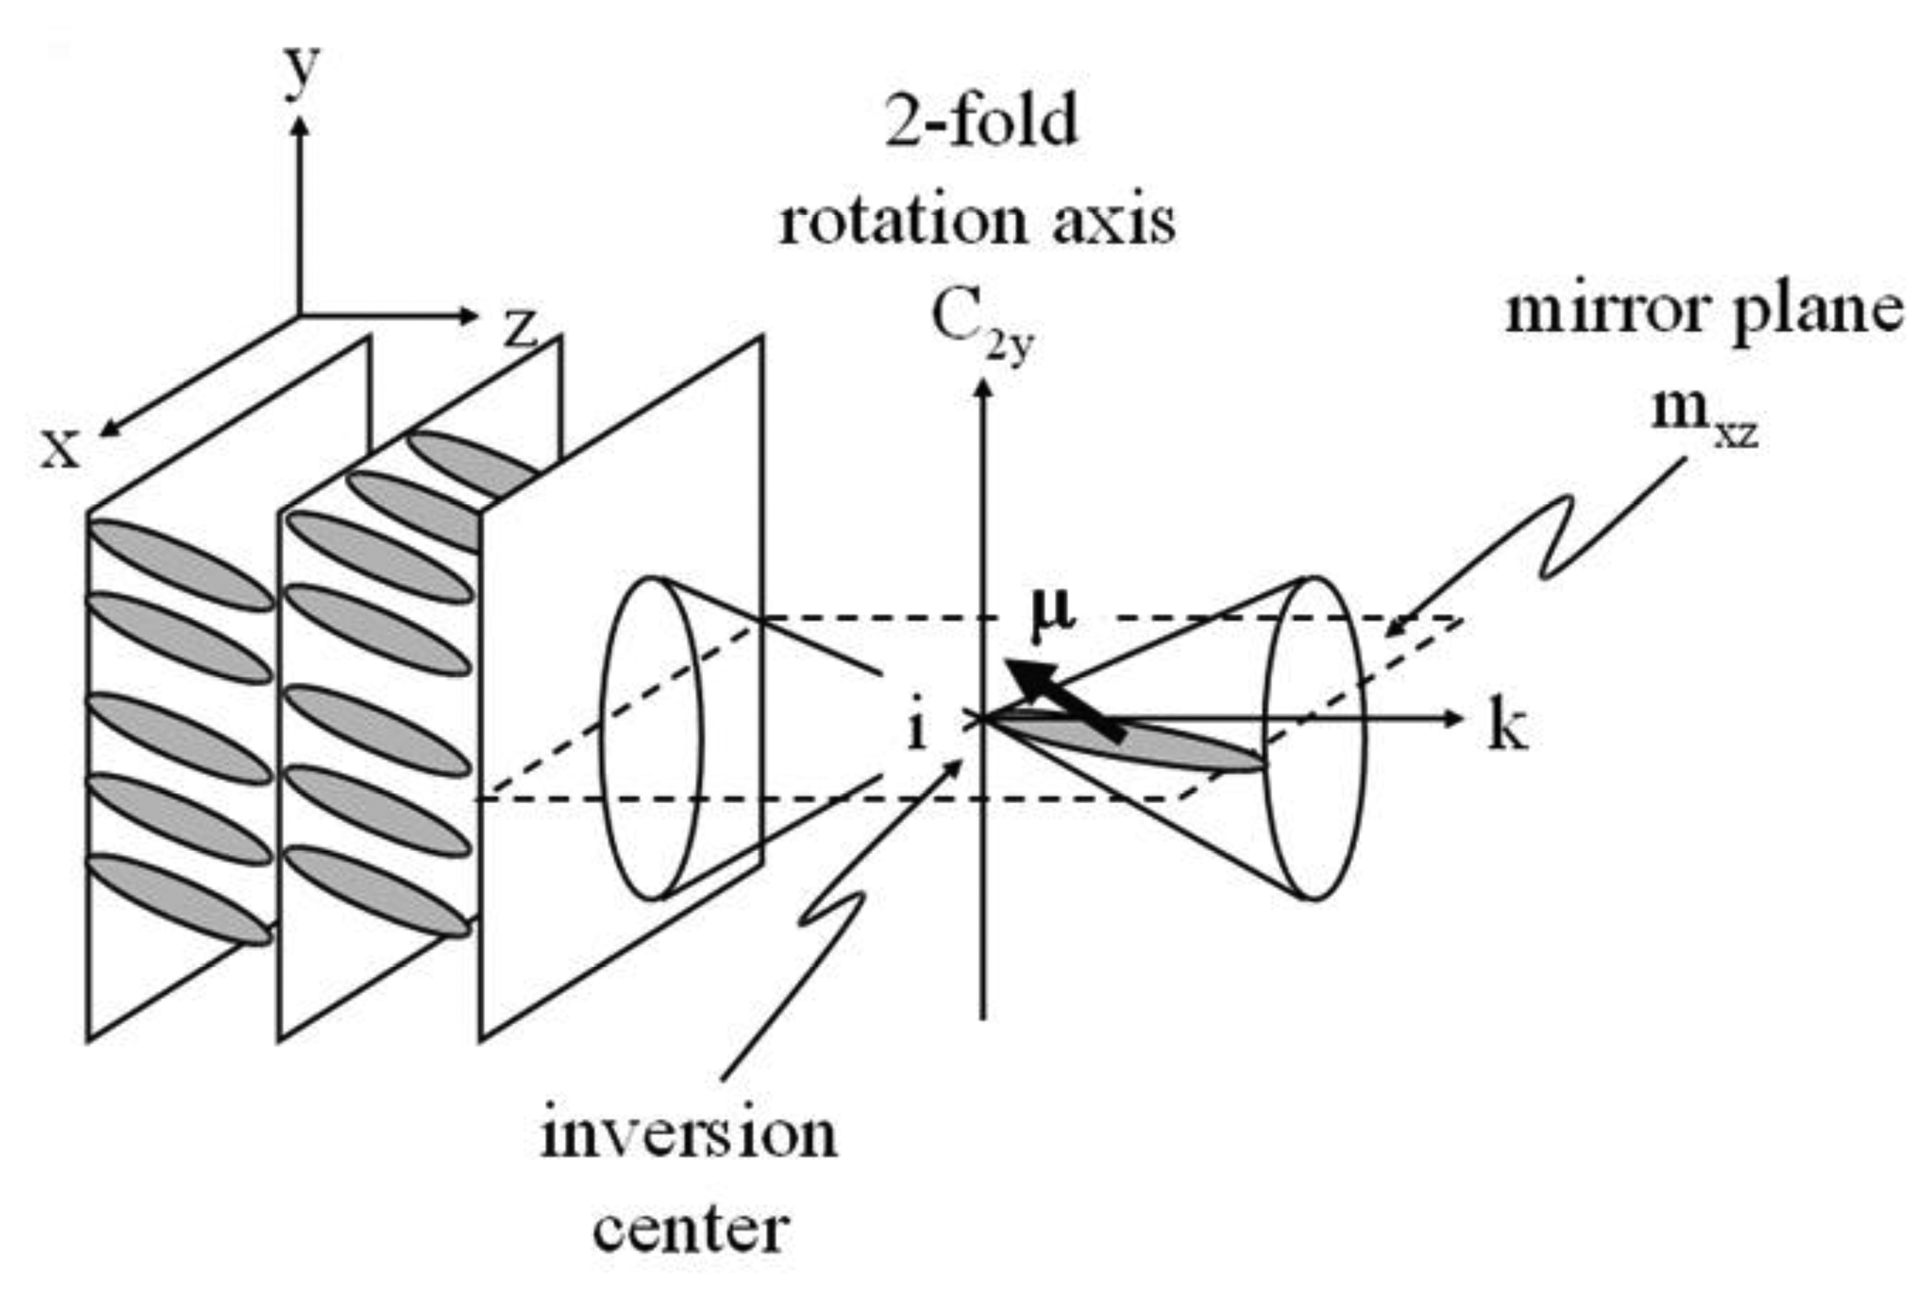
The occurrence of a spontaneous polarization can be understood by following the symmetry argument of Meyer et al. [80]. Starting with an achiral SmC structure as depicted in Figure 19, one can see that there are several symmetry elements, (i) a two-fold rotation axis; (ii) a mirror plane, and resulting from this; (iii) an inversion center. A general molecular dipole moment μ = (μx, μy, μz) transforms to μi = (−μx, −μy, −μz) under these operations, which leads to a net zero polarization μSmC = (0, 0, 0) for the achiral SmC phase. On the other hand, introducing chirality implies a vanishing of the mirror plane and the inversion center. The general molecular dipole moment μ = (μx, μy, μz) is then subjected to the remaining symmetry element of the two-fold rotation axis, leading to μrot = (−μx, μy, −μz) and a net dipole of μSmC* = (0, μy, 0) for the chiral SmC* phase. The dipole density per unit volume, i.e., the spontaneous polarization, is non zero and pointing in y-direction.
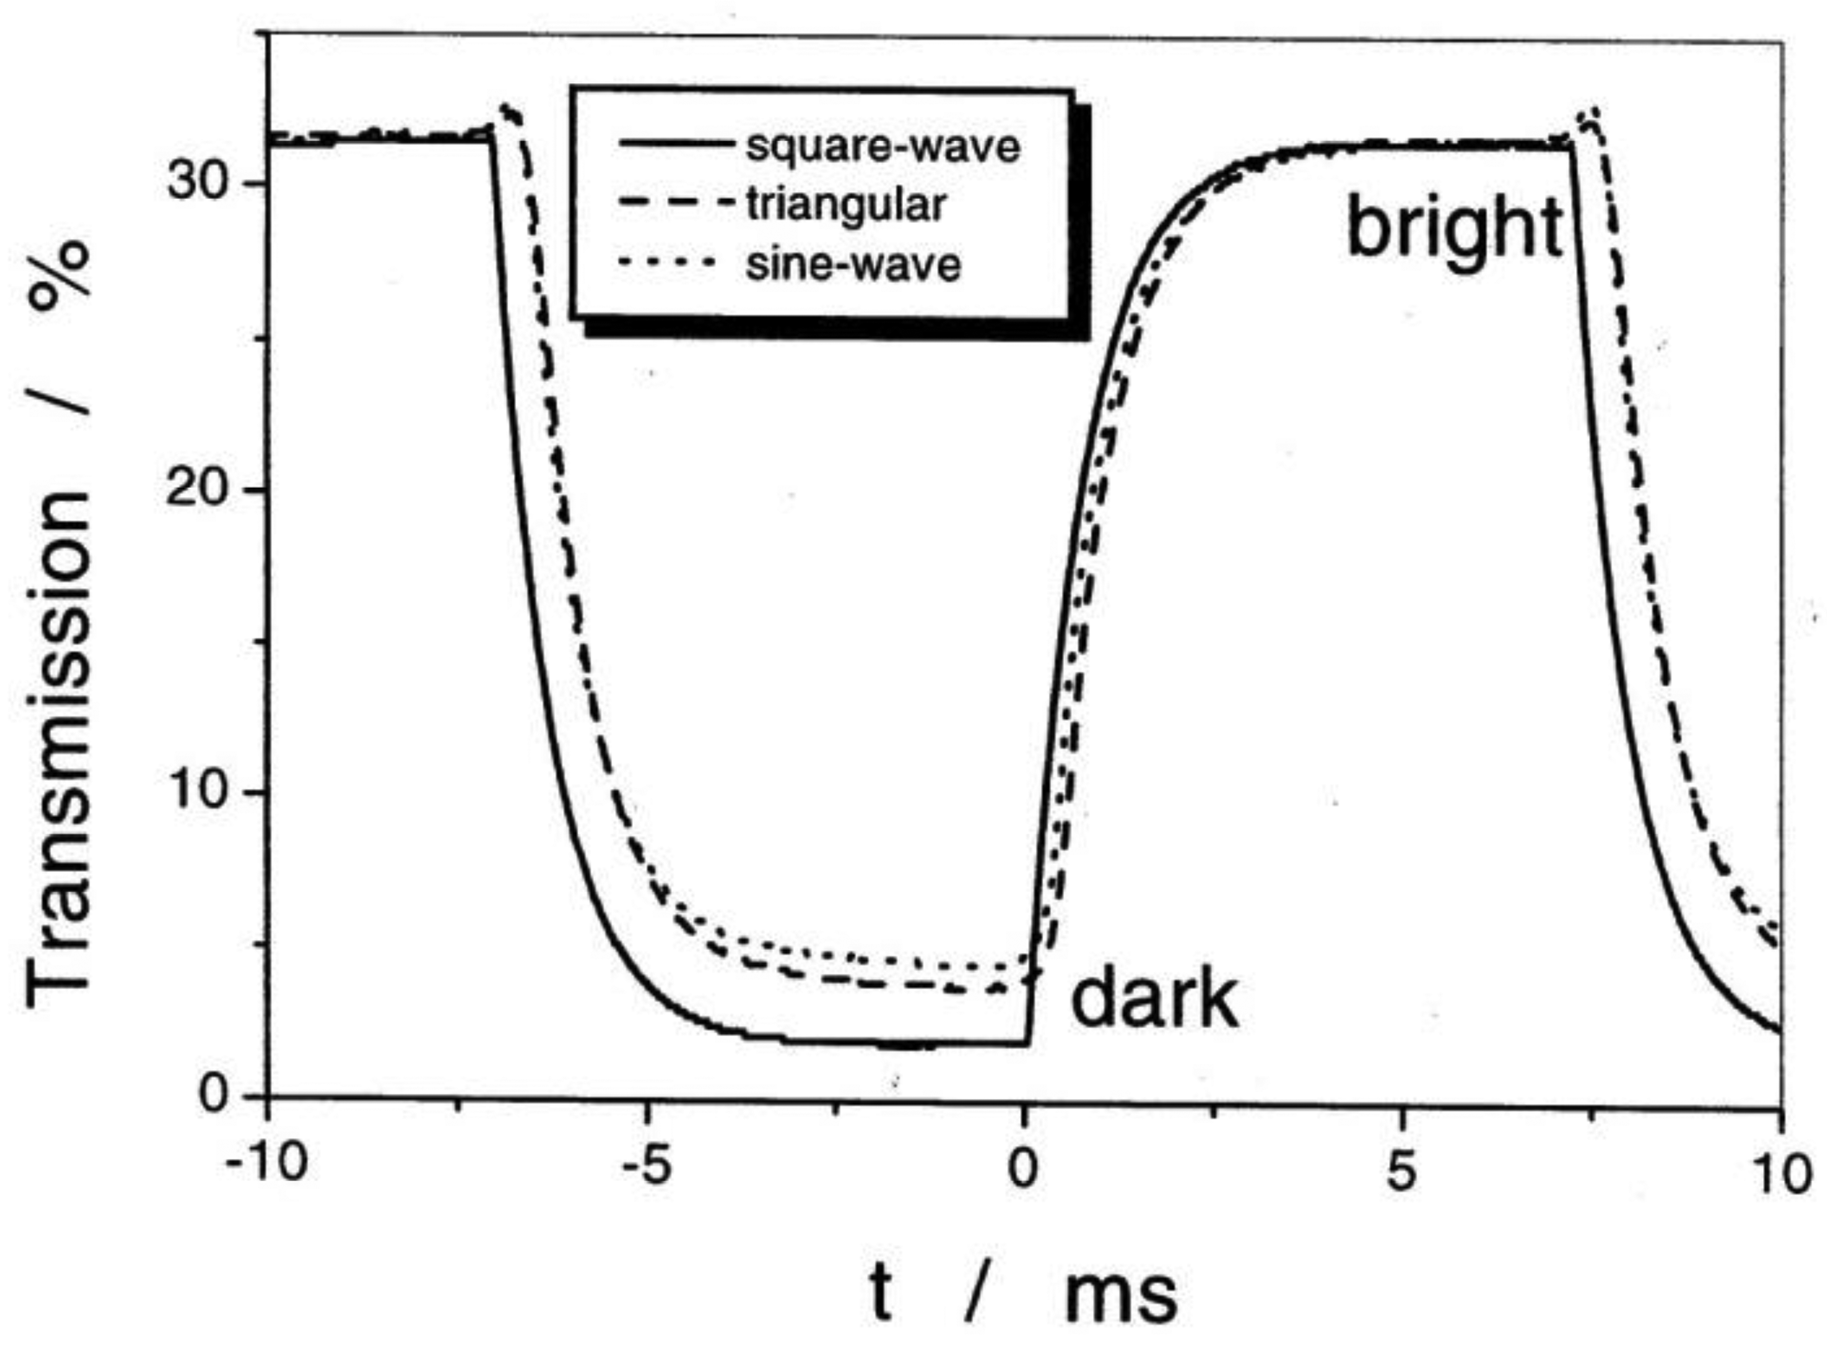
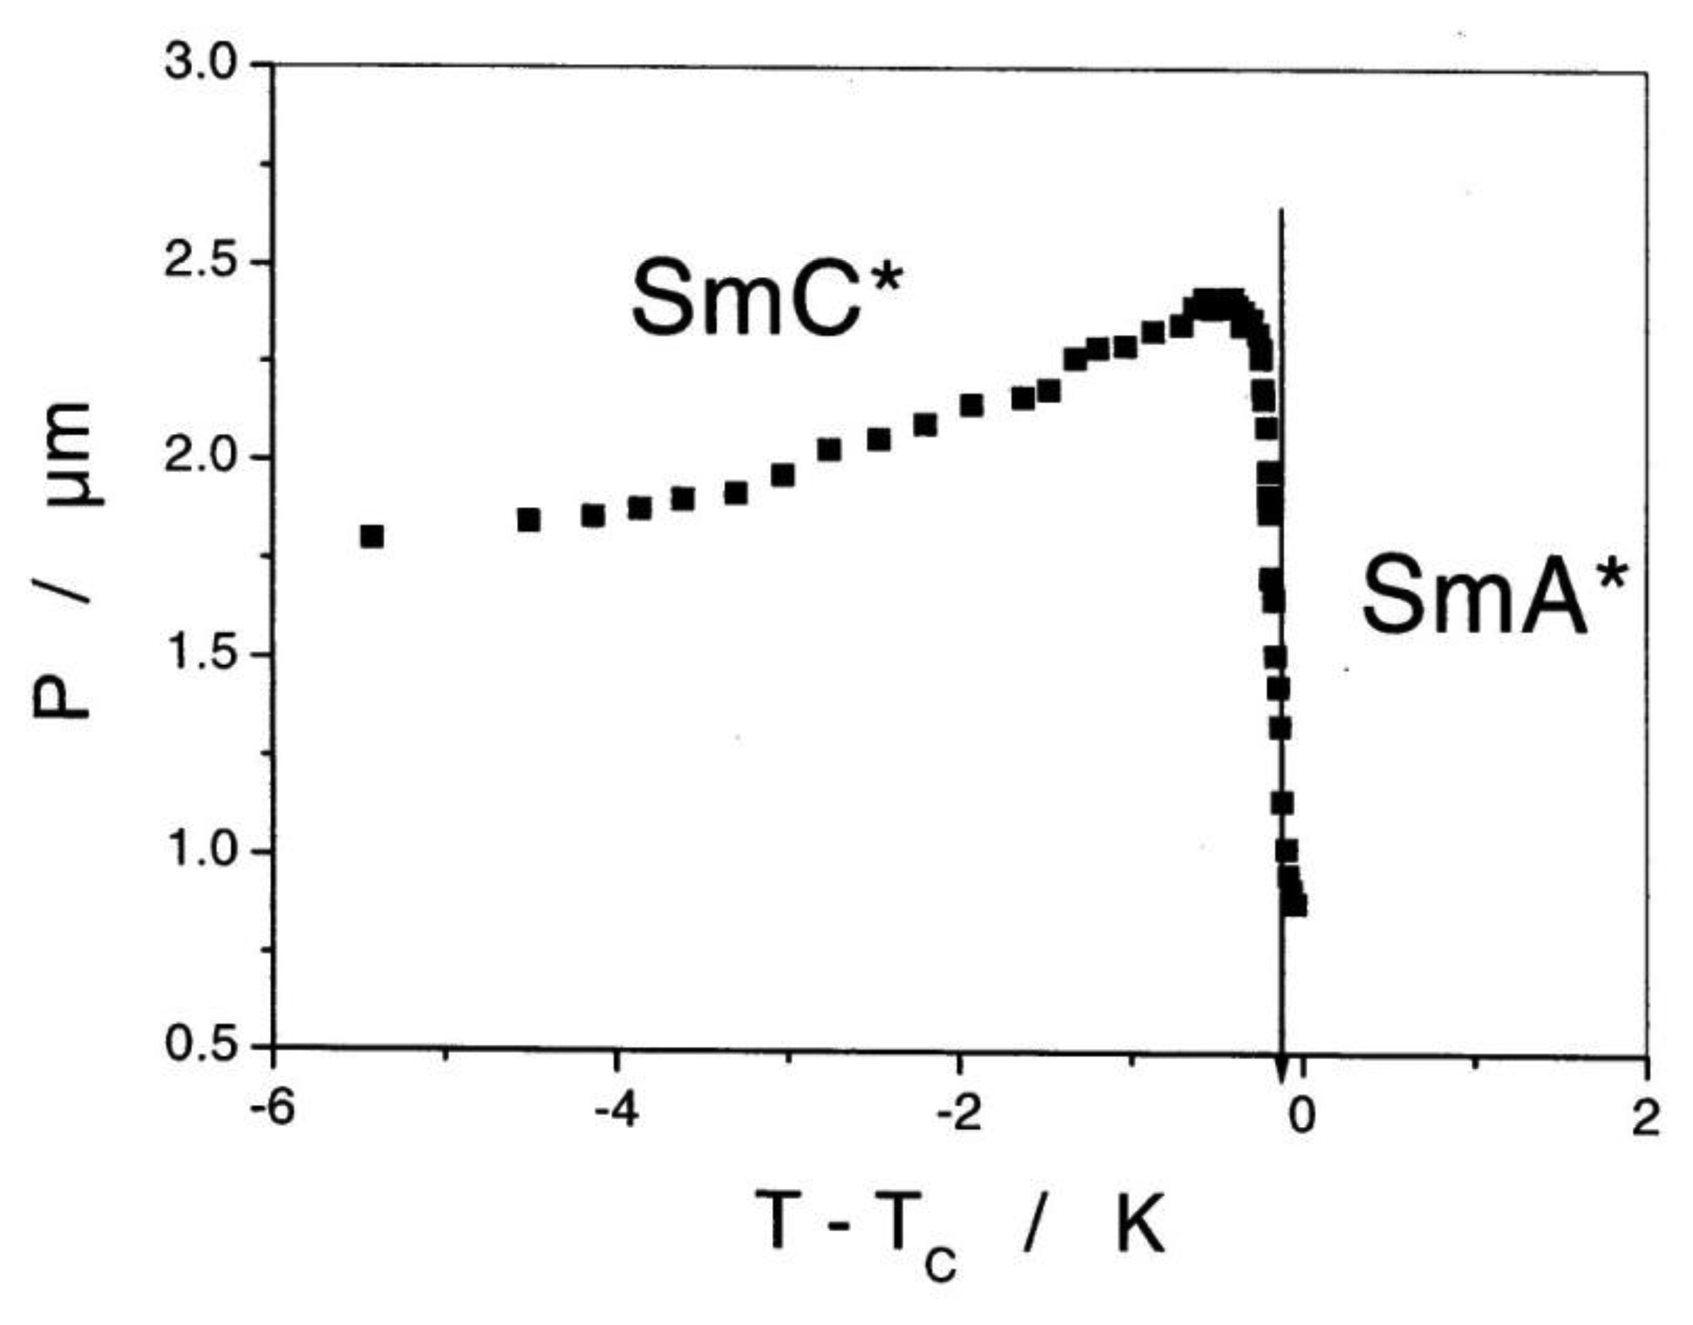
Application of an alternating electric field reorients PS, which is coupled to a reorientation of the director n, thus leading to an electro-optic switching process which is about a factor 103 faster than that of standard displays employing the nematic phase. The response is bistable and a square wave optical transmission is observed for all alternating electric waveforms (Figure 20). It should be noted that for thick devices the spontaneous polarization is locally compensated by the formation of a supermolecular helical structure of a certain handedness. Inversion of the molecular chiral configuration leads to the inversion of the helical handedness. In most cases the pitch is only slightly temperature dependent with a maximum close to the transition between SmC* and SmA*, as depicted in Figure 21. More correctly one should speak of a helielectric structure. The helical superstructure can be elastically unwound by placing the SmC* liquid crystal in a sandwich cell of gap smaller than the pitch of the helix. This leads to a true ferroelectric domain structure and is called a surface stabilized ferroelectric liquid crystal (SSFLC) [81].
Just as for solid state materials, liquid crystals exhibit phase transitions of first and of second order. In the former case, an order parameter shows a discontinuous change, while in the latter, the order parameter behaves continuously. The spontaneous polarization can be chosen as a (secondary) order parameter, as depicted in Figure 22. The second order phase transition between the SmA* and the SmC* phase can be described by a generalized Landau theory [82,83] with the tilt angle, which is coupled to the spontaneous polarization, as order parameter:
Recently, an interesting discovery has been made in demonstrating the first lyotropic ferroelectric liquid crystal [90], which consists of a phenylpyrimidine core with a chiral diol head group coupled via a spacer group, in polar solvents like water or formamide. Thermotropic and lyotropic phases exhibit a wealth of similarities. For example, nematic and cholesteric phases exist in both types, including the corresponding formation of helices. Also the thermotropic SmA phase very commonly finds its lyotropic analogy, called the lamellar Lα phase, for example in cell membranes. It is thus surprising that only very few examples of the tilted SmC structure are known for lyotropics, while it is a rather commonly observed thermotropic phase. None of the former materials are chiral, except the recently demonstrated one. Also in the lyotropic case a helical superstructure is observed, as well as a SSFLC domain texture. In addition, polar electro-optic switching is observed, which indicates a ferroelectric phase. This is indeed surprising, because ferroelectricity is a cooperative effect, which implies, that chiral information is transmitted across a layer of water, which makes up 60%–70% of the lyotropic phase.
4.2. The Electroclinic Effect
Another effect that occurs only for chiral smectic liquid crystals is the so called electroclinic effect [91], a polar, linear electro-optic switching, which is very similar to piezoelectricity in solid state materials [92,93]. On application of an alternating electric field, the switching direction of the director reverses. The effect can be observed on both sides of the phase transition, but most easily in the SmA* phase as in the SmC* phase it is overshadowed by the much larger ferroelectric response. An experimental example is given in Figure 23a, while part (b) depicts the electroclinic effect in the vicinity of the SmA* to SmC* transition. This demonstrates a way to break the cylinder symmetry due to molecular rotation around the long molecular axis by an electric field. A polarization is induced and with it the reorientation of the director. This changes sign as the applied field changes polarity and is proportional to the electric field amplitude. While the electro-optic modulation depth is rather small, approximately about one degree, the response time is fast, generally in the order of less than a microsecond.
It should be noted that the electroclinic effect may also be observed in the chiral nematic phase [94–96], although with extremely small deviation angles of the optic axis of 1/hundred to 1/tens of degrees.
4.3. Antiferroelectric and Intermediate Phases
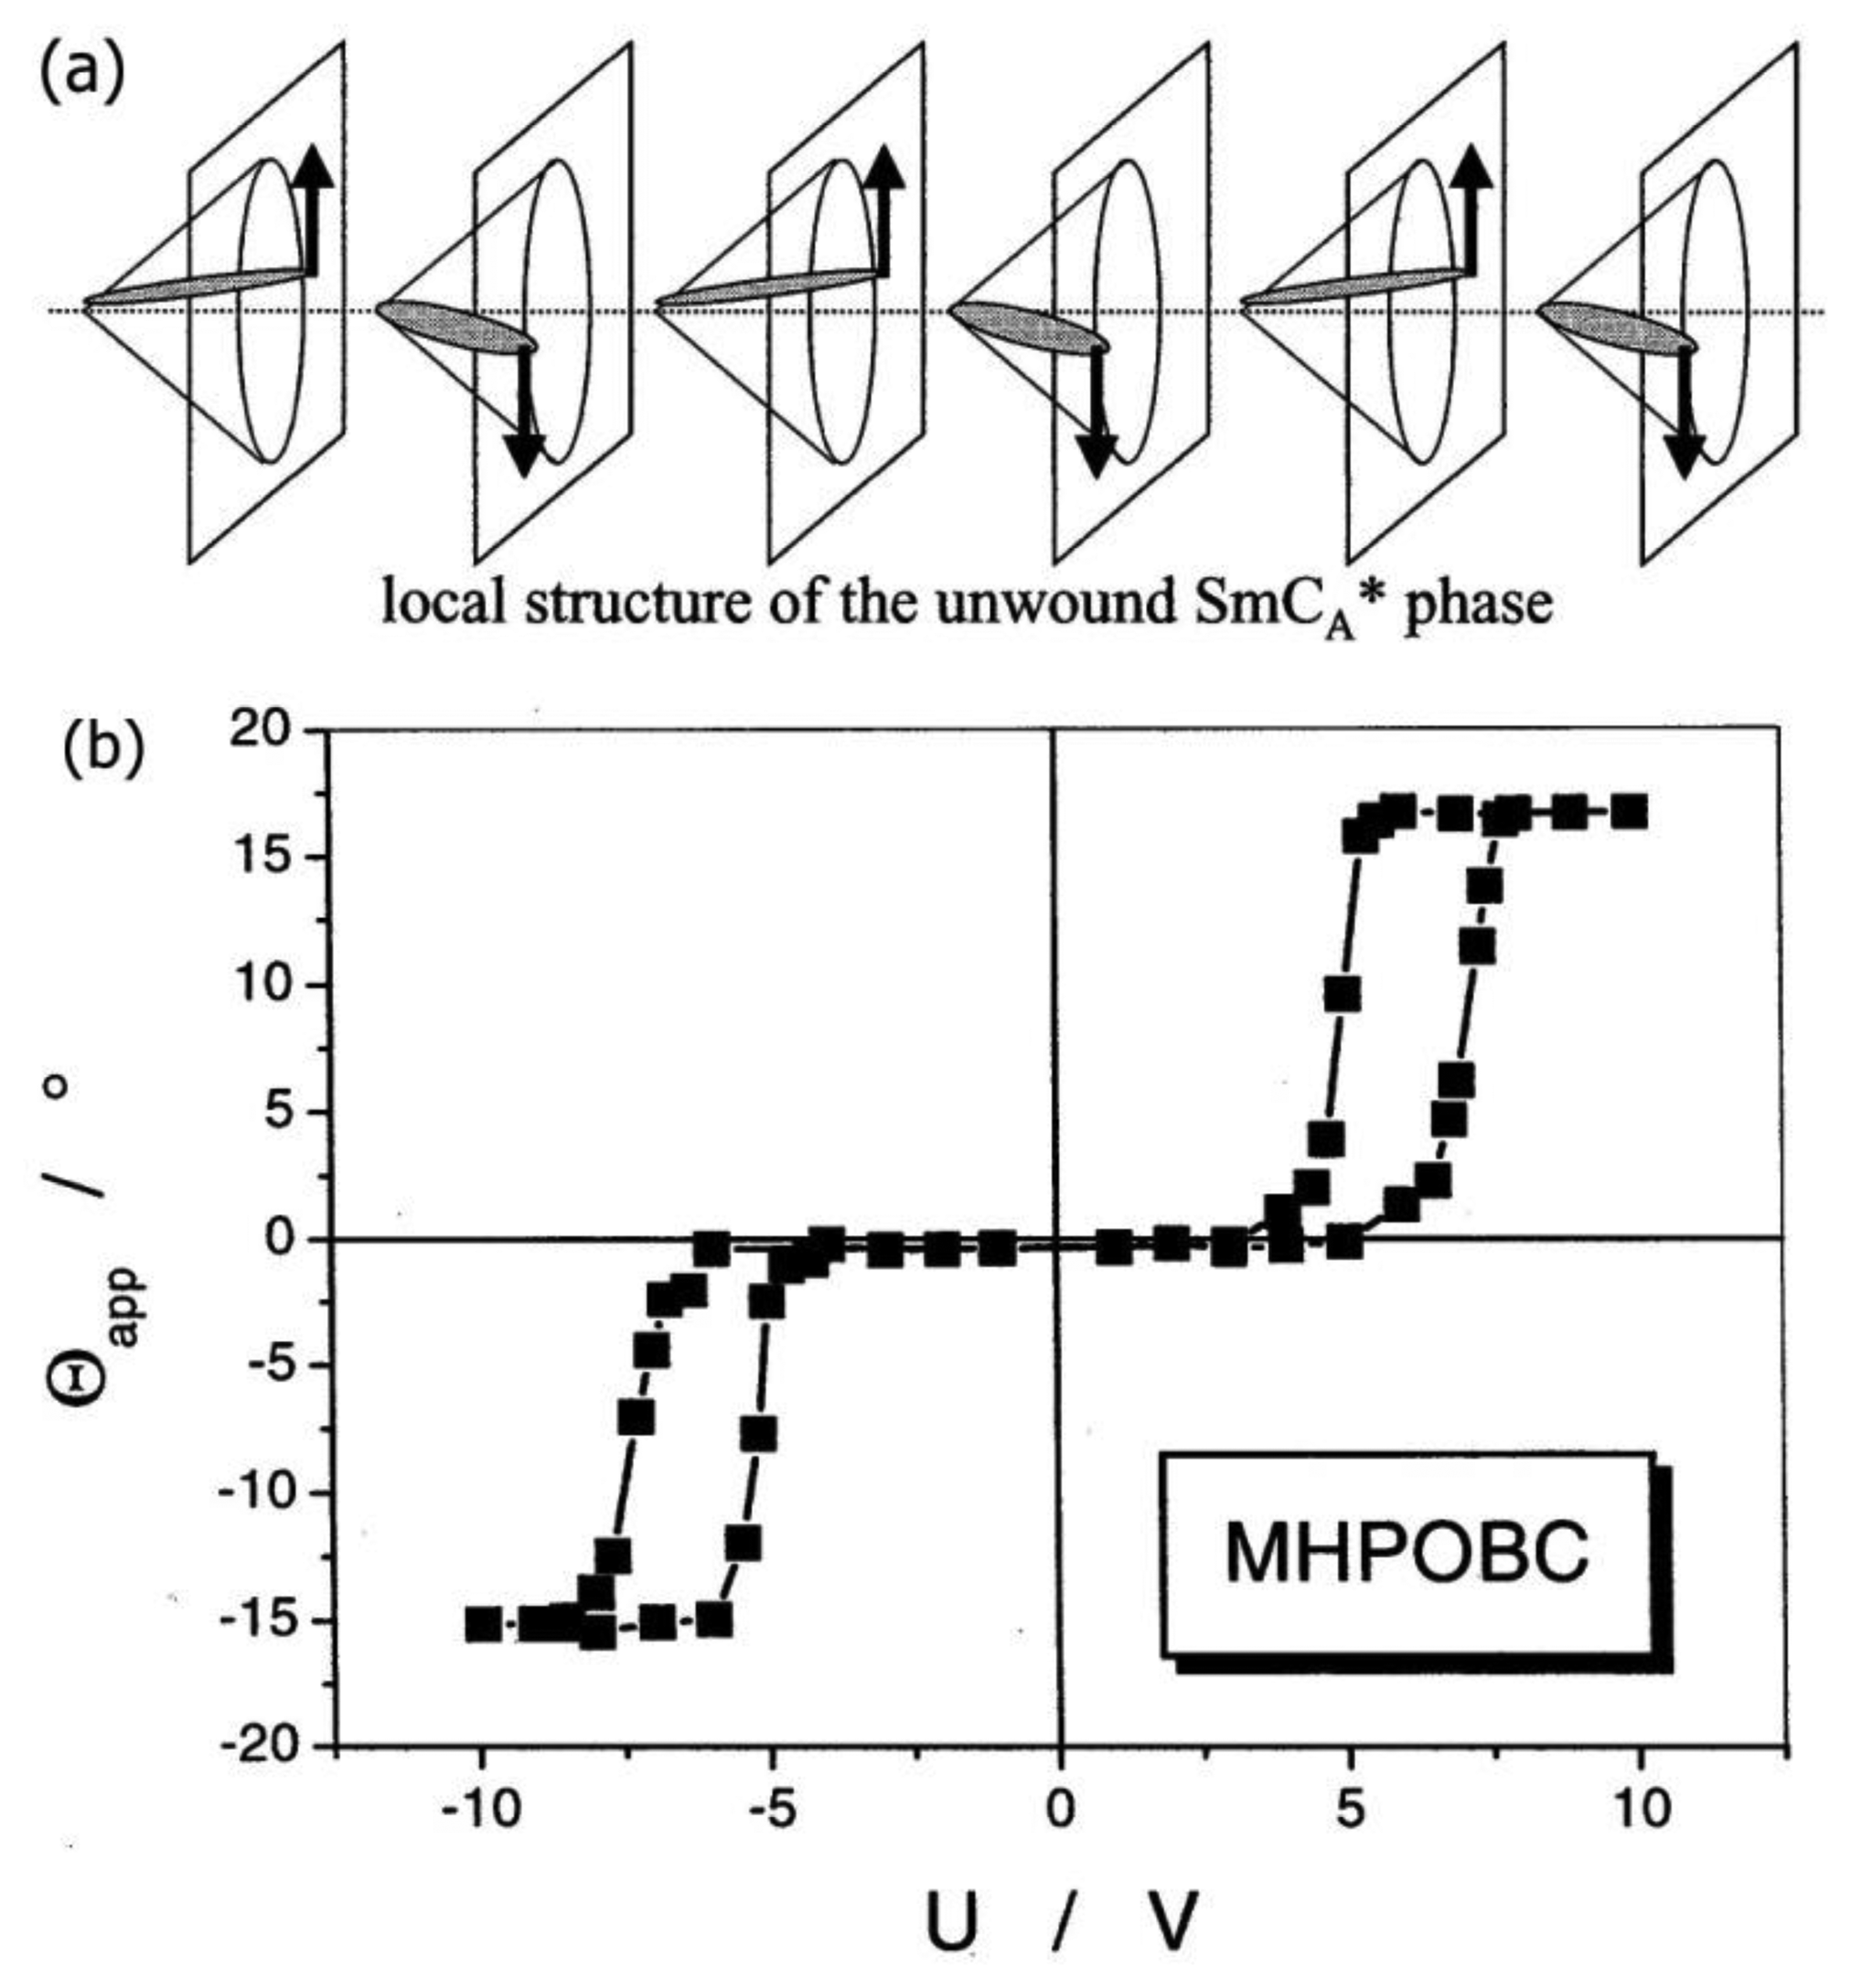
Having demonstrated the occurrence of a spontaneous polarization and the property of ferroelectricity for the chiral, tilted SmC* phase, it should be noted that also other similarities to solid state materials can be observed, namely antiferroelectric [97–99] and intermediate [100,101] structures. Just like their ferroelectric counterpart, the former exhibit a helical superstructure, which for now we neglect for reasons of clarity. The antiferroelectric phase shows an alternating tilt pattern when advancing in direction of the smectic layer normal. Associated with this is a spontaneous polarization which points upward and downward from layer to layer, as depicted in Figure 24a. When subjected to an alternating electric field, a typical antiferroelectric double-hysteresis loop is observed (Figure 24b). The threshold voltage of the antiferroelectric SmCA* phase is clearly larger than that of the ferroelectric SmC* phase, while electro-optic modulation depth and response time are comparable. The antiferroelectric phase on the other hand has the applicational advantage of being monostable with three switching states, with the dark state at zero field.
Similarly, there are structures with alternatingly two layers polarization up and one layer PS down. These exhibit intermediate behavior. The occurrence of these phases depends in a subtle way on the interlayer interactions.
4.4. Bent-Core Materials
In recent years bent-core liquid crystals [102,103], also called “banana phases” have attracted much interest, due to their chiral properties from achiral molecules. These materials exhibit no molecular handedness due to chiral elements or groups, but structural chirality of the phase due to the packing of the bent-shaped cores of the molecules [104]. It has been shown that this structural chirality may lead to a spontaneous polarization and ferroelectric, but more often antiferroelectric, properties. Additionally, when added to a chiral matrix, chiral conformations of the bent-core molecule can be biased, resulting in an overall increased chirality. This can manifest itself in cholesteric liquid crystals through a reduction of the pitch of the helical superstructure [105], but also in the properties of Blue Phases, which can occur through the addition of bent-core molecules over a certain concentration regime [106]. Bent-core dopants have also been shown to widen the range of an existing Blue Phase [62]. In ferroelectric liquid crystals, bent-core molecules can increase the polarization-tilt coupling coefficient, which is the only chiral parameter in the generalised Landau expansion of FLCs. The increase of this coefficient C is independent on the handedness of the chiral matrix, which provided experimental evidence of the interpretation outlined above [107].
5. Conclusions
Just like in all areas of science, chirality, or the lack of mirror symmetry, can be found in liquid crystals, thermotropic as well as lyotropic ones. In the former case, it manifests itself through the formation of supermolecular chiral (helical) structures, the occurrence of novel phases like Blue Phases or Twist Grain Boundary phases, or the observation of new effects like ferroelectricity and the occurrence of a spontaneously formed polarization due to symmetry breaking. In the latter case, chiral liquid crystals are most often observed for biopolymers. Examples were given in the discussion of cellulose and DNA. Liquid crystalline chirality effects in nature are related to those of standard liquid crystal materials, as can be seen by the cholesteric helicity and optical properties of certain beetles.
Conflicts of Interest
The author declares no conflict of interest.
References
- Janoschek, R. Chirality: From Weak Bosons to the α-Helix; Springer Verlag: Berlin, Germany, 2011. [Google Scholar]
- Wagniere, G.H. On Chirality and the Universal Asymmetry; Wiley-VCH: Weinheim, Germany, 2007. [Google Scholar]
- Flapan, E. When Topology Meets Chemistry: A Topological Look at Molecular Chirality; Cambridge University Press: Cambridge, UK, 2000. [Google Scholar]
- Riehl, J.P. Mirror-Image Asymmetry: An Introduction to the Origin and Consequences of Chirality; Wiley-Blackwell: Hoboken, NJ, USA, 2010. [Google Scholar]
- Pasteur, L. Annales de chimie et de physique. C.R. Acad. Sci. Paris 1848, 24, 442–459. [Google Scholar]
- Lord Kelvin, W.T.B. Baltimore Lectures on Molecular Dynamics and the Wave Theory of Light; Cambridge Library Collection: Cambridge, UK, 1904. [Google Scholar]
- Crossley, R.J. Chirality and Biological Activity of Drugs; CRC Press: Boca Raton, FL, USA, 1995. [Google Scholar]
- Reddy, I.K. Chirality in Drug Design and Development; Mehvar, R., Ed.; CRC Press: Boca Raton, FL, USA, 2004. [Google Scholar]
- Francotte, E. Chirality in Drug Research: From Synthesis to Pharmacology; Lindner, W., Ed.; Wiley-VCH: Weinheim, Germany, 2006. [Google Scholar]
- Kondepundi, D.K.; Durand, D.J. Chiral asymmetry in spiral galaxies? Chirality 2001, 13, 351–356. [Google Scholar]
- Capozziello, S.; Lattanzi, A. Spiral galaxies as chiral objects? Astrophys. Space Sci. 2006, 301, 189–193. [Google Scholar]
- Aryal, B.; Acharya, S.R.; Sauer, W. Chiral property of spiral and barred spiral galaxies in the local supercluster. Astrophys. Space Sci. 2007, 307, 369–383. [Google Scholar]
- Cahn, R.S.; Ingold, C.; Prelog, V. Specification of molecular chirality. Angew. Chem. Int. Ed. 1966, 5, 385–415. [Google Scholar]
- Kuball, H.-G.; Höfer, T. From a chiral molecule to a chiral anisotropic phase. In Chirality in Liquid Crystals; Kitzerow, H.-S., Bahr, C., Eds.; Springer Verlag: New York, NY, USA, 2001; Chapter 3; pp. 67–100. [Google Scholar]
- Collings, P.J.; Hird, M. Introduction to Liquid Crystals: Chemistry and Physics; Taylor & Francis: London, UK, 1997. [Google Scholar]
- Chandrasekhar, S. Liquid Crystals, 2nd ed.; Cambridge University Press: Cambridge, UK, 1992. [Google Scholar]
- De Gennes, P.G.; Prost, J. The Physics of Liquid Crystals, 2nd ed.; Clarendon Press: Oxford, UK, 1993. [Google Scholar]
- Petrov, A.G. The Lyotropic State of Matter; Gordon and Breach: New York, NY, USA, 1999. [Google Scholar]
- Figueiredo Neto, A.M.; Neto, S.R.A. The Physics of Lyotropic Liquid Crystals; Oxford University Press: Oxford, UK, 2005. [Google Scholar]
- Kumar, S. Chemistry of Discotic Liquid Crystals: From Monomers to Polymers; CRC Press: Boca Raton, FL, USA, 2011. [Google Scholar]
- Kitzerow, H.-S. Chirality in Liquid Crystals; Bahr, C., Ed.; Springer Verlag: New York, NY, USA, 2001. [Google Scholar]
- DeVries, H. Rotatory power and other optical properties of certain liquid crystals. Acta Cryst. 1951, 4, 219–226. [Google Scholar]
- Martinot-Lagarde, P.H. Flexo and ferroelectricity observation of ferroelectrical monodomainsin the chiral smectic C liquid crystals. J. Phys. 1976, 37, C3-129–C3-132. [Google Scholar]
- Crooker, P.P. Blue Phases. In Chirality in Liquid Crystals; Kitzerow, H.-S., Bahr, C., Eds.; Springer Verlag: New York, NY, USA, 2001; Chapter 7; pp. 186–222. [Google Scholar]
- Kitzerow, H.-S. Twist Grain Boundary Phases. In Chirality in Liquid Crystals; Kitzerow, H.-S., Bahr, C., Eds.; Springer Verlag: New York, NY, USA, 2001; Chapter 10; pp. 296–354. [Google Scholar]
- Dierking, I. Textures of Liquid Crystals; Wiley-VCH: Weinheim, Germany, 2003. [Google Scholar]
- Keating, P.N. A theory of the cholesteric mesophase. Mol. Cryst. 1969, 8, 315–326. [Google Scholar]
- De Gennes, P.G. Some remarks on the polymorphism of smectics. Mol. Cryst. Liq. Cryst. 1973, 21, 49–76. [Google Scholar]
- Chen, J.H.; Lubensky, T.C. Landau-ginzburg mean field theory for the nematic to smectic-C and nematic to smectic-A phase transition. Phys. Rev. A 1976, 14, 1202–1207. [Google Scholar]
- Chu, K.C.; McMillan, W.L. Unified Landau Theory for the nematic, smectic A, and smectic C phases of Liquid Crystals. Phys. Rev. A 1977, 15, 1181–1187. [Google Scholar]
- Yoon, H.G.; Dierking, I.; Gleeson, H.F. Cholesteric pitch divergence near smectic phase transitions. Phys. Rev. E 2010, 82, 011705:1–011705:9. [Google Scholar]
- Stegemeyer, H.; Siemensmeyer, K.; Sucrow, W.; Appel, L. Liquid crystalline norcholesterylesters—Influence of the axial methylgroups on the phase transitions and the cholesteric helix. Z. Naturforsch. 1989, 44, 1127–1130. [Google Scholar]
- Slaney, A.J.; Nishiyama, I.; Styring, P.; Goodby, J.W. Twist inversion in a cholesteric material containing a single chiral center. J. Mater. Chem. 1992, 2, 805–810. [Google Scholar]
- Dierking, I.; Giesselmann, F.; Zugenmaier, P.; Kuczynski, W.; Lagerwall, S.T.; Stebler, B. Investigations of the structure of a cholesteric phase with a temperature induced helix inversion and of the succeeding SC* phase in thin liquid crystal cells. Liq. Cryst. 1993, 13, 45–55. [Google Scholar]
- Styring, P.; Vuijk, J.D.; Nishiyama, I.; Slaney, A.J.; Goodby, J.W. Inversion of chirality dependent properties in optically active liquid crystals. J. Mater. Chem. 1993, 3, 399–405. [Google Scholar]
- Loubser, C.; Wessels, P.L.; Styring, P.; Goodby, J.W. Helix Inversion in the chiral nematic phase of a ferroelectric liquid crystal containing a single chiral center. J. Mater. Chem. 1994, 4, 71–79. [Google Scholar]
- Finkelmann, H.; Stegemeyer, H. Description of cholesteric mixtures by an extended goossens theory. Ber. Bunsenges. Phys. Chem. 1974, 78, 869–874. [Google Scholar]
- Finkelmann, H.; Stegemeyer, H. Temperature dependence of the intrinsic pitch in induced cholesteric systems. Ber. Bunsenges. Phys. Chem. 1978, 82, 1302–1308. [Google Scholar]
- Dierking, I.; Giesselmann, F.; Zugenmaier, P.; Mohr, K.; Zaschke, H.; Kuczynski, W. The origin of the helical twist inversion in single component cholesteric liquid crystals. Z. Naturforsch. 1994, 49, 1081–1086. [Google Scholar]
- Dierking, I.; Giesselmann, F.; Zugenmaier, P.; Mohr, K.; Zaschke, H.; Kuczynski, W. New diastereomeric compound with cholesteric twist inversion. Liq. Cryst. 1995, 18, 443–449. [Google Scholar]
- Katsonis, N.; Lacaze, E.; Ferrarini, A. Controlling chirality with helix inversion in cholesteric liquid crystals. J. Mater. Chem. 2012, 22, 7088–7097. [Google Scholar]
- Portnoy, W.M. Tutorial liquid crystal thermography. J. Assoc. Adv. Med. Instrum. 1970, 4, 176–181. [Google Scholar]
- Shlens, M.; Stoltz, M.R.; Benjamin, A. Orthopedic applications of liquid crystal thermography. West. J. Med. 1975, 122, 367–370. [Google Scholar]
- Schmidt, J.; Dierking, I. Localization and imaging local shunts in solar cells using polymer dispersed liquid crystals. Prog. Photovolt. Res. Appl. 2001, 9, 263–271. [Google Scholar]
- Dreher, R.; Meier, G.; Saupe, A. Selective reflection by cholesteric liquid crystals. Mol. Cryst. Liq. Cryst. 1971, 13, 17–26. [Google Scholar]
- Michelson, A.A. On metallic colouring in birds and insects. Phil. Mag. 1911, 21, 554–567. [Google Scholar]
- Jewell, S.A.; Vukusic, P.; Roberts, N.W. Circularly polarized colour reflection from helicoidal structures in the beetle plusiotis boucardi. New J. Phys. 2007, 9. [Google Scholar] [CrossRef]
- Zugenmaier, P. Cellulosic liquid crystals. In Handbook of Liquid Crystals; Goodby, J.W., Collings, P.J., Kato, T., Tschierske, C., Gleeson, H.F., Raynes, P., Eds.; Wiley-VCH: Weinheim, Germany, 2014; Volume 7. [Google Scholar]
- Strzelecka, T.E.; Davidson, M.W.; Rill, R.L. Multiple liquid crystal phases of DNA at high concentrations. Nature 1988, 331, 457–460. [Google Scholar]
- Zanchetta, G.; Nakata, M.; Buscaglia, M.; Bellini, T.; Clark, N.A. Phase separation and liquid crystallization of complementary sequences in mixtures of nanoDNA oligomers. Proc. Natl. Acad. Sci. USA 2008, 105, 1111–1117. [Google Scholar]
- Tortora, L.; Lavrentovich, O.D. Chiral symmetry breakingby spatial confinement in tactoidal droplets of lyotropic chromonic liquid rystals. Proc. Natl. Acad. Sci. USA 2011, 108, 5163–5168. [Google Scholar]
- Crooker, P.P. The blue phases—A review of experiments. Liq. Cryst. 1989, 5, 751–775. [Google Scholar]
- Ostwald, P.; Pieranski, P. Nematic and Cholesteric Liquid Crystals; Chapter BVIII; Taylor & Francis: Boca Raton, FL, USA, 2005. [Google Scholar]
- Coates, D.; Gray, G.W. Optical studies of amorphous liquid-cholesteric liquid crystal transition—Blue Phases. Phys. Lett. A 1973, 45, 115–116. [Google Scholar]
- Reinitzer, F. Beiträge zur Kenntnis des Cholesterins. Monatshefte Chem. 1888, 9, 421–431. [Google Scholar]
- Dubois-Violette, E.; Pansu, B. Frustration and related topology of blue phases. Mol. Cryst. Liq. Cryst. 1988, 165, 151–182. [Google Scholar]
- Kopp, V.I.; Fan, B.; Vithana, H.K.M.; Genack, A.Z. Low Threshold lasing at the edge of a photonic stop band in cholesteric liquid crystals. Opt. Lett. 1998, 23, 1707–1709. [Google Scholar]
- Munoz, A.; Palffy-Muhoray, P.; Taheri, B. Ultraviolet lasing in cholesteric liquid crystals. Opt. Lett. 2001, 26, 804–806. [Google Scholar]
- Ozaki, M.; Kasano, M.; Ganzke, D.; Haase, W.; Yashino, K. Mirrorless lasing in a dye doped ferroelectric liquid crystal. Adv. Mater. 2002, 14, 306–309. [Google Scholar]
- Cao, W.; Munoz, A.; Palffy-Muhoray, P.; Taheri, B. Lasing in a three dimensional photonic crystal of the liquid crystal blue phase II. Nat. Mater. 2002, 1, 111–113. [Google Scholar]
- A 15′′ display was demonstrated by Samsung Electronics Co. Ltd. at the conference of the Society for Information Display in Los Angeles, 2008
- Dierking, I.; Blenkhorn, W.; Credland, E.; Drake, W.; Kociuruba, R.; Kayser, B.; Michael, T. Stabilising liqui crystalline blue phases. Soft Matter 2012, 8, 4355–4362. [Google Scholar]
- Kasch, N.; Dierking, I.; Turner, M. Stabilization of the liquid crystalline blue phase by the addition of short chain polystyrene. Soft Matter 2013, 9, 4789–4793. [Google Scholar]
- Renn, S.R.; Lubensky, T.C. Abrikosov dislocation lattice in a model of the cholesteric to smectic A transition. Phys. Rev. A 1988, 38, 2132–2147. [Google Scholar]
- Renn, S.R.; Lubensky, T.C. Existence of a Sm-C grain boundary phase at the chiral NAC point. Mol. Cryst. Liq. Cryst. 1991, 209, 349–355. [Google Scholar]
- De Gennes, P.G. Analogy between superconductors and smectics A. Solid State Commun. 1972, 10, 753–756. [Google Scholar]
- Goodby, J.W.; Waugh, M.A.; Stein, S.M.; Chin, E.; Pindak, R.; Patel, J.S. Characterization of a new helical smectic liquid crystal. Nature 1989, 337, 449–452. [Google Scholar]
- Goodby, J.W.; Waugh, M.A.; Stein, S.M.; Chin, E.; Pindak, R.; Patel, J.S. A new molecular ordering in helical liquid crystals. J. Am. Chem. Soc. 1989, 111, 8119–8125. [Google Scholar]
- Navailles, L.; Barois, P.; Nguyen, H.T. X-ray measurement of the Twist Grain Boundary angle in the liquid crystal analog of the abrikosov phase. Phys. Rev. Lett. 1993, 71, 545–548. [Google Scholar]
- Navailles, L.; Pansu, B.; Gorre-Talini, L.; Nguyen, H.T. Structural study of a commensurate TGB(A) phase and of a presumed chiral line liquid phase. Phys. Rev. Lett. 1998, 81, 4168–4171. [Google Scholar]
- Srajer, G.; Pindak, R.; Waugh, M.A.; Goodby, J.W. Structural measurements on the liquid crystal analog of the abrikosov phase. Phys. Rev. Lett. 1990, 64, 1545–1548. [Google Scholar]
- Hardouin, F.; Achard, M.F.; Jin, J.-I.; Shin, J.-W.; Yun, Y.-K. Novel sequence with incommensurate SA phases in a new dimesogenic liquid crystal. J. Phys. II 1994, 4, 627–643. [Google Scholar]
- Renn, S.R. Multicritical behavior of abrikosov vortex lattices near the chilesteric smectic A smectic C* point. Phys. Rev. A 1992, 45, 953–973. [Google Scholar]
- Nugyen, H.T.; Bouchta, A.; Navailles, L.; Barois, P.; Isaert, N.; Twieg, R.J.; Maaroufi, A.; Destrade, C. TGBA phases and TGBC phases in some chiral tolan derivatives. J. Phys. II 1992, 2, 1889–1906. [Google Scholar]
- Navailles, L.; Pindak, R.; Barois, P.; Nugyen, H.T. Structural study of the smectic C Twist Grain Boundary phase. Phys. Rev. Lett. 1995, 74, 5224–5227. [Google Scholar]
- Lubensky, T.C.; Renn, S.R. Twist Grain Boundary phases near the nematic—Smectic A–smectic C point in liquid crystals. Phys. Rev. A 1990, 41, 4392–4401. [Google Scholar]
- Booth, C.J.; Goodby, J.W.; Toyne, K.J.; Dunmur, D.A.; Kang, J.S. The influence of lateral fluoro-substituents on TGB phases in chiral propiolates. Mol. Cryst. Liq. Cryst. 1995, 260, 39–50. [Google Scholar]
- Lagerwall, S.T. Ferroelectric and Antiferroelectric Liquid Crystals; Wiley-VCH: Weinheim, Germany, 1999. [Google Scholar]
- Musevic, I.; Blinc, R.; Zeks, B. The Physics of Ferroelectric and Antiferroelectric Liquid Crystals; World Scientific: Singapore, 2000. [Google Scholar]
- Meyer, R.B.; Liebert, L.; Strzelecki, L.; Keller, P. Ferroelectric liquid crystals. J. Phys. Lett. 1975, 36, L69–L71. [Google Scholar]
- Clark, N.A.; Lagerwall, S.T. Submicrosecond bistable electro-optic switching in liquid crystals. Appl. Phys. Lett. 1980, 36, 899–901. [Google Scholar]
- Zeks, B. Landau free energy expansion for chiral ferroelectric smectic liquid crystals. Mol. Cryst. Liq. Cryst. 1984, 114, 259–270. [Google Scholar]
- Carlsson, T.; Zeks, B.; Levstik, A.; Filipic, C.; Levstik, I.; Blinc, R. Generalized landau model of ferroelectric liquid crystals. Phys. Rev. A 1987, 36, 1484–1487. [Google Scholar]
- Giesselmann, F.; Zugenmaier, P. Mean field coefficients and the electroclinic effect of a ferroelectric liquid crystal. Phys. Rev. E 1995, 52, 1762–1772. [Google Scholar]
- Giesselmann, F.; Heimann, A.; Zugenmaier, P. Experimental determination of landau expansion coefficients in ferroelectric liquid crystals. Ferroelectrics 1997, 200, 237–256. [Google Scholar]
- Archer, P.; Dierking, I. Experimental determination of the full landau potential of bent-core doped ferroelectric liquid crystals. Phys. Rev. E 2005, 72, 041713:1–041713:10. [Google Scholar]
- Archer, P.; Dierking, I. Quantitative experimental determination of the landau potential of chiral enantiomer doped ferroelectric liquid crystals. Eur. Phys. J. E 2005, 18, 373–381. [Google Scholar]
- Archer, P.; Dierking, I.; Hird, M. Determination of the landau potential of chiral enantiomer ferroelectric liquid crystal mixtures. Soft Matter 2007, 3, 207–213. [Google Scholar]
- Archer, P.; Dierking, I.; Görtz, V.; Goodby, J.W. Probing the material properties and phase transitions of ferroelectric liquid crystals by determination of the landau potential. Eur. Phys. J. E. 2008, 25, 385–393. [Google Scholar]
- Bruckner, J.R.; Porada, J.H.; Dietrich, C.F.; Dierking, I.; Giesselmann, F. A lyotropic chiral smectic C liquid crystal with polar electrooptic switching. Angew. Chem. Int. Ed. 2013, 52, 8934–8937. [Google Scholar]
- Lagerwall, S.T. The electroclinic effect. In The Optics of Thermotropic Liquid Crystals; Elston, S.J., Sambles, J.R., Eds.; Taylor & Francis: London, UK, 1998. [Google Scholar]
- Garoff, S.; Meyer, R.B. Electroclinic effect at the A–C phase change in a chiral smectic liquid crystal. Phys. Rev. Lett. 1977, 38, 848–851. [Google Scholar]
- Garoff, S.; Meyer, R.B. Electroclinic effect at the A–C phase change in a chiral smectic liquid crystal. Phys. Rev. A 1979, 19, 338–347. [Google Scholar]
- Li, Z.; Petschek, R.G.; Rosenblatt, C. Linear electroclinic effect in a chiral nematic liquid crystal. Phys. Rev. Lett. 1989, 62, 796–799. [Google Scholar]
- Li, Z.; Di Lisi, G.A.; Petschek, R.G.; Rosenblatt, C. Nematic electroclinic effect. Phys. Rev. A 1990, 41, 1997–2004. [Google Scholar]
- Dierking, I.; Rudquist, P.; Komitov, L.; Lagerwall, S.T.; Stebler, B. Investigation on the flexoelectric and electroclinic effect in a cholesteric phase with twist inversion. Mol. Cryst. Liq. Cryst. 1997, 304, 389–402. [Google Scholar]
- Chandani, A.D.L.; Hagiwara, T.; Suzuki, Y.; Ouchi, Y.; Takezoe, H.; Fukuda, A. Tristable switching in surface stabilized ferroelectric liquid crystals with a large spontaneous polarization. Jpn. J. Appl. Phys. Lett. 1988, 27, L729–L732. [Google Scholar]
- Johno, M.; Chandani, A.D.L.; Ouchi, Y.; Takezoe, H.; Fukuda, A.; Ichihashi, M.; Furukawa, K. Novel phases exhibiting tristable switching. Jpn. J. Appl. Phys. Lett. 1989, 28, L1261–L1264. [Google Scholar]
- Chandani, A.D.L.; Gorecka, E.; Ouchi, Y.; Takezoe, H.; Fukuda, A. Antiferroelectric chiral smectic phases responsible for the tristable switching in MHPOBC. Jpn. J. Appl. Phys. Lett. 1989, 28, L1265–L1268. [Google Scholar]
- Fukuda, A.; Takanishi, Y.; Isozaki, T.; Ishikawa, K.; Takezoe, H. Antiferroelectric chiral smectic liquid crystals. J. Mater. Chem. 1994, 4, 997–1016. [Google Scholar]
- Nugyen, H.T.; Rouillon, J.C.; Cluzeau, P.; Sigaud, G.; Destrade, C.; Isaert, N. New chiral thiobenzoate series with antiferroelectric mesophases. Liq. Cryst. 1994, 17, 571–583. [Google Scholar]
- Pelzl, G.; Diele, S.; Weissflog, W. Banana-shaped compounds—A new field of liquid crystals. Adv. Mater 1999, 11, 707–724. [Google Scholar]
- Takezoe, H.; Takanishi, Y. Bent-core liquid crystals: Their mysterious and attractive world. Jpn. J. Appl. Phys. 2006, 45, 597–625. [Google Scholar]
- Link, D.R.; Natale, G.; Shao, R.; Maclennan, J.E.; Clark, N.A.; Korblova, E.; Walba, D.M. Spontaneous formation of macroscopic chiral domains in a fluid smectic phase of achiral molecules. Science 1997, 278, 1924–1927. [Google Scholar]
- Gorecka, E.; Cepic, M.; Mieczkowski, J.; Nakata, M.; Takezoe, H.; Zeks, B. Enhanced chirality by adding achiral molecules into the chiral system. Phys. Rev. E 2003, 67, 061704:1–061704:5. [Google Scholar]
- Nakata, M.; Takanishi, Y.; Watanabe, J.; Takezoe, H. Blue Phases induced by doping chiral nematic liquid crystals with nonchiral molecules. Phys. Rev. E 2003, 68, 041710:1–041710:6. [Google Scholar]
- Archer, P.; Dierking, I. Chirality enhancement through addition of achiral molecules. Chem. Comm. 2010, 46, 1467–1469. [Google Scholar]


© 2014 by the authors; licensee MDPI, Basel, Switzerland. This article is an open access article distributed under the terms and conditions of the Creative Commons Attribution license ( http://creativecommons.org/licenses/by/3.0/).
Share and Cite
Dierking, I. Chiral Liquid Crystals: Structures, Phases, Effects. Symmetry 2014, 6, 444-472. https://doi.org/10.3390/sym6020444
Dierking I. Chiral Liquid Crystals: Structures, Phases, Effects. Symmetry. 2014; 6(2):444-472. https://doi.org/10.3390/sym6020444
Chicago/Turabian StyleDierking, Ingo. 2014. "Chiral Liquid Crystals: Structures, Phases, Effects" Symmetry 6, no. 2: 444-472. https://doi.org/10.3390/sym6020444
APA StyleDierking, I. (2014). Chiral Liquid Crystals: Structures, Phases, Effects. Symmetry, 6(2), 444-472. https://doi.org/10.3390/sym6020444