
The State of the Art of Photovoltaic Module Cooling Techniques and Performance Assessment Methods


 , and
, and
Abstract
1. Introduction
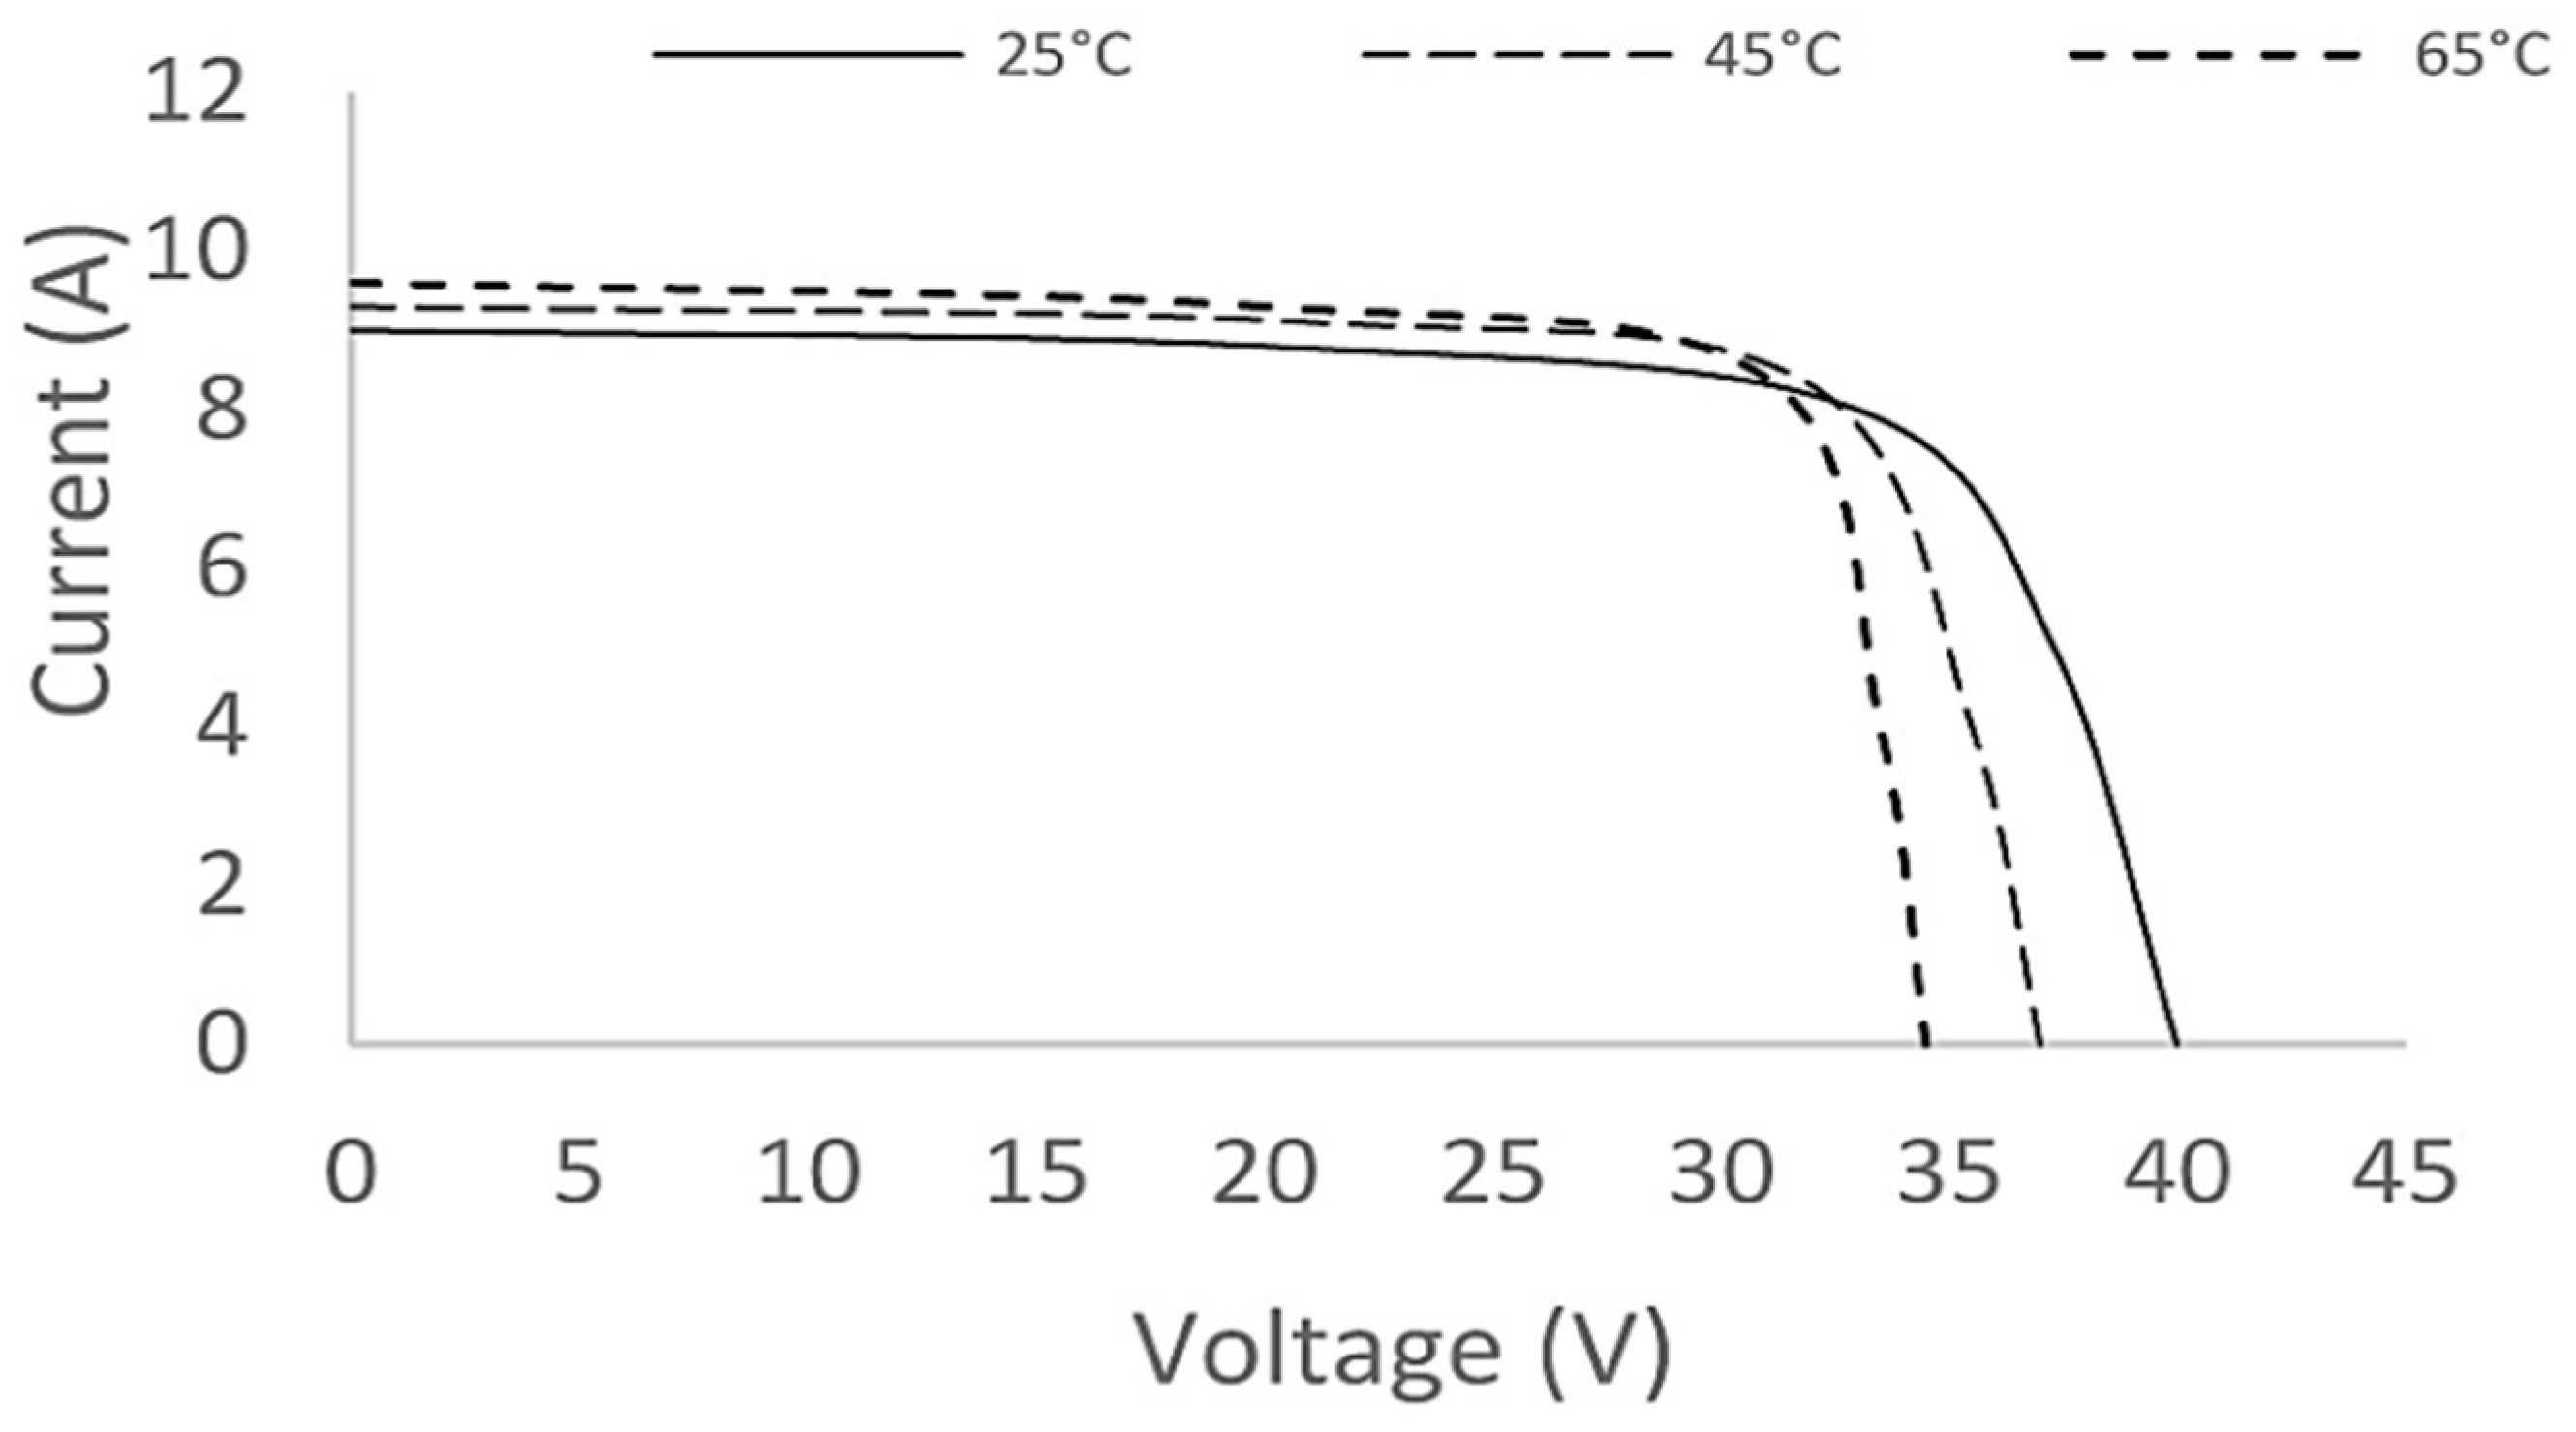
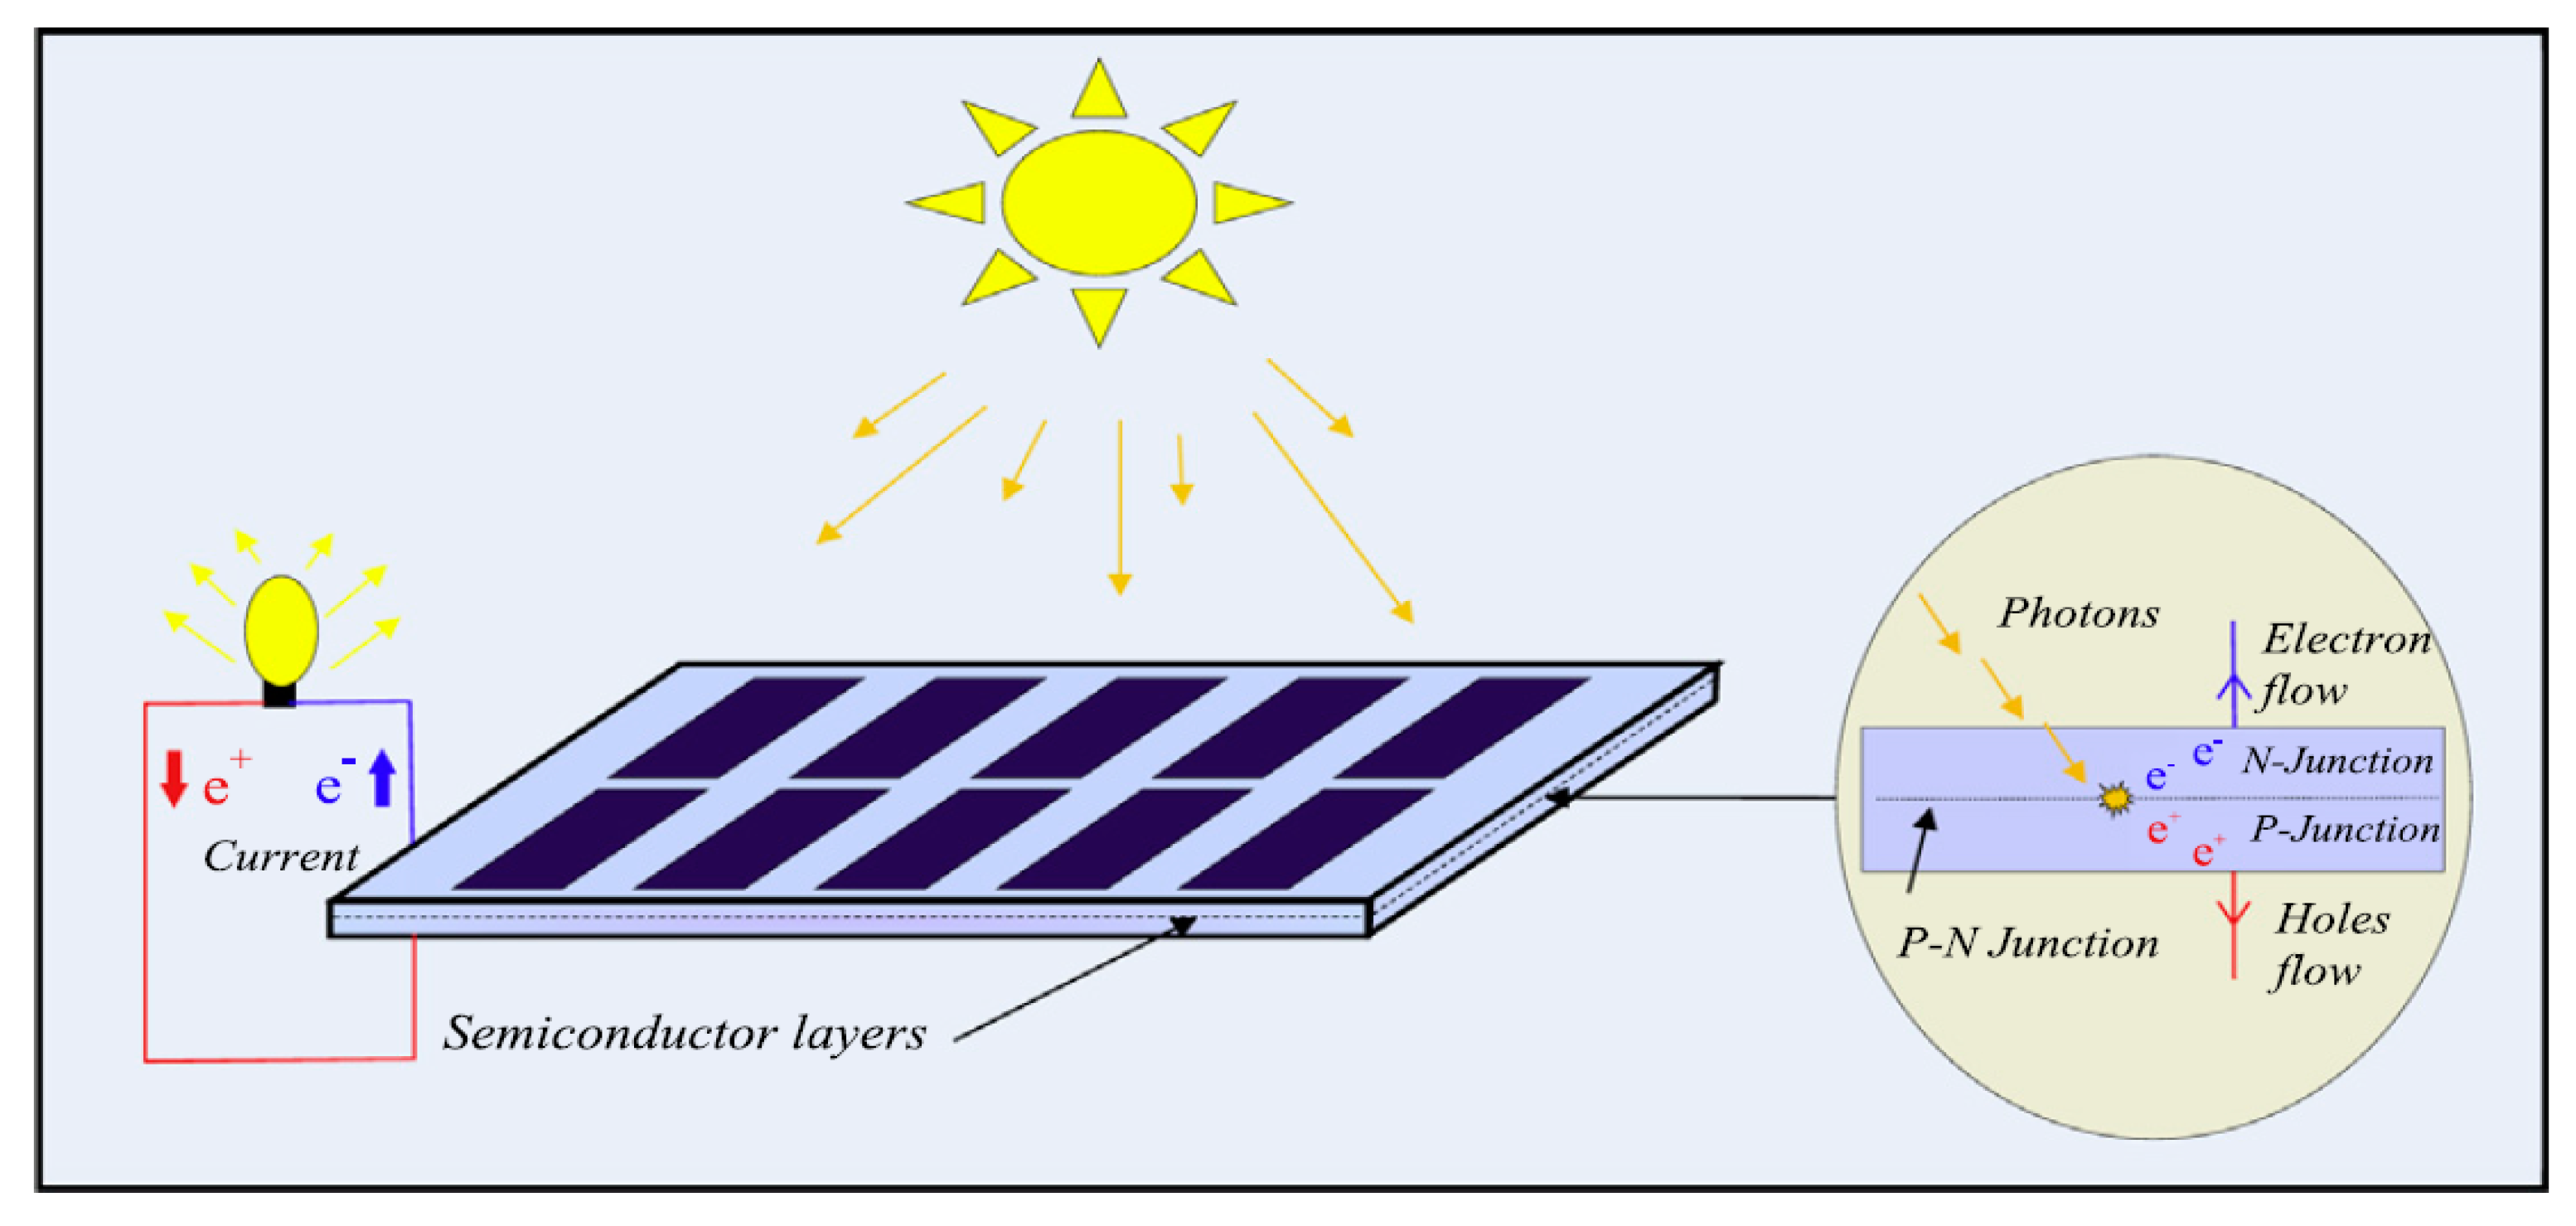
2. PV Technology
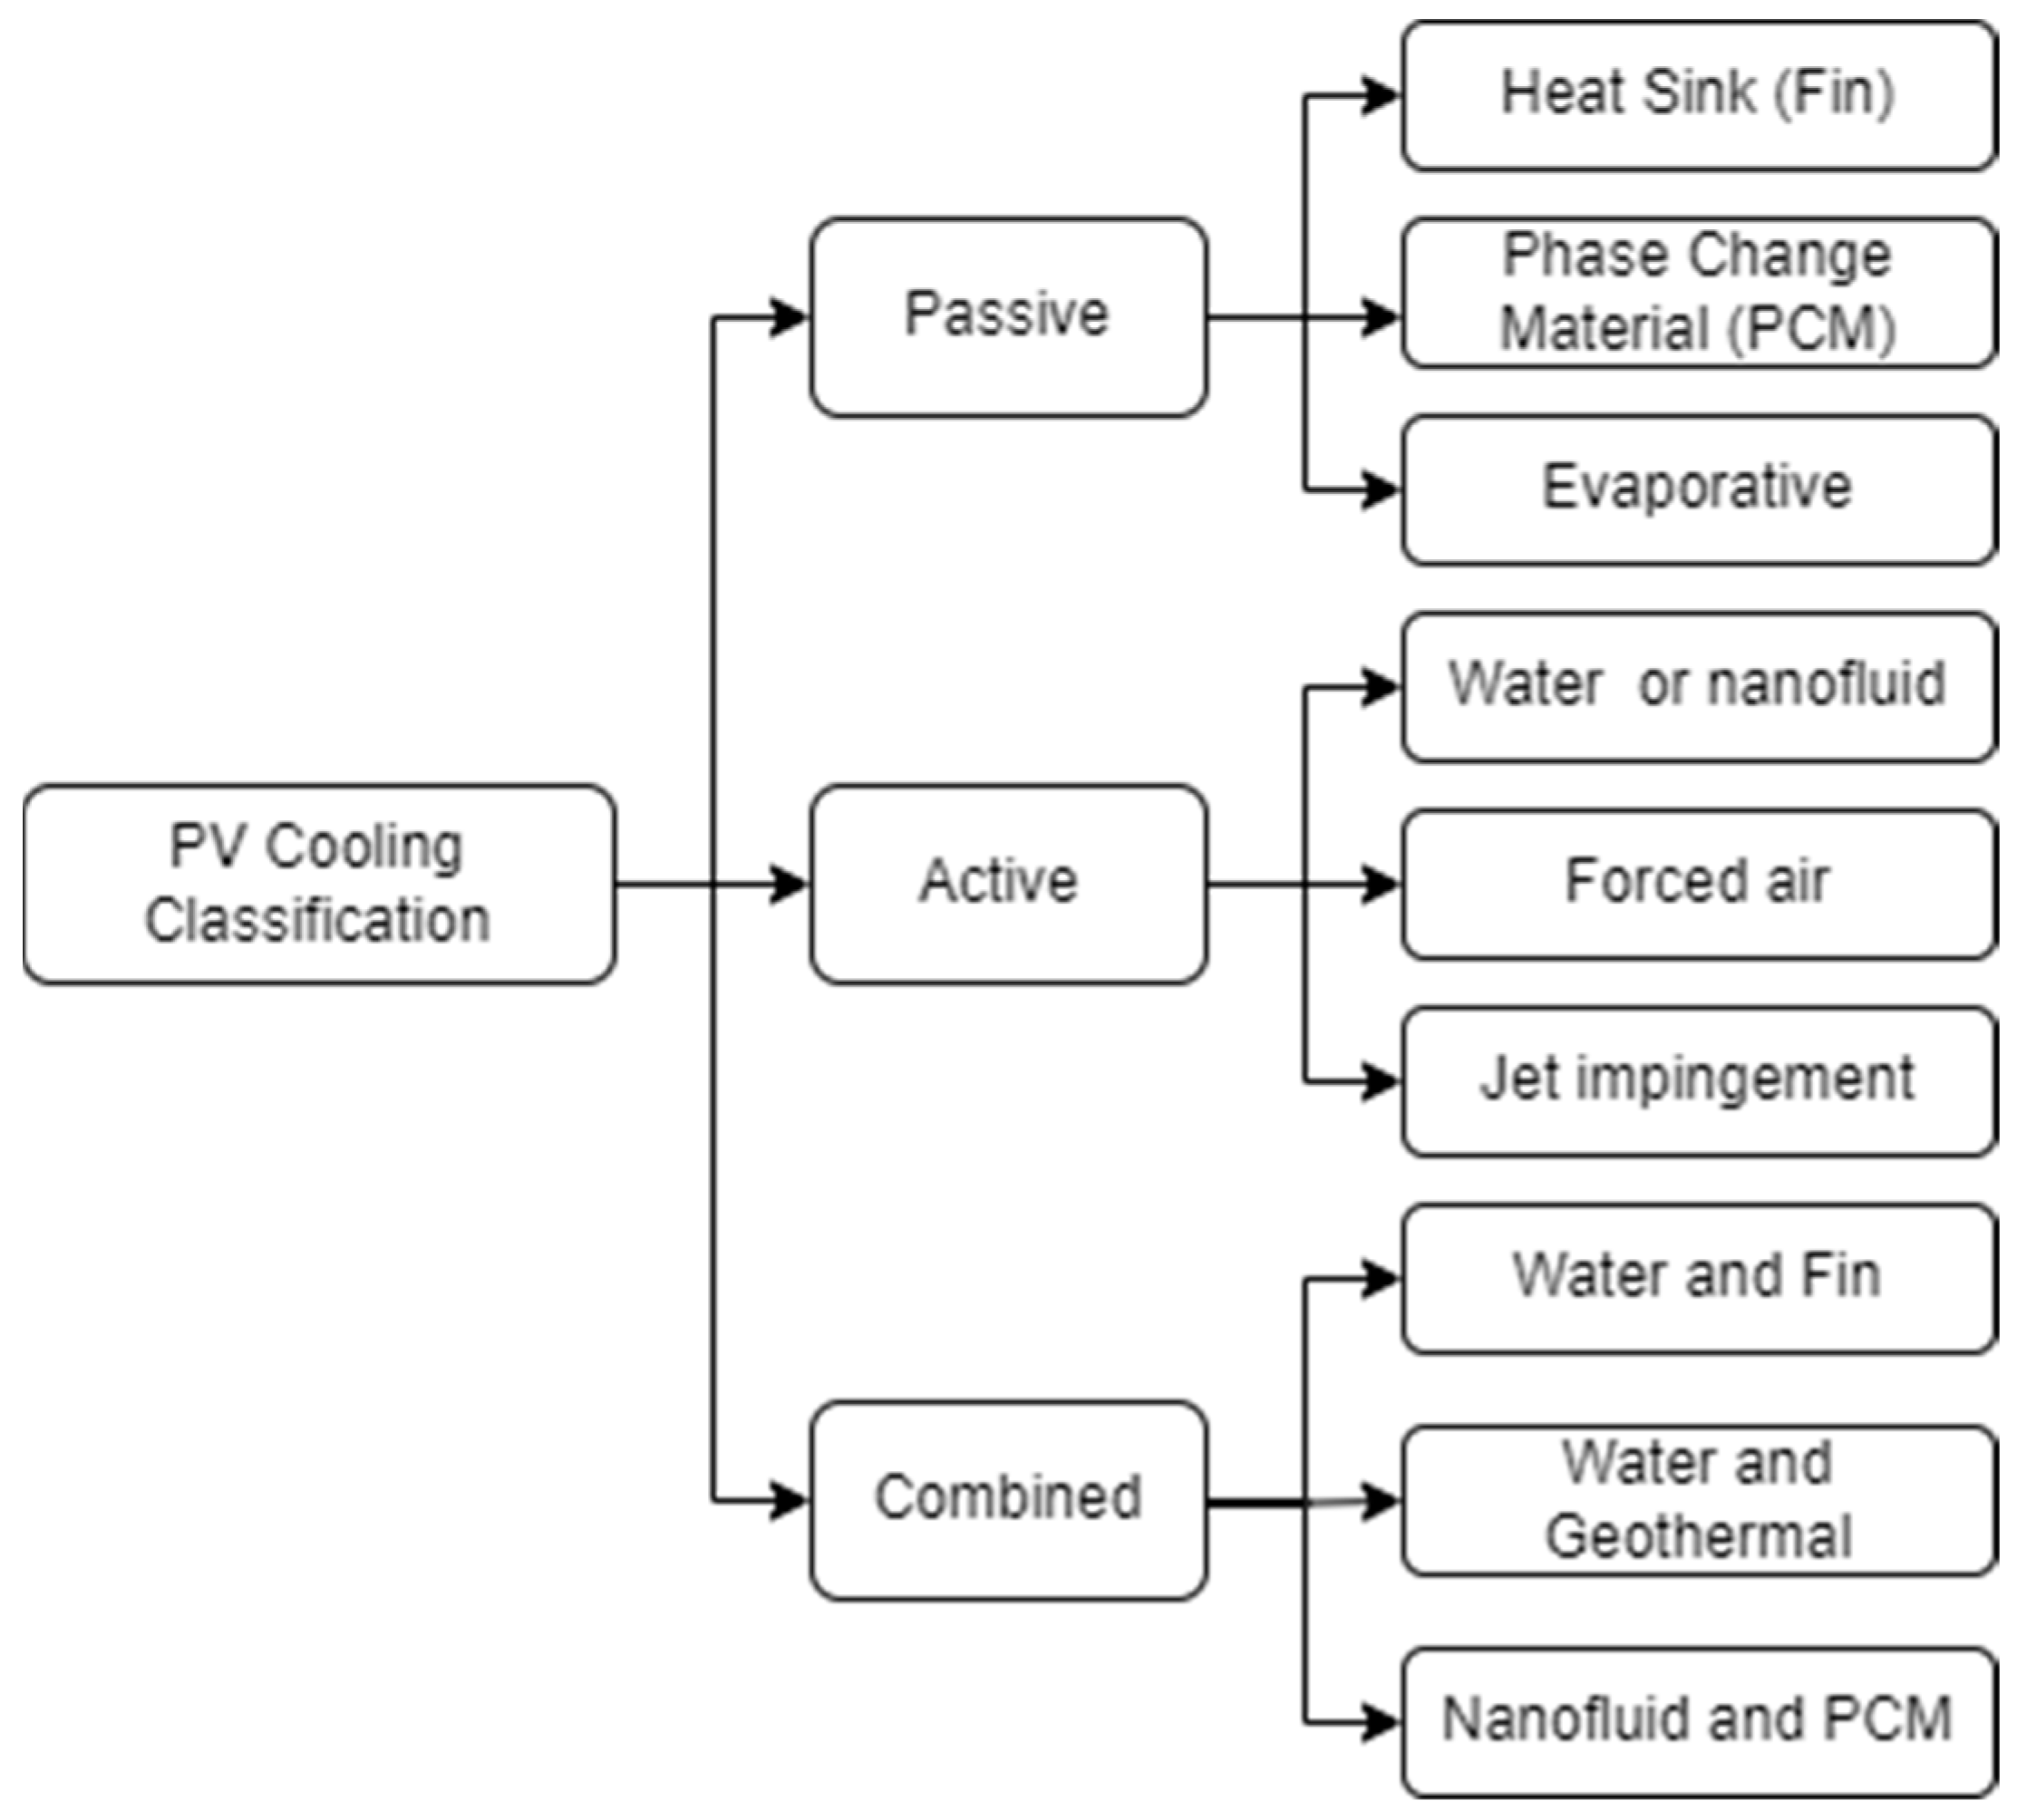
3. PV Cooling
3.1. Passive Cooling
3.1.1. Heat Sink
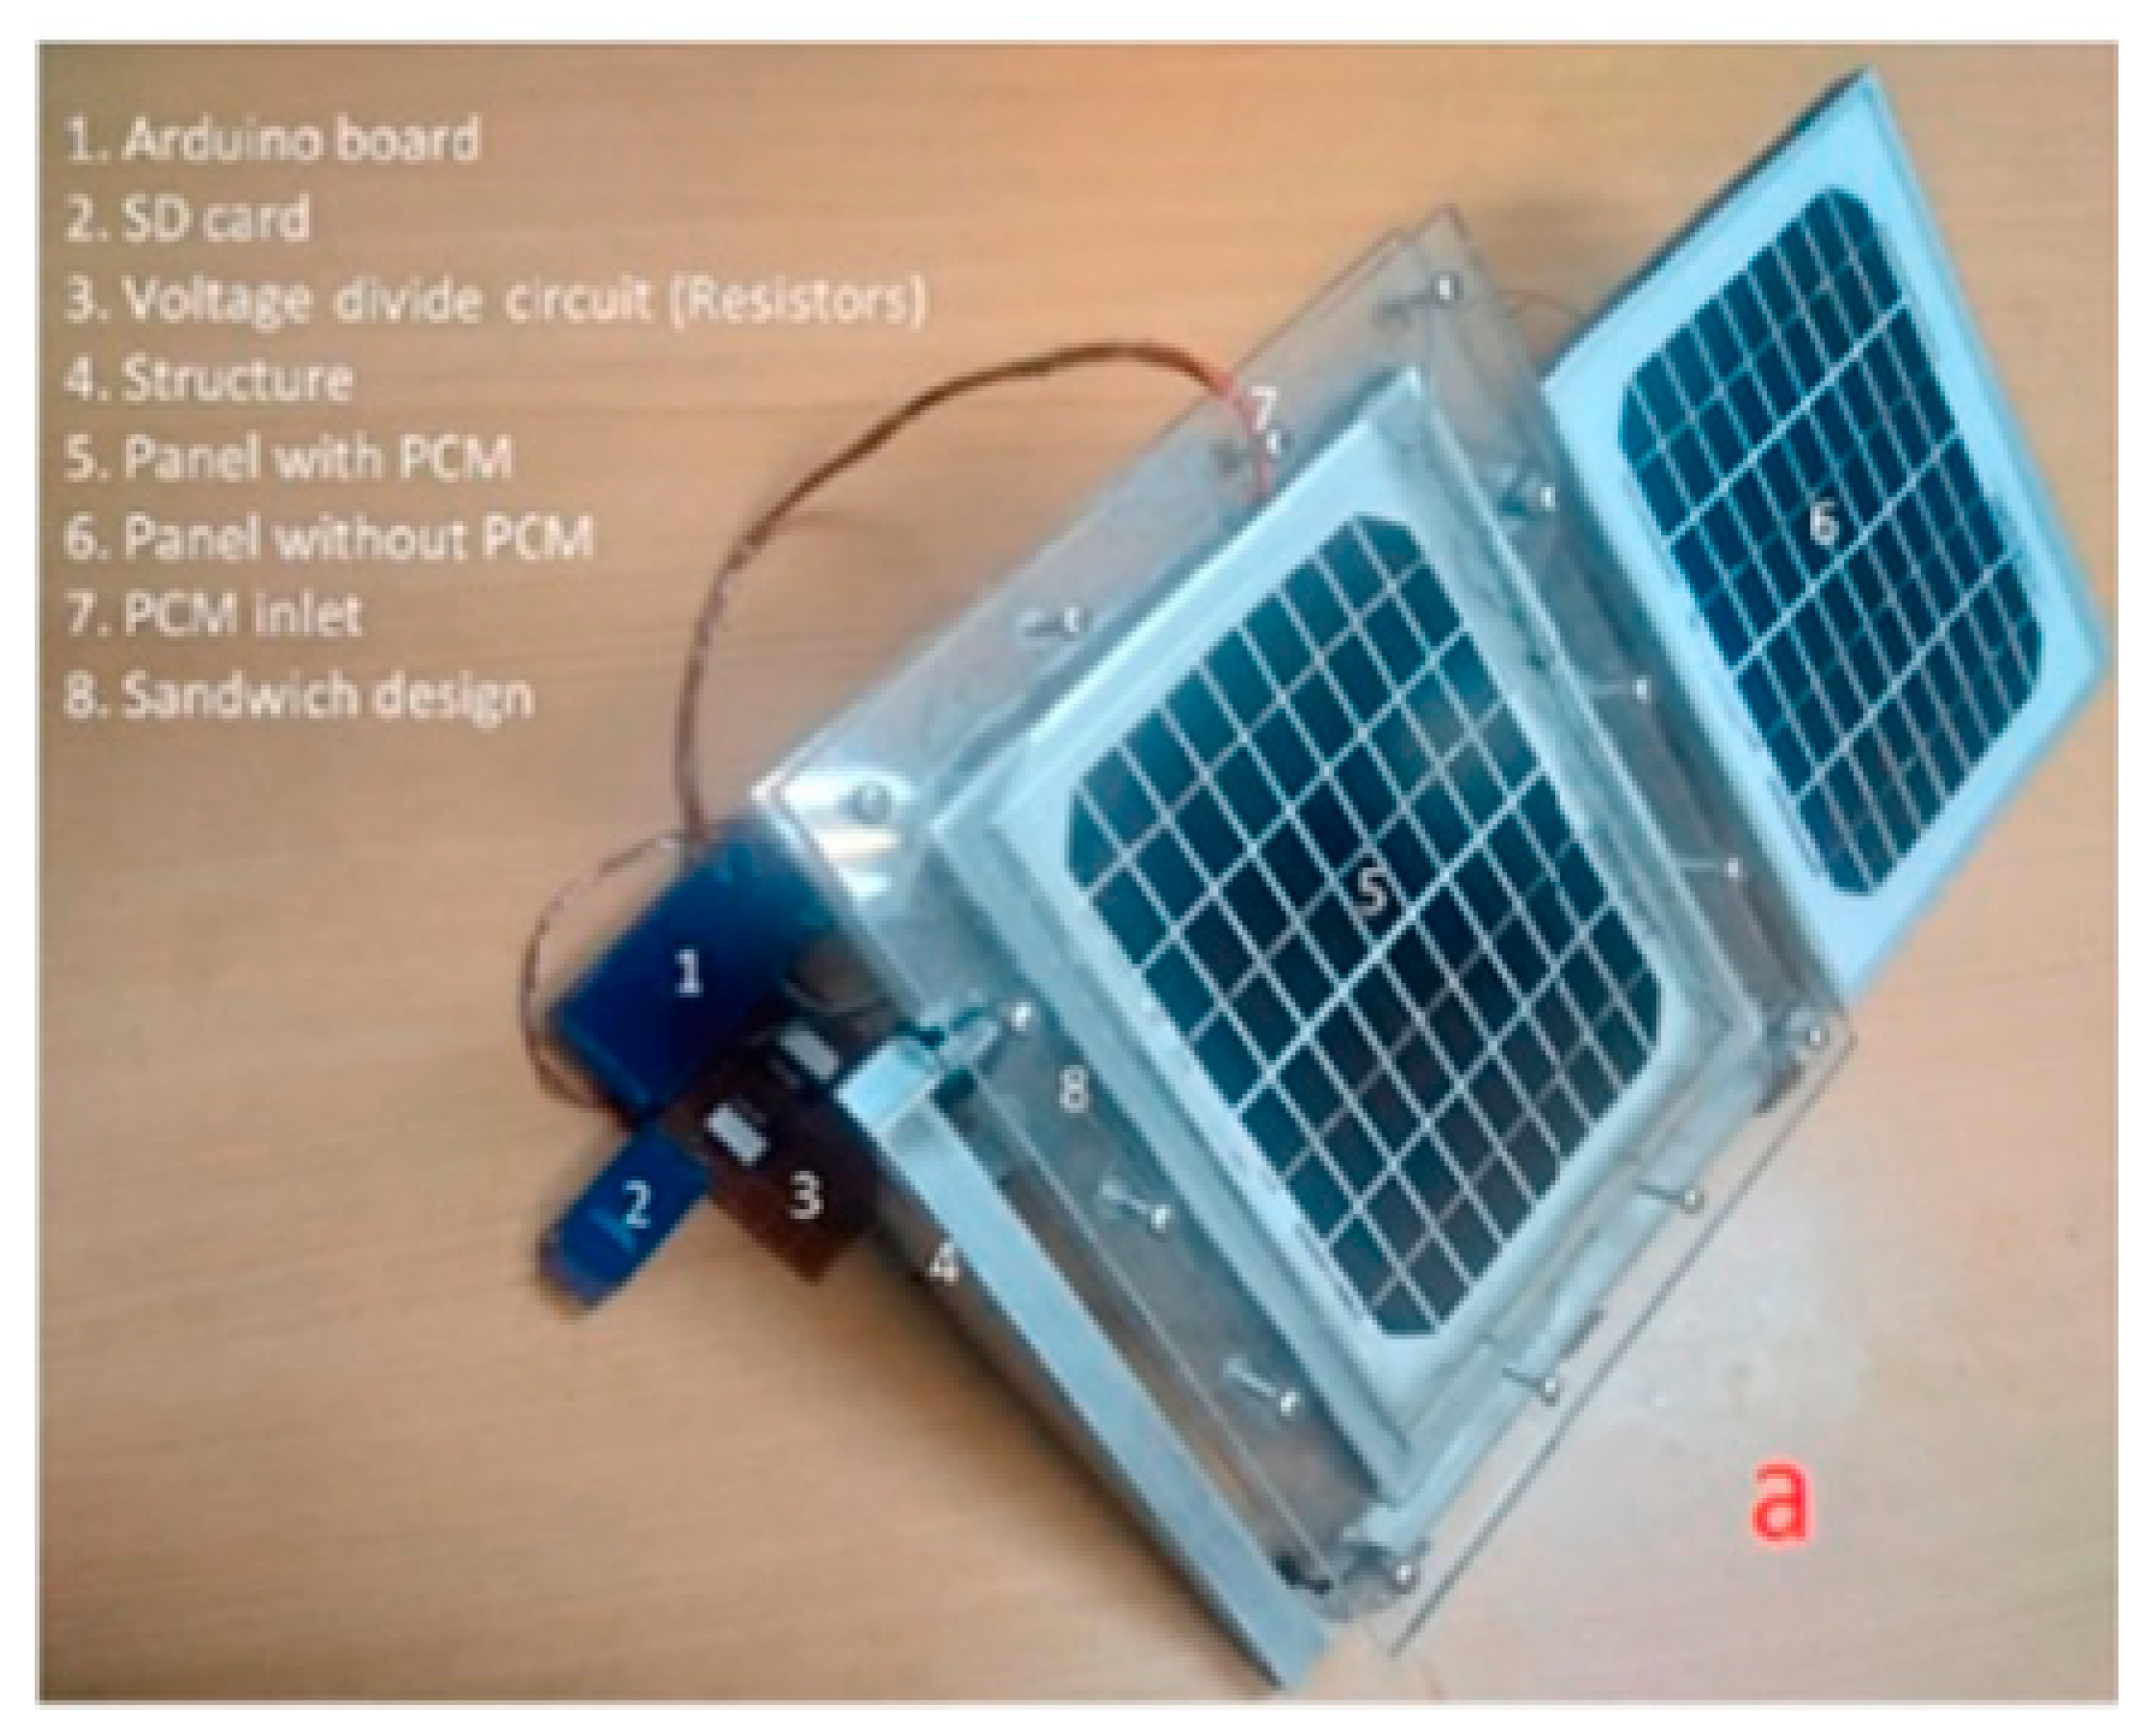
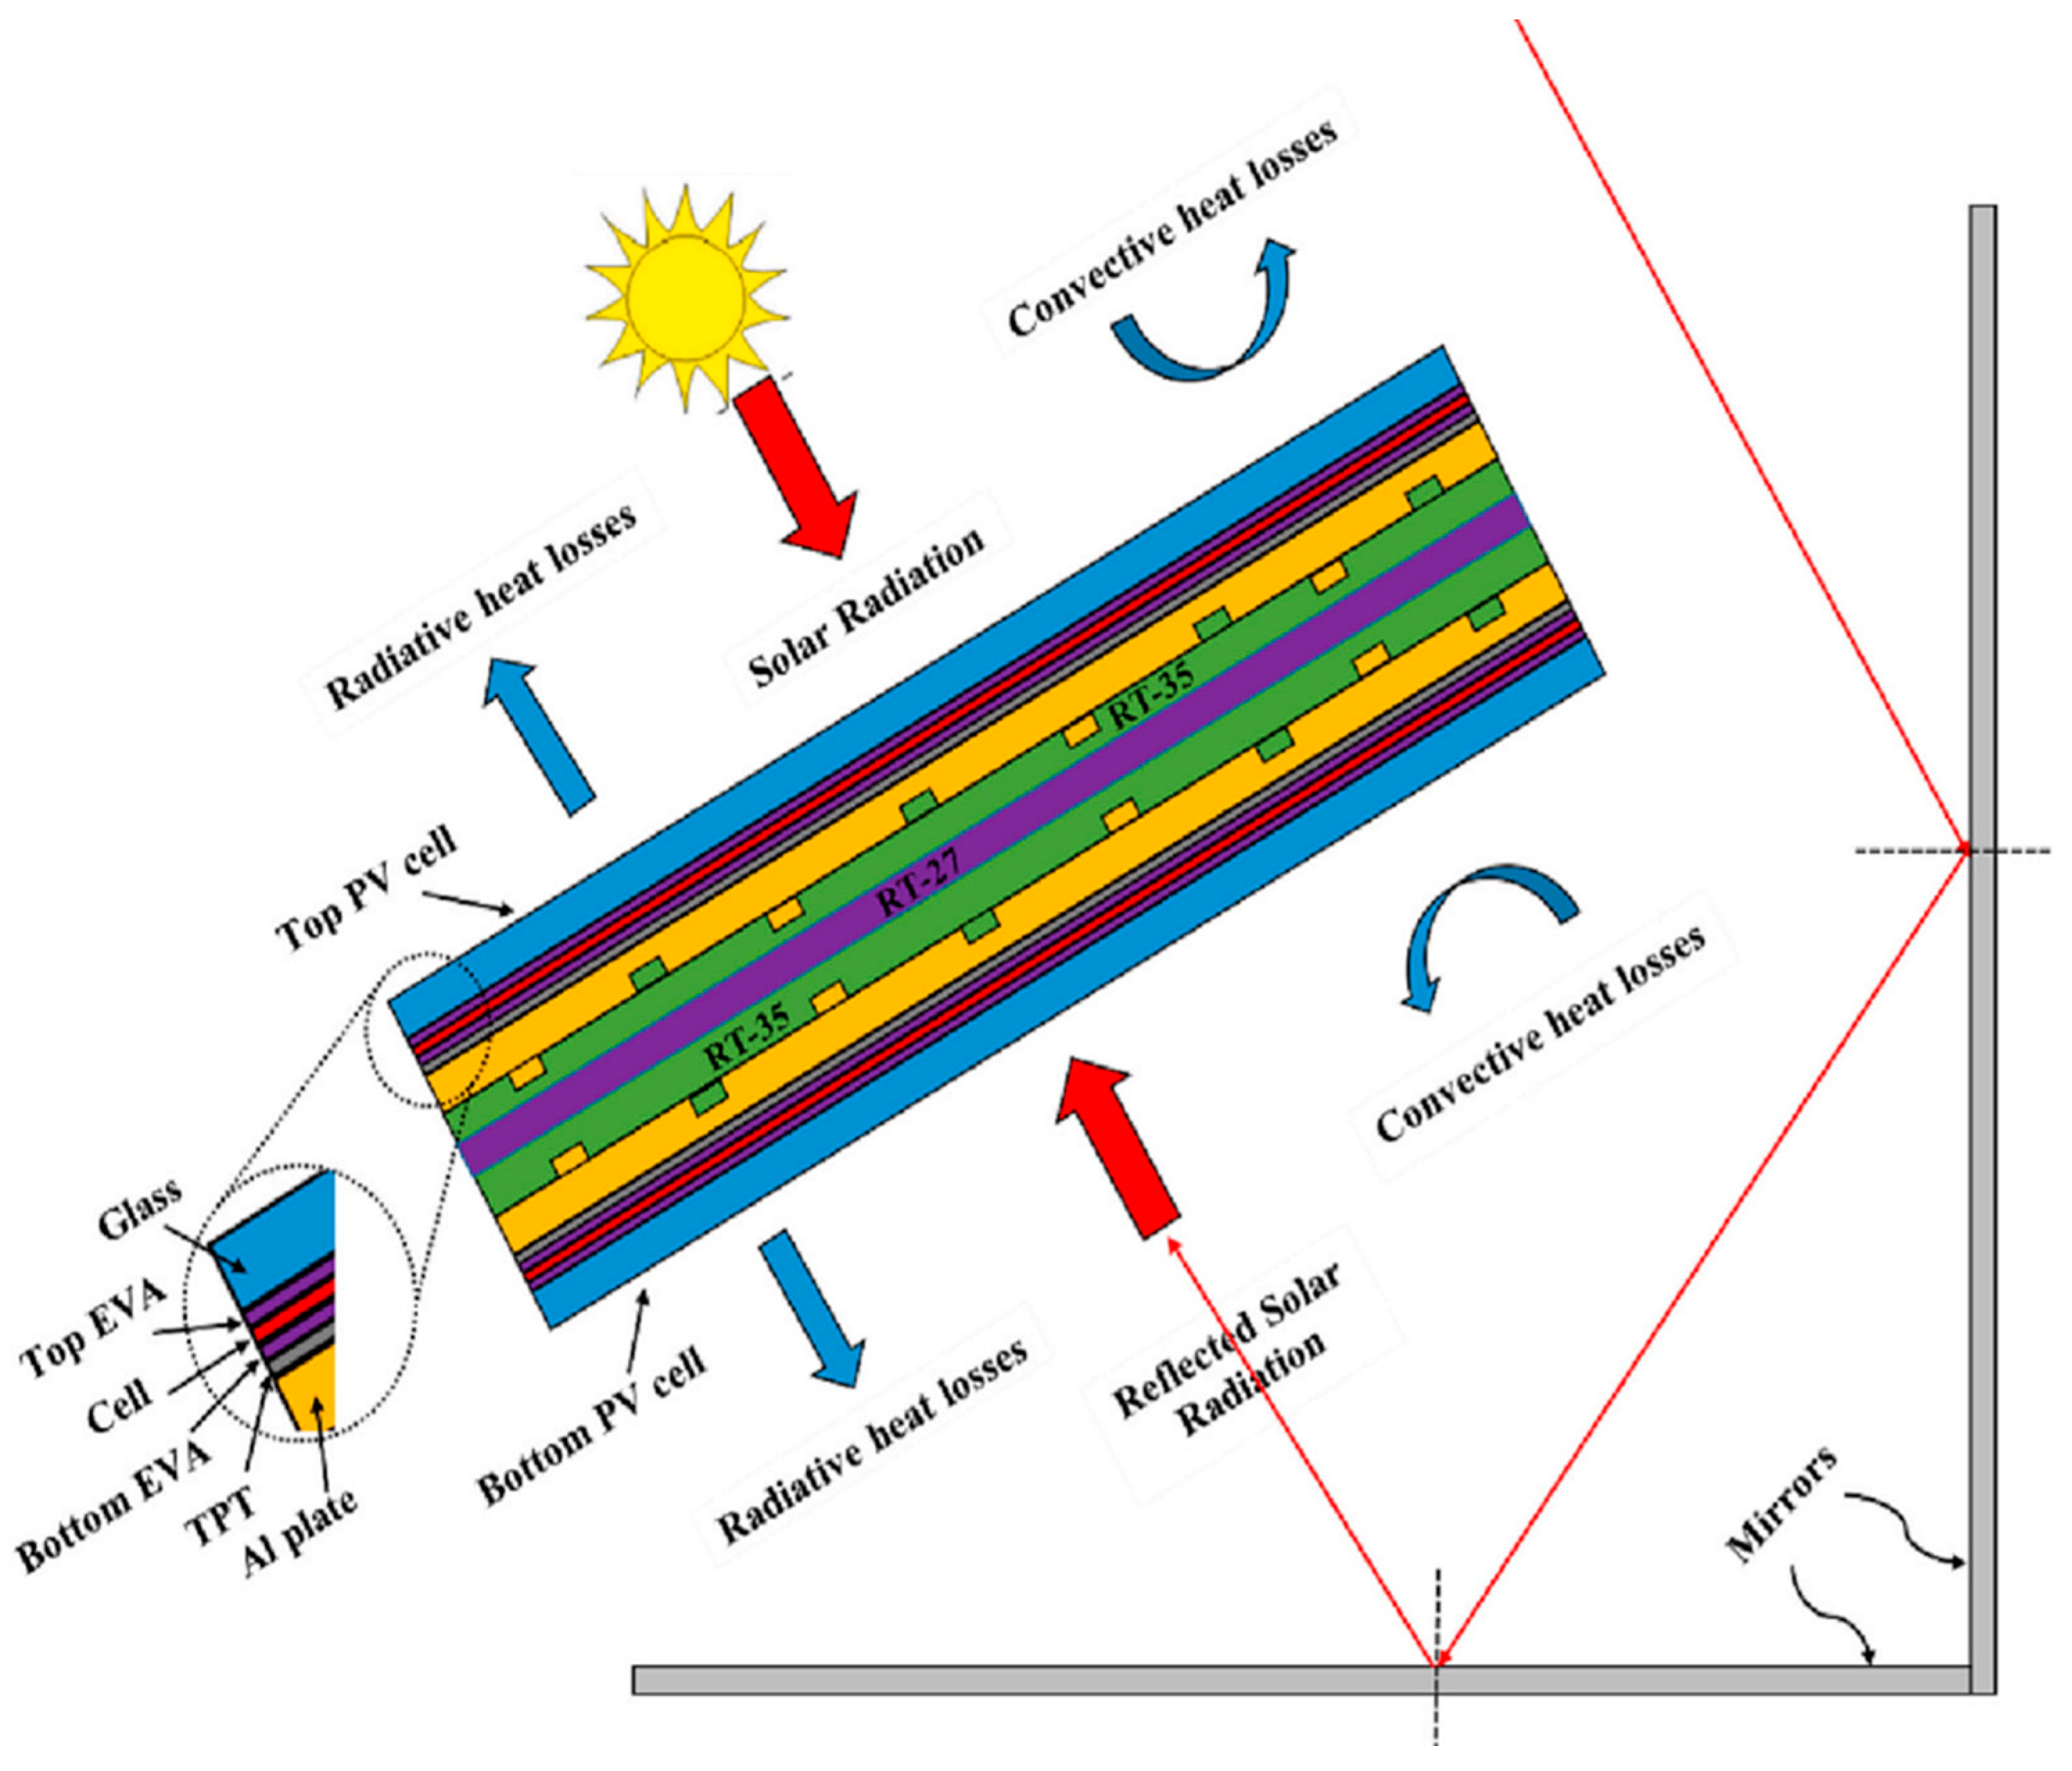
3.1.2. Phase Change Materials (PCMs)
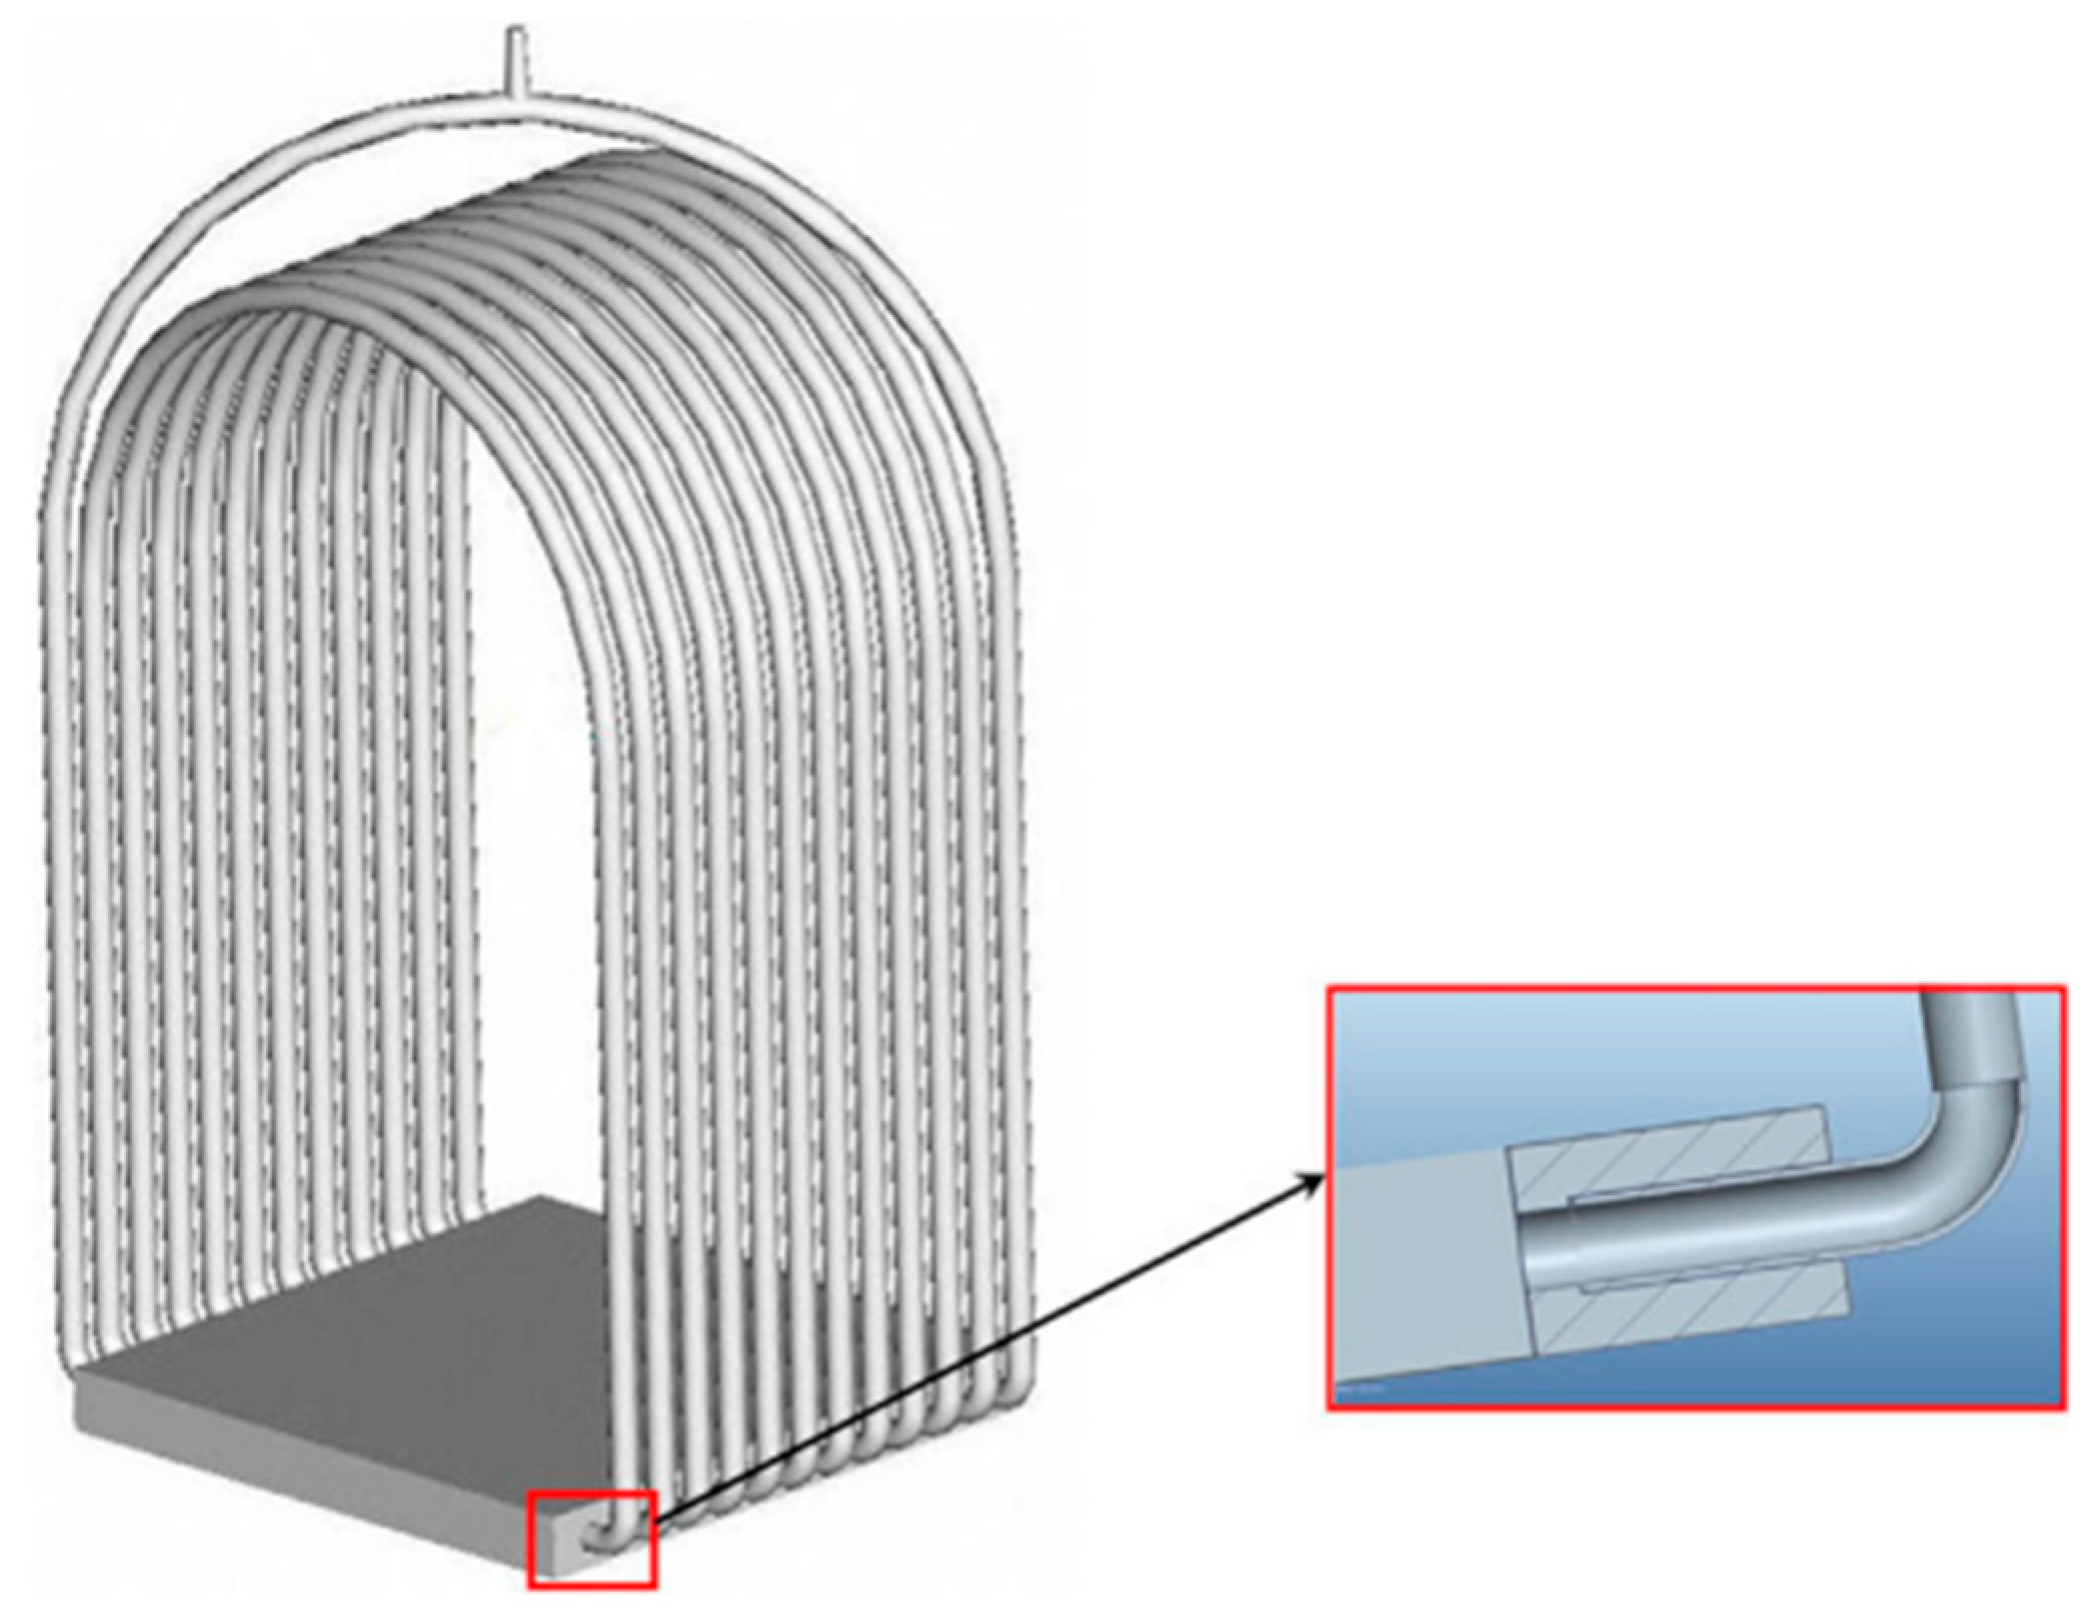
3.1.3. Thermosyphon
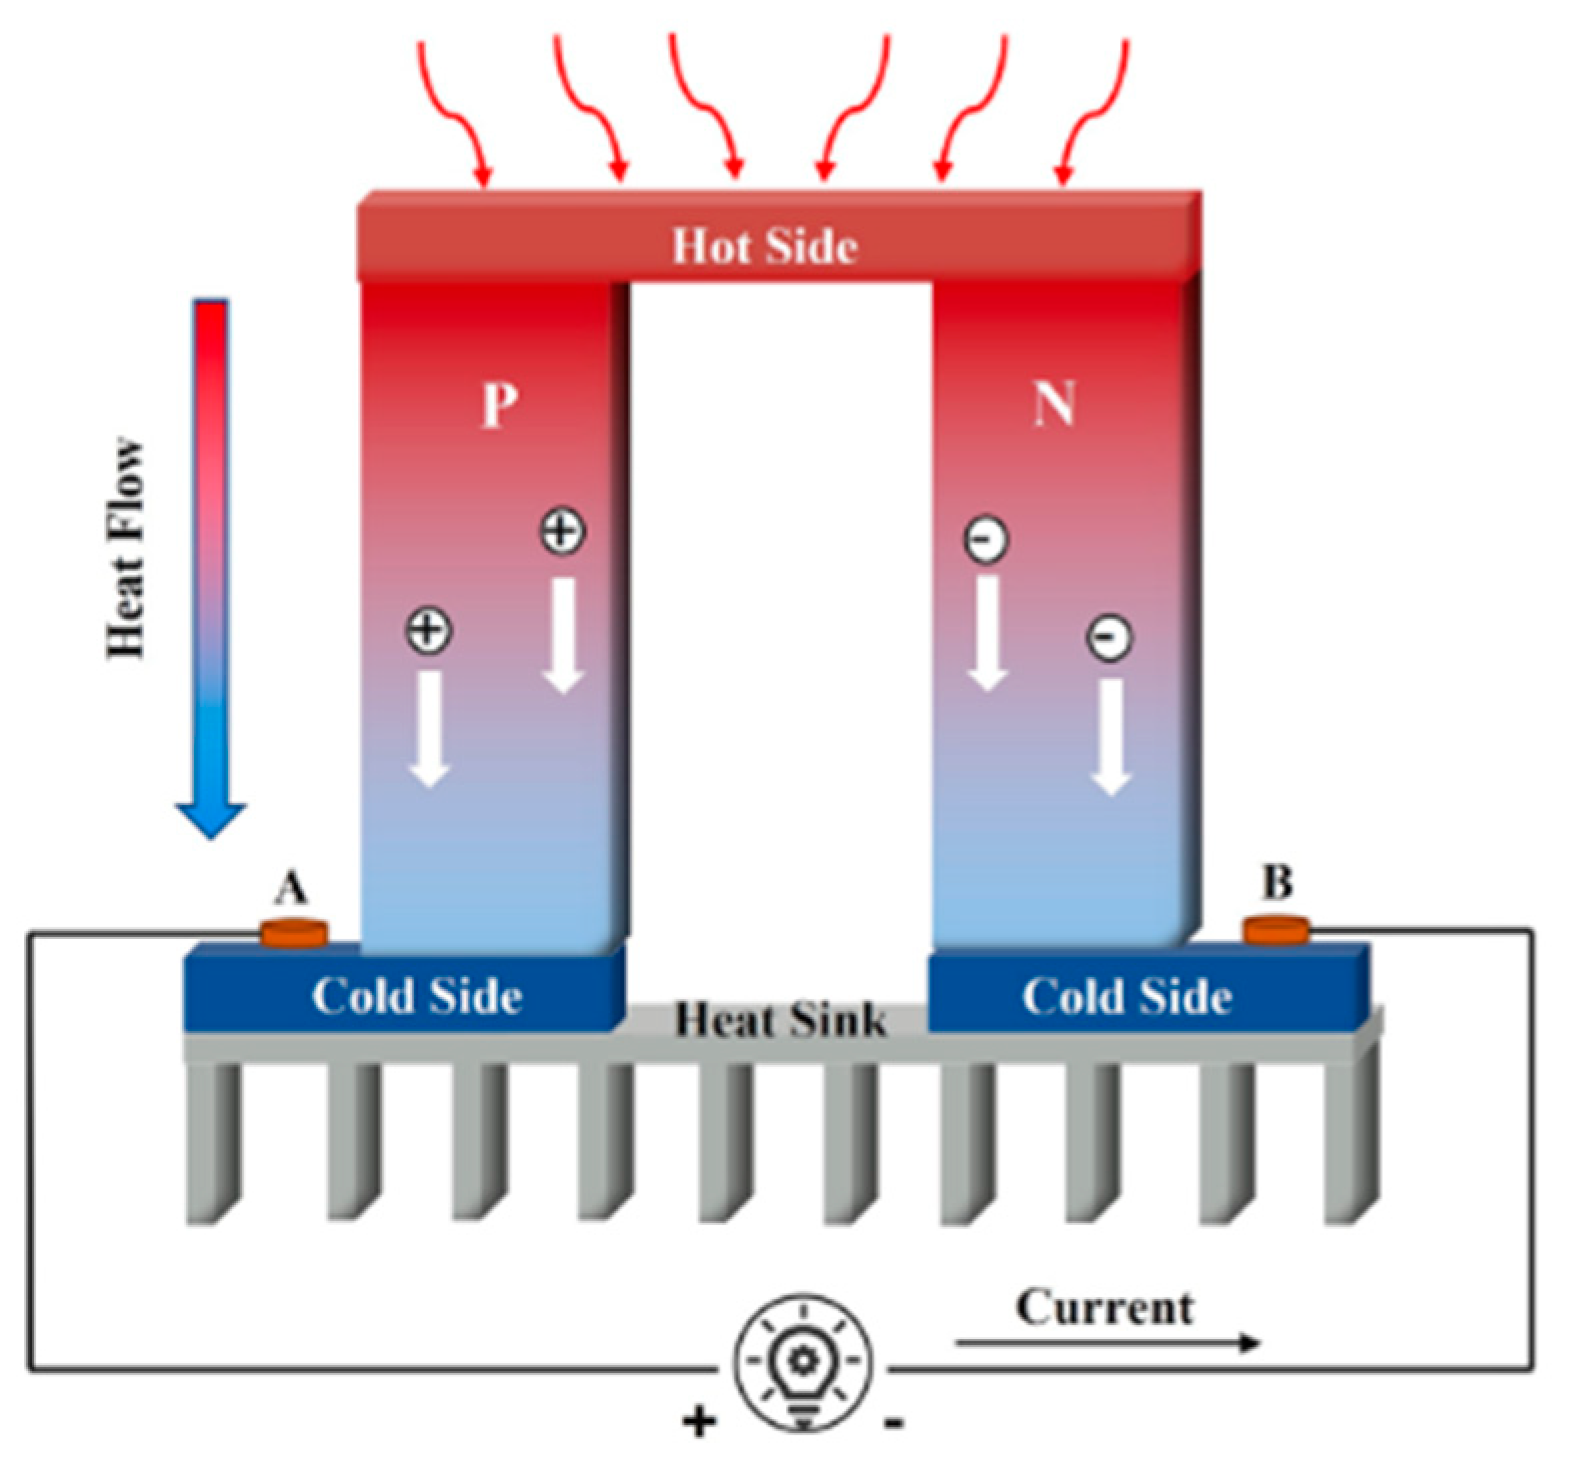
3.1.4. Thermoelectric Generator
3.2. Active Cooling
3.2.1. Water and Nanofluid Cooling (Liquid Cooling)
3.2.2. Air Cooling
3.3. Combined Cooling
3.4. Existing Performance Assessment Methods for PV Cooling Techniques
3.4.1. Production Cost Effectiveness Factor (FCE)
- If FCE > 1, it implies that the PV cooler is not production cost effective.
- If FCE = 1, it implies that the PV cooler is neutral and this is the threshold value.
- If ≤ < 1, it implies that the PV cooler is production cost effective.
3.4.2. Modified Production Cost Effectiveness Factor (FMCE)
- The power output of a single solar cell (Pcell) in the absence of an enhancer.
- The output power from a PV module with an enhancer, PPVCT.
- The quantity, n, of solar cells available in a PV module with an enhancer.
- Z is the manufacturing cost of the PV enhancer.
- The PV power’s one-watt cost, Y.
3.4.3. Temperature-Dependent Efficiency Difference Factor (FTDED)
- If FTDED > 0, it implies the cooling technique contributes to PV efficiency gain.
- If FTDED = 0, it implies the cooling technique contributes neither gain nor loss to the PV efficiency, and it is the threshold value of the gain.
- If FTDED < 0, it implies the cooling technique contributes to PV efficiency loss.
3.4.4. Temperature Dependent Photovoltaic Power Difference Factor (FTDPD)
3.4.5. Power Difference Factor (FED)
- Pcell, which is the power output from a single solar cell in the absence of a cooler.
- The PV output power from a PV module with a cooler, PPVCT.
- The PV output power at STC, PPV,max.
- The available solar cell count in a PV module with a cooler, n.
- The pumping power, Pfc.
- I, which is the solar irradiation.
- ISTC, which is the solar irradiation at 1000 W/m2.
3.4.6. Power Ratio (R)
3.4.7. Lifespan Efficacy Factor (FLSE)
- The PV cooler is considered to be lifespan effective if 0 < FLSE ≤ 1.
- The PV cooler is said to have maximum performance and longevity if FLSE = 1.
- The PV cooler performs the worst and has no lifespan effectiveness if FLSE = 0.
4. Conclusions
Author Contributions
Funding
Conflicts of Interest
Abbreviations
| Nomenclature | |
| β | efficiency decrease per unit increase in temperature, () |
| F | factor, dimensionless |
| I | solar irradiance, (W/m2) |
| L | lifespan, (Year) |
| N | number of solar cells |
| STC | standard test condition |
| P | power, (W) |
| R | ratio, dimensionless |
| T | temperature, (°C) |
| Y | cost of one watt of PV (USD) |
| Z | cost of the cooling technique (USD) |
| Subscripts | |
| CE | photovoltaic module cooling technique production cost effective |
| Cell | photovoltaic cell |
| ED | PV power difference |
| LSE | lifespan effectiveness |
| max | maximum output power |
| min | minimum |
| PV | photovoltaic module |
| PVCT | photovoltaic module with a cooler |
| ref | reference |
| TDED | PV efficiency difference factor |
| TDPD | PV power difference factor |
References
- Nasr, E.A.; Mahmoud, H.A.; El-Meligy, M.A.; Awwad, E.M.; Salunkhe, S.; Naranje, V.; Swarnalatha, R.; Qudeiri, J.E.A. Electrical efficiency investigation on photovoltaic thermal collector with two different coolants. Sustainability 2023, 15, 6136. [Google Scholar] [CrossRef]
- Ibrahim, S.I.; Ali, A.H.; Hafidh, S.A.; Chaichan, M.T.; Kazem, H.A.; Ali, J.M.; Isahak, W.N.R.; Alamiery, A. Stability and thermal conductivity of different nanocomposite material prepared for thermal energy storage applications. South Afr. J. Chem. Eng. 2022, 39, 72–89. [Google Scholar] [CrossRef]
- Al-Maamary, H.M.; Kazem, H.A.; Chaichan, M.T. Climate change: The game changer in the Gulf Cooperation Council region. Renew. Sustain. Energy Rev. 2017, 76, 555–576. [Google Scholar] [CrossRef]
- Dano, U.L.; Abubakar, I.R.; Al-Shihri, F.S.; Ahmed, S.M.; Alrawaf, T.I.; Alshammari, M.S. A Multi-Criteria Assessment of Climate Change Impacts on Urban Sustainability in Dammam Metropolitan Area, Saudi Arabia. Ain. Shams. Eng. J. 2022, 14, 102062. [Google Scholar] [CrossRef]
- Kazem, H.A.; Al-Waeli, A.H.A.; Chaichan, M.T.; Sopian, K.; Ahmed, A.; Wan Nor Roslam, W.I. Enhancement of photovoltaic module performance using passive cooling (Fins): A comprehensive review. Case Stud. Therm. Eng. 2023, 49, 103316. [Google Scholar] [CrossRef]
- Azad, A.K.; Parvin, S. Photovoltaic thermal (PV/T) performance analysis for different flow regimes: A comparative numerical study. Int. J. Thermof. 2023, 18, 100319. [Google Scholar] [CrossRef]
- Al-Waeli, A.H.; Kazem, H.A.; Chaichan, M.T.; Sopian, K. Photovoltaic/Thermal (PV/T) Systems: Principles, Design, and Applications; Springer Nature: Berlin/Heidelberg, Germany, 2019. [Google Scholar]
- Pathak, P.K.; Roy, D.G.; Yadav, A.K.; Padmanaban, S.; Blaabjerg, F.; Khan, B. A State-of-the-Art Review on Heat Extraction Methodologies of Photovoltaic/Thermal System. IEEE Access 2023, 11, 49738–49759. [Google Scholar] [CrossRef]
- Jehad, A.; Alaa, F.; Ahmed, A. Temperature effect on performance of different solar cell technologies. J. Ecol. Eng. 2019, 20, 249–254. [Google Scholar]
- Kazem, H.A. Evaluation of aging and performance of grid-connected photovoltaic system northern Oman: Seven years’ experimental study. Sol. Energy 2021, 207, 1247–1258. [Google Scholar] [CrossRef]
- Suresh, A.K.; Khurana, S.; Nandan Gopal Dwivedi, G.; Kumar, G. Role on nanofluid in cooling solar photovoltaic cell to enhance overall efficiency. Mater. Today Proc. 2018, 5, 20614–20620. [Google Scholar] [CrossRef]
- Bhakre, S.S.; Sawarkar, P.D.; Kalamkar, V.R. Performance evaluation of PV panel surfaces exposed to hydraulic cooling—A review. Sol. Energy 2021, 224, 1193–1209. [Google Scholar] [CrossRef]
- Sajan, P. Water and phase change material based photovoltaic thermal management systems: A review. Renew. Sustain. Energy Rev. 2018, 82, 791–807. [Google Scholar] [CrossRef]
- Elbreki, A.M.; Alghoul, M.A.; Sopian, K.; Hussein, T. Towards adopting passive heat dissipation approaches for temperature regulation of PV module as a sustainable solution. Renew. Sustain. Energy Rev. 2017, 69, 961–1017. [Google Scholar] [CrossRef]
- Bahaidarah, H.M.S.; Baloch, A.A.B.; Gandhidasan, P. Uniform cooling of photo-voltaic panels: A review. Renew. Sustain. Energy Rev. 2016, 57, 1520–1544. [Google Scholar] [CrossRef]
- Ghadikolaei, S.S.C. Solar photovoltaic cells performance improvement by cooling Technology: An overall review. Int. J. Hydrog. Energy 2021, 46, 10939–10972. [Google Scholar] [CrossRef]
- Verma, S.; Mohapatra, S.; Chowdhury, S.; Dwivedi, G. Cooling techniques of the PV module: A review. Mater. Today Proc. 2020, 38, 253–258. [Google Scholar] [CrossRef]
- Glunz, S.; Preu, R. Crystalline silicon solar cells—State-of-the-art and future developments. In Comprehensive Renewable Energy, 2nd ed.; Elsevier: Amsterdam, The Netherlands, 2022; pp. 293–324. [Google Scholar] [CrossRef]
- Rahman, M.M.; Hasanuzzaman, M.; Rahim, N.A. Effects of various parameters on PV-module power and efficiency. Energy Convers. Manag. 2015, 103, 348–358. [Google Scholar] [CrossRef]
- Elnozahy, A.; Abd-Elbary, H.; Abo-Elyousr, F.K. Efficient energy harvesting from PV Panel with reinforced hydrophilic nano-materials for eco-buildings. Energy Built Environ. 2024, 5, 393–403. [Google Scholar] [CrossRef]
- Hu, M.; Zhao, B.; Ao, X.; Cao, J.; Wang, Q.; Riffat, S.; Su, Y.; Pei, G. Effect of the spectrally selective features of the cover and emitter combination on radiative cooling performance. Energy Built Environ. 2021, 2, 251–259. [Google Scholar] [CrossRef]
- Mamun, M.; Islam, M.; Hasanuzzaman, M.; Selvaraj, J. Effect of tilt angle on the performance and electrical parameters of a PV module: Comparative indoor and outdoor experimental investigation. Energy Built Environ. 2022, 3, 278–290. [Google Scholar] [CrossRef]
- Mangkuto, R.A.; Tresna, D.N.A.T.; Hermawan, I.M.; Pradipta, J.; Jamala, N.; Paramita, B.; Atthaillah. Experiment and simulation to determine the optimum orientation of building-integrated photovoltaic on tropical building façades considering annual daylight performance and energy yield. Energy Built Environ. 2024, 5, 414–425. [Google Scholar] [CrossRef]
- Yadav, K.; Kumar, B.; Swaroop, D. Mitigation of mismatch power losses of PV array under partial shading condition using novel odd even configuration. Energy Rep. 2020, 6, 427–437. [Google Scholar] [CrossRef]
- Thoy, E.; Wen, J.; Go, Y.L. Enhancement and validation of building integrated PV system: 3D modelling, techno-economics and environmental assessment. Energy Built Environ. 2021, 3, 444–466. [Google Scholar] [CrossRef]
- Gharzi, M.; Arabhosseini, A.; Gholami, Z.; Rahmati, M.H. Progressive cooling technologies of photovoltaic and concentrated photovoltaic modules: A review of fundamentals, thermal aspects, nanotechnology utilization and enhancing performance. Sol. Energy 2020, 211, 117–146. [Google Scholar] [CrossRef]
- Ahmad, E.; Fazlizan, A.; Jarimi, H.; Sopian, K.; Ibrahim, A. Enhanced heat dissipation of truncated multi-level fi heat sink (MLFHS) in case of natural convection for photovoltaic cooling. Case Stud. Therm. Eng. 2021, 28, 101578. [Google Scholar] [CrossRef]
- Akrouch, M.A.; Chahine, K.; Faraj, J.; Hachem, F.; Castelain, C.; Khaled, M. Advancements in cooling techniques for enhanced efficiency of solar photovoltaic panels: A detailed comprehensive review and innovative classification. Energy Built Environ. 2023; In press. [Google Scholar] [CrossRef]
- Demir, M.; Omeroglu, G.; Ozakın, A.N. Experimental determination of the effect of fins of different cylindrical geometries on electrical and thermal efficiency in an air-cooled PVT system. Heat Tran. Res. 2023, 54, 1–16. [Google Scholar] [CrossRef]
- Marinić-Kragić, I.; Nižetić, S.; Grubišić-Čabo, F.; Čoko, D. Analysis and optimization of passive cooling approach for free-standing PV panel: Introduction of slits. Energy Convers. Manag. 2020, 204, 112277. [Google Scholar] [CrossRef]
- Bayrak, F.; Oztop, H.F.; Selimefendigil, F. Effects of different fin parameters on temperature and efficiency for cooling of photovoltaic panels under natural convection. Sol. Energy 2019, 188, 484–494. [Google Scholar] [CrossRef]
- Ma, T.; Li, Z.; Zhao, J. Photovoltaic panel integrated with phase change materials (PV-PCM): Technology overview and materials selection. Renew. Sustain. Energy Rev. 2019, 116, 109406. [Google Scholar] [CrossRef]
- Nazir, H.; Batool, M.; Bolivar, O.F.J.; Isaza-Ruiz, M.; Xu, X.; Vignarooban, K. Recent developments in phase change materials for energy storage applications: A review. Int. J. Heat Mass Transf. 2019, 129, 491–523. [Google Scholar] [CrossRef]
- Pandey, A.; Hossain, M.; Tyagi, V.; Rahim, N.A.; Jeyraj, A.; Selvaraj, L. Novel approaches and recent developments on potential applications of phase change materials in solar energy. Renew. Sustain. Energy Rev. 2018, 82, 281–323. [Google Scholar] [CrossRef]
- Sandro, N.; Miso, J.; Duje, C.; Müslüm, A. A novel and effective passive cooling strategy for PV panel. Renew. Sustain. Energy Rev. 2021, 145, 111164. [Google Scholar]
- Tian, D.; Shi, T.; Wang, X.; Liu, H.; Wang, X. Magnetic field-assisted acceleration of energy storage based on microencapsulation of phase change material with CaCO3/Fe3O4 composite shell. J. Energy Storage 2022, 47, 103574. [Google Scholar] [CrossRef]
- Rezvanpour, M.; Borooghani, D.; Farschad, T.; Maryam, P. Using CaCl2·6H2O as a phase change material for thermo-regulation and enhancing PV panels’ conversion efficiency experimental study and TRNSYS validation. Renew. Energy 2020, 146, 1907–1921. [Google Scholar] [CrossRef]
- Abo-Elnour, F.; Zeidan, E.B.; Sultan, A.A.; El-Negiry, E.; Soliman, A.S. Enhancing the bifacial PV system by using dimples and multiple PCMs. J. Energy Storage 2023, 70, 108079. [Google Scholar] [CrossRef]
- Ranawade, V.; Nalwa, K.S. Multilayered PCMs-based cooling solution for photovoltaic modules: Modelling and experimental study. Renew. Energy 2023, 216, 119136. [Google Scholar] [CrossRef]
- Maghrabie, H.M.; Mohamed, A.S.A.; Fahmy, A.M.; Samee, A.A.A. Performance enhancement of PV panels using phase change material (PCM): An experimental implementation. Case Stud. Therm. Eng. 2023, 42, 102741. [Google Scholar] [CrossRef]
- Yao, H.; Pu, W.; Wang, J.; Qin, Y.; Qiao, L.; Song, N. A novel thermosyphon cooling applied to concentrated photovoltaic-thermoelectric system for passive and efficient heat dissipation. Appl. Therm. Eng. 2024, 236 Pt A, 121460. [Google Scholar] [CrossRef]
- Moradgholi, M.; Nowee, S.M.; Farzaneh, A. Experimental study of using Al2O3/methanol nanoflui in a two-phase closed thermosyphon (TPCT) array as a novel photovoltaic/thermal system. Sol. Energy 2018, 164, 243–250. [Google Scholar] [CrossRef]
- Wang, H.; Qu, J.; Sun, Q.; Kang, Z.; Han, X. Thermal characteristic comparison of three-dimensional oscillating heat pipes with/without sintered copper particles inside flat-plate evaporator for concentrating photovoltaic cooling. Appl. Therm. Eng. 2020, 167, 114815. [Google Scholar] [CrossRef]
- He, J.; Li, K.; Jia, L.; Zhu, Y.; Zhang, H.; Linghu, J. Advances in the applications of thermoelectric generators. Appl. Therm. Eng. 2024, 236 Pt D, 121813. [Google Scholar] [CrossRef]
- Jaziri, N.; Boughamoura, A.; Müller, J.; Mezghani, B.; Tounsi, F.; Ismail, M. A comprehensive review of Thermoelectric Generators: Technologies and common applications. Energy Rep. 2020, 6, 264–287. [Google Scholar] [CrossRef]
- Champier, D. Thermoelectric generators: A review of applications. Energy Convers. Manag. 2017, 140, 167–181. [Google Scholar] [CrossRef]
- Yin, E.S.; Li, Q.; Xuan, Y.M. Feasibility analysis of a tandem photovoltaic-thermoelectric hybrid system under solar concentration. Renew. Energy 2020, 162, 1828–1841. [Google Scholar] [CrossRef]
- Yaya, L.; Han, X.; Chen, X.; Yao, Y. Maximizing energy output of a vapor chamber-based high concentrated PV-thermoelectric generator hybrid system. Energy 2023, 282, 128882. [Google Scholar] [CrossRef]
- Elbreki, A.M.; Muftah, A.F.; Sopian, K.; Jarimi, H.; Fazlizan, A.; Ibrahim, A. Experimental and economic analysis of passive cooling PV module using fins and planar reflector. Case Stud. Therm. Eng. 2021, 23, 100801. [Google Scholar] [CrossRef]
- Hernandez-Perez, J.G.; Carrillo, J.G.; Bassam, A.; Flota-Banuelos, M.; Patino-Lopez, L.D. A new passive PV heatsink design to reduce efficiency losses: A computational and experimental evaluation. Renew. Energy 2020, 147, 1209–1220. [Google Scholar] [CrossRef]
- Nada, S.A.; El-Nagar, D.H.; Hussein, H.M.S. Improving the thermal regulation and efficiency enhancement of PCM-Integrated PV modules using nano particles. Energy Convers. Manag. 2018, 166, 735–743. [Google Scholar] [CrossRef]
- Elsheniti Mahmoud, B.; Hemedah Moataz, A.; Sorour, M.M.; El-Maghlany Wael, M. Novel enhanced conduction model for predicting performance of a PV panel cooled by PCM. Energy Convers. Manag. 2020, 205, 112456. [Google Scholar] [CrossRef]
- Yesildal, F.; Ozakin, A.N.; Yakut, K. Optimization of operational parameters for a photovoltaic panel cooled by spray cooling. Eng. Sci. Technol. Int. J. 2022, 25, 100983. [Google Scholar] [CrossRef]
- Kemal, B.; Ismail, E. Effects of cooling on performance of photovoltaic/thermal (PV/T) solar panels: A comprehensive. Solar Energy 2023, 262, 111829. [Google Scholar]
- Shamroukh, A.N. Thermal regulation of photovoltaic panel installed in Upper Egyptian conditions in Qena. Therm. Sci. Eng. Prog. 2019, 14, 100438. [Google Scholar] [CrossRef]
- Irwan, Y.M.; Leow, W.Z.; Irwanto, M.; Fareq, M.; Amelia, A.R.; Gomesh, N.; Safwati, I. Indoor test performance of PV panel through water cooling method. Energy Procedia 2015, 79, 604–611. [Google Scholar] [CrossRef]
- Rahimi, M.; Asadi, M.; Karami, N.; Karimi, E. A comparative study on using single and multi-header microchannels in a hybrid PV cell cooling. Energy Convers. Manag. 2015, 101, 1–8. [Google Scholar] [CrossRef]
- Peng, Z.; Herfatmanesh, M.R.; Liu, Y. Cooled solar PV panels for output energy efficiency optimization. Energy Convers. Manag. 2017, 150, 949–955. [Google Scholar] [CrossRef]
- Ebaid, M.S.Y.; Ghrair, A.M.; Al-Busoul, M. Experimental investigation of cooling photovoltaic (PV) panels using (TiO2) nanofluid in water–polyethylene glycol mixture and (Al2O3) nanofluid in water-cetyltrimethylammonium bromide mixture. Energy Convers. Manag. 2018, 155, 324–343. [Google Scholar] [CrossRef]
- Nardi, I.; Ambrosini, I.; Rubeis, T.; Paoletti, D.; Muttillo, M.; Sfarra, S. Energetic performance analysis of a commercial water-based photovoltaic thermal system (PV/T) under summer conditions. J. Phys. Conf. Ser. 2017, 923, 012040. [Google Scholar] [CrossRef]
- Bahaidarah, H.M.S. Experimental performance evaluation and modeling of jet impingement cooling for thermal management of photovoltaics. Sol. Energy 2016, 135, 605–617. [Google Scholar] [CrossRef]
- Maatoug, S.; Moulahi, A.; Bazuhair, N.; Alqarni, S.; Selimefendigil, F.; Aich, W.; Kolsi, L.; Mhimid, A. Pulsating multiple nano-jet impingement cooling system design by using different nanofluids for photovoltaic (PV) thermal management. Case Stud. Therm. Eng. 2023, 41, 102650. [Google Scholar] [CrossRef]
- Kianifard, S.; Zamen, M.; Nejad, A.A. Modeling, designing and fabrication of a novel PV/T cooling system using half pipe. J. Clean. Prod. 2020, 253, 119972. [Google Scholar] [CrossRef]
- Liu, Y.; Chen, Y.; Wang, D.; Liu, J.; Luo, X.; Wang, Y.; Liu, H.; Liu, J. Experimental and numerical analyses of parameter optimization of photovoltaic cooling system. Energy 2020, 215, 119159. [Google Scholar] [CrossRef]
- Pang, W.; Cui, Y.; Zhang, Q.; Yan, H. Building integrated photovoltaic module-based on aluminum substrate with forced water cooling. J. Sol. Energy Eng. 2018, 140, 021005. [Google Scholar] [CrossRef] [PubMed]
- Alihosseini, Y.; Oghabneshin, Y.; Bari, A.R.; Moslemi, S.; Roozbehi, A.R.; Targhi, M.Z.; Guo, W. Performance of high-concentration photovoltaic cells cooled by a hybrid microchannel heat sink. Appl. Therm. Eng. 2024, 238, 122206. [Google Scholar] [CrossRef]
- Elavarasan, R.M.; Mudgal, V.; Selvamanohar, L.; Wang, K.; Huang, G.; Shafiullah, G.M.; Markides, C.N.; Reddy, K.S.; Nadarajah, M. Pathways toward high-efficiency solar photovoltaic thermal management for electrical, thermal and combined generation applications: A critical review. Energy Convers. Manag. 2022, 55, 115278. [Google Scholar] [CrossRef]
- Arifin, Z.; Tjahjana, D.D.D.P.; Hadi, S.; Rachmanto, R.A.; Setyohandoko, G.; Sutanto, B. Numerical and experimental investigation of air cooling for photovoltaic panels using aluminum heat sinks. Int. J. Photoenergy 2020, 2020, 1574274. [Google Scholar] [CrossRef]
- Rahman, N.M.A.; Haw, L.C.; Kamaluddin, K.A.; Abdullah, M.S.I. Investigating photovoltaic module performance using aluminium heat sink and forced cold-air circulation method in tropical climate conditions. Energy Rep. 2023, 9, 2797–2809. [Google Scholar] [CrossRef]
- Hussien, A.; Eltayesh, A.; El-Batsh, H.M. Experimental and numerical investigation for PV cooling by forced convection. Alex. Eng. J. 2023, 64, 427–440. [Google Scholar] [CrossRef]
- Syafiqah, Z.; Irwan, Y.; Amin, N.; Irwanto, M.; Leow, W.; Amelia, A. Thermal and electrical study for PV panel with cooling. Indones. J. Electr. Eng. Comput. Sci. 2019, 7, 492–499. [Google Scholar] [CrossRef]
- Dehghan, M.; Rahgozar, S.; Pourrajabian, A.; Aminy, M.; Halek, F.S. Techno-economic perspectives of the temperature management of photovoltaic (PV) power plants: A case-study in Iran. Sustain. Energy Technol. Assess. 2021, 45, 101133. [Google Scholar] [CrossRef]
- Almuwailhi, A.; Zeitoun, O. Investigating the cooling of solar photovoltaic modules under the conditions of Riyadh. J. King Saud Univers. Eng. Sci. 2023, 35, 123–136. [Google Scholar] [CrossRef]
- Rostami, Z.; Rahimi, M.; Azimi, N. Using high-frequency ultrasound waves and nanofluid for increasing the efficiency and cooling performance of a PV module. Energy Convers. Manag. 2018, 160, 141–149. [Google Scholar] [CrossRef]
- Hadipour, A.; Zargarabadi, M.R.; Rashidi, S. An efficient pulsed-spray water cooling system for photovoltaic panels: Experimental study and cost analysis. Renew. Energy 2021, 164, 867–875. [Google Scholar] [CrossRef]
- Babu, C.; Ponnambalam, P. The theoretical performance evaluation of hybrid PV-TEG system. Energy Convers. Manag. 2018, 173, 450–460. [Google Scholar] [CrossRef]
- Hassan, A.; Wahab, A.; Qasim, M.A.; Janjua, M.M.; Ali, M.A.; Ali, H.M. Thermal management and uniform temperature regulation of PV modules using hybrid phase change materials-nanofluids system. Renew Energy 2020, 145, 282–293. [Google Scholar] [CrossRef]
- Yang, L.-H.; Liang, J.-D.; Hsu, C.-Y.; Yang, T.-H.; Chen, S.-L. Enhanced efficiency of PV panels by integrating a spray cooling system with shallow geothermal energy heat exchanger. Renew. Energy 2019, 134, 970–981. [Google Scholar] [CrossRef]
- Elminshawy, N.A.S.; El Ghandour, M.; Gad, H.M.; El-Damhogi, D.G.; El-Nahhas, K.; Addas, M.F. The performance of a buried heat exchanger system for PV panel cooling under elevated air temperatures. Geothermics 2019, 82, 7–15. [Google Scholar] [CrossRef]
- Idoko, L.; Anaya-Lara, O.; McDonald, A. Enhancing PV modules efficiency and power output using multi-concept cooling technique. Energy Rep. 2018, 4, 357–369. [Google Scholar] [CrossRef]
- Sudhakar, P.; Santosh, R.; Asthalakshmi, B.; Kumaresan, G.; Velraj, R. Performance augmentation of solar photovoltaic panel through PCM integrated natural water circulation cooling technique. Renew. Energy 2021, 172, 1433–1448. [Google Scholar] [CrossRef]
- Agyekum, E.B.; Seepana, P.K.; Naseer, T.A.; Vladimir, I.V.; Sergey, E.S. Effect of dual surface cooling of solar photovoltaic panel on the efficiency of the module: Experimental investigation. Heliyon 2021, 7, e07920. [Google Scholar] [CrossRef]
- Sultan, S.M.; Tso, C.P.; Ervina, E.M.N. A new production cost effectiveness factor for assessing photovoltaic module cooling techniques. Int. J. Energy Res. 2020, 44, 574–583. [Google Scholar] [CrossRef]
- Sultan, S.M.; Tso, C.P.; Ajeel, R.K.; Sobayel, K.; Abdullah, M.Z. A Detailed Analysis of the Modified Economic Method for Assessing the Performance of Photovoltaic Module Enhancing Techniques. Sustainability 2023, 15, 12028. [Google Scholar] [CrossRef]
- Sultan, S.M.; Abdullah, M.Z. A new method for assessing photovoltaic module cooler based on lifespan effectiveness factor. Case Stud. Therm. Eng. 2022, 35, 102126. [Google Scholar] [CrossRef]
- Sultan, S.M.; Tso, C.P.; Ervina, E.M.N. A Proposed temperature-dependent photovoltaic efficiency difference factor for evaluating photovoltaic module cooling techniques in natural or forced fluid circulation mode. Arab. J. Sci. Eng. 2019, 44, 8123–8128. [Google Scholar] [CrossRef]
- Sultan, S.M.; Tso, C.P.; Ervina, E.M.N.; Abdullah, M.Z. Cost and time effective performance evaluation methods for photovoltaic module cooling techniques: Analytical and experimental study. Sol. Energy 2022, 326, 119940. [Google Scholar] [CrossRef]
- Sultan, S.M.; Tso, C.P.; Ervina, E.M.N. A new approach for photovoltaic module cooling technique evaluation and comparison using the temperature dependent photovoltaic efficiency ratio. Sustain. Energy Technol. Assess. 2020, 30, 100705. [Google Scholar]
- Sultan, S.M.; Tso, C.P.; Ervina, E.M.N. Anew method for reducing the performance evaluation cost of the photovoltaic module cooling techniques using the photovoltaic efficiency difference factor. Case Stud. Therm. Eng. 2020, 21, 100682. [Google Scholar] [CrossRef]


| PV Cooling Classification | Cooling Method Specification | Temperature Reduction | Electric Performance | Innovative Discovery | Reference |
|---|---|---|---|---|---|
| Passive Air Cooling | Truncated multi-level fin heat sinks (MLFHS) | MLFHS design gives an average temperature that is around 6.13% lower. | 2.87% improvement in the PV module’s electrical output power. | Because of its improved surface shape, the truncated MLFHS has superior heat transfer performance to the rectangular plate-fin heat sink. Better flow patterns are shown in the suggested fin design, and the suggested shape creates an abrupt transition within the boundary layer in the fin confined region. | [27] |
| Passive Air Cooling | Module with fins and a planar reflector | Temperature reduction by 8.4 °C. | Electrical efficiency of 10.68%. | Cooling PV module using passive technique, particularly with lapping fins design, is concluded to be the preferred option over longitudinal fins design due to its simplicity and low cost. | [49] |
| Passive Air Cooling | Aluminium heatsinks with straight and inclined fin design | Temperature reduction was approximately 9.4 °C and 10 °C, respectively. | Electrical efficiency reached more than 4% for these cooling methods. | In order to improve convective heat exchange and lower pressure losses across heatsink channels, the work suggests a new fin pattern for PV module passive heatsinks. This fin array will also help cool down the PV system by increasing vortex formation. | [50] |
| Passive PCM Cooling | PCM with RT55 paraffin wax material and 2% Alumina nanoparticles addition to pure PCM | Temperature reduction results are 8.1 °C and 10.6 °C, respectively. | Cooling system’s efficiency increased by 5.7% and 13.2%, respectively. | The work bridges the gap regarding the potential application of PCM and nanoparticle compounds in the integrated PV building system’s thermal management. Therefore, the purpose, uniqueness, and innovation of the work are to experimentally explore the impacts on temperature regulation and system efficiency increases of the addition of nanomaterial to the PCM in PV integrated systems. | [51] |
| Passive PCM Cooling | PCM calcium chloride hexahydrate (CaCl2&6H2O) based system. | Temperature drops by 26.3 °C or 38%. | Boost the electricity output roughly to 1.16 W, or 24.68%. | The phase change material used by the authors is CaCl2&6H2O because it is significantly less expensive than other types of PCMs. Further benefits of this material include its large fusion heat capacity, appropriate melting and freezing temperature range for both cold and warm climates, stronger thermal conductivity than paraffin-based PCMs, and availability. | [37] |
| Passive PCM Cooling | Computational model to predict PV–PCM temperature interface. | The average temperature of the period of high incidence (10:00 to 15:00) are 39 °C, 39.5 °C, and 44 °C for Computer Fluid Dynamic (CFD), enhanced conduction model (ECM), and conduction model. | The highest average efficiency is up to 18%. | Develop a computational investigation to simulate the PV–PCM temperature interface as an accurate prediction while reducing the computational time with ECM and CFD. | [52] |
| Thermosyphon passive cooling | Two-phase closed thermosyphons (TPCTs) with methanol and Al2O3 (methanol nanofluid). | Lowering temperature by 14.52 °C. | The PV cell produced an extra 1.42 W electric power. | The work uses nanofluid in TPCTs. Furthermore, effect of filling ratio and nanofluid concentration to achieve optimal performance of cooling is discussed. | [42] |
| Thermoelectric Generator (TEG) | High CPV with vapor chamber and TEG. | Temperature difference of the PV cell with TEG2 and TEG5 are 22.0 K and 12.2 K, respectively. | Electrical efficiency increased by 0.36% and 2.72% with TEG2 and TEG5, respectively. | TEG module is used to recover the waste heat from the cell, which is transferred by the Vapor Chamber (VC), to improve the utilization of solar energy. | [48] |
| PV Cooling Classification | Cooling Method Specification | Temperature Reduction | Electric Performance | Innovative Discovery | Reference |
|---|---|---|---|---|---|
| Active water cooling | PV cooling with high frequency ultrasound | Increase in cooling efficiency in the range of 2.75–57.25%. | The percentage of maximum power increase in the range of 3.4 to 51.2% related to cold vapor flow rate or ultrasound power. | Applying ultrasonic energy and nanofluid simultaneously is being researched as a potential active cooling technique for PV cells. The use of high frequency ultrasonography to atomize CuO nanofluid is the primary innovative aspect of this work. Thus, the cold vapor, an atomized fluid employed as a cooling working fluid, is produced using high frequency ultrasonic waves. | [74] |
| Jet impingement water cooling | Maximum temperature was reduced from 69.7 °C to 36.6 °C and 47.6 °C to 31.1 °C by applying cooling for June and December, respectively. | Power output and conversion efficiency were improved by 51.6% and 66.6% by employing jet cooling for the data of June and December, respectively. | The benefit of utilizing impingement cooling can lead to a low average cell temperature. PV strings’ cell temperature, power production, and conversion efficiency may all be examined using the heat transfer analysis for a single nozzle that is performed using the jet impingement geometric model. | [61] | |
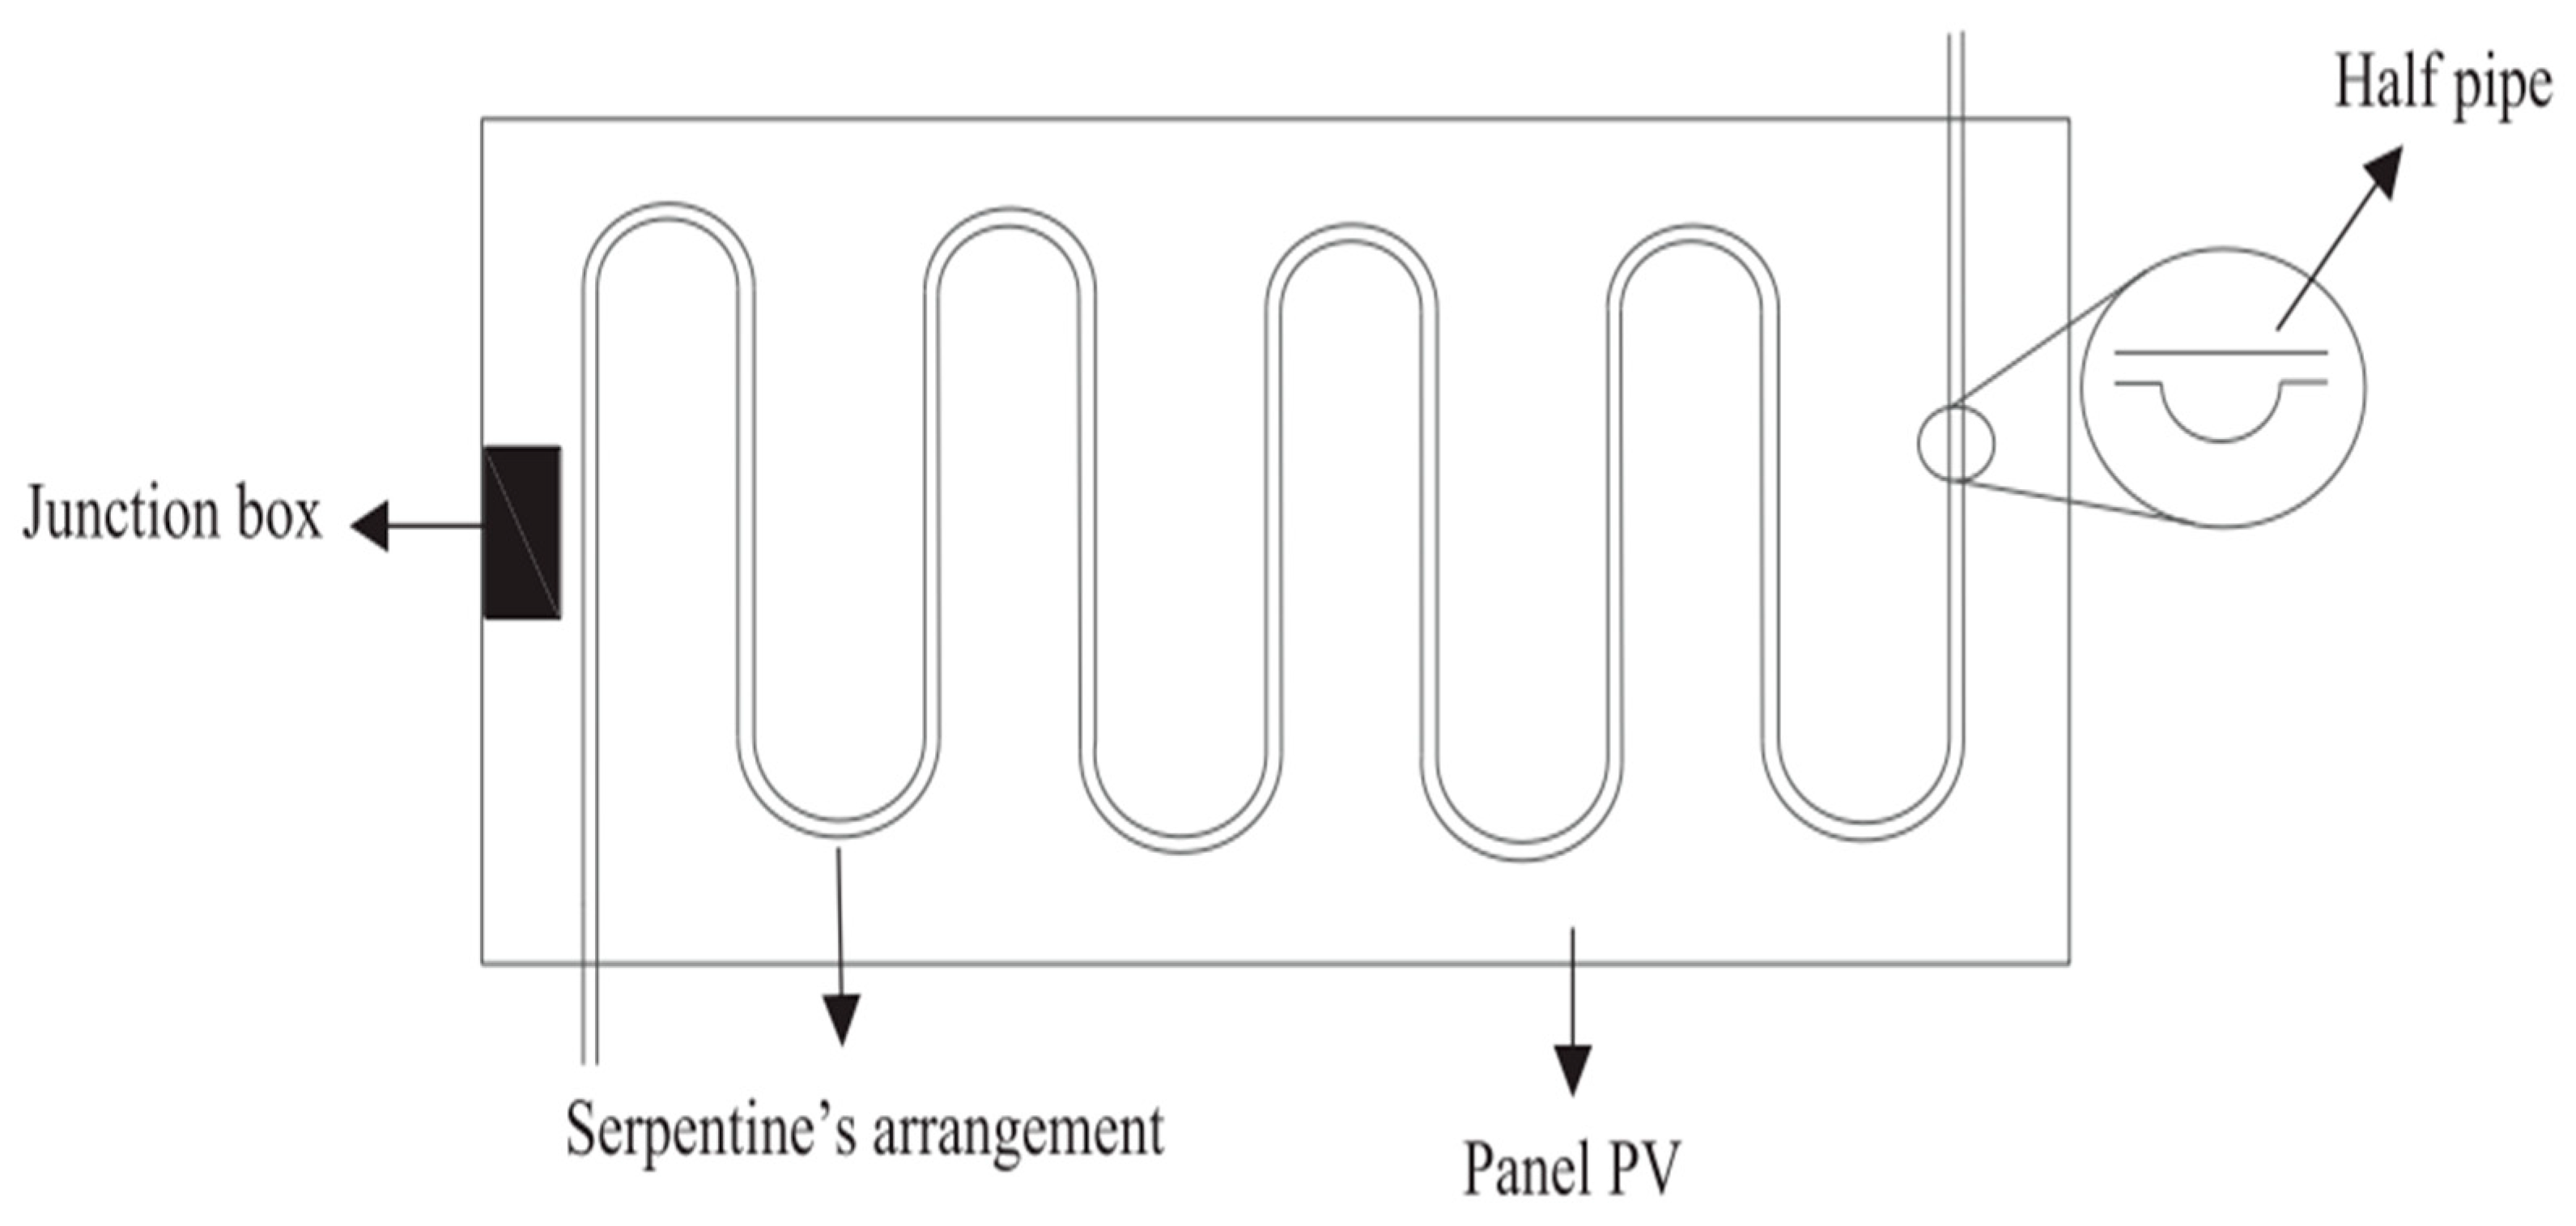
| Active water cooling | Water pipe cooling | It reduces the surface temperature, which is about 47.0 °C lower than that of the non-cooled system. | The conversion and exergy efficiencies achieved maximum values of 11.9% and 12.4%, respectively. | The goal of the work is to thoroughly optimize and investigate PV cooling systems. The impacts of many parameters, including the type of tube, tube diameter, tube spacing, water inlet temperature, and flow velocity, are examined using the mathematical model. The findings demonstrate that as tube diameter and flow velocity rise, and as tube interval and water inlet temperature fall, the average surface temperature of the PV cell can be lowered. | [64] |
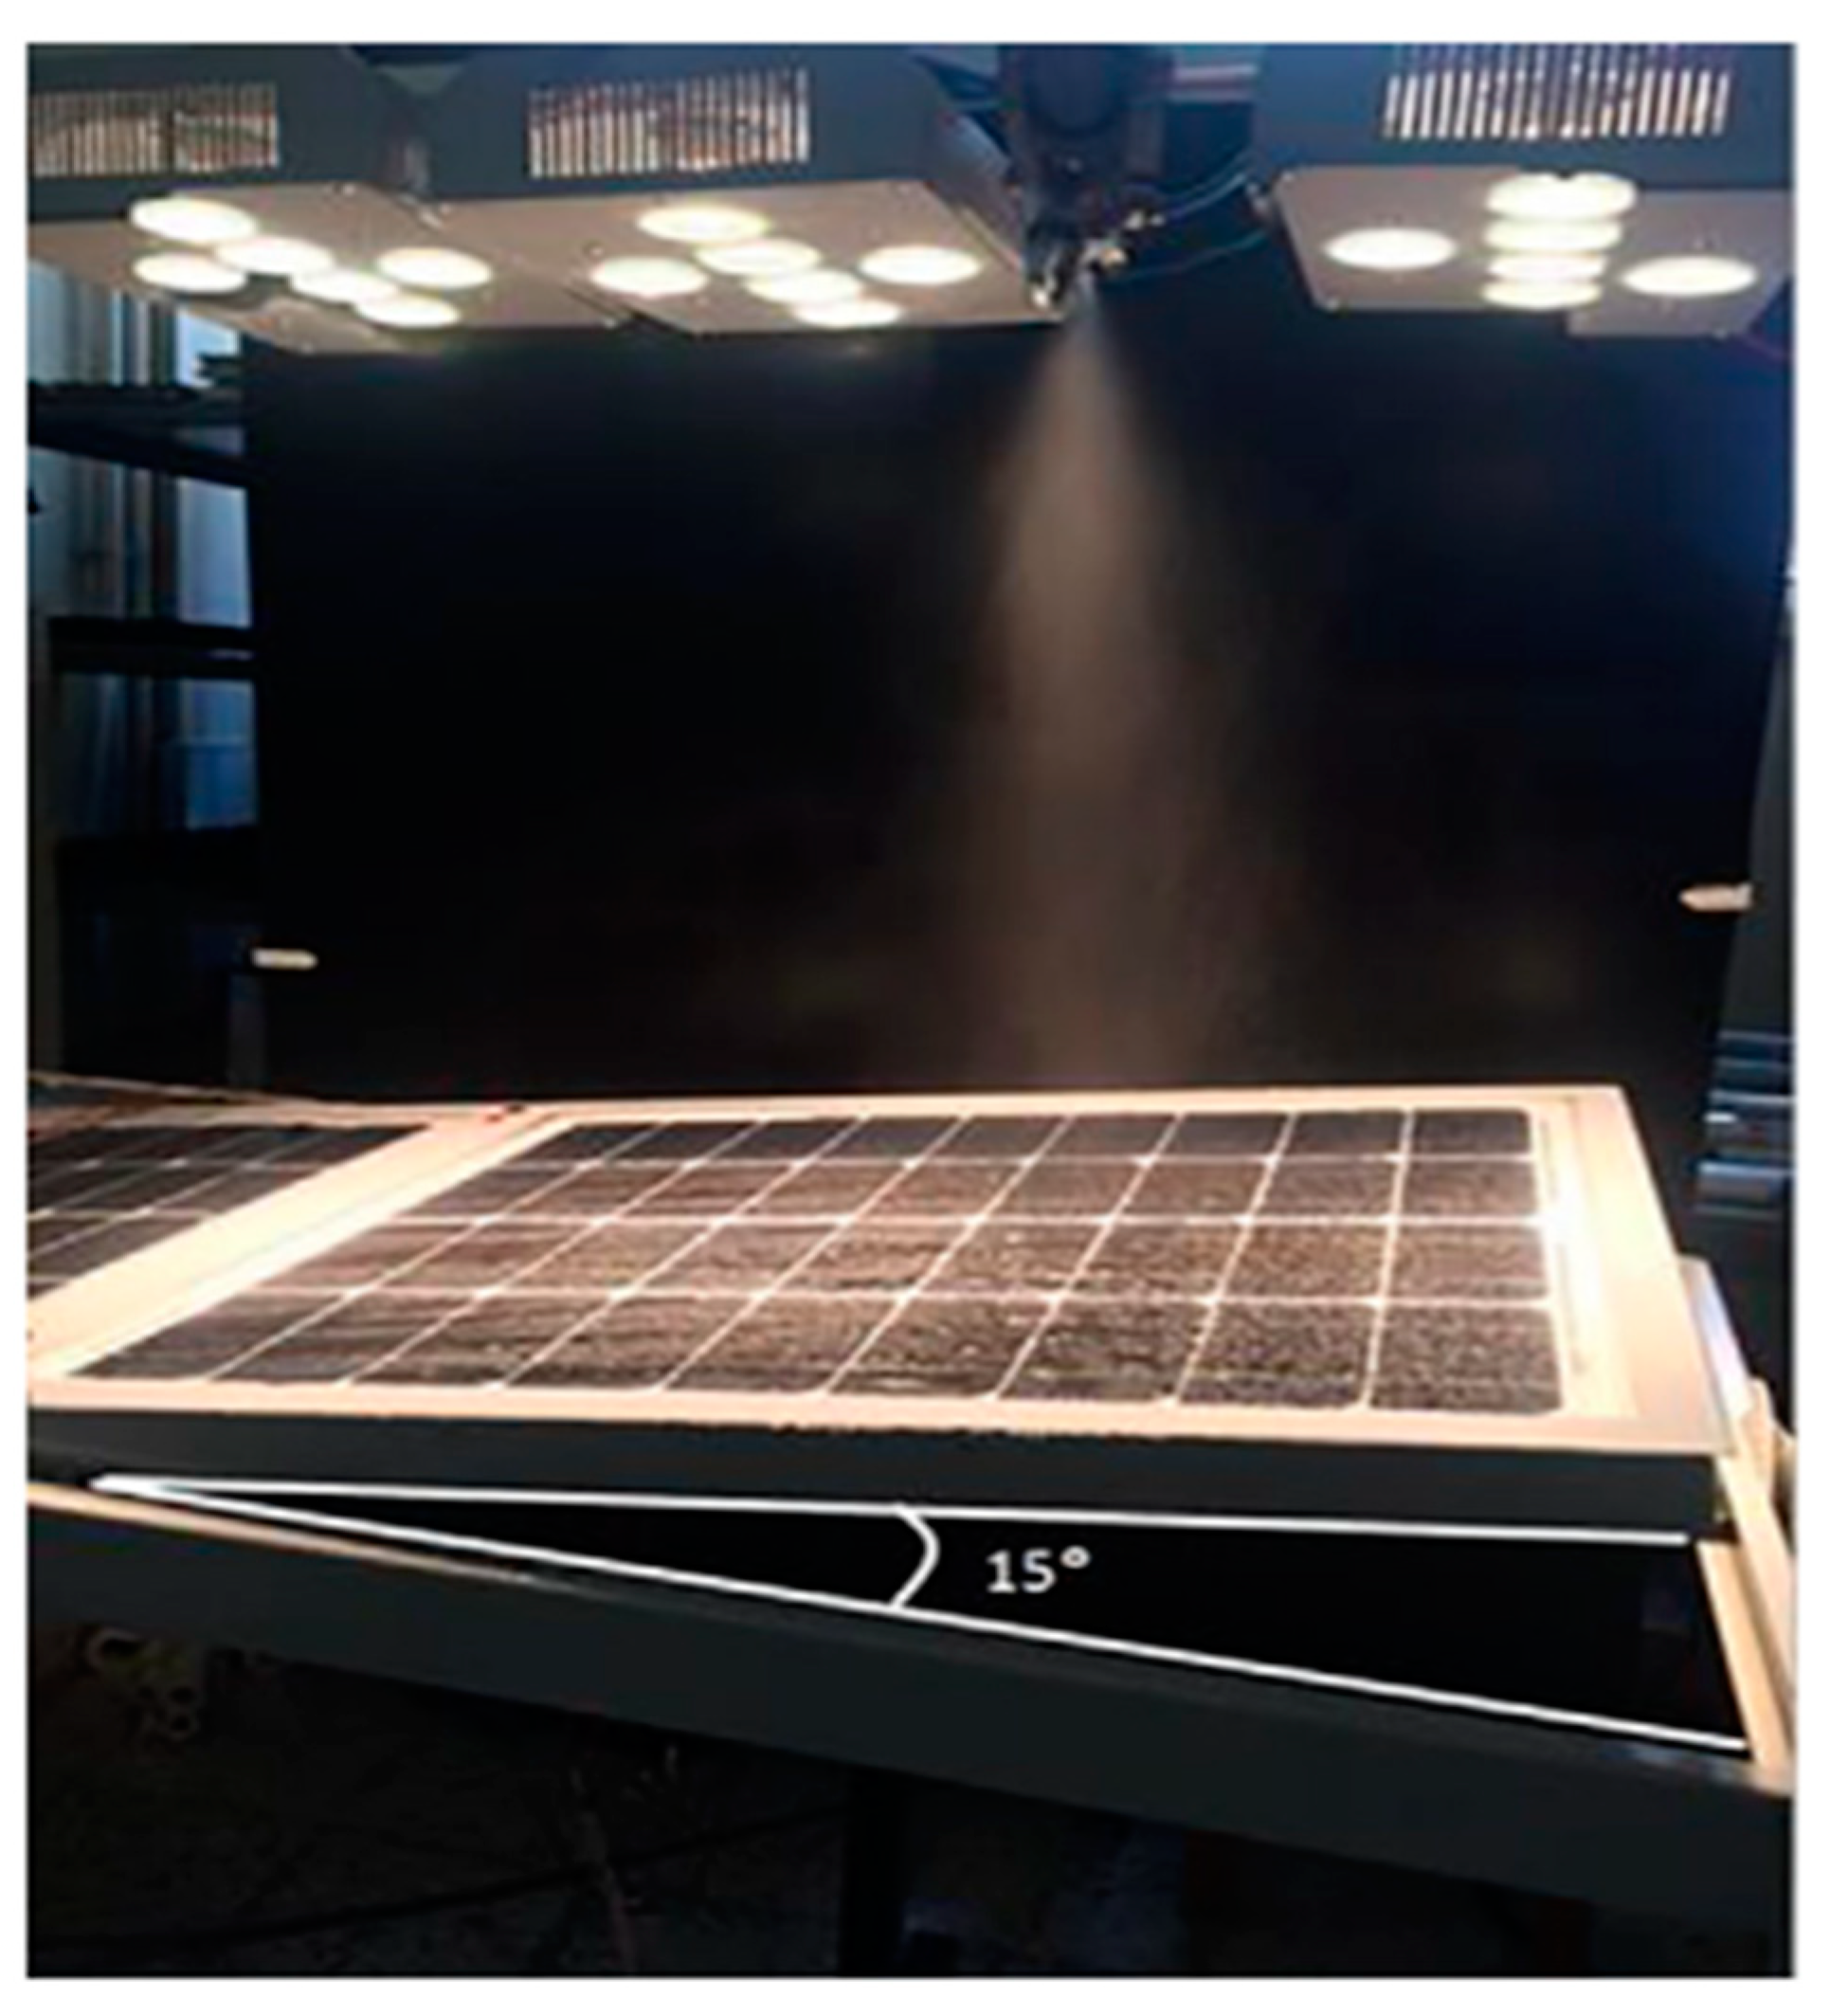
| Pulsed-spray water cooling | The temperature of PV surface reduces from 57.1 °C to 24.8 °C and 26.5 °C by using the steady-spray cooling system and pulsed-flow cooling system, respectively. | The maximum electrical power output of the PV panel increases about 27.7%, and 25.9% by using the steady-flow water spray cooling system, and the pulsed-spray cooling system, respectively. | In the majority of the examples in the earlier research, the PV panels’ temperature was cooled and managed using a cooling system with a steady-flow design. Nevertheless, these systems use a lot of water, which might be a big issue for large-scale PV generating plants. In order to cool the PV panel and use less water in the cooling process, a pulsed-spray water cooling system is devised and tested. The pulsed-spray cooling system reduces water consumption to one-ninth in comparison with the steady-flow cooling system. | [75] | |
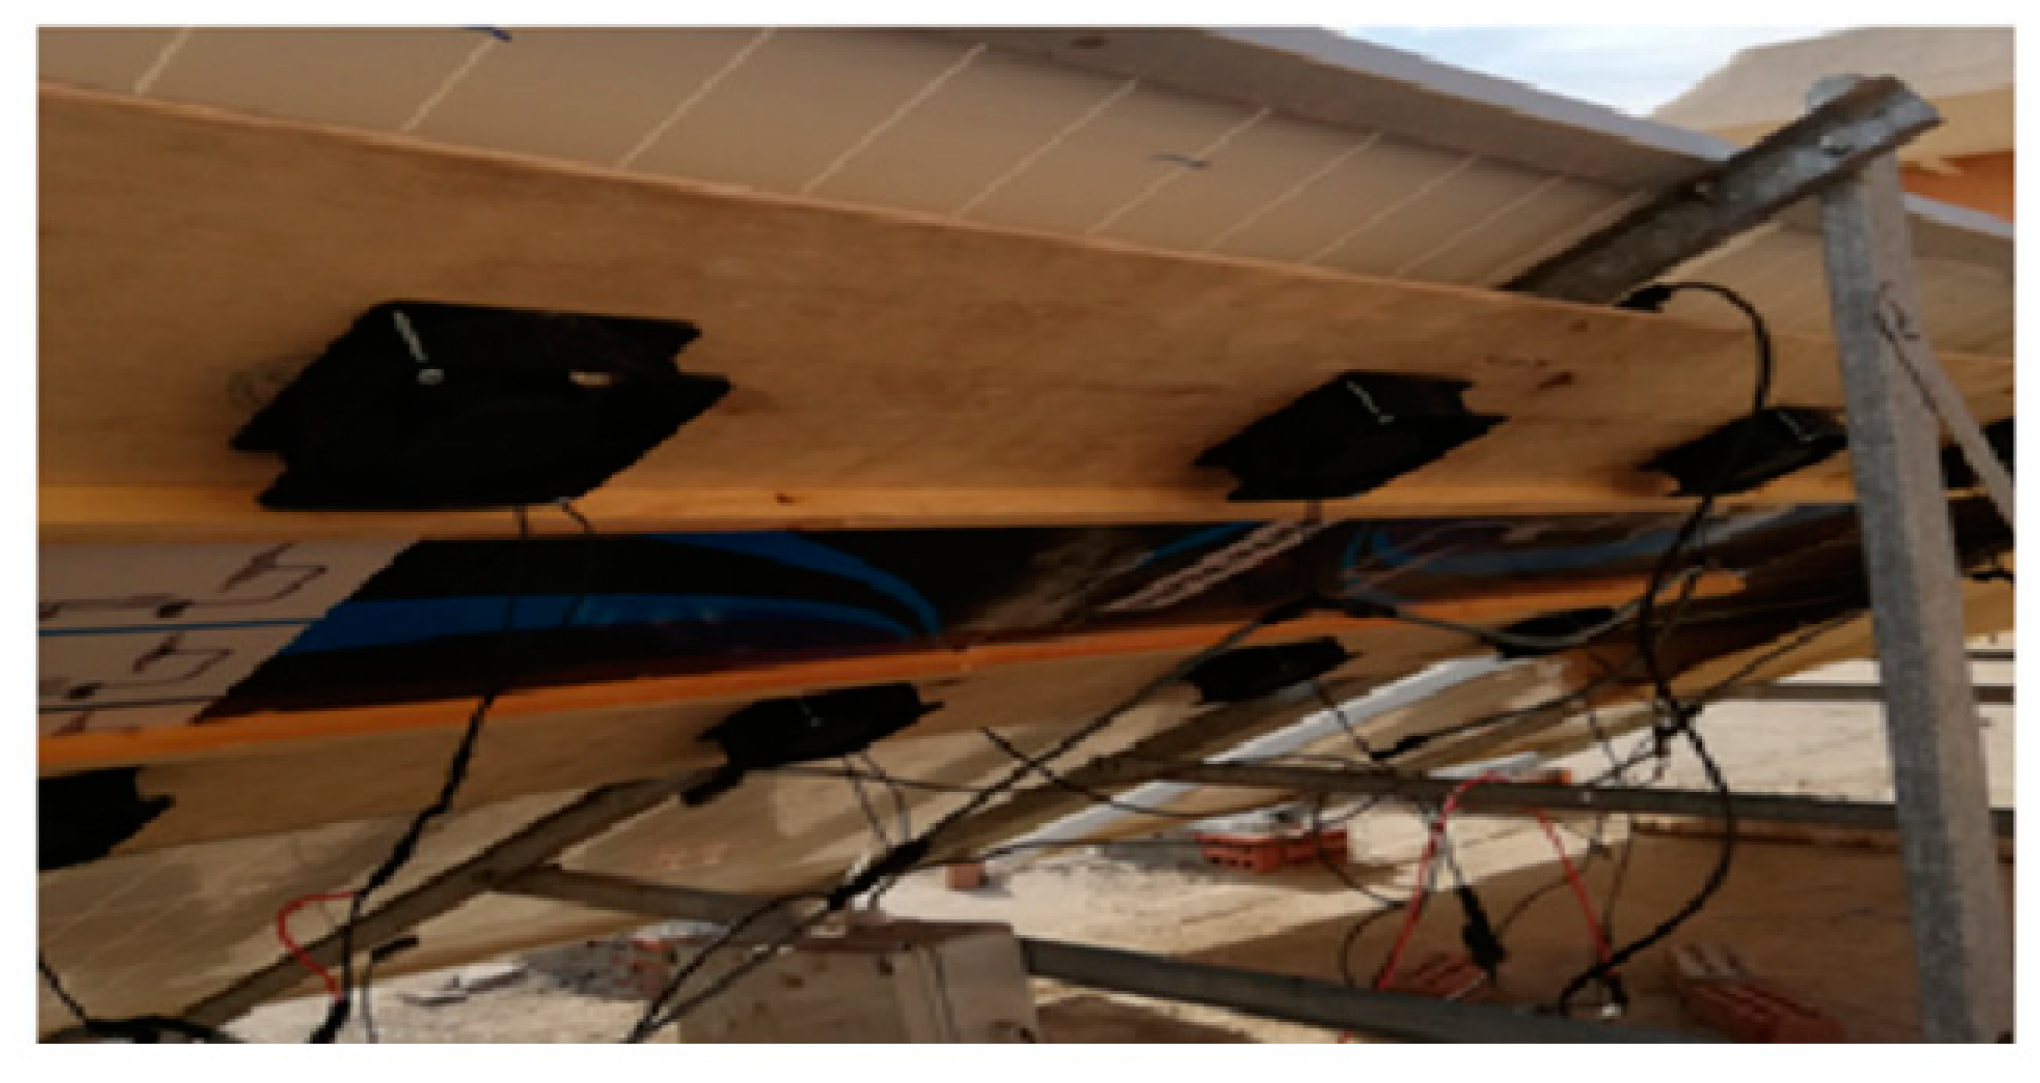
| Active air cooling | Forced air cooling with fan and blower | Temperature reduction of the PV cell by about 9.9 °C and 5.4 °C, respectively. | There is an increase of 1.34% in PV panel efficiency. | In order to maintain the cells’ temperature as low as possible and boost PV module efficiency, the work attempts to investigate forced air cooling with a small fan and blower. | [70] |
| PV Cooling Classification | Cooling Method Specification | Temperature Reduction | Electric Performance | Innovative Discovery | Reference |
|---|---|---|---|---|---|
| Combined Cooling | Air passive cooling and water cooling | It reduces the PV panel’s surface temperature to 20 °C. | The result stated an increase in output power of 20.96 W, and 3% in electrical efficiency. | The cooling problem in PV modules may be solved by using a multi-concept cooling technology, which combines two concepts: water passive cooling and air passive cooling. | [80] |
| Water-cooling system and PCM combination | The average temperature reduction for four designs, case I, II, III and IV, were 4.35 °C, 3.25 °C, 5.40 °C, and 2.46 °C, respectively. | There was an increase in the average electrical efficiency of PV–PCM by 9.58% compared to the reference PV panel. | The goal of the work was to assess experimentally the cooling capacity of PCM integrated water-based passive cooling technology on PV panel performance enhancement. Based on the direction and duration of the water flow, an experimental comparison of the cooling potential of PV panels with PCM integrated water circulation cooling technology was conducted. | [81] | |
| Aluminium fins and an ultrasonic water humidifier cooling system | It reduces the temperature of the panel by 14.61 °C on average. | The electrical efficiency of the module improved by 6.8%. | The study increased a PV module’s electrical production by combining passive and active cooling techniques. The panel was cooled using an ultrasonic humidifier and an aluminium fin heat sink. A humid atmosphere was created at the back of the PV module using an ultrasonic humidifier. | [82] |
| Performance Factor | Equation | Description | Reference |
|---|---|---|---|
| Production cost effectiveness factor () | This method links the manufacturing cost of the PV enhancer with the output power from adding an enhancer to the PV cell. | [83] | |
| Modified production cost effectiveness factor () | This method can greatly reduce the assessment cost of PV enhancers. | [84] | |
| PV cooling technique lifespan factor () | The PV cooler lifespan effectiveness factor depends on the lifespan of both PV cell and cooler. This factor is defined as the ratio of the lifespan of the PV cooler to the lifespan of the PV cell. This technique is helpful in categorizing the performance of the PV cooler in terms of lifespan effectiveness. | [85] | |
| PV efficiency difference factor () | This parameter can indicate if the cooling technique is contributing to PV efficiency gain or loss, or is neutral, and may have the potential to be a measure of PV cooler performance evaluation by manufacturers and designers of PV coolers. | [86] | |
| Modified PV efficiency difference factor () | This method has the flexibility to be applied under various solar irradiance values and depends on a PV module that has a single solar cell only, without a cooler. | [87] | |
| PV power ratio () | This method instantly calculates the unknown power for different reference powers, and makes performance comparison among different enhancers simple. | [88] | |
| PV power difference factor () | The method considers the power output of a standalone PV module with a single solar cell (without a cooler) as a reference point when evaluating the performance of a PV system containing a specified number of solar cells, equipped with a cooler. It can be used to evaluate the performance of different types of PV coolers. | [89] |
| PV Cooler Type | PPV,max, W | PPV, W | PPVCT, W | Cost of One Watt of PV Power, USD | Cost of PV Cooling Technique, USD | FCE | FCE,min | Production Cost Effectiveness |
|---|---|---|---|---|---|---|---|---|
| A | 150 | 90 | 95 | 2 | 20 | 1.05 | 0.6 | Not production cost effective |
| B | 150 | 90 | 102 | 2 | 24 | 1 | 0.6 | Neutral |
| C | 150 | 90 | 105 | 2 | 25 | 0.98 | 0.6 | Production cost effective |
| D | 150 | 90 | 120 | 2 | 30 | 0.88 | 0.6 | Production cost effective |
| E | 150 | 90 | 140 | 2 | 35 | 0.77 | 0.6 | Production cost effective |
| PV Reflector | Pcell, W | PPVCT, W | One Watt PV Power Cost, MYR | PV Enhancer Cost, MYR | FCE | Remark | Assessment Cost (MYR) |
|---|---|---|---|---|---|---|---|
| Type A | 0.374 | 0.579 | 13.40 | 2.30 | 0.942 | Cost effective | 35.8 |
| Type B | 0.374 | 0.592 | 13.40 | 4.60 | 1.212 | Not cost effective | 38.1 |
| PV Enhancer | n | Pcell, W | PPVCT, W | One Watt PV Power Cost, MYR | PV Enhancer Cost, MYR | FCE | Remark | Assessment Cost (MYR) |
|---|---|---|---|---|---|---|---|---|
| Type A | 2 | 0.187 | 0.579 | 13.40 | 2.30 | 0.942 | Cost effective | 27.41 |
| Type B | 2 | 0.185 | 0.592 | 13.40 | 4.60 | 1.212 | Not cost effective | 29.71 |
| Examples | Type of Fluid Circulation | °C | °C | PPV,max, W | Pfc, W | FTDED | PV Efficiency (Gain or Loss) |
|---|---|---|---|---|---|---|---|
| A | Forced | 45 | 30 | 75 | 4 | +0.0014 | Gain |
| B | Forced | 45 | 33.15 | 75 | 4 | 0 | Neutral |
| C | Forced | 45 | 40 | 75 | 4 | −0.031 | Loss |
| D | Forced | 45 | 45 | 75 | 4 | −0.053 | Loss |
| E | Forced | 45 | 46 | 75 | 4 | −0.058 | Loss |
| F | Natural | 45 | 30 | 75 | 0 | +0.068 | Gain |
| G | Natural | 45 | 45 | 75 | 0 | 0 | Neutral |
| H | Natural | 45 | 46 | 75 | 0 | −0.045 | Loss |
| PV Cooler Types | Cooling Type | Tcell, °C (a Single Solar Cell without a Cooler) | TPVCT, °C (a PV Cell with a Cooler) | FTDPD | PV Efficiency Gain/Loss/Neutral |
|---|---|---|---|---|---|
| A | Forced | 55 | 24 | 0.0583 | Gain |
| B | Forced | 55 | 31.3 | 0.0320 | Gain |
| C | Forced | 55 | 34 | 0.0223 | Gain |
| D | Forced | 55 | 55 | −0.0533 | Loss |
| E | Forced | 55 | 60 | −0.0713 | Loss |
| F | Natural | 55 | 40 | 0.054 | Gain |
| G | Natural | 55 | 55 | 0 | Neutral |
| H | Natural | 55 | 56 | −0.0036 | Loss |
| PV Cooler Types | Cooling Type | Pcell, W | PPVCT, W | PPV,max, W | Pfc, W | FED at 1000 W/m2 | FED at 800 W/m2 | PV Efficiency Gain/Loss/Neutral |
|---|---|---|---|---|---|---|---|---|
| A | Forced | 0.333 | 60 | 75 | 4 | +0.08 | +0.1 | Gain |
| B | Forced | 0.333 | 54 | 75 | 4 | 0 | 0 | Neutral |
| C | Forced | 0.333 | 52 | 75 | 4 | −0.026 | −0.033 | Loss |
| D | Forced | 0.333 | 45 | 75 | 4 | −0.12 | −0.15 | Loss |
| E | Natural | 0.333 | 60 | 75 | 0 | +0.13 | +0.163 | Gain |
| F | Natural | 0.333 | 50 | 75 | 0 | 0 | 0 | Neutral |
| G | Natural | 0.333 | 45 | 75 | 0 | −0.07 | −0.088 | Loss |
| PV Cooler Types | °C | °C | °C −1 | R | ||
|---|---|---|---|---|---|---|
| A | 30 | 0 | 25 | 0.0039 | 340 | 0.9805 |
| B | 27 | 4 | 25 | 0.0039 | 340 | 0.9804 |
| C | 29 | 1 | 25 | 0.0039 | 340 | 0.9815 |
| PV Cooler Types | °C | °C | °C −1 | R | ||
|---|---|---|---|---|---|---|
| A | 30 | 0 | 25 | 0.0039 | 300 | 0.9805 |
| B | 27 | 4 | 25 | 0.0039 | 300 | 0.9789 |
| C | 29 | 1 | 25 | 0.0039 | 300 | 0.9810 |
| PV Cooler Type | , Years | , Years | FLSE | Performance Remark |
|---|---|---|---|---|
| Type A | 7 | 15 | 0.467 | Lifespan effective |
| Type B | 15 | 15 | 1 | Lifespan effective |
| Type C | 23 * | 15 | 1 | Lifespan effective |
Disclaimer/Publisher’s Note: The statements, opinions and data contained in all publications are solely those of the individual author(s) and contributor(s) and not of MDPI and/or the editor(s). MDPI and/or the editor(s) disclaim responsibility for any injury to people or property resulting from any ideas, methods, instructions or products referred to in the content. |
© 2024 by the authors. Licensee MDPI, Basel, Switzerland. This article is an open access article distributed under the terms and conditions of the Creative Commons Attribution (CC BY) license (https://creativecommons.org/licenses/by/4.0/).
Share and Cite
Harmailil, I.O.; Sultan, S.M.; Tso, C.P.; Fudholi, A.; Mohammad, M.; Ibrahim, A. The State of the Art of Photovoltaic Module Cooling Techniques and Performance Assessment Methods. Symmetry 2024, 16, 412. https://doi.org/10.3390/sym16040412
Harmailil IO, Sultan SM, Tso CP, Fudholi A, Mohammad M, Ibrahim A. The State of the Art of Photovoltaic Module Cooling Techniques and Performance Assessment Methods. Symmetry. 2024; 16(4):412. https://doi.org/10.3390/sym16040412
Chicago/Turabian StyleHarmailil, Ihsan Okta, Sakhr M. Sultan, Chih Ping Tso, Ahmad Fudholi, Masita Mohammad, and Adnan Ibrahim. 2024. "The State of the Art of Photovoltaic Module Cooling Techniques and Performance Assessment Methods" Symmetry 16, no. 4: 412. https://doi.org/10.3390/sym16040412
APA StyleHarmailil, I. O., Sultan, S. M., Tso, C. P., Fudholi, A., Mohammad, M., & Ibrahim, A. (2024). The State of the Art of Photovoltaic Module Cooling Techniques and Performance Assessment Methods. Symmetry, 16(4), 412. https://doi.org/10.3390/sym16040412