
Development of a Smart Metered-Dose Inhaler for Asthma Based on Computational Fluid Dynamics
College of Mechanical and Electronic Engineering, Hohai University, Changzhou 213000, China
*
Author to whom correspondence should be addressed.
Symmetry 2023, 15(9), 1712; https://doi.org/10.3390/sym15091712
Submission received: 9 August 2023
/
Revised: 27 August 2023
/
Accepted: 4 September 2023
/
Published: 7 September 2023
(This article belongs to the Special Issue Symmetry in Mechanical and Biomedical Mechanical Engineering II)
Abstract
:Asthma is a common respiratory disease with symptoms such as repeated wheezing, shortness of breath, and coughing. However, currently, asthma cannot be cured but only controlled or relieved using medication. The metered-dose inhaler (MDI) is known to lead to high deposition fractions of drug particles in the mouth and throat, resulting in inadequate drug efficacy. Therefore, herein, the factors influencing the deposition fraction of asthma drugs in the mouth and throat regions were explored by computational fluid dynamics and a smart MDI for asthma was designed. The smart MDI was designed based on the obtained simulation results, which demonstrated that the deposition fraction gradually increased from 55.78% to 65.75% with an increase in the peak inspiratory flow rate at an angle of incidence of 0°. The deposition fraction first decreased and then increased as the angle of incidence increased at a constant peak inspiratory flow rate. The deposition fraction increased as the inspiration–press interval time increased at a constant angle of incidence and peak inspiratory flow rate. Meanwhile, performance analysis of the designed smart MDI indicated that the inhaler could effectively reduce the deposition fraction of drugs in the mouth and throat regions by 17% on average.
1. Introduction
According to relevant incomplete statistics, more than 6 million underage patients and more than 45.7 million patients aged 20 or above are currently diagnosed with asthma in China [1]. Asthma is a chronic disease with a potential to have a significant impact on the daily lives of patients or even cause their sudden death in severe cases. Asthma is clinically characterized by airway hyper-responsiveness, reversible airflow restriction, and airway remodeling, which manifest as recurrent wheezing, shortness of breath, chest tightness, and coughing. Asthma is not only prevalent among middle-aged and elderly individuals [2] but is also the most common chronic disease affecting children [3,4]. China has one of the highest asthma mortality rates worldwide [5]; furthermore, asthma cases continue to increase every year with the increase in air pollution and the aging society [6,7,8].
Despite this, asthma cannot be currently cured, and available drugs can only relieve its symptoms. Generally, the two main routes of drug administration, that is, inhalation and oral, are known to significantly differ. In particular, drug administration through inhalation requires a special drug delivery device to deliver drug preparations through oral inhalation into the respiratory tract. Compared with oral administration, inhalation-assisted drug administration is rapid, requires smaller dose levels, avoids the hepatic first-pass effect, and presents fewer systemic adverse reactions owing to direct actions on the patient airway; therefore, this route of administration is preferred for asthma drugs [9].
The commonly used asthma drug delivery devices include atomizers, dry powder inhalers, and metered-dose inhalers (MDIs). Among these, nebulizers are often difficult to clean, their mesh is prone to clogging, the devices are prone to breakage, and they are only suitable for low-viscosity drug solutions [10]. Passive inhalers are used for administering dry powders, and patient inspiration is the sole driving force for drug delivery, in this case; moreover, the efficacy of delivery remains a central issue [11] Thus, MDIs are most commonly adopted as drug delivery devices for asthma drugs owing to their low costs, portability, operational convenience, and wide applicability. MDIs typically consist of an aerosolized canister with a drug, as well as a disposable agent encapsulated within the canister, and the driver is typically a plastic shell with an expansion chamber equipped with a spray port [12]. However, MDIs are difficult to operate and have certain requirements for patient inspiration–pressure co-ordination; owing to these technical limitations, the MDI aerosols are generally sprayed at a faster rate than that required, leading to a high rate of MDI drug deposition into the oropharynx. This higher rate of oropharyngeal deposition may not only reduce the efficacy of drug delivery, but also lead to laryngeal irritation, coughing, hoarseness, and oropharyngeal Candida infections [13]. To address the aforementioned issues, storage mist canisters with inhalation-driven aerosols have been introduced. One such canister is the fog storage container, which is an extension of the drive embouchure; that is, a large-volume canister is attached to the spray outlet, which enables temporary storage of drug particles and mitigates the problems of high oral and throat drug deposition rates resulting from excessive aerosol velocities. Although such mist storage containers can effectively reduce the rate of oral and throat deposition, significant amounts of drugs are deposited in the container, which may not improve the rate of drug deposition in the lungs [14]. In contrast to the storage mist canisters, the concept of the inhaler-driven aerosol design achieves the function of synchronizing patient inhalation and aerosol compression via a specially designed structure or device, thereby reducing the rate of drug deposition in the oropharynx [15]. To address the high deposition rates of drug particles in the mouth and throat regions when using MDIs, which may reduce drug efficacy [9], this study aims to analyze the following: (1) the deposition patterns of aerosol particles in a three-dimensional model based on a computational fluid dynamics (CFD) numerical simulation, (2) the effect of peak inspiratory flow rate, angle of incidence, and inspiratory–press interval time on the oral and throat deposition rate of drug particles, (3) and design an intelligent MDI that automatically adjusts to the optimal angle of incidence and inspiratory–press interval time, based on the patient’s peak inspiratory flow.
2. Materials and Methods
2.1. Modeling and Meshing of the Human Mouth and Throat Regions
Because this study aimed to reduce the deposition fractions of asthma drug particles in the mouth and throat regions during MDI administration, the human oral cavity and throat regions were selected as the study areas. The midsagittal view of the human head and neck, specifically including the oral cavity, oropharynx, laryngopharynx, and part of the airflow pathway of the trachea, was selected. For convenience, this is hereinafter referred to as the human mouth and throat model. Notably, the oral cavity as the starting site for transoral inhalational administration, leads to the pharynx through the pharyngeal isthmus. The pharynx is located at the upper end of the digestive tract and can be divided into the following three parts: nasopharynx, oropharynx, and laryngopharynx. The nasopharynx refers to the part above the plane of the palate that connects to the nasal cavity through the posterior nasal aperture. The oropharynx is connected to the oral cavity, and its upper and lower parts are connected to the nasopharynx and laryngopharynx, respectively, with several small depressions where foreign bodies can easily rest. The laryngopharynx is the lowermost part of the pharynx, which is narrow and can easily retain foreign bodies.
Most human mouth and throat models used in previous studies are ideal [16,17,18]; however, this study adopted a human mouth and throat model created based on the reconstruction of real human computed tomography (CT) data. The CT data used were derived from a database established by Medimodel and used for scientific research; the data were collected from a 35-year-old male using a KaVo CT scanner with a slice thickness of 0.25 mm. The patient was asked to keep his mouth slightly open, similar to that during the MDI-assisted administration of asthma drugs. The MIMICS 21.0 software was used to output the human mouth and throat model after inputting human CT data in the digital imaging and communications in medicine format, and the model exported from MIMICS was refined using Geomagic Design X. The nasopharyngeal part, which was not relevant to this study, was truncated, and refined surface treatment was performed. To reduce the backflow phenomenon caused by the small flow area in the calculation process and to facilitate convergence, the throat was appropriately extended without affecting the calculation accuracy. Finally, the human mouth and throat model was exported in a stereolithography file format (Figure 1).
The human mouth and throat model used in this study was divided into 164,200, 210,000, 372,700, 455,900, 558,800, and 777,400 grids, and the airflow field was simulated at an inspiratory flow rate of 45 L/min. The calculated tip speeds of the outflow section were compared, and the difference between the results of grid numbers of 455,900, 558,800, and 777,400 was smaller compared to that for other grids (Figure 2). To balance the calculation time and accuracy, the human mouth and throat model with 455,900 meshes was selected (Figure 3). The degree of distortion for approximately 97.65% of the meshes of the model was less than 0.50; this distortion ranged between 0 and 0.25 for 72.82% of the meshes. The average aspect ratio of the mesh was 1.85, with good quality.
2.2. Numerical Simulation Methods for Computational Fluid Dynamics Analysis
In this study, we used ANSYS Fluent 2020 R2 to perform the numerical simulations, as described below.
First, the turbulence model was selected. When the inspiratory flow rate was 30 L/m, the Reynolds number (Re) at the inlet of the human mouth and throat was Re = 3399, and the air flow state was in the transition zone between a laminar and turbulent flow. Therefore, in this study, we selected the transition shear stress transport model for the numerical simulation, which was suitable for simulating the transition from a laminar to a turbulent flow. Notably, the turbulent kinetic energy equation is expressed as follows:
where k denotes the turbulent energy of the fluid (m2/s2), t denotes the time (s), uj denotes the velocity component along the j direction in the Cartesian co-ordinate system (m/s), Gk denotes a correction to the turbulent energy generation term, Yk denotes a correction to the turbulent energy dissipation term, xj denotes the J-direction space co-ordinates, σk denotes the turbulent Prandtl number, µT denotes the eddy viscosity, and µ denotes the kinematic viscosity (Pa·s).
The expression for the turbulent dissipation rate of a fluid is as follows:
where ω denotes the specific turbulence dissipation rate of the fluid (s−1), Gω denotes the generation term of the specific turbulence dissipation rate of the fluid (N/m4), and Yω denotes the dissipation term of the specific turbulence dissipation rate of the fluid (N/m4).
The motion of the MDI-ejected salbutamol sulfate particles in the flow field was simulated using the discrete phase model (DPM), and the following aspects were considered:
- Particle force equation:
The salbutamol sulfate particles were assumed to be rigid, non-rotating, and dilute-phase spheres with a constant density. Drug particles are subjected to many forces in the respiratory tract, including inertial forces, trailing forces, pressure gradient forces, added mass forces, Magnus lift forces, Saffman lift forces, etc. To simplify the calculation, only the effects of gravity, traction, and the Saffman lift force were considered. Thus, the force acting on the particles could be expressed as follows [19]:
where denotes the gravity force, denotes the traction force, and denotes the Saffman lift force. Here, can be expressed as follows:
where mp denotes the particle mass and g denotes the acceleration due to gravity.
Considering that Ventolin aerosol particles are spherical with diameters of 1–50 µm, the traction force was calculated using the Stokes model with the Cunningham correction [20]. Subsequently, could be calculated using the following equation:
where up denotes the particle velocity, ρp denotes the particle density, and dp denotes the particle size.
The traction coefficient CC can be expressed as follows:
where λ denotes the mean free path, that is, the average distance traveled by a particle between collisions, which is, typically, λ = 0.07 µm.
The Saffman lift force can be determined using the following equation:
- 2.
- Random walk model
Notably, the random walk model can simulate the random effect of turbulence on particles. In this study, we used a discrete random walk model set by ANSYS Fluent with the number of walks equal to one.
- 3.
- Particle deposition model
Next, the particle deposition model can monitor the deposition of particles on each wall, but it is only applicable to coupled simulations. In this study, we adopted this model to monitor the DPM accretion, which was defined as the mass of particles deposited per unit area. Generally, the higher the DPM accretion in a region, the greater the mass of particles deposited in that region; that is, particles are easily deposited in that region. The calculation formula for accretion is as follows:
where mp denotes the mass of the deposited particles (kg) and Aface denotes the area where the particle stream hits the wall (m2). Note that the DPM accretion cloud maps discussed later are obtained based on this formula.
As this study used ANSYS Fluent for the simulation analysis, the discretization finite volume method was used. A pressure-based solver with unsteady computation was employed. Notably, the pressure implicit with splitting of the operator algorithm was chosen owing to its iterative process of momentum correction and its conduciveness to accelerating the calculation convergence particularly when solving unsteady-state problems. After completing the initialization of the computational domain, the calculation was performed, with a time step of 5 × 10⁻⁴ s and computing time of up to 1.5 s.
3. Quantitative Study of Drug Particle Deposition in the Mouth and Throat Regions
3.1. Influence of Peak Inspiratory Flow Rate on the Drug Deposition Fraction in the Mouth and Throat Regions
3.1.1. Boundary Conditions
Generally, the boundary conditions to be used in the numerical simulation of a gas–solid two-phase flow must mimic the inhalation conditions of asthma patients during actual medication administration, including the patient inhalation and drug particle injection conditions when using an MDI. For routine MDI-based administration, the patient must hold the device horizontally and press the aerosol canister while beginning to inhale.
Therefore, the inlet boundary conditions must be set according to the following two aspects: the gas phase and particle phase.
For the correct operation of an MDI [21], a relatively stable and deep inspiration must be performed by the patient during drug administration, and the inspiratory direction must be normal to the oral inlet cross-section. To ensure that the inlet boundary conditions resemble those in real situations, a simplified respiratory flow model was used at the airway inlet [22,23]. The inspiratory flow rate of the patient was first accelerated to a peak flow value of Qmax within 1 s and sustained for 2 s; this value was then subsequently decreased to zero at the 4th s. Based on the achievable peak inspiratory flow rate during drug administration and considering relatively extreme cases, a rate of 15–120 L/min (at 15 L/min intervals) was selected as the range of the peak inspiratory flow rate in this study [24]. Finally, the inlet boundary conditions were implemented using user-defined functions. The gas phase was assumed to be composed of incompressible air with a constant temperature of 37 °C (T = 310.15 K), a density of ρg = 1.139 kg/m3, a viscosity of µg = 2.002 × 10⁻⁵ Pa·s, and an initial pressure of P0 = 101.325 KPa. The mass flow rate parameters corresponding to different inspiratory flows are listed in Table 1.
Ventolin salbutamol sulfate aerosol particles were used as representative research objects in this study; thus, the parameters of the particle phase were set considering the spraying parameters of Ventolin. As shown in the Figure 4, generally, pressing the aerosol canister 0.2 s after the patient begins inhaling is believed to produce the optimal effect on the deposition fraction of drug particles in the mouth and throat regions, and approximately 27–51% of patients report difficulty with inspiration–press co-ordination [25]. Therefore, in this study, we began spraying aerosol particles in the mouth of the patient 0.2 s after they began to inhale and continued this spraying until 0.38 s [26].
The density of the salbutamol sulfate particles was approximately 1230 kg/m3, mass of the particles injected per press was approximately 100 µg, velocity of the particles upon entering the oral cavity was approximately 10.3 m/s [27], direction of incidence was perpendicular to the cross-section of the oral cavity entrance, and mode of injection was chosen as the plane of incidence. Currently, the most common medication used to treat asthma is sulfate albuterol. According to Oliveira RF, the Rosin–Rammler distribution was adopted for the particle distribution [28]. The particle size distribution and parameters are summarized in Figure 5 and Table 2.
Typically, the patient’s inspiratory state is relatively stable during medication administration, and the deformation of the airway wall is small, so the wall of the human mouth and throat model was set as a rigid no-slip wall. The administered asthma drug particles flow in from the inlet of the mouth and throat model and exit from the outlet; thus, the wall boundary conditions of the inlet and outlet of the human mouth and throat model were set as escaping conditions. Particle deposition is not only related to the concentration of mucus in the oral mucosa, but also to the size of the particles. When particle sizes larger than 10 μm contact the airway wall, most of the drug particles are captured by the airway wall [29,30]. Because the human mouth and throat areas contain thick and dense mucus and the mean size of drug particles is 12.82 μm, therefore, the sidewall boundary condition of the human mouth and throat model was set as a trapping condition.
3.1.2. Results and Discussion
To analyze the results of the numerical simulation, it was first necessary to quantify the deposition fraction, DF, of asthma drug particles ejected by the MDI in the human mouth and throat model as follows:
where mtrap denotes the mass of the drug particles deposited in the human mouth and throat model, and mall denotes the total mass of the drug particles entering the human mouth and throat model.
The simulated data on the deposition fraction of drug particles in the mouth and throat areas under different peak inspiratory rates are summarized in Table 3.
Table 3 indicates that the rate of oropharyngeal deposition of drug particles at 30 L/min is approximately 56.47%, which is similar to the rates of oropharyngeal deposition obtained from previous in vitro experiments [31,32]. Thus, the results of the numerical simulation obtained in this study are reliable. The simulation results were then fitted to obtain the fitted curves of the deposition fractions of drug particles in the mouth and throat regions under different peak inspiratory flow rates (Figure 6); the fitting function is expressed by Equation (10). Notably, an increase in the peak inspiratory flow rate leads to a gradual increase in the deposition fraction of drug particles in the mouth and throat region. Here, when the peak inspiratory flow rate was 15 L/min, the deposition fraction in the mouth and throat was DF = 55.78%, and when the peak inspiratory flow rate increased to 120 L/min, the deposition fraction of drug particles in the mouth and throat increased to 65.75%, an increase of 17.87%.
The aforementioned phenomena were further analyzed by considering peak inspiratory flow (Qmax) rates of 30, 60, and 90 L/min as examples (Figure 7).
When Qmax = 30 L/min, most of the drug particles were deposited on the tip and anterior part of the tongue with a maximum deposition fraction of 9.10 × 10⁻⁴ kg/m2. This was because the incidence angle of the drug particles was 0° and the velocity was high. Notably, the flow field distribution in the mouth and throat regions and the convexity of the tip and anterior part of the tongue led to a narrow airflow pathway, resulting in a higher airflow velocity near the tip of the tongue. Thus, most of the drug particles contacted and deposited themselves on the convex tongue tip and the tongue surface under the action of inhaled air and inertial impact. The deposition area of the particles in the oropharyngeal region was small, with a deposition fraction of less than 2.80 × 10⁻⁴ kg/m2. The overall deposition fraction of asthma drug particles in the mouth and throat regions was DF = 56.47%.
At Qmax = 60 L/min, as the inspiratory flow rate increased, horizontally incident drug particles were more likely to be deposited on the convex tip of the tongue and anterior part of the tongue, and the maximum deposition fraction in this region increased to 9.25 × 10⁻⁴ kg/min. Simultaneously, the deposition area of drug particles in the oropharyngeal region significantly increased, with an increase in the deposition fraction to 2.85 × 10⁻⁴ kg/m2. Therefore, the deposition fraction of drug particles in the mouth and throat region was greater than that at Qmax = 30 L/min, reaching 58.49%, an increase of approximately 3.58%.
At Qmax = 90 L/min, the maximum deposition fraction at the tip of the tongue and the anterior part of the tongue was 9.35 × 10⁻⁴ kg/m2, and the deposition area and deposition fraction of drug particles in the oropharyngeal region further increased, with the latter reaching 3.80 × 10⁻⁴ kg/m2 in certain areas. The deposition fraction of the MDI-administered drug particles in the mouth and throat was 62.16%, an approximate increase of 10.08% compared to that at Qmax = 30 L/min.
The aforementioned data indicate that when the incidence angle was zero, with an increase in the peak inspiratory flow, the flow velocity within the human mouth and throat model increased, and drug particles more easily contacted and deposited themselves on the convex tip of the tongue and the body surface of the tongue under the prevalent airflow. Meanwhile, the deposition area and deposition fraction in the oropharyngeal region significantly increased, leading to a gradual increase in the deposition fraction of asthma drug particles in the mouth and throat regions. When the peak inspiratory flow rate Qmax increased from 15 L/min to 120 L/min, the deposition fraction of asthma drug particles ejected by the MDI in the mouth and throat region increased from 55.78% to 65.75%.
3.2. Effect of the Angle of Incidence on the Drug Deposition Fraction in the Mouth and Throat Regions
3.2.1. Boundary Conditions
Notably, in addition to the peak inspiratory flow, the incidence angle of the drug aerosols ejected by the MDI can also affect the deposition fraction of drug particles in the mouth and throat regions. Therefore, using the gas–solid two-phase flow method, we quantitatively investigated the effect of this incidence angle on the deposition fraction of drug particles that were administered with an MDI in the mouth and throat region.
According to the schematic of the incidence angle of drug particles during MDI administration (Figure 8), a patient must typically hold the MDI horizontally to administer the drug; thus, the incidence angle of drug aerosols ejected by the MDI could be set as 0°. The settings for the boundary conditions were consistent with those in the previous simulation except for the angle of incidence of asthma drug particles ejected by the MDI. The incidence angle α was set to be positive along the clockwise direction, and 0–50° was chosen as the research range, with 5° intervals.
3.2.2. Results and Discussion
Ten sets and 80 numerical simulation rounds of the gas–solid two-phase flow method were conducted, and the incidence angles of asthma drug particles ejected by the MDI were set to 5°, 10°, 15°, 20°, 25°, 30°, 35°, 40°, 45°, and 50° (0° was considered previously). The obtained data for the deposition fractions of drug particles in the mouth and throat regions under different incidence angles were fitted, and the curves depicted in Figure 9 were obtained.
The results indicated that when the peak inspiratory flow rate was constant, the deposition fraction of drug particles in the mouth and throat first decreased; this was followed by an increase as the incidence angle increased. Moreover, the optimal incidence angle was dependent on the peak inspiratory flow rate. Furthermore, the angle of incidence at higher peak inspiratory flow rates demonstrated a smaller effect on the deposition fraction in the mouth and throat.
Considering the peak inspiratory flow rate Qmax = 30 L/min as an example for further analysis, Table 4 presents the deposition fractions of MDI-administered drug particles in the mouth and throat at different incidence angles.
Figure 10 presents cloud plots of the deposition fractions of drug particles in the mouth and throat regions at a peak inspiratory flow rate of Qmax = 30 L/min with incidence angles (α) of 0°, 15°, 30°, and 45°.
When α = 0°, most of the drug particles were deposited on the tip and anterior part of the tongue, with a maximum deposition fraction of approximately 9.1 × 10⁻⁴ kg/m2; moreover, the deposition area in the oropharyngeal region was relatively small, with a deposition fraction of less than 2.80 × 10⁻⁴ kg/m2. The overall deposition fraction in the mouth and throat was DF = 56.47%; when α = 15°, a small number of particles began to deposit onto the soft palate, and the deposition rate of particles on the tip and anterior part of the tongue decreased, with the maximum deposition fraction in this area decreasing to 7.39 × 10⁻⁴ kg/m2. Meanwhile, the deposition area and deposition fraction in the oropharynx increased, with the maximum deposition fraction exceeding 5.20 × 10⁻⁴ kg/m2. Overall, the deposition fraction in the mouth and throat regions decreased to approximately 40.96%; when α = 30°, the deposition area and deposition fraction of particles on the tip and anterior part of the tongue significantly decreased, and the deposition area of the particles on the upper wall moved from the soft palate to the posterior part of the hard palate, leading to a maximum oropharynx deposition fraction of approximately 8.55 × 10⁻⁴ kg/m2. In this case, the deposition fraction of the MDI-administered drug particles in the mouth and throat decreased to a relatively low level of approximately 31.53%; when α = 45°, no particles were deposited on the tip of the tongue and surface of the tongue body but the particles were concentrated on the hard palate. Moreover, the deposition fraction in the oropharynx significantly increased, with a maximum deposition fraction of 9.14 × 10⁻⁴ kg/m2. The deposition fraction of the MDI-administered drug particles in the mouth and throat rebounded to approximately 42.53%.
In summary, when the peak inspiratory flow rate was constant, the main deposition area of the drug particles moved from the surface of the tongue to the palate and oropharynx as the angle of incidence increased, and an optimal incidence angle led the deposition fraction in the mouth and throat to a minimum level. If the incidence angle continued to increase beyond this point, the deposition fraction in the hard palate and oropharynx significantly increased, consequently increasing the deposition fraction in the mouth and throat. Therefore, generally when the peak inspiratory flow rate is maintained constant, the deposition fraction of MDI-administered drug particles in the mouth and throat can be reduced by adjusting the angle of incidence of asthma drug particles, which, in turn, improves the efficacy of the drugs in patients.
After processing and analyzing the data of optimal incidence angles under different peak inspiratory flow rates, the overall distribution was found to be similar to a Gaussian function. Therefore, the relationship between the peak inspiratory flow rate and optimal incidence angle was fitted by a Gaussian function in this study, and the fitted curves depicted in Figure 11 were obtained.
This relationship can be approximated using the following formula:
where αOpt denotes the optimal angle of incidence corresponding to the Qmax value of MDI-administered drug particles (°).
3.3. Effect of Inspiration–Press Interval Time on the Deposition Fraction in the Mouth and Throat Regions
3.3.1. Boundary Conditions
Notably, Δt is defined as the time difference between the initiation of drug spraying and its inhalation by the patient, that is, the interval between inspiration and press, which is expressed as follows:
where tp denotes the moment the aerosol canister is pressed and ti denotes the moment the patient inhales the drug.
Generally, Δt = 0.2 s is accepted as the standard for inspiration–press synchronization, with approximately 14% patients pressing the aerosol canister too early after starting inspiration and approximately 35% patients pressing the aerosol canister too late [33]. Studies have revealed that approximately 27–51% of patients experience difficulty with inspiration–press co-ordination, particularly the elderly and children [23]. Therefore, we investigated the effect of the inspiration–press interval time on the deposition fraction of MDI-administered drug particles in the mouth and throat.
The boundary conditions were similar to those used in the previous simulations, except for a few differences. First, the angle of incidence of aerosol particles ejected from the MDI was set to α = 0°, resembling conventional delivery conditions, and α was set to 30°, which was closer to the optimal angle of incidence at different peak inspiratory flow rates. Considering the inspiration–press co-ordination capacity of a patient, the inspiration–press interval time range was set to 0.1–0.5 s at 0.1 s intervals.
3.3.2. Results and Discussion
Eight sets and 64 numerical simulations rounds of the gas–solid two-phase flow method were conducted, and these comprised four sets with inspiration–press intervals of 0.1, 0.3, 0.4, and 0.5 s at α = 0° (0.2s was previously considered), and four sets with inspiration–press intervals of 0.1, 0.3, 0.4, and 0.5 s at α = 30° (0.2s was previously considered). The simulation results were then fitted and analyzed. Figure 12, presents the fitted curves of the deposition fractions of drug particles in the mouth and throat at different inspiration–press intervals for α = 0°.
The results reveal that the deposition fraction of drug particles in the mouth and throat gradually increased as the inspiration–press interval increased at α = 0°. Moreover, the effect of the inspiration–press interval on the deposition fraction of drug particles in the mouth and throat gradually increased as the peak inspiratory flow rate increased.
For example, when the peak inspiratory flow rate was 30 L/min, as the inspiration–press interval increased from 0.1 to 0.5 s, the deposition fraction increased from 55.91% to 58.55%, a change of 4.72%. When the peak inspiratory flow rate increased to Qmax = 60 L/min, as the inspiration–press interval increased, the deposition fraction increased from 56.81% to 66.29%, a change of 16.69%. When Qmax = 90 L/min, as the inspiration–press interval increased, the deposition fraction increased from 58.43% to 73.21%, a change of 25.30%. Combining the aforementioned effect of the peak inspiratory flow rate on the deposition fraction of drug particles in the mouth and throat, along with the fact that the inspiratory flow for a patient is in an accelerated state during the first 1 s of inspiration, we can conclude that a longer interval, and higher peak inspiratory flow rate at inhalation result in a higher deposition fraction of drug particles in the mouth and throat.
As depicted in Figure 13, the fitted curves of the deposition fractions of drug particles in the mouth and throat at different inspiration–press intervals are plotted for α = 30°. Similar to when α = 0°, barring a few differences, the deposition fraction gradually increased as the inspiration–press interval increased.
When α = 30°, the inspiration–press interval had a greater impact on the deposition fraction of drug particles in the mouth and throat. For example, at Qmax = 30 L/min, Qmax = 60 L/min, and Qmax = 90 L/min, the deposition fractions increased from 25.73% to 44.34% by 72.33%, 34.50% to 59.01% by 71.04%, and 43.50% to 68.09% by 56.53% as the inspiration–press intervals increased, respectively.
In summary, the deposition fraction of drug particles in the mouth and throat regions positively correlated with the inspiration–press interval under both horizontal and optimal incidence angles. Therefore, inspiration–press synchronization can have a significant impact on the deposition fraction of drug particles in the mouth and throat.
4. Design of an Intelligent Dosing Inhaler Based on the Obtained Simulation Results
Based on the patterns of the peak inspiratory flow rate, angle of incidence, and inspiration–press time for the particle oropharyngeal deposition rates derived from the aforementioned numerical simulations, we aimed to design a smart MDI that could effectively reduce the deposition fraction of asthma drug particles in the mouth and throat; the device was designed to incorporate the following:
- The intelligent MDI must include a peak suction flow monitoring mechanism and an angle adjustment mechanism for detecting the patient’s peak inspiratory flow and adjusting the angle of incidence to the optimal angle of incidence;
- The intelligent MDI must include an automatic pressing mechanism that enables rapid detection of the inspiratory action and provides an immediate drive for pressing the aerosol canister to achieve inspiration–press synchronization.
4.1. Structural Design
To achieve the aforementioned functions, a device comprising a housing, aerosol tank, angle switching nozzle, stepper motor, disc impeller, slotted optocoupler, push–pull solenoid, and control system was initially designed (Figure 14).
The peak inspiratory flow detection structure consists of a disc impeller and an optocoupler. The impeller blades are evenly set with blackout sheets (Figure 15). When the impeller rotates with the patient’s inspiratory airflow during medication administration, the light emitted from the slotted optocoupler above it is blocked and cut by the code disc. The sensor monitors the patient’s peak inspiratory flow by recording the time interval when the light is blocked and by obtaining the speed of the impeller through processing with an STM32 microcontroller.
The angle switching nozzle structure, which consists of an angle switching nozzle and a stepper motor (Figure 16), contains eight internal nozzles with different angles ranging from 29° to 36°, with an interval of 1°. The upper part of the angle switching nozzle is designed with a sliding groove and the valve stem of the aerosol dosing valve slides into the groove. When the stepper motor rotates the switching nozzle, the valve stem of the aerosol dosing valve is connected to spray holes located at different incidence angles to switch the drug spray angle.
Automatic compression is achieved using a push–pull solenoid. When the system detects that a patient is inspiring, the automatic compression part immediately presses the aerosol canister to achieve inspiration–press synchronization.
4.2. Design of the Control System
The control system of the designed smart MDI for asthma (Figure 17) consists of the following main elements:
- The speed of the disc impeller is monitored by the microcontroller and the slotted optocoupler, and the peak inspiratory flow rate of the patient is obtained through microcontroller processing;
- A small stepper motor is driven by the driver chip to rotate the angle switching nozzle to switch to the nozzle with the optimal incidence angle corresponding to the patient’s current peak inspiratory flow rate;
- Using a relay with a push–pull solenoid, the aerosol canister is quickly pressed to optimally shorten the drug injection interval when the patient inhales again;
- The medication data of the patient are then uploaded to a PC via serial communication and to a database via the upper computer software, which includes device ID, medication time, peak inspiratory flow, and interval time.
4.3. Upper Computer Design
The overall diagram of the system framework is presented in Figure 18, where the upper computer consists of a device terminal, upper computer software, and MySQL database. The main tasks of the upper computer involve receiving the medication data monitored by the smart aerosol drug delivery device through the serial communication device, including the current angle of incidence, peak inspiratory flow rate, and drug injection interval time, as well as providing a visualization interface for physicians and patients to allow physicians to entirely utilize the data collected by the device and prescribe medications to the patients. In addition, the upper computer software must be equipped with certain testing functions. In summary, the main functions of the upper computer software are as follows:
- The upper computer software reads the data transmitted by the device in real time and saves the data to the database while also testing whether certain parts of the device are functioning properly;
- The upper computer software registers and deletes the accounts of physicians and patients (i.e., device IDs) and saves them to the database;
- Physicians and patients are able to login to the upper computer software, and the physicians can access the medication data of patients from the database and provide recommendations, and patients can consult physicians or provide feedback on the recommendations through the software.
Figure 19 illustrates the upper computer software functional framework.
The monitoring interface constitutes the monitoring part of the upper computer software, while the login, physician, and patient interfaces constitute the management part of the upper computer software (Figure 20).
5. Prototype Preparation and Experimental Test
To verify the feasibility and functional reliability of the prototype structure designed based on the simulation results, the structure was fabricated and assembled by the 3D printing method, and a simple prototype model was obtained. Based on this, a vacuum pump was used to investigate the following: (1) whether each structure in the prototype could be set to the state corresponding to the simulation results to minimize the deposition rate in the mouth and throat; and (2) whether the upper computer could complete the recording of the relevant information under different inspiration flow rates.
5.1. Prototype Preparation
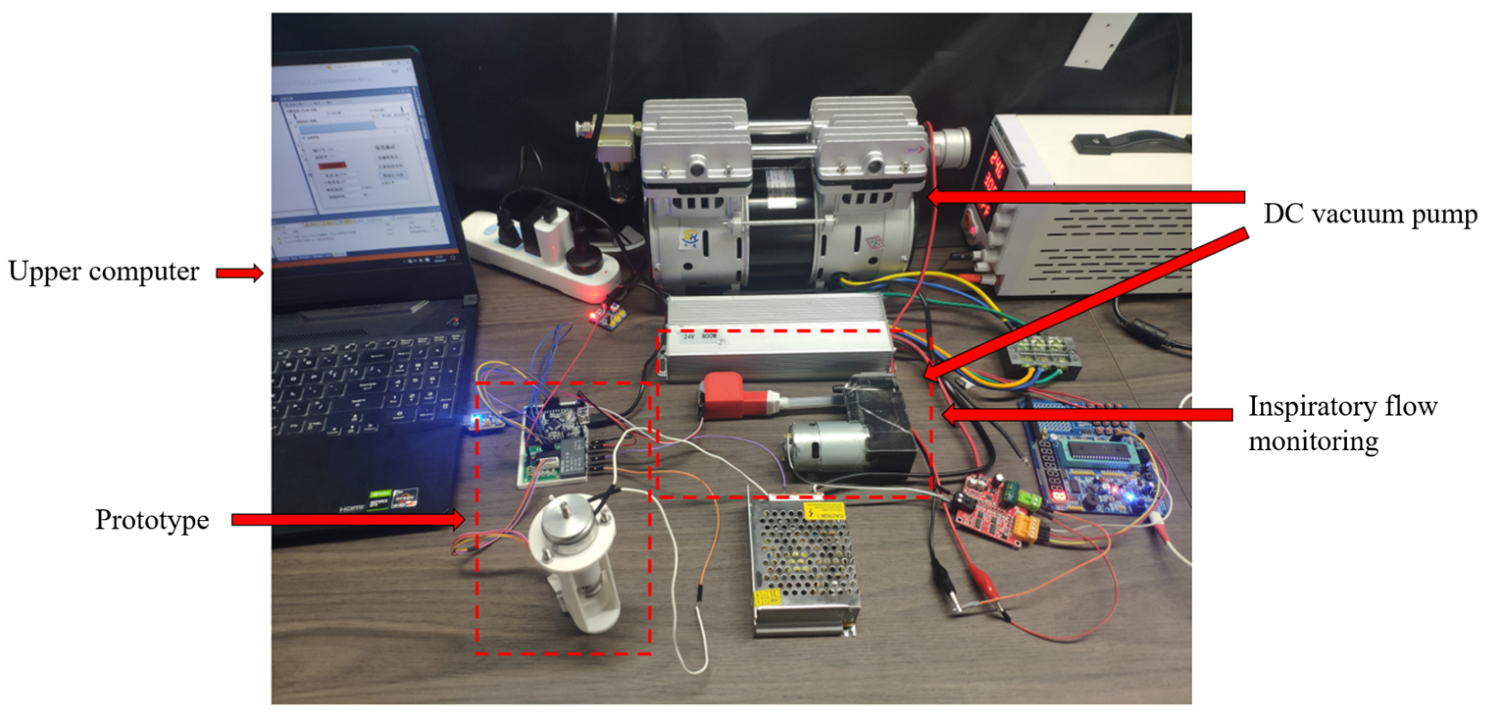
The geometric model of each component of the prototype was established using SolidWorks 2018. Because the components were small and non-standard, they were prepared via 3D printing and assembled into the main body of the prototype, which constituted the prototype test platform with the peak inspiratory flow monitoring device, control system, DC vacuum pump, and upper computer (Figure 21). An adjustable constant voltage power supply was used (0–24 V) and the maximum flow rate of the DC vacuum pump was 120 L/min. The peak inspiration flow monitoring mechanism, control system, and upper computer are described above. The flow rate of the vacuum pump was adjusted by adjusting the voltage to simulate the inspiratory flow rate in different states.
5.2. Inspiratory Flow and Incidence Angle Test
Based on the simulation results discussed above, selecting the optimal incidence angle and inspiration–press interval time is essential to reduce the deposition rate in the oropharynx under different peak inspiratory flow rates. Thus, to determine the performance of the prototype, it must be tested separately for the accuracy inspiratory flow tracking, precision of incidence angle adjustment, and synchronization between the inspiration and pressing actions at different inspiratory flow rates.
5.2.1. Accuracy Test of Inspiratory Flow Monitoring and Incidence Angle Adjustments
Test steps:
- The DC vacuum pump was connected to the inspiratory flow monitoring device in the test platform and the constant flow rate was then tested from 15 to 120 L/min at 15 L/min intervals. Each flow rate was tested thrice, and the average of the peak inspiratory flow rates obtained from the final statistics was adopted as the displayed flow rate;
- We tested whether the upper computer software was able to receive the monitoring results in real time, and whether the receiving function worked normally, the test results were analyzed and are summarized in Table 5.
The relative error E was calculated using Equation (13), where Qd denotes the test flow rate and Qp denotes the displayed flow rate, both in units of L/min.
5.2.2. Inspiration–Press Synchronization Test
Test steps:
- the DC vacuum pump was connected to the inspiratory flow monitoring device in the test platform; the constant flow rate was then tested from 15 to 120 L/min at 15 L/min intervals. Each flow rate was tested thrice, and the average of the inspiration–press intervals obtained from the final tally was used as the interval time;
- we observed whether the solenoid pressed the driver, the upper computer software could adequately receive the monitoring results in real time, and whether the receiving function worked normally; the test results were analyzed and are summarized in Table 6.
The interval time was calculated using Equation (14).
where STA denotes the number of overflows, VAL denotes the current channel value of the timer, and te denotes the driving time of the push–pull solenoid, which was set to approximately 9 ms for this study.
5.3. Comprehensive Performance Analysis of the Prototype
The obtained data related to the inspiratory flow rate, incidence angle test and inspiration–press synchronization test were used to set the boundary conditions in the simulation analysis. The oropharyngeal deposition rate adjusted by the prototype was obtained based on the numerical simulation method and compared with the results obtained from the numerical simulation method without the prototype. The comparison results are summarized in Table 7.
6. Discussion
This study designed an intelligent MDI that can automatically adjust to the optimal incidence angle according to the patient’s peak inspiratory flow and complete the inspiratory–pressure synergistic operation, which can solve the inefficiency of drug delivery of common MDIs in the market at a lower cost, but there are still many shortcomings in this research.
In order to simplify the difficulty of device development, this paper assumes that patients can keep the device relatively level with the head during use, ignoring the uncertainty in actual use. Therefore, this problem should be paid attention to in the next step of device improvement design.
The error of flow monitoring function of this device is large, so it is necessary to improve it or explore other more reliable gas flow monitoring methods in future research. In this paper, there are shortcomings in the angle switching of aerosol incidence, so it is necessary to consider how to realize the function of angle stepless adjustment in future research.
Prototype reliability needs to be verified by in vitro and in vivo experiments with the prototype. At the same time, we need to find and improve the deficiencies of the prototype in the process of experimentation.
7. Conclusions
In this study, a 3D numerical model of the human mouth and throat regions was reconstructed based on real human CT data. The most representative aerosol Ventolin, salbutamol sulfate, was selected for the study, and the effects of the peak inspiratory flow rate, angle of incidence, and inspiration–press interval on the deposition fraction of drug particles in the mouth and throat were quantitatively analyzed based on CFD. The following results were obtained:
- An incidence angle of 0°, and an increase in the peak inspiratory flow rate caused the drug particles to easily contact and deposit themselves on the convex tip of the tongue and body surface of the tongue under the inertial impact of the inspiratory airflow, the deposition fraction of the drug particles in the mouth and throat gradually increased from 55.78% to 65.75%;
- When the peak inspiratory flow remained constant, the deposition fraction of drug particles in the mouth and throat first decreased and then increased as the incidence angle increased. Thus, there existed certain optimal incidence angles corresponding to the lowest deposition fractions at different peak inspiratory flows;
- When the angle of incidence and peak inspiratory flow remained constant, the deposition fraction positively correlated with the inspiration–press interval; therefore, inspiration–press synchronization was identified to be a critical factor;
- According to the test results corresponding to each component of the prototype designed based on the simulation results and the test results of the ideal prototype performance, the smart MDI for asthma developed in this study can reduce the deposition fraction of drug particles in the mouth and throat to a certain extent, thereby improving the efficacy of the drug.
Author Contributions
Z.Z.: writing—review and editing, writing original draft, visualization, validation, supervision, software, resources, project administration, methodology, investigation, funding acquisition, formal analysis, data curation, conceptualization. M.W.: writing—review and editing, writing original draft, visualization, validation, software, resources, project administration, methodology, investigation, formal analysis, data curation, conceptualization. All authors have read and agreed to the published version of the manuscript.
Funding
The study was supported by the National Natural Science Foundation of China (grant no. 32071319) and the National Natural Science Foundation of China (grant no. 11472062).
Institutional Review Board Statement
Ethical review and approval were waived for this study due to the CT data used were derived from a database established by Medimodel.
Informed Consent Statement
Patient consent was waived due to the CT data used were derived from a database established by Medimodel.
Data Availability Statement
We have uploaded the relevant data files in the public data control with the shared DOI number https://doi.org/10.6084/m9.figshare.23522025.
Conflicts of Interest
The authors declare no conflict of interest. The funders had no role in the design of the study; in the collection, analyses, or interpretation of data; in the writing of the manuscript; or in the decision to publish the results.
References
- Huang, K.; Yang, T.; Xu, J.; Yang, L.; Zhao, J.; Zhang, X.; Bai, C.; Kang, J.; Ran, P.; Shen, H.; et al. Prevalence, risk factors, and management of asthma in China: A national cross-sectional study. Lancet 2019, 394, 407–418. [Google Scholar] [CrossRef] [PubMed]
- Wan, J.; Zhang, Q.; Li, C.; Lin, J. Prevalence of and risk factors for asthma among people aged 45 and older in China: A cross-sectional study. BMC Pulm. Med. 2021, 21, 311. [Google Scholar] [CrossRef] [PubMed]
- Deng, Q.; Deng, L.; Lu, C.; Li, Y.; Norbäck, D. Parental stress and air pollution increase childhood asthma in China. Environ. Res. 2018, 165, 23–31. [Google Scholar] [CrossRef] [PubMed]
- Li, X.; Song, P.; Zhu, Y.; Lei, H.; Chan, K.Y.; Campbell, H.; Theodoratou, E.; Rudan, I.; Global Health Epidemiology Research Group. The disease burden of childhood asthma in China: A systematic review and meta-analysis. J. Glob. Health 2020, 10, 010801. [Google Scholar] [CrossRef] [PubMed]
- Ge, J.; Xu, Y. Internal Medicine, 8th ed.; People’s Medical Publishing House: Beijing, China, 2013. [Google Scholar]
- Ebmeier, S.; Thayabaran, D.; Braithwaite, I.; Bénamara, C.; Weatherall, M.; Beasley, R. Trends in international asthma mortality: Analysis of data from the WHO Mortality Database from 46 countries (1993–2012). Lancet 2017, 390, 935–945. [Google Scholar] [CrossRef]
- Lundbäck, B.; Backman, H.; Lötvall, J.; Rönmark, E. Is asthma prevalence still increasing? Expert Rev. Respir. Med. 2016, 10, 39–51. [Google Scholar] [CrossRef]
- Feng, X. Epidemiological Investigation of Bronchial Asthma Prevalence and Related Risk Factors in China; Peking Union Medical College: Beijing, China, 2014. [Google Scholar]
- Zhou, X.; Shen, H.; Zhong, N. Guidelines for bronchial asthma prevent and management (2020 edition). Chin. J. Tuberc. Respir. Dis. 2020, 43, 26. [Google Scholar]
- Cheng, Y. Inhalation Formulation 10 Billion Yuan Market Pattern Is Changing. Medical Report. 2021, 22, 349. [Google Scholar]
- Kim, Y.; Li, D.; Park, S.; Yi, D.; Yeoh, G.; Abbas, A. Computational investigation of particle penetration and deposition pattern in a realistic respiratory tract model from different types of dry powder inhalers. Int. J. Pharm. 2021, 612, 121293. [Google Scholar] [CrossRef]
- De Boer, A.H.; Thalberg, K. Metered dose inhalers (MDIs). In Inhaled Medicines; Academic Press: Cambridge, MA, USA, 2021; pp. 65–97. [Google Scholar]
- Yousefi, M.; Inthavong, K.; Tu, J. Effect of Pressurized Metered Dose Inhaler Spray Characteristics and Particle Size Distribution on Drug Delivery Efficiency. J. Aerosol Med. Pulm. Drug Deliv. 2017, 30, 359–372. [Google Scholar] [CrossRef]
- Lim, S.H.; Park, S.; Lee, C.C.; Ho, P.C.L.; Kang, L. A 3D Printed Human Upper Respiratory Tract Model for Particulate Deposition Profiling. Int. J. Pharm. 2021, 597 (Suppl. S2), 120307. [Google Scholar] [CrossRef] [PubMed]
- Stein, S.W.; Sheth, P.; Hodson, P.D.; Myrdal, P.B. Advances in Metered Dose Inhaler Technology: Hardware Development. AAPS PharmSciTech 2014, 15, 326–338. [Google Scholar] [CrossRef] [PubMed]
- Stapleton, K.W.; Guentsch, E.; Hoskinson, M.; Finlay, W.H. On the suitability of k–ε turbulence modeling for aerosol deposition in the mouth and throat: A comparison with experiment. J. Aerosol Sci. 2000, 31, 739–749. [Google Scholar] [CrossRef]
- Zhang, Y.; Finlay, W.H.; Matida, E. Particle deposition measurements and numerical simulation in a highly idealized mouth–throat. J. Aerosol Sci. 2004, 35, 789–803. [Google Scholar] [CrossRef]
- Cui, X.; Ge, H.; Song, W.; Wang, L.; Feng, Y.; Wang, J. Large eddy simulation of gas flow characteristics in the whole respiratory tract. J. Med. Biomech. 2021, 36 (Suppl. S1), 97. [Google Scholar]
- Shen, Y.; Ji Zhe, W. Numerical modeling of particulate matter deposition in the respiratory tract. Med. Biomech. 2016, 31, 193–198. [Google Scholar]
- Cunningham, E. On the velocity of steady fall of spherical particles through fluid medium. Proc. R. Soc. Lond. Ser. A Contain. Pap. A Math. Phys. Character 1910, 83, 357–365. [Google Scholar]
- Wu, X.; Zhang, W.; Chen, F.; Li, M.; Ding, Y. Effect of Improved-Seven-step Method for Inhalation. Pharm. Clin. Res. 2020, 28, 286–288. [Google Scholar] [CrossRef]
- Deeks, E.D.; Lyseng-Williamson, K.A. K-haler® breath-triggered inhaler: A profile of the properties of the device. Drugs Ther. Perspect. 2019, 35, 315–320. [Google Scholar] [CrossRef]
- Zou, W.; Zhao, C. Performance comparison of flexible pressure sensors in breathing airflow detection. Electron. Meas. Technol. 2020, 43, 153–158. [Google Scholar] [CrossRef]
- Prime, D.; De Backer, W.; Hamilton, M.; Cahn, A.; Preece, A.; Kelleher, D.; Baines, A.; Moore, A.; Brealey, N.; Moynihan, J. Effect of disease severity in asthma and chronic obstructive pulmonary disease on inhaler-specific inhalation profiles through the ELLIPTA® dry powder inhaler. J. Aerosol Med. Pulm. Drug Deliv. 2015, 28, 486–497. [Google Scholar] [CrossRef] [PubMed]
- Farkas, Á.; Horváth, A.; Kerekes, A.; Nagy, A.; Kugler, S.; Tamási, L.; Tomisa, G. Effect of delayed pMDI actuation on the lung deposition of a fixed-dose combination aerosol drug. Int. J. Pharm. 2018, 547, 480–488. [Google Scholar] [CrossRef] [PubMed]
- Alatrash, A.; Matida, E. Characterization of medication velocity and size distribution from pressurized metered-dose inhalers by phase Doppler anemometry. J. Aerosol Med. Pulm. Drug Deliv. 2016, 29, 501–513. [Google Scholar] [CrossRef]
- Liu, X.; Doub, W.H.; Guo, C. Evaluation of metered dose inhaler spray velocities using Phase Doppler Anemometry (PDA). Int. J. Pharm. 2012, 423, 235–239. [Google Scholar] [CrossRef]
- Oliveira, R.F.; Teixeira, S.; Silva, L.F.; Teixeira, J.C.; Antunes, H. (Eds.) Study of a pressurized metered-dose inhaler spray parameters in fluent. In Proceedings of the World Congress on Engineering (WCE 2010), London, UK, 30 June–2 July 2010. [Google Scholar]
- Yaqoubi, S.; Chan, H.K.; Nokhodchi, A.; Dastmalchi, S.; Alizadeh, A.A.; Barzegar-Jalali, M.; Adibkia, K.; Hamishehkar, H. A quantitative approach to predicting lung deposition profiles of pharmaceutical powder aerosols. Int. J. Pharm. 2021, 602, 120568. [Google Scholar] [CrossRef] [PubMed]
- Kwok, P.C.L.; Salama, R.O.; Chan, H.K. Inhalation Drug Delivery: Techniques and Products; Colombo, P., Traini, D., Buttini, F., Eds.; John Wiley & Sons: Hoboken, NJ, USA, 2013. [Google Scholar]
- Huang, F.; Zhou, X.; Dai, W.; Yu, J.; Zhou, Z.; Tong, Z.; Yu, A. In Vitro and In Silico Investigations on Drug Delivery in the Mouth-Throat Models with Handihaler. Pharm. Res. 2022, 39, 3005–3019. [Google Scholar] [CrossRef] [PubMed]
- Cheng, Y.S.; Fu, C.S.; Yazzie, D.; Zhou, Y. Respiratory deposition patterns of salbutamol pMDI with CFC and HFA-134a formulations in a human airway replica. J. Aerosol Med. 2001, 14, 255–266. [Google Scholar] [CrossRef]
- Tao, X.; Zhao, J.; Duan, Y.; Liu, X.; Tang, Y. Current status of learning to use inhalation devices in children with asthma. Chin. J. Med. Guide 2021, 23, 603–605. [Google Scholar]
Figure 1.
Human mouth and throat model.
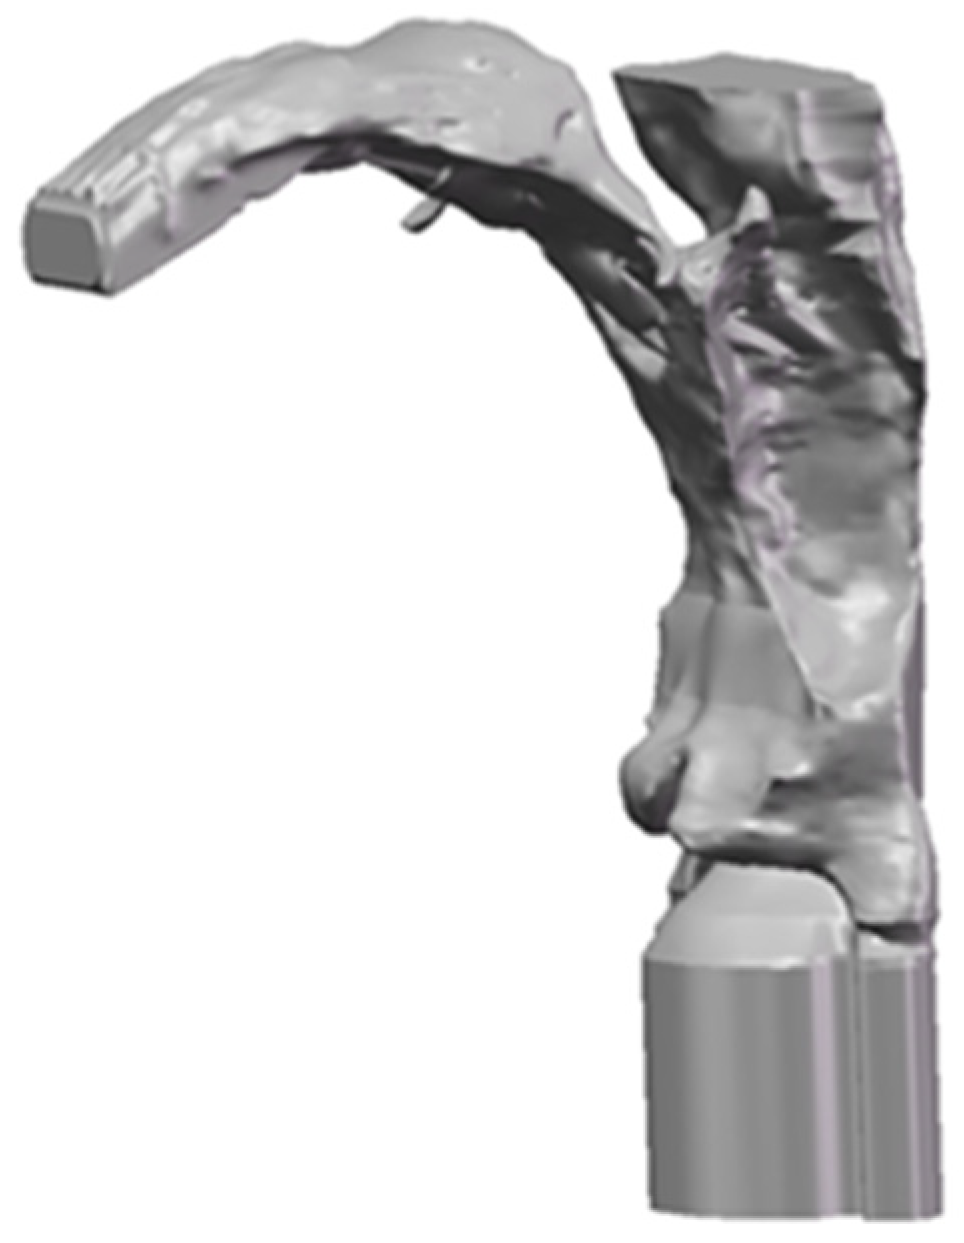
Figure 2.
Verification of the grid-independence of the human mouth and throat model.
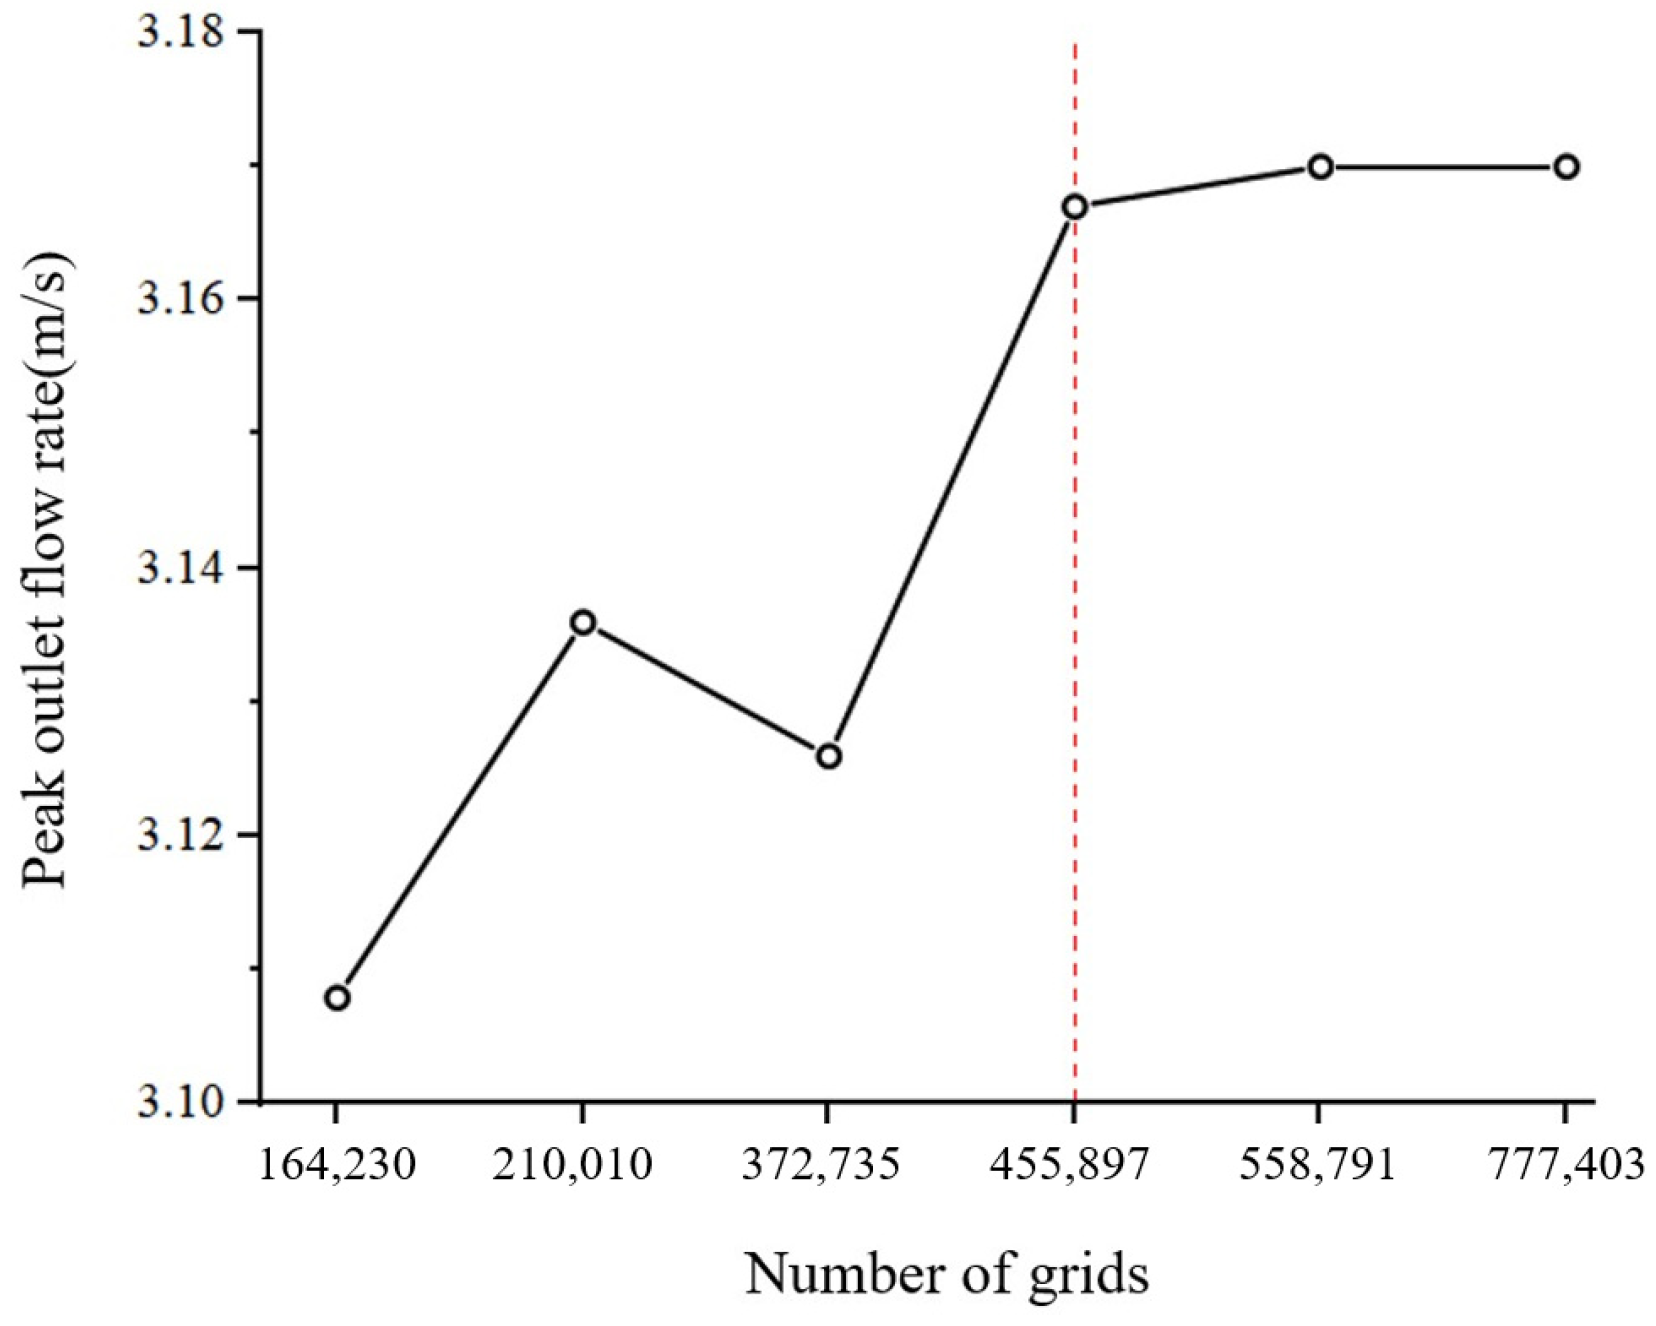
Figure 3.
Human mouth and throat mesh model.

Figure 4.
Inspiratory flow curve.
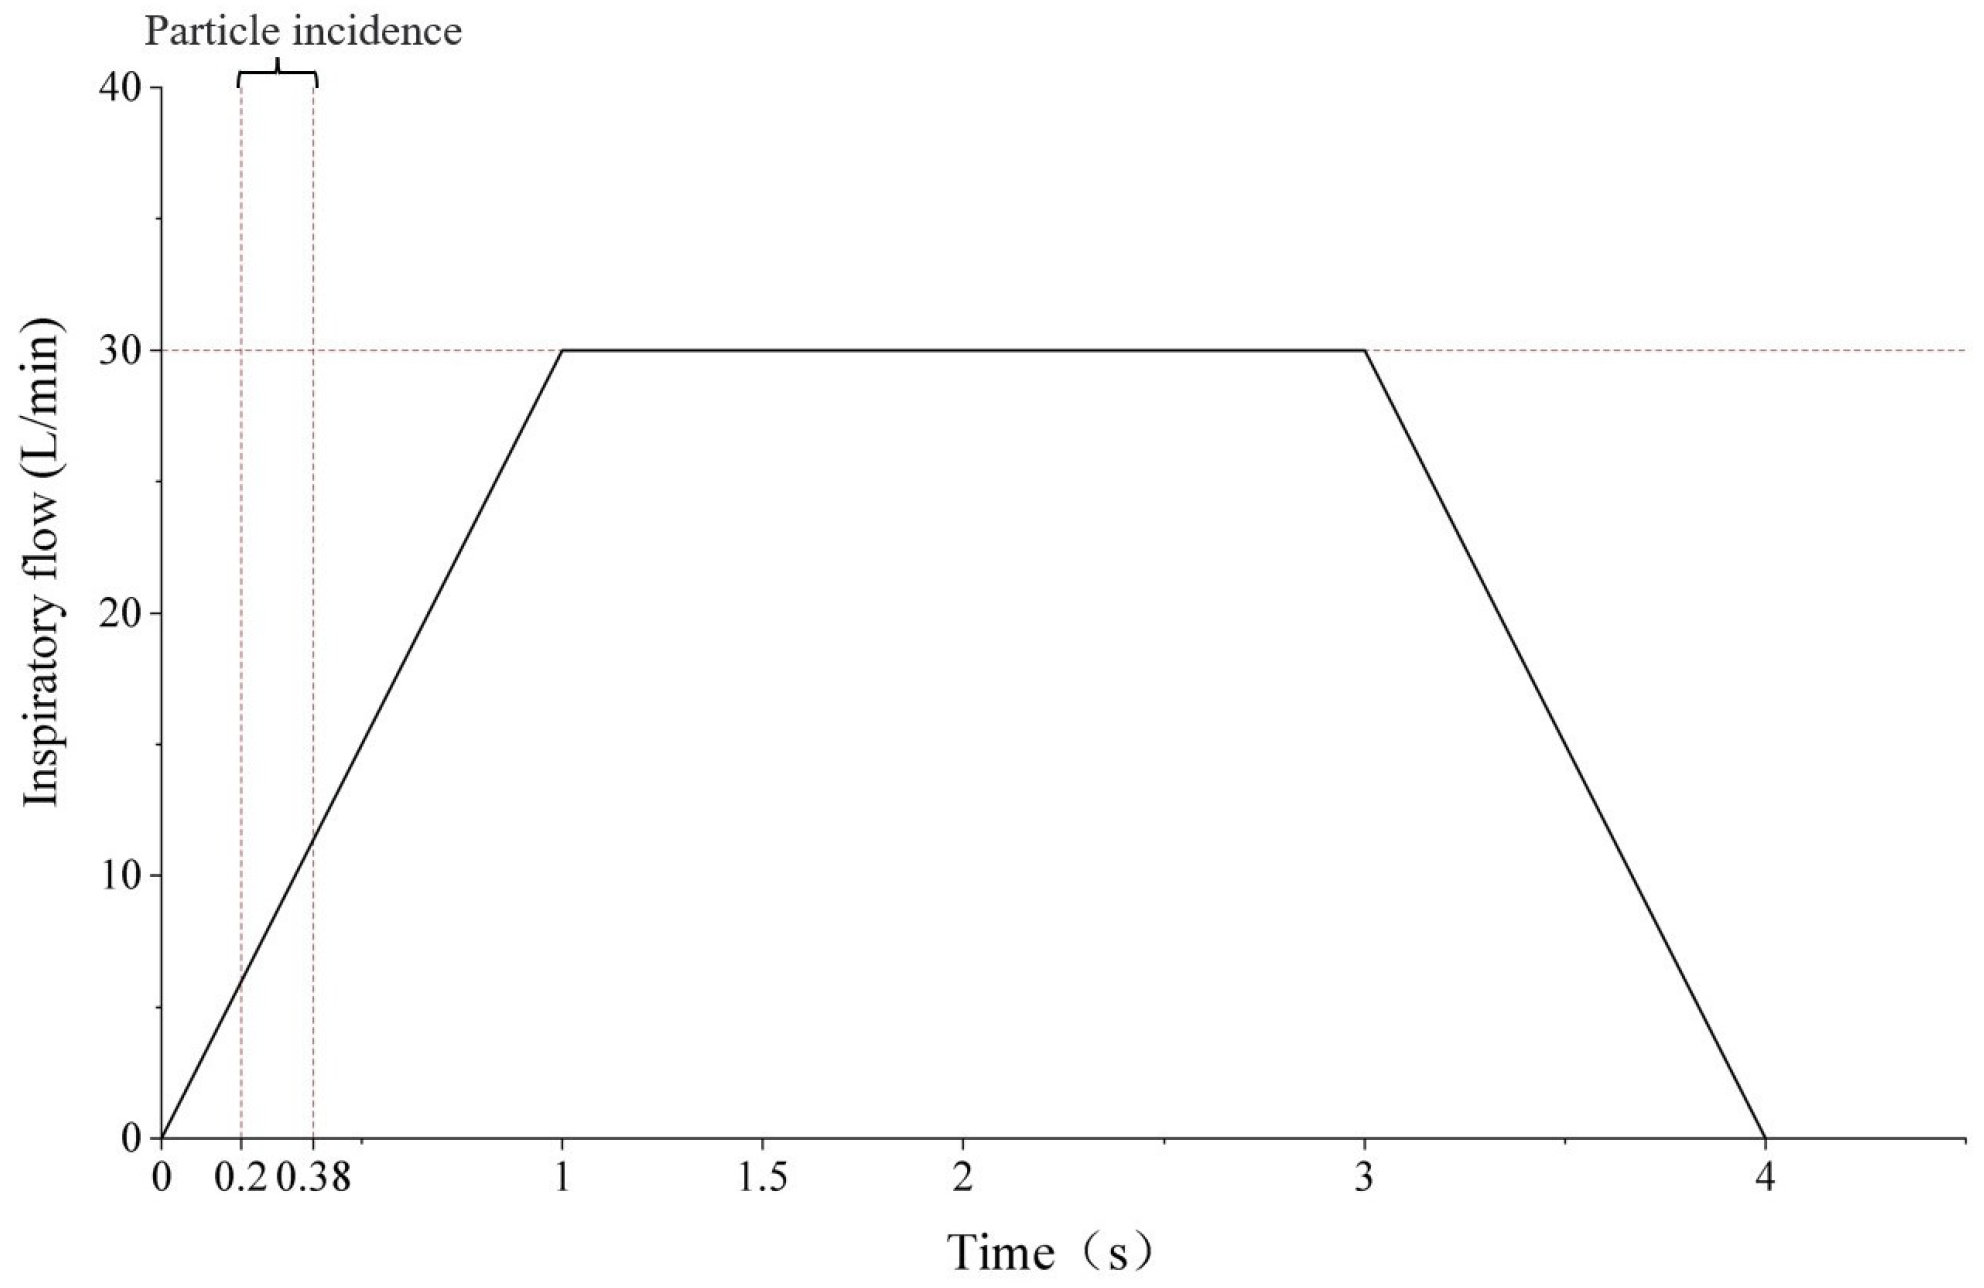
Figure 5.
Particle size distribution.

Figure 6.
Fitted curves of the deposition fraction of drug particles in the mouth and throat regions under different peak inspiratory flows rates.
Figure 6.
Fitted curves of the deposition fraction of drug particles in the mouth and throat regions under different peak inspiratory flows rates.

Figure 7.
Cloud plots of the deposition fraction of drug particles in the mouth and throat regions at the following Qmax values: (A) 30 L/min; (B) 60 L/min; (C) 90 L/min.
Figure 7.
Cloud plots of the deposition fraction of drug particles in the mouth and throat regions at the following Qmax values: (A) 30 L/min; (B) 60 L/min; (C) 90 L/min.
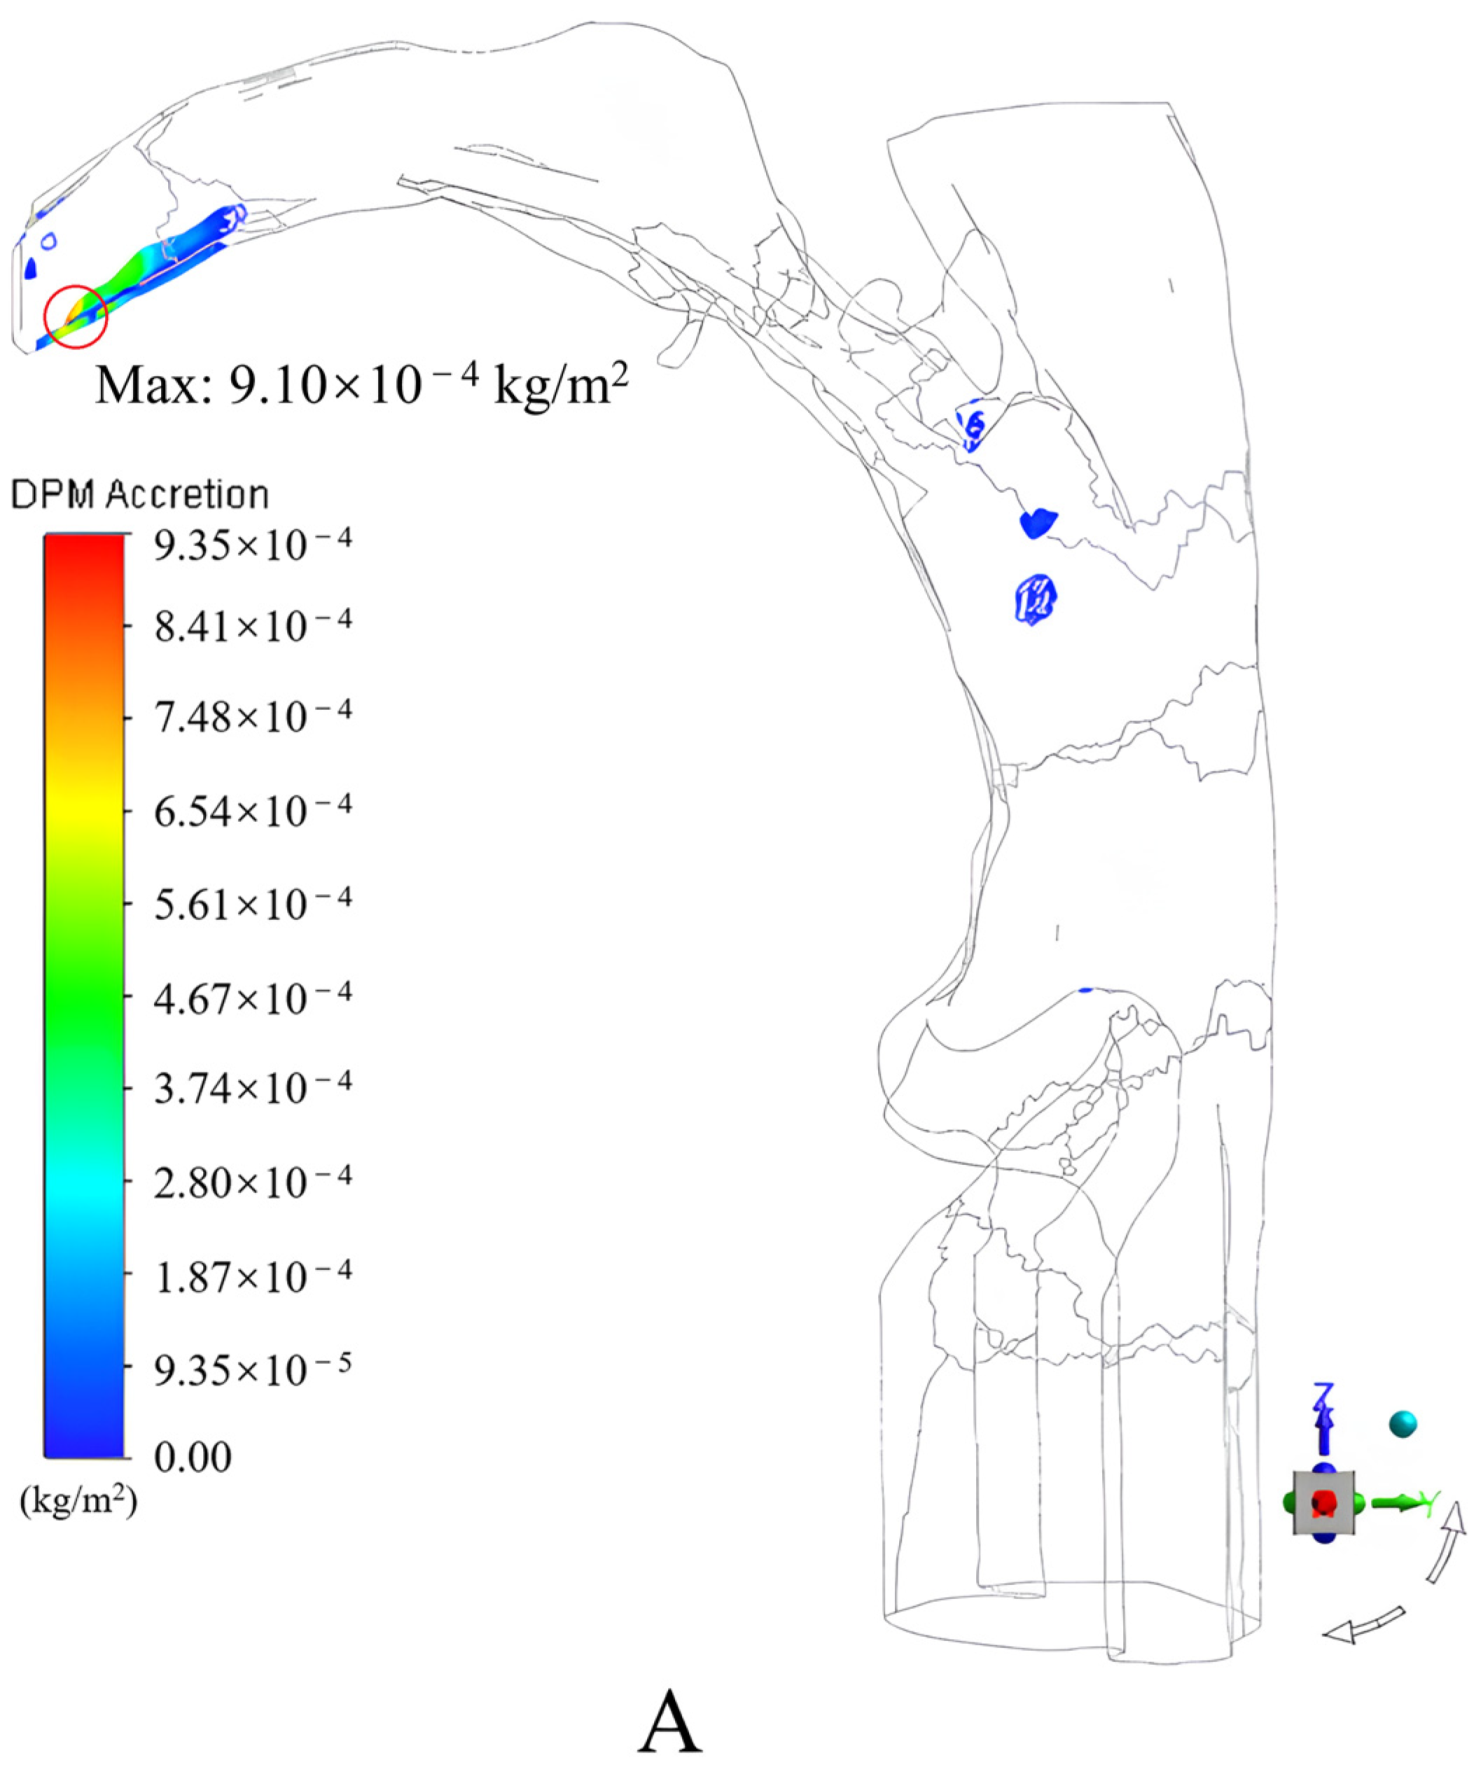
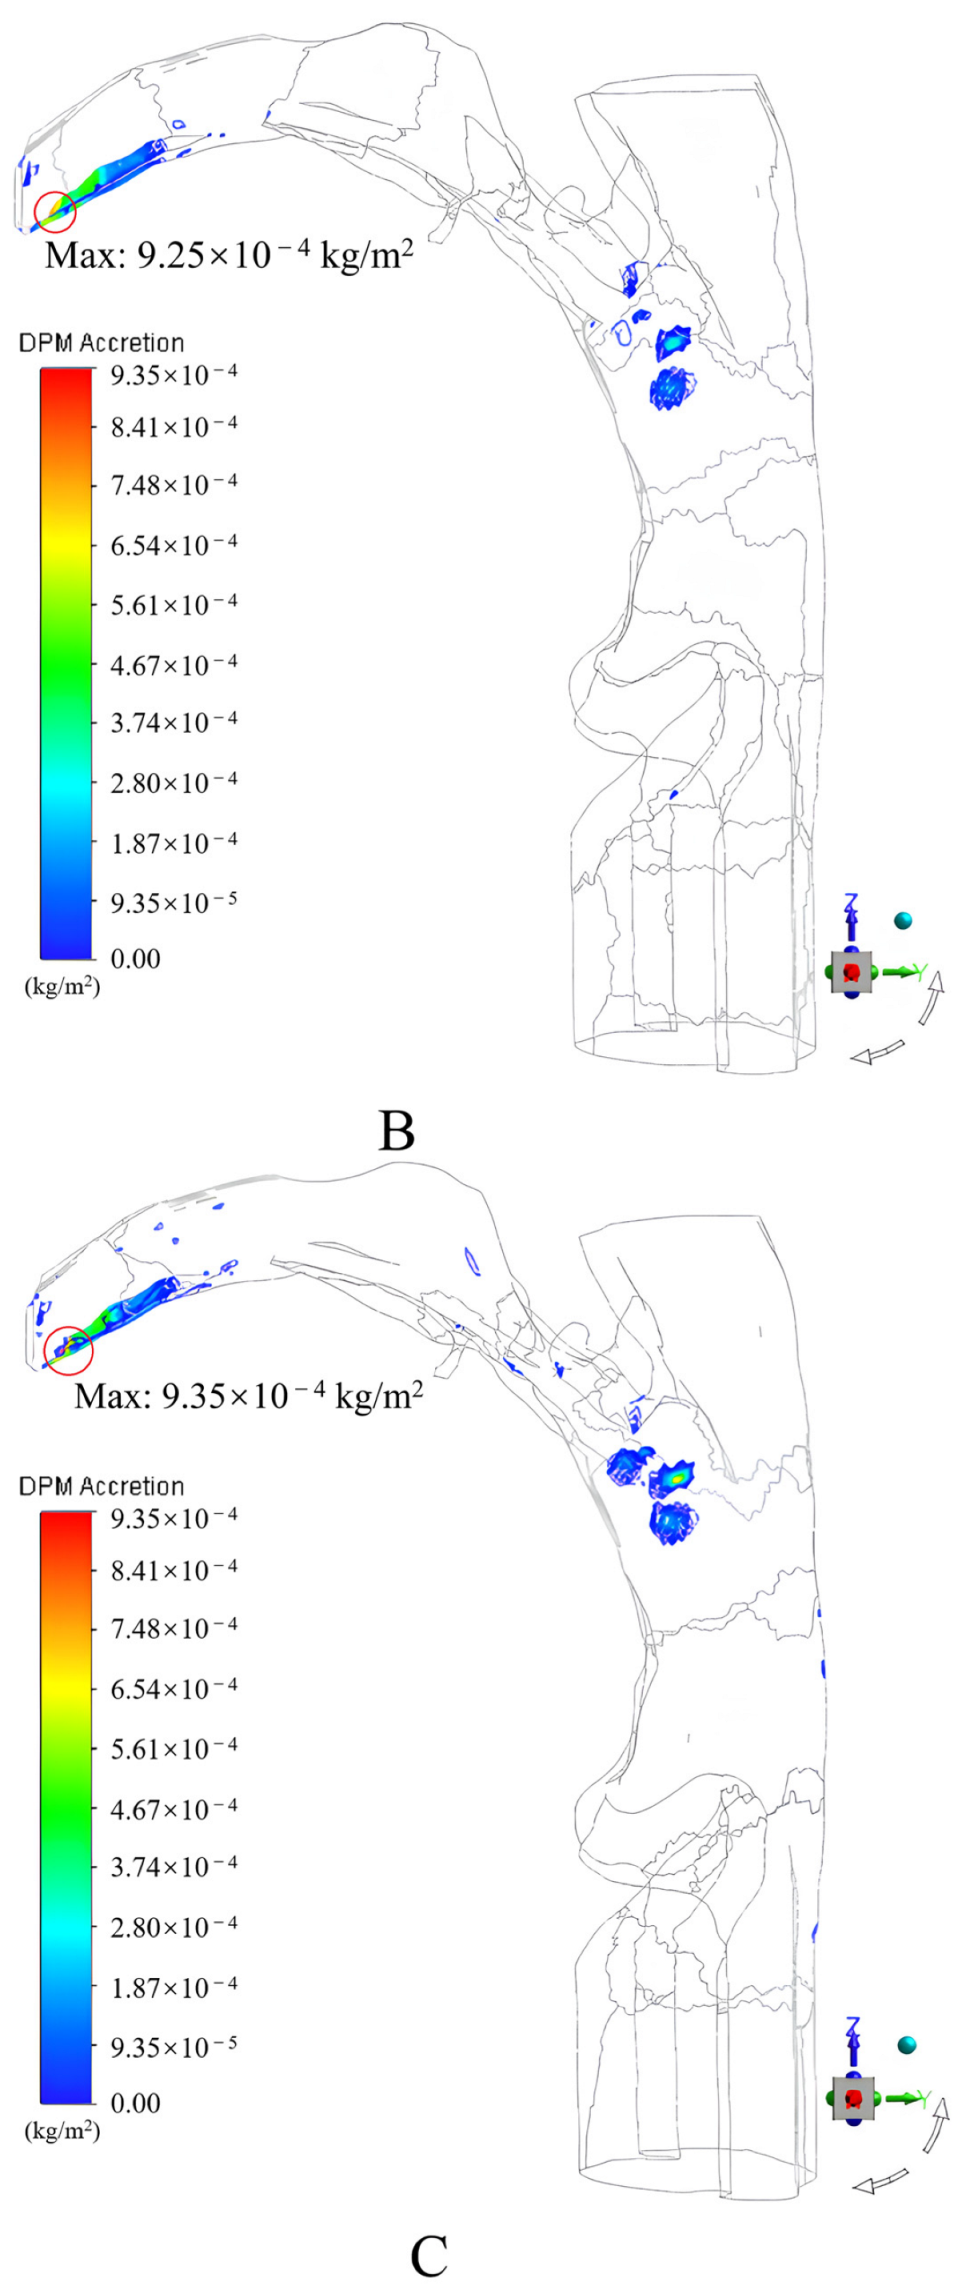
Figure 8.
Schematic of the angle of incidence of drug particles.
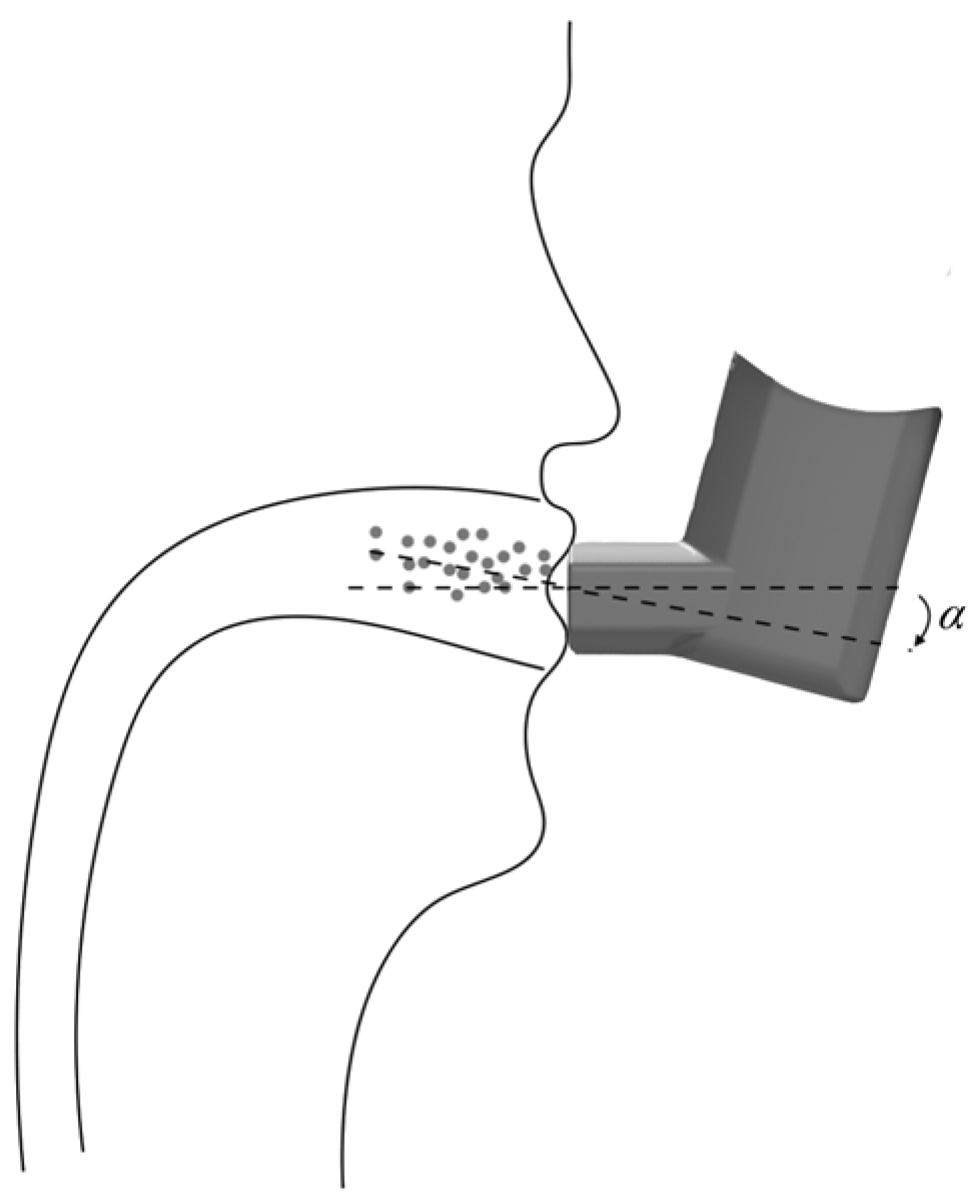
Figure 9.
Fitted curves of the deposition fractions of drug particles in the mouth and throat regions at different incidence angles.
Figure 9.
Fitted curves of the deposition fractions of drug particles in the mouth and throat regions at different incidence angles.
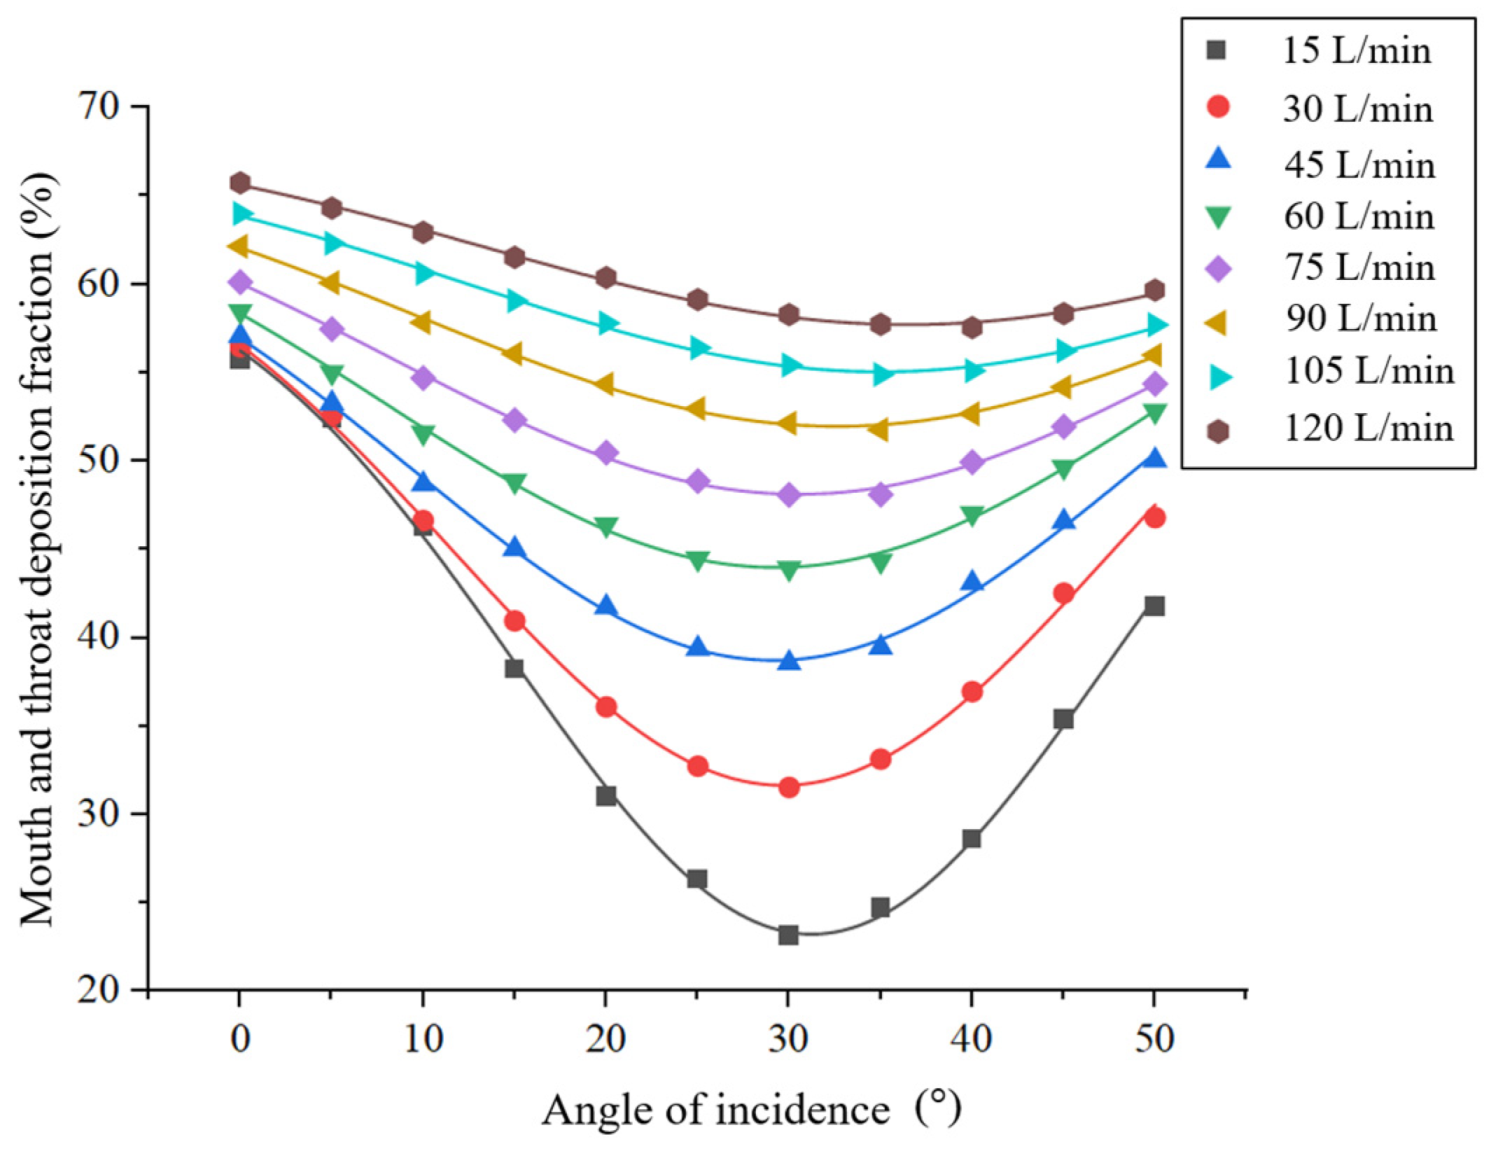
Figure 10.
Cloud plots of the deposition fractions of drug particles in the mouth and throat at the following incidence angles with Qmax = 30 L/min. (A) 0°; (B) 15°; (C) 30°; (D) 40°.
Figure 10.
Cloud plots of the deposition fractions of drug particles in the mouth and throat at the following incidence angles with Qmax = 30 L/min. (A) 0°; (B) 15°; (C) 30°; (D) 40°.
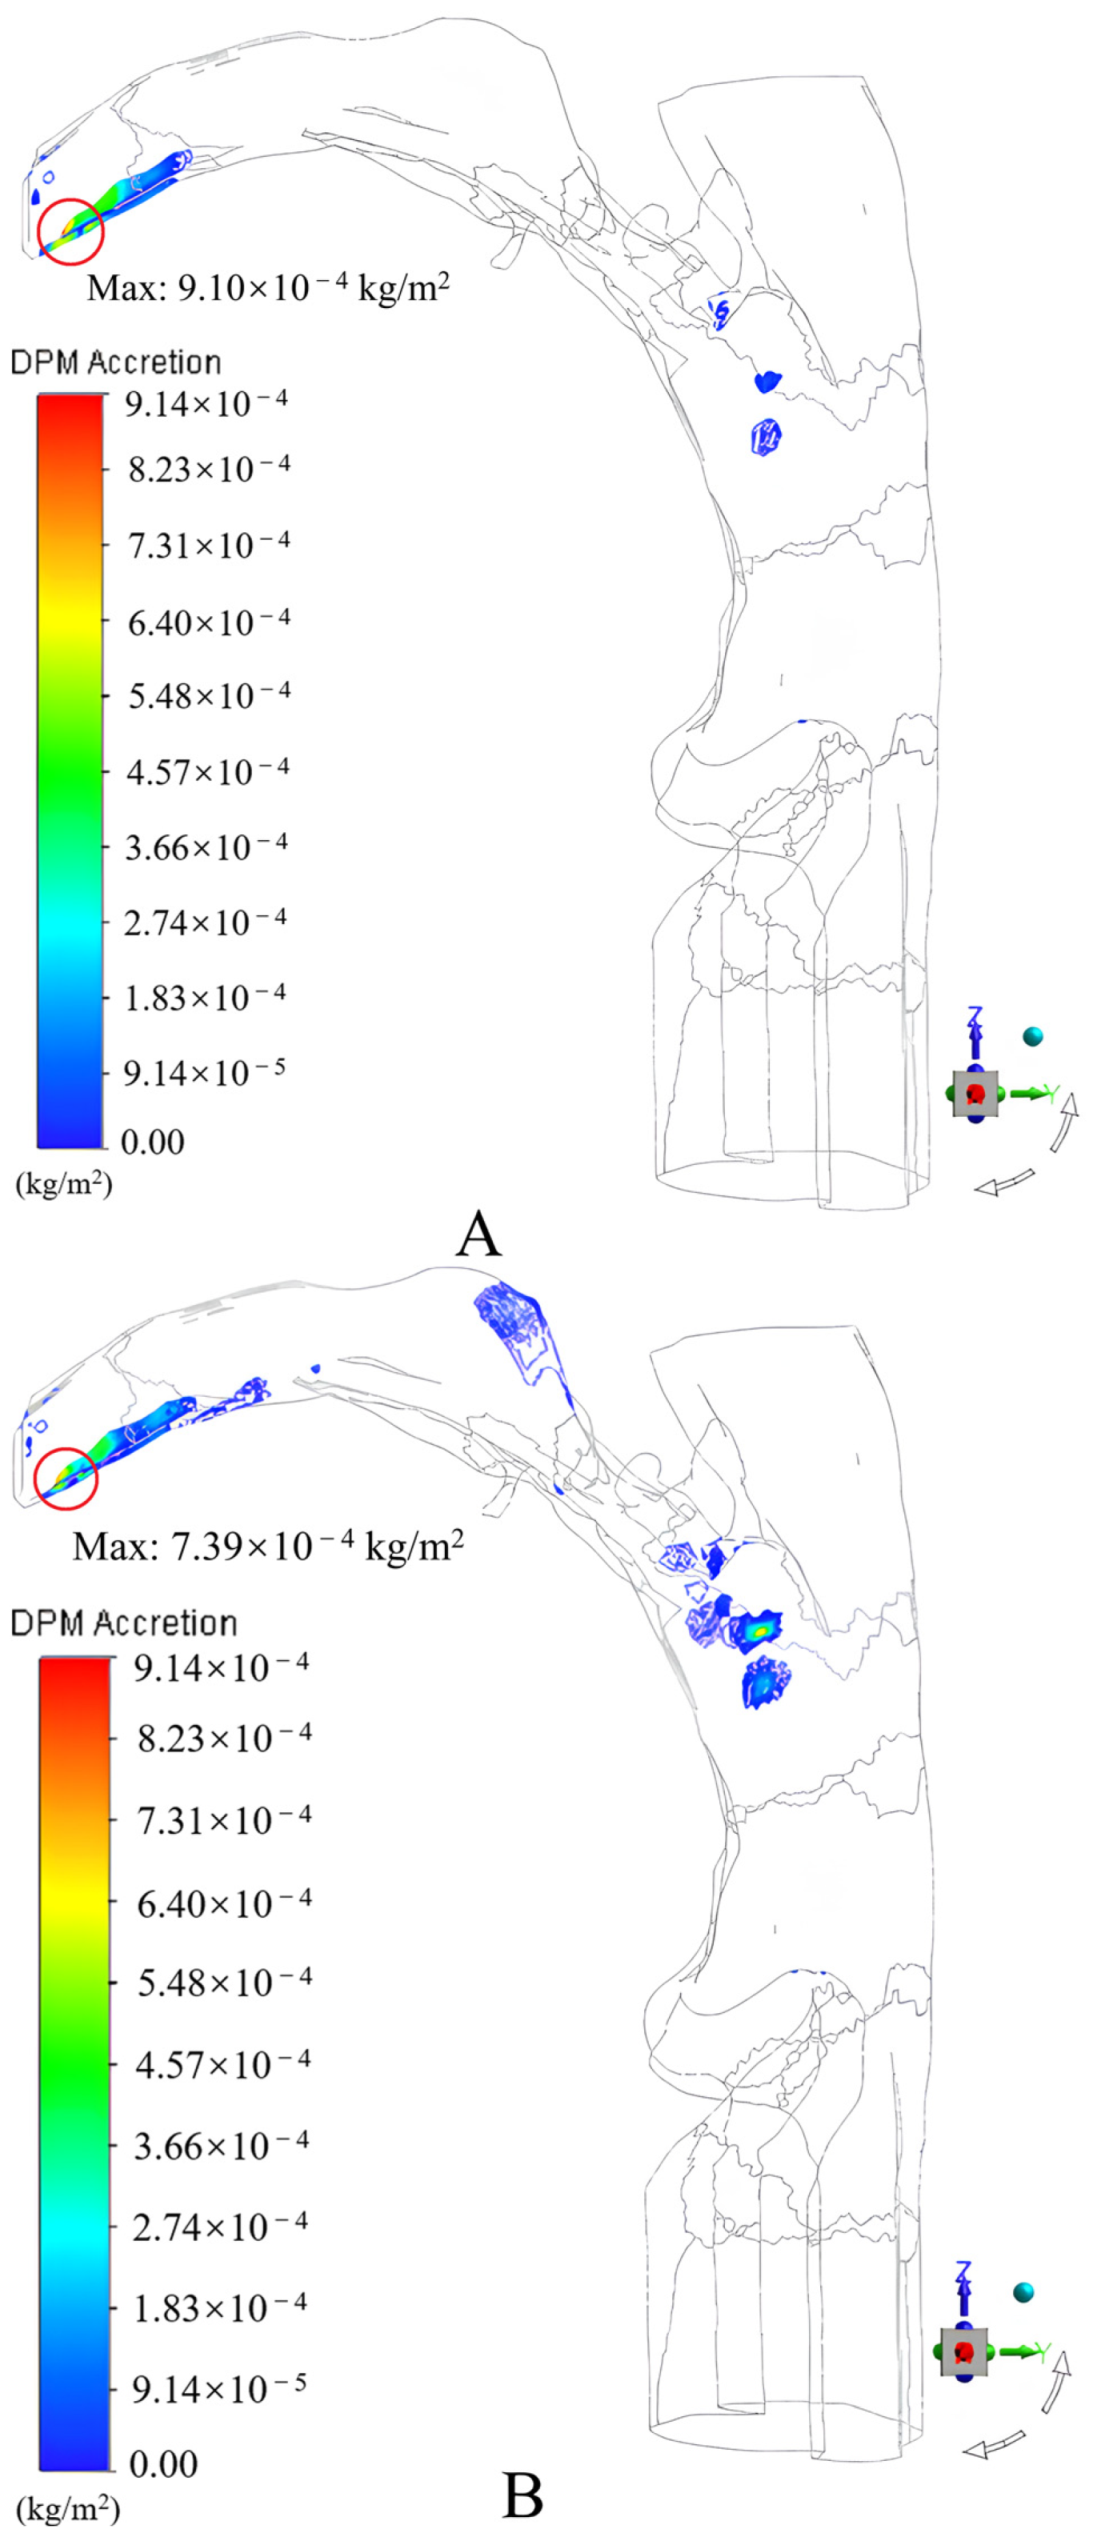
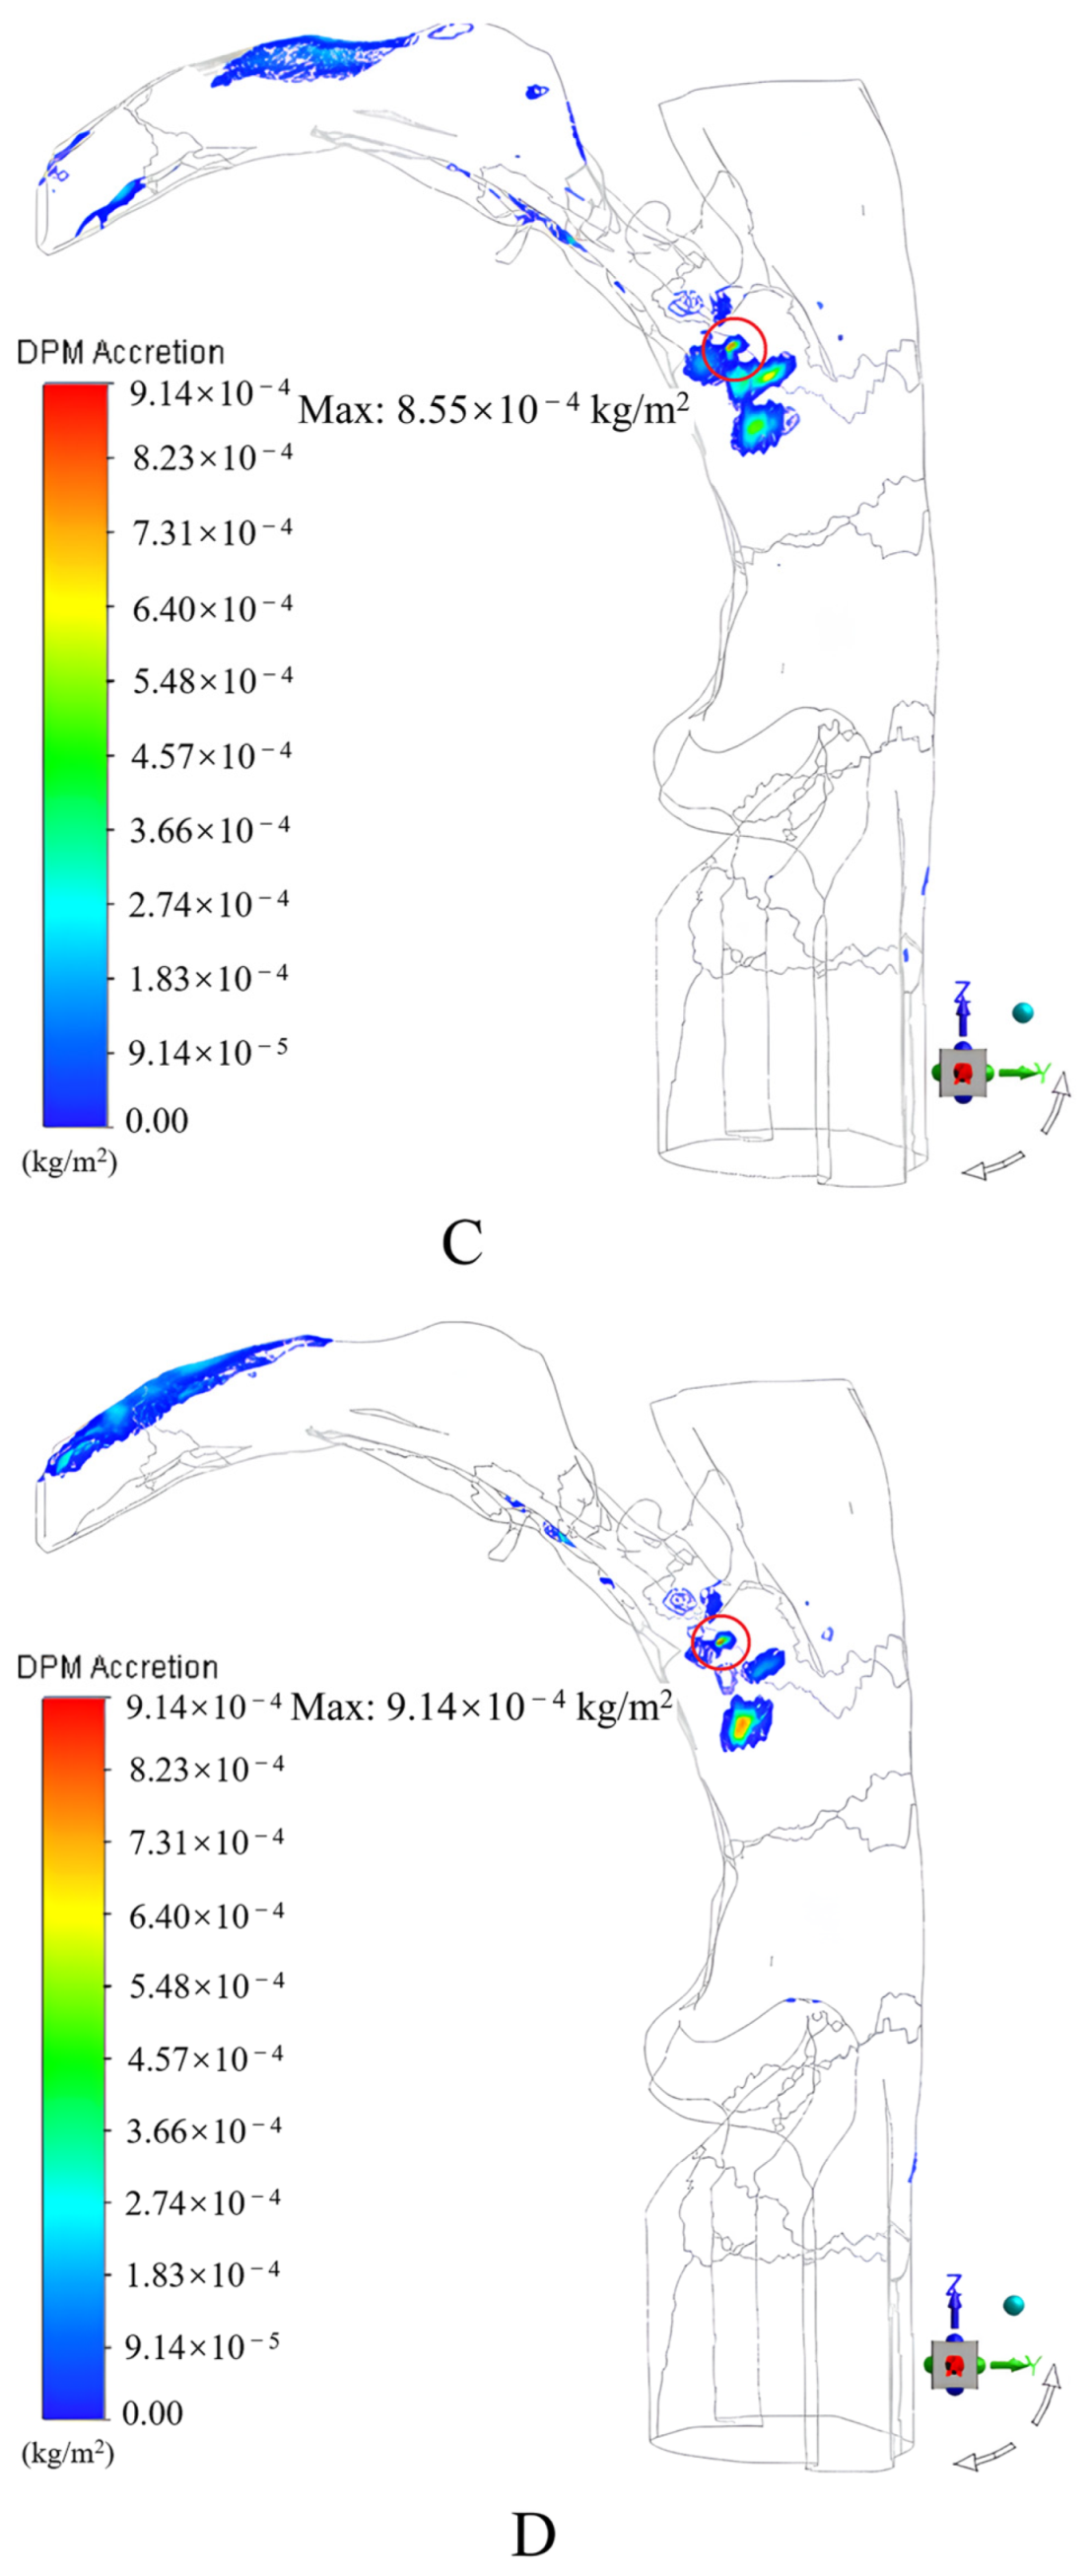
Figure 11.
Fitted curves of the optimal incidence angles.
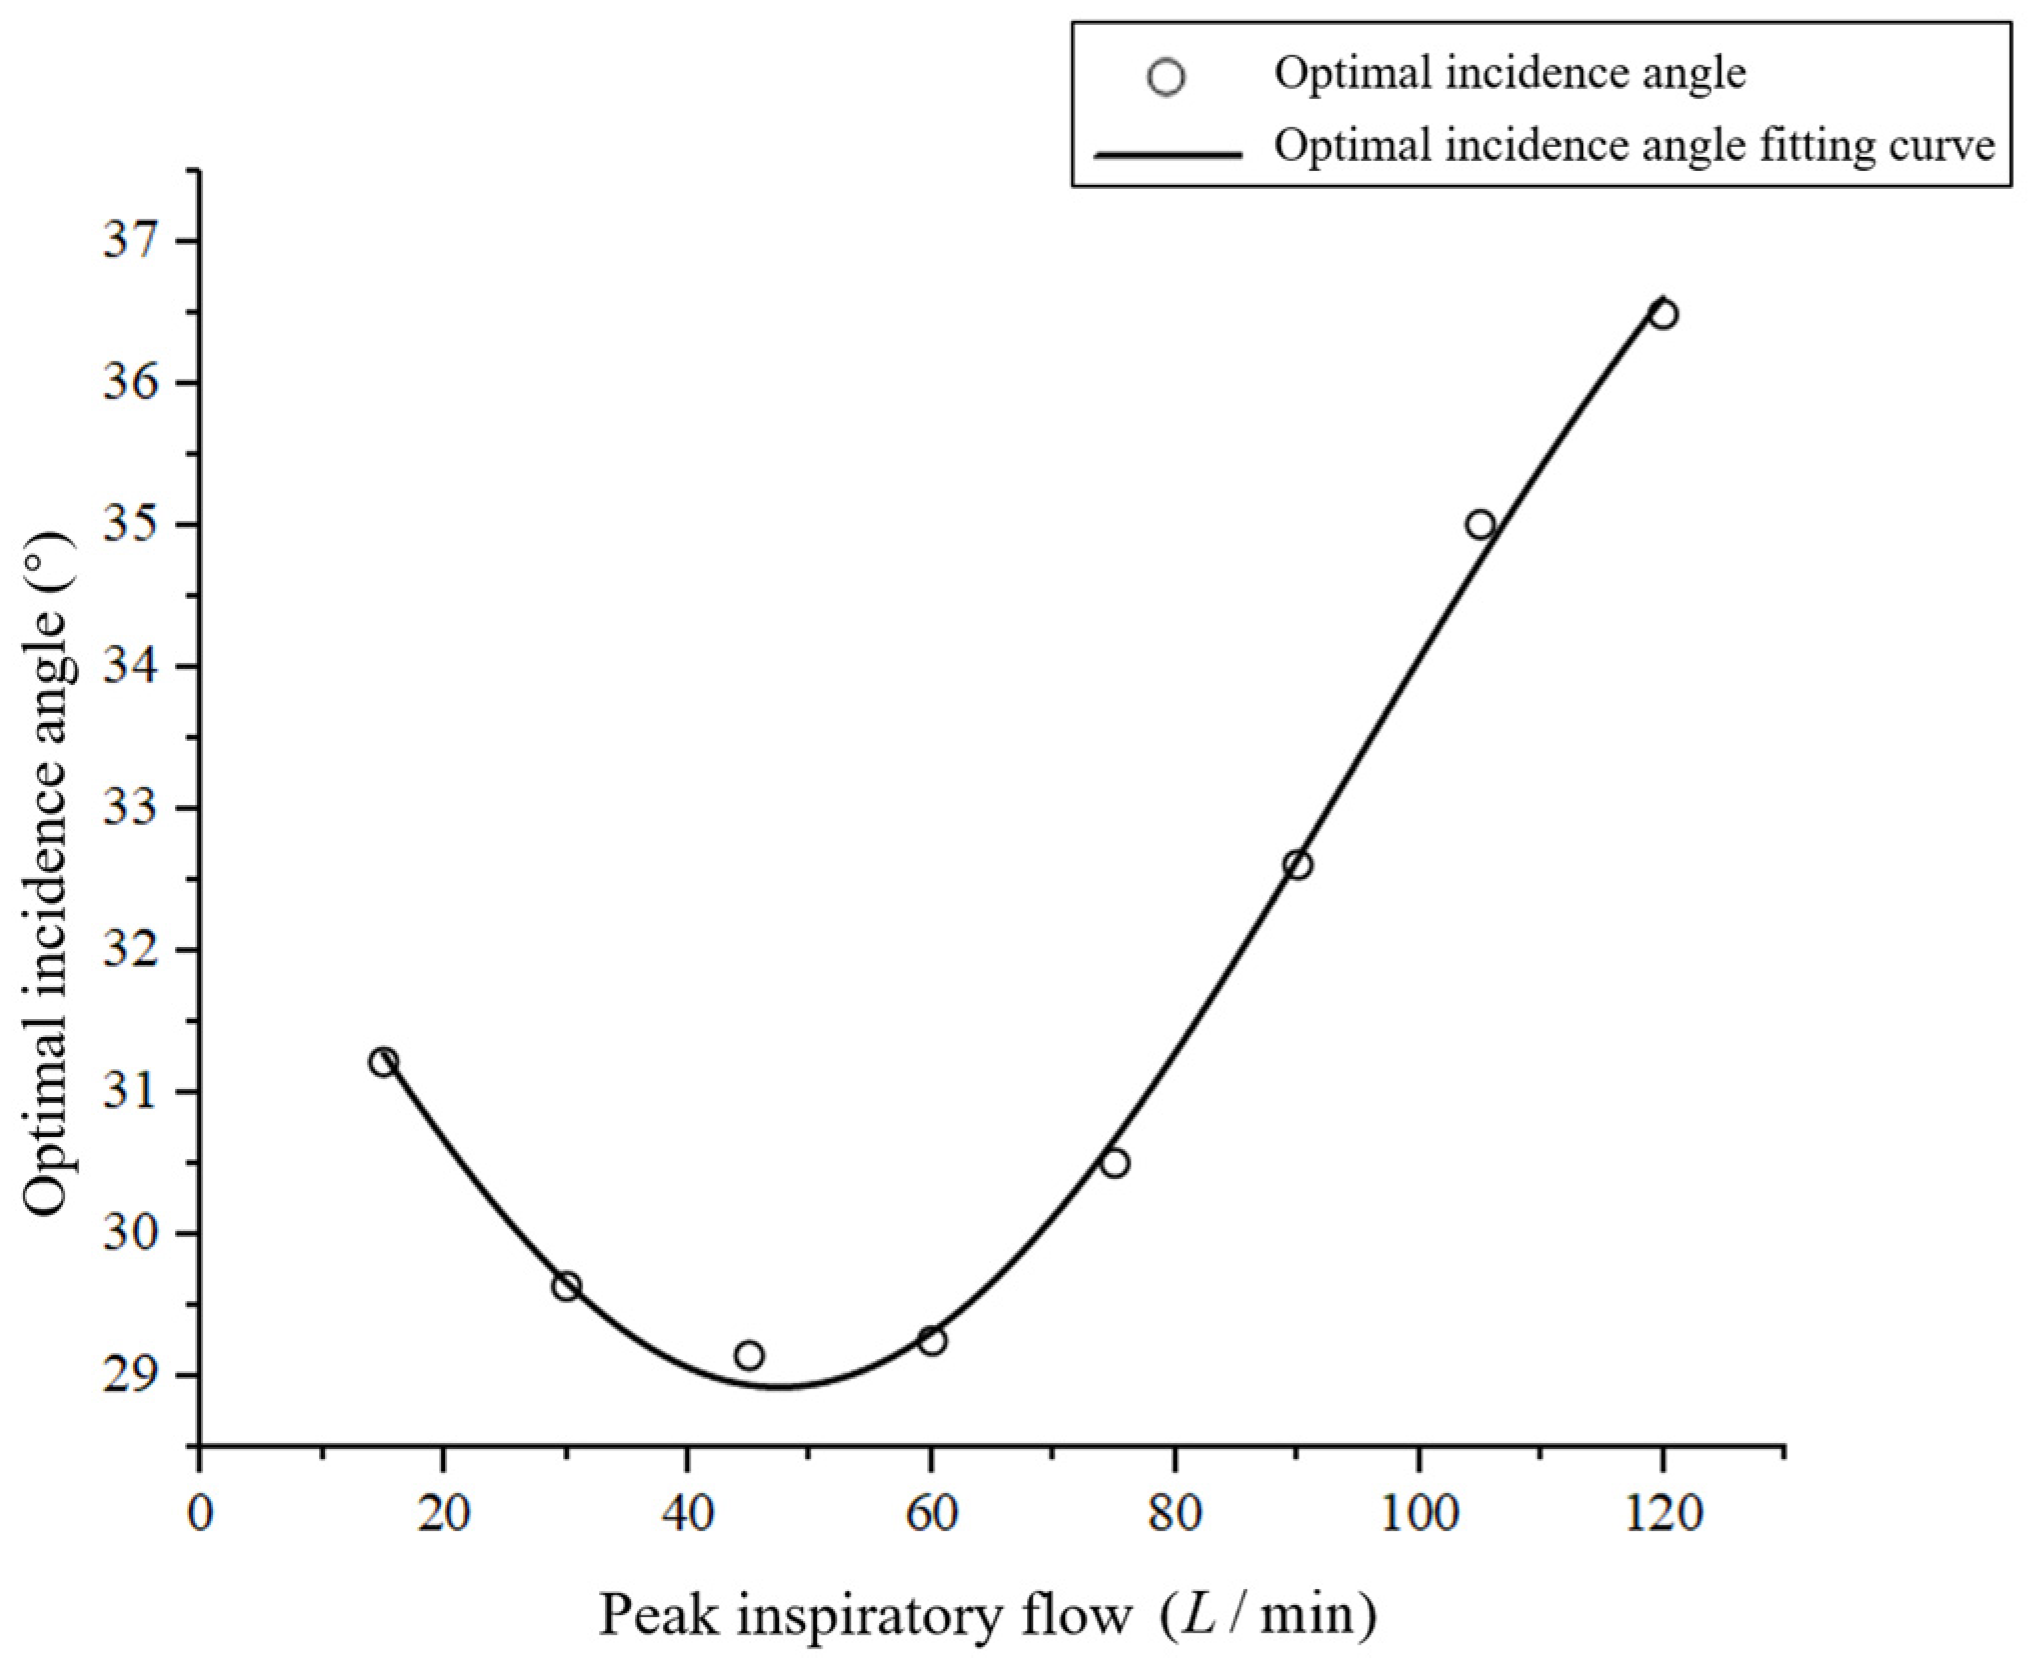
Figure 12.
Fitted curves of the deposition fractions of drug particles in the mouth and throat at different inspiration–press intervals for α = 0°.
Figure 12.
Fitted curves of the deposition fractions of drug particles in the mouth and throat at different inspiration–press intervals for α = 0°.
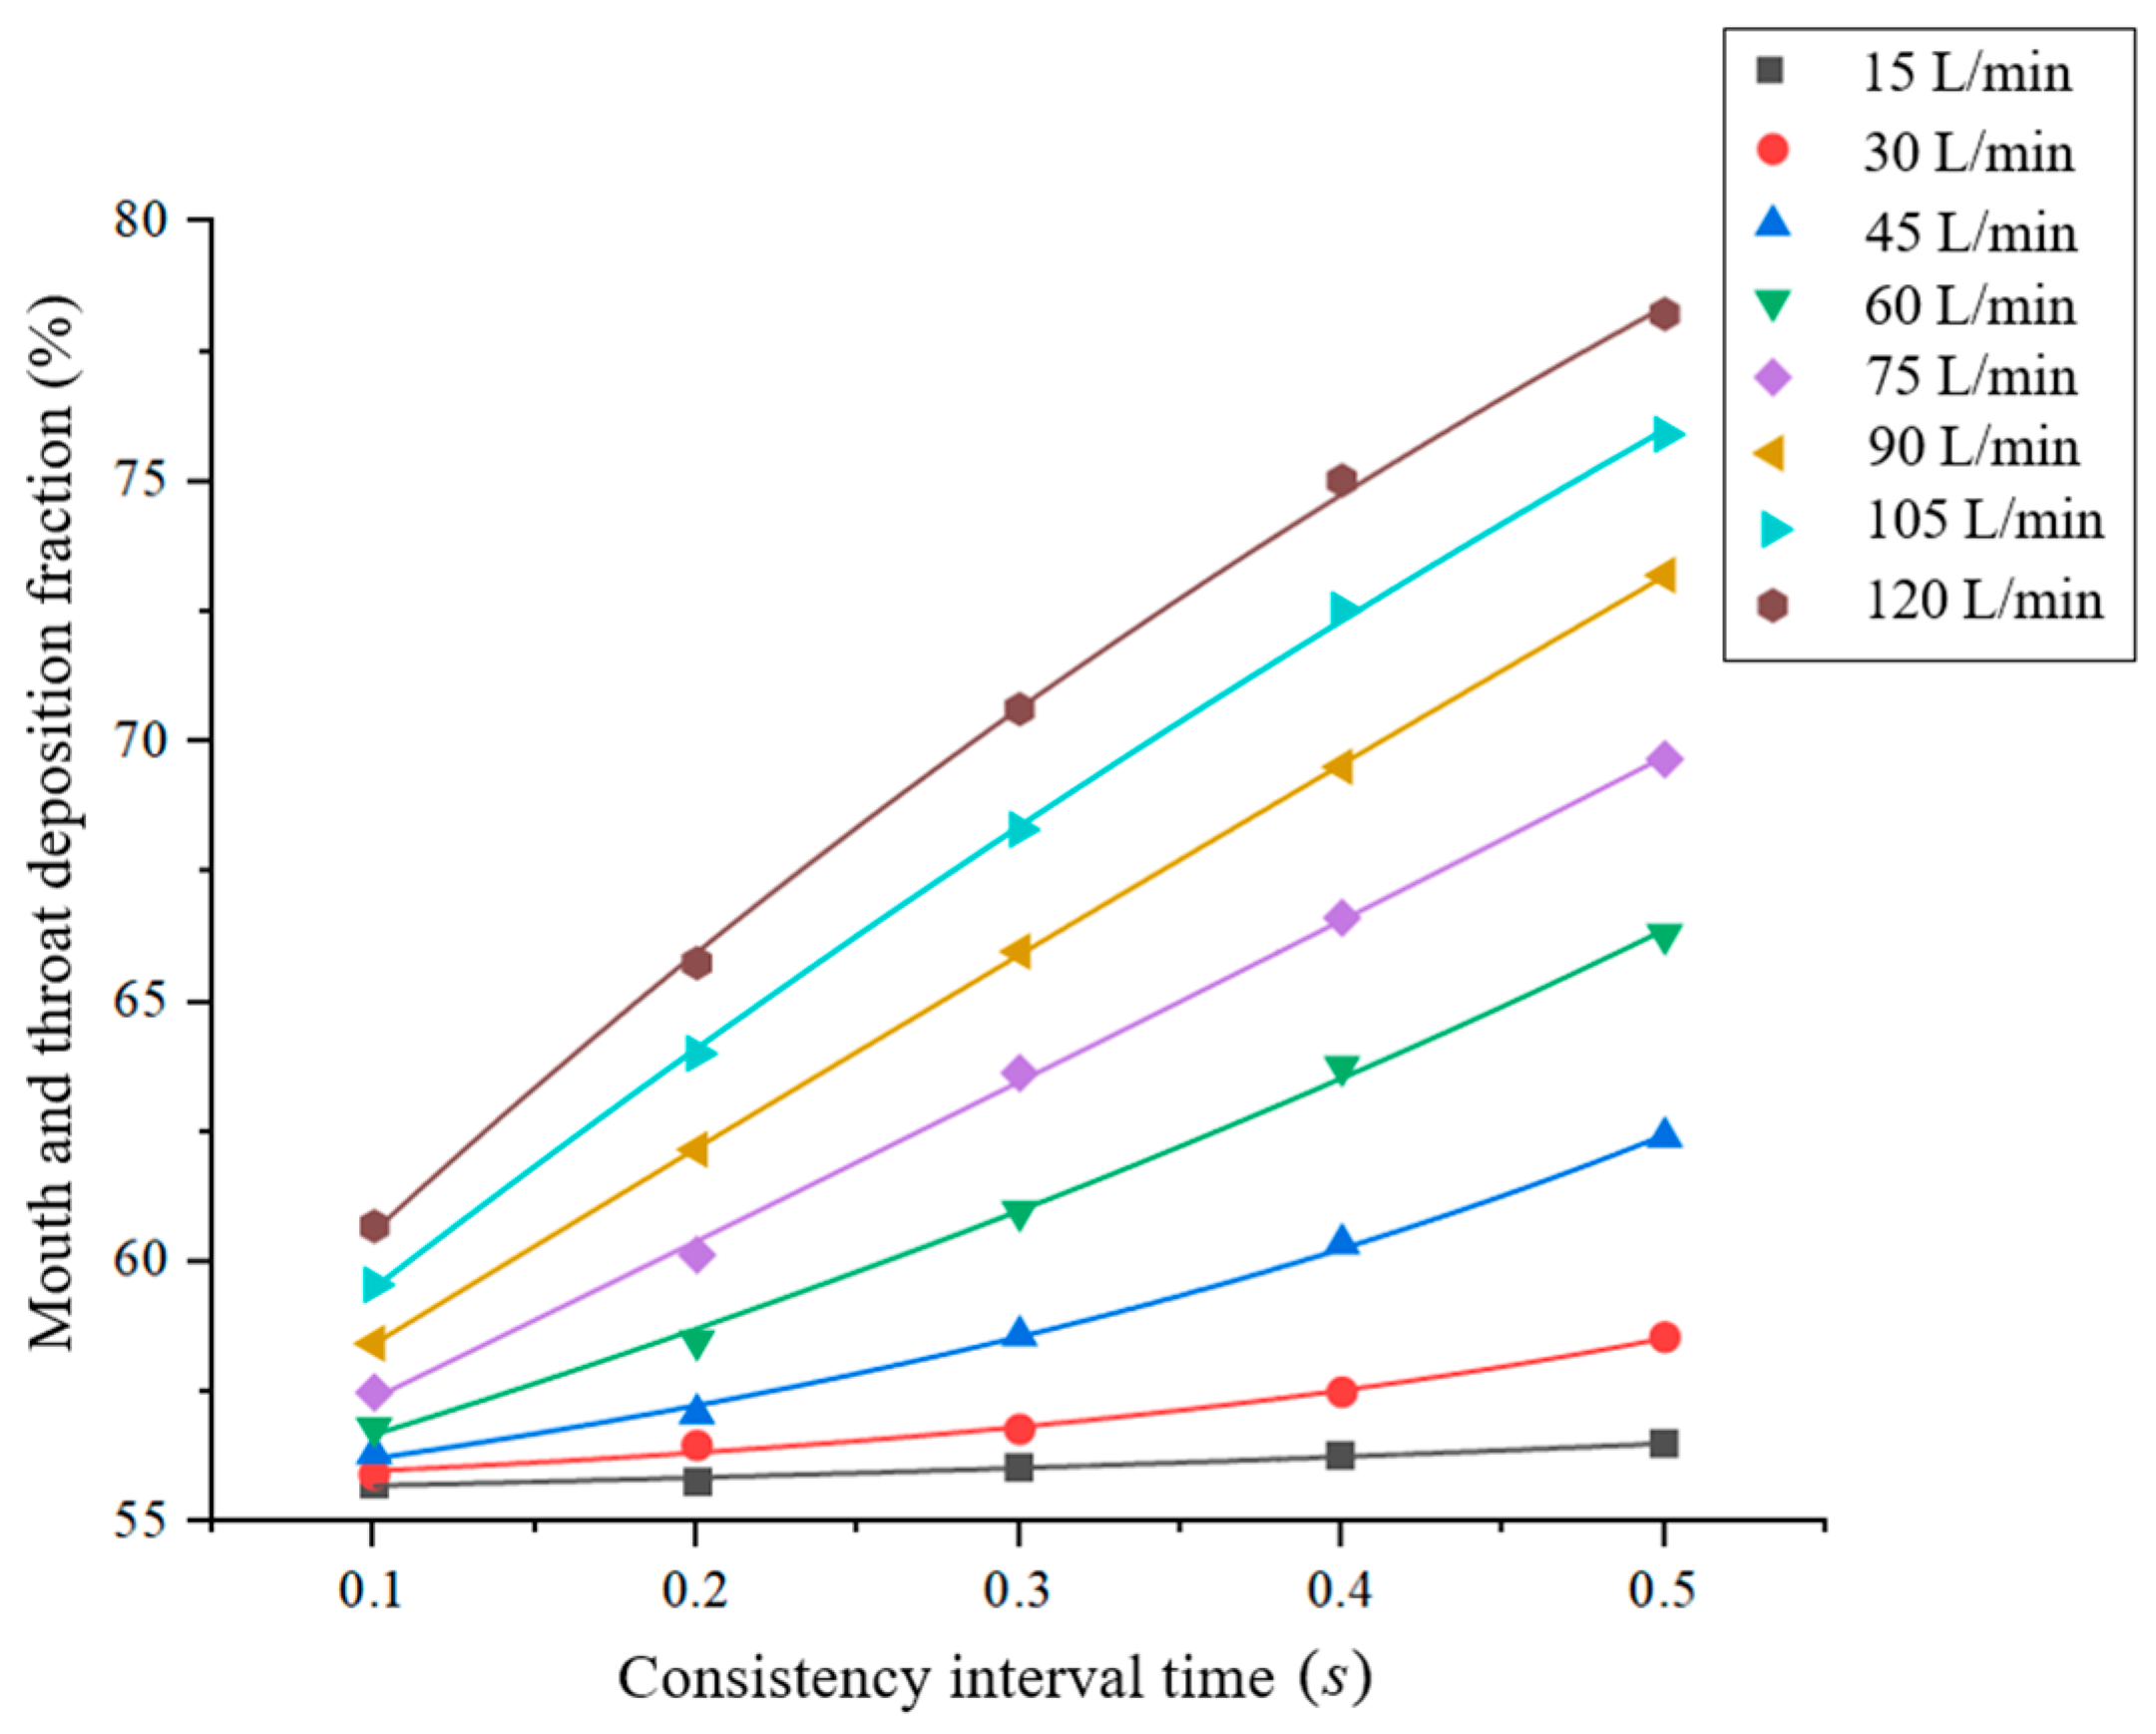
Figure 13.
Fitted curves of the deposition fractions of drug particles in the mouth and throat at different inspiration–press intervals for α = 30°.
Figure 13.
Fitted curves of the deposition fractions of drug particles in the mouth and throat at different inspiration–press intervals for α = 30°.

Figure 14.
Schematic of the smart MDI: 1. aerosol tank; 2. housing; 3. angle switching nozzle; 4. stepper motor; 5. disc impeller; 6. slotted optocoupler; 7. press end cap; 8. push–pull lever; 9. solenoid.
Figure 14.
Schematic of the smart MDI: 1. aerosol tank; 2. housing; 3. angle switching nozzle; 4. stepper motor; 5. disc impeller; 6. slotted optocoupler; 7. press end cap; 8. push–pull lever; 9. solenoid.
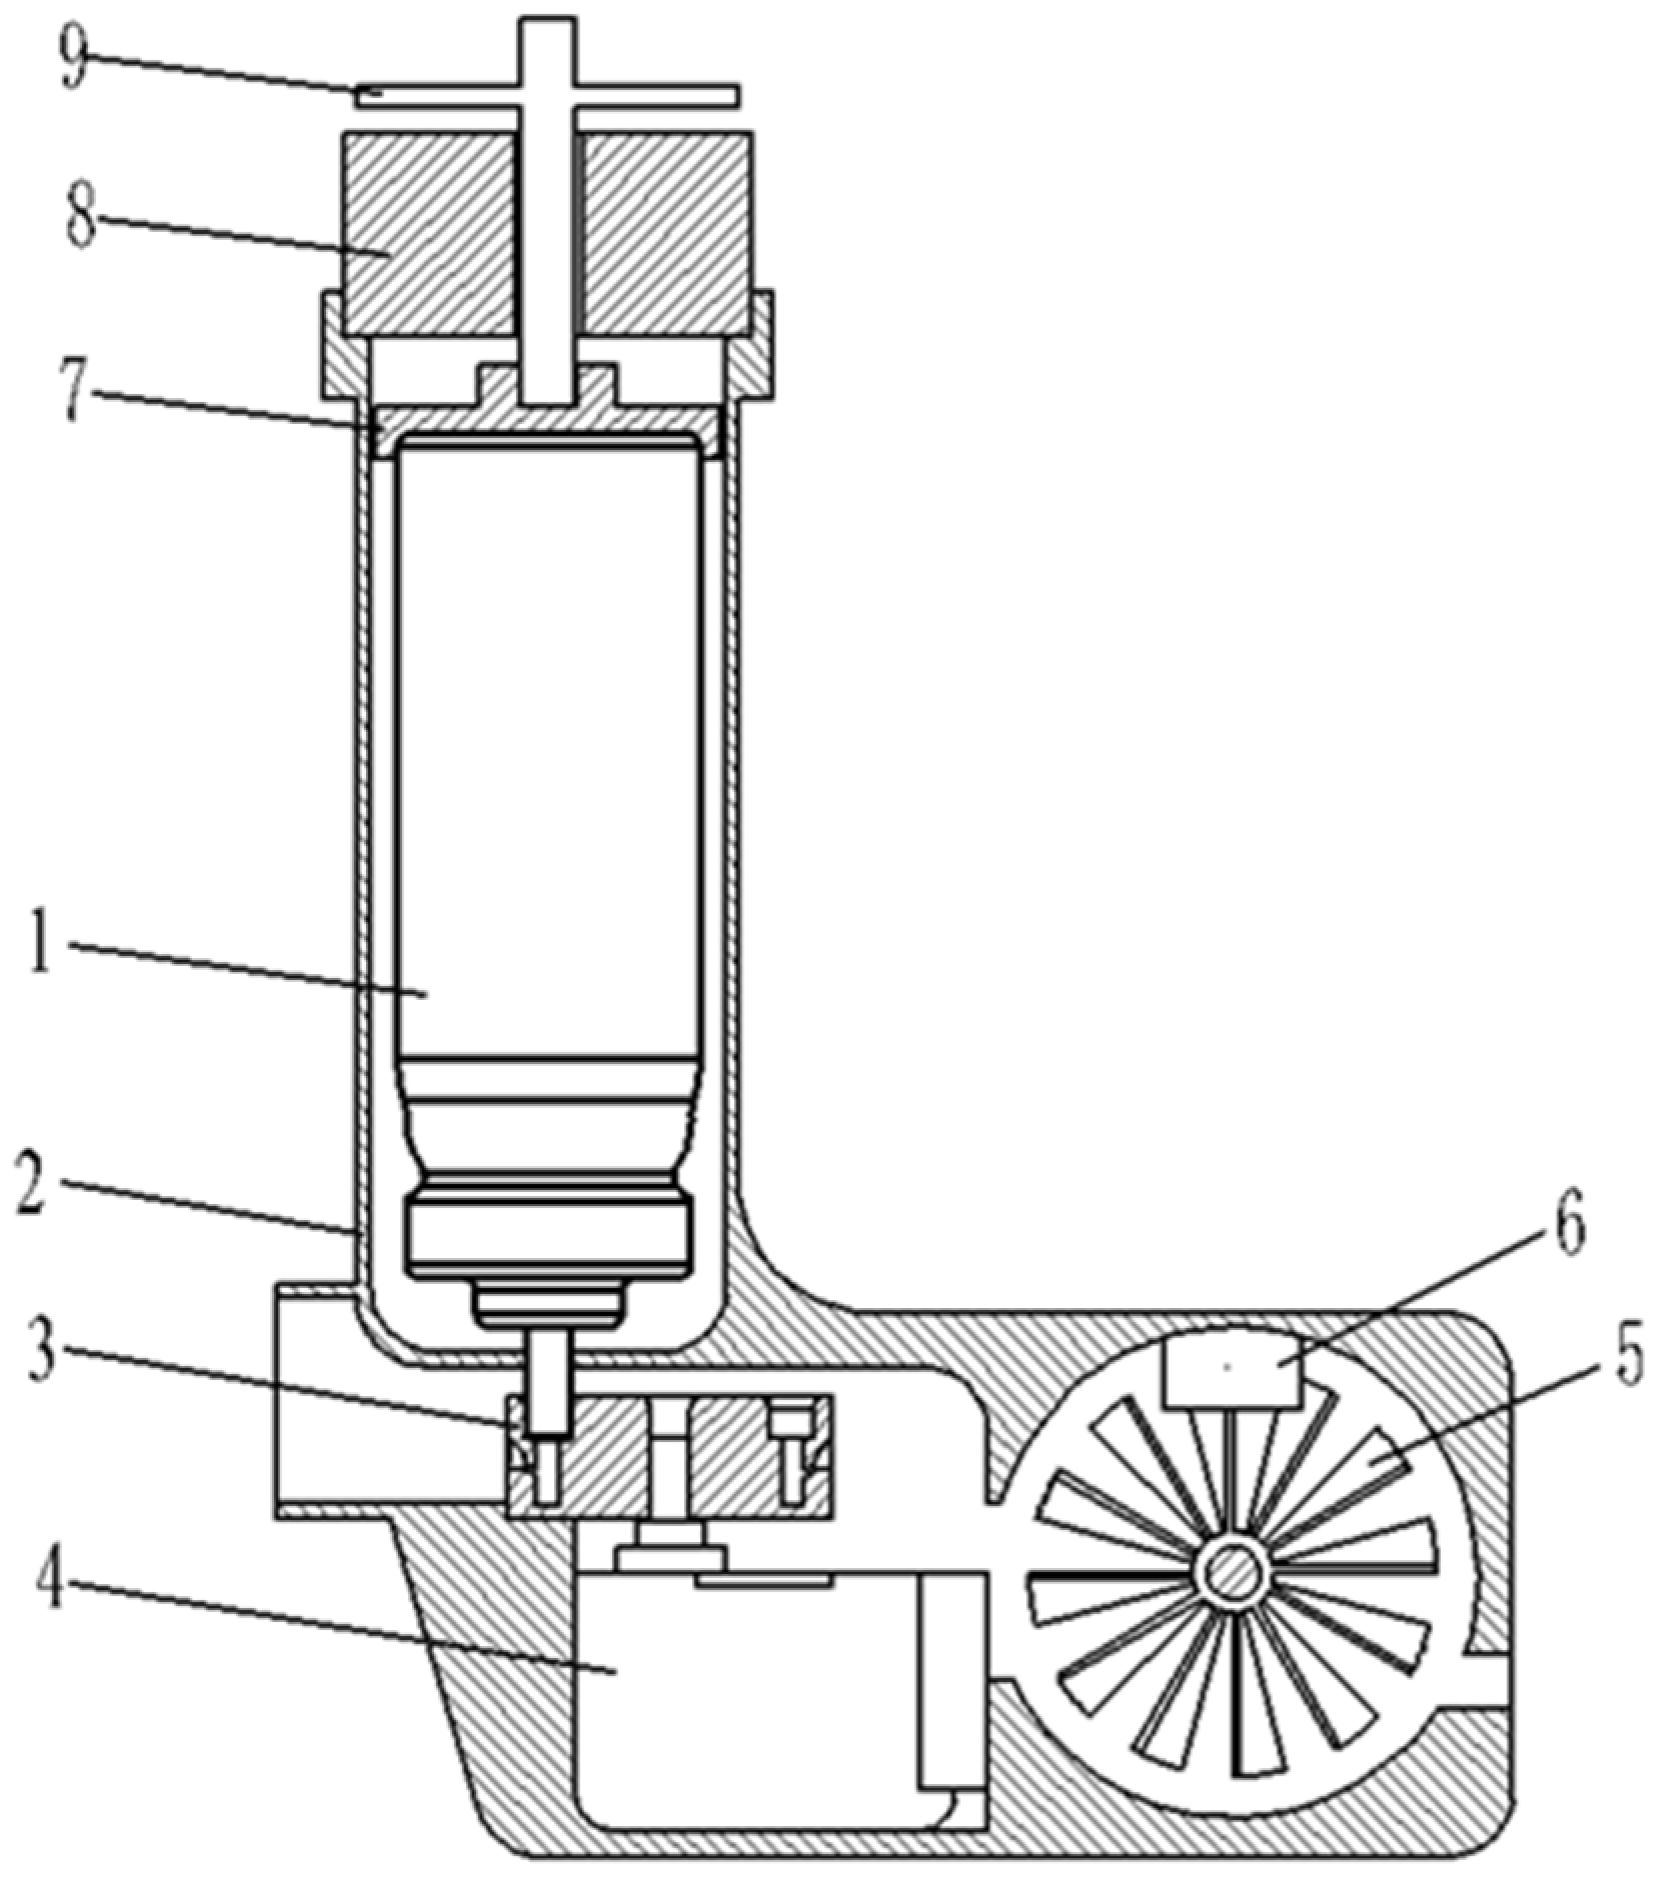
Figure 15.
Schematic of the disc impeller. (A) Structural diagram; (B) dimensional drawing (mm).
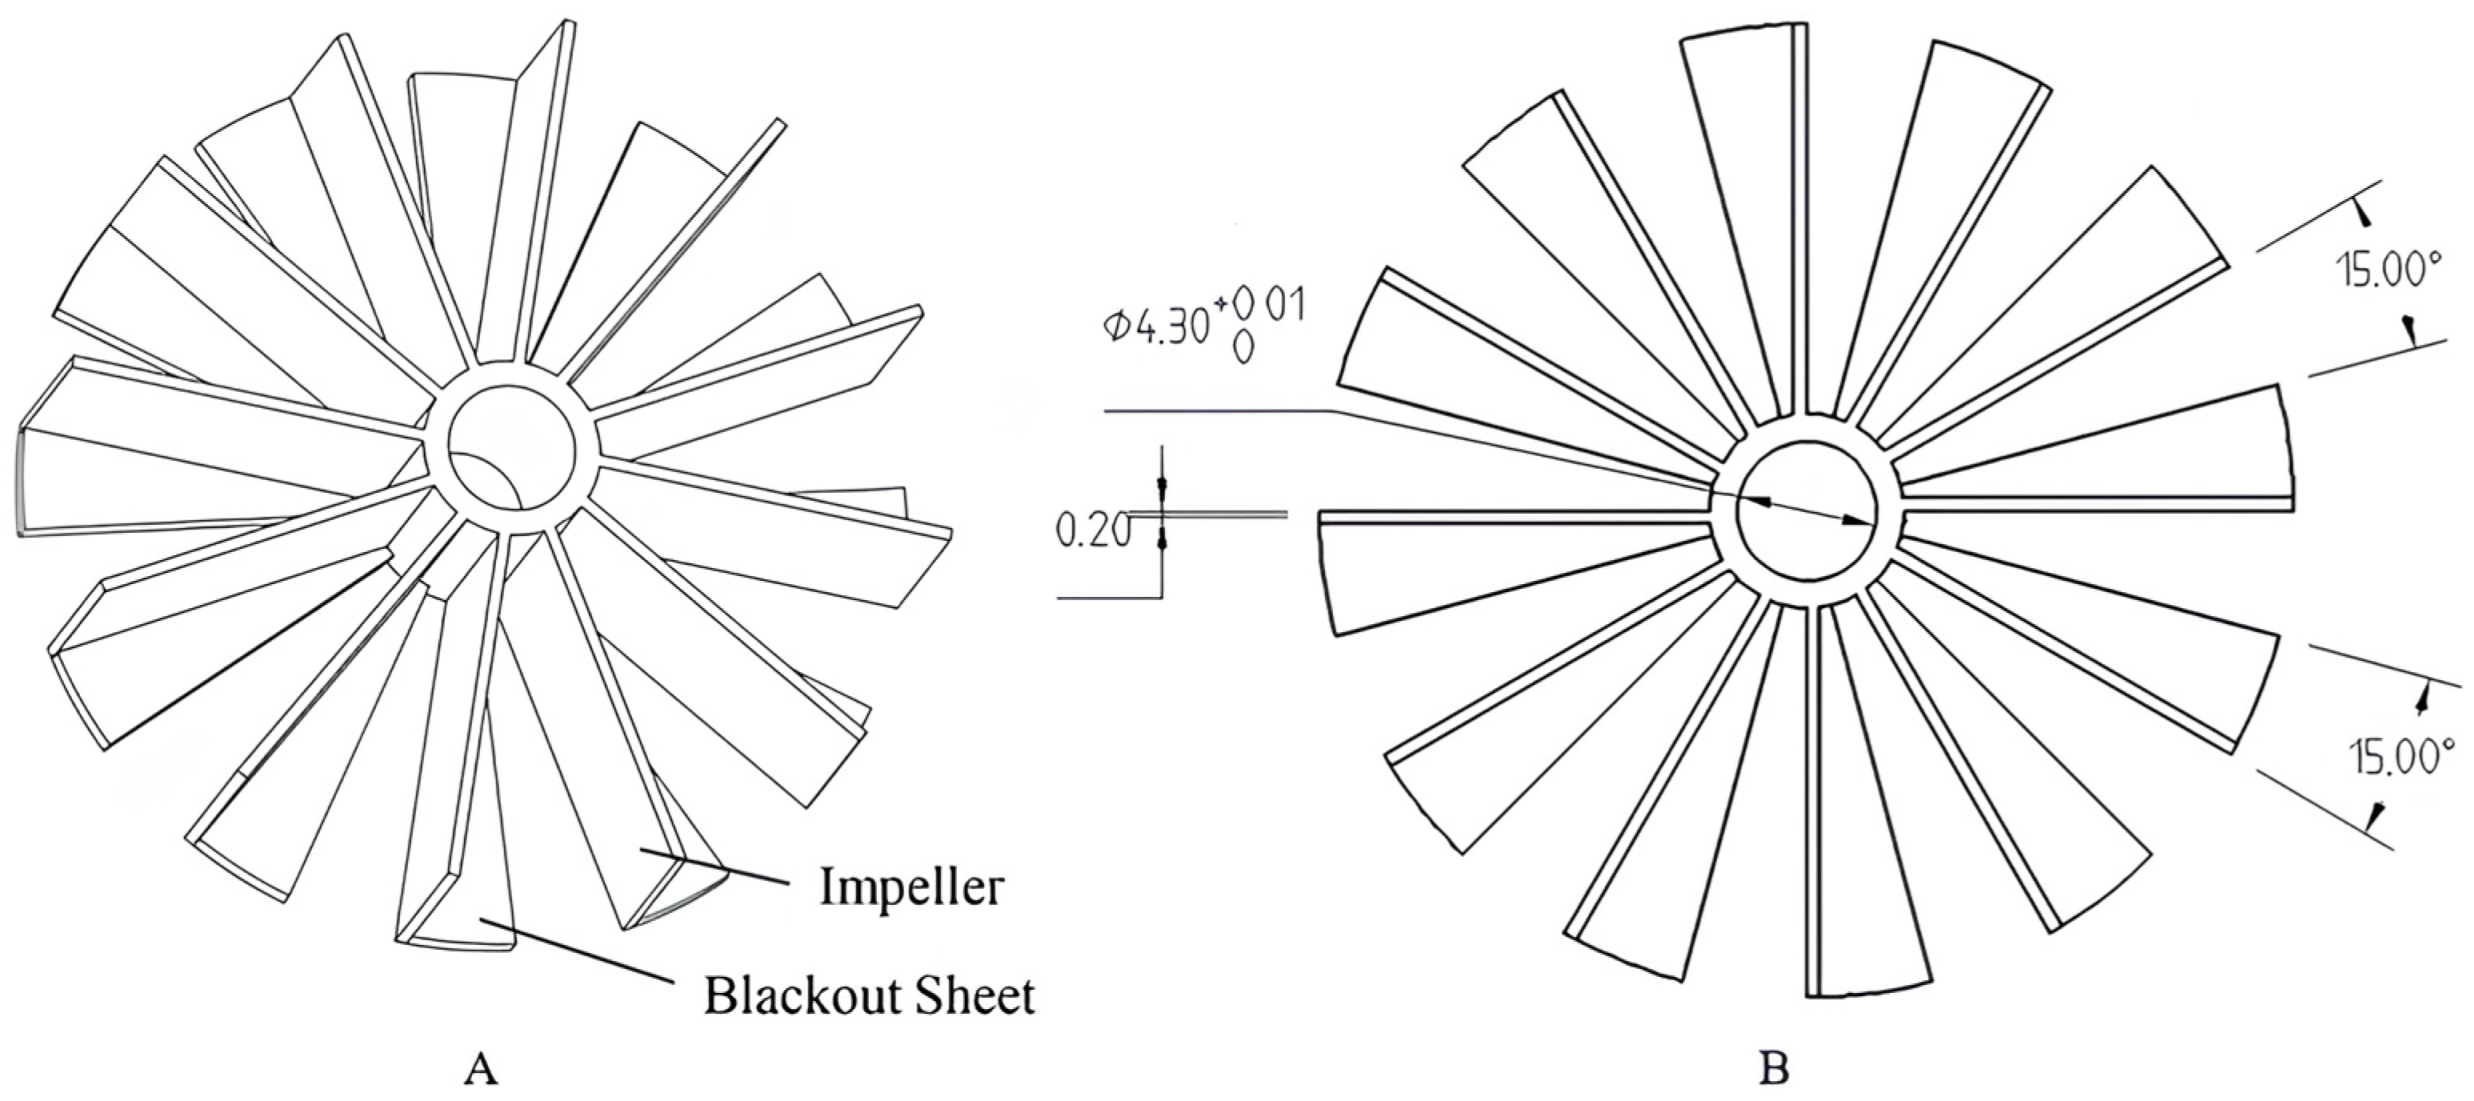
Figure 16.
Angle switching nozzle: (A) Structure schematic; (B) cross-section diagram of a nozzle with an incidence angle of 30° (mm).
Figure 16.
Angle switching nozzle: (A) Structure schematic; (B) cross-section diagram of a nozzle with an incidence angle of 30° (mm).
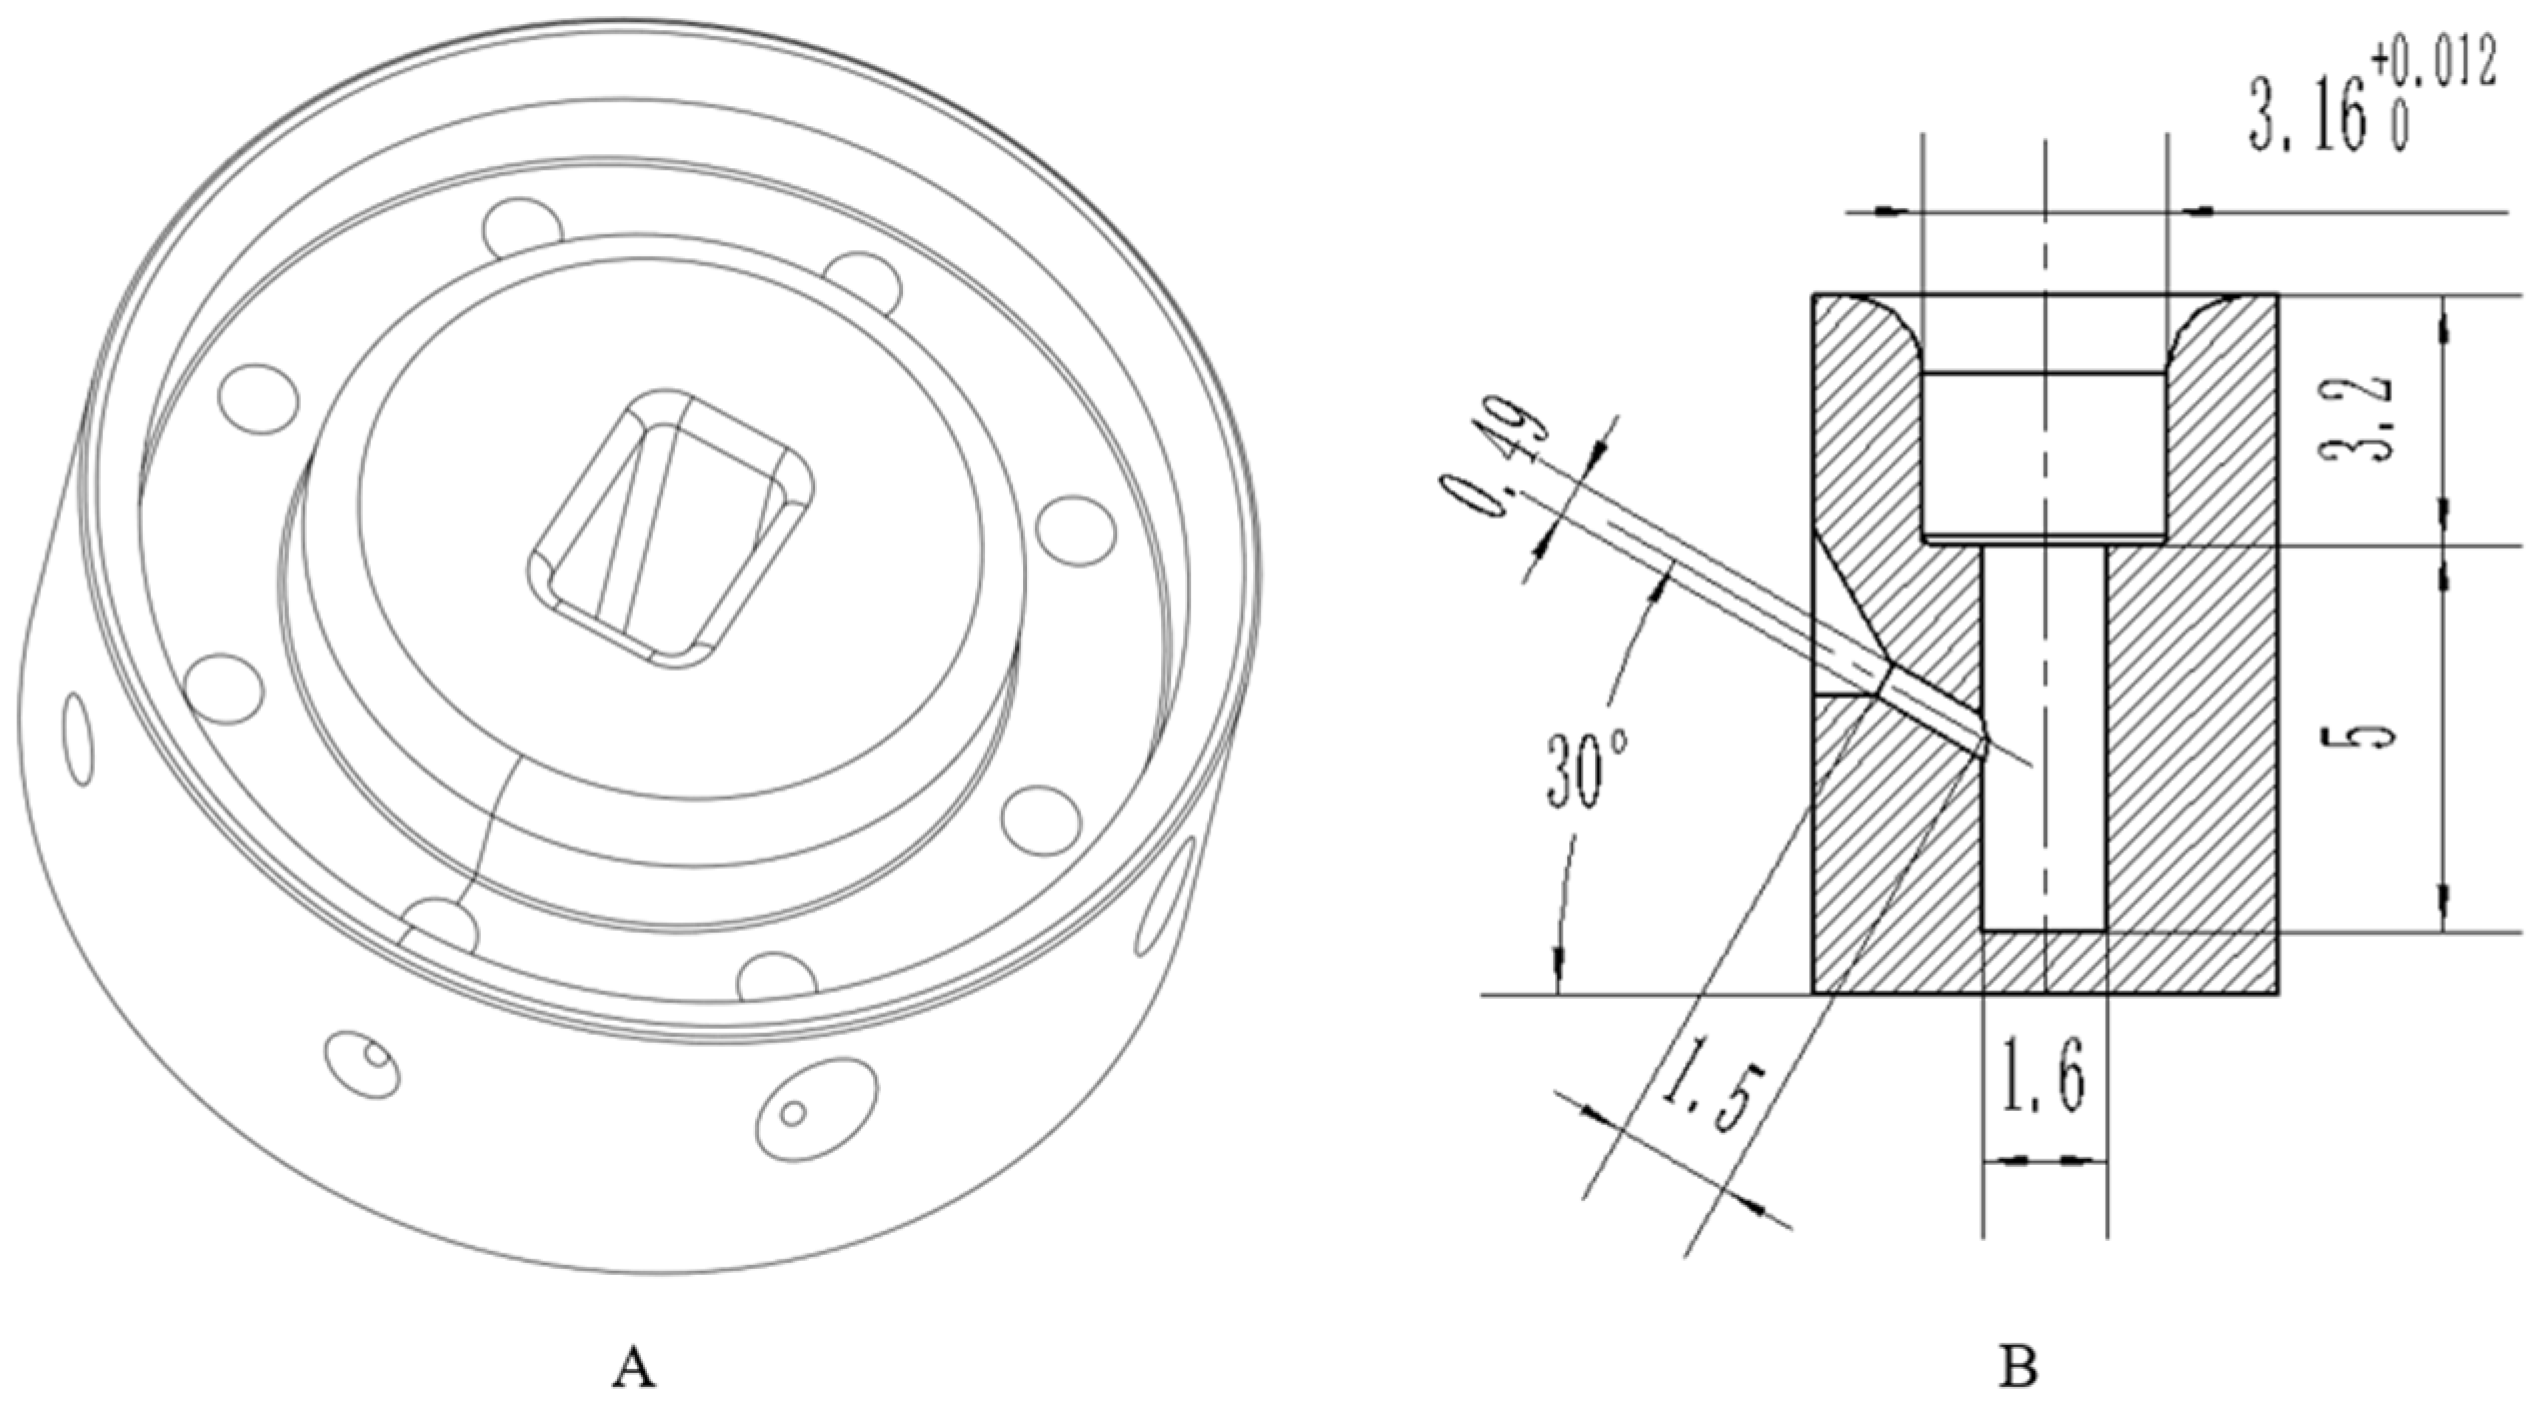
Figure 17.
Control system of the smart MDI.
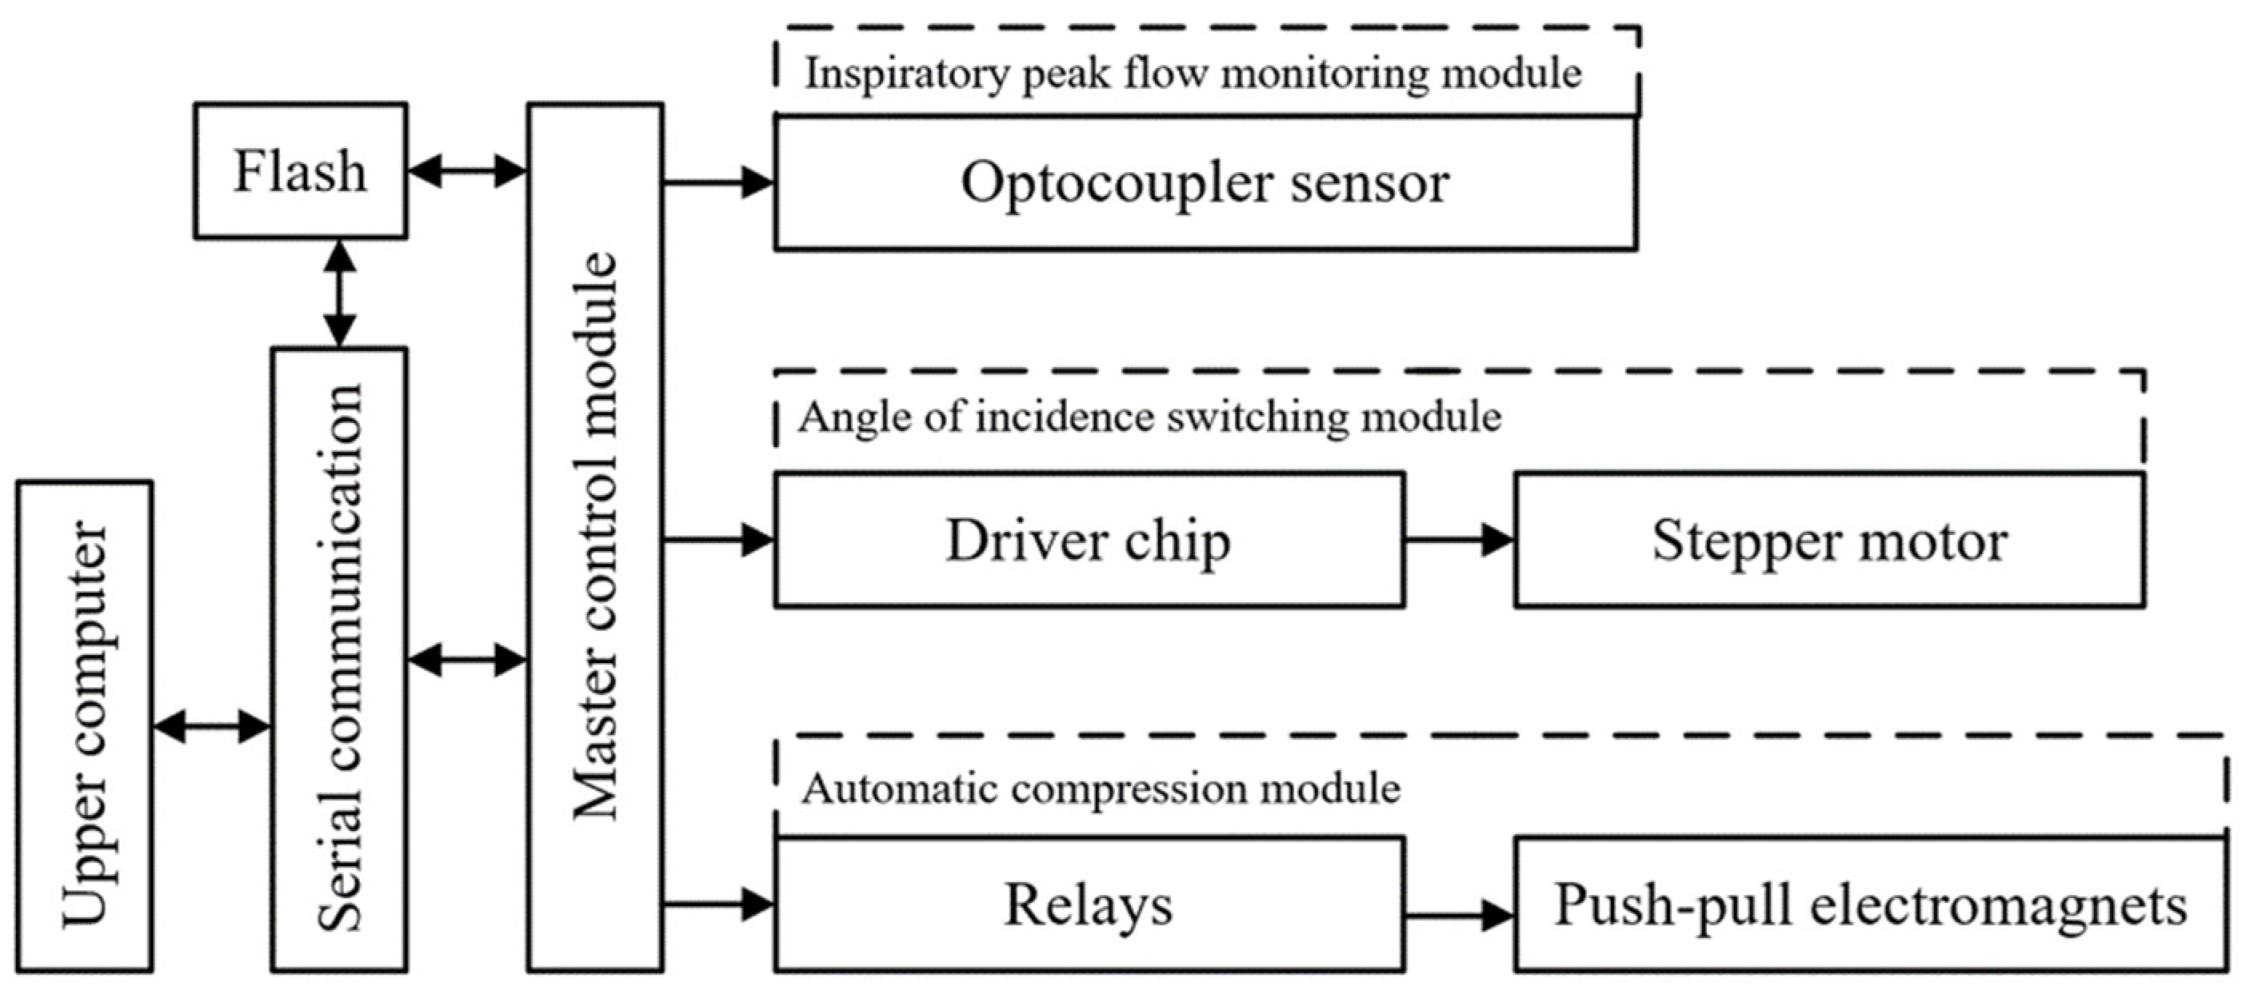
Figure 18.
Overall system framework diagram.

Figure 19.
Upper computer software functional framework diagram.
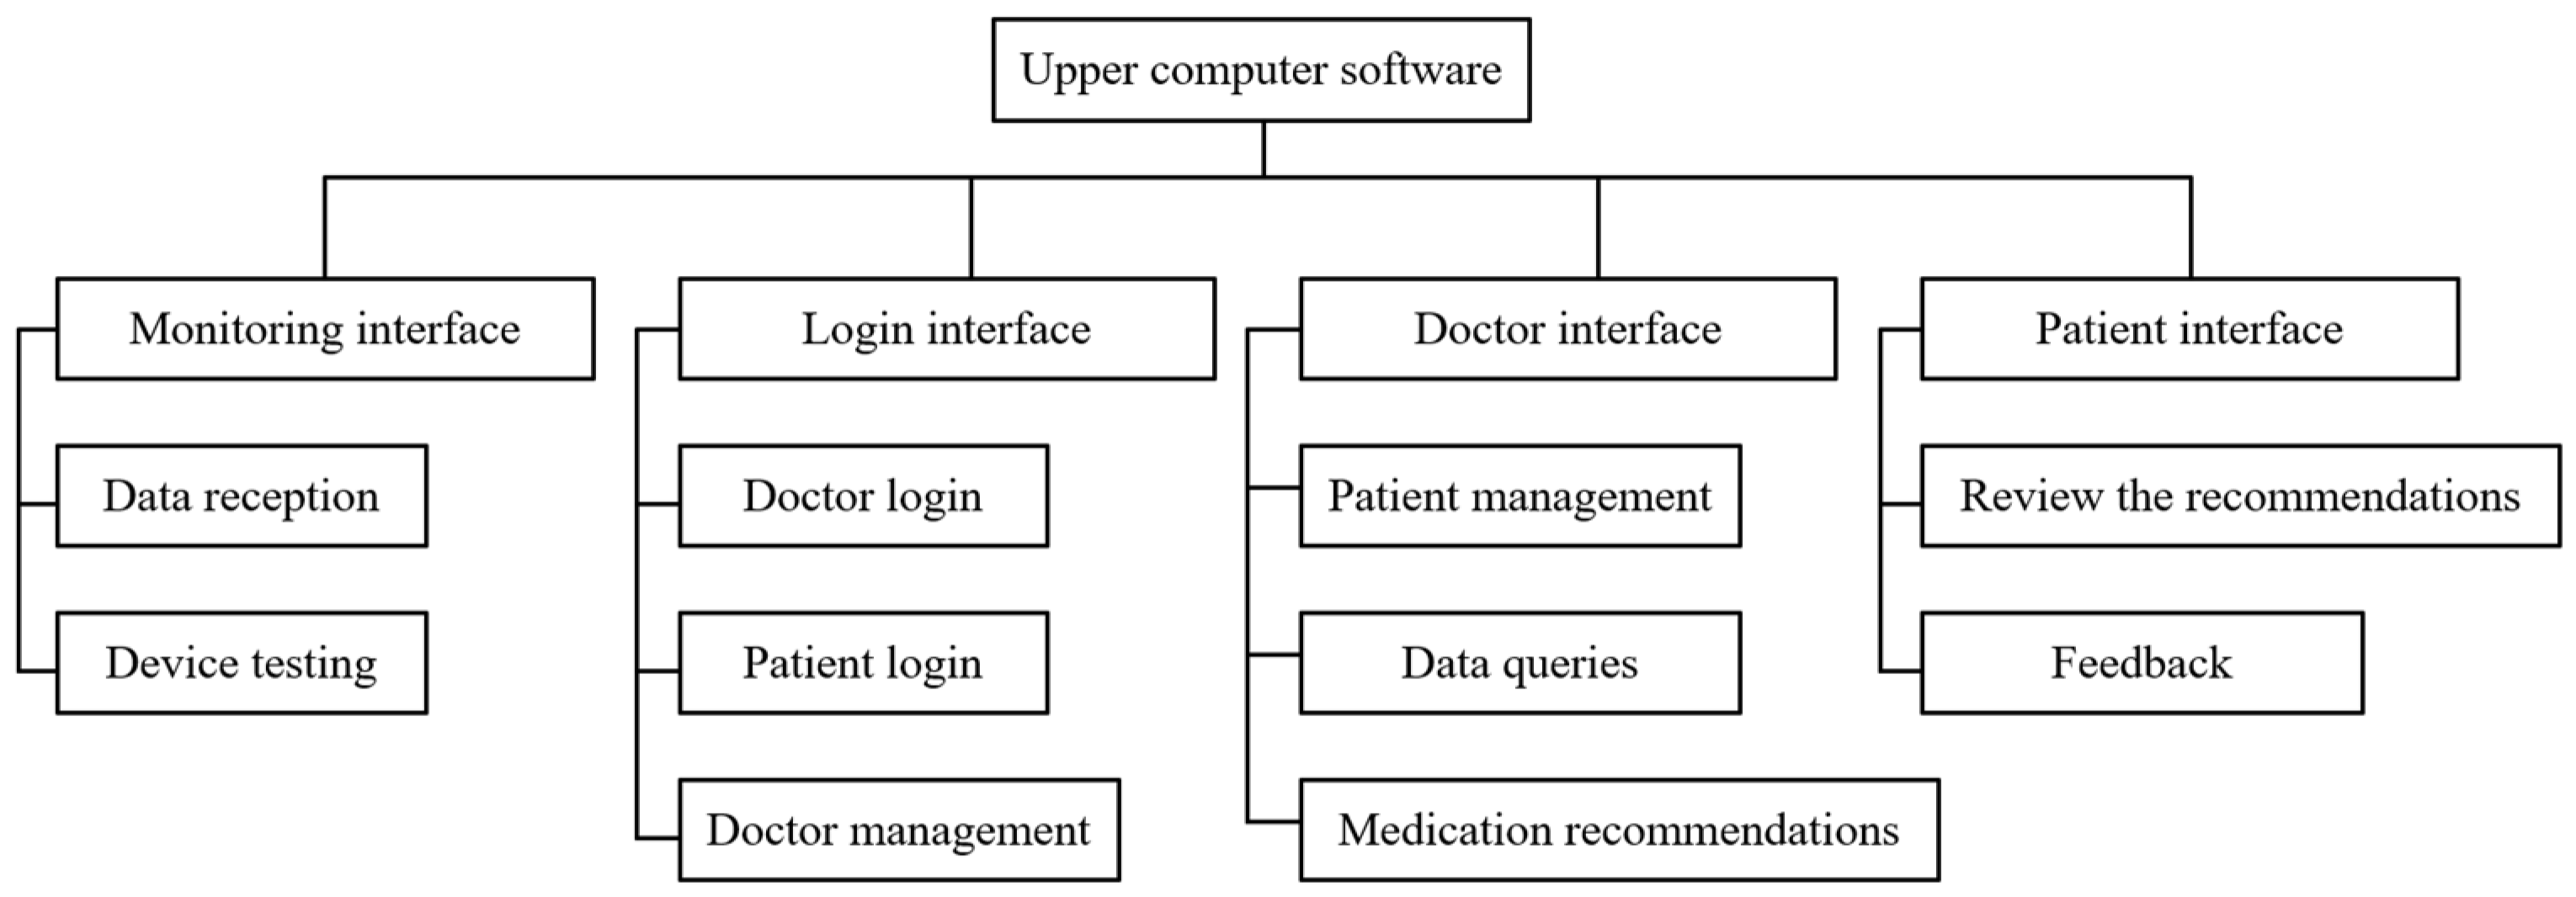
Figure 20.
Monitoring and management interfaces of the upper computer. (A) Monitoring interface; (B) login interface; (C) doctor interface.
Figure 20.
Monitoring and management interfaces of the upper computer. (A) Monitoring interface; (B) login interface; (C) doctor interface.
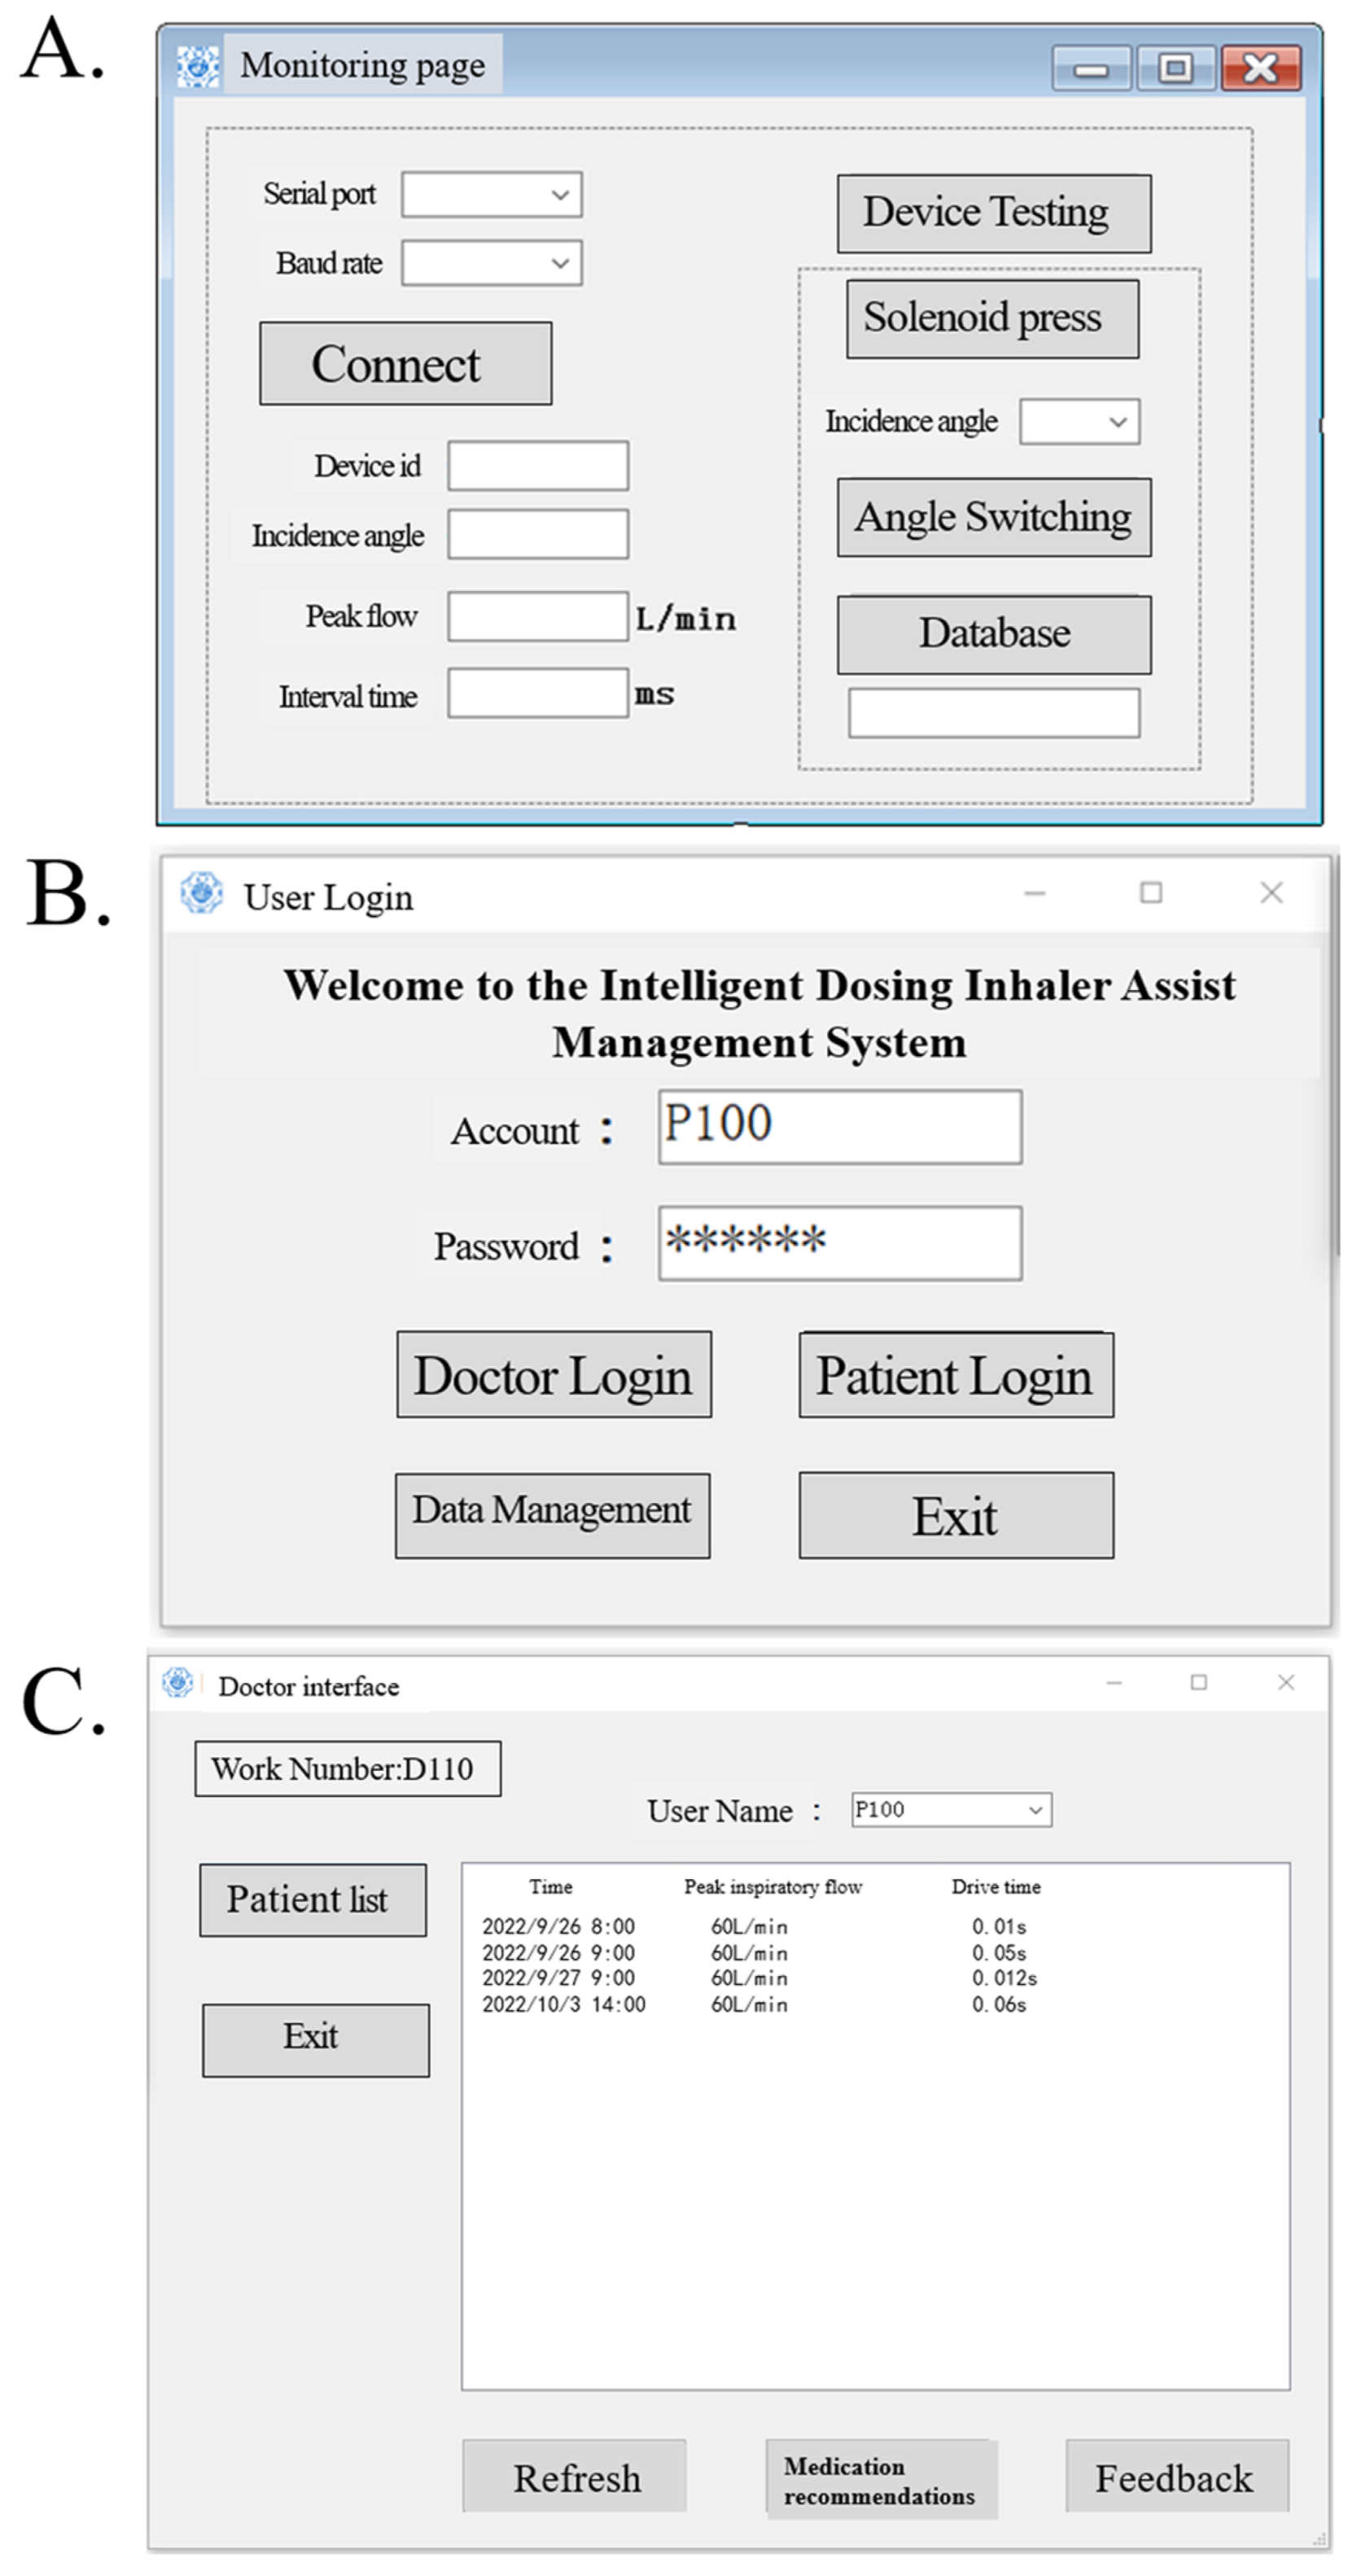
Figure 21.
Prototype assembly diagram.

Table 1.
Gas flow parameters.
| Inspiratory Flow Q (L/min) | Mass Flow Rate q (kg/s) | Inspiratory Flow Q (L/min) | Mass Flow Rate q (kg/s) |
|---|---|---|---|
| 15 | 2.85 × 10⁻⁴ | 75 | 1.42 × 10⁻³ |
| 30 | 5.70 × 10⁻⁴ | 90 | 1.71 × 10⁻³ |
| 45 | 8.54 × 10⁻⁴ | 105 | 1.99 × 10⁻³ |
| 60 | 1.14 × 10⁻³ | 120 | 2.28 × 10⁻³ |
Table 2.
Particle size distribution parameters.
| Parameter Type | Numerical Value |
|---|---|
| Particle size distribution mode | Rosin–Rammler function |
| Minimum particle size (μm) | 1.22 |
| Maximum particle size (μm) | 49.50 |
| Mean particle size (μm) | 12.82 |
Table 3.
Deposition fractions of drug particles in the mouth and throat regions at different peak inspiratory rates.
Table 3.
Deposition fractions of drug particles in the mouth and throat regions at different peak inspiratory rates.
| Inspiratory Flow Qmax (L/min) | Deposition Fraction DF (%) | Inspiratory Flow Qmax (L/min) | Deposition Fraction DF (%) |
|---|---|---|---|
| 15 | 55.78 | 75 | 60.14 |
| 30 | 56.47 | 90 | 62.16 |
| 45 | 57.08 | 105 | 64.01 |
| 60 | 58.49 | 120 | 65.75 |
Table 4.
Deposition fractions of drug particles in the mouth and throat under different incidence angles at Qmax = 30 L/min.
Table 4.
Deposition fractions of drug particles in the mouth and throat under different incidence angles at Qmax = 30 L/min.
| Angle of incidence α (°) | 0 | 15 | 30 |
| Deposition fraction DF (%) | 56.47 | 40.96 | 31.53 |
Table 5.
Peak inspiratory flow monitoring results.
| Test Flow (L/min) | Displayed Flow (L/min) | Relative Error (%) | Actual Angle of Incidence (°) | Displayed Angle of Incidence (°) |
|---|---|---|---|---|
| 120 | 116.52 | 2.90 | 36.62 | 36 |
| 105 | 102.16 | 2.70 | 34.77 | 34 |
| 90 | 87.41 | 2.88 | 32.65 | 32 |
| 75 | 72.82 | 2.91 | 30.69 | 30 |
| 60 | 58.83 | 1.95 | 29.33 | 29 |
| 45 | 43.97 | 2.29 | 28.95 | 29 |
| 30 | 29.03 | 3.23 | 29.68 | 30 |
| 15 | 14.32 | 4.53 | 31.29 | 31 |
Table 6.
Inspiration drive test results.
| Peak Inspiratory Flow (L/Min) | Interval Time (s) | Press aerosol Canister? (Yes/No) |
|---|---|---|
| 120 | 0.1276 | Yes |
| 105 | 0.1340 | Yes |
| 90 | 0.1423 | Yes |
| 75 | 0.1542 | Yes |
| 60 | 0.1713 | Yes |
| 45 | 0.1998 | Yes |
| 30 | 0.2537 | Yes |
| 15 | 0.4219 | Yes |
Table 7.
Prototype performance results.
| Peak Inspiratory Flow (L/min) | MDI-Administered Drug Deposition Fraction in the Mouth and Throat (%) | Difference (%) | |
|---|---|---|---|
| No Drug Delivery Device Was Used | Use of a Drug Delivery Device | ||
| 120 | 65.75 | 52.62 | 13.13 |
| 105 | 64.01 | 49.97 | 14.04 |
| 90 | 62.16 | 48.06 | 14.10 |
| 75 | 60.14 | 45.14 | 15.00 |
| 60 | 58.49 | 42.41 | 16.08 |
| 45 | 57.08 | 39.57 | 17.51 |
| 30 | 56.47 | 34.74 | 21.73 |
| 15 | 55.78 | 29.47 | 26.31 |
Disclaimer/Publisher’s Note: The statements, opinions and data contained in all publications are solely those of the individual author(s) and contributor(s) and not of MDPI and/or the editor(s). MDPI and/or the editor(s) disclaim responsibility for any injury to people or property resulting from any ideas, methods, instructions or products referred to in the content. |
© 2023 by the authors. Licensee MDPI, Basel, Switzerland. This article is an open access article distributed under the terms and conditions of the Creative Commons Attribution (CC BY) license (https://creativecommons.org/licenses/by/4.0/).
Share and Cite
MDPI and ACS Style
Zhang, Z.; Wei, M. Development of a Smart Metered-Dose Inhaler for Asthma Based on Computational Fluid Dynamics. Symmetry 2023, 15, 1712. https://doi.org/10.3390/sym15091712
AMA Style
Zhang Z, Wei M. Development of a Smart Metered-Dose Inhaler for Asthma Based on Computational Fluid Dynamics. Symmetry. 2023; 15(9):1712. https://doi.org/10.3390/sym15091712
Chicago/Turabian StyleZhang, Zhiguo, and Maoning Wei. 2023. "Development of a Smart Metered-Dose Inhaler for Asthma Based on Computational Fluid Dynamics" Symmetry 15, no. 9: 1712. https://doi.org/10.3390/sym15091712
Note that from the first issue of 2016, this journal uses article numbers instead of page numbers. See further details here.