
An Unsupervised Multi-Dimensional Representation Learning Model for Short-Term Electrical Load Forecasting


1
School of Computer Science, Zhaoqing University, Zhaoqing 526061, China
2
Department of Computer Science, State University of New York, New Paltz, NY 12561, USA
*
Authors to whom correspondence should be addressed.
Symmetry 2022, 14(10), 1999; https://doi.org/10.3390/sym14101999
Submission received: 23 August 2022
/
Revised: 18 September 2022
/
Accepted: 20 September 2022
/
Published: 23 September 2022
(This article belongs to the Section Engineering and Materials)
Abstract
:The intelligent electrical power system is a comprehensive symmetrical system that controls the power supply and power consumption. As a basis for intelligent power supply control, load demand forecasting in power system operation management has attracted considerable research attention in energy management. In this study, we proposed a novel unsupervised multi-dimensional feature learning forecasting model, named MultiDBN-T, based on a deep belief network and transformer encoder to accurately forecast short-term power load demand and implement power generation planning and scheduling. In the model, the first layer (pre-DBN), based on a deep belief network, was designed to perform unsupervised multi-feature extraction feature learning on the data, and strongly coupled features between multiple independent observable variables were obtained. Next, the encoder layer (D-TEncoder), based on multi-head self-attention, was used to learn the coupled features between various locations, times, or time periods in historical data. The feature embedding of the original multivariate data was performed after the hidden variable relationship was determined. Finally, short-term power load forecasting was conducted. Experimental comparison and analysis of various sequence learning algorithms revealed that the forecasting results of MultiDBN-T were the best, and its mean absolute percentage error and root mean square error were improved by more than 40% on average compared with other algorithms. The effectiveness and accuracy of the model were experimentally verified.
1. Introduction and Motivation
The intelligent electrical power system, as a comprehensive symmetrical system, controls the power supply and power consumption. Power load forecasting is critical for achieving power analysis and intelligent power supply control and plays a crucial role in power system management. Energy management has become a critical research topic in electric power. Inaccurate load forecasting can result in overload or congestion of power dispatch, which can affect the security of power systems and the implementation of power production plans. Short-term power demand forecasting is a crucial aspect of the load forecasting model and is indispensable in modern power supply systems. Demands for electricity or energy load are a result of the interaction and coupling of various observable factors (such as weather conditions, electricity production, electricity consumption, electricity price fluctuations) or hidden factors (such as different time periods, different regions, and different industrial structures). Demand is key for integrating production, control, and dispatch in an energy system. The predictability of power loads can be improved by considering various explicit and implicit causes, the diversity of various demands, and the complexity of various loads in a forecasting model, as well as finding a strong coupling relationship between multi-dimensional relationships of various factors in the observable data, analyzing all coupling relationships, and performing feature analysis and extraction to optimize the accuracy of the load forecasting model.
Conventional load forecasting methods are based on a single factor for independently forecasting various types of loads. These methods include fitting- or regression-based methods, such as Kalman filtering, fuzzy linear regression, and support vector machine (SVM), as well as neural network-based methods, such as LSTM, XGBoost, gradient boosting regression tree (GBRT), and artificial neural networks (ANN) [1,2,3,4]. However, for the processing of multi-dimensional power load time-series data with both multi-dimensional features and long-term time feature dependencies, the aforementioned methods exhibit certain limitations. One study demonstrated the importance of relevant dataset structure for creating optimal logic mining. The authors used a Hopfield neural network to learn and obtain the corresponding optimal induced logical rule in the learning datasets. Finally, the validity of the optimal logic rules for mining associated datasets for analyzing data was verified by experiments [5,6,7].
When analyzing time-series data, a single historical data series cannot truly reflect the multiple influences of external factors on the generation of the series data and the complex spatiotemporal dependencies between related datasets. On the one hand, the existing analytical frameworks usually utilize given spatiotemporal correlations with incomplete information structures for modeling, which would limit the effective learning of predictive models on spatiotemporal dependencies. On the other hand, for nonlinear complex spatiotemporal data, the existing methods cannot effectively integrate the inherent spatiotemporal correlation, local feature correlation, and global multi-dimensional dependence of the dataset. The motivation of this paper is to propose a new unsupervised multi-dimensional representation learning framework based on data-driven deep feature extraction and a multi-scale self-attention network, which are more conducive to studying the dynamics reflected by different granularities in space and time. The application of this framework can learn and mine the hidden logical rules of spatial and temporal correlation in multi-dimensional datasets, encode different time granularities at different levels, and effectively integrate local and global spatial and temporal correlations. Through this process, the spatiotemporal dependences of the fusion of internal and external factors are fully captured. The proposed unsupervised multi-dimensional representation learning framework can be applied to short-term electricity demand forecasting, traffic flow analysis, and service task sequence analysis.
To address multi-dimensional power load time-series data and improve the accuracy and reliability of power load forecasting, a novel unsupervised multi-dimensional feature learning forecasting model is proposed. First, a deep belief network (DBN) was used to perform feature learning of unsupervised multi-feature extraction on the data, and the features obtained after determining strong coupling relationships between independent factors were embedded. Next, the multi-head self-attention mechanism in the transformer was used to learn the locations or times of strongly coupled features and internal hidden features of the sequence to obtain the feature encoding of the multi-related feature information at each time point in the sequence. Finally, the spliced code regression learned through a neural network with a hidden layer. The objective of the power forecasting model was to forecast the power load demand in the next 12–24 h by analyzing a segment of multi-dimensional historical data (such as the historical data for 48 or 72 h before forecasting). The main contributions of this paper are as follows: (1) a novel data processing and forecasting model based on unsupervised multi-feature feature learning is proposed; (2) the model can learn the strongly coupled features among independent multi-factors and can learn the strongly coupled features and hidden factors between locations or time points in the sequence; (3) experimental results on multi-dimensional power load sequence data reveal that the model outperformed the latest forecasting models in processing multi-dimensional time-series data.
2. Related Work
Numerous studies have been conducted on the analysis of time-series data using conventional methods, such as KLF, SVR, ARIMA, XGBoost, and LSTM [8,9,10]. In these methods, the single-mode data are used as the original sequence as the analysis target, and subsequent time points are forecasted through fitting or regression to the historical data. To perform forecasting on complex sequence data, based on the classical methods, a LSTM forecasting model with principal component correlation analysis (PCA) [11], an SVM forecasting model based on the fruit fly optimization algorithm (FFOA) [12], improved ARIMA models, SARIMA [13,14], and other models have been proposed for short-term natural gas load forecasting. The SARIMA model transforms nonstationary data into stationary data by using lagged mean values of power load time-series data. The analysis of seasonality in the method can be observed by using the autocorrelation function and the partial autocorrelation function. Because of the nonlinearity of the time-series data, single linear regression, and multiple linear regression methods based on statistical regression variables and methods, the time changes and nonlinear power load patterns in the series cannot be captured; these methods are not suitable for processing such time-series data [15,16]. A novel particle swarm optimization (PSO) two-step method is presented in [17] for increasing the performance of short-term load forecasting (STLF).
The development of machine learning and neural network technology provides novel methods for short-term power load forecasting. Compared with forecasting models based on statistical regression and dimensionality reduction, machine learning methods are remarkably accurate in forecasting nonlinear power loads and peaks, and their algorithms improve the performance of power load demand forecasting models [18]. For weather factors in historical data, an ANN model deeply learns the effect of random weather characteristics on power load and forecasts the power load in a certain period of time in the future [19,20]. Various K-nearest neighbor (KNN)-based machine learning algorithms perform forecasting by learning to process the time-varying features of nonlinear time-series data by learning the K nearest instances in historical data. In the algorithms, using the most similar instances of detected K, the target points closest to these K instances were obtained through local interpolation. However, these methods exhibit considerable drawbacks for high-dimensional time-series data—the lack of hyperparameters can lead to overfitting of a forecasting model, whereas when dealing with high-dimensional data, the curse of dimensionality can occur. These methods cannot handle high-dimensional time-series data [21,22]. In [23], a novel forecasting model based on pooling was proposed, in which LSTM was used to train and extract the features encoded with one-hot encoding. This method mitigated the overfitting problem and improved forecasting accuracy. In [24], a combined model based on EOBL-CSSA-LSSVM, which contains the machine learning algorithms, the swarm intelligence optimization algorithms, and data pre-processing in the prediction model, is proposed for power load forecasting.
Because time-series data are becoming increasingly complex, researchers have proposed novel methods for analyzing multi-dimensional power load time-series data. To obtain the global temporal correlation characteristics (such as overall trend) in historical data, a FEDformer model combined with a transformer was proposed, and seasonal trend decomposition methods were used to learn global change trends in time-series to acquire detailed feature structures in the series [25]. Because of coupling characteristics of deep factors in time-series, convolutional neural network (CNN), gated recurrent unit, and GBRT have been integrated to develop a multi-dimensional energy load forecasting model. A DBN-based multi-task regression neural network model was proposed. The model acquired hidden features in the multi-energy load time-series through training and learning, and finally, the energy load demand was forecasted by multi-prosumers [26,27]. By obtaining the internal correlation of the relevant factors in the time-series data in the multiple energy consumption-load joint forecasting, Wang et al. proposed a joint multi-energy load forecasting model composed of a single encoder and multiple decoders, namely multi-decoder transformer (MultiDeT). In this model, a single encoder was used to uniformly encode the input data, and the results were obtained after using the decoders of the multi-prediction task to learn and train the shared data encoding for forecasting various energy consumption loads [28]. To analyze time-series data, a hybrid ensemble deep learning model combining MLP, CNN, LSTM, and CNN-LSTM was proposed to improve the forecasting performance in [29].
The analysis and processing of multi-dimensional sequence data have attracted considerable research interest. These sequence data exhibit nonlinearity, multi-dimensionality, time-series correlation, and hidden coupling. For multi-dimensional data short-term power load forecasting, the various methods proposed exhibit certain limitations and insufficient capabilities in addressing time-series data that have (1) nonlinearity in processing, (2) implicit coupling and correlation characteristics, (3) high-dimensional and mutually independent characteristics, and (4) multiple coupling and correlations (such as global trend and time-series periodic correlation). Thus, forecasting performance should be improved.
3. Unsupervised MultiDBN-T
To investigate the internal correlation characteristics of the data, the strong coupling correlations of various features in space and time can be obtained by learning historical data. The trend of the data for the forecasting target can be accurately determined. Representation learning, also known as feature learning, is used in machine learning for encoding original data. The transformed encoding retains features that can be easily identified, rendering it easy for various machine learning algorithms to learn and apply data processing procedures [30,31]. To extract the coupled features between dimensions, the temporal coupled features within the dimensions, and the overall change trend features in multi-dimensional time-series data, we propose a novel unsupervised MultiDBN-T. This model forecasts power load demand in the next 24 h by learning and training power load historical data with multi-dimensional data features.
3.1. MultiDBN-T Architecture
The architecture of MultiDBN-T model is displayed in Figure 1, and the detailed composition is shown in Figure 2. The forecasting model is primarily composed of three parts. (1) Pre-DBN: A single-decoder deep belief network used for self-supervised/unsupervised pre-training. This layer is a pre-training layer that solves the training problem of deep neural networks by stacking multiple layers of RBMs. It solves the optimization problem of deep neural network training with high-dimensional correlated but different datasets, as it can make the whole network with better initial weights achieve the optimal solution by fine-tuning the layer-by-layer training. (2) DBN-transformer encoder (D-TEncoder): Transformer encoder based on DBN fine-tuning. After pre-training, by combining with the multi-head self-attention mechanism, it further constructs spatiotemporal features with the codes of feature compression to mine the effective logical rules inherent in the dataset for improving the effectiveness of training. (3) L-Decoder: Fully connected hidden layer decoder. It optimizes the variables of the model by computing the loss function.
The overall structure of the MultiDBN-T model and its training process are shown in Figure 1. The training process steps are as follows. (1) It pre-trains with pre-DBN using the training dataset, and then uses the corresponding data for fine-tuning to obtain the optimized DBN. (2) The training dataset will be directly inputted into the tuned DBN in the D-TEncoder, and be further encoded by the transformer encoder. (3) Finally, the L-Decoder is used to decode and calculate the loss function, and the final prediction model is obtained through the back-propagation gradient calculation and optimization of the neural network.
As displayed in Figure 2, MultiDBN-T uses dual encoders: pre-DBN (based on the DBN encoding layer) and DBN-transformer encoder (based on the transformer-based encoding layer). These two layers of encoders are the core layers of feature learning in the forecasting model. The purpose of pre-DBN is to learn the coupling correlation between dimensions of multi-dimensional data in the self-supervised/unsupervised process, and it can be used for data pre-training. Thus, the initial values of the network weights of the two hidden layers at the bottom of the DBN-transformer encoder were obtained to improve training accuracy. The purpose of the DBN-transformer encoder is to obtain the temporal coupled features in the historical data, such as periodicity, globality, and correlation of external factors, and obtain deeper hidden features in the sequence through the multi-head attention mechanism.
3.2. Pre-DBN
Multi-dimensional power load time-series data present a complex nonlinear data distribution; however, oftentimes, only limited local features, such as weather condition data, productivity consumption data, different regions, and changes in electricity prices, can be observed. The data on these dimensions can considerably affect the future power load demand in a certain area. Therefore, the data are inevitably affected by multiple factors and contain noise. The distribution is modeled to obtain a representation of internal features hidden between the observable variables.
As displayed in Figure 2, pre-DBN consists of three layers of RBM and one fully connected output layer. Because more than three layers of RBM are used to form the encoding part of pre-DBN, as the network deepens, the features extracted by each layer become distinctive; that is, the coupled features of the data between the dimensions become stronger. However, some hidden features may be lost, which is not conducive to the encoding of the transformer.
Figure 3 displays the network structure of a one-layer RBM. Let the random vector observable in the pre-DBN input layer be . Thus, in the m-dimensional power load time-series data, at the time point , sample vector , and the first RBM hidden random vector , then . The second is , ; the third is ; and finally, the output layer is .
In each RBM, the dimension of an observable variable is , and the dimension of a hidden variable is ; that is, and . The bias of an observable variable in the visible layer is , and the bias of a hidden layer variable is . The weight matrix between the two layers is . is the bias of , is the bias of , and is the weight of the edge between and .
Because the observable variables and hidden variables of the time-series data processed in this study satisfy the Gaussian–Gaussian RBM (GG-RBM), studies [32,33] have revealed that the energy function of GG-RBM can be defined as follows:
The observable variable and the hidden variable are calculated by the following:
where and represent the standard deviations of the noise for and satisfying Gaussian distribution, respectively. In practice, the data are normalized so that both and are equal to 1. When solving the training, can be obtained from raw input data ; that is, is based on the two-layer relationship in Figure 3, and can be calculated by .
As displayed in Figure 4, in the solving process of the CK-k algorithm, for the original data of a given observable variable, the hidden vector is obtained by sampling the conditional probability . Next, is used to calculate the conditional probability and to obtain by sampling. The process is repeated to obtain and . According to the aforementioned process, Equations (1)–(3) and the calculation formulas of and , the equations for updating the parameters , , and for GG-RBM are follows:
where is the learning rate of the model, and represents the values of and in the first rounds of sampling. Thus, the parameters of the L-layers of GG-RBM in the pre-DBN are obtained by .
Here, pre-DBN is used as a pre-training model. The last layer is a fully connected hidden layer as an output layer. The weights and biases of the corresponding neural network of each layer are obtained by training through the BP algorithm. The training process is as follows:
(1) For each layer of GG-RBM according to Equations (1)–(6), the CD-k algorithm is used to perform layer-by-layer pre-training from the bottom to the top and to obtain the parameters of each layer . The equation for the iterative calculation for the training is as follows:
where is the learning rate, is the number of iterations of GG-RBM for each layer, and is the first -th layer of GG-RBM. , , and .
(2) After the pre-training of GG-RBM is completed, the last fully connected hidden layer of pre-DBN is used as the output. The network structure of GG-RBM is converted into the corresponding neural network structure. The network parameters are trained and fine-tuned again with the deep neural network. The initialization parameters of the corresponding network layers are , where is the output of the last corresponding GG-RBM hidden variable layer. The output of the pre-DBN is . The output and the loss function of the model are defined as follows:
where is the number of samples in the pre-training set, represents the -th dimension data of the sample input at time , and is the dimension of the time-series data ( observable variables).
(3) The BP algorithm is applied to the pre-DBN and trains with Adam as the optimizer to obtain the network parameters of the pre-DBN: . The parameters are the initialization network parameters of the corresponding L-layer neural network in the D-TEncoder encoder.
3.3. D-TEncoder
The multi-head self-attention module of the transformer is applied to re-encode the encoding output from the pre-DBN and capture the interaction information in space and time in multiple different projection spaces. Let the output code of pre-DBN be , which is the input sequence of D-TEncoder.
Let D-TEncoder’s initial input sequence be , and add the position encoding learnable parameter : ; then, we have following expression:
where .
Figure 5 displays a multi-head self-attention encoder. During encoding, through multiple learnable matrices , and , the self-attention model is applied in projection spaces. The query, keys, and values in the projection spaces can be calculated as follows:
where is the dimension of the input matrix and , is the dimension of the column vector of , is the output projection matrix, , , and .
The MultiDBN-T model in Figure 1 reveals that a total of M transformer encoders are set up, and each encoding layer is calculated by a multi-head self-attention module and a nonlinear for each position feedforward neural network. In Figure 5, in the layer calculation in each encoder, the residuals (time-series data and ’ in Figure 5) are connected to the output of the previous layer, and the layer normalization is then performed. Here, is a fully connected layer with two layers connected with ReLu as the activation function, which is defined as follows:
where is the vector at each position in the input sequence of the previous layer, and are the weight matrices of the two-layer neural network, and and are the bias for the two layers of the network, respectively. These are all learnable network parameters. The connection weights of each layer in the encoder D-TEncoder are dynamically calculated by the self-attention mechanism.
3.4. L-Decoder
Through the double encoding of pre-DBN and D-TEncoder, the input multi-dimensional power load time-series data are reconstructed through feature learning. The reconstructed encoding is used as the input of the last fully connected layer for training. Let D-TEncoder represent the reconstructed encoded vector at time t, and the time window width be . All the codes are then concatenated into vector as a linear layer with network parameters and , where is the temporal window width of the output forecasting. The output of the L-Decoder is defined as follows:
According to the forecasting target of MultiDBN-T, for forecasting the electricity load demand in the future time , the loss function of the model is defined as follows:
3.5. Training Algorithm and Optimal Configuration
The purpose of the forecasting model is to forecast the power load demand in future time by inputting an m-dimensional historical data with a duration of (the m-dimension includes a column of power load historical data).
According to the original historical data and forecasting target, the input of the model is , and the output is . The initialization of the forecasting model, the training process, and the list of the output network parameter variable descriptions are presented in Table 1.
The sample is divided into the 7:2:1 ratio for the training set, validation set, and test set, respectively. Furthermore, the training set is divided into 80–20%, where 20% is used for the fine-tuning and verification of hyperparameters. The process of the forecasting model is as follows. A three-layer RBM (GG-RBM) is built, corresponding to the formation of pre-DBN. The parameters of the pre-DBN network fine-tuned through training and the corresponding three-layer RBM network are used as the corresponding three-layer DNN network configuration and the initial weights of MultiDBN-T. After encoding by D-TEncoder, L-Decoder generates an output. The pseudo code of the algorithm is presented in Algorithm 1 as follows:
| Algorithm 1: MultiDBN-T algorithm based on pre-DBN and D-TEncoder feature learning |
| Input: |
| Output: |
| 1. 2.For i = 1 to 3 Do 3. ;//Use to solve GG−RBM according to//Equations (1)−(7) 4. //According to Equations (8) and (9), use the//fine-tuning mode of DBN to obtain the initial weights of the network parameters of//the corresponding layer of MultiDBN-T 5. For e = 1 to epoch Do 6. ;//Complete the parameter learning of //MultiDBN-T according to Equations (10)–(14) 7. Return |
Suppose the loss function value obtained according to Equation (14) in the MultiDBN-T training process is . We apply BP to its partial derivative and then learn the network parameters and use the Adam optimizer for tuning. The parameter optimization in the model is defined as follows:
where is the initial learning rate with an initial value of 0.01. is the new learning rate, calculated from the initial learning rate using Equation (15). is the first-order exponential smoothing value of the gradient during the training process. is the first-order exponential smoothing value of gradient squared during training. represents the new network parameter set of the forecasting model MultiDBN-T. Equation (18) calculates the updated values of the network parameter variables. Furthermore, , , and are the parameters of the Adam optimizer, set to 0.9, 0.999, are 10−8 in Algorithm 1, respectively.
4. Data Description and Data Formatting
Multi-dimensional time-series data obtained by integrating datasets provided by multiple open source institutions were used to validate the forecasting model.
4.1. Data Description
The data primarily originate from the European Network of Transmission System Operators for Electricity, the Spanish Electricity Network, and the Open Weather API, which integrate regional weather data for five major cities in Spain, namely, Madrid, Barcelona, Barcelona, Valencia, Seville, and Bilbao. These cities are located in the east, south, west, north, and middle of Spain, respectively, and cover the average weather conditions in Spain. The historical series data are the four dimensions of weather average, electricity price, electricity production, and electricity consumption. The data describe the four-dimension historical data in the four years from 1 January 2015 to 31 December 2018. The time interval window for data acquisition was 1 h.
4.2. Description of Observable Variables
According to the data collection time interval, from 1 January 2015 to 31 December 2018, a total of 35,064 rows of data were collected for each dimension. The data dimensions (observable variables) include time label (2), power production capacity (14), power load (1), electricity price (1), and weather conditions (9*5), or 63 columns in total. The historical data are the electricity load in the territory of Spain and cover the electricity consumption history of five cities in the dataset. The electricity load demand is closely coupled with the electricity demand of a city. Therefore, each city name and the corresponding weather indicator are connected to form a label; that is, nine weather indicators and five city names are connected to form a total of 45 labels. All data are normalized as the original data of the model. A summary of the observable variables of the dataset is presented in Table 2.
4.3. Data Format Conversion
As described in Section 4.2, 63 observable variables were observed in the original data, with a total of 35,064 rows of records. The load forecasting model uses two days (48 h), three days (72 h), and four days (96 h) to forecast the electricity demands for the next day (24 h). Thus, the model input is .
The data format conversion processes of the MultiDBN-T kernel layers are displayed in Figure 6. The model undergoes the following three format conversion processes from raw data to data output:
(1) Initialization of the original data format to the model input format: As displayed in the left part of Figure 5, after the initial data are cleansed, their format is an array . According to the format of pre-DBN input in MultiDBN-T, the data of consecutive durations (, that is, hours, rows of records, are converted into one-dimensional array data.
(2) Encoded output after three GG-RBM conversions: A total of three GG-RBMs are configured in pre-DBN. The input format of the first GG-RBM is , and the output of the last GG-RBM is ; that is, after pre-DBN feature learning, the input data are extracted with features close to 63/8 ≈ 8 times compressibility after data reconstruction.
(3) Conversion of pre-DBN output encoding to D-TEncoder encoder input: Because the output of pre-DBN is reconstructed and encoded, the original data are one-dimensional array data , and the input of the D-TEncoder encoder is in the format, the pre-DBN output encoding is converted to by segment for each sample, as displayed in the right part of Figure 6. The original data lose some information through pre-DBN. The power load (y) and the converted data in the format of are spliced into , as the input to the D-TEncoder encoder.
5. Experiment and Result Analysis
5.1. Evaluation Metric
The electric load demand of the next day (24 h) in the future is predicted by applying the collected electric load time-series data. Taking the mean absolute percentage error (MAPE) and root mean square error (RMSE) as the comparison indicators, the MultiDBN-T proposed in this paper was analyzed with the algorithms LSTM, Conv3D-LSTM (CNN + LSTM), Adaboost, ARIMA, SVR, and RF. The formulas for calculating MAPE, RMSE, MAE, and RMSLE are as follows:
where is the predicted value of the model, represents the actual data, and is the number of samples.
5.2. Experimental Setup
Hardware environment: 2 × Dell PowerEdge T720 (2×CPUs: Xeon 6-core E5-2630 2.3G, a total of 12 CPU cores, 64 GB RAM).
Dataset division: The dataset has a total of 35,064 samples. The dimension of each sample is 63. They are divided by 7:2:1. A total of 24,545 rows are used as training samples, where 19,636 rows are used for pre-DBN (GG-RBM) pre-training, 4909 rows are used for pre-DBN fine-tuning, 7012 rows are used as the validation set, and 3507 rows are used as the test set for comparing the performance of various models.
According to the input format and forecasting target of the experimental data (considering the computation cost and effectiveness, the model uses the first three days, or 72 h, to forecast the electricity load demand of each time window of 24 h in the next day), the relevant hyperparameters in MultiDBN-T (the network structure and parameter configuration of each module) are presented in Table 3.
5.3. Experimental Results and Analysis
MultiDBN-T was applied and the dataset was tested according to the structure and configuration parameters in Table 3. According to the set evaluation metrics and , the new algorithm and the existing algorithms commonly used in time-series analysis, LSTM, Conv 3D-LSTM (CNN+ LSTM), Adaboost, ARIMA, SVR, and RF, are analyzed. Table 4 and Figure 6 are the overall data comparison results and the data plots of the test set (3507 rows of data records) in the dataset.
Table 4 and Figure 7 reveal that MultiDBN-T (abbreviated as MultiD-T in the figure), the proposed forecasting model, outperforms all the compared algorithms in terms of MAPE (1.952%) and RMSE (630.720 KW) of the prediction results in the test set. RF exhibited the worst performance, with MAPE and RMSE of 4.027% and 1271.662 KW, respectively. Among the algorithms involved in the comparison, the comparison between the best, MultiDBN-T, and the worst, RF, reveals that the MAPE and RMSE of the proposed forecasting model were 51.54% and 50.40% higher than RF, respectively.
To analyze the performance of the aforementioned algorithms and MultiDBN-T on the test set, the distribution of the components is calculated according to the MAPE and RMSE of the predicted results and the actual power load demand in each time window (observation interval of one hour). For MAPE, , and for RMSE, , where , is the model predicted value, and represents the actual data. The box plots corresponding to the distribution of MAPE and RMSE components are displayed in Figure 8 and Figure 9.
It can be seen from Table 5 and Figure 8 that the values of MAX, Q1, MEDIAN, Q2, and Q3 of the MAPE component of the MultiDBN-T model are the smallest among all the methods. The numerical distribution of its MAPE component is also the most concentrated, which shows that the stability of the model is also the best.
It can be seen from Table 6 and Figure 9 that the values of MAX, Q1, MEDIAN, Q2, and Q3 of the RMSE component of the MultiDBN-T model are still the lowest among all methods.
Figure 8 and Figure 9 reveal that the distributions of the MAPE component () and the RMSE component () in the load demand results forecasted by MultiDBN-T are concentrated in the upper and lower quartiles. The distributions exhibit small whisker lengths and are less spread for . The data distributions from RF and CNN-LSTM (Conv3D-LSTM) are more spread, which indicates that their performance is unstable. Their whisker lengths and outliers are worse in the distribution of MSE’.
To perform a comparative analysis of MultiDBN-T and several other algorithms, the and of each algorithm’s prediction results at each observation point were subtracted from the difference of and obtained by MultiD-T; that is, and , and then the local performance improvement is analyzed. Here, . The box plots corresponding to the distributions of performance improvement are displayed in Figure 10 and Figure 11.
It can be seen from Table 7 and Figure 10 that the MultiDBN-T model has the most obvious improvement in the MAPE component compared with the RF method; the improvement is not obvious compared with the SVR method, but its component improvement reached an average of 0.89%. From Table 8 and Figure 11, it can be seen that the situation of the RMSE component improvement is similar to that of the MAPE component improvement.
Figure 10 and Figure 11 reveal that except for the versus SVR, the upper and lower quartiles of and improved by MultiDBN-T and the several other algorithms were all above 0. Thus, the performance of MultiDBN-T at each observation point of the test set was the best. In particular, the lower whiskers of each box plot on are short and mainly distributed above the lower quartile line, and the lower quartile line is above 0. Therefore, the performance improvement of the forecasting model in this paper on is remarkable and stable.
For the test set, we selected the three-day power load forecast and actual demand from 8 to 10 August 2018 and 24 and 26 December 2018, respectively. The plots for the relative errors are displayed in Figure 12 and Figure 13.
Figure 12 and Figure 13 reveal that because of the difference in the weather in Spain during these two periods, the electricity demand differed considerably. The data representation code obtained by feature learning can represent the coupling and correlation characteristics of power load demand, weather, and power price. Thus, the power load demand can be predicted accurately with small elative errors (RE).
According to the electricity load demand results predicted by the different methods for these two time periods, the average value of the relative error of each method is calculated as shown in Table 9.
A lower average relative error (RE) indicates a better prediction. As we can see from Table 9, MultiDBN-T obtains the lowest values in average relative error.
According to the analysis, the overall situation of the experiment in Table 10 and Figure 14 reveals that the proposed MultiDBN-T outperforms other algorithms, whether locally or as a whole. It performs better than SVR (the next best) in terms of MAPE and RMSE by 31.21% and 30.10%, respectively. The average increases in the evaluation metrics of MAPE, RMSE, MAE, and RMSLE were 42.16%, 40.61%, 41.96%, and 40.99% respectively.
The analysis of the experimental data revealed that MultiDBN-T achieved satisfactory results for the dataset. Through feature learning, MultiDBN-T performed better in obtaining strong coupling and correlation features between the forecasted target data and multiple observable variables or between hidden variables, time, and time periods. The feature learning improves the prediction accuracy. Although MultiDBN-T improves prediction accuracy, as the dimension of sample data (observable variables) increases, its network structure expands and become too large and too fast, and the network parameters that should be learned become large. The resources required for its training also increase, and the time required for training becomes longer.
6. Conclusions
Power load demand forecasting is the basis for power analysis and intelligent power supply control and has attracted considerable research interest attention in energy management. This method is critical in operating and managing power systems. To accurately forecast power load demand and implement power generation planning and scheduling, we proposed a novel unsupervised MultiDBN-T. The two encoders, pre-DBN and D-TEncoder, are used in the model to perform unsupervised multi-dimensional feature learning on historical data of power loads with multiple observable variables. The data representation encoding is obtained through feature learning. Thus, the strongly coupled features between independent multi-factors, the strongly coupled features between positions or time points in the sequence, and the correlation features between unobservable hidden variables are obtained, which improves the predictive ability and accuracy of the model. On integrated multi-dimensional power load data, compared with the classical and new algorithms for time-series analysis, such as LSTM, Conv3D-LSTM (CNN+LSTM), Adaboost, ARIMA, SVR, and RF, MultiDBN-T exhibited the best performance in both local predictive and overall predictive ability, with an average improvement of more than 40% in MAPE and RMSE, verifying the effectiveness and predictive ability of the model.
However, the MultiDBN-T model requires a large network on high-dimensional datasets, too many network parameters to learn, and a long training time. In the future, we will optimize the networks of pre-DBN and D-TEncoder in the forecasting model to reduce its consumption of resources, further improve its efficiency and accuracy, and improve its applicability.
Author Contributions
Conceptualization, W.B. and K.L.; methodology, W.B. and K.L.; software, J.Z. (Jiaxian Zhu) and J.Z. (Jialing Zhao); validation, W.B., W.C., and K.L.; formal analysis, W.B.; investigation, W.B.; resources, J.Z. (Jiaxian Zhu); data curation, J.Z. (Jialing Zhao); writing—original draft preparation, W.B.; writing—review and editing, W.B.; visualization, W.B.; supervision, W.B. and K.L.; project administration, W.B. and K.L.; funding acquisition, W.B. All authors have read and agreed to the published version of the manuscript.
Funding
This research received no external funding.
Institutional Review Board Statement
Not applicable.
Informed Consent Statement
Not applicable.
Acknowledgments
The work in this study was supported by the Guangdong Province Educational Science Planning Project (no. 2019KTSCX199), the Zhaoqing Science and Technology Special Fund Project (no. 2020G1004), Zhaoqing University Science and Technology Projects (no. zlgc201933), and the Teaching Reform Project of University Public Computer Course of Guangdong Province (no. 2021-GGJGJ-012).
Conflicts of Interest
The authors declare no conflict of interest.
References
- Shahid, F.; Zameer, A.; Muneeb, M. A novel genetic LSTM model for wind power forecast. Energy 2021, 223, 120069. [Google Scholar] [CrossRef]
- Phan, Q.T.; Wu, Y.K.; Phan, Q.D. A hybrid wind power forecasting model with XGBoost, data preprocessing considering different NWPs. Appl. Sci. 2021, 11, 1100. [Google Scholar] [CrossRef]
- Lai, X.; Huang, Y.; Han, X.; Gu, H.; Zheng, Y. A novel method for state of energy estimation of lithium-ion batteries using particle filter and extended Kalman filter. J. Energy Storage 2021, 43, 103269. [Google Scholar] [CrossRef]
- Ti, Z.; Deng, X.W.; Zhang, M. Artificial Neural Networks based wake model for power prediction of wind farm. Renew. Energy 2021, 172, 618–631. [Google Scholar] [CrossRef]
- Kasihmuddin, M.S.M.; Jamaludin, S.Z.M.; Mansor, M.A.; Wahab, H.A.; Ghadzi, S.M.S. Supervised Learning Perspective in Logic Mining. Mathematics 2022, 10, 915. [Google Scholar] [CrossRef]
- Mohd Jamaludin, S.Z.; Mohd Kasihmuddin, M.S.; Md Ismail, A.I.; Mansor, M.A.; Md Basir, M.F. Energy based logic mining analysis with hopfield neural network for recruitment evaluation. Entropy 2020, 23, 40. [Google Scholar] [CrossRef]
- Jamaludin, S.Z.M.; Romli, N.A.; Kasihmuddin, M.S.M.; Baharum, A.; Mansor, M.A.; Marsani, M.F. Novel Logic Mining Incorporating Log Linear Approach. J. King Saud Univ.-Comput. Inf. Sci. 2022; in press. [Google Scholar]
- Kong, W.; Dong, Z.Y.; Jia, Y.; Hill, D.J.; Xu, Y.; Zhang, Y. Short-term residential load forecasting based on LSTM recurrent neural network. IEEE Trans. Smart Grid 2019, 10, 841–851. [Google Scholar] [CrossRef]
- Luo, H.; Zhou, P.; Shu, L.; Mou, J.; Zheng, H.; Jiang, C.; Wang, Y. Energy performance curves prediction of centrifugal pumps based on constrained PSO-SVR model. Energies 2022, 15, 3309. [Google Scholar] [CrossRef]
- Liu, M.D.; Ding, L.; Bai, Y.L. Application of hybrid model based on empirical mode decomposition, novel recurrent neural networks and the ARIMA to wind speed prediction. Energy Convers. Manag. 2021, 233, 113917. [Google Scholar] [CrossRef]
- Wei, N.; Li, C.; Duan, J.; Liu, J.; Zeng, F. Daily natural gas load forecasting based on a hybrid deep learning model. Energies 2019, 12, 218. [Google Scholar] [CrossRef] [Green Version]
- Lu, H.; Azimi, M.; Iseley, T. Short-term load forecasting of urban gas using a hybrid model based on improved fruit fly optimization algorithm and support vector machine. Energy Rep. 2019, 5, 666–677. [Google Scholar] [CrossRef]
- Wenlong, H.; Yahui, W. Load forecast of gas region based on ARIMA algorithm. In Proceedings of the 2020 Chinese Control And Decision Conference (CCDC), Hefei, China, 22–24 August 2020; pp. 1960–1965. [Google Scholar]
- Musbah, H.; El-Hawary, M. SARIMA model forecasting of short-term electrical load data augmented by fast fourier transform seasonality detection. In Proceedings of the IEEE Canadian Conference of Electrical and Computer Engineering (CCECE), Edmonton, AB, Canada, 5–8 May 2019; pp. 1–4. [Google Scholar]
- Yildiz, B.; Bilbao, J.; Sproul, A. A review and analysis of regression and machine learning models on commercial building electricity load forecasting. Renew. Sustain. Energy Rev. 2017, 73, 1104–1122. [Google Scholar] [CrossRef]
- Tayaba, U.B.; Zia, A.; Yanga, F.; Lu, J.; Kashif, M. Short-term load forecasting for microgrid energy management system using hybrid HHO-FNN model with best-basis stationary wavelet packet transform. Energy 2020, 203, 117857. [Google Scholar] [CrossRef]
- Panapakidis, I.; Katsivelakis, M.; Bargiotas, D. A Metaheuristics-Based Inputs Selection and Training Set Formation Method for Load Forecasting. Symmetry 2022, 14, 1733. [Google Scholar] [CrossRef]
- Ahmed, W.; Ansari, H.; Khan, B.; Ullah, Z.; Ali, S.M.; Mehmood, C.A.A. Machine learning based energy management model for smart grid and renewable energy districts. IEEE Access 2020, 8, 185059–185078. [Google Scholar] [CrossRef]
- Shabbir, N.; Kutt, L.; Jawad, M.; Iqbal, M.N.; Ghahfarokhi, P.S. Forecasting of energy consumption and production using recurrent neural networks. Adv. Electr. Electron. Eng. 2020, 18, 190–197. [Google Scholar] [CrossRef]
- Shirzadi, N.; Nizami, A.; Khazen, M.; Nik-Bakht, M. Medium-term regional electricity load forecasting through machine learning and deep learning. Designs 2021, 5, 27. [Google Scholar] [CrossRef]
- Fan, G.-F.; Guo, Y.-H.; Zheng, J.-M.; Hong, W.-C. Application of the weighted K-nearest neighbor algorithm for short-term load forecasting. Energies 2019, 12, 916. [Google Scholar] [CrossRef]
- Madrid, E.A.; Antonio, N. Short-term electricity load forecasting with machine learning. Information 2021, 12, 50. [Google Scholar] [CrossRef]
- Shi, H.; Xu, M.; Li, R. Deep learning for household load forecasting—A novel pooling deep RNN. IEEE Trans. Smart Grid 2018, 9, 5271–5280. [Google Scholar] [CrossRef]
- Wang, X.; Gao, X.; Wang, Z.; Ma, C.; Song, Z. A Combined Model Based on EOBL-CSSA-LSSVM for Power Load Forecasting. Symmetry 2021, 13, 1579. [Google Scholar] [CrossRef]
- Zhou, T.; Ma, Z.; Wen, Q.; Wang, X.; Sun, L.; Jin, R. FEDformer: Frequency enhanced decomposed transformer for long-term series forecasting. arXiv 2022, preprint. arXiv:2201.12740. [Google Scholar]
- Xuan, W.; Shouxiang, W.; Qianyu, Z.; Shaomin, W.; Liwei, F. A multi-energy load prediction model based on deep multi-task learning and ensemble approach for regional integrated energy systems. Int. J. Electr. Power Energy Syst. 2021, 126, 106583. [Google Scholar] [CrossRef]
- Zhou, B.; Meng, Y.; Huang, W.; Wang, H.; Deng, L.; Huang, S.; Wei, J. Multi-energy net load forecasting for integrated local energy systems with heterogeneous prosumers. Int. J. Electr. Power Energy Syst. 2021, 126, 106542. [Google Scholar] [CrossRef]
- Wang, C.; Wang, Y.; Ding, Z.; Zheng, T.; Hu, J.; Zhang, K. A Transformer-Based Method of Multi-Energy Load Forecasting in Integrated Energy System. IEEE Trans. Smart Grid 2022, 13, 2703–2714. [Google Scholar] [CrossRef]
- Phyo, P.P.; Byun, Y.C. Hybrid Ensemble Deep Learning-Based Approach for Time Series Energy Prediction. Symmetry 2021, 13, 1942. [Google Scholar] [CrossRef]
- Bengio, Y.; Courville, A.; Vincent, P. Representation learning: A review and new perspectives. IEEE Trans. Pattern Anal. Mach. Intell. 2013, 35, 1798–1828. [Google Scholar] [CrossRef] [PubMed]
- Schölkopf, B.; Locatello, F.; Bauer, S.; Ke, N.R.; Kalchbrenner, N.; Goyal, A.; Bengio, Y. Toward causal representation learning. Proc. IEEE 2021, 109, 612–634. [Google Scholar] [CrossRef]
- Hinton, G.E. A practical guide to training restricted Boltzmann machines. In Neural Networks: Tricks of the Trade; Springer: Berlin/Heidelberg, Germany, 2012; pp. 599–619. [Google Scholar]
- Zhang, Z.; Zhao, J. A deep belief network based fault diagnosis model for complex chemical processes. Comput. Chem. Eng. 2017, 107, 395–407. [Google Scholar] [CrossRef]
Figure 1.
The overall structure of the MultiDBN-T model and its training process.
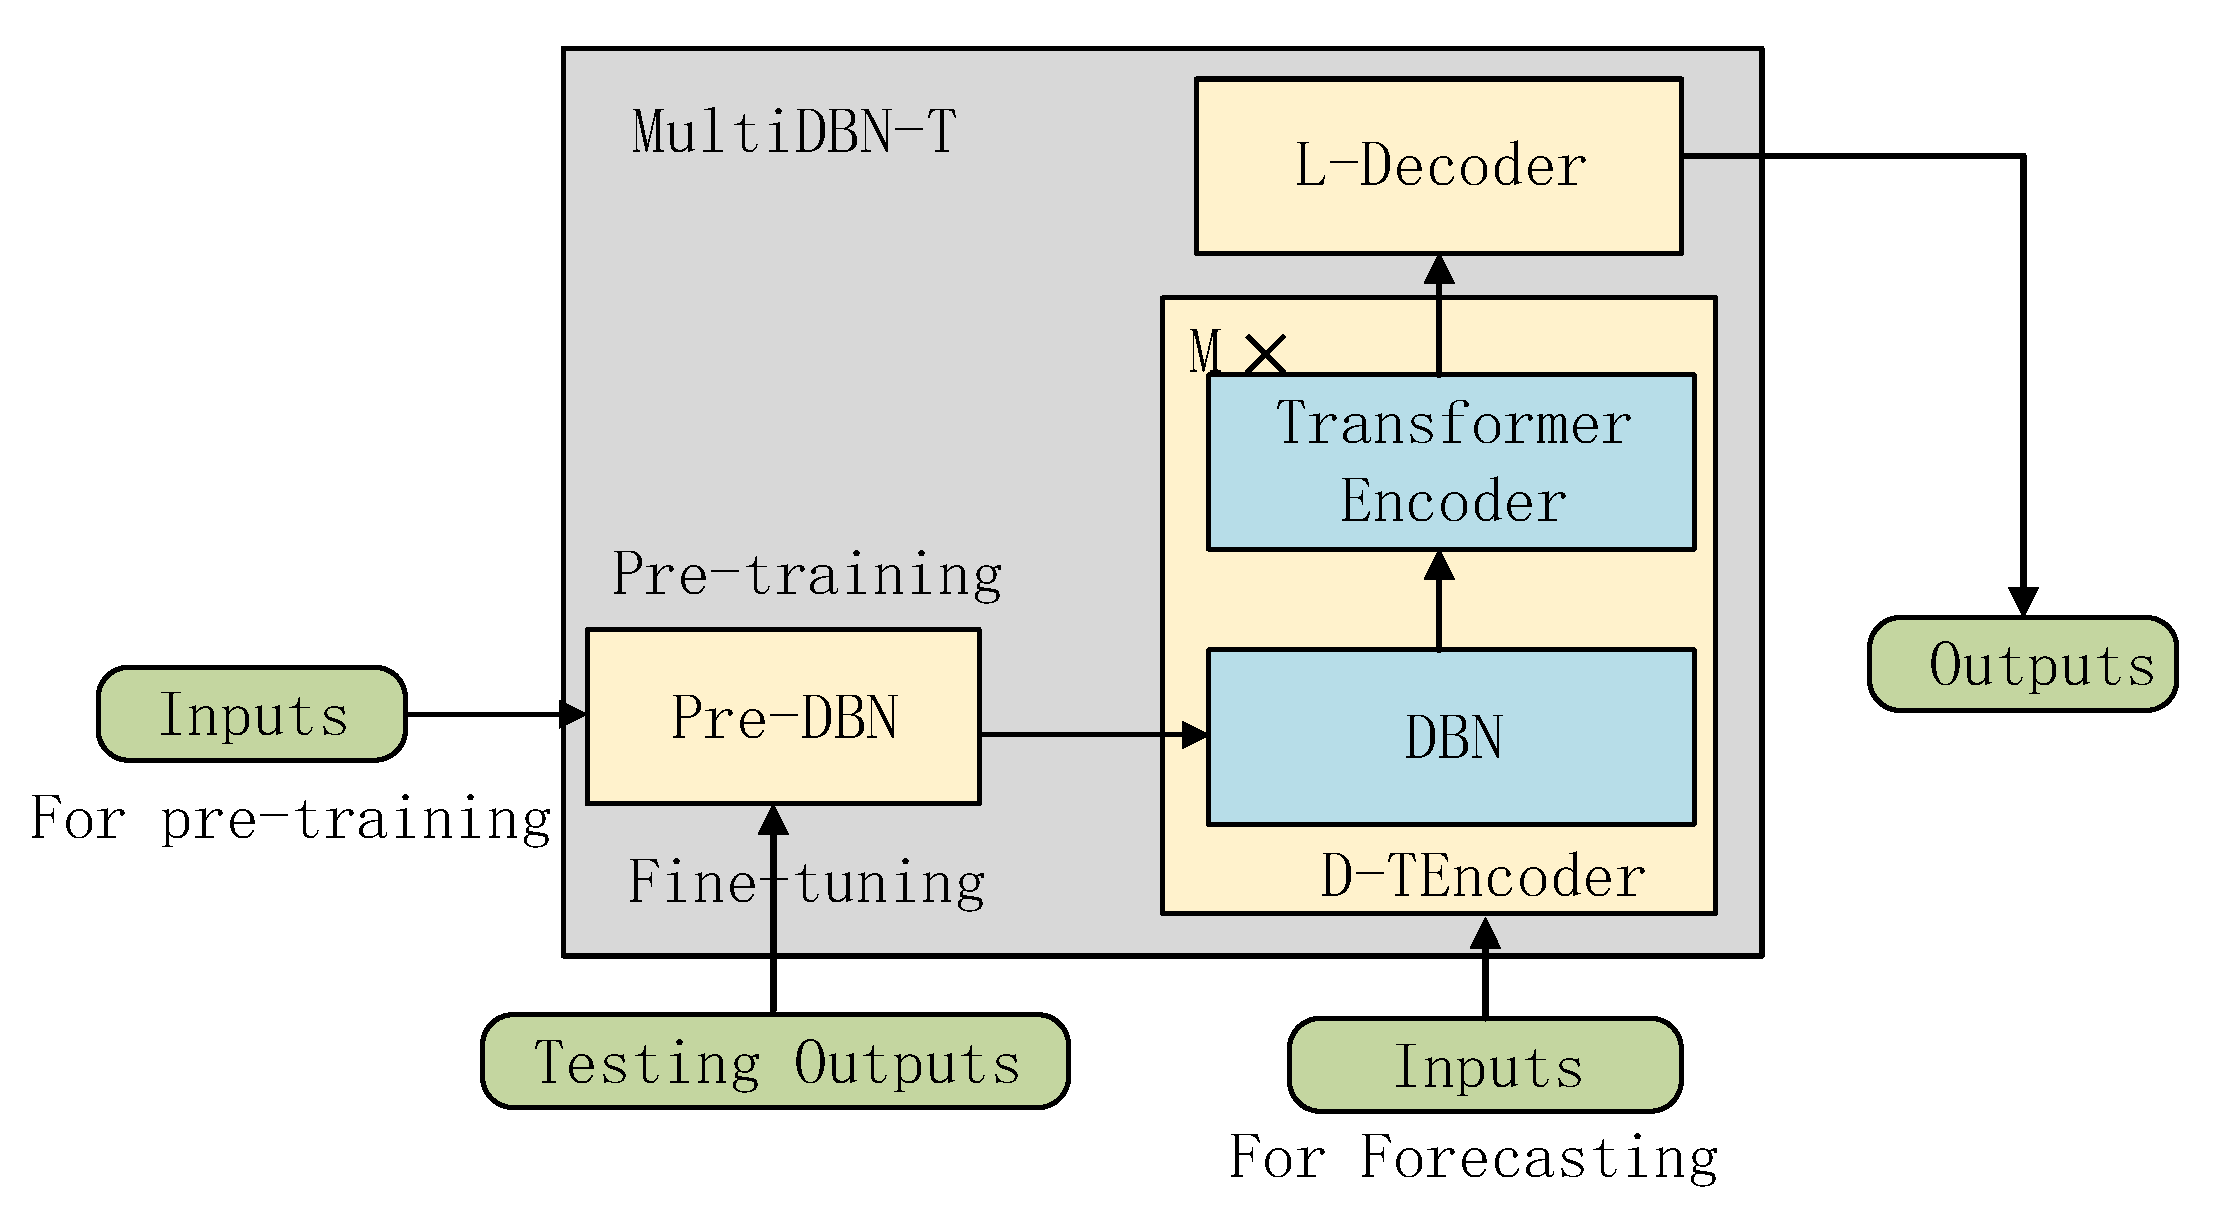
Figure 2.
Architecture of the MultiDBN-T model.

Figure 3.
An RBM in pre-DBN.

Figure 4.
Solving process of the CK-k algorithm.
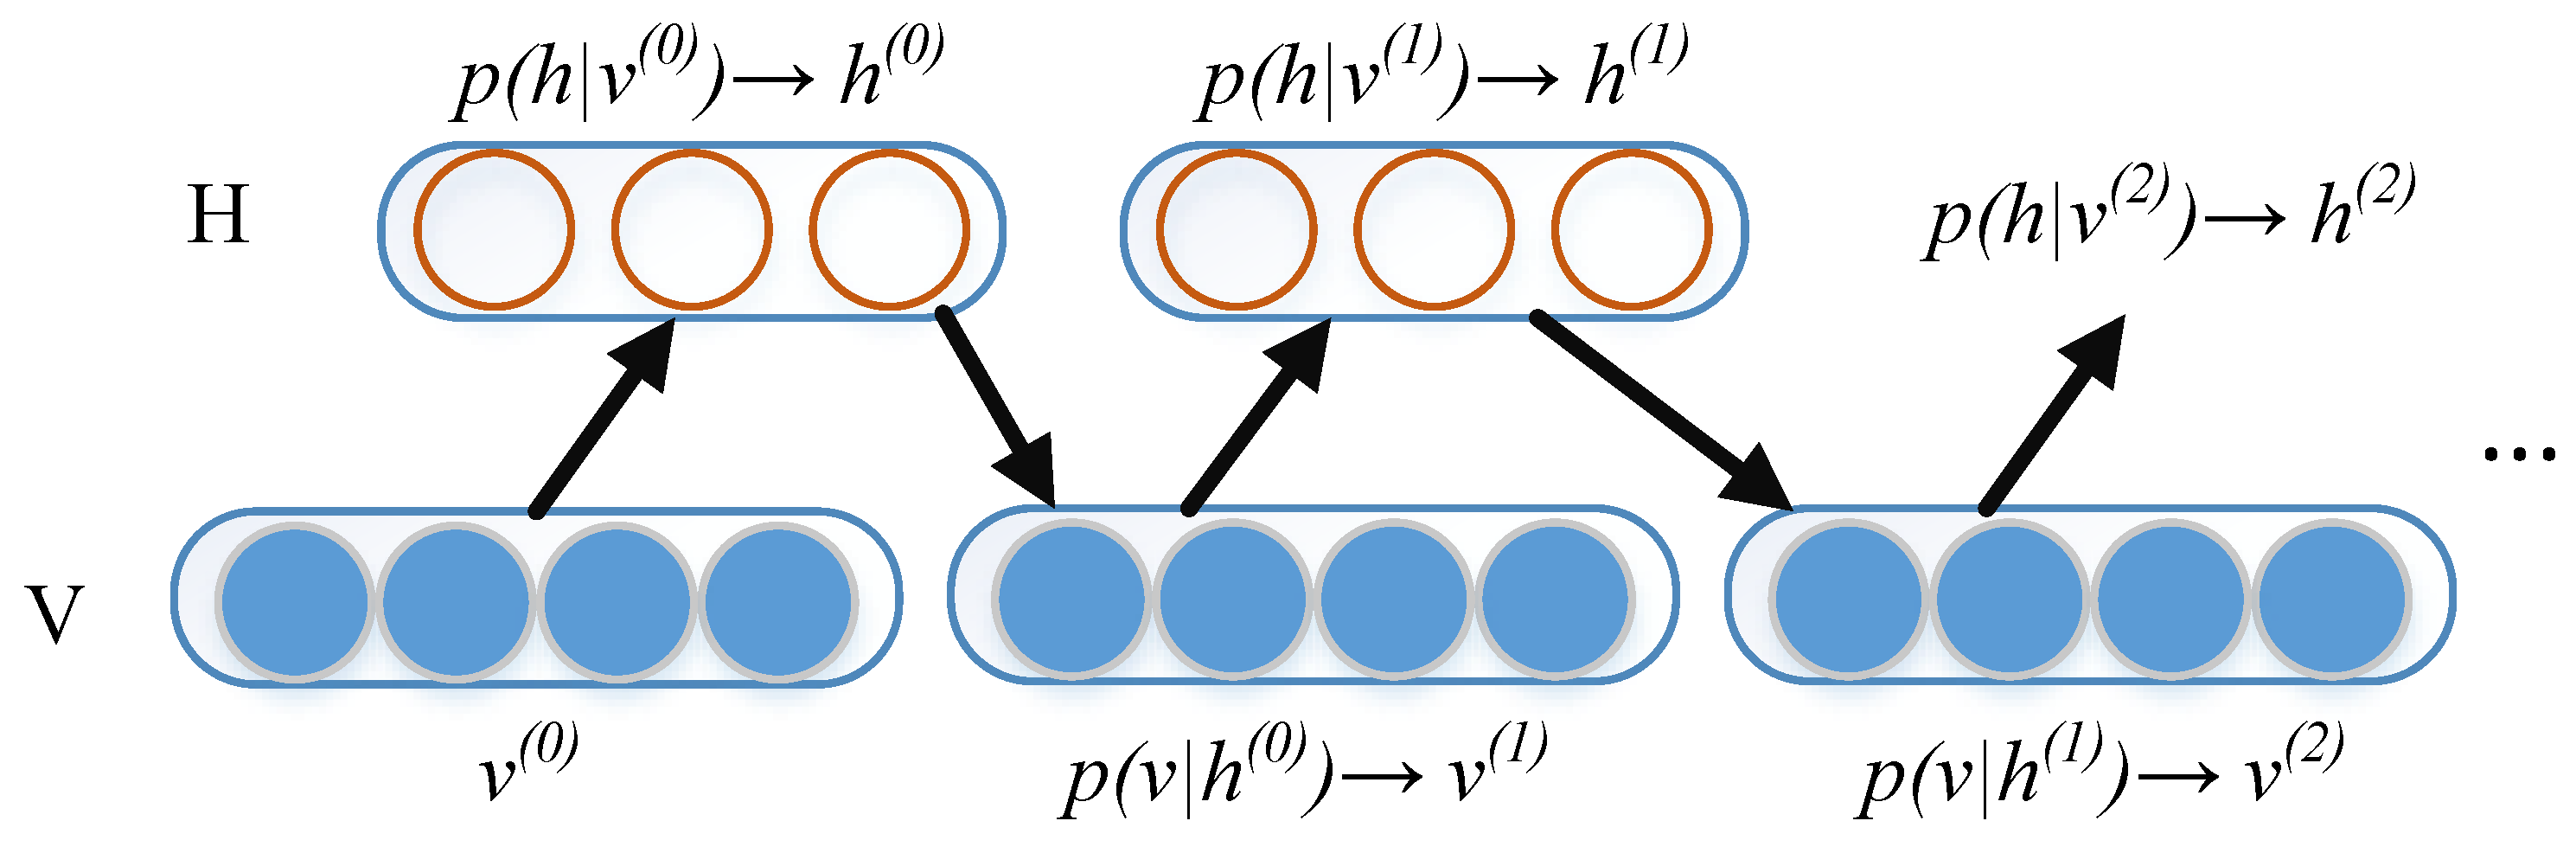
Figure 5.
Transformer encoder.
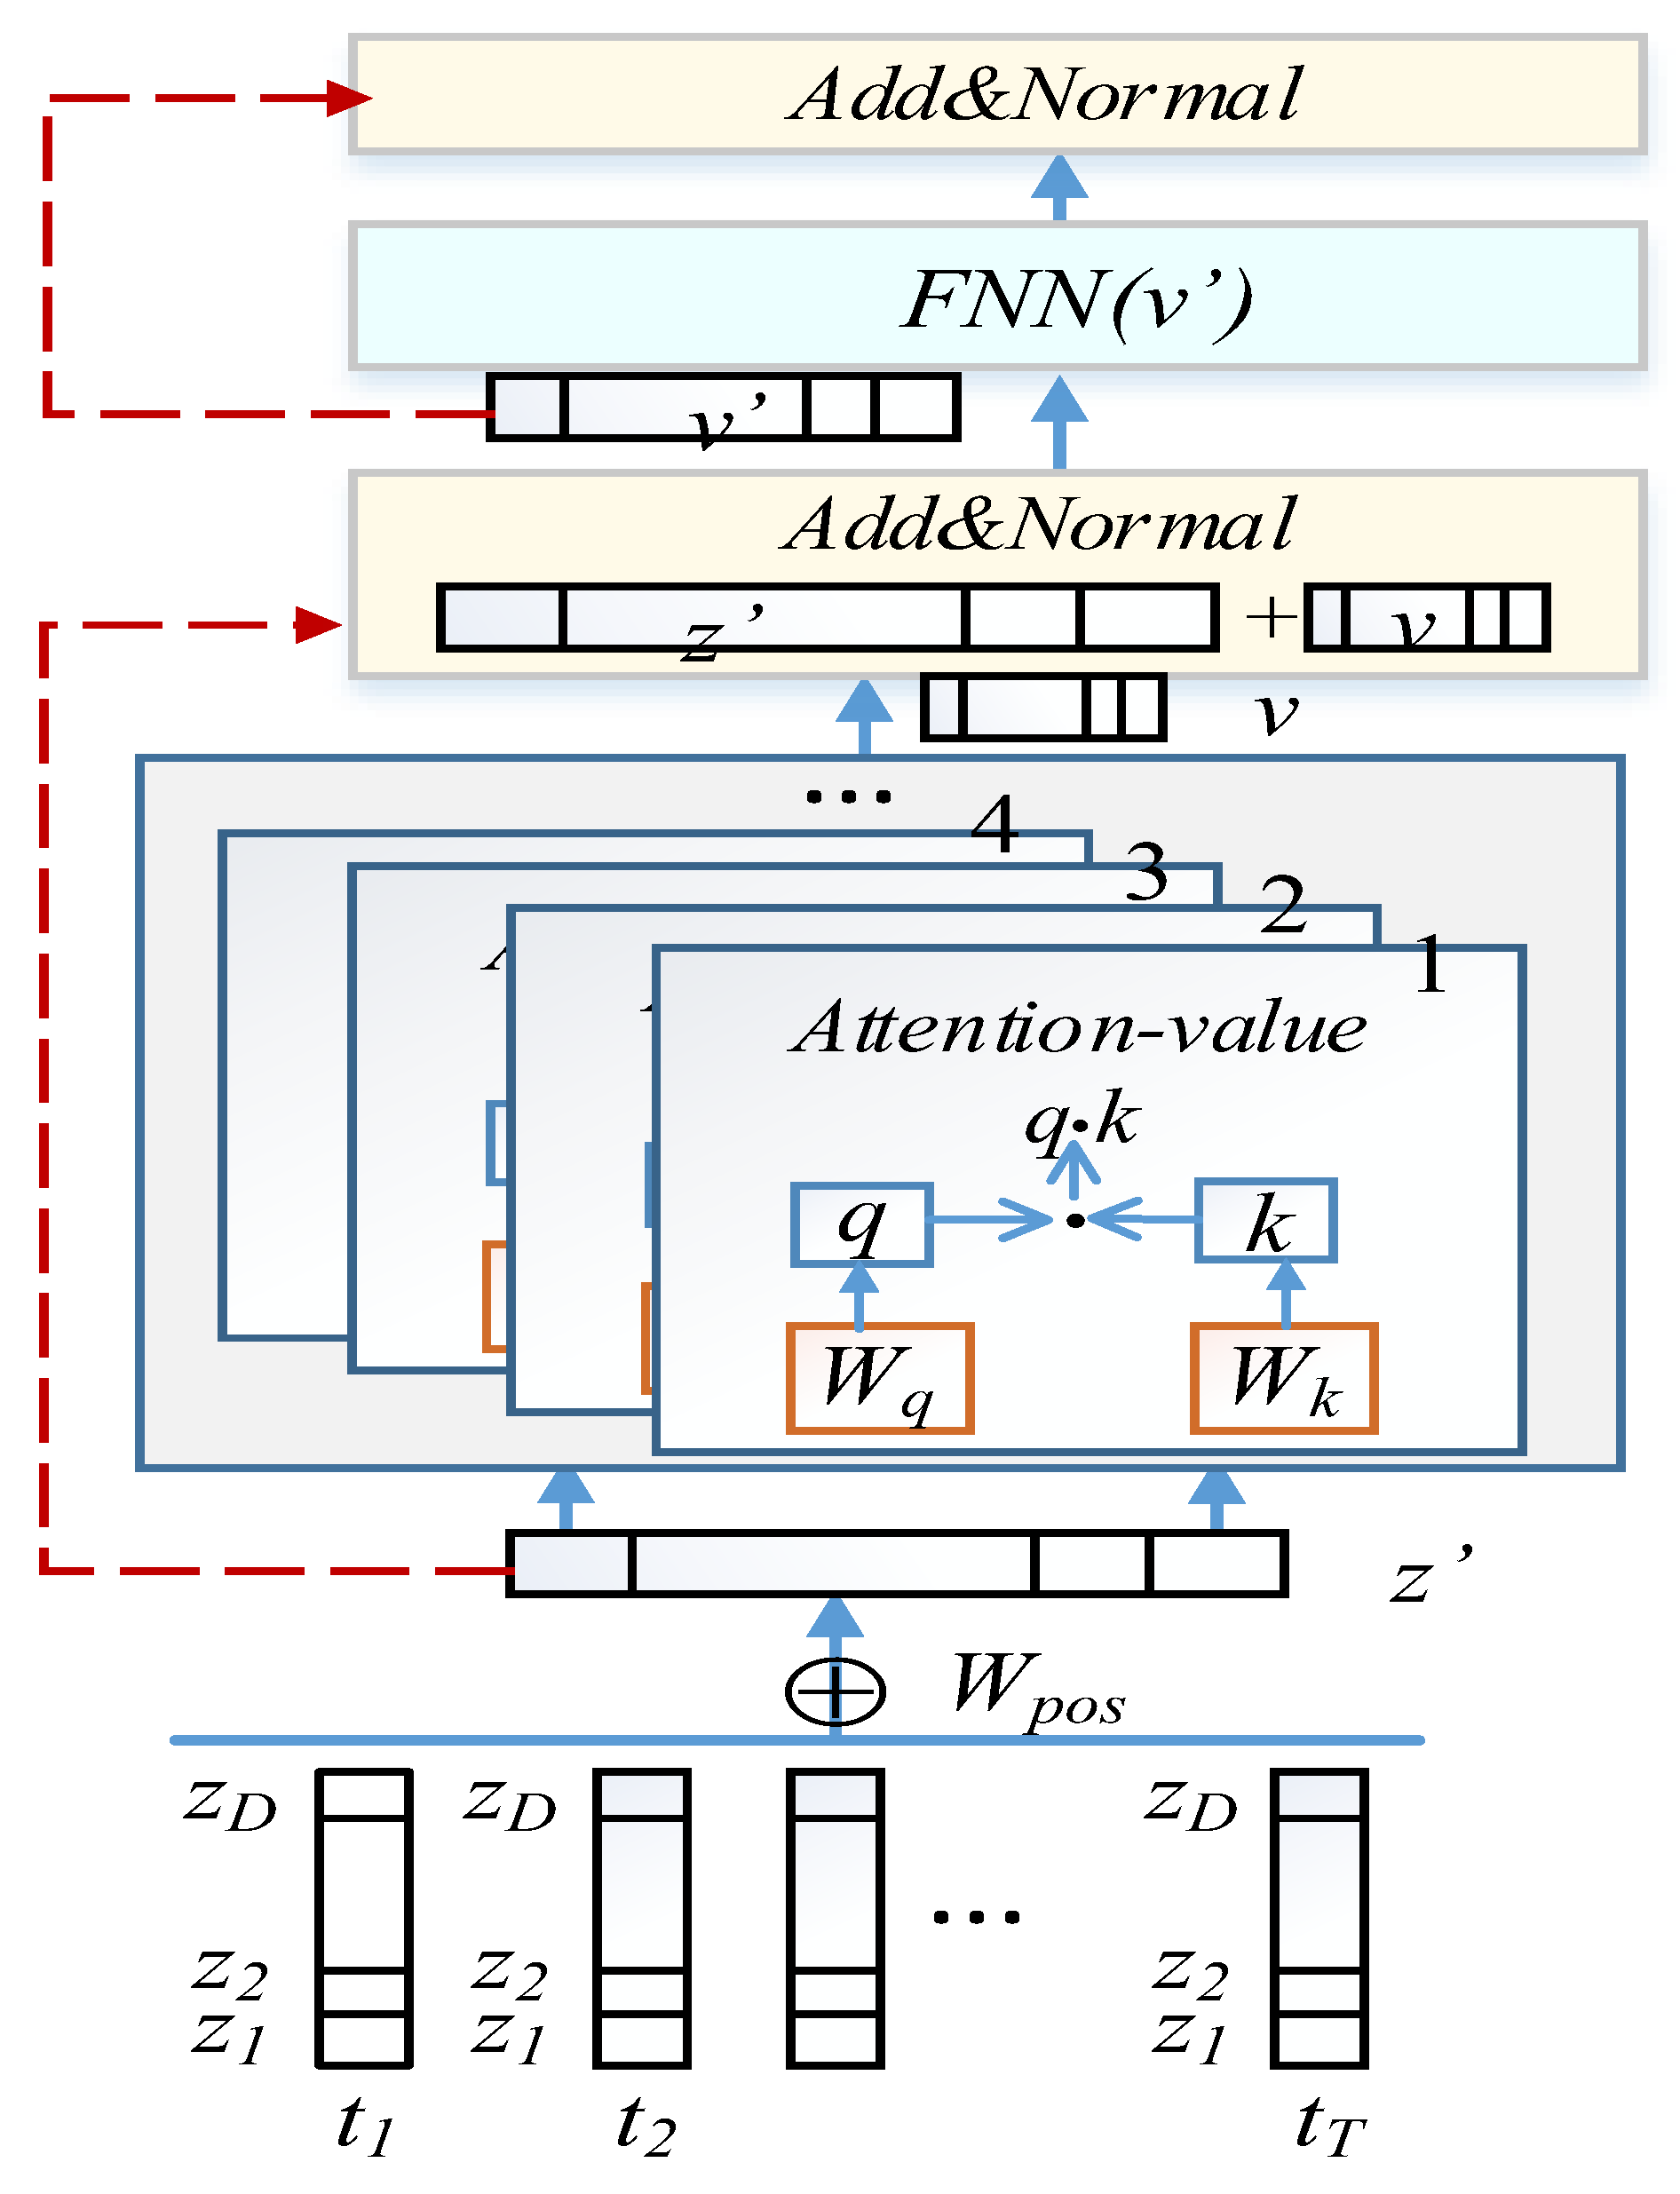
Figure 6.
MultiDBN-T kernel layer data format conversion.

Figure 7.
Results of mean absolute percentage error (MAPE) and root mean square error (RMSE) from different algorithms.
Figure 7.
Results of mean absolute percentage error (MAPE) and root mean square error (RMSE) from different algorithms.
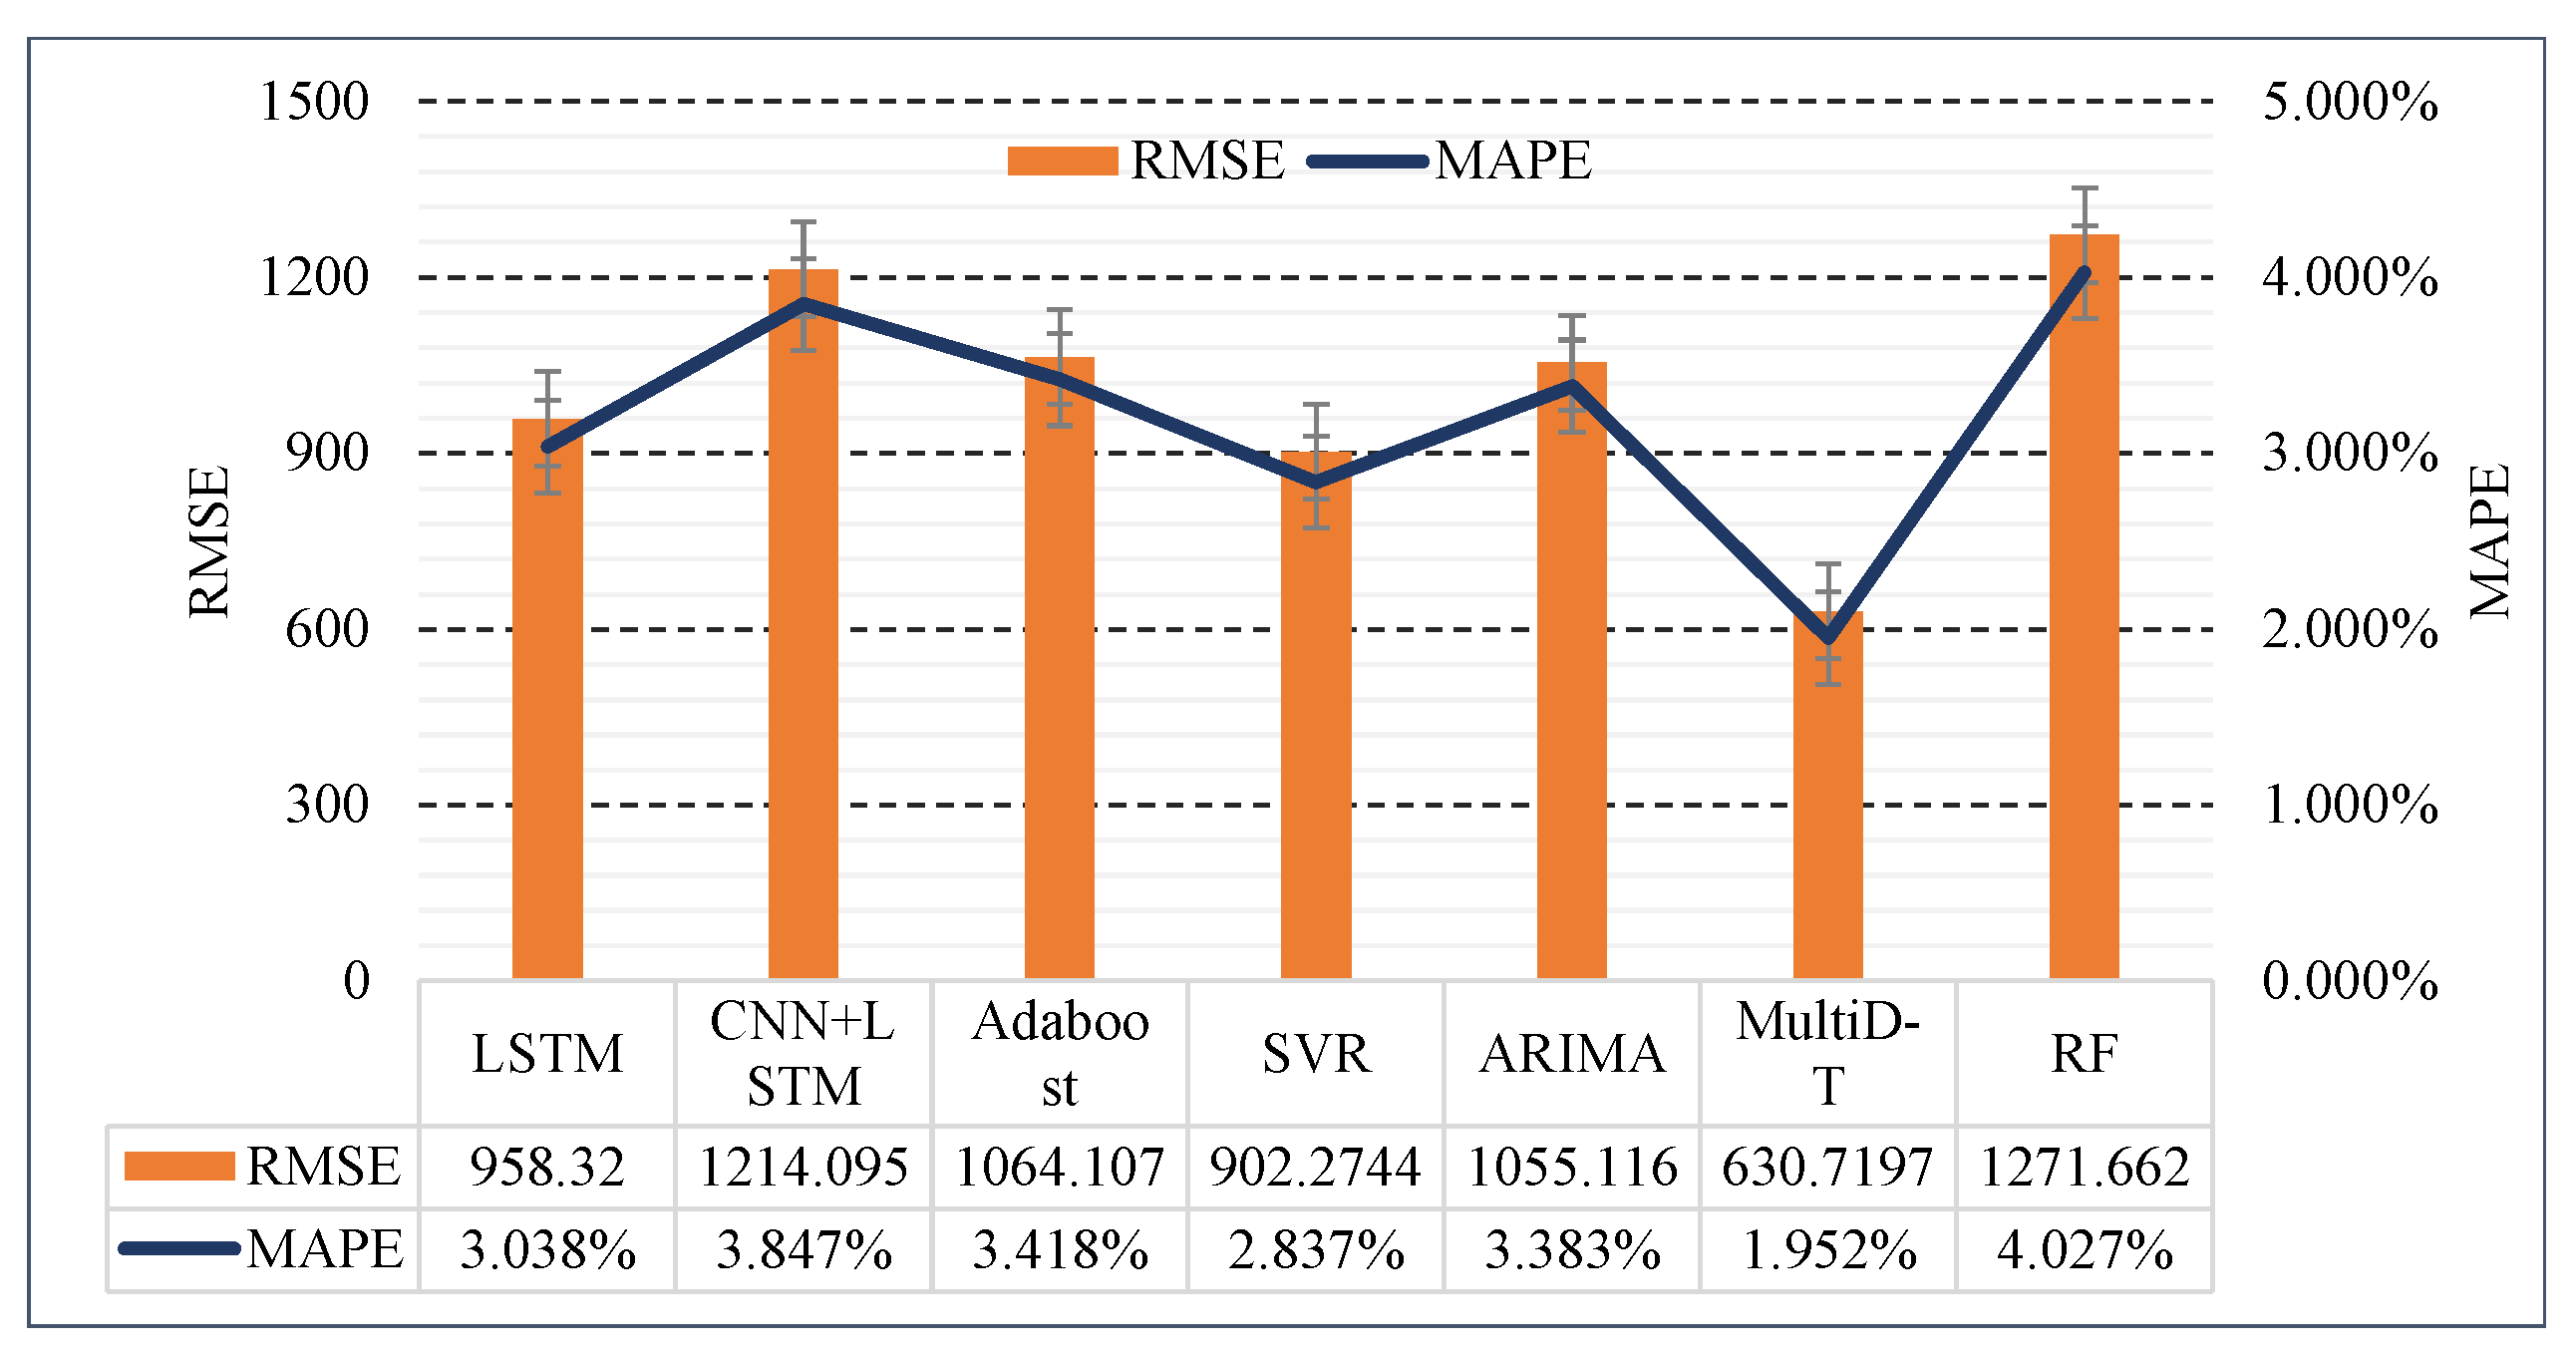
Figure 8.
MAPE component distribution box plots.
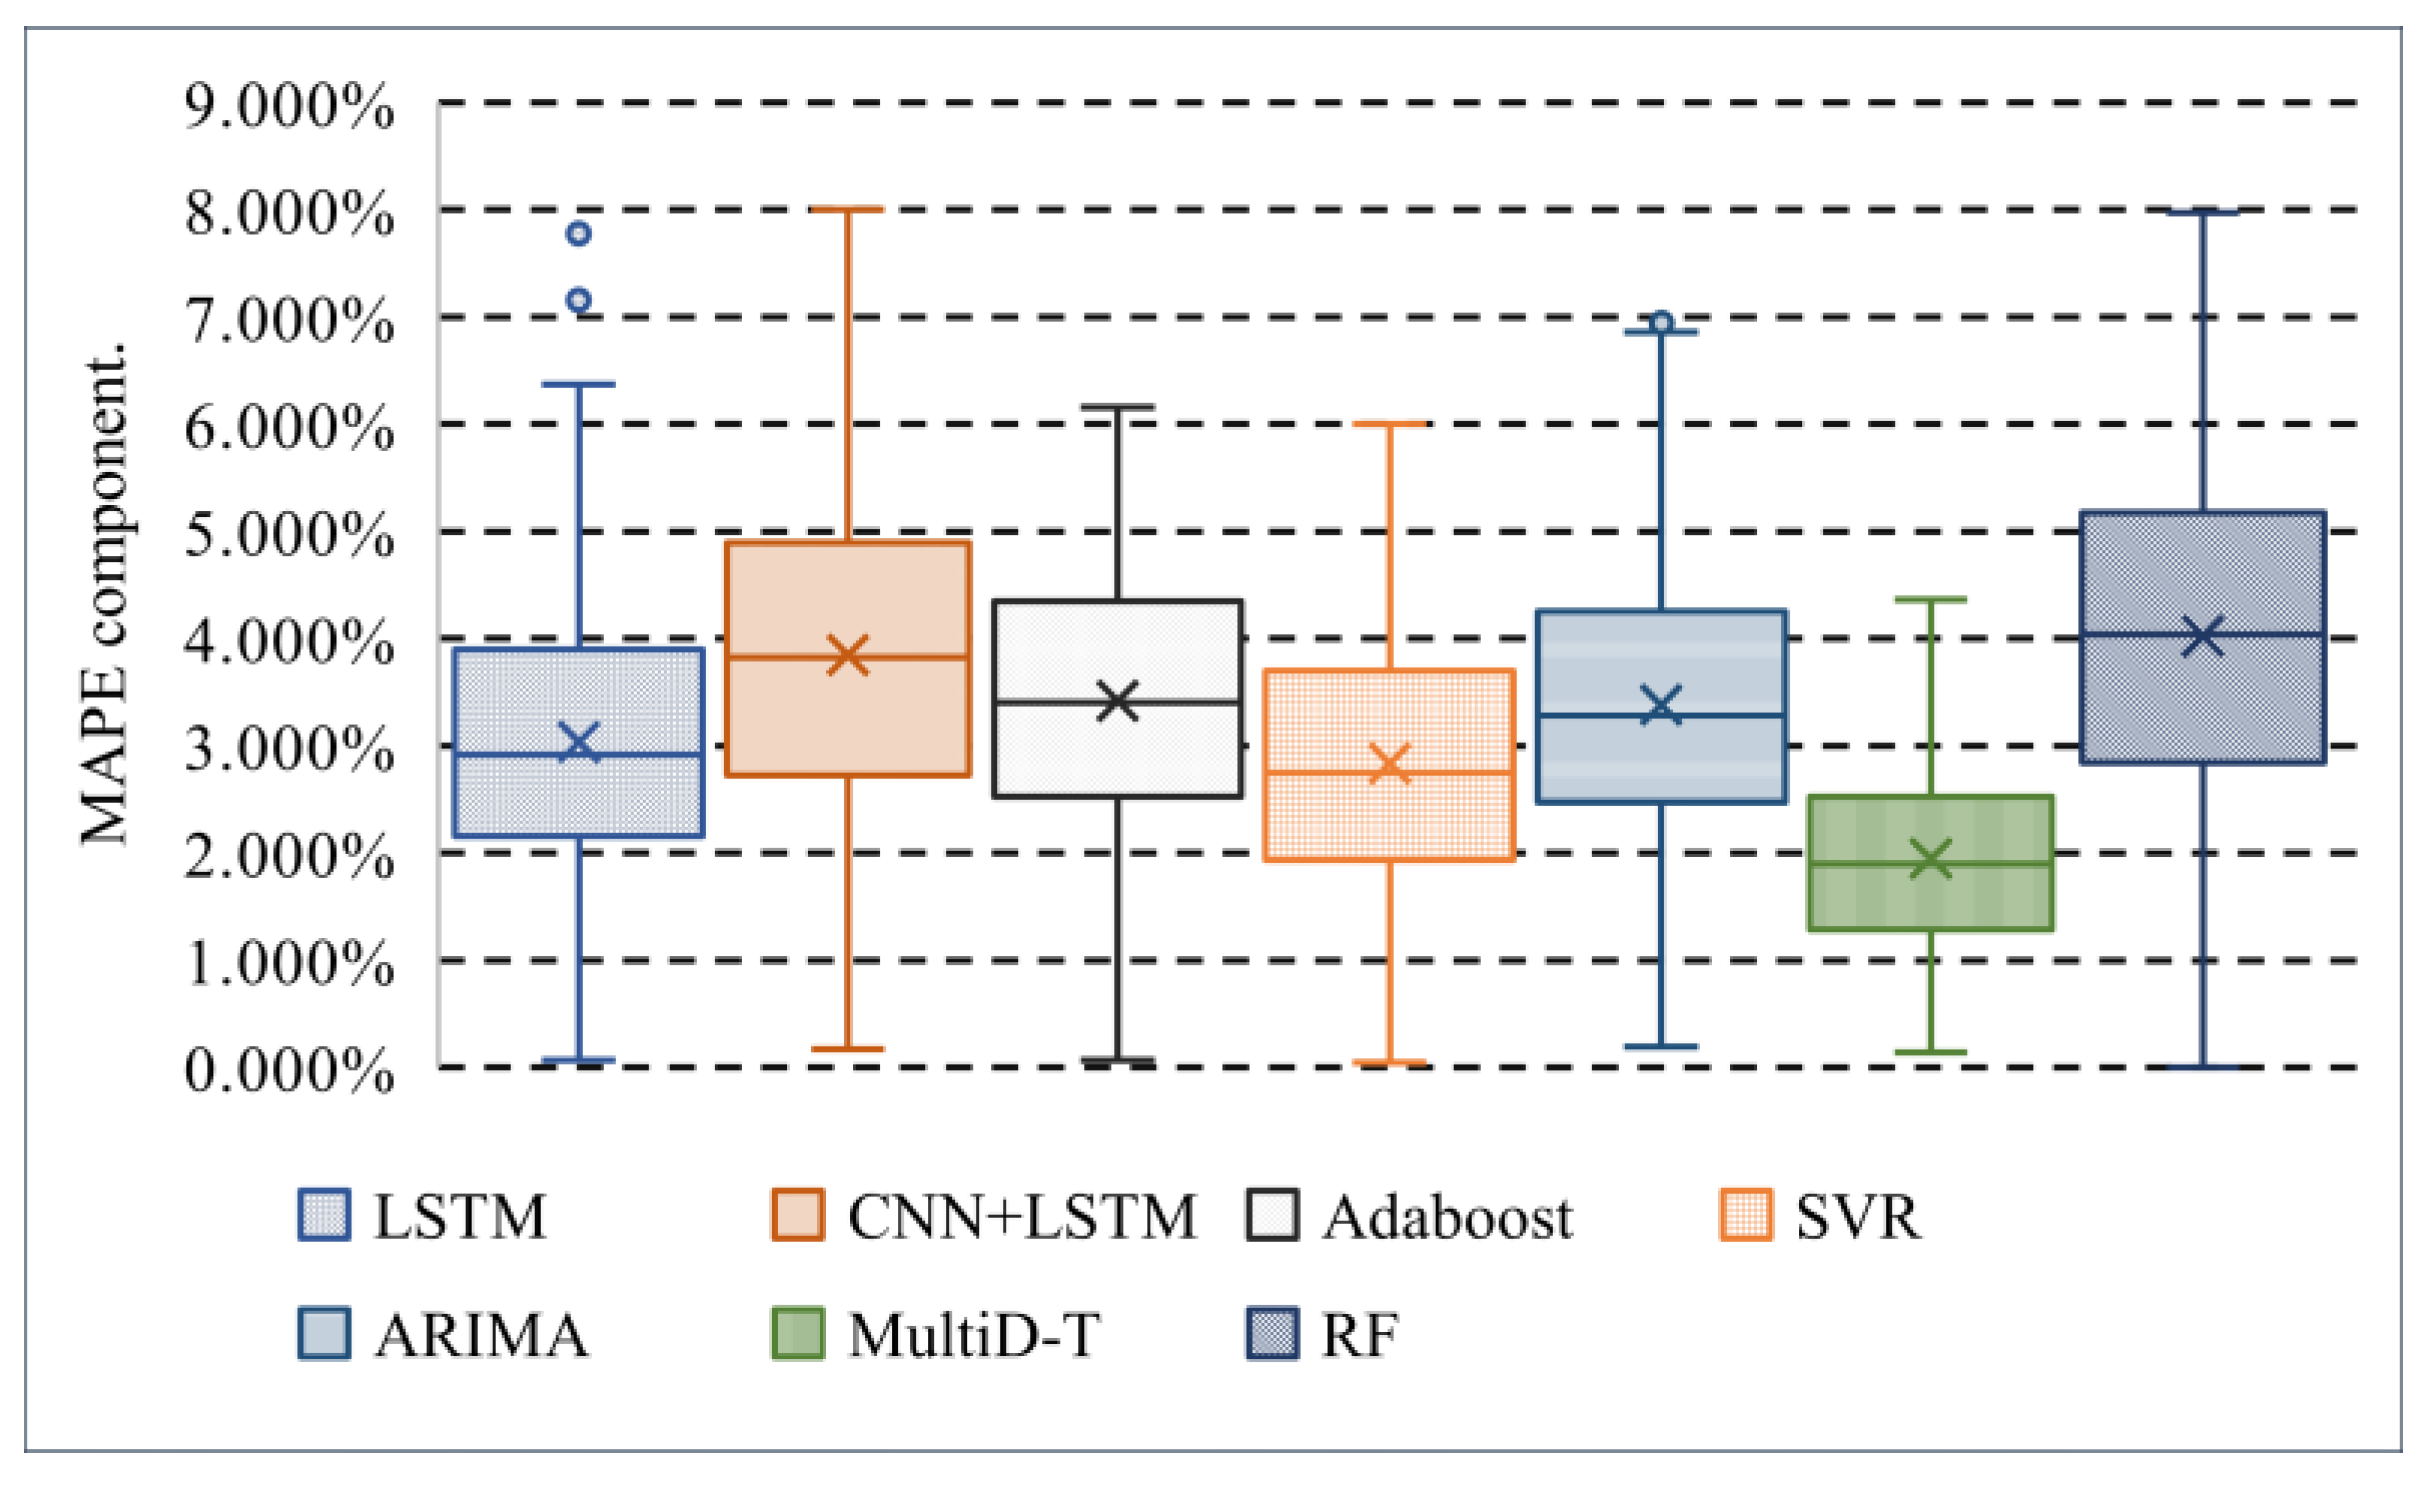
Figure 9.
RMSE component distribution box plots.
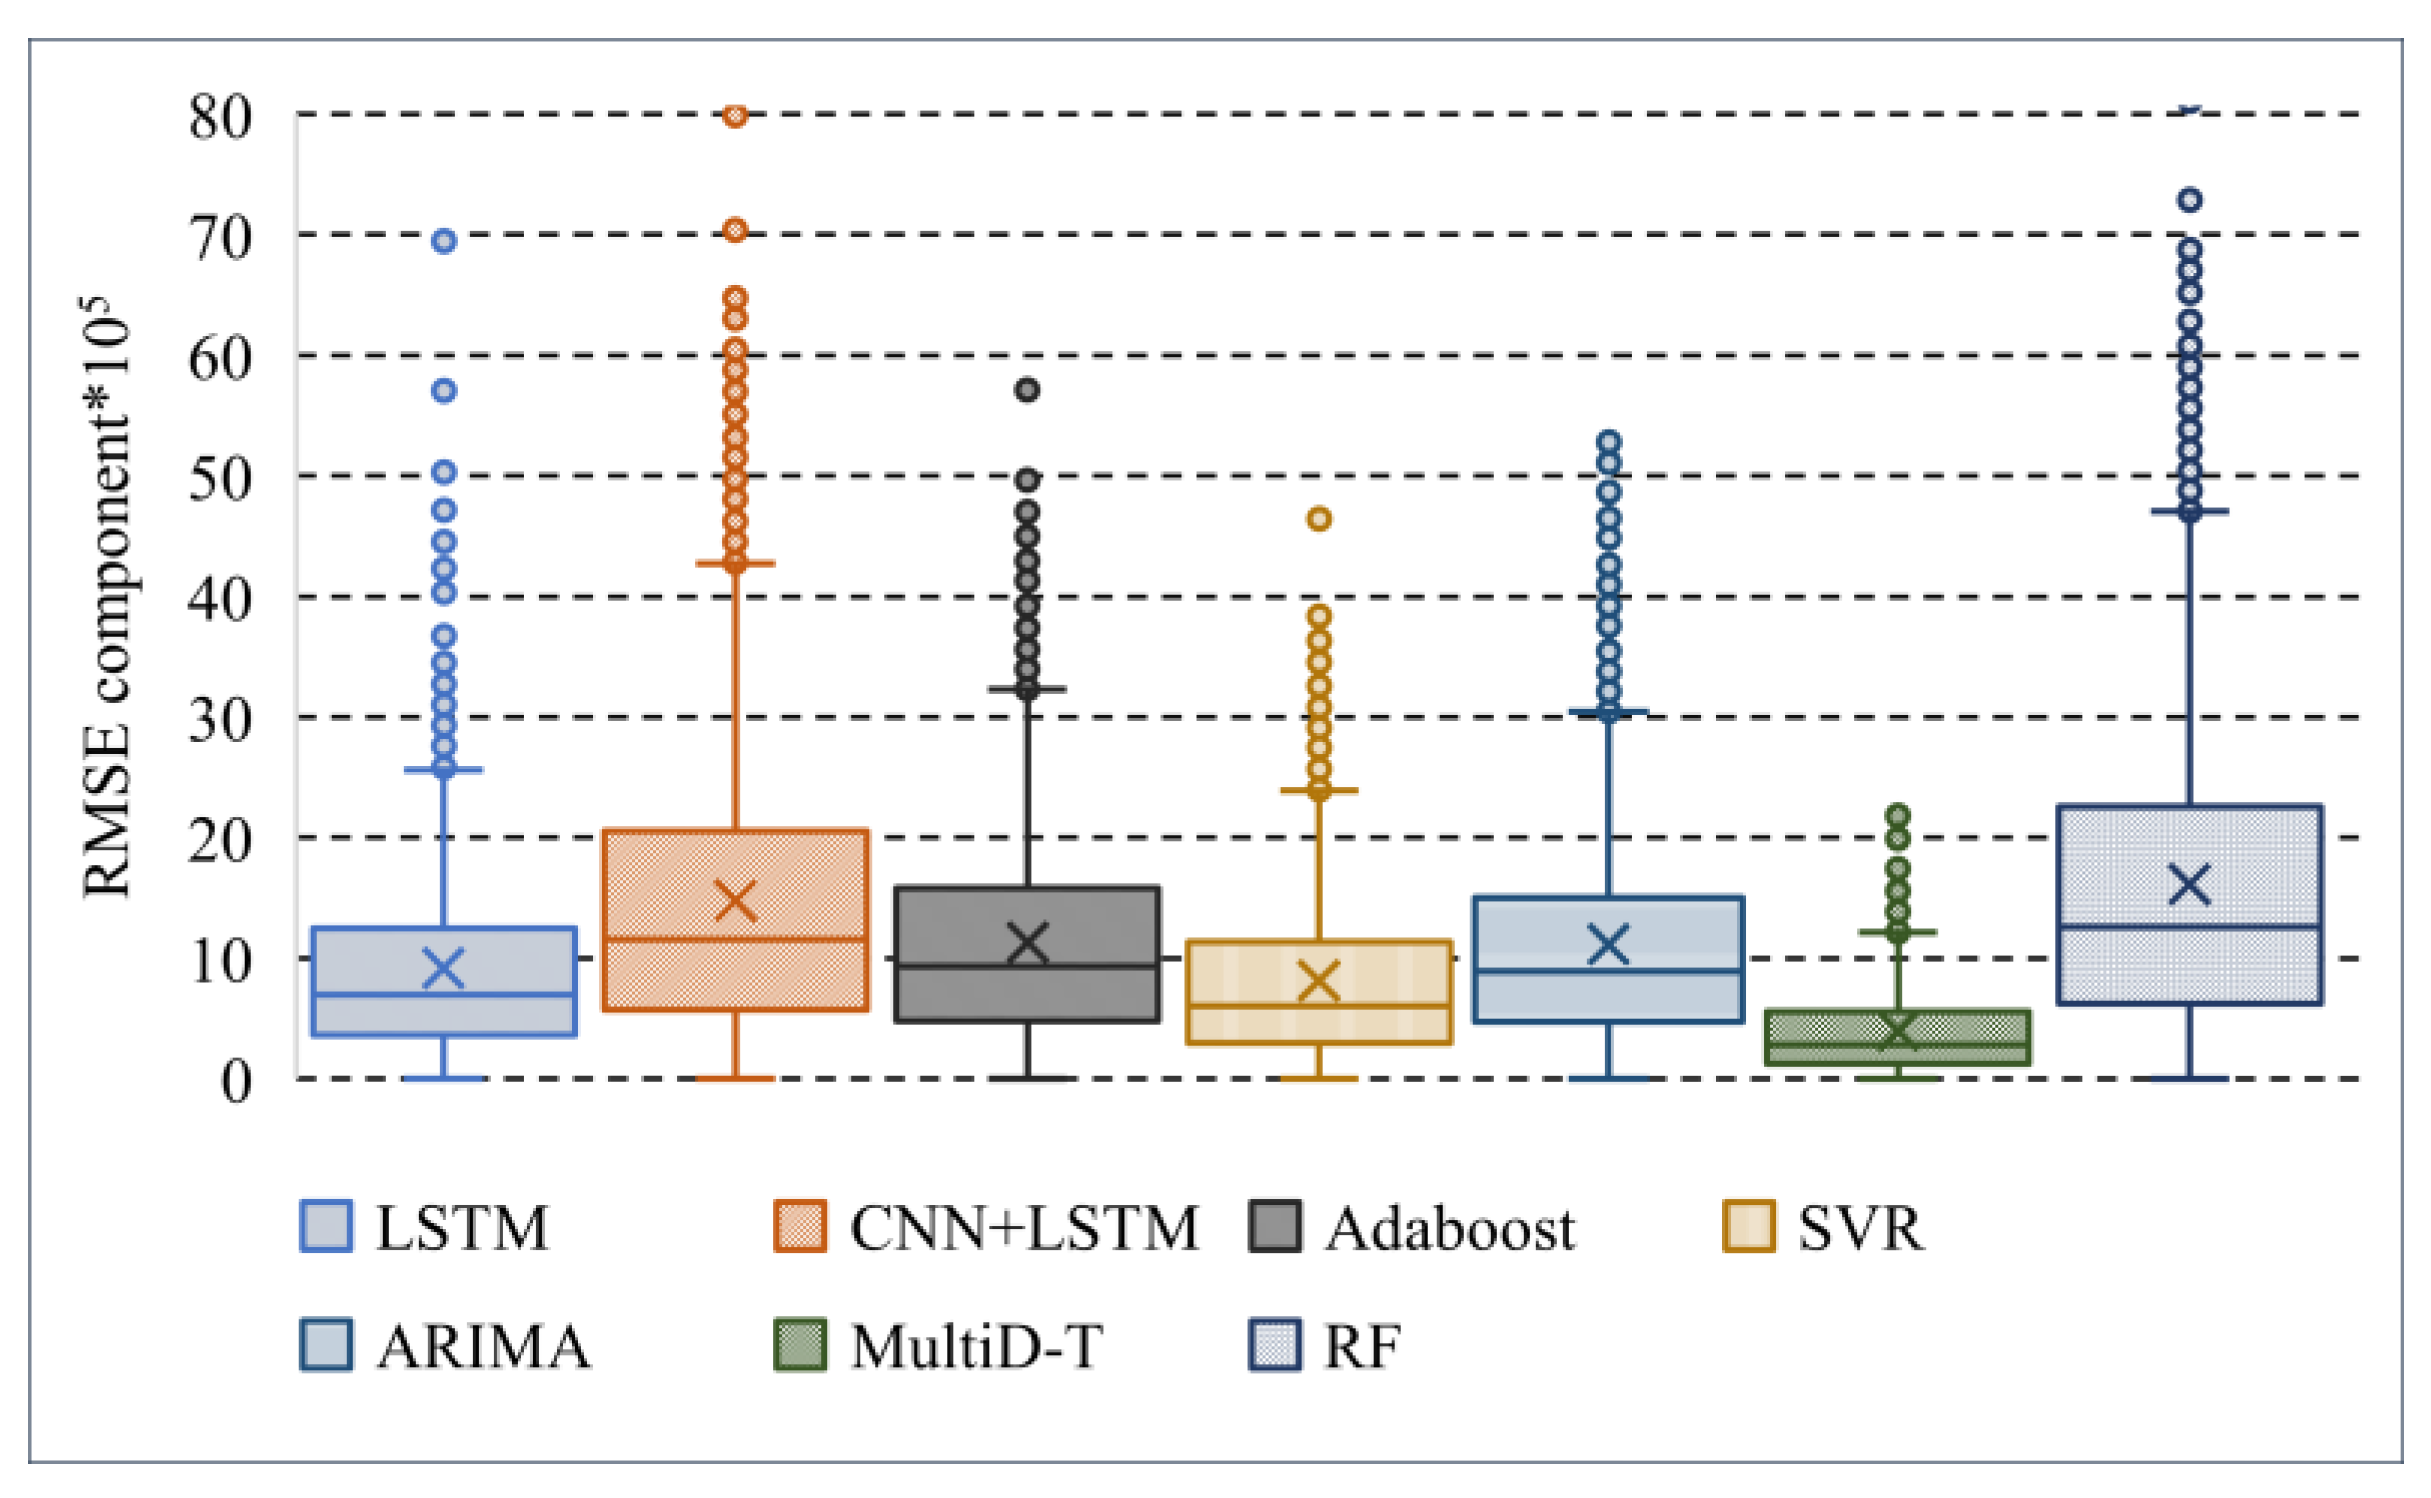
Figure 10.
Box plots for MAPE component improvement.
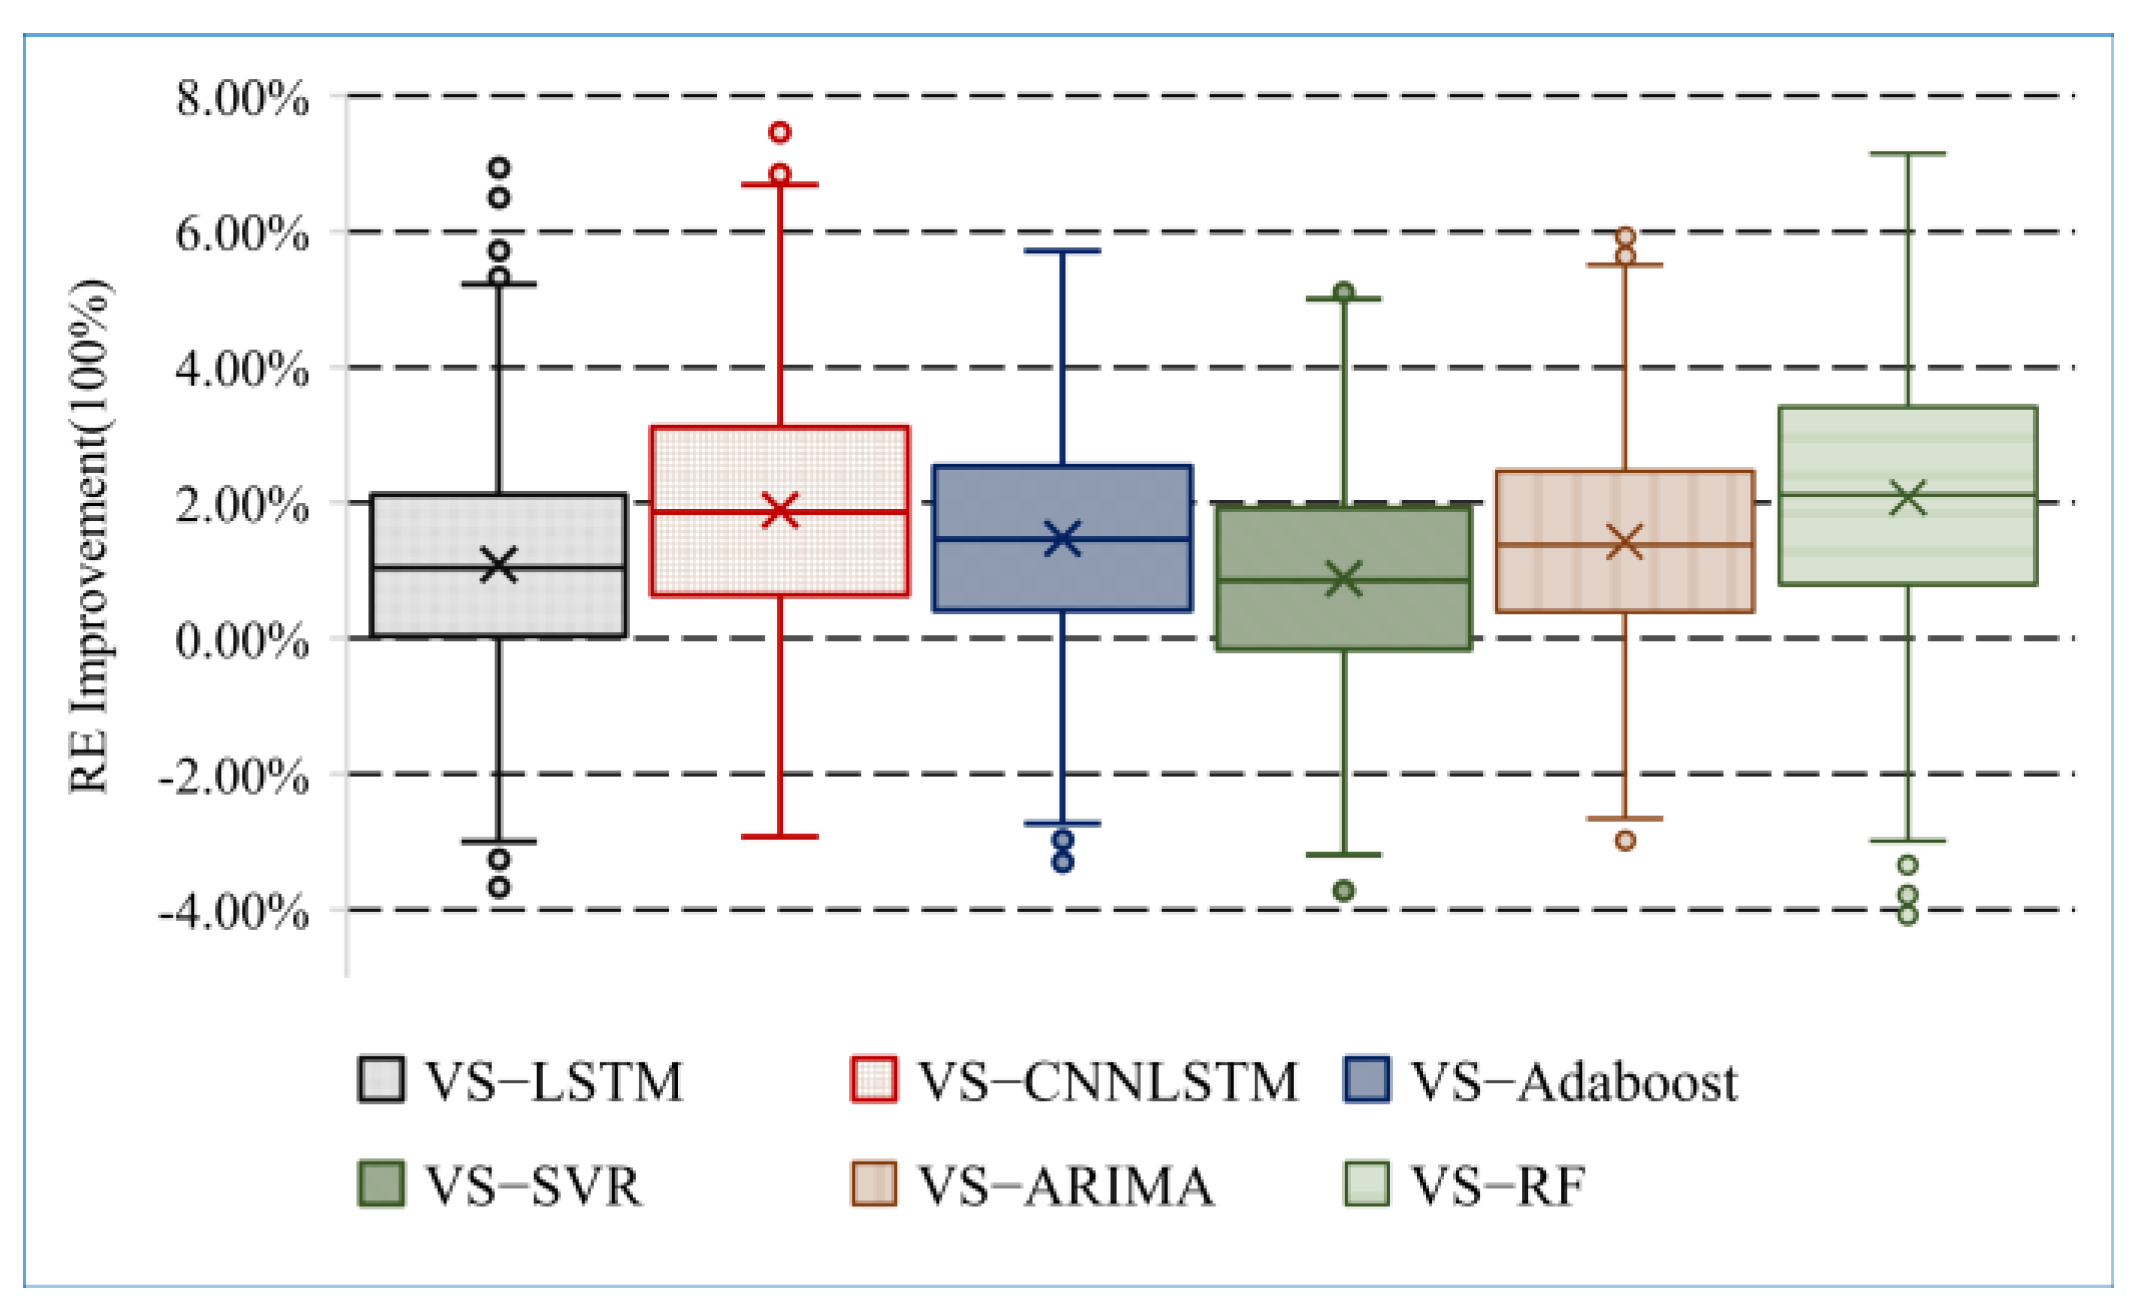
Figure 11.
Box plots for distribution of the RMSE component improvement, in comparison with the improvement in MSE’.
Figure 11.
Box plots for distribution of the RMSE component improvement, in comparison with the improvement in MSE’.
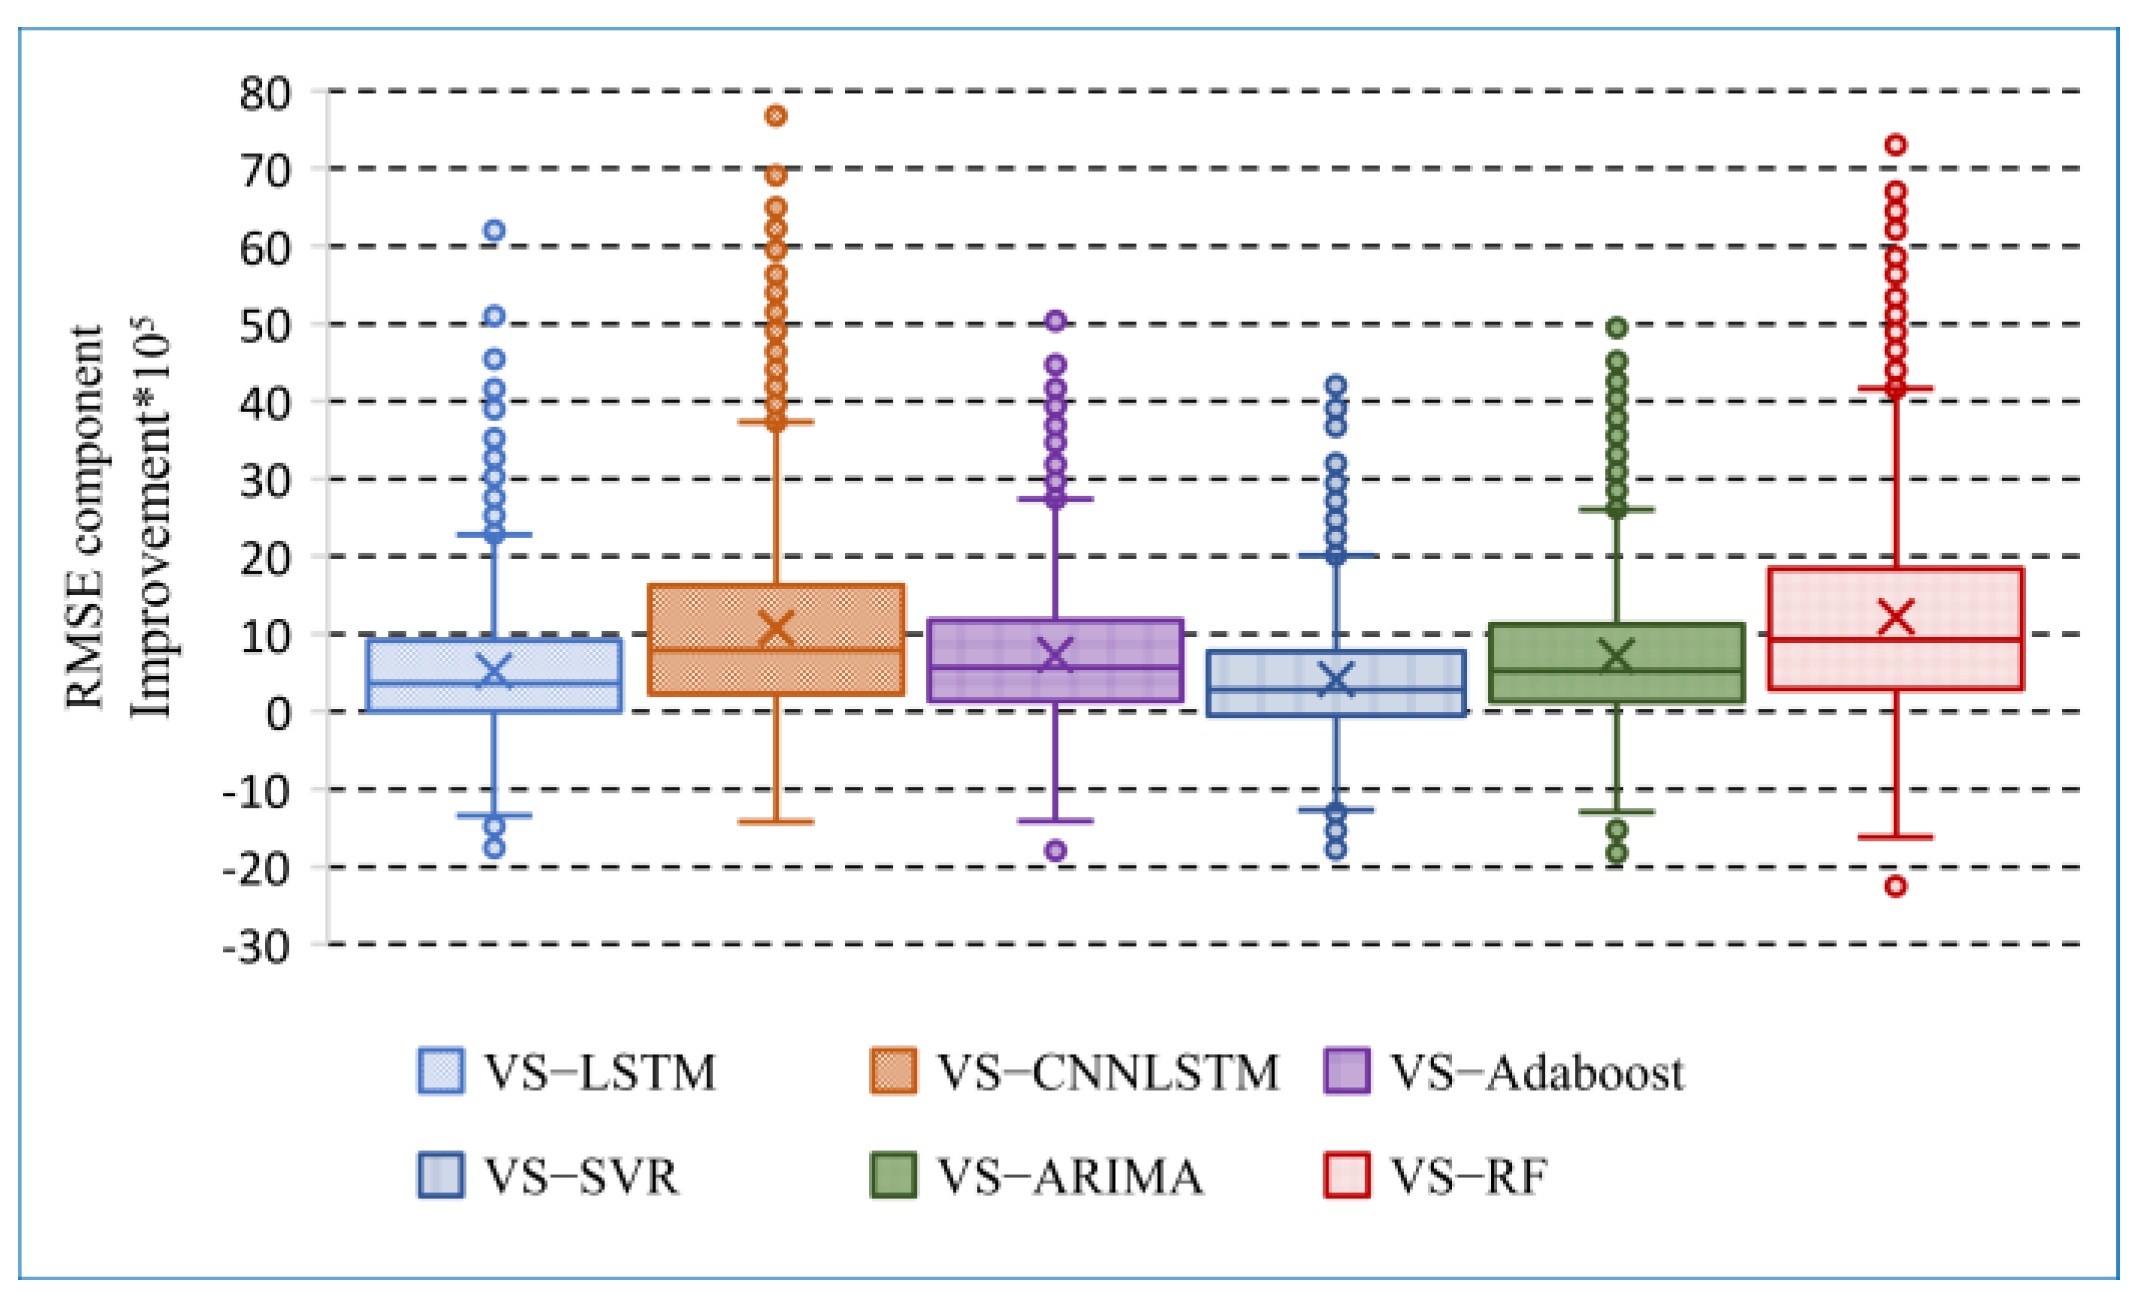
Figure 12.
Plots of forecasted values and actual results (8 August 2018 to 10 August 2018).

Figure 13.
Plots of forecasted values and actual results (24 December 2018 to 26 December 2018).
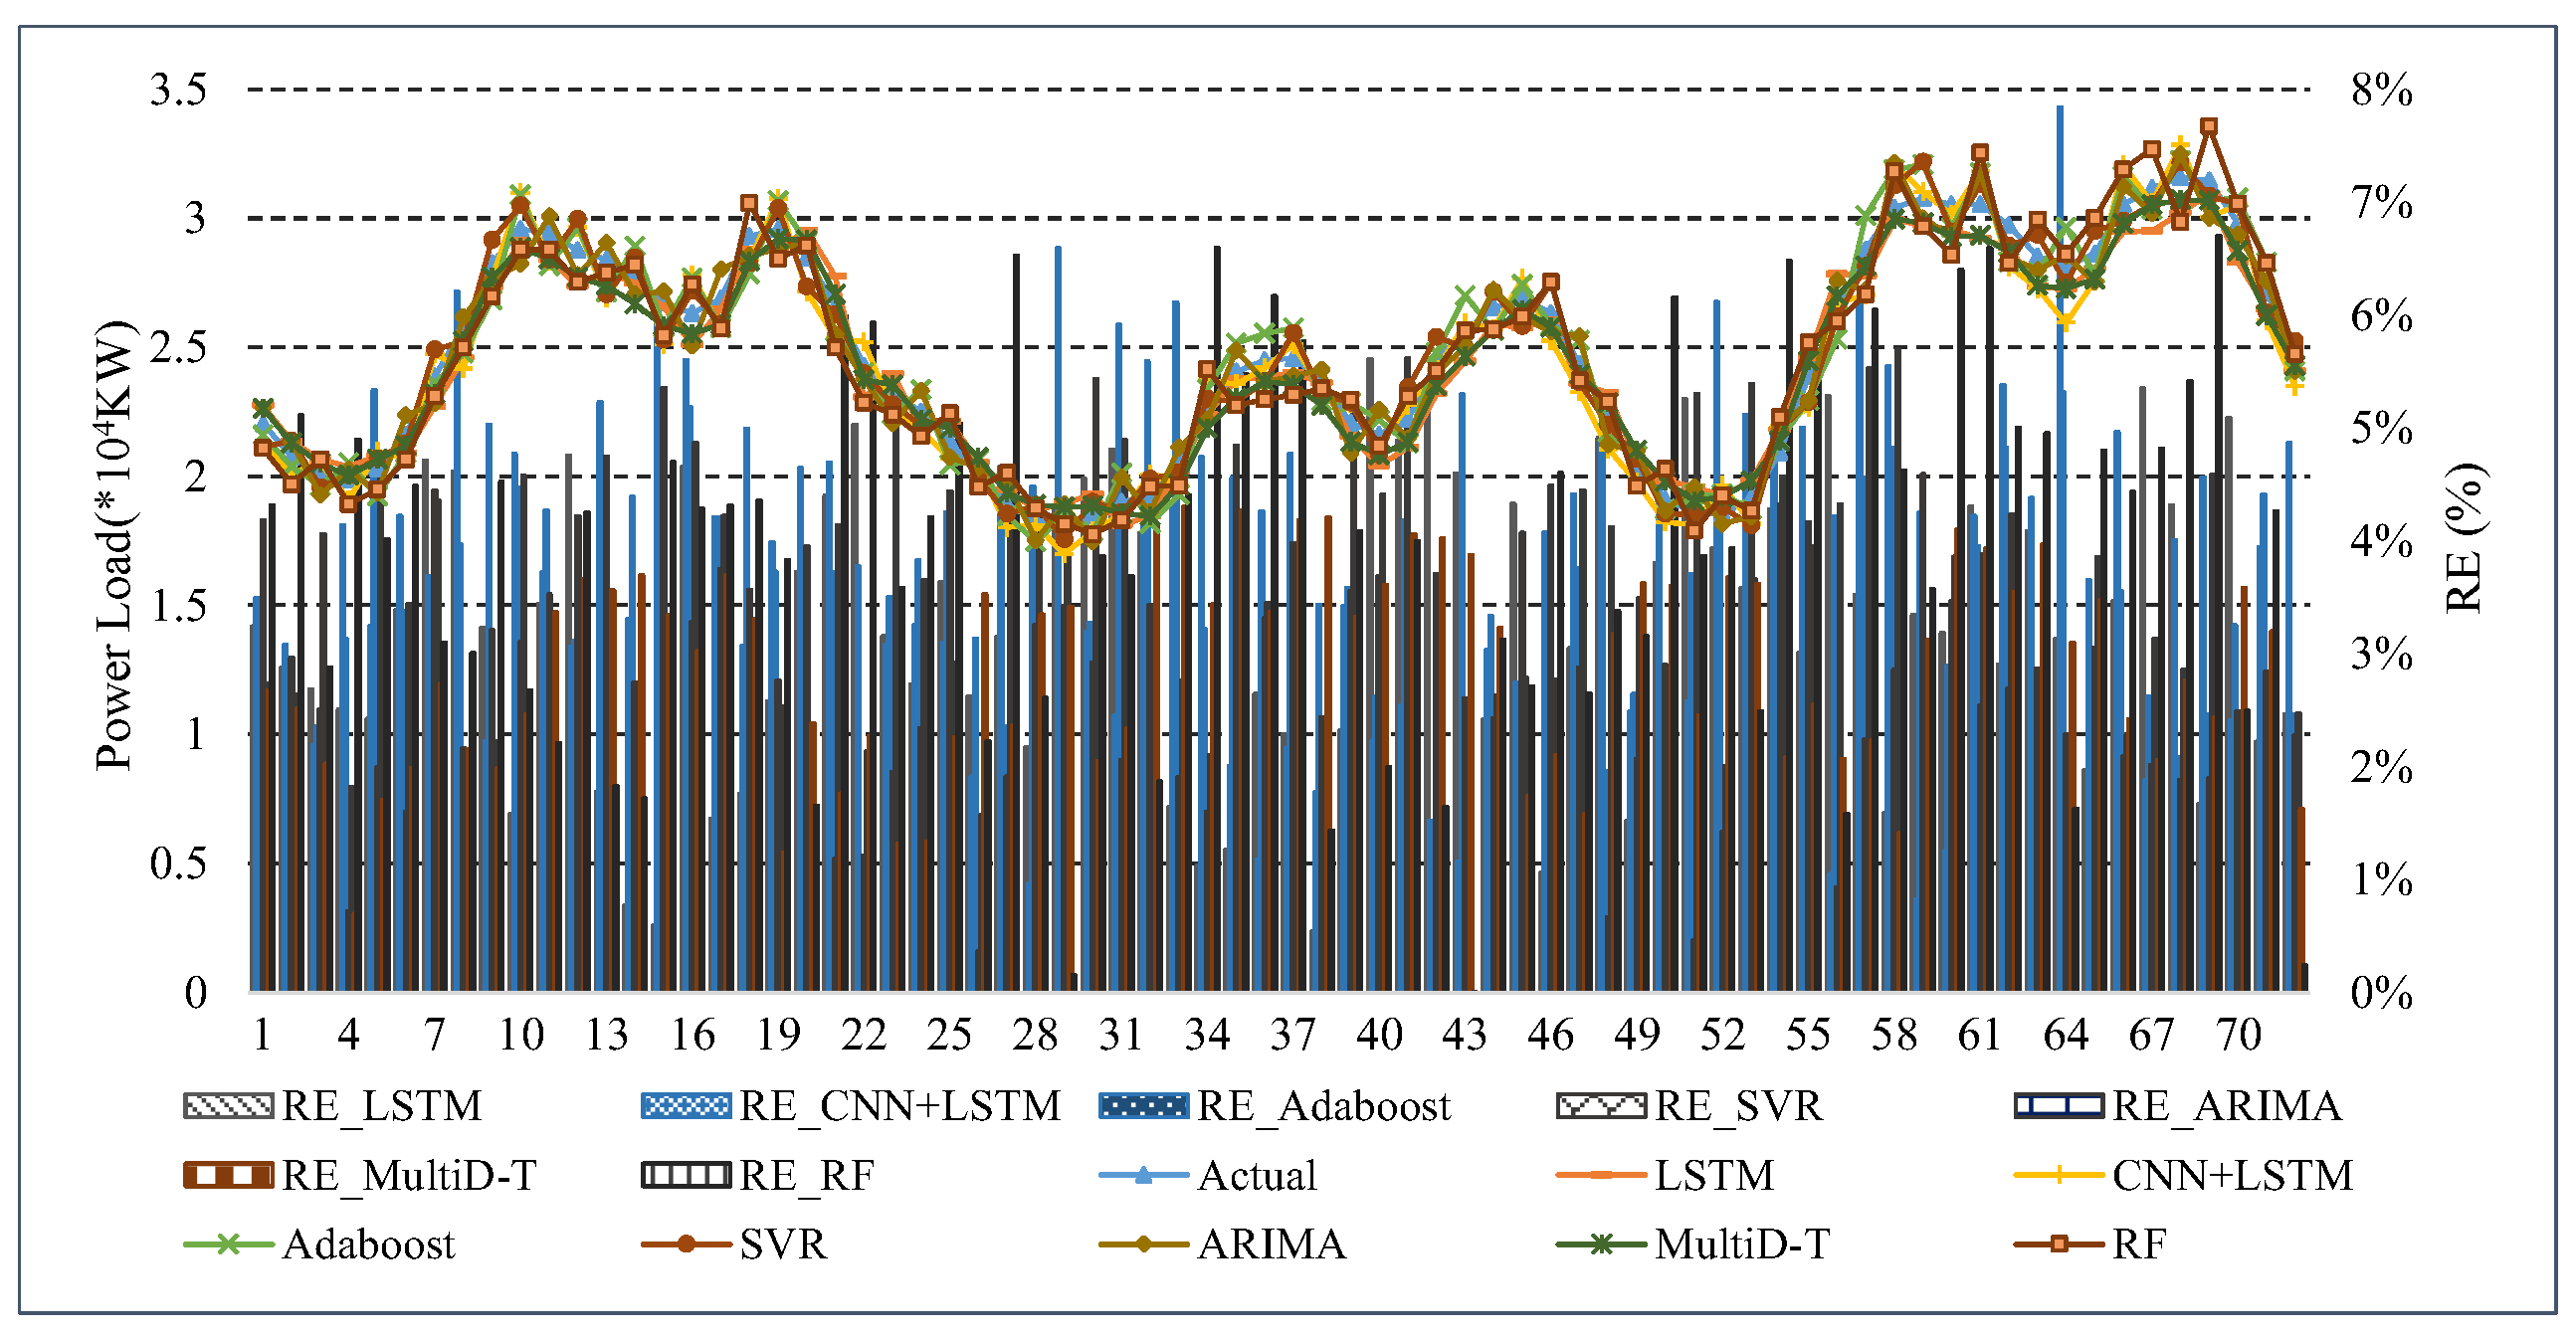
Figure 14.
Plots of the improvement of MultiDBN-T.


Table 1.
Description of the major model parameters.
| Symbol | Description and Meaning |
|---|---|
| MultiDBN-T network parameter set; e is the training parameter epoch | |
| MultiDBN-T output layer network parameters | |
| Network parameters obtained by the i-th layer GG-RBM, | |
| Position encoding information in D-TEncoder | |
| Multi-head self-attention parameters in D-TEncoder, | |
| Parameters in in D-TEncoder, |
Table 2.
Summary of observable variables.
| Term | Description and Number of Observable Variables |
|---|---|
| Time | 2 columns: time and holiday labels |
| Electricity production | 14 columns: various power production capacities |
| Electrical load | 1 column: actual consumption of electric energy per hour |
| Electricity price | 1 column: average price of electricity for a company |
| Weather | 9 columns: data of various weather indicators |
| City label | 5 columns: city names |
Table 3.
Summary of observable variables.
| Module/Parameter | Description and Number of Observable Variables |
|---|---|
| Pre-DBN | GG-RBM1 (63 × 72, 32 × 72), GG-RBM2 (32 × 72, 16 × 72) GG-RBM3 (16 × 72, 8 × 72), Linear (63 × 72) |
| D-TEncoder | Feedforward (256), Multi-Head (8), Output-Dimension (256) Blocks (3), Dropout (0.1) |
| L-Decoder | Linear (1 × 24) |
| Learning rate | 0.01 |
| Batch size | 128 |
Table 4.
Experimental data.
| Algorithm | MAE (KW) | RMSLE | ||
|---|---|---|---|---|
| LSTM | 3.038% | 958.320 | 878.1204 | 0.032806 |
| CNN+LSTM | 3.847% | 1214.095 | 1113.74 | 0.041546 |
| Adaboost | 3.418% | 1064.107 | 987.7954 | 0.036448 |
| SVR | 2.837% | 902.274 | 820.3937 | 0.030889 |
| ARIMA | 3.383% | 1055.116 | 978.5581 | 0.036015 |
| RF | 4.027% | 1271.662 | 1165.123 | 0.043685 |
| MultiDBN-T | 1.952% | 630.720 | 566.3686 | 0.021454 |
Table 5.
The data of MAPE component distribution (%).
| Metrics | LSTM | CNN + LSTM | Adaboost | SVR | ARIMA | RF | MultiDBN-T |
|---|---|---|---|---|---|---|---|
| Max | 5.369% | 8.005% | 6.157% | 5.999% | 6.861% | 7.970% | 4.361% |
| Q1 | 3.899% | 4.894% | 4.346% | 3.701% | 4.249% | 5.177% | 2.524% |
| Median | 3.038% | 3.847% | 3.418% | 2.837% | 3.383% | 4.027% | 1.952% |
| Q2 | 2.918% | 3.825% | 3.401% | 2.745% | 3.275% | 4.038% | 1.898% |
| Q3 | 2.157% | 2.724% | 2.523% | 1.931% | 2.477% | 2.846% | 1.288% |
| Min | 0.067% | 0.172% | 0.065% | 0.047% | 0.192% | 0.0% | 0.138% |
Table 6.
The data of RMSE component distribution (*103).
| Metrics | LSTM | CNN + LSTM | Adaboost | SVR | ARIMA | RF | MultiDBN-T |
|---|---|---|---|---|---|---|---|
| Max | 2562.184 | 4274.847 | 3226.730 | 2387.311 | 3042.323 | 4706.446 | 1212.348 |
| Q1 | 1248.420 | 2052.355 | 1581.224 | 1133.856 | 1501.843 | 2255.543 | 560.560 |
| Median | 918.115 | 1476.606 | 1132.002 | 813.867 | 1112.953 | 1616.663 | 397.694 |
| Q2 | 693.523 | 1154.171 | 931.083 | 602.291 | 884.029 | 1258.970 | 284.569 |
| Q3 | 360.841 | 570.103 | 482.006 | 296.404 | 474.368 | 621.096 | 125.185 |
| Min | 0.247 | 1.214 | 0.525 | 0.240 | 1.055 | 0.000004 | 0.630719 |
Table 7.
The data of the MAPE component improvement (%).
| Metrics | VS-LSTM | VS-CNN + LSTM | VS-Adaboost | VS-SVR | VS-ARIMA | VS-RF |
|---|---|---|---|---|---|---|
| Max | 5.22% | 6.69% | 5.72% | 5.00% | 5.50% | 7.15% |
| Q1 | 2.12% | 3.11% | 2.54% | 1.93% | 2.46% | 3.41% |
| Median | 1.09% | 1.90% | 1.47% | 0.89% | 1.43% | 2.08% |
| Q2 | 1.04% | 1.86% | 1.46% | 0.85% | 1.38% | 2.12% |
| Q3 | 0.03% | 0.63% | 0.41% | −0.16% | 0.39% | 0.79% |
| Min | −3.00% | −2.93% | −2.73% | −3.19% | −2.66% | −2.99% |
Table 8.
The data of the RMSE component (MSE’) improvement (*103).
| Metrics | VS-LSTM | VS-CNN + LSTM | VS-Adaboost | VS-SVR | VS-ARIMA | VS-RF |
|---|---|---|---|---|---|---|
| Max | 2281.035 | 3730.698 | 2739.107 | 2012.757 | 2599.928 | 4161.327 |
| Q1 | 918.079 | 1628.529 | 1178.128 | 778.153 | 1120.156 | 1842.060 |
| Median | 520.569 | 1076.218 | 734.517 | 416.291 | 715.463 | 1219.317 |
| Q2 | 362.080 | 788.596 | 567.339 | 279.695 | 524.671 | 923.383 |
| Q3 | 6.568 | 226.248 | 136.731 | −47.682 | 126.794 | 290.765 |
| Min | −1338.101 | −1422.029 | −1412.882 | −1265.45 | −1297.318 | −1618.46 |
Table 9.
The average relative errors of the two periods (%).
| Period | LSTM | CNN + LSTM | Adaboost | SVR | ARIMA | RF | MultiDBN-T |
|---|---|---|---|---|---|---|---|
| 2018-08-08 to 2018-08-10 | 3.026% | 3.897% | 3.430% | 2.907% | 3.472% | 3.803% | 1.993% |
| 2018-12-24 to 2018-12-26 | 3.231% | 3.696% | 3.517% | 2.900% | 3.293% | 3.903% | 2.882% |
Table 10.
The improvement of MultiDBN-T (%).
| Algorithm | MAE Imp | RMSLE Imp | ||
|---|---|---|---|---|
| LSTM | 35.76% | 34.18% | 35.50% | 34.60% |
| CNN+LSTM | 49.27% | 48.05% | 49.15% | 48.36% |
| Adaboost | 42.91% | 40.73% | 42.66% | 41.14% |
| SVR | 31.21% | 30.10% | 30.96% | 30.55% |
| ARIMA | 42.30% | 40.22% | 42.12% | 40.43% |
| RF | 51.54% | 50.40% | 51.39% | 50.89% |
| Average Improvement | 42.16% | 40.61% | 41.96% | 40.99% |
Publisher’s Note: MDPI stays neutral with regard to jurisdictional claims in published maps and institutional affiliations. |
© 2022 by the authors. Licensee MDPI, Basel, Switzerland. This article is an open access article distributed under the terms and conditions of the Creative Commons Attribution (CC BY) license (https://creativecommons.org/licenses/by/4.0/).
Share and Cite
MDPI and ACS Style
Bai, W.; Zhu, J.; Zhao, J.; Cai, W.; Li, K. An Unsupervised Multi-Dimensional Representation Learning Model for Short-Term Electrical Load Forecasting. Symmetry 2022, 14, 1999. https://doi.org/10.3390/sym14101999
AMA Style
Bai W, Zhu J, Zhao J, Cai W, Li K. An Unsupervised Multi-Dimensional Representation Learning Model for Short-Term Electrical Load Forecasting. Symmetry. 2022; 14(10):1999. https://doi.org/10.3390/sym14101999
Chicago/Turabian StyleBai, Weihua, Jiaxian Zhu, Jialing Zhao, Wenwei Cai, and Keqin Li. 2022. "An Unsupervised Multi-Dimensional Representation Learning Model for Short-Term Electrical Load Forecasting" Symmetry 14, no. 10: 1999. https://doi.org/10.3390/sym14101999
Note that from the first issue of 2016, this journal uses article numbers instead of page numbers. See further details here.