Fast Searching Density Peak Clustering Algorithm Based on Shared Nearest Neighbor and Adaptive Clustering Center


Key Laboratory of Advanced Control and Optimization for Chemical Processes, Ministry of Education, East China University of Science and Technology, Shanghai 200237, China
*
Author to whom correspondence should be addressed.
Symmetry 2020, 12(12), 2014; https://doi.org/10.3390/sym12122014
Submission received: 16 November 2020
/
Revised: 30 November 2020
/
Accepted: 3 December 2020
/
Published: 6 December 2020
Abstract
:The clustering analysis algorithm is used to reveal the internal relationships among the data without prior knowledge and to further gather some data with common attributes into a group. In order to solve the problem that the existing algorithms always need prior knowledge, we proposed a fast searching density peak clustering algorithm based on the shared nearest neighbor and adaptive clustering center (DPC-SNNACC) algorithm. It can automatically ascertain the number of knee points in the decision graph according to the characteristics of different datasets, and further determine the number of clustering centers without human intervention. First, an improved calculation method of local density based on the symmetric distance matrix was proposed. Then, the position of knee point was obtained by calculating the change in the difference between decision values. Finally, the experimental and comparative evaluation of several datasets from diverse domains established the viability of the DPC-SNNACC algorithm.
1. Introduction
Clustering is a process of “clustering by nature”. As an important research content in data mining and artificial intelligence, clustering is an unsupervised pattern recognition method without the guidance of prior information [1]. It aims at finding potential similarities and grouping, so that the distance between two points in the same cluster is as small as possible and the distance between data points in different clusters is opposite. A large number of studies have been devoted to solving clustering problems. Generally speaking, clustering algorithms can be divided into multiple categories such as partition-based, model-based, hierarchical-based, grid-based, density-based, and their combinations. Various clustering algorithms have been successfully applied in many fields [2].
With the emergence of big data, there is an increasing demand for clustering algorithms that can automatically understand and summarize data. Traditional clustering algorithms cannot handle the data with hundreds of dimensions, which leads to low efficiency and poor results. It is urgent to develop the existing clustering algorithms or propose a new clustering algorithm to improve the stability of the algorithm and ensure the accuracy of clustering [3].
In June 2014, Rodriguez et al. published clustering by fast search and find of density peaks (referred to as CFSFDP) in Science [4]. This is a new clustering algorithm on the basis of density and distance. The performance of the CFSFDP algorithm is superior to other traditional clustering algorithms in many aspects. First, the CFSFDP algorithm is efficient and straightforward, which can significantly reduce the calculation time without the iteration of the objective function. Second, it is convenient to find cluster centers intuitively with the help of a decision graph in the CFSFDP algorithm. Third, the CFSFDP algorithm can be used to recognize the groups regardless of their shape and spatial dimensions. Therefore, shortly after the algorithm was proposed, it has been broadly used in computer vision [5], image recognition [6], and other fields.
Although the distinct advantages of the CFSFDP algorithm are over other clustering algorithms, the CFSFDP algorithm also has some disadvantages, which are as follows:
- The measurement method for calculating local density and distance still needs to be improved. It does not consider the processing of complex datasets, which makes it difficult to achieve the expected clustering results when dealing with datasets with various densities, multi-scales, or other complex characteristics.
- The allocation strategy of the remaining points after finding the cluster centers may lead to a “domino effect”, whereby once one point is assigned wrongly, there may be many more points subsequently mis-assigned.
As the cut-off distance corresponding to different datasets may be different, it is usually challenging to determine . Additionally, the clustering results are susceptible to .
In 2018, Rui Liu et al. proposed a shared-nearest-neighbor-based clustering by fast search and find of density peaks (SNN-DPC) algorithm to solve some fundamental problems of the CFSFDP algorithm [7]. The SNN-DPC algorithm is illustrated by the following innovations.
- A novel metric to indicate local density is put forward. It makes full use of neighbor information to show the characteristics of data points. This standard not only works for simple datasets, but also applies to complex datasets with multiple scales, cross twining, different densities, or high dimensions.
- By improving the distance calculation approach, an adaptive measurement method of distance from the nearest point with large density is proposed. The new approach considers both distance factors and neighborhood information. Thus, it can compensate for the points in the low-density cluster, which means that the possibilities of selecting the correct center point are raised.
- For the non-center points, a two-step point allocation is carried out on the SNN-DPC algorithm. The unassigned points are divided into “determined subordinate points” and “uncertain subordinate points”. In the process of calculation, the points are filtered continuously, which improves the possibility of correctly allocating non-center points and avoids the “domino effect”.
Although the SNN-DPC algorithm can be used to make up some deficiencies of the CFSFDP algorithm, it still has some unsolved problems. Most obviously, the number of clusters in the dataset needs to be manually input. However, if we have no idea about the number of clusters, we can select cluster centers through the decision graph. It is worth noting that both methods require some prior knowledge. Therefore, the clustering results are less reliable because of the high effect of human orientation. In order to solve the problem of adaptively determining the cluster center, a fast searching density peak clustering algorithm based on shared nearest neighbor and adaptive clustering center algorithm, called DPC-SNNACC, was proposed in this paper. The main innovations of the algorithm are as follows:
- The original local density measurement method is updated, and a new density measurement approach is proposed. This approach can enlarge the gap between decision values to prepare for automatically determining the cluster center. The improvement can not only be applied to simple datasets, but also to complex datasets with multi-scale and cross winding.
- A novel and fast method is proposed that can select the number of clustering centers automatically according to the decision values. The “knee point” of decision values can be adjusted according to information of the dataset, then the clustering centers are determined. This method can find the cluster centers of all clusters quickly and accurately.
The rest of this paper is organized as follows. In Section 2, we introduce some research achievements related to the CFSFDP algorithm. In Section 3, we present the basic definitions and processes of the CFSFDP algorithm and the SNN-DPC algorithm. In Section 4, we propose the improvements of SNN-DPC algorithm and introduce the processes of the DPC-SNNACC algorithm. Simultaneously, the complexity of the algorithm is analyzed according to processes. In Section 5, we first introduce some datasets used in this paper, and then discuss some arguments about the parameters used in the DPC-SNNACC algorithm. Further experiments are conducted in Section 6. In this part, the DPC-SNNACC algorithm is compared with other classical clustering algorithms. Finally, the advantages and disadvantages of the DPC-SNNACC algorithm are summarized, and we also point out some future research directions.
2. Related Works
In this section, we briefly review several kinds of widely used clustering methods and elaborate on the improvement of the CFSFDP algorithm.
K-means is one of the most widely used partition-based clustering algorithms because it is easy to implement, is efficient, and has been successfully applied to many practical case studies. The core idea of K-means is to update the cluster center represented by the centroid of the data point through iterative calculation, and the iterative process will continue until the convergence criterion is met [8]. Although K-means is simple and has a high computing efficiency in general, there still exist some drawbacks. For example, the clustering result is sensitive to K; moreover, it is not suitable for finding clusters with a nonconvex shape. PAM [9] (Partitioning Around Medoids), CLARA [10] (Clustering Large Applications), CLARANS [11] (Clustering Large Applications based upon RANdomized Search), and AP [12] (Affinity Propagation) are also typical partition-based clustering algorithms. However, they also fail to find non-convex shape clusters.
The hierarchical-based clustering method merges the nearest pair of clusters from bottom to top. Typical algorithms include BIRCH [13] (Balanced Iterative Reducing and Clustering using Hierarchies) and ROCK [14] (Bayesian Optimization with Cylindrical Kernels).
The grid-based clustering method divides the original data space into a grid structure with a certain size for clustering. STING [15] (A Statistical Information Grid Approach to Spatial Data Mining) and CLIQUE [16] (clustering in QUEst) are typical algorithms of this type, and their complexity relative to the data size is very low. However, it is difficult to scale these methods to higher-dimensional spaces.
The density-based clustering method assumes that an area with a high density of points in the data space is regarded as a cluster. DBSCAN [17] (Density-Based Spatial Clustering of Applications with Noise) is the most famous density-based clustering algorithm. It uses two parameters to determine whether the neighborhood of points is dense: the radius of the neighborhood and the minimum number of points in the neighborhood.
Based on the CFSFDP algorithm, many algorithms have been put forward to make some improvements. Research on the CFSFDP algorithm mainly involves the following three aspects:
1. The density measurements of the CFSFDP algorithm.
Xu proposed a method to adaptively choose cut-off distance [18]. Using the characteristics of Improved Sheather–Jones (ISJ), the method can be used to accurately estimate .
The Delta-Density based clustering with a Divide-and-Conquer strategy clustering algorithm (3DC) has also been proposed [19]. It is based on the Divide-and-Conquer strategy and the density-reachable concept in Density-Based Spatial Clustering of Applications with Noise (referred to as DBSCAN).
Xie proposed a density peak searching and point assigning algorithm based on the fuzzy weighted K-nearest neighbor (FKNN-DPC) technique to solve the problem of the non-uniformity of point density measurements in the CFSFDP algorithm [20]. This approach uses K-nearest neighbor information to define the local density of points and to search and discover cluster centers.
Du proposed density peak clustering based on K-nearest neighbors (DPC-KNN), which introduces the concept of K-nearest neighbors (KNN) to CFSFDP and provides another option for computing the local density [21].
Qi introduced a new metric for density that eliminates the effect of on clustering results [22]. This method uses a cluster diffusion algorithm to distribute remaining points.
Liu suggested calculating two kinds of densities, one based on k nearest neighbors and one based on local spatial position deviation, to handle datasets with mixed density clusters [23].
2. Automatically determine the group numbers.
Bie proposed the Fuzzy-CFSFDP algorithm [24]. This algorithm uses fuzzy rules to select centers for different density peaks, and then the number of final clustering centers is determined by judging whether there are similar internal patterns between density peaks and merging density peaks.
Li put forward the concept of potential cluster center based on the CFSFDP algorithm [25], and considered that if the shortest distance between potential cluster center and known cluster center is less than the cut-off distance , then the potential cluster center is redundant. Otherwise, it will be considered as the center of another group.
Lin proposed an algorithm [26] that used the radius of neighborhood to automatically select a group of possible density peaks, then used potential density peaks as density peaks, and used CFSFDP to generate preliminary clustering results. Finally, single link clustering was used to reduce the number of clusters. The algorithm can avoid the clustering allocation problem in CFSFDP.
3. Application of the CFSFDP algorithm.
Zhong and Huang applied the improved density and distance-based clustering method to the actual evaluation process to evaluate the performance of enterprise asset management (EAM) [27]. This method greatly reduces the resource investment in manual data analysis and performance sorting.
3. Clustering by Fast Search and Find of Density Peaks (CFSFDP) Algorithm and Shared-Nearest-Neighbor-Based Clustering by Fast Search and Find of Density Peaks (SNN-DPC) Algorithm
3.1. Clustering by Fast Search and Find of Density Peaks (CFSFDP) Algorithm
It is not necessary to consider the probability distribution or multi-dimensional density in the CFSFDP algorithm as the performance is not affected by the space dimension, which is why it can handle high-dimensional data. Furthermore, it requires neither an iterative process nor more parameters. This approach is robust concerning the choice of as the only parameter.
This algorithm is based on a critical assumption that the points with a higher local density and a relatively large distance than the others are more likely to be the cluster centers. Therefore, for each data point , only two variables need to be focused, that is, its local density and distance .
The local density of data point is defined as Equation (1).
where is the Euclidean distance between point and ; is the cut-off distance; and represents the neighborhood radius of a point, while it is a hyper-parameter that needs to be specified by users.
Equation (1) means that the local density is equal to the number of data points with a distance less than the cut-off distance.
is computed by the minimum distance between point and another point with a higher density than , defined as Equation (2).
It should be noted that for the point with the highest density, its is conventionally obtained by Equation (3).
Then, the points with high and high are simultaneously decided as cluster centers, and the CFSFDP algorithm uses the decision value for each data point to express the possibility of becoming the center of the cluster. The calculation method is shown by Equation (4).
From Equation (4), the higher and are, the larger the decision value is. In other words, point with higher and is more likely to be chosen as a cluster center. The algorithm introduces a representation called a decision graph to help users to select centers. The decision graph is the plot of as a function of for each point.
There is no need to specify the number of clusters in advance as the algorithm can find the density peaks and identify them as cluster centers, but it needs users to select the number of clusters by identifying outliers in the decision graph.
After finding the centers, we can assign the groups of remaining points according to the cluster where the nearest neighbor peak belongs. The information used is obtained by calculating .
3.2. Shared-Nearest-Neighbor-Based Clustering by Fast Search and Find of Density Peaks (SNN-DPC) Algorithm
The SNN-DPC algorithm introduces an indirect distance and density measurement method, taking the influence of neighbors of each point into consideration, and using the concept of shared neighbors to describe the local density of points and the distance between them.
Generally speaking, the larger the sum of neighbors shared by the two points, the higher the similarity of the two points.
For each point and in dataset , the intersection of the K-nearest neighbor set of the -th point and the K-nearest neighbor set of the point is defined as the number of shared nearest neighbors, referred to as . Equation (5) expresses the definition of .
where represents the set of K-nearest neighbors of point and represents the set of K-nearest neighbors of point .
For each point and in dataset , the SNN similarity can be defined as Equation (6)
In other words, SNN similarity is calculated only if point and point exist in each other’s K-neighbor set. Otherwise, the SNN similarity is zero.
Then, the local density is calculated by Equation (7)
where is the set of points with the highest similarities. The local density is the result of adding the similarity of points with the highest similarity to point .
From the definition of local density, it can be seen that the calculation of local density not only uses the distance information, but also obtains the information about the clustering structure by SNN similarity, which fully reveals the internal relevance between points.
Regarding , the distance from the nearest larger density point is introduced in the SNN-DPC algorithm and uses the proximity distance to add a compensation mechanism, so the value of the point in the low-density cluster may also be high. The definition of distance is shown in Equation (8)
The value of the highest density point is the largest among all the remaining points in the dataset , which can be given by Equation (9)
The distance from the nearest larger density point not only considers the distance factor, but also considers the neighbor information of each point, thereby compensating the points in the low-density cluster and improving the feasibilities of the . That is to say, this method can be adapted to different density datasets.
The definition of the decision value is the same as the CFSFDP algorithm. The formula is displayed in Equation (10)
According to the decision graph, the cluster center-point can also be determined.
In the SNN-DPC algorithm, the unallocated points are divided into two categories: inevitable subordinate point and possible subordinate point.
Points and are two different points in dataset . Only when at least half of the k neighborhoods of and are shared can they become the same cluster points. The condition is expressed by Equation (11).
If an unassigned point does not meet the criteria for the inevitable subordinate point, it is defined as a possible subordinate point. The condition is reflected by Equation (12).
According to Equation (11), inevitable subordinate points can be allocated first. For the points that do not meet the equation conditions, the neighborhood information is used to further determine the belonging cluster. During the whole process of the algorithm, the information will be updated continuously to achieve better results.
3.3. Analysis of the SNN-DPC Algorithm
Compared with the CFSFDP algorithm, the SNN-DPC algorithm has a significant improvement. Considering the information of the shared neighbors, the SNN-DPC algorithm is applicable to datasets with different conditions. For the non-center points, a two-step allocation method is adopted. With this approach, the algorithm can cluster variable density and non-convex datasets. However, the method of determining cluster center points without prior knowledge has not been explored in the SNN-DPC algorithm, in other words, manual intervention is still needed. Moreover, this approach is more effective for datasets with one unique density peak or with a small number of clusters because in such cases, it is easier to judge the data points with relatively large and from the decision graph. However, for the following cases, the decision graph showed obvious limitations:
- For the datasets with unknown cluster numbers, choosing the cluster number is greatly affected by human subjectivity.
- In addition to the apparent density peak points in the decision graph, some data points with relatively large and small , or relatively small and large may be cluster centers. These points are easy to be ignored artificially, so fewer cluster centers can be selected. Finally, some data points of different clusters will be mistakenly merged into the same group.
- If there are multiple density peaks in the same group, these points can be wrongly selected as redundant cluster centers, resulting in the same cluster being improperly divided into sub-clusters.
- When dealing with datasets with many clustering centers, it is also easier to choose the wrong clustering centers.
The SNN-DPC algorithm is more sensitive to the selection of clustering centers and it is likely to select fewer or more clustering centers artificially. This kind of defect is more prominent when dealing with some particular datasets.
4. Fast Searching Density Peak Clustering Algorithm Based on Shared Nearest Neighbor and Adaptive Clustering Center (DPC-SNNACC) Algorithm
Through the analysis in Section 3.3, it can be seen that the SNN-DPC algorithm needs to know the number of clusters in advance. A method that can adaptively find the number of clusters on the basis of the SNN-DPC algorithm was proposed to solve this problem. The improvements in the DPC-SNNACC algorithm are mainly reflected in two aspects. On one hand, an improved calculation method of local density is proposed. On the other hand, the position of the knee point is obtained by calculating the change of the difference between decision values. Then, we can get the center-points and a suitable number of clusters. In this part, we will elaborate on the improvements.
4.1. Local Density Calculation Method
The local density of the SNN-DPC algorithm is defined under the similarity and the number of shared neighbors between two points. For some datasets with unbalanced sample numbers and different densities between certain clusters, when choosing the cluster centers by the decision graph, the distinction between center and non-center points is vague. In order to better identify the clustering centers than previously, we used the squared value of the original local density. The enhanced local density is defined as Equation (13).
where is the set of points with the highest similarities, and stands for SNN similarity, which is calculated based on a symmetric distance matrix.
Through experimental analysis, we can draw a conclusion that changing the density has a greater impact than on the value. Thus, in order to limit the complexity of the algorithm, we only dealt with the and kept the unchanged. In addition, the values will follow the change of according to Equation (10). If the difference in between the points increases, so does the difference in . We used to represent the results of ranking in ascending order, subsequently, we could plot a novel decision graph by using the number of points as the x-axis and as the y-axis. The subsequent analysis of the decision values will be based on the new decision graph. The specific analysis of is illustrated in Section 5.
4.2. Adaptive Selection of Cluster Centers
Through observation, it can be easily inferred that the . values of the cluster center points are relatively large, and they are far away from the decision values of the non-central points. Moreover, the values of non-center points are usually small and remain basically the same. According to this characteristic, we proposed a method to find the knee point, which is described as Equations (14)–(17).
The search range of clustering centers can be locked on several points with larger values. On one hand, reducing the search range of the decision value of the cluster center means reducing the time of calculation as we do not need to search for complete data. On the other hand, deleting elements that have little impact on the results also has a positive impact on the accuracy of the clustering results. The square root is a quick and straightforward method to reduce the size of value in mathematical calculations. If the number of data points in dataset is defined as , is an integer closest to the result after rooting to , then we lock the processing range of the points on .
Specifically,
where is the rounding symbol, whose value is the integer closest to the value in middle brackets and is the difference value between adjacent value. The is to find a point with maximum sort value, which satisfies that the change in the difference between its corresponding values difference is beyond a certain threshold value. We used the average value of the difference among the values to represent the threshold . The specific reasons for the selection of the number of are explained in Section 5.4.
After obtaining the position of knee point , the number of clusters is the number of (from to ). The corresponding point of the value is the cluster center of each cluster.
We took the Aggregation dataset (the details of Aggregation dataset are described in Section 5.1) as an example. It includes 788 data points (n = 788) in total, so DN = . The subsequent calculation only needs to focus on the maximum of 28 values. First, calculate 27 difference values from the biggest 28 values according to Equation (17), then calculate the average value from the 26 increments of by Equation (16). Next, the maximum of , whose increment is greater than according to Equation (14), is found to determine . For this dataset, , so the number of centers selected was 782; subsequently, the cluster centers were seven points corresponding to to .
As shown in Figure 1, the red horizontal line in the figure distinguishes the selected group center points from the non-center points. The color points above the red line are the clustering center points chosen by the algorithm, and the blue points below the red line are the non-center points.
4.3. Processes
The whole process of the DPC-SNNACC algorithm still includes three major steps: the calculation of and , the selection of cluster centers, and the distribution of non-center points.
Suppose dataset and number of neighbors are given. Clustering aims to divide the dataset into classes. is the number of clusters. The set of cluster centers is . The result of clustering is . In the following steps, is the Euclidean distance matrix, local density is , distance from the nearest larger density point is , the decision value is , and the ascending sorted decision value is , represents the initial clustering number where are the noncentral points that are unassigned, M is an ergodic matrix whose rows correspond to unallocated points, and columns correspond to clusters. Various symbols used in the paper are explained in the attached Table A1.
- Step 1:
- Initialize dataset , and standardize all data points so that their values are in the range of [0, 1]. Then, calculate distance matrix .
- Step 2:
- Calculate the similarity matrix of SNN according to Equation (5).
- Step 3:
- According to Equation (13), calculate local density .
- Step 4:
- Calculate the distance from the nearest larger density point according to Equations (8) and (9).
- Step 5:
- Calculate the decision value according to Equation (10), and arrange it in ascending order to get the sorted .
- Step 6:
- According to the knee point condition defined in Equation (14), determine the number of clusters (), and then the set of cluster centers is determined.
- Step 7:
- Initialize queue , push all center points into .
- Step 8:
- Take the header of as , find the number of neighbors of , and the set of it is .
- Step 9:
- Take the unallocated point If meets the conditions defined as Equation (11), then classify the data point into the cluster where is located, and add to the end of the queue . Otherwise, continue to choose the next point in and determine the distribution. After all the sample points in are judged, return to step 8 to proceed to the next determined subordinate point in queue .
- Step 10:
- When , the initial clustering result is .
- Step 11:
- Find all unallocated points , and re-number them. Then, define an ergodic matrix for distribution of possible subordinate points, the row in indicates the order number of unassigned points, and the column represents the cluster.
- Step 12:
- Find the maximum value in each row of , and use the cluster where the is located to represent the cluster of unallocated points in this row. Update matrix until all points are assigned.
- Step 13:
- Output the final clustering results .
We used a simple dataset as an example. This simple dataset contained 16 data points, , which can be divided into two categories according to their relative positions. Suppose the number of neighbors is 5. As shown in Figure 2, there are two clusters in , the red points from numbers 1 to 8 belong to one cluster, the blue points from numbers 9 to 16 is another cluster. Clustering aims to divide the dataset into two classes.
According to steps 1 to 6 above, we can calculate the and of every point in dataset . Then, the of each point can be calculated and arranged in ascending order to get , and the distribution of is shown in Figure 3. Through step 7, we can easily obtain the number of clusters. Furthermore, the cluster center set is , corresponding to the two clusters as points and , respectively.
To determine inevitable subordinate points, we pushed all points of into , . First, we can take as , and simultaneously pop out of queue , so the queue becomes . Then, we can find the five neighbors of as . Point meets the conditions defined as Equation (11), so add to the cluster of , push point into . Next, check the points in in order, and repeat the same steps until is empty. The initial clustering result is .
The unallocated points are . The five neighbors of are and the neighbors of are . We can define the ergodic matrix as shown in Table 1. In matrix , the rows represent unallocated points , and the columns stand for Cluster 1 centered on and Cluster 2 centered on .
Table 1 shows that most of the neighbors of point belong to cluster 1, so belongs to cluster 1 with as the cluster center. Similarly, point belongs to cluster 2 with as the cluster center. Finally, all points in dataset can be solved, and we can get clustering results.
4.4. Analysis of Complexity
In this section, we analyze the time complexity of the algorithm according to the algorithm steps in Section 4.3. The time complexity corresponding to each step is analyzed as follows.
- Step 1:
- Normalize points into the range of , so the time complexity is about . Calculate the distance between each of the two points, and the time complexity is .
- Step 2:
- Calculate the number of nearest neighbors between each two points, and the time complexity is . Calculate the intersection within using a hash table. Generally speaking, the time complexity of step 3 is .
- Step 3:
- Calculate the initial local density according to the number of shared nearest neighbors , and square it, so the time complexity of step 4 is .
- Step 4:
- Calculate the distance from the nearest larger density point, so the time complexity is .
- Step 5:
- Calculate the decision values for each point in ascending order, so the complexity is .
- Step 6:
- Calculate the change in the difference between two different points in the total points, so the time complexity is about .
- Steps 7–10:
- The total complexity is .
The total time complexity of Steps 8–11 is the basic loop times the highest complexity in this loop, which is . As the number of nearest neighbors can be obtained by step 3, the time complexity is recorded as . Therefore, the total time complexity is .
- Steps 11–13:
- The total complexity is
The total time complexity of Steps 11–13 is the basic loop times the highest complexity in the loop, which is or ; therefore, the total time complexity is or , so we can combine them into .
In summary, the time complexity of the entire DPC-SNNACC algorithm is .
5. Discussion
Before the experiment, some parameters should be discussed. The purpose was to find the best value of each parameter related to the DPC-SNNACC algorithm. First, some datasets and metrics are introduced. Second, we discuss the performance of the DPC-SNNACC algorithm from several aspects including k, and . The optimal parameter values corresponding to the optimal metrics were found through comparative experiments.
5.1. Introduction to Datasets and Metrics
The performance of the clustering algorithm is usually verified with some datasets. In this paper, we applied 14 commonly used datasets [28,29,30,31,32,33,34,35,36] containing eight synthetic datasets in Table 2 and four UCI(University of California, Irvine) real-datasets in Table 3. The tables list the basic information including the number of data records, the number of clusters, and the data dimensions. The datasets in Table 2 are two-dimensional for the convenience of graphic display. Compared with synthetic datasets, the dimensions of the real datasets in Table 3 are usually bigger than 2.
The evaluation metrics of the clustering algorithm usually include internal and external metrics. Generally speaking, internal metrics are suitable for the situation of unknown data labels, while external metrics have a good reflection on the data with known data labels. As the datasets used in this experiment had already been labeled, several external evaluation metrics were used to judge the accuracy of clustering results including normalized mutual information (NMI) [37], adjusted mutual information (AMI) [38], adjusted Rand index (ARI) [38], F-measure [39], accuracy [40], and Fowlers-Mallows index (FMI) [41]. The maximum values of these metrics are 1, and the larger the values of the metrics, the higher the accuracy.
5.2. The Influence of on the Metrics
The only parameter that needs to be determined in the DPC-SNNACC algorithm is the number of nearest neighbors . In order to analyze the impact of on the algorithm, the Aggregation dataset was used as shown in Figure 4.
To select the optimal number of neighbors, we increased the number of neighbors from five to 100. For the lower boundary, if the number of neighbors is low and the density is sparse, it means that there is no similarity. Furthermore, errors may be caused by small for some datasets. Thus, the lower limit was determined to be 5. For the upper limit, if the value of is much too high, on one hand, the algorithm will be complex and run for a long time, on the other hand, a high value will affect the results of the algorithm. The analysis on shows that the exorbitant has no impact on the results of the algorithm, so it is of little significance for further tests. We set 100 as the upper limit.
When ranges from five to 100, the corresponding metrics oscillate obviously, and the trend of the selected metrics of “AMI”, “ARI”, and “FMI” are more or less the same. Therefore, we can replace multiple metric changes with one metric change. For example, when the AMI metric reaches the optimal value, other external metrics will float the optimal value nearby, and the corresponding is the best number of neighbors. Additionally, it can be seen from the change in metrics that the value of each metric tends to be stable with the increase in . However, an exorbitant value will lead to the decrease of metrics. Therefore, if a certain value is defined in advance without experiment, the optimal clustering result cannot be obtained; furthermore, the significance of the similarity measurement is lost. In the case of the Aggregation dataset, when = 35, each metric value was higher, so 35 could be selected as the best neighbor number of the Aggregation dataset.
5.3. The Comparison of Values between SNN-DPC and DPC-SNNACC
As we change the calculation method of local density, the difference between contiguous will increase. Two different datasets were used to illustrate the comparison between two algorithms in Figure 5 and Figure 6. The used were the best parameters in the respective algorithms.
After comparing and analyzing the above figures, whether using the SNN-DPC algorithm or the DPC-SNNACC algorithm, the correct selection of the number of cluster centers could be achieved on the Jain dataset and Spiral dataset, and the distinction was the differences between . In other words, the improved method showed a bigger difference between the cluster center and non-center points, thus indicating that we can use the DPC-SNNACC algorithm to identify the cluster centers and reduce unnecessary errors.
5.4. The Influence of Different on Metrics
As above-mentioned, represents the search range of clustering centers and is an integer closest to the result of treatment. In order to reduce the search range of the decision values of the cluster centers, we used closest to as the search scale of clustering centers. In this part, the effects of using several other values instead of as were subjected to further analysis. This section applies the Aggregation and Compound datasets to illustrate this problem.
As can be seen from Figure 7, Figure 8 and Figure 9, achieves better cluster quantity than other values of in terms of the distributions of and the clustering results. Furthermore, when , the algorithm loses the exact number of clusters.
Table 4 uses a number of metrics to explain the problem objectively, which explain the clustering situations when chooses different values. The bold type indicates the best clustering situation. obtained higher metrics than and , indicating that is the best value to determine .
It can be seen from Figure 10, Figure 11 and Figure 12 that different obtained the same number of clusters, but the corresponding metrics were quite different. Comparing Figure 10b and Figure 11b, it can be clearly seen that the case of correctly separated each cluster, while the case of divided a complete cluster into three parts, and merged two upper left clusters that should have been separated.
6. Experiment
6.1. Preprocessing and Parameter Selection
Before starting the experiment, we had to eliminate the effects of missing values and dimension differences on the datasets. For missing values, we could replace them with the average of all valid values of the same dimension. For data preprocessing, we used the “min-max normalization method”, as shown in Equation (18), to make all data linearly map into [0, 1]. In this way, we could reduce the influence of different measures on the experimental results, eliminate dimension differences, and improve the calculation efficiency [42].
where is the standard data of -th sample and -th dimension; is the original data of -th sample and -th dimension; and is the original data of the entire -th dimension.
First, to reflect the actual results of the algorithms more objectively, we adjusted the optimal parameters for each dataset to ensure the best performance of the algorithm for each kind of parameter. Specifically, the exact cluster numbers of K-means, SNN-DPC, and CFSFDP are given. However, the DPC-SNNACC algorithm does not determine the number of clusters in advance, which is automatically calculated according to the algorithm itself. When processing the SNN-DPC and the DPC-SNNACC algorithms, we increased the number of neighbors from five to 100. Next, we conducted experiments to find the best clustering neighbor number . The author of the traditional CFSFDP algorithm provides a rule of thumb, which makes the number of neighbors between of the total number of points. We can approach the best result by adjusting the values through previous experiments.
6.2. Results on Synthetic Datasets
In this part, we tested the DPC-SNNACC algorithm with eight synthetic datasets. Figure 13 and Figure 14 intuitively show the visual comparisons among the four algorithms by using two-dimensional images. The color points represent the points assigned to different groups, and the pentagram points are clustering centers.
The comprehensive clustering results of the Aggregation dataset in Figure 13 showed that better clustering results could be achieved by both the SNN-DPC and the DPC-SNNACC algorithm, however, a complete cluster will be split by the K-means and CFSFDP algorithm. To be specific, the SNN-DPC and the DPC-SNNACC algorithm found the same clustering centers, which means that the improved algorithm achieved gratifying results in determining the centers. Nevertheless, the K-means algorithm in Figure 13a divided a complete cluster at the bottom of the two-dimensional image from the middle into two independent clusters, and merged the left part with two similar groups into one cluster, while the CFSFDP algorithm in Figure 13b divided it into upper and lower clusters because there were several data points from the upper groups connected to an adjacent small group, so they were combined into a single cluster.
The clustering results shown in Figure 14 demonstrate the SNN-DPC and the DPC-SNNACC algorithms identified the cluster correctly, but K-means and CFSFDP failed to do so. For the K-means algorithm, a small part of the lower cluster was allocated to the upper cluster, so the whole dataset looked like two types of diagonal cut, therefore it was obvious that the clustering results were not desirable. For the CFSFDP algorithm, all sides of the lower cluster were allocated to the upper cluster, leading to the upper and lower parts, which was still not what we expected.
Table 6 shows the results in terms of the NMI, AMI, ARI, F-Measure, Accuracy, FMI, , and Time evaluation metrics on the synthetic datasets, where the symbol “–” indicates the meaningless parameters, and the best result metrics are in bold.
As reported in Table 6, the improved algorithm competes favorably with the other three clustering algorithms. The column shows the number of clusters. The of the first three algorithms are given in advance. However, the number of clusters of the DPC-SNNACC algorithm was adaptively determined by the improved method. Through the analysis of the table, the numerical value of the column in each dataset was the same, indicating that the DPC-SNNACC algorithm could correctly identify the number of clusters in the selected dataset. Compared with K-means, the other three algorithms could obtain fairly good performances in clustering. The Spiral dataset usually verifies the ability of algorithm to solve cross-winding datasets. It is clear that the K-means algorithm failed to perform well, while the other three clustering algorithms reached the optimal condition. This may result from the fact that the other three algorithms used both and to describe each point, which can make the characteristics more obvious. The K-means algorithm only uses distance to classify points, so it cannot generally represent the characteristics of points. In other words, the K-means algorithm cannot deal with the cross-winding datasets. Sometimes, the CFSFDP algorithm cannot recognize the clusters effectively, even on a few more points. This may be due to the simplistic way of density estimation as well as the approach of allocating the remaining points. The DPC-SNNACC and the SNN-DPC algorithms outperformed the other clustering algorithms on nearly all of these synthetic datasets, except for CFSFDP on Jain. Furthermore, each algorithm could obtain good clustering results in the R15 dataset. Similarly, in the D31 dataset, the result of K-means and CFSFDP were almost as good as the SNN-DPC and the DPC-SNNACC algorithms, which means that these algorithms can be applied to multi groups and larger datasets. Although the DPC-SNNACC algorithm runs a little longer, it is still within the acceptable range.
6.3. Results on UCI (University of California, Irvine) Datasets
In this part, the improved algorithm was subjected to further tests with four UCI real datasets.
The Wine dataset consists of three clusters with few intersections among them. From the results shown in Figure 15, the four algorithms could all divide into three clusters, but there were some differences in the classification of the critical part. For instance, the CFSFDP algorithm had cross parts between the second and the third cluster from top to bottom, while the other algorithms were three independent individuals roughly. In addition, the less-than-perfect results are also reflected in the center distance of the second and third groups in CFSFDP as it was much closer than the others. The other three algorithms could basically achieve correct clustering results.
Figure 16 shows the performance of the four algorithms on the WDBC dataset. As shown in the figure, the other three algorithms found the cluster centers of the breast cancer database (WDBC), except for CFSFDP. To be specific, as the distribution density of the dataset was uneven and the overall density was similar, the CFSFDP algorithm classified most of the points into one group, resulting in poor clustering effect. It appears that the K-means, the DPC-SNNACC, and the SNN-DPC algorithms could find the cluster centers correctly and allocate the points reasonably, but a further inspection revealed that the DPC-SNNACC and the SNN-DPC could distinguish two kinds of clusters well, while the K-means algorithm had some cross points in the middle of two clusters.
Again, the performances of the four algorithms were benchmarked in terms of NMI, AMI, ARI, F-Measure, Accuracy, and FMI. Table 7 displays the performance of the four algorithms on various datasets. The symbol “–” in the table means that the entries had no actual values and the best results are shown in bold. Like the synthetic datasets, the DPC-SNNACC algorithm could correctly identify the number of clusters, which means that we can use the improved algorithm to adaptively determine the cluster centers. Furthermore, the SNN-DPC and DPC-SNNACC were superior to the other algorithms in terms of metrics. Basically, every metric of the DPC-SNNACC algorithm was on par with the SNN-DPC, indicating evidence of great potential in clustering. It was obvious that although the metric values of the DPC-SNNACC in the WDBC dataset were slightly lower than the SNN-DPC algorithm, these were much higher than the K-means. Furthermore, the CFSFDP algorithm had trouble with the WDBC dataset, which indicates that the DPC-SNNACC algorithm is more robust than CFSFDP. In terms of time, the DPC-SNNACC was similar to the others, with little differentiation in 0.7 s.
Through the above-detailed analysis of the performance of the DPC-SNNACC algorithm with other clustering algorithms on the synthetic and real-world datasets from the UCI, we can conclude that the DPC-SNNACC algorithm had better performance than the other common algorithms in clustering, which substantiates its potentiality in clustering. Most importantly, it could find the cluster centers adaptively, which is not a common characteristic of the other algorithms.
6.4. Running Time
The execution efficiency of the algorithm is usually an important metric to evaluate the performance, and we often use time to represent the execution efficiency. This section compares the DPC-SNNACC algorithm with the SNN-DPC algorithm, the CFSFDP algorithm, and K-means algorithm in terms of time complexity. At the same time, the clustering consumption time of the synthetic dataset and the real dataset will be compared by Section 4.3 and Section 4.4 to judge the advantages and disadvantages of the DPC-SNNACC algorithm.
Table 8 shows the time complexity comparison of the four clustering algorithms. It can be seen from the table that the time complexity of the K-means algorithm was the lowest, the time complexity of the CFSFDP algorithm ranked second, and the time complexity of the SNN-DPC and the DPC-SNNACC algorithm was the highest. However, and are usually much smaller than , so it has little effect on the time complexity of the algorithms.
The last columns of Table 6 and Table 7 show the time needed by each algorithm to cluster different datasets. Table analysis showed that for most datasets, the time of the K-means algorithm was the shortest, followed by CFSFDP. The time of the SNN-DPC and the DPC-SNNACC algorithms were longer, which is consistent with the time complexity, but the difference in the running time of each dataset algorithm was less than 1 s, which can be acceptable. Therefore, even if the time of the DPC-SNNACC algorithm is not optimal, it is still desirable.
7. Conclusions
In this paper, in order to solve the problem that the SNN-DPC algorithm needs to select cluster centers through a decision graph or needs to input the cluster number manually, we proposed an improved method called DPC-SNNACC. By optimizing the calculation method of local density, the difference in the local density among different points becomes larger as does the difference in the decision values. Then, the knee point is obtained by calculating the change in decision values. The points with a high decision value are selected as clustering centers, and the number of clustering centers is adaptively obtained. In this way, the DPC-SNNACC algorithm can solve the problem of clustering for unknown or unfamiliar datasets.
The experimental and comparative evaluation of several datasets from diverse domains established the viability of the DPC-SNNACC algorithm. It could correctly obtain the clustering centers, and almost every metric met the standard of the SNN-DPC algorithm, which was superior to the traditional CFSFDP and K-means algorithms. Moreover, the DPC-SNNACC algorithm has high applicability to datasets of different dimensions and sizes. Within the acceptable range, it is generally feasible, although it has some shortcomings such as long running time. In general, the DPC-SNNACC algorithm not only retains the advantages of the SNN-DPC algorithm, but also solves the problem of self-adaptive determination of the cluster number. Furthermore, the DPC-SNNACC algorithm can be applicable to any dimension and size of datasets, and it is robust to noise and cluster density differences.
In future work, first, we can further explore the clustering algorithm based on shared neighbors, find a more accurate method to automatically determine , and simplify the process of determining the algorithm parameters. Second, the DPC-SNNACC algorithm can be combined with other algorithms to give full play to the advantages of other algorithms and make up for the shortcomings of the DPC-SNNACC algorithm. Third, the algorithm can be applied to some practical problems to increase its applicability.
Author Contributions
Conceptualization, Y.L.; Formal analysis, Y.L.; Supervision, M.L.; Validation, M.L.; Writing—original draft, Y.L.; Writing—review & editing, M.L. and Y.X. All authors have read and agreed to the published version of the manuscript.
Funding
This research was funded by Fundamental Research Funds for the Central Universities, grant number 222201917006
Conflicts of Interest
The authors declare no conflict of interest.
Appendix A

Table A1.
Summary of the meaning of symbols used in this paper.
| Symbol | Meaning |
|---|---|
| The cut-off distance, the neighborhood radius of a point | |
| The dataset with as its -th data point | |
| The number of records in the dataset | |
| The Euclidean distance between point and | |
| The distances of the pairs of data points in | |
| The local density | |
| The distance from larger density point | |
| The decision value, the element-wise product of and | |
| The ascending sorted | |
| The number of K-nearest neighbors considered | |
| The set of K-nearest neighbors of point | |
| The set of shared nearest neighbors of point , maybe an empty set | |
| L(xi) = (x1, …, xk) | The set of points with the highest similarity to point |
| The SNN similarity between points and | |
| The number of clusters in the experiment | |
| An integer closest to result after rooting to | |
| The knee point | |
| The difference value between adjacent values | |
| The threshold for judging knee point | |
| The set of cluster centers in the experiment | |
| The representation of final clustering result | |
| The noncentral points which are unassigned, possible subordinate points | |
| The representation of initial clustering result | |
| Ergodic matrix for distribution of possible subordinate points | |
| The queue that has points waiting to be processed | |
| The set of K-nearest neighbors of point |
References
- Xu, R.; Wunsch, D. Survey of Clustering Algorithms. IEEE Trans. Neural Netw. 2005, 16, 645–678. [Google Scholar] [CrossRef] [Green Version]
- Omran, M.G.H.; Engelbrecht, A.P.; Salman, A.A. An overview of clustering methods. Intell. Data Anal. 2007, 11, 583–605. [Google Scholar] [CrossRef]
- Feldman, D.; Schmidt, M.; Sohler, C. Turning Big Data into Tiny Data: Constant-Size Coresets for kk-Means, PCA, and Projective Clustering. SIAM J. Comput. 2020, 49, 601–657. [Google Scholar] [CrossRef]
- Alex, R. Machine learning. Clustering by fast search and find of density peaks. J. Sci. 2014, 344, 6191. [Google Scholar]
- Shi, Y.-M.; Zhu, F.-Z.; Wei, X.; Chen, B.-Y. Study of transpedicular screw fixation on spine development in a piglet model. J. Orthop. Surg. Res. 2016, 11, 8. [Google Scholar] [CrossRef] [PubMed] [Green Version]
- Chen, Y.; Lai, D.-H.; Qi, H.; Wang, J.-L.; Du, J. A new method to estimate ages of facial image for large database. Multimed. Tools Appl. 2015, 75, 2877–2895. [Google Scholar] [CrossRef]
- Liu, R.; Wang, H.; Yu, X. Shared-nearest-neighbor-based clustering by fast search and find of density peaks. Inf. Sci. 2018, 450, 200–226. [Google Scholar] [CrossRef]
- Wang, J.; Zhu, C.; Zhou, Y.; Zhu, X.; Wang, Y.; Zhang, W. From Partition-Based Clustering to Density-Based Clustering: Fast Find Clusters With Diverse Shapes and Densities in Spatial Databases. IEEE Access 2017, 6, 1718–1729. [Google Scholar] [CrossRef]
- Kaufman, L.; Rousseeuw, P.J. Partitioning Around Medoids (Program PAM); Wiley: Hoboken, NJ, USA, 2008; pp. 68–125. [Google Scholar]
- Kaufman, L.; Rousseeuw, P.J. Finding Groups in Data: An Introduction to Cluster Analysis; Wiley: Hoboken, NJ, USA, 2005. [Google Scholar]
- Ng, R.; Han, J. CLARANS: A method for clustering objects for spatial data mining. IEEE Trans. Knowl. Data Eng. 2002, 14, 1003–1016. [Google Scholar] [CrossRef] [Green Version]
- Frey, B.J.; Dueck, D. Clustering by Passing Messages between Data Points. Science 2007, 315, 972–976. [Google Scholar] [CrossRef] [Green Version]
- Zhang, T.; Ramakrishnan, R.; Livny, M. BIRCH: An Efficient Data Clustering Method for Very Large Databases. ACM SIGMOD Rec. 1996, 25. [Google Scholar] [CrossRef]
- Guha, S.; Rastogi, R.; Shim, K. A Clustering Algorithm for Categorical Attributes. Inf. Syst. J. 1999, 25, 345–366. [Google Scholar] [CrossRef]
- Wang, W.; Yang, J.; Muntz, R. In STING: A Statistical Information Grid Approach to Spatial Data Mining. In Proceedings of the VLDB’97—23rd International Conference on Very Large Data Bases, Athens, Greece, 25–29 August 1997. [Google Scholar]
- Agrawal, R.; Gehrke, J.E.; Gunopulos, D.; Raghavan, P. Automatic Subspace Clustering of High Dimensional Data for Data Mining Applications. In Proceedings of the 1998 ACM SIGMOD International Conference on Management of Data, Seattle, WA, USA, 1–4 June 1998; Volume 27, pp. 94–105. [Google Scholar]
- Ester, M. A Density-Based Algorithm for Discovering Clusters in Large Spatial Databases with Noise; AAAI Press: Palo Alto, CA, USA, 1996. [Google Scholar]
- Xu, D.; Tian, Y. A Comprehensive Survey of Clustering Algorithms. Ann. Data Sci. 2015, 2, 165–193. [Google Scholar] [CrossRef] [Green Version]
- Liang, Z.; Chen, P. Delta-density based clustering with a divide-and-conquer strategy: 3DC clustering. Pattern Recognit. Lett. 2016, 73, 52–59. [Google Scholar] [CrossRef]
- Xie, J.; Gao, H.; Xie, W.; Liu, X.; Grant, P.W. Robust clustering by detecting density peaks and assigning points based on fuzzy weighted K-nearest neighbors. Inf. Sci. 2016, 354, 19–40. [Google Scholar] [CrossRef]
- Du, M.; Ding, S.; Jia, H. Study on density peaks clustering based on k-nearest neighbors and principal component analysis. Knowl. Based Syst. 2016, 99, 135–145. [Google Scholar] [CrossRef]
- Qi, J.; Xiao, B.; Chen, Y. I-CFSFDP: A Robust and High Accuracy Clustering Method Based on CFSFDP. In Proceedings of the 37th Chinese Control Conference (CCC), Wuhan, China, 25–27 July 2018. [Google Scholar]
- Liu, Y.; Liu, D.; Yu, F.; Ma, Z. A Double-Density Clustering Method Based on Nearest to First in Strategy. Symmetry 2020, 12, 747. [Google Scholar] [CrossRef]
- Bie, R.; Mehmood, R.; Ruan, S.; Sun, Y.; Dawood, H. Adaptive fuzzy clustering by fast search and find of density peaks. Pers. Ubiquitous Comput. 2016, 20, 785–793. [Google Scholar] [CrossRef]
- Tao, L.I.; Hongwei, G.E.; Shuzhi, S. Density Peaks Clustering by Automatic Determination of Cluster Centers. J. Front. Comput. Sci. Technol. 2016, 10, 1614–1622. [Google Scholar]
- Lin, J.-L.; Kuo, J.-C.; Chuang, H.-W. Improving Density Peak Clustering by Automatic Peak Selection and Single Linkage Clustering. Symmetry 2020, 12, 1168. [Google Scholar] [CrossRef]
- Zhong, X.B.; Huang, X.X. An Efficient Distance and Density Based Outlier Detection Approach. Appl. Mech. Mater. 2012, 155, 342–347. [Google Scholar] [CrossRef]
- Gionis, A.; Mannila, H.; Tsaparas, P. Clustering aggregation. ACM Trans. Knowl. Discov. Data 2007, 1, 4. [Google Scholar] [CrossRef] [Green Version]
- Chang, H.; Yeung, D.-Y. Robust path-based spectral clustering. Pattern Recognit. 2008, 41, 191–203. [Google Scholar] [CrossRef]
- Jain, A.K.; Law, M. Data Clustering: A User’s Dilemma. In Proceedings of the International Conference on Pattern Recognition and Machine Intelligence, Kolkata, India, 20–22 December 2005. [Google Scholar]
- Veenman, C.; Reinders, M.; Backer, E. A maximum variance cluster algorithm. IEEE Trans. Pattern Anal. Mach. Intell. 2002, 24, 1273–1280. [Google Scholar] [CrossRef] [Green Version]
- Fu, L.; Qu, J.; Chen, H. Mechanical drilling of printed circuit boards: The state-of-the-art. Circuit World 2007, 33, 3–8. [Google Scholar] [CrossRef]
- Xia, Y.; Wang, G.; Gao, S. An Efficient Clustering Algorithm for 2D Multi-density Dataset in Large Database. In Proceedings of the 2007 International Conference on Multimedia and Ubiquitous Engineering (MUE’07), Seoul, Korea, 26–28 April 2007; pp. 78–82. [Google Scholar]
- Bache, K.; Lichman, M. UCI Machine Learning Repository; University of California: Irvine, CA, USA, 2013. [Google Scholar]
- Charytanowicz, M.; Niewczas, J.; Kulczycki, P.; Kowalski, P.A.; Łukasik, S.; Żak, S. Complete Gradient Clustering Algorithm for Features Analysis of X-ray Images; Springer: Berlin/Heidelberg, Germany, 2010; pp. 15–24. [Google Scholar]
- Street, W.N.; Wolberg, W.H.; Mangasarian, O. Nuclear Feature Extraction for Breast Tumor Diagnosis. In Biomedical Image Processing and Biomedical Visualization; International Society for Optics and Photonics: Bellingham, WA, USA, 1993; Volume 1905, pp. 861–870. [Google Scholar]
- Lancichinetti, A.; Fortunato, S.; Kertész, J. Detecting the overlapping and hierarchical community structure in complex networks. New J. Phys. 2009, 11, 033015. [Google Scholar] [CrossRef]
- Vinh, N.X.; Epps, J.; Bailey, J. Information Theoretic Measures for Clusterings Comparison: Variants, Properties, Normalization and Correction for Chance. J. Mach. Learn. Res. 2010, 11, 2837–2854. [Google Scholar]
- Yan, Y.; Fan, J.; Mohamed, K. Survey of clustering validity evaluation. Appl. Res. Comput. 2008. [Google Scholar] [CrossRef]
- Ding, S.F.; Jia, H.J.; Shi, Z. Spectral Clustering Algorithm Based on Adaptive Nystrom Sampling for Big Data Analysis. J. Softw. 2014, 25, 2037–2049. [Google Scholar]
- Fowlkes, E.B.; Mallows, E. A Method for Comparing Two Hierarchical Clusterings. J. Am. Stat. Assoc. 1983, 78, 553–569. [Google Scholar] [CrossRef]
- Jiawei, H.; Micheline, K. Data Mining: Concepts and Techniques; Elsevier: Amsterdam, The Netherlands, 2006. [Google Scholar]
Figure 1.
Distribution of on the Aggregation dataset.
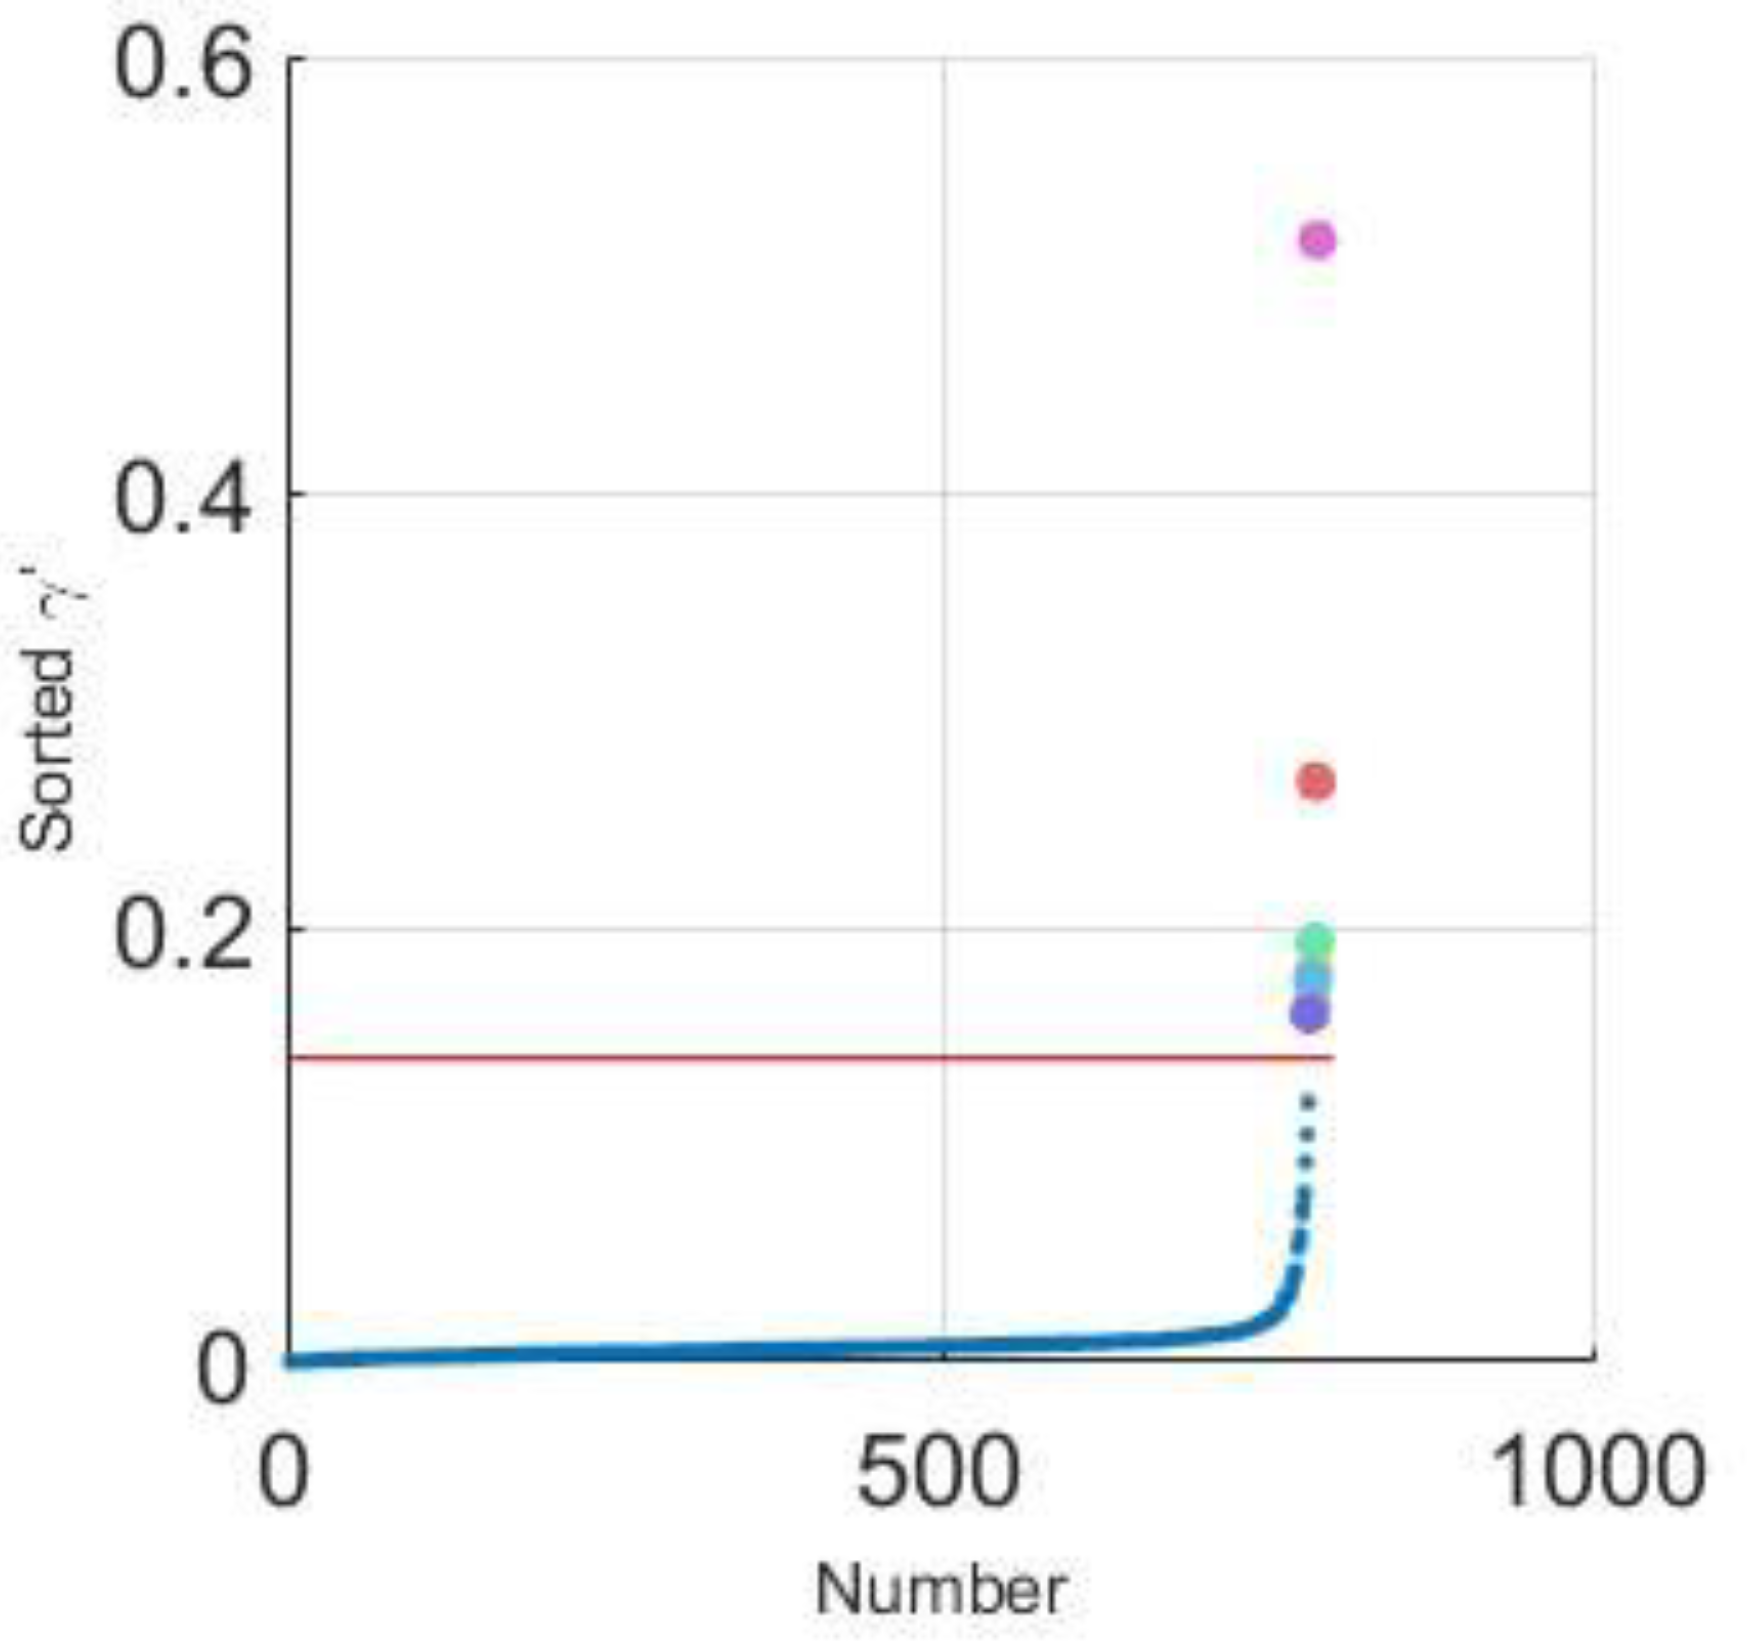
Figure 2.
A simple dataset as the example.
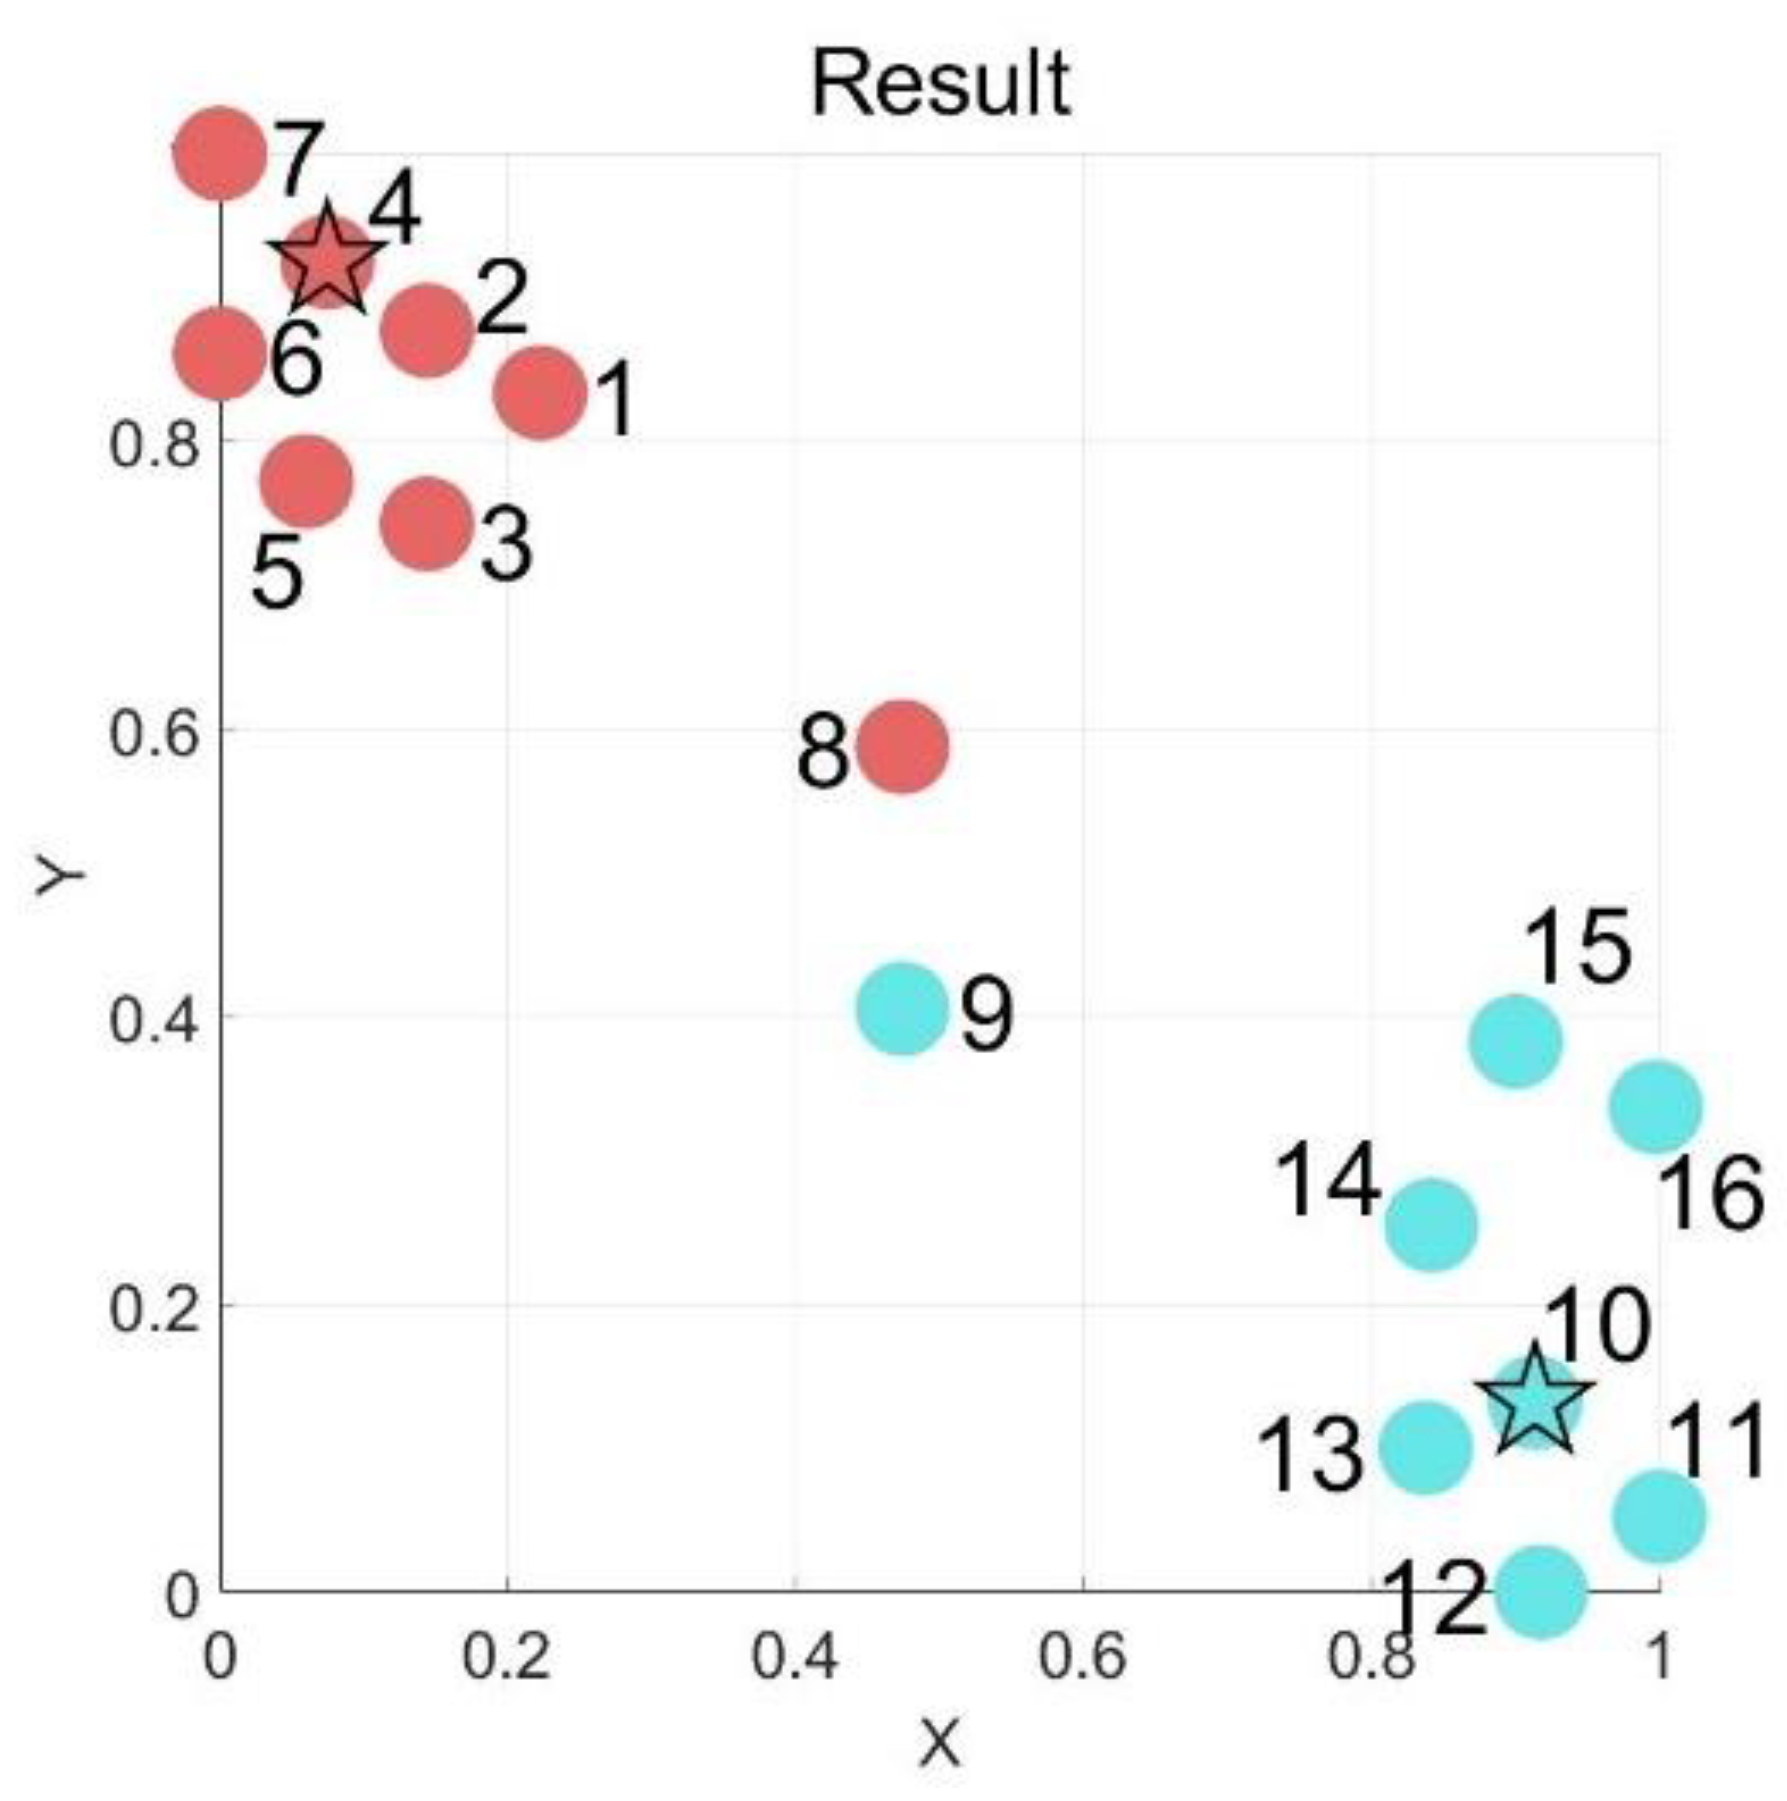
Figure 3.
Distribution of in the simple dataset.

Figure 4.
Changes in the various metrics of the Aggregation dataset.

Figure 5.
Comparison of values between shared-nearest-neighbor-based clustering by fast search and find of density peaks (SNN-DPC) and fast searching density peak clustering algorithm based on shared nearest neighbor and adaptive clustering center (DPC-SNNACC) in the Jain dataset. (a) values of SNN-DPC; (b) values of DPC-SNNACC.
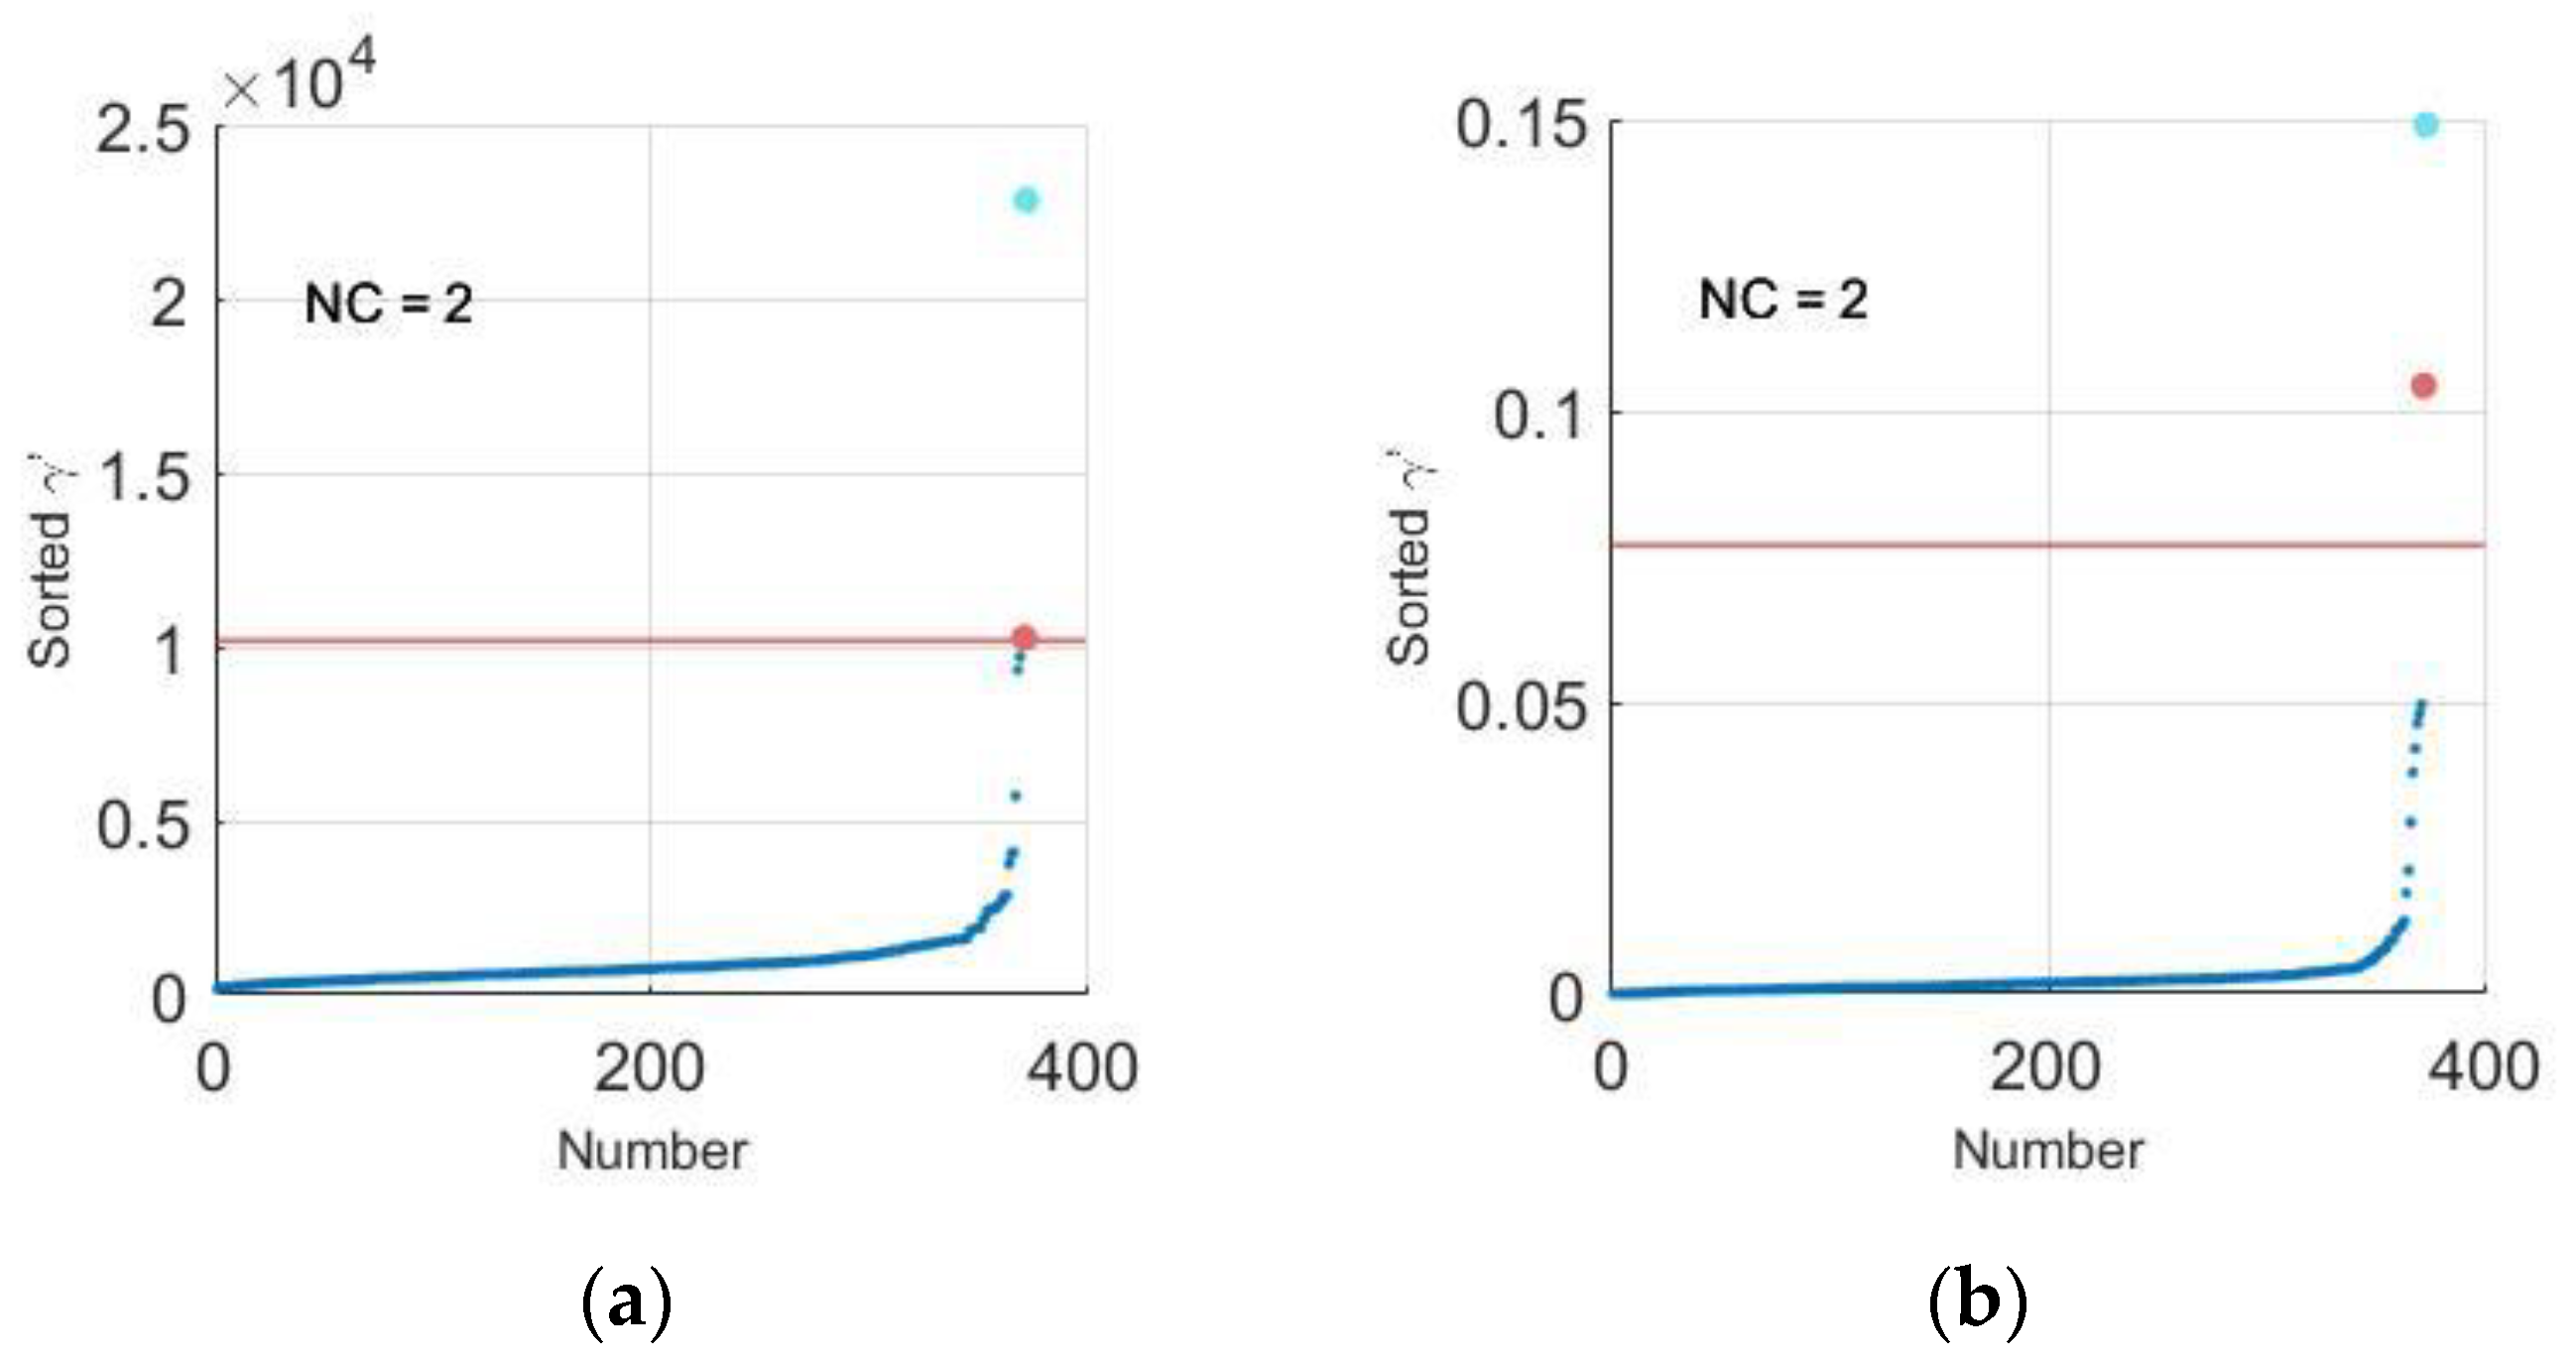
Figure 6.
Comparison of values shared-nearest-neighbor-based clustering by fast search and find of density peaks (SNN-DPC) and fast searching density peak clustering algorithm based on shared nearest neighbor and adaptive clustering center (DPC-SNNACC) in the Spiral dataset. (a) values of SNN-DPC; (b) values of DPC-SNNACC.
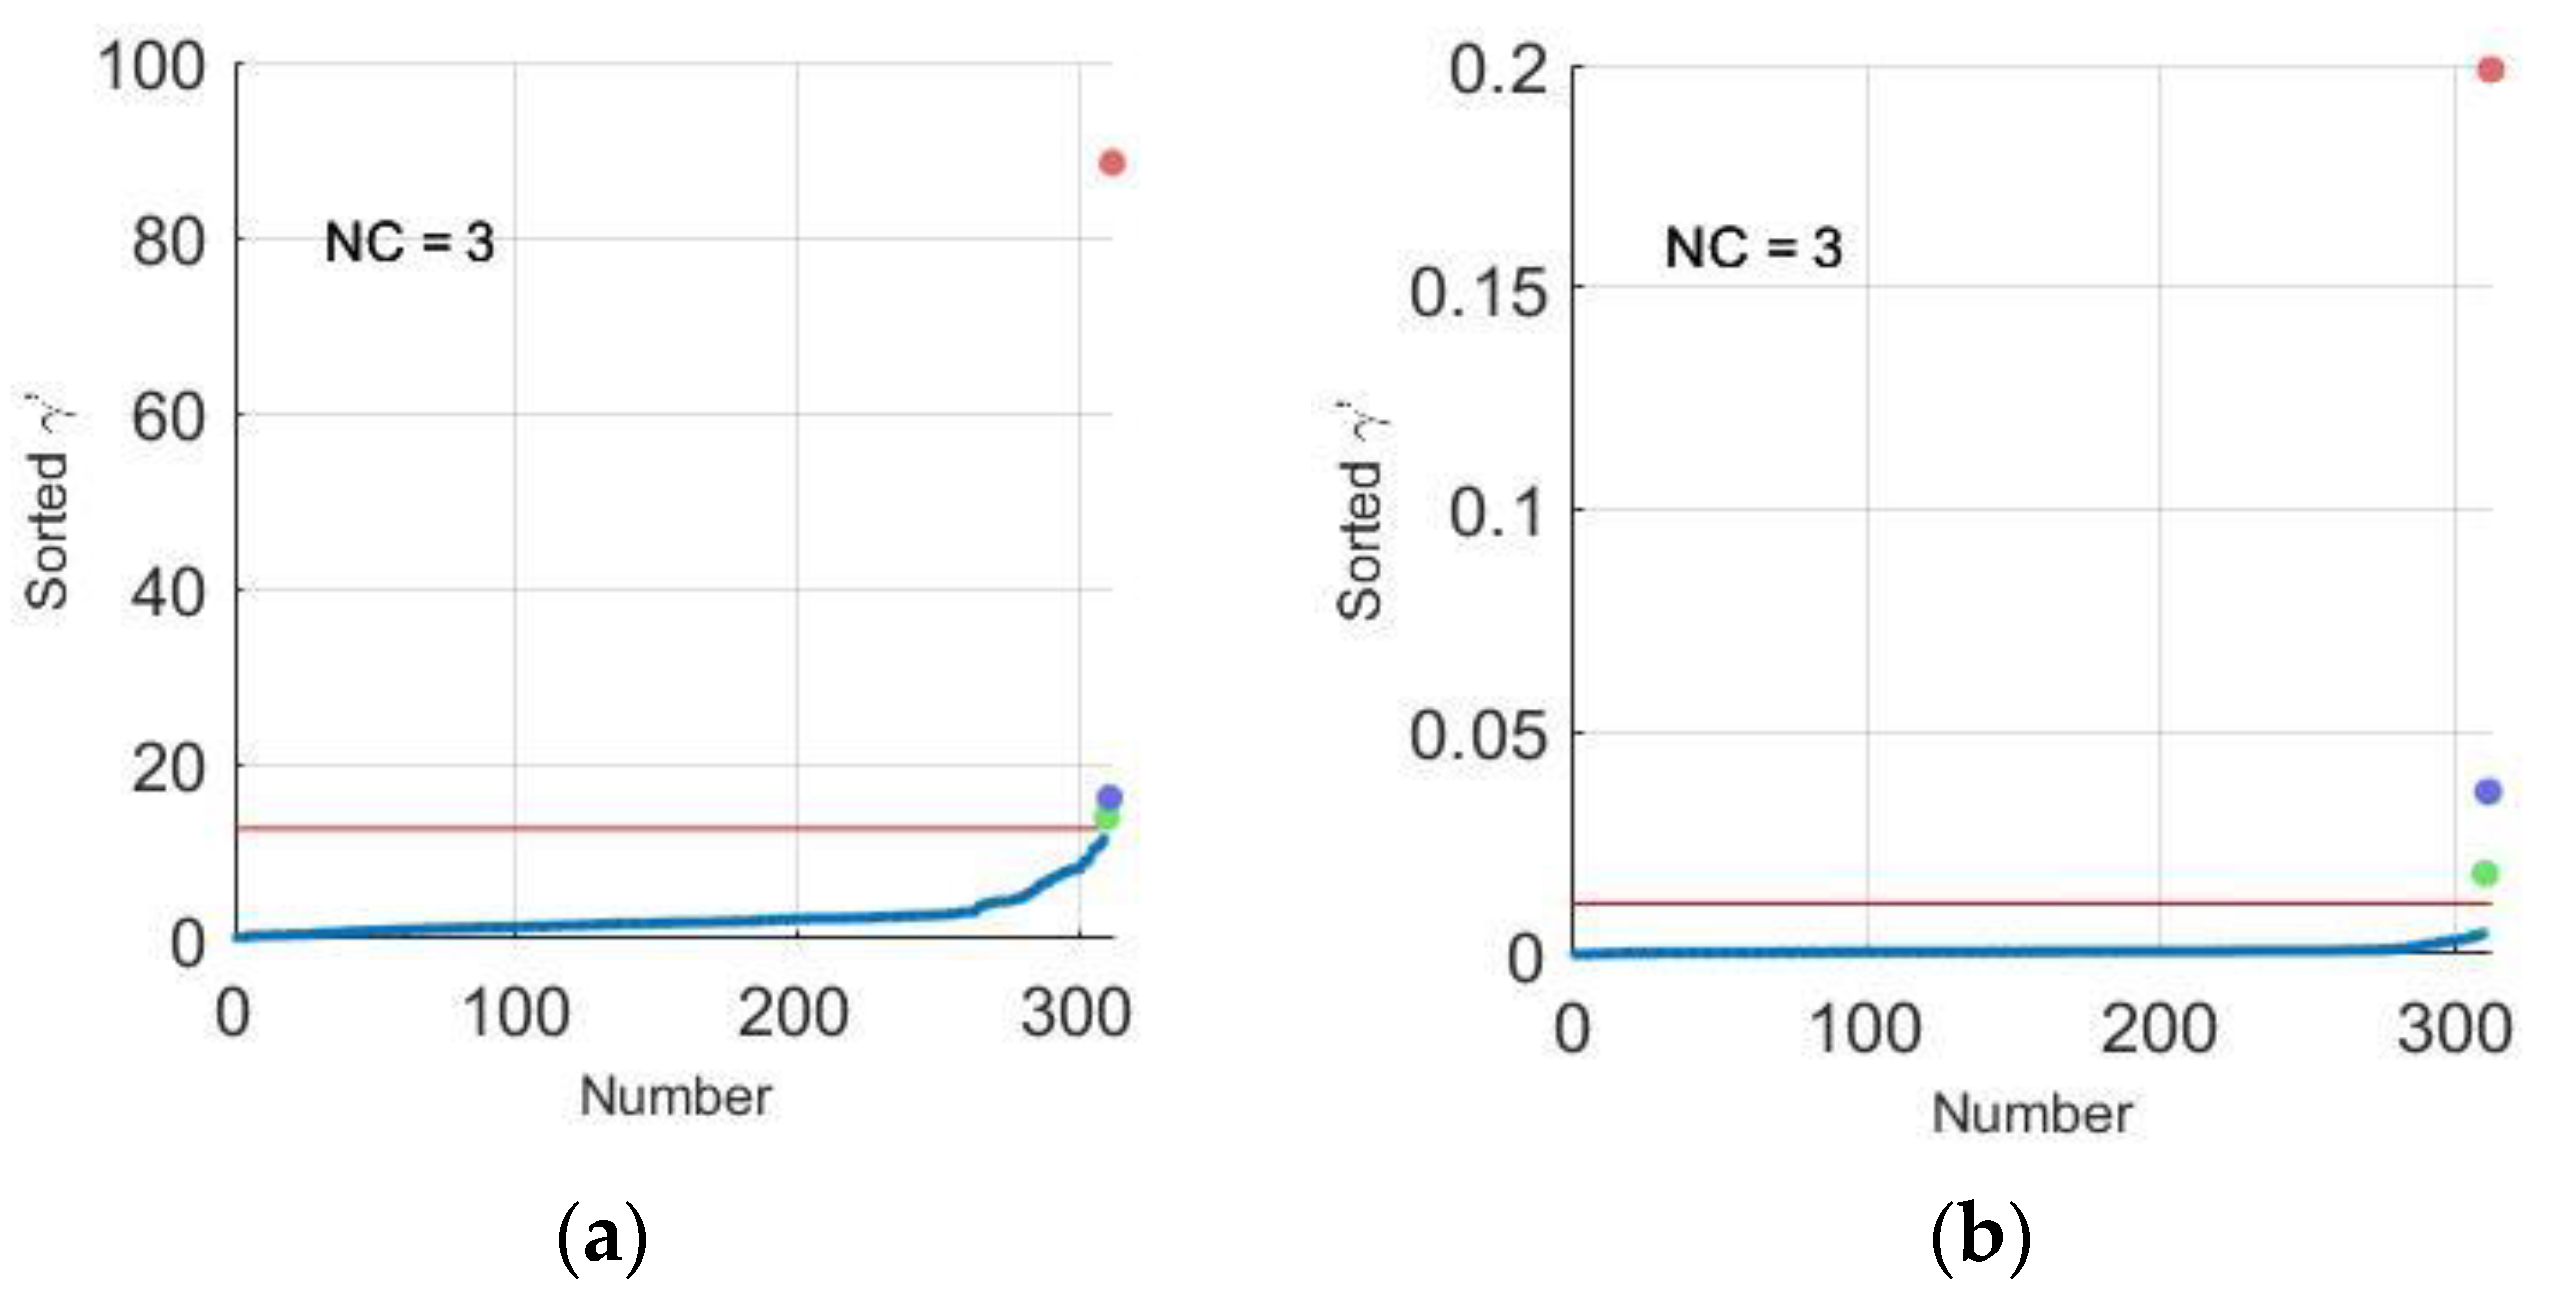
Figure 7.
Clustering results when in the Aggregation dataset. (a) Distribution of in the Aggregation dataset; (b) Clustering result of the Aggregation dataset.
Figure 7.
Clustering results when in the Aggregation dataset. (a) Distribution of in the Aggregation dataset; (b) Clustering result of the Aggregation dataset.
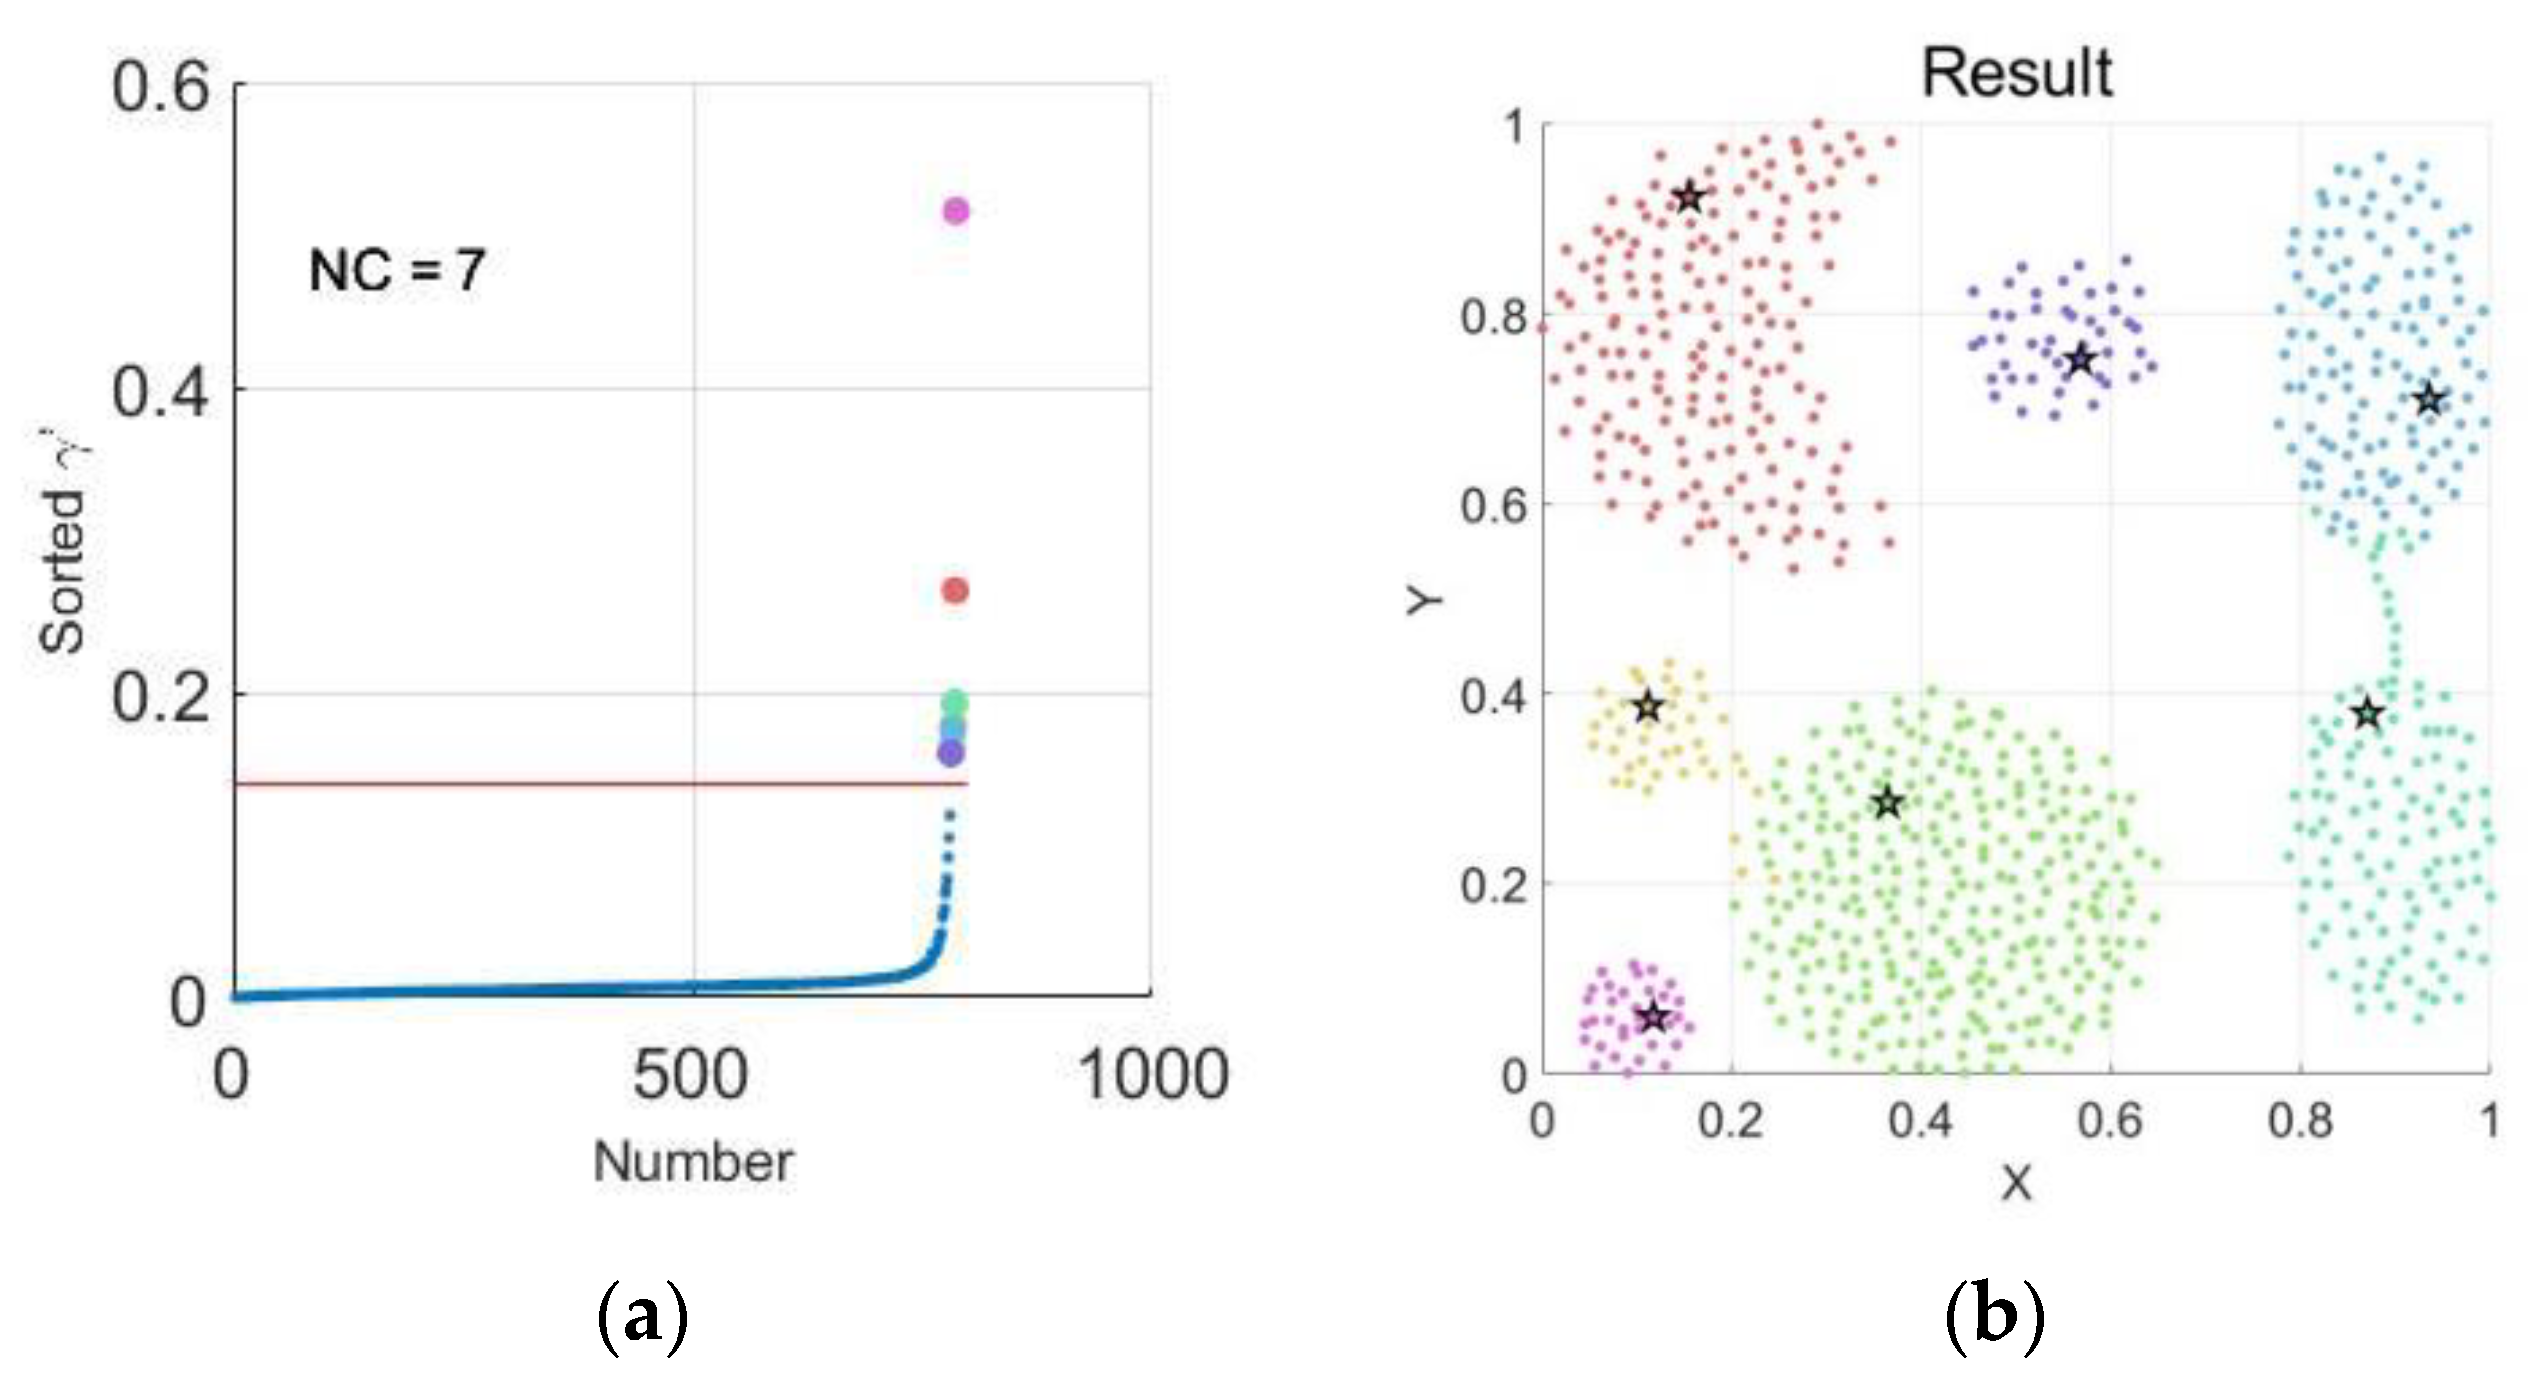
Figure 8.
Clustering results when in the Aggregation dataset. (a) Distribution of in the Aggregation dataset; (b) Clustering result of the Aggregation dataset.
Figure 8.
Clustering results when in the Aggregation dataset. (a) Distribution of in the Aggregation dataset; (b) Clustering result of the Aggregation dataset.
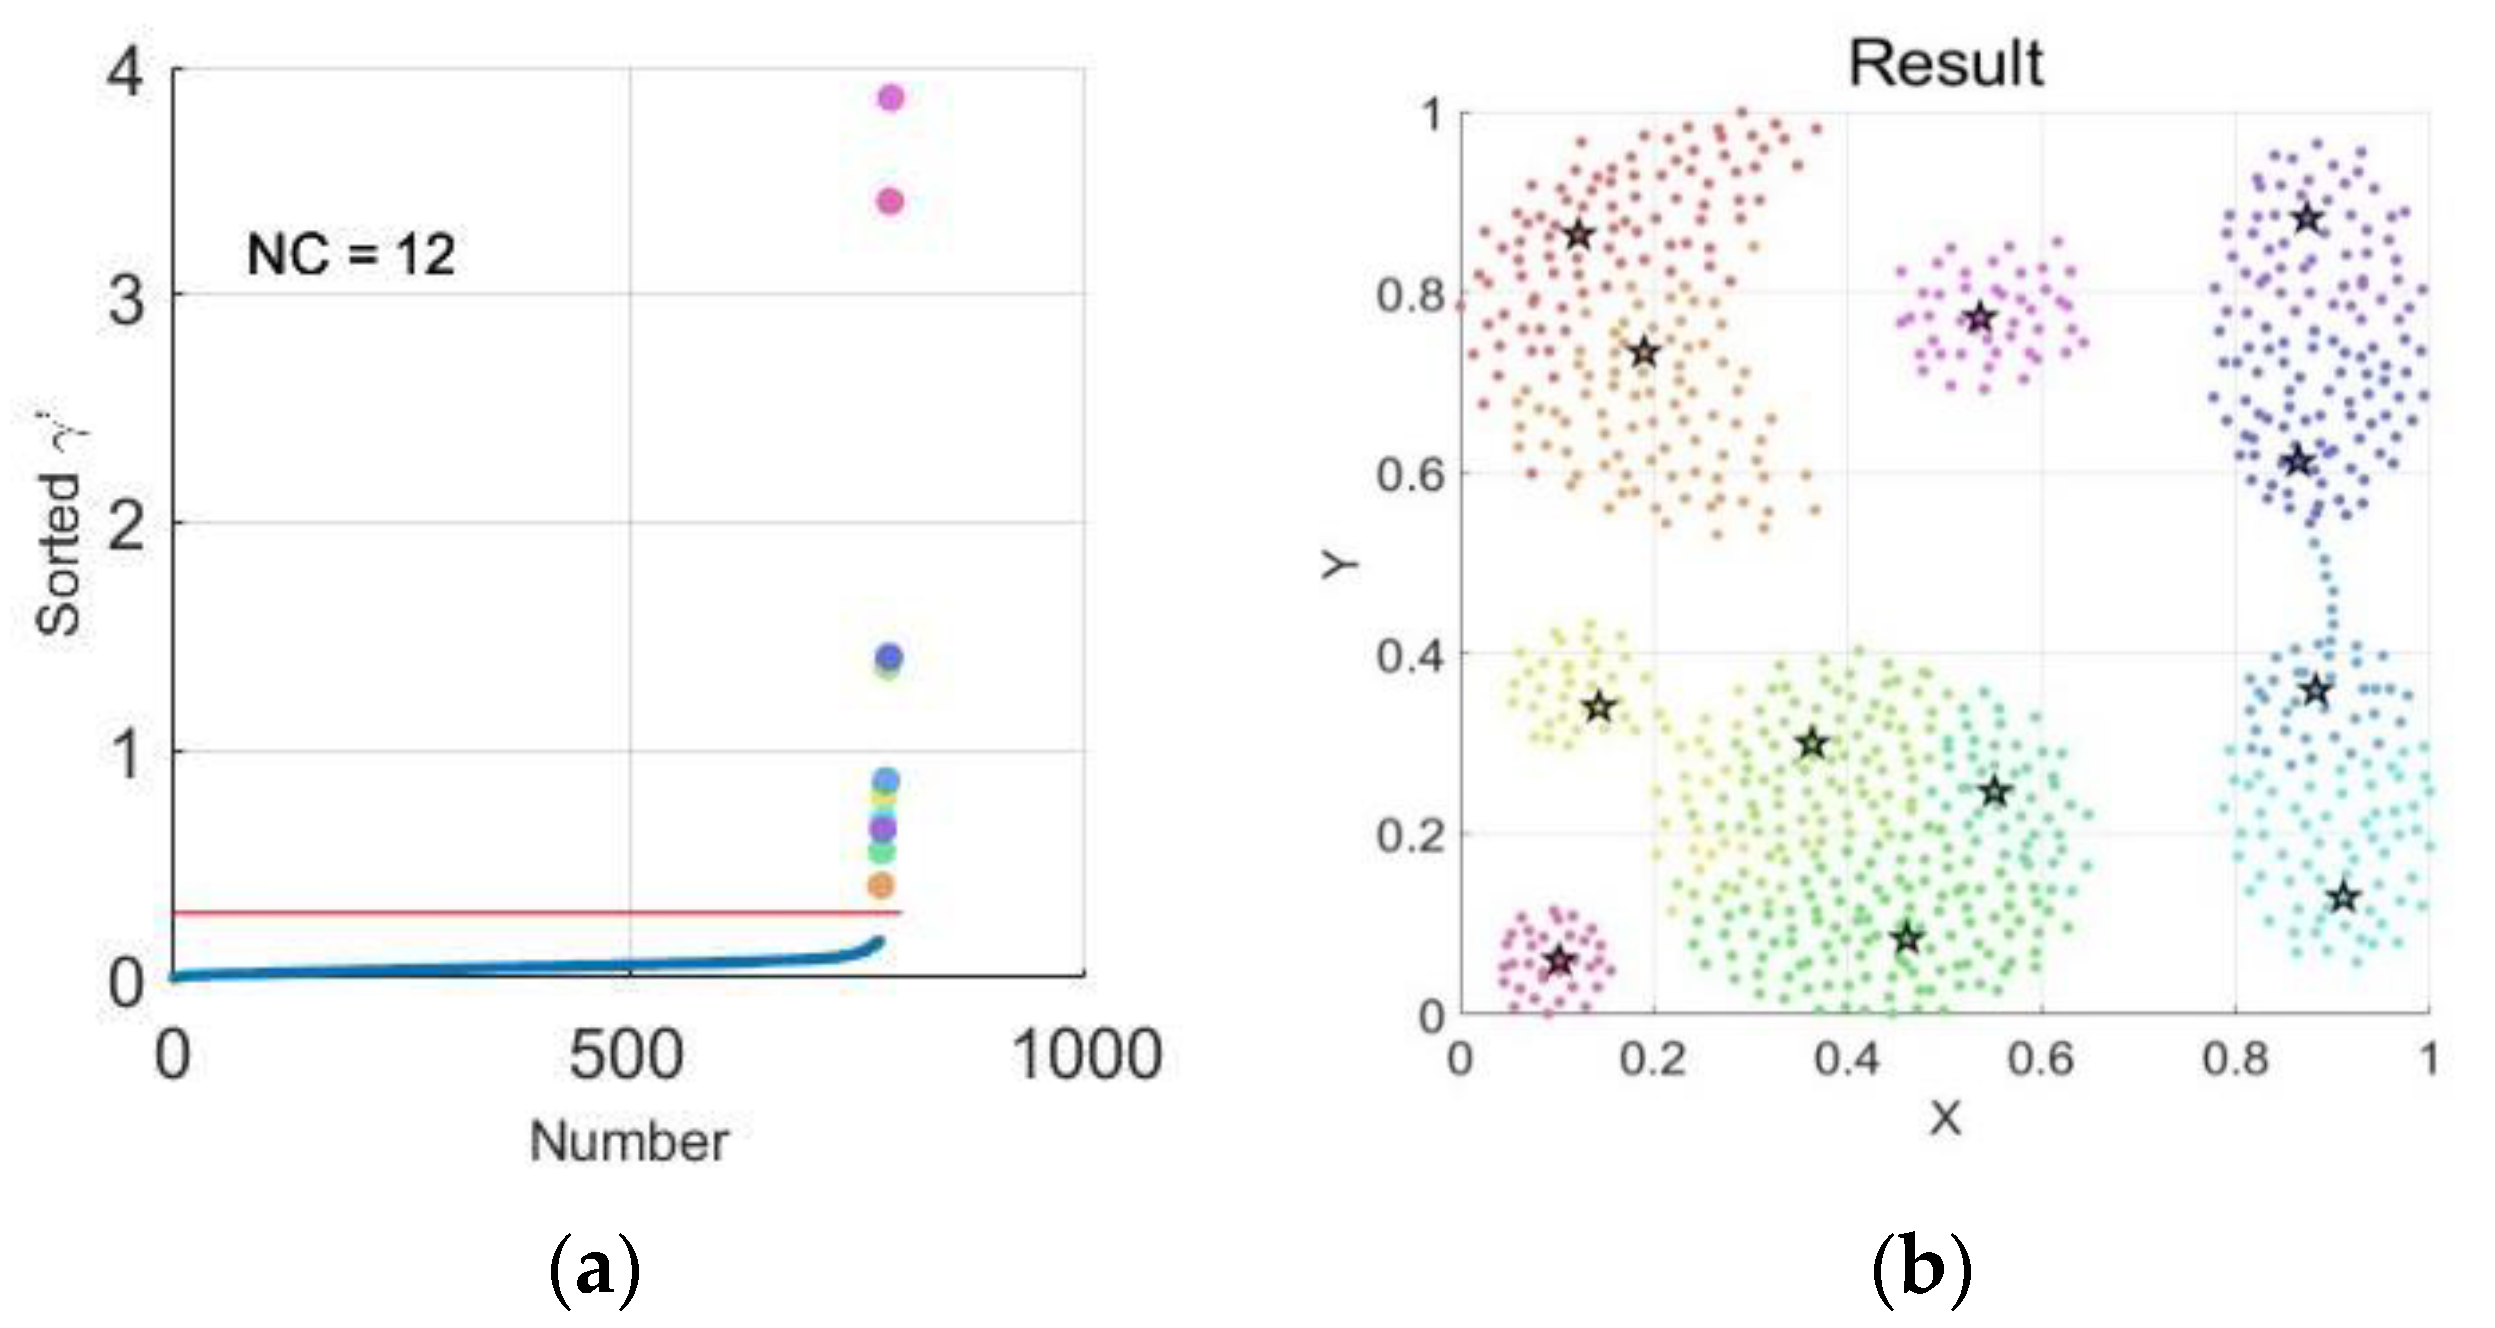
Figure 9.
Clustering results when in the Aggregation dataset. (a) Distribution of in the Aggregation dataset; (b) Clustering result of the Aggregation dataset.
Figure 9.
Clustering results when in the Aggregation dataset. (a) Distribution of in the Aggregation dataset; (b) Clustering result of the Aggregation dataset.
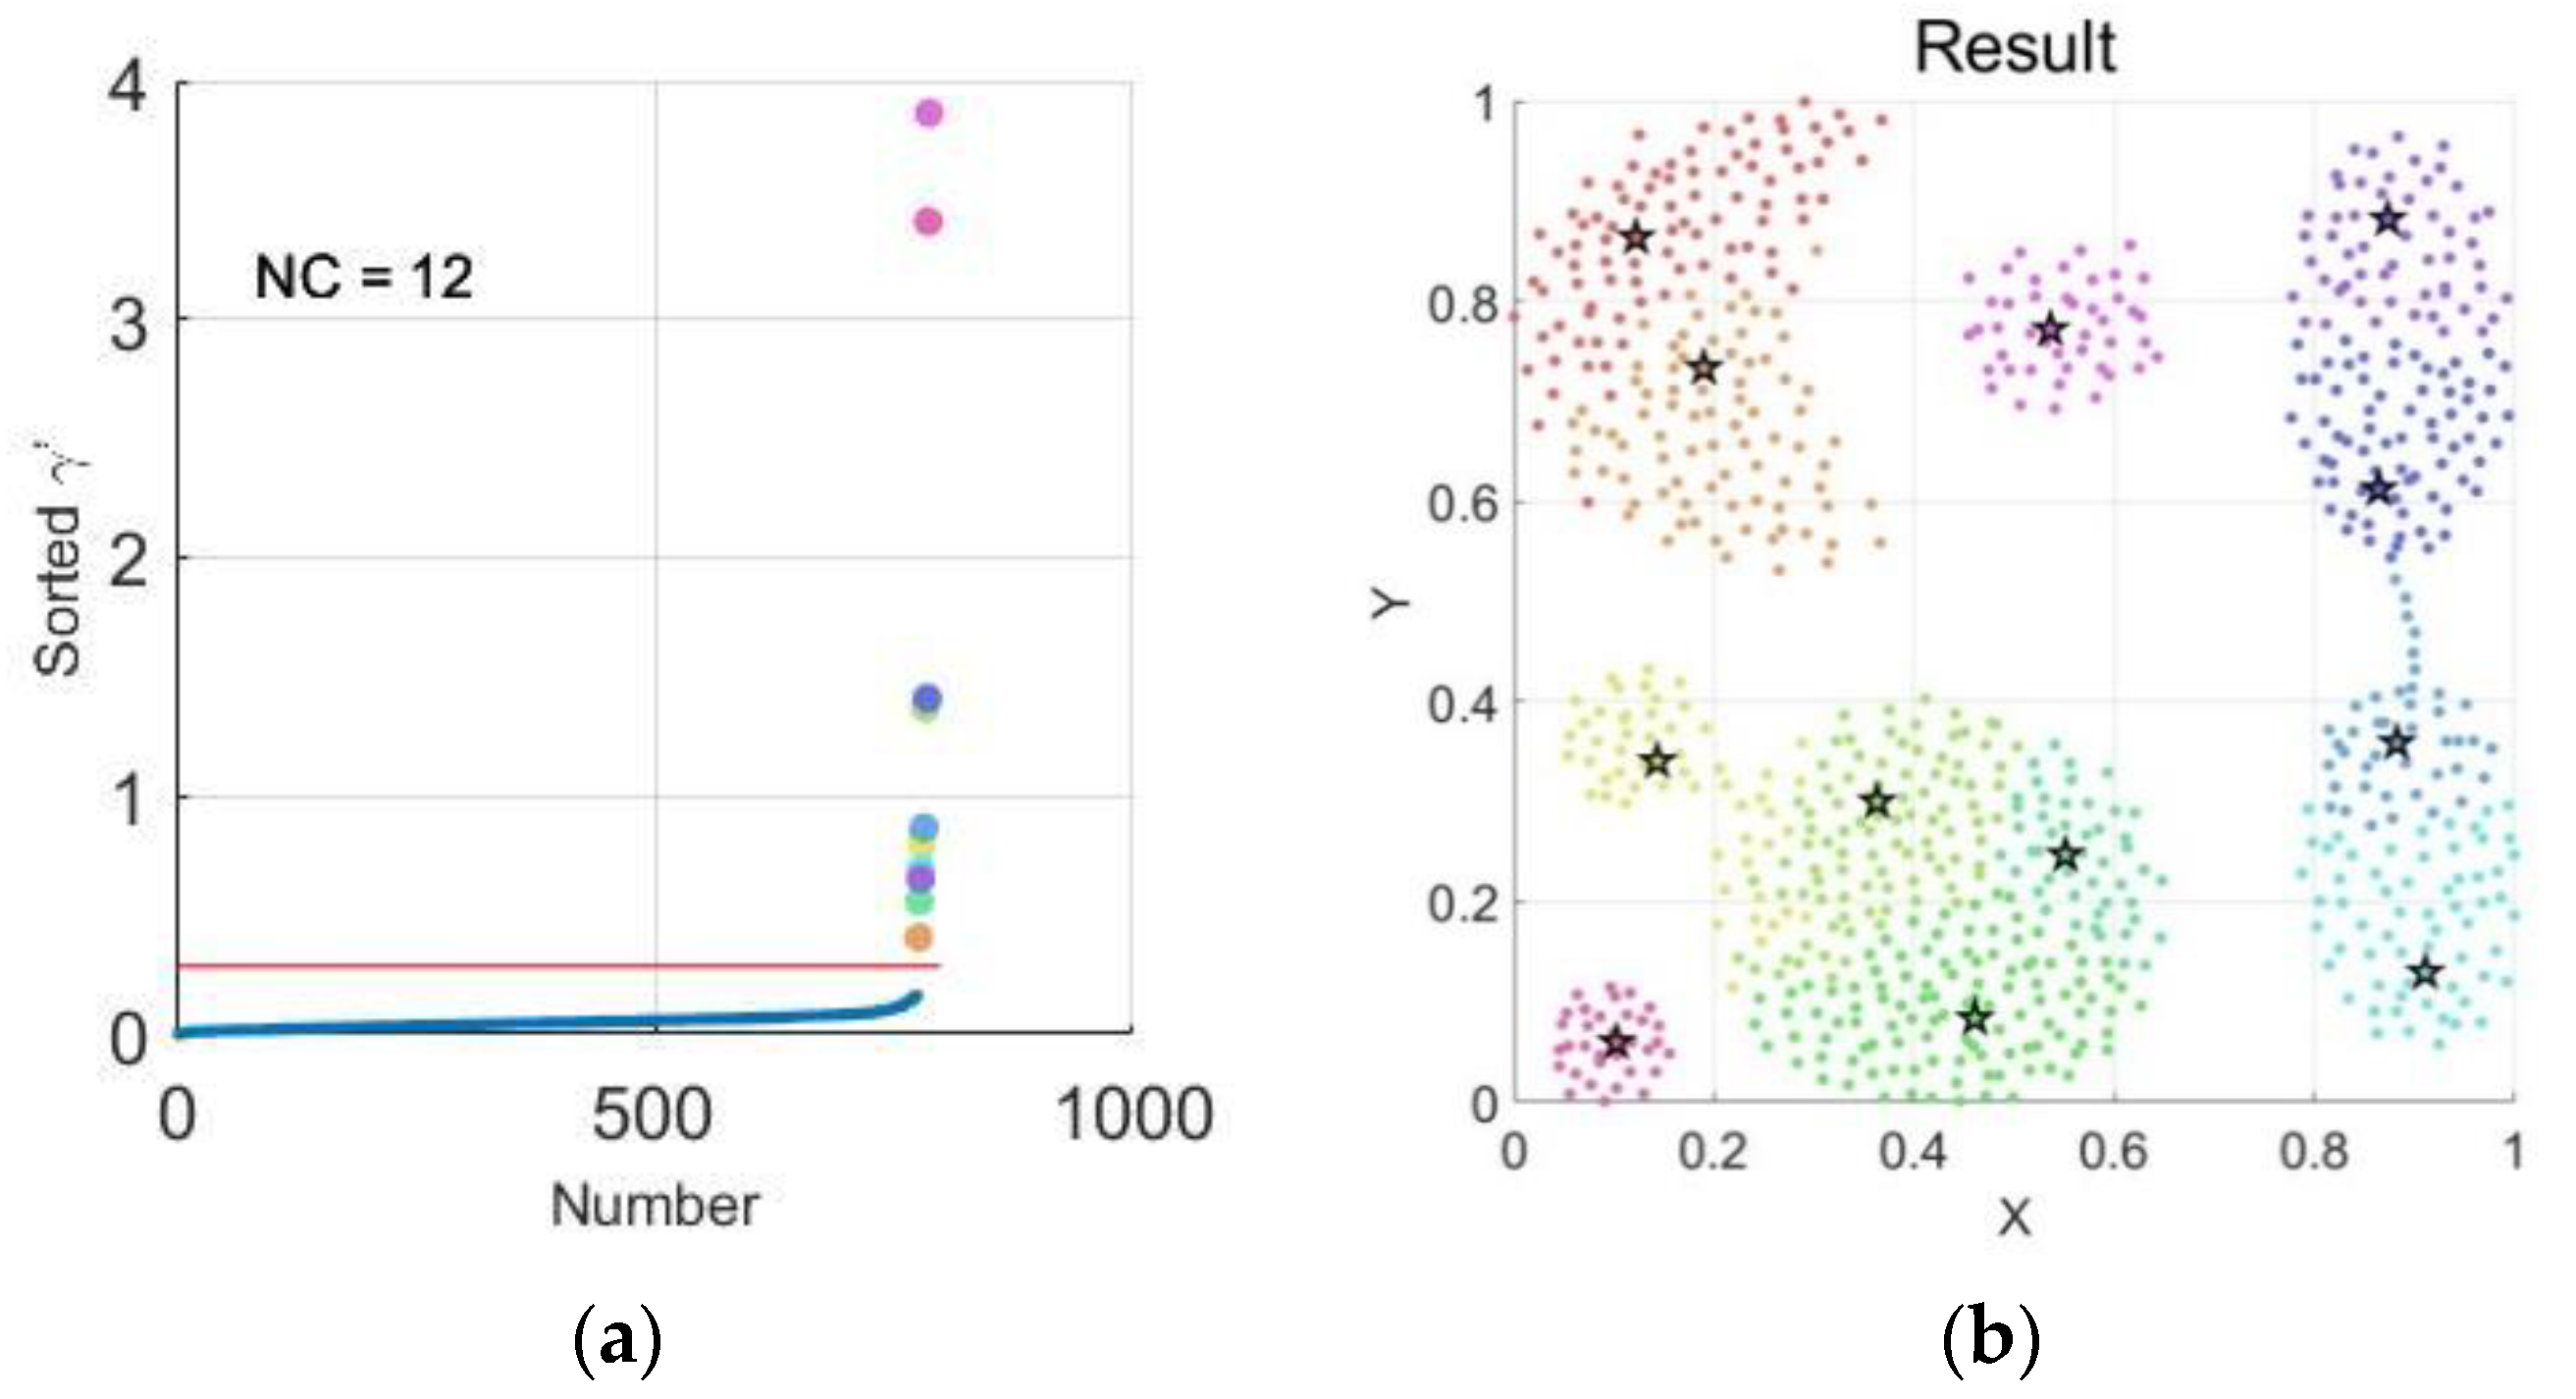
Figure 10.
Clustering results when in the Compound dataset. (a) Distribution of in the Compound dataset; (b) Clustering result of the Compound dataset.
Figure 10.
Clustering results when in the Compound dataset. (a) Distribution of in the Compound dataset; (b) Clustering result of the Compound dataset.
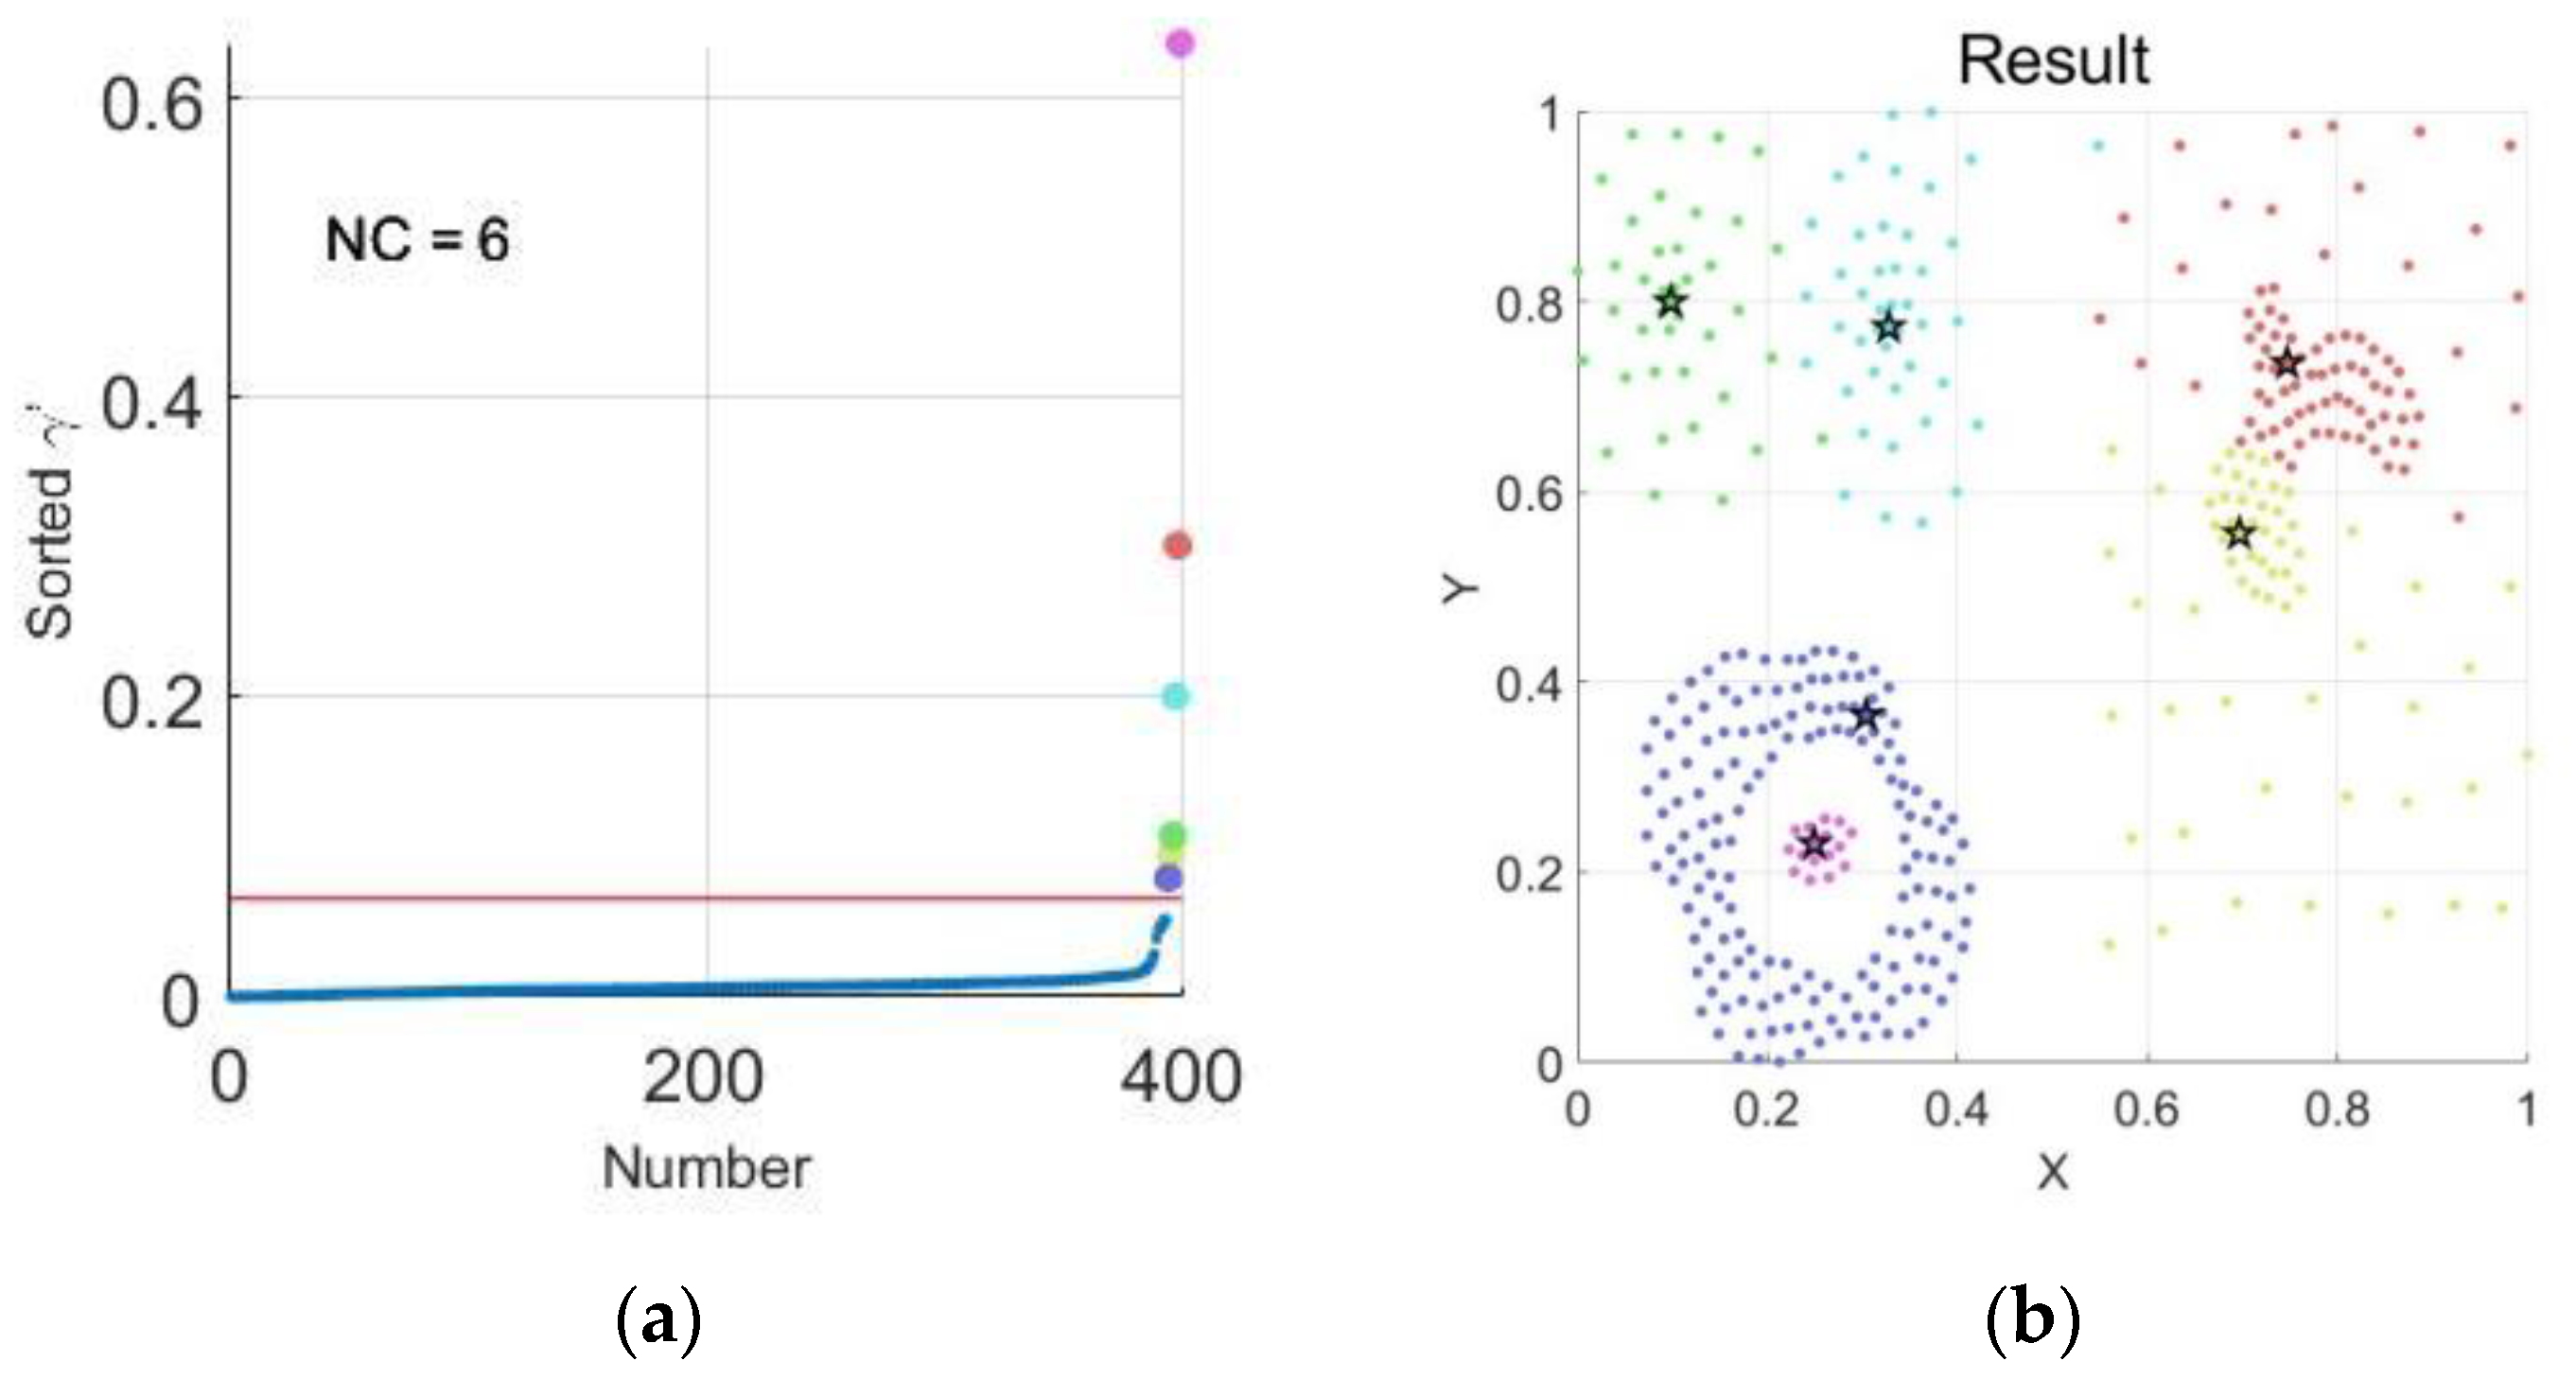
Figure 11.
Clustering results when in the Compound dataset. (a) Distribution of in the Compound dataset; (b) Clustering result of the Compound dataset.
Figure 11.
Clustering results when in the Compound dataset. (a) Distribution of in the Compound dataset; (b) Clustering result of the Compound dataset.

Figure 12.
Clustering results when in the Compound dataset. (a) Distribution of in the Compound dataset; (b) Clustering result of the Compound dataset.
Figure 12.
Clustering results when in the Compound dataset. (a) Distribution of in the Compound dataset; (b) Clustering result of the Compound dataset.
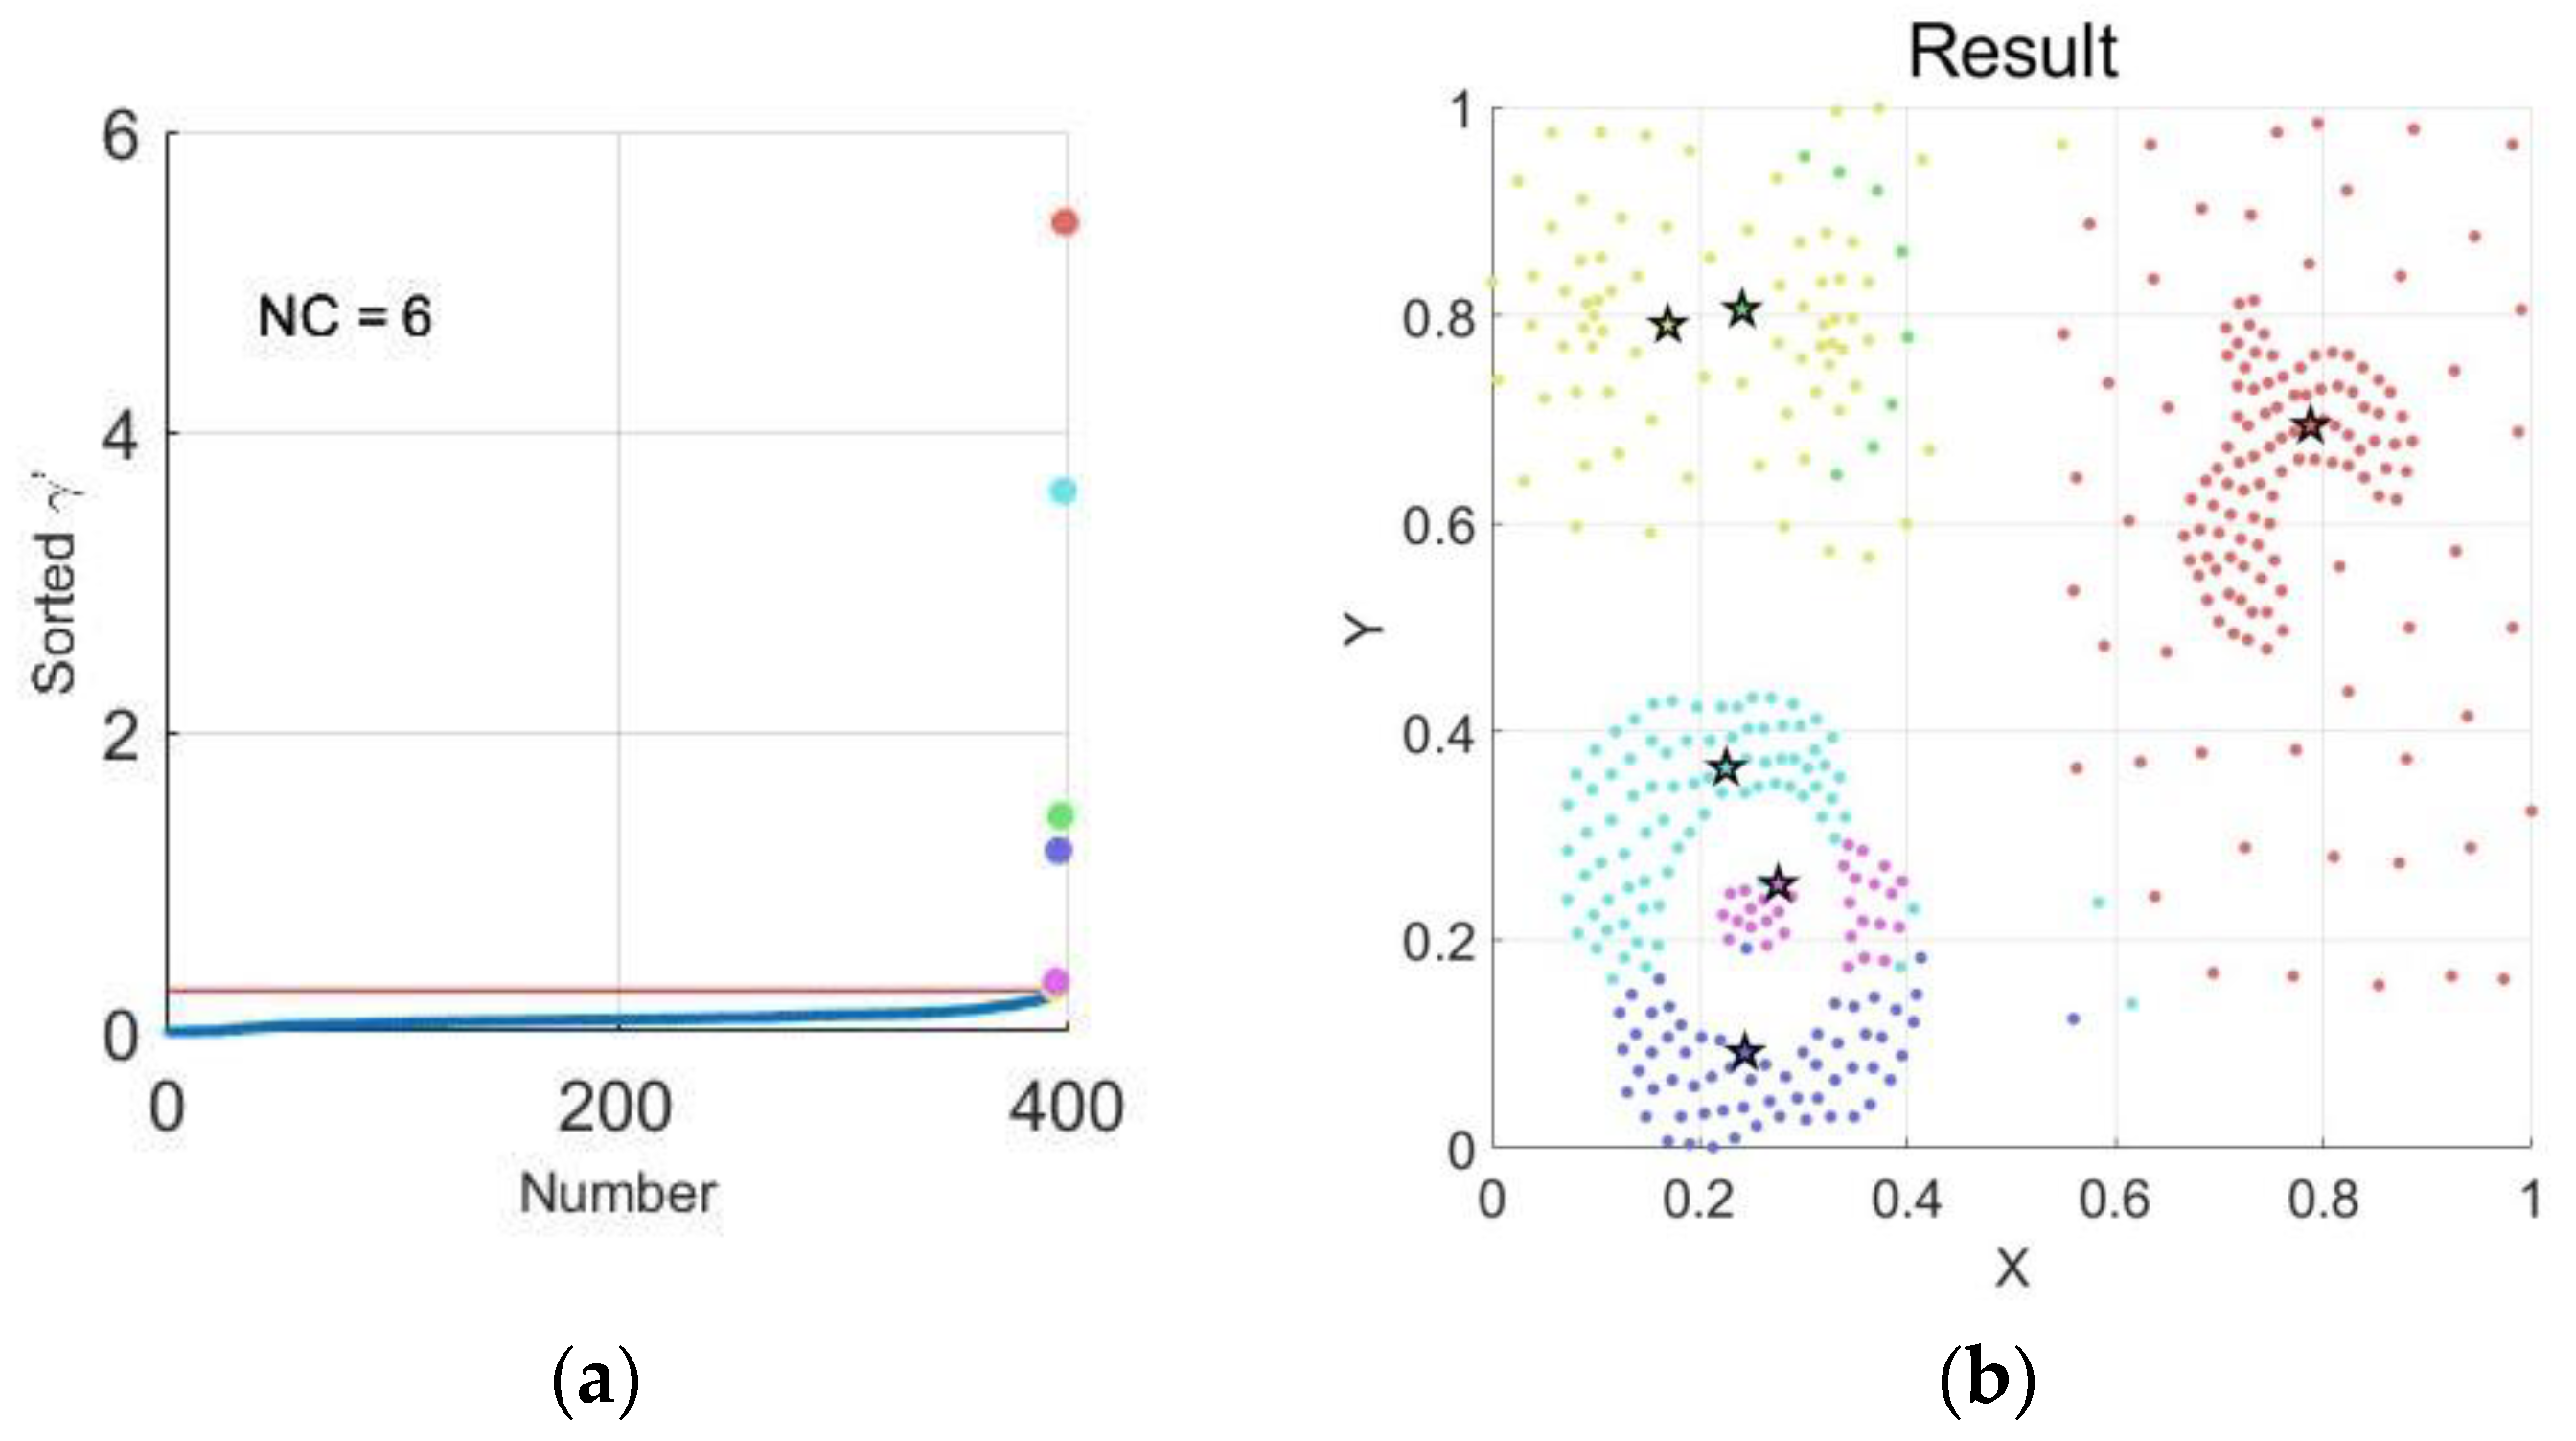
Figure 13.
The clustering results on Aggregation by the four algorithms. (a) K-means on the Aggregation; (b) CFSFDP on the Aggregation; (c) SNN-DPC on the Aggregation; (d) DPC-SNNACC on Aggregation.
Figure 13.
The clustering results on Aggregation by the four algorithms. (a) K-means on the Aggregation; (b) CFSFDP on the Aggregation; (c) SNN-DPC on the Aggregation; (d) DPC-SNNACC on Aggregation.

Figure 14.
The clustering results on Flame by the four algorithms. (a) K-means on Flame; (b) CFSFDP on Flame; (c) SNN-DPC on Flame; (d) DPC-SNNACC on Flame.
Figure 14.
The clustering results on Flame by the four algorithms. (a) K-means on Flame; (b) CFSFDP on Flame; (c) SNN-DPC on Flame; (d) DPC-SNNACC on Flame.

Figure 15.
The clustering results on Wine by four algorithms. (a) K-means on Wine; (b) CFSFDP on Wine; (c) SNN-DPC on Wine; (d) DPC–SNNACC on Wine.
Figure 15.
The clustering results on Wine by four algorithms. (a) K-means on Wine; (b) CFSFDP on Wine; (c) SNN-DPC on Wine; (d) DPC–SNNACC on Wine.
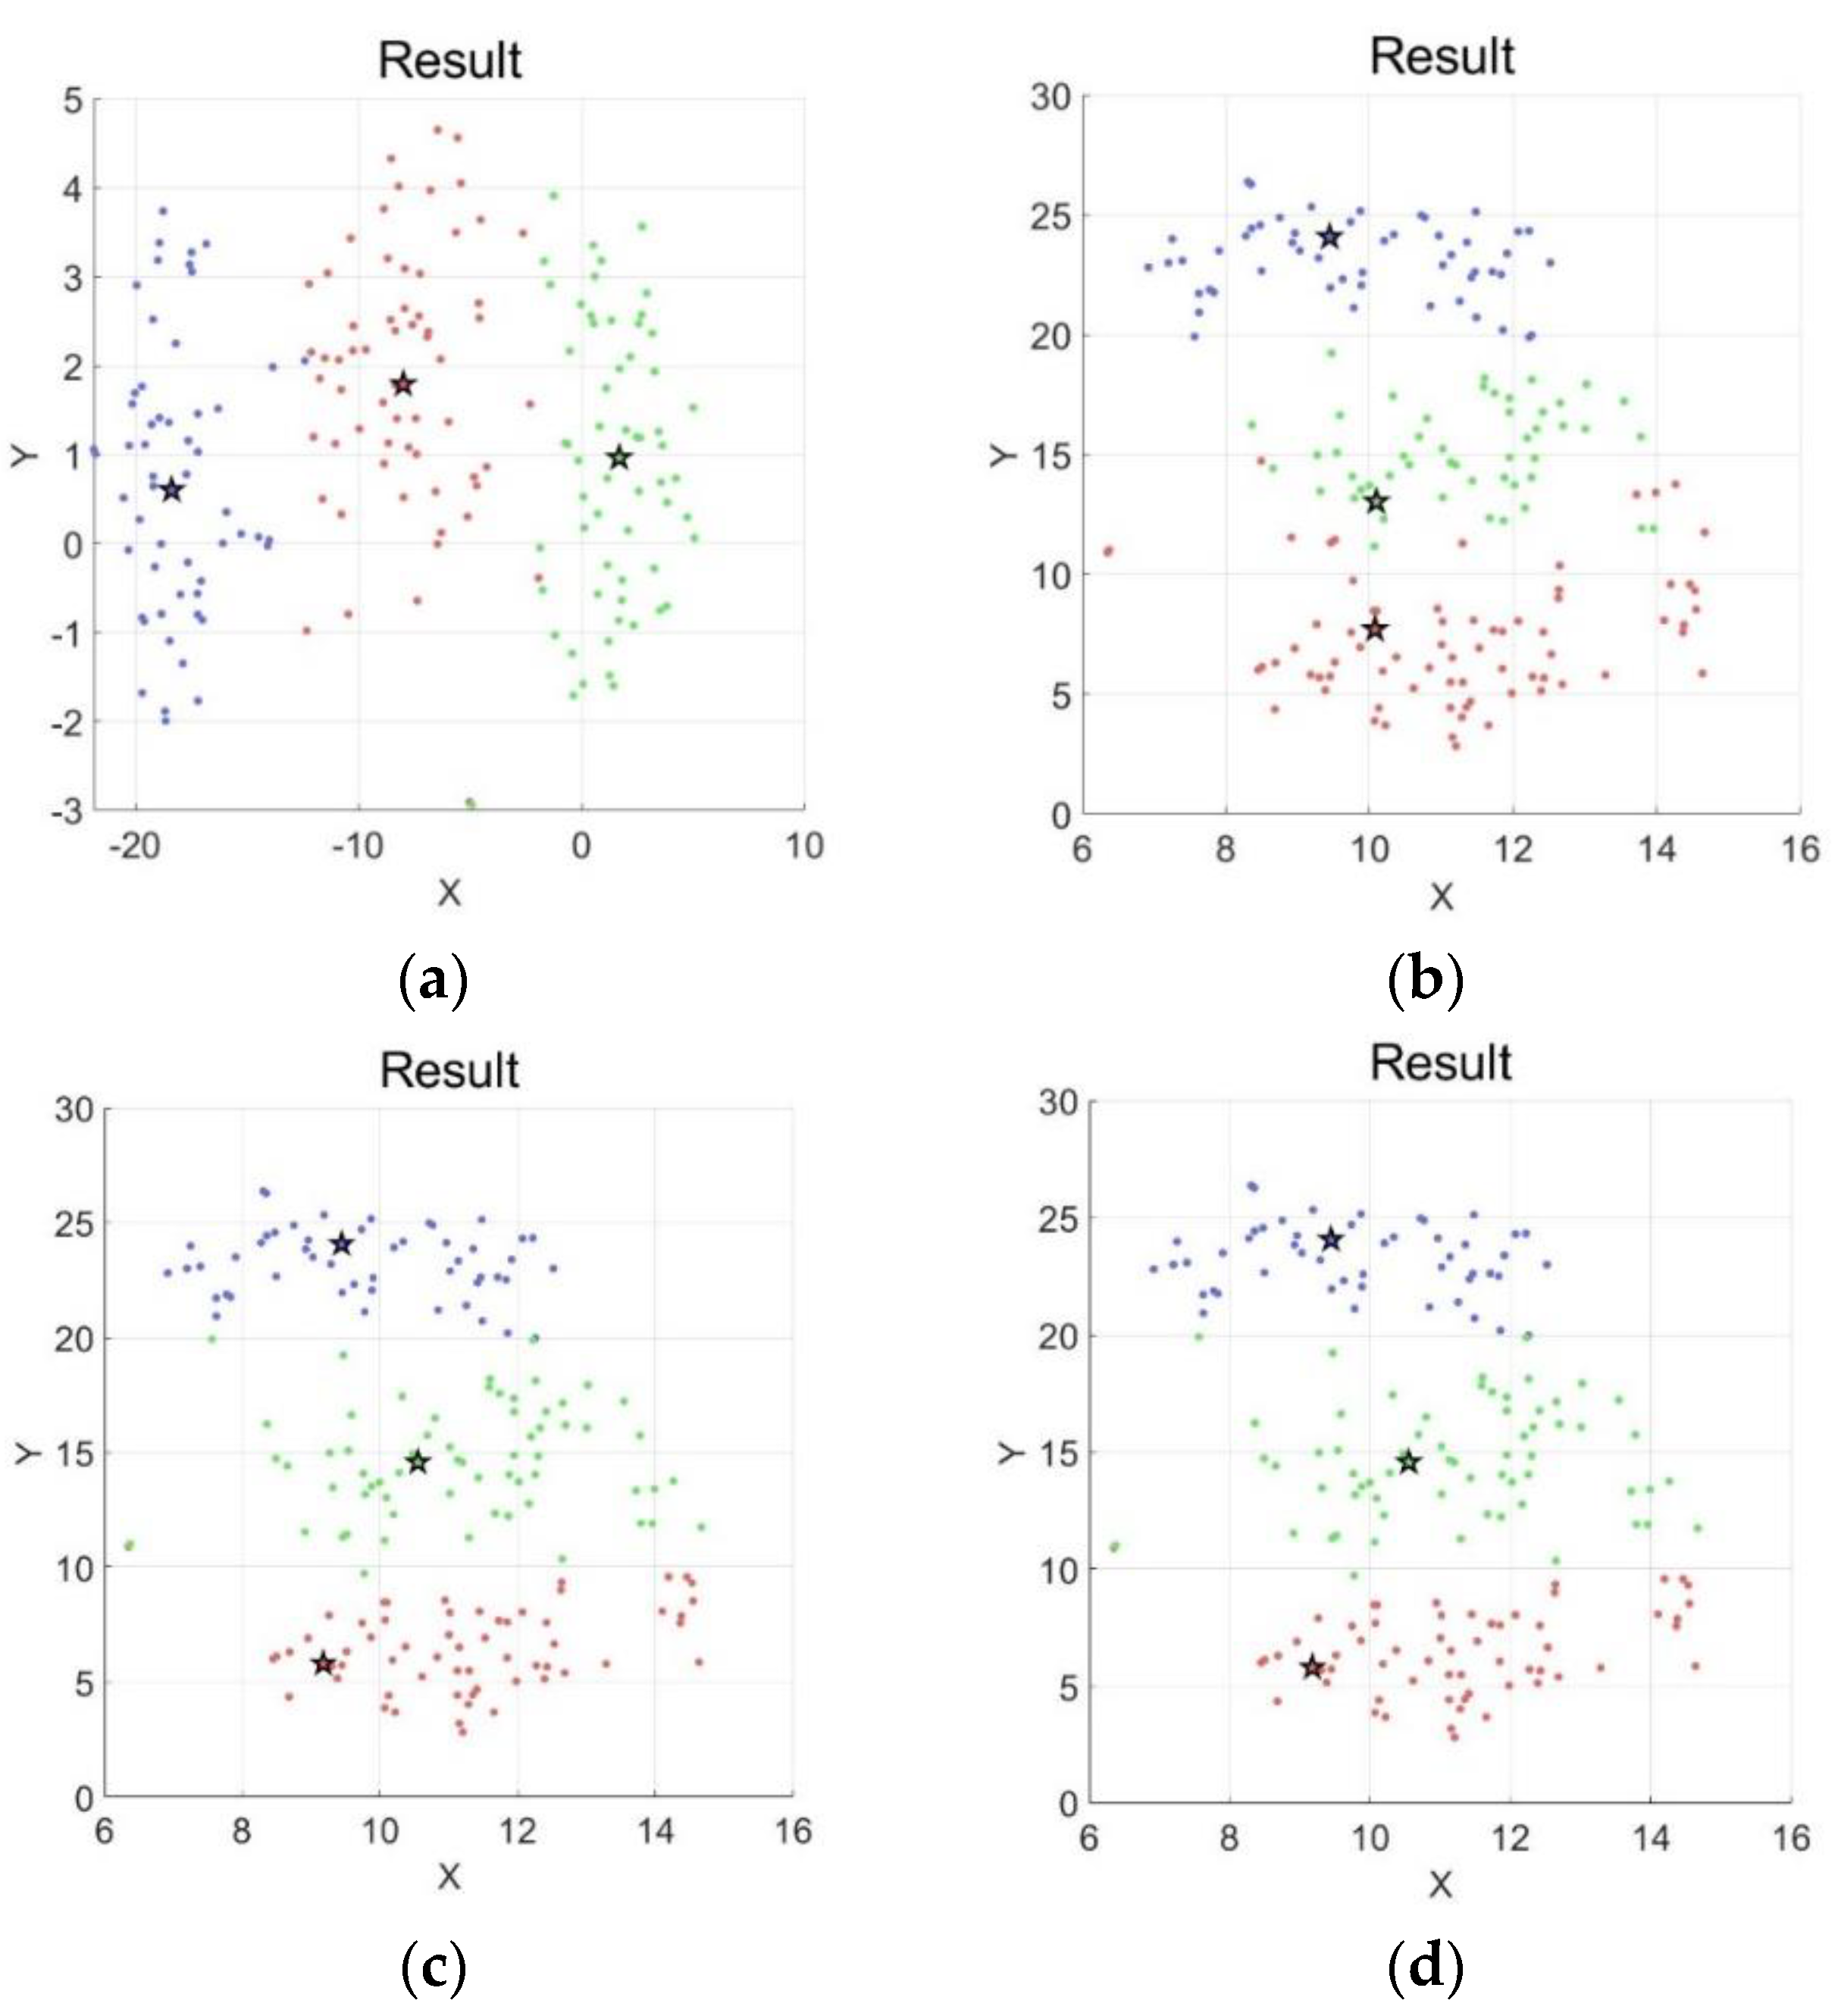
Figure 16.
The clustering results on the WDBC(Wisconsin Diagnosis Breast Cancer Database) by the four algorithms. (a) K-means on WDBC; (b) CFSFDP on WDBC; (c) SNN-DPC on WDBC; (d) DPC-SNNACC on WDBC.
Figure 16.
The clustering results on the WDBC(Wisconsin Diagnosis Breast Cancer Database) by the four algorithms. (a) K-means on WDBC; (b) CFSFDP on WDBC; (c) SNN-DPC on WDBC; (d) DPC-SNNACC on WDBC.
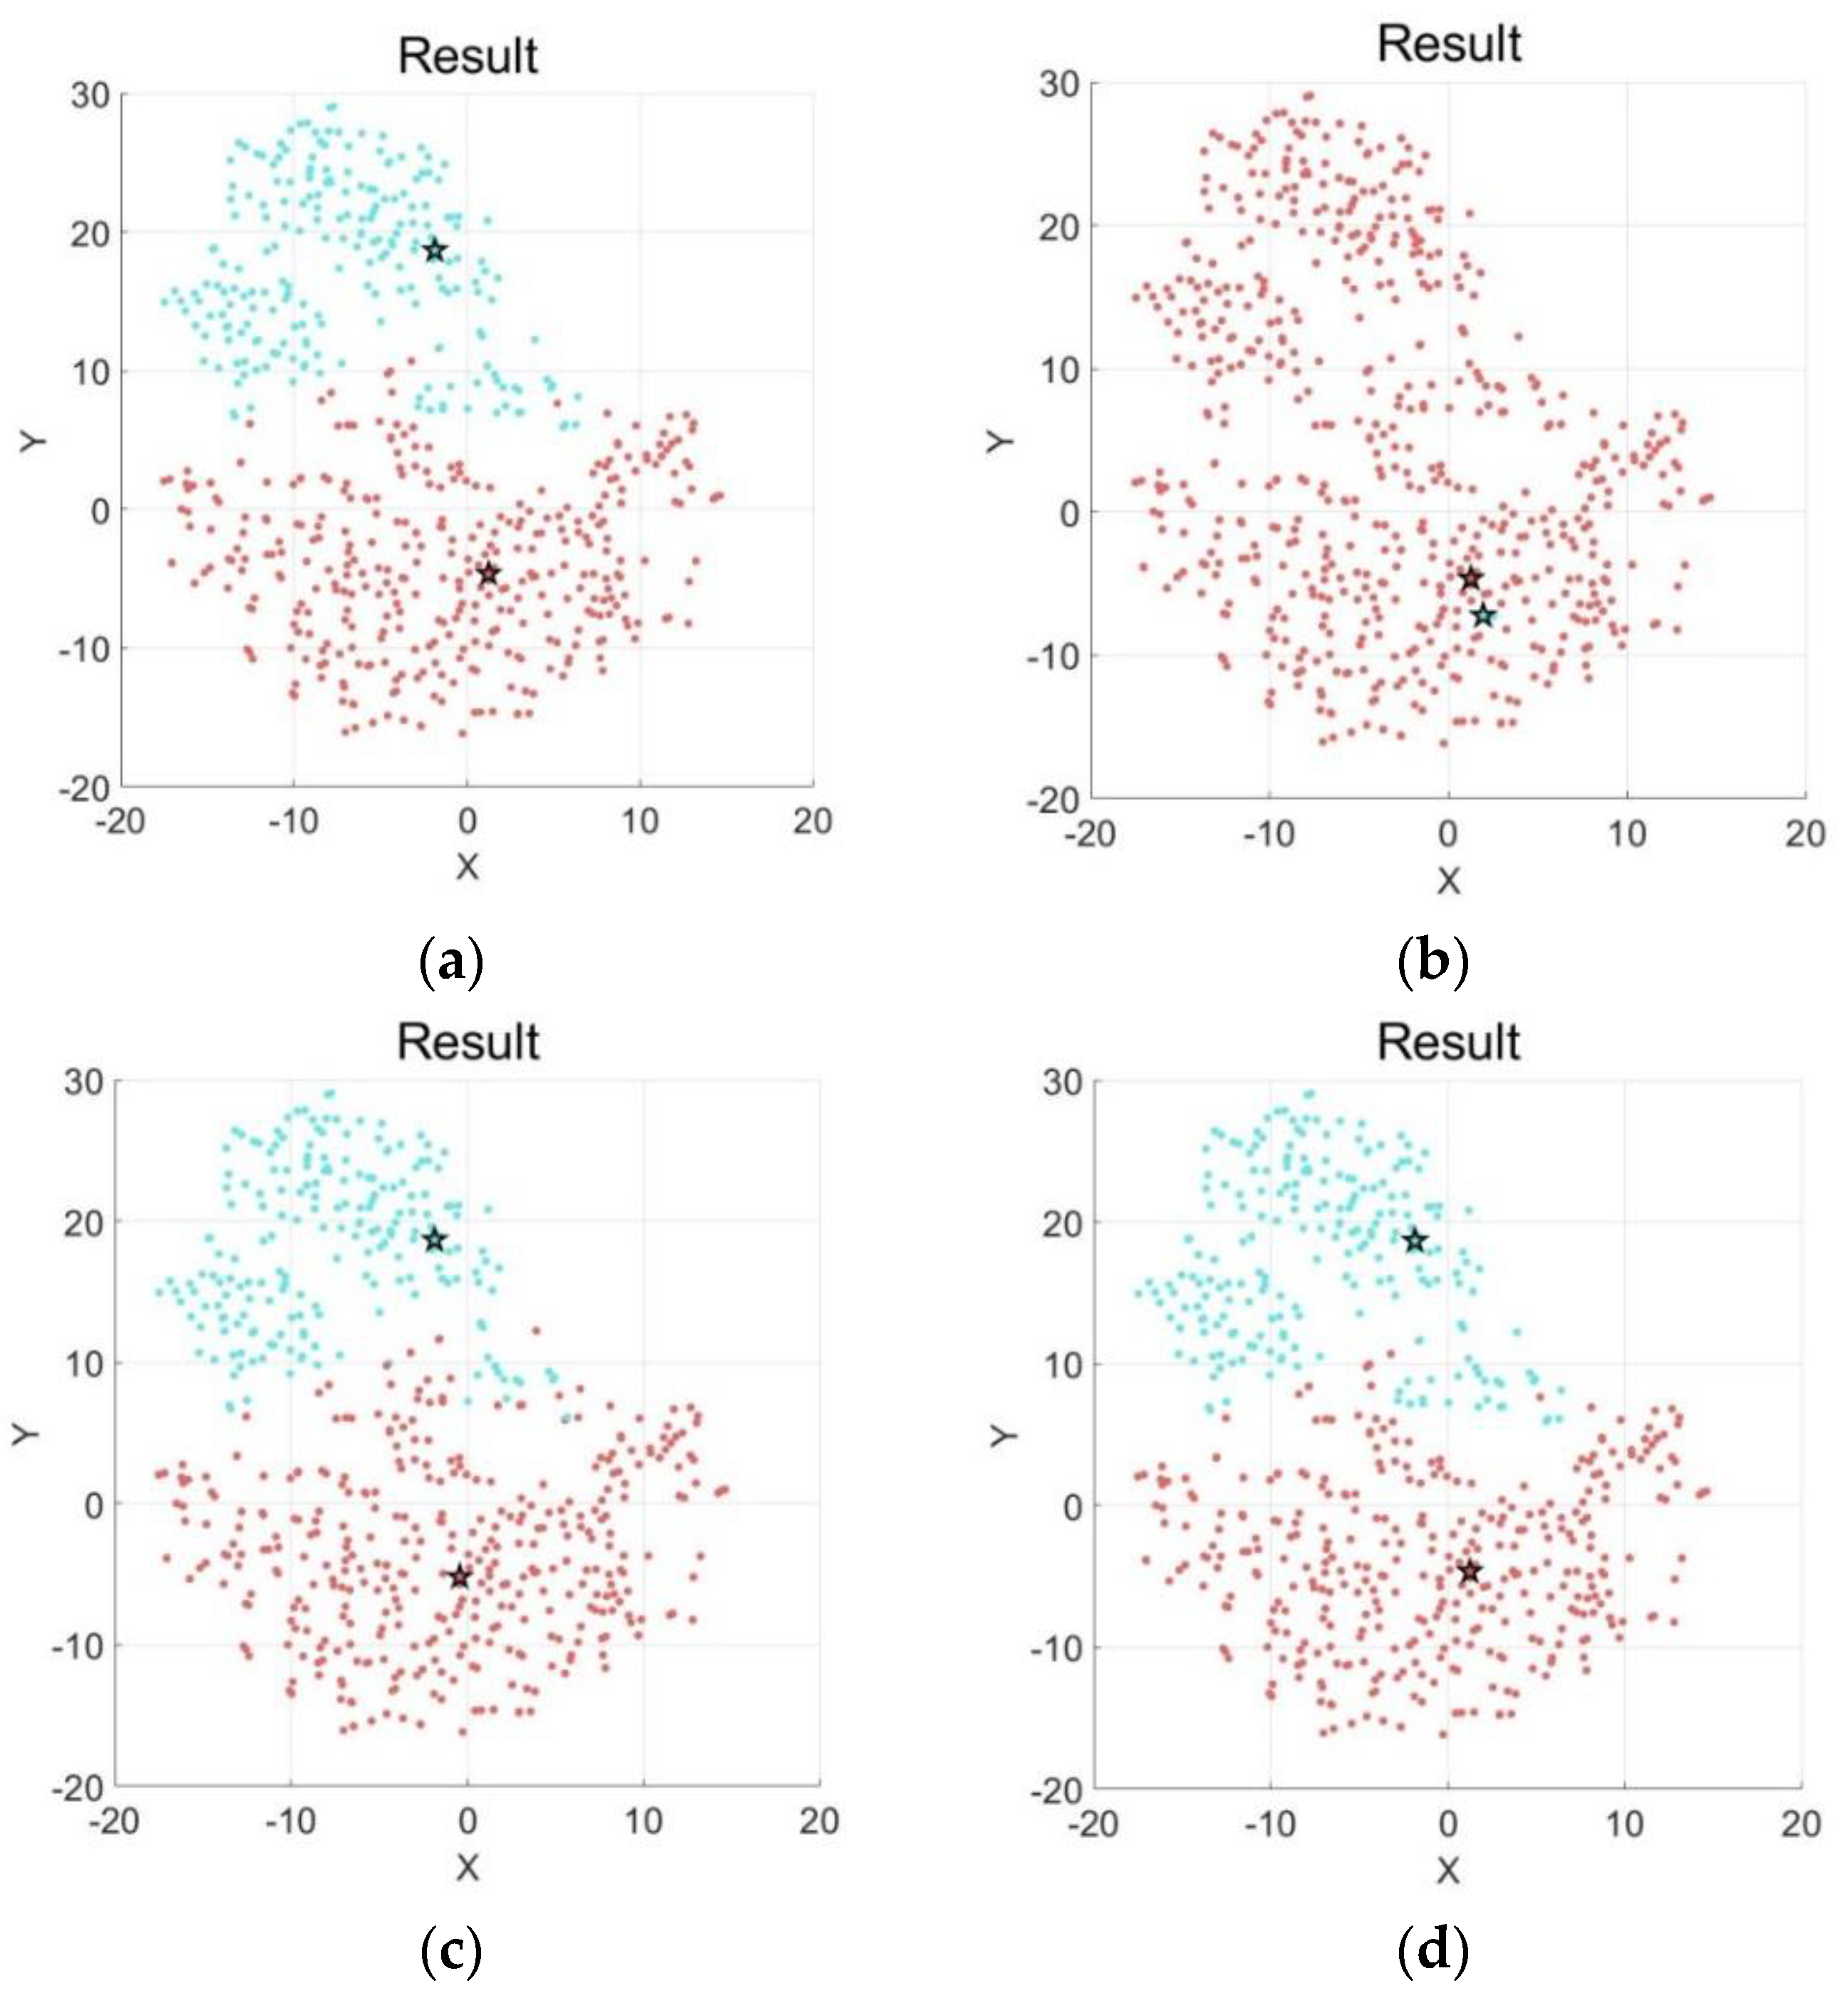
Table 1.
Ergodic matrix of the example dataset.
| Cluster 1 | Cluster 2 | |
|---|---|---|
| 3 | 0 | |
| 1 | 2 |
Table 2.
Synthetic datasets.
| Name | No. of Records | No. of Clusters | No. of Dimension |
| Aggregation | 788 | 7 | 2 |
| Spiral | 312 | 3 | 2 |
| Jain | 373 | 2 | 2 |
| R15 | 600 | 15 | 2 |
| Flame | 240 | 2 | 2 |
| Compound | 399 | 6 | 2 |
| Path-based | 300 | 3 | 2 |
| D31 | 3100 | 31 | 2 |
Table 3.
UCI(University of California, Irvine) real-datasets.
| Name | No. of Records | No. of Clusters | No. of Dimension |
| Wine | 178 | 3 | 13 |
| Iris | 150 | 3 | 4 |
| Seeds | 210 | 3 | 7 |
| WDBC | 569 | 2 | 30 |
Table 4.
Metrics corresponding to different in the Aggregation dataset.
| NMI | AMI | ARI | FMI | F-Measure | ||
|---|---|---|---|---|---|---|
| 7 | 0.9555 | 0.94998 | 0.95938 | 0.96814 | 0.97843 | |
| 12 | 0.80363 | 0.66523 | 0.51377 | 0.63036 | 0.69423 | |
| 12 | 0.80363 | 0.66523 | 0.51377 | 0.63036 | 0.69423 |
Table 5.
Metrics corresponding to different in the Compound dataset.
| NMI | AMI | ARI | FMI | F-Measure | ||
|---|---|---|---|---|---|---|
| 6 | 0.8361 | 0.80864 | 0.83369 | 0.87443 | 0.86421 | |
| 6 | 0.69173 | 0.68154 | 0.51401 | 0.62995 | 0.66917 | |
| 6 | 0.69173 | 0.68154 | 0.51401 | 0.62995 | 0.66917 |
Table 6.
Performances of different clustering algorithm on different synthetic datasets.
| Metrics | NMI | AMI | ARI | FMeasure | Accuracy | FMI | NC | Time/s |
|---|---|---|---|---|---|---|---|---|
| Aggregation dataset | ||||||||
| K-means | 0.8499 | 0.8008 | 0.7099 | 0.8169 | 0.9086 | 0.7731 | 7 | 0.8363 |
| CFSFDP | 0.8941 | 0.8596 | 0.7548 | 0.8477 | 0.9543 | 0.8071 | 7 | 0.6420 |
| SNN-DPC | 0.955 | 0.9499 | 0.9593 | 0.9787 | 0.9784 | 0.9681 | 7 | 1.1680 |
| DPC-SNNACC | 0.955 | 0.9499 | 0.9593 | 0.9787 | 0.9784 | 0.9681 | 7 | 1.1938 |
| Spiral dataset | ||||||||
| K-means | 0.003 | 0 | 0 | 0.3492 | 0.3462 | 0.3276 | 3 | 0.2830 |
| CFSFDP | 1 | 1 | 1 | 1 | 1 | 1 | 3 | 0.4221 |
| SNN-DPC | 1 | 1 | 1 | 1 | 1 | 1 | 3 | 0.4981 |
| DPC-SNNACC | 1 | 1 | 1 | 1 | 1 | 1 | 3 | 0.5000 |
| Jain dataset | ||||||||
| K-means | 0.5287 | 0.4915 | 0.5766 | 0.8876 | 0.8820 | 0.8199 | 2 | 0.2292 |
| CFSFDP | 0.6456 | 0.6103 | 0.7055 | 0.9251 | 0.9222 | 0.8779 | 2 | 0.4116 |
| SNN-DPC | 0.5604 | 0.5211 | 0.5935 | 0.8927 | 0.887 | 0.8272 | 2 | 0.5303 |
| DPC-SNNACC | 0.5068 | 0.4667 | 0.5146 | 0.8680 | 0.8605 | 0.7904 | 2 | 0.6070 |
| R15 dataset | ||||||||
| K-means | 0.9942 | 0.9937 | 0.9927 | 0.9966 | 0.9966 | 0.9932 | 15 | 0.4304 |
| CFSFDP | 0.9942 | 0.9937 | 0.9927 | 0.9966 | 0.9966 | 0.9932 | 15 | 0.7821 |
| SNN-DPC | 0.9942 | 0.9937 | 0.9927 | 0.9966 | 0.9966 | 0.9932 | 15 | 0.9916 |
| DPC-SNNACC | 0.9942 | 0.9937 | 0.9927 | 0.9966 | 0.9966 | 0.9932 | 15 | 1.0347 |
| Flame dataset | ||||||||
| K-means | 0.4843 | 0.4692 | 0.5117 | 0.8611 | 0.8583 | 0.7643 | 2 | 0.2755 |
| CFSFDP | 0.4131 | 0.4030 | 0.3269 | 0.7903 | 0.7873 | 0.6786 | 2 | 0.3983 |
| SNN-DPC | 0.8993 | 0.8974 | 0.9501 | 0.9875 | 0.9875 | 0.9768 | 2 | 0.4230 |
| DPC-SNNACC | 0.8993 | 0.8974 | 0.9501 | 0.9875 | 0.9875 | 0.9768 | 2 | 0.4750 |
| Compound dataset | ||||||||
| K-means | 0.6834 | 0.6466 | 0.4988 | 0.6210 | 0.7894 | 0.6114 | 6 | 0.6626 |
| CFSFDP | 0.7373 | 0.6968 | 0.5460 | 0.7183 | 0.8320 | 0.6491 | 6 | 0.7726 |
| SNN-DPC | 0.8526 | 0.8451 | 0.8348 | 0.8603 | 0.8746 | 0.8752 | 6 | 0.6762 |
| DPC-SNNACC | 0.8361 | 0.8286 | 0.8336 | 0.8642 | 0.8696 | 0.8744 | 6 | 0.6807 |
| Path-based dataset | ||||||||
| K-means | 0.5469 | 0.5098 | 0.4613 | 0.6959 | 0.7433 | 0.6616 | 3 | 0.2523 |
| CFSFDP | 0.5529 | 0.5165 | 0.4678 | 0.7015 | 0.7466 | 0.6653 | 3 | 0.4284 |
| SNN-DPC | 0.9013 | 0.9 | 0.9293 | 0.9767 | 0.9766 | 0.9529 | 3 | 0.7557 |
| DPC-SNNACC | 0.9013 | 0.9 | 0.9293 | 0.9767 | 0.9766 | 0.9529 | 3 | 0.7920 |
| D31 dataset | ||||||||
| K-means | 0.9576 | 0.9526 | 0.9162 | 0.9462 | 0.9480 | 0.9192 | 31 | 1.9972 |
| CFSFDP | 0.9577 | 0.9556 | 0.9363 | 0.9683 | 0.9683 | 0.9384 | 31 | 2.2940 |
| SNN-DPC | 0.9658 | 0.9642 | 0.9509 | 0.9758 | 0.9757 | 0.9525 | 31 | 11.6866 |
| DPC-SNNACC | 0.9658 | 0.9642 | 0.9509 | 0.9758 | 0.9757 | 0.9525 | 31 | 11.0848 |
Table 7.
Performances of the different clustering algorithms on different UCI datasets.
| Metrics | NMI | AMI | ARI | FMeasure | Accuracy | FMI | NC | Time/s |
|---|---|---|---|---|---|---|---|---|
| Wine dataset | ||||||||
| K-means | 0.8346 | 0.8301 | 0.8471 | 0.9488 | 0.9494 | 0.8984 | 3 | 1.4173 |
| CFSFDP | 0.7104 | 0.7064 | 0.6723 | 0.8775 | 0.8821 | 0.7834 | 3 | 1.7788 |
| SNN-DPC | 0.8781 | 0.8735 | 0.8991 | 0.9661 | 0.9662 | 0.9329 | 3 | 1.2852 |
| DPC-SNNACC | 0.8781 | 0.8735 | 0.8991 | 0.9661 | 0.9662 | 0.9329 | 3 | 1.9896 |
| Iris dataset | ||||||||
| K-means | 0.7419 | 0.7331 | 0.7163 | 0.8852 | 0.8866 | 0.8112 | 3 | 0.9315 |
| CFSFDP | 0.6586 | 0.5741 | 0.4530 | 0.7095 | 0.6667 | 0.6855 | 3 | 1.3219 |
| SNN-DPC | 0.9143 | 0.9123 | 0.9222 | 0.9732 | 0.9733 | 0.9478 | 3 | 1.3140 |
| DPC-SNNACC | 0.9143 | 0.9123 | 0.9222 | 0.9732 | 0.9733 | 0.9478 | 3 | 1.3814 |
| Seeds dataset | ||||||||
| K-means | 0.6654 | 0.6614 | 0.6934 | 0.8858 | 0.8857 | 0.7949 | 3 | 1.2054 |
| CFSFDP | 0.7238 | 0.7172 | 0.7341 | 0.8977 | 0.9 | 0.8230 | 3 | 1.4785 |
| SNN-DPC | 0.7513 | 0.7486 | 0.7962 | 0.9291 | 0.9285 | 0.8636 | 3 | 1.3827 |
| DPC-SNNACC | 0.7513 | 0.7486 | 0.7962 | 0.9291 | 0.9285 | 0.8636 | 3 | 1.4527 |
| WDBC dataset | ||||||||
| K-means | 0.6232 | 0.6109 | 0.7301 | 0.927 | 0.9279 | 0.8769 | 2 | 3.2554 |
| CFSFDP | — | — | — | 0.6849 | 0.6274 | 0.7256 | 2 | 3.9900 |
| SNN-DPC | 0.7568 | 0.7521 | 0.8503 | 0.9611 | 0.9613 | 0.9304 | 2 | 3.7370 |
| DPC-SNNACC | 0.6926 | 0.6895 | 0.799 | 0.9474 | 0.9478 | 0.9054 | 2 | 4.2873 |
Table 8.
Comparison of the time complexity of different algorithms.
| Algorithm | Time Complexity |
|---|---|
| K-means | |
| CFSFDP | |
| SNN-DPC | |
| DPC-SNNACC |
Publisher’s Note: MDPI stays neutral with regard to jurisdictional claims in published maps and institutional affiliations. |
© 2020 by the authors. Licensee MDPI, Basel, Switzerland. This article is an open access article distributed under the terms and conditions of the Creative Commons Attribution (CC BY) license (http://creativecommons.org/licenses/by/4.0/).
Share and Cite
MDPI and ACS Style
Lv, Y.; Liu, M.; Xiang, Y. Fast Searching Density Peak Clustering Algorithm Based on Shared Nearest Neighbor and Adaptive Clustering Center. Symmetry 2020, 12, 2014. https://doi.org/10.3390/sym12122014
AMA Style
Lv Y, Liu M, Xiang Y. Fast Searching Density Peak Clustering Algorithm Based on Shared Nearest Neighbor and Adaptive Clustering Center. Symmetry. 2020; 12(12):2014. https://doi.org/10.3390/sym12122014
Chicago/Turabian StyleLv, Yi, Mandan Liu, and Yue Xiang. 2020. "Fast Searching Density Peak Clustering Algorithm Based on Shared Nearest Neighbor and Adaptive Clustering Center" Symmetry 12, no. 12: 2014. https://doi.org/10.3390/sym12122014
Note that from the first issue of 2016, this journal uses article numbers instead of page numbers. See further details here.