1. Introduction
Effective transport worldwide demands for reduction of the time spent travelling, and high-speed railway lines have nowadays become of uttermost importance. Increasing train speed is technically possible with recent advances in vehicles, such as better propulsion systems and optimized aerodynamics [
1]. However, in order to reach the full velocity range, railway infrastructures must tolerate these speeds, while preserving all the safety specifications. One of the most critical infrastructures, and the one that will be analysed in this paper, are bridges. Moving trains produce periodical forces. This periodicity is caused by the constant separation between axles, which induces a vibrational response on the bridge [
2,
3,
4,
5,
6,
7]. The acceptable values for the amplitude and acceleration of these vibrations are regulated to preserve the integrity of the infrastructure. To follow the demand of increasing speeds in conventional railway infrastructures, while following all the safety regulations, several vibration mitigation systems have been proposed and, sometimes, implemented in existing bridges.
The Tuned Mass Damper (TMD) system is probably the most studied method for vibrational response reduction in bridges and buildings. Its popularity is due to its simplicity and cost-efficient implementation [
8,
9,
10,
11,
12]. However, TMD systems are designed and tuned to a specific frequency value—typically, the first flexural mode of the structure. This may cause problems, since the added mass of different trains to the main structure modifies its natural frequencies.
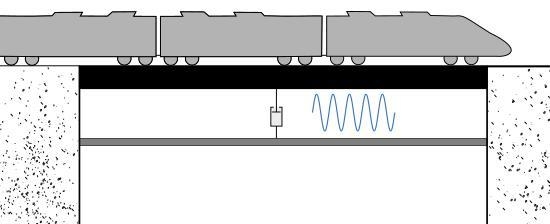
An alternative method for bridges is the Auxiliary Beam (AB) or double beam system [
13,
14,
15,
16]. The AB system consists of an extra beam installed under the bridge deck, being both connected by a viscous damper; see
Figure 1. The viscous damper of the system will dissipate part of the energy generated by the moving loads, reducing both the vertical acceleration and the displacement of the bridge. The tuning problem of TMDs is now avoided, since the viscous damper is capable of working properly in a wider range of frequencies. Also, this system is particularly interesting for the retrofitting of existing infrastructures, since it can be installed while the bridge is in use.
The design parameters for the AB system are the damper characteristics and the dimensions of the auxiliary beam. In this work, we study a generic AB system in order to optimize its parameters. The aim is to obtain the maximum reduction of the vibrations caused by the passing train at the mid-span of the bridge (the critical section). To characterise the dynamic behaviour of the system with a moving train, a Finite Element (FE) model was designed. With a full transient implicit analysis, acceleration and displacement values were obtained at any time.
To perform this optimization process, we implemented a Genetic Algorithm (GA) in MATLAB R2016b (MathWorks, MA USA) [
17], which is a valuable tool for problems involving several parameters, especially if analytical solutions or simplifications can be hardly developed [
18]. Evolutionary algorithms provide the additional advantage of working without derivatives (useful for the fitting of non-smooth functions) and being easily adapted to multi-objective problems. These techniques are especially useful when combined with reduced models, which allow for a fast evaluation of each individual (or parametrized) case [
19].
Consequently, in this paper, a new methodology for tackling this problem is presented, applying an optimization tool to a computationally affordable model. To allow for the use of FE models (which can be as realistic and complicated as the computational resources permit), a classic commercial FE software was employed together with an heuristic technique for the optimization, implemented in a different software. The FE model used at this point is a very simplified one, the most important simplification being the reduction to a two-dimensional case. This is possible since the geometries of the bridge and the train, as well as the loads of the train, are essentially symmetrical about the longitudinal plane. Once the tool has proven its viability, more complex models can be added.
The paper is organized as follows. The problem is fully described in the next section. In
Section 3, the FE model is presented and validated with published results. In
Section 4, the genetic algorithm used is described in detail. Finally, the results and discussion are presented in
Section 5, and the conclusions in
Section 6.
2. Problem Definition
To demonstrate the methodology that we present in this paper, a particular problem was studied. However, this methodology can be extended to any problem of interest simply by modifying the FE model. Also, more dampers can be added, increasing the number of variables for the optimization if we allow for different damper coefficients. In conclusion, any configuration is susceptible of being optimized as long as it can be parametrized to define the variables of interest.
The FE model developed for this study consists of a generic AB system connected to a 20 m single span bridge. The bridge was considered to be a simply supported slab of homogeneous concrete with a rectangular section of 5 m width and 1.2 m thickness (moment of inertia of 0.72 m
4), according to the data provided in a national regulation technical note [
20]. The material chosen for the auxiliary beam was steel. This element is also simply supported at both ends. Both elements were connected by one viscous damper, as described before.
One of the design parameters was the size of the auxiliary beam. More specifically, the moment of inertia was selected as the parameter for variance, and the dimensions of the beam were computed from it. In order to simplify this calculation, the cross-section of the beam was considered to be squared, although the results can be generalized to any cross-section. The second design parameter involves the viscous damper. The damping coefficient was selected to be the other variable, since it is a direct input to the FE model.
Both parameters—the moment of inertia and the damping coefficient—were normalized in order to get more generalizable results. The moment of inertia of the AB was normalized to the moment of inertia of the bridge itself, obtaining a relation between both cross-sections (
):
The damper coefficient was also normalized, in this case with the structural damping of the bridge. Therefore, the normalized damping
results in:
where the structural damping of the bridge is obtained from
k being the flexural stiffness of the bridge and
a Rayleigh coefficient that allows to define the damping matrix [
21]. Only
was used because the vibrations occur in the vicinity of the first natural frequency of the bridge, and
was computed using such a frequency and the value of the structural damping coefficient (2% according to [
20]). Furthermore, a comparative analysis (using both Rayleigh parameters and only
) provided identical acceleration responses over time, and the maximum value only differs for less than 0.7 percent. Then, these non-dimensional parameters are the variables to optimize in our study.
In order to select a train type and a velocity to study, we performed a parametric study of seven European high-speed trains whose data was available in [
20]. In this study, all the trains were simulated passing the bridge (without an AB system) at speeds ranging from 100 to 400 km/h, and the maximum acceleration (in modulus) that appeared in the middle of the span of the bridge was recorded. The results of this analysis are shown in
Figure 2.
It can be seen that the train EUROSTAR 373/1 travelling at 330 km/h produces the biggest acceleration peak below 350 km/h. The Virgin train produces a greater acceleration value at 400 km/h; however, the evolution of this acceleration with velocity is smoother at lower speeds. Thus, the case study will be the EUROSTAR train at 330 km/h with the bridge-beam configuration described previously.
3. Finite Element Model
The dynamic problem involved in this optimization process can be solved with different techniques. One approach is the modal superposition method [
13]. However, this approach simplifies the dynamic loads (caused by train traffic) to harmonic loads, which are then projected into the modal space to solve the problem. Furthermore, this method is not suitable to solve non-linearities in the problem. (Although they are not addressed in this work, we also provide the possibility of using them in the future, for example, with the addition of non-linear dampers).
On the other hand, the full integration methodology presented in this paper allows for the inclusion of non-linear dampers and other kinds of non-linearities in a straightforward way.
In this work, the structural problem is solved as a FE model, with an implicit integration in time. Since the execution of the optimization algorithm requires a large number of simulations in order to evaluate the partial results, the model must be lightweight. To obtain a reliable and robust model with limited CPU requirements, one-dimensional elements were employed. As it is shown later, this model has been validated with current regulations and bibliography results.
The model was constructed with the software ANSYS v17 (ANSYS Inc., Canonsburg, PA, USA). Both the deck of the bridge and the auxiliary beam were modelled as beam elements. In particular, we used the element BEAM188 provided by the program, which is based on Timoshenko beam theory with shear-deformation effects [
22]. The number of elements was determined with a mesh sensitivity analysis, concluding that eleven elements (for each beam) were sufficient to produce consistent results. To model the damper, the element COMBIN14 was employed. The only value needed for this element was the damping coefficient. Given the symmetry of the model, the study was two-dimensional (in the plane containing both beams).
There are several ways to model the moving train, particularly the train–bridge interactions. The most common ones are the moving loads, moving mass, and moving suspension mass models. For our purpose, the train was modelled as a set of moving loads, since it is the easiest and fastest model. Although this model is a simplification of the real behaviour, the solution is not critically changed. As stated in [
10], the mass that the train would add to the structure only causes a change in the resonant frequencies below 3%. Also, in [
13], the authors show that that added mass does not affect the optimization process of the AB. Furthermore, in [
23] the moving loads model was selected, since it causes a more adverse case (the suspension system of the train can absorb part of the vibrations).
Regarding the numerical integration, the time-step was defined following the guidelines of the railway bridge regulation [
20]; in this reference, it is stablished that every vibration with a frequency lower than 30 Hz must be considered. In [
24], the authors recommend the use of a time-step at least ten times lower than the smallest period to be studied. In this work, the time-step was considered to be 20 times lower than the minimum period required by the regulation, thus increasing the accuracy while maintaining a reasonable computing time.
3.1. Validation of the Bridge Model
In order to validate the proposed FE model, we used results from the literature. First, the bridge model was checked without any mitigation devices. This validation took as reference values the ones provided in [
20], which were obtained for the ICE-2 train and a specific bridge geometry. All the cases presented in the reference were performed. Here, we present a parametric study of the passing train for different velocities. In
Figure 3, the maximum displacement and acceleration values (at any time) at the mid-span of the bridge for each train speed are plotted. Good agreement is shown for both cases. Only local discrepancies below 5% appear for the acceleration comparison (right panel) at 250 km/h. No bigger discrepancies were found in the other validation cases performed.
3.2. Validation of the AB System
To ensure that the AB system was correctly modelled, a validation study was also performed with the complete model. We used the parametric results of [
13] to contrast our model. In that work, the system was studied using classical harmonic analysis, studying the Frequency Response Function (FRF) varying several model parameters. Therefore, the same analysis was performed for our model, instead of a full integration.
The results obtained for our model and the formulation of the parameters were adapted to the nomenclature used in [
13], in order to compare the results directly. All the results presented in that reference were replicated. In
Figure 4, some FRF results obtained with our model are shown. These curves compare directly with
Figure 4 in [
13]. No numerical differences appeared between both models for this case and all the others studied.
4. Genetic Algorithm
Overall, GAs work like nature, allowing a series of individuals to evolve with time and preserve the best-adapted ones, which leads to better and better offspring. In this analogy, individuals represent a tuple of parameters (
), and the adaptation is related to how the AB system performs. With the objectives that were set in the second section, the fitness (or how well each individual adapts) is related to the reduction of vibrations and the mass added to the system. Although the algorithm was implemented by the authors from scratch in MATLAB, the detailed explanation of the algorithm is omitted, since it is a well-known technique whose details can be found, for instance, in [
25], and a similar algorithm is described by the authors in [
26].
To start the algorithm, it is necessary to define the bounds of the search space (parametric domain) and an initial population. There are several techniques to start the population, the easiest one being distributing random individuals along the parametric domain. Other techniques distribute the initial individuals evenly along the parametric domain. For this work, the Latin Hypercube Sampling technique was employed [
27], which is a compromise between randomness and a good parametric domain coverage. Regarding the parametric domain, the bounds were defined based on commercial dampers and beam profiles in order to obtain realistic values. The limits resulted in
and
.
After all individuals are defined, they have to be evaluated. For this, the FE model was constructed with the individual parameters, and the simulation was performed. Since the algorithm was implemented in MATLAB and the model was constructed in ANSYS, an intermediate file to transfer the individual data was used. With the output of the simulation (the maximum acceleration) and the computed added mass value (according to the beam configuration), the adaptation (fitness) of that individual could be computed.
The specific definition of the fitness function (a function that maps the acceleration and added mass values to a scalar) is critical to the behaviour of the algorithm. We decided to unify both objectives in a single fitness value by first evaluating the results and mapping them to individual fitness values. The mapping of added mass and maximum acceleration is performed with the piecewise functions depicted in
Figure 5. Bigger accelerations and masses are penalised with lower fitness values, saturating at certain unreasonable values.
Then, these individual values are combined into a single value with a weighted average:
The influence of the weighting parameter
w will be studied in the results section.
With every individual evaluated and with a fitness value assigned, the selection of the best suited individuals must be performed. The selection technique implemented was the Stochastic Universal Sampling (SUS) method with elitism [
28]. With this method, the best-suited individual is always preserved to the next generation. Then, M individuals are selected with a probability proportional to their fitness value (the details can be found in the previous reference). In this particular case, we found that selecting four individuals plus the elite individual led to convergent results.
Once the individuals that will be preserved in further generations have been selected, they must produce offspring. To perform this crossover, the genetic data (the parameter values) is encoded into a 16 bit binary string, which improves the performance of the algorithm by making it independent of the problem [
29]. Then, individuals are coupled in all possible combinations, and offspring is produced by a uniform crossover of the binary strings. This crossover consists of selecting each bit of the child binary string randomly from one progenitor or the other.
Mutation is a powerful tool that can be used to better explore the parametric domain [
30]. It is performed by randomly changing one bit of the offspring. Both the mutated individual and the original one are kept, in order to avoid losing a promising individual due to a dramatic change caused by mutation. The probability of mutating a gene in an individual is set to 1%. We note that the influence of mutating or randomly selecting the Most Significant Bit (MSB) or Less Significant Bit (LSB) is not discussed on this paper, since it is out of our scope.
After all the new individuals are generated, they are evaluated once more, and a fitness value is assigned repeating the loop for a predefined number of generations. For this work, the number of generations was set to 20.
Validation of the GA
In order to crosscheck the implementation of the GA, a validation case must be solved. We took, as reference, the analytical optimization of an AB system proposed in [
13]. In that reference, the authors obtained an analytical expression for a parameter related to the acceleration at the mid-span of the bridge (
). Then, the value for the parameter related to the damping coefficient
that minimizes
was computed. The theoretical model proposed in the paper is given by:
where
is the excitation frequency ratio normalized to the first natural frequency of the bridge,
is the mass ratio, and
the frequency ratio; all defined in [
13].
We performed the optimization with the GA of this theoretical model for the case where
and
, and the domain for the damping coefficient is
. We note that the parameter
is a variable that changes between 0.5 and 1.5 and the maximum amplitude appears in that range (see
Figure 4). The optimal value obtained with the genetic algorithm is
, whereas the analytical solution obtained is
. The algorithm converges with a relative difference below 0.0035. This test shows the ability of the GA to provide good optimization solutions.
5. Results and Discussion
According to the selected case (EUROSTAR train at 330 km/h), the parameters of the AB system ( and ) were optimized. Each set of values produced a dynamic response given by the results of the FE model, and was evaluated in terms of the maximum acceleration. Also, some additional mass was included in the structure, due to the mitigation system.
Each individual of any generation defines a possible configuration of the AB system, according to the defining parameters (); we remark that the fitness of each individual is related to the acceleration reduction it produces and the mass it adds to the system.
The first study was performed by allowing the individuals to until convergence was achieved (typically within 20 generations), and weighting the acceleration reduction at 90% and the mass addition at 10%, as defined in Equation (
1). In
Figure 6, all the individuals have been plotted in the parametric domain, with its fitness value represented as a colour ranging from blue (low fitness) to red (high fitness). We can see that penalising the mass results in a concentration of good individuals around the value of inertia
, regardless of the damping value. However, the best individuals tended to the damping value of
.
The three best candidates found by the algorithm are listed in
Table 1. The parameters of the system differed only for
, with a maximum difference of 10%. For
, the differences are minimum. The algorithm, therefore, outputs stable results within narrow ranges.
5.1. Dependency on the Weighting Factors
As mentioned previously, the definition of the fitness function depends on the weight given to the mass penalty and the complementary weight of the acceleration reduction, cf. Equation (
1). This weighting factor heavily affects the result of the algorithm. For instance, in
Table 2, we show the best candidate that the algorithm outputs for different weighting factors.
In general terms, to reduce the maximum acceleration, it is of interest to increment the inertia of the system, thus increasing the mass. This is shown in the increasing value of the inertia parameter when the mass weighting factor reduces. Increasing this weighting factor will balance the results by preferring lower masses with higher accelerations.
In
Figure 7 (left), the evolution of the maximum acceleration and the added mass for the best candidate found by the algorithm is plotted against the weighting factor. As expected, when the mass weighting factor increases, the mass is reduced and the acceleration increases. To study the relation between both objectives, in the right panel of that same Figure, the acceleration is plotted against the added mass (for each weight factor). It can be seen that for the low mass values range, a small increment of mass causes a big drop in the acceleration. When the added mass becomes bigger, the improvement in terms of acceleration decreases for the same increase in mass. The best choice depends on the application and the limitations of the particular case studied.
5.2. Dynamic Response
To conclude the study, here we present the dynamic response of the bridge simulated with the FE model. In
Figure 8, the acceleration over time has been plotted for four different cases. We took as reference the response of the bridge without a damping system (black line) and compared it with three of the solutions represented in
Table 2. We observe that the AB system has no effect on the frequency values but decreases the peak values of acceleration. Furthermore, with no optimization system, the acceleration peak values increase for the first 4.3 s, while the AB system produces a more homogeneous acceleration envelope.
The phenomenon discussed in the previous section is also visible. Reducing the weighting factor from 30% to 10% for the mass produces significant changes in the dynamic response. However, the reduction from 10% to 2.5% has little effect on the response of the system. In this case, with an added mass from 1500 to 3300 kg, a significant reduction in the dynamic response is shown for the particular bridge studied.
6. Conclusions
In this work, an optimization study of an auxiliary beam system which was used to reduce the unintended vibrational behaviour of railway bridges was addressed. To evaluate the mechanical characteristics of the system, an FE model was developed, comprising the bridge, the beam, and the moving loads of train traffic. This simple model can be replaced by more accurate models in the future, reproducing complex effects. Recent studies have made use of artificial intelligence techniques in order to obtain reduced models. These reduced models (consisting of, for example, artificial neural networks) allow for a faster execution of the genetic algorithm once they are trained.
A genetic algorithm was also implemented to perform the optimization process. This optimization problem involved two parameters of the AB system, namely, the inertia of the beam and the damping coefficient of the viscous damper. The analysis of each set of parameters involved the evaluation of the FE model to obtain the maximum acceleration caused by the train with that configuration. After the evolution process was finished, a set of optimal individuals was obtained. The behaviour of these individuals was studied, paying special attention to the influence of the weighting parameter for the multi-objective problem, and the minimization of the vibrations with the minimum addition of mass.
As expected, the more mass was added to the system, the reduction of the vibrations was bigger; however, a point was reached where the addition of extra mass did not significantly affect the improvement of the dynamic response. The results can be applied to particular railway cases to make realistic assessments according to the train, maximum speed, and mitigation measures to be implemented.
The methodology presented in this work, combining a high-level programming language and a specific software for FE analysis, showed their suitability for these kinds of processes. Furthermore, the use of genetic algorithms in complex problems, such as the problems that appear in dynamics, proved to be of interest.

 ,
, 


