Centrality Metrics’ Performance Comparisons on Stock Market Datasets


1
Faculty of Engineering and Information Technology, Shaoyang University, Shaoyang 422000, China
2
Faculty of Engineering and Information Technology, University of Technology Sydney, Sydney, NSW 2007, Australia
*
Author to whom correspondence should be addressed.
Symmetry 2019, 11(7), 916; https://doi.org/10.3390/sym11070916
Submission received: 13 June 2019
/
Revised: 8 July 2019
/
Accepted: 11 July 2019
/
Published: 15 July 2019
(This article belongs to the Special Issue Recent Advances in Social Data and Artificial Intelligence 2019)
Abstract
:The stock market is an essential sub-sector in the financial area. Both understanding and evaluating the mountains of collected stock data has become a challenge in relevant fields. Data visualisation techniques can offer a practical and engaging method to show the processed data in a meaningful way, with centrality measurements representing the significant variables in a network, through exploring the aspects of the exact definition of the metric. Here, in this study, we conducted an approach that combines data processing, graph visualisation and social network analysis methods, to develop deeper insights of complex stock data, with the ultimate aim of drawing the correct conclusions with the finalised graph models. We addressed the performance of centrality metrics methods such as betweenness, closeness, eigenvector, PageRank and weighted degree measurements, drawing comparisons between the experiments’ results and the actual top 300 shares in the Australian Stock Market. The outcomes showed consistent results. Although, in our experiments, the results of the top 300 stocks from those five centrality measurements’ rankings did not match the top 300 shares given by the ASX (Australian Securities Exchange) entirely, in which the weighted degree and PageRank metrics performed better than other three measurements such as betweenness, closeness and eigenvector. Potential reasons may include that we did not take into account the factor of stock’s market capitalisation in the methodology. This study only considers the stock price’s changing rates among every two shares and provides a relevant static pattern at this stage. Further research will include looking at cycles and symmetry in the stock market over chosen trading days, and these may assist stakeholder in grasping deep insights of those stocks.
1. Introduction
Today, the importance of innovation in the business sector in achieving competitive success has become increasingly clear to most significant corporations [1], and massive financial data in relevant areas can provide the crucial information for sound business analysis, but the finance literature reveals little interest in investor decision processes or the quality of judgment [2]. In the financial sector, data is of enormous value, also generally characterised as complex and heterogeneous; once the data have been compiled, original data sets can be analysed for different purposes and stakeholders. At present, there are some contemporary common issues such as unclear relationships among multiple data entries; complex data analysis needing professional skill; data noise potentially affecting accuracy; making the wrong decision may cause the loss of revenue opportunities; uncomprehensive financial data analysis leads to low benefits deriving. Companies may not be able to meet shareholder expectations. For organisations’ activities, data analysis is essential for the final decision making [3,4]. Existing data analytics methodologies usually have their pros and cons, and effective and efficient data analysis is still a challenge that crosses multiple industry fields, which includes the financial sector. Hence, the demand to understand and make sense of a large amount of collected data is rapidly growing. However, utilising the complex data to provide stakeholders with the necessary information still remains a challenge in the financial sector. Additionally, the method of analysing relationships among multiple data entries and finding the importance of any individual data entry, is a critical factor in enabling stakeholders to grasp deep insights into their investments. One of the ultimate aims of financial data analysis is to draw the right conclusions from raw data in order to gain a competitive advantage.
The stock market is an essential sub-sector in the financial area, how to understand and make sense of the mountains of collected stock data has become a challenge in relevant fields. For instance, basic analytics in the stock market include understanding the stock price movements and the relationships among massive shares; looking at cycles and symmetry in the stock market based on counting trading days, for example, to find out if the current bear market is repeating the tops made during another period bear market. Hence, with the assistance of finalised data analytics outcomes, stakeholders may adjust investments accordingly and rationally. In addition, in this paper, we only analyse the connections among stocks, and this may help stakeholders to align their investments based on other related stocks’ trends; the price prediction is not involved in our study at the stage. The raw data in this sector is usually massive and complex, it changes all the time, and the connections among stocks are complicated as well, which may lead to data analysis complexity. It arguably is that making rational judgments and decisions would require expertise and extra efforts in relevant areas; it is frequently becoming a burden of data analytics among those domains [5]. Many techniques have been applied to data analytics in the stock market, addressing multiple issues.
This study was initially encouraged by actual demand from stakeholders, creating a joint project with the financial data analytics from the business school in Western Sydney University. A general problem they found in this sector is that particular stocks are difficult to analyse for future investment due to the complexity of the stock’s network. Then again, to get a better grip on all the shares, the centre/significant stocks need to be determined, factoring in the influence of essential stocks. Hereafter, this study was put on the agenda. Our proposed approach involves data processing, graph visualisation and social network analysis, and it models stock datasets into graphs based on the trading price changing rates among shares, which has not been tested in the Australian Stock Market thus far, to the best of our knowledge. The approach adopts centrality measurement concepts for importance measurement of stocks and compares the usability of those methods to find the suitable centrality metrics of the stock market data. This case study is based on raw data collected from the Australian Stock Market for over 20 years.
The significant contributions of this research are as follows:
- The provision of a supplementary method for examination of stock market data.
- The approach combines graph centrality measurements and interactive visualisation methods and applies them to real stock data.
- The method treats all selected shares as a network system other than individual entries. It brings the relationship strength into the analytics, comparing to the existing methods in the stock market analysis such as traditional charts and treemap, the connections among stocks can be identified clearly as a big picture through the finalised graph layouts. Essential features such as zoom in and out are provided as well, although the graph layout’s quality is not included in this paper.
- We performed experiments on cleansed stock datasets to demonstrate that our approach is feasible and beneficial, and furthermore, the comparison of different centrality methods’ performance on those datasets.
- Five centrality measurements were implemented, and their performances were compared based on the same dataset in experiments.
In the following subchapters, we briefly review related work about graph visualisation and graph centrality metrics in Section 2. Section 3 introduces the methodology we use throughout the work. Experimental results are reported in Section 4. Section 5 presents a discussion. The conclusion and future works are specified in Section 6.
2. Related Works
2.1. Graph Visualisation
In the stock market, a massive volume of raw data is extrapolated every second and said data needs to be processed into easy-to-understand forms in a reasonable time, to provide stakeholders with evidence for decision-making purposes. Many data processing methods have been applied to this sector to do so. At the final stage of financial data analytics, the finalised data has been filtered/cleansed/formatted, therefore its size might be much smaller compared to the raw data gathered, yet the finalised dataset is still large typically. For example, in our experiments, we collected around 6.4 million data entries and the completed graph model that contains the entire stock market has 1379 stocks and 11,535 edges among them, but the data is still too large to analyse, especially to non-experts. Data visualisation techniques can offer abilities for data interpretation to make raw data expressive, providing a practical and utilised way to present data in a meaningful way. Multiple visualisation tools have been adopted to visually exploit data insights in many application domains, including the stock market [6,7,8]. Currently, stock data analytics is still usually being conducted in traditional ways such as a spreadsheet, charts, treemaps and parallel coordinates, etc., with these methods improving the readability of finalised stock data to some extent.
A traditional stock market chart is a standard visualisation tool; it delivers representative charts and typically comes with features such as zooming, levels of details and selection etc. A chart provides a whole picture of stock market dynamics; the chart shape is considered in decision making for technical stock market analysis purposes [9]. Treemap is adopted in Smart Money—one of the most popular visualisation tools in the stock market—used by Wall-Street Magazine to show market performance [10], providing views of stock market performance and showing the changing of stock prices and the capitalisation of 500+ companies. It uses coloured rectangular tiles to represent stocks, the size represents the market capitalisation, the colour code indicates the price is decreasing/increasing, with the shading indicating the degree of change. Treemap is well-suited for presenting large hierarchical datasets where the node size feature matters. However, treemap cannot be used in decentralised networks [11], and investigating complex networks through unintuitive treemap view is difficult [12]. Parallel coordinates are used for visualising and analysing high-dimensional data. They are valid for presenting n-dimensional data, and they make it possible to explore data sets with large amounts. Although, in practice, parallel coordinates algorithms may lead to difficulty in understanding complex data, due to its sensitivity to visual clutter [13].
In addition, the node-link graph is another common visualisation technique; data with a relational structure is suitable to be modelled and visualised into node-link graphs, for a better analysis [14,15]. Hence, stock market data’s relational structure makes it appropriate to apply node-link graphs methods. Here, the focus has been on how the elements are connected as a system, not just individual items [14]. Many well-developed node-link graph algorithms and tools have been built to generate graph layouts in a visually pleasing and useful way, which helps readers understand the structure and relationship patterns of the underlying graphs [16]. For example, the Visone software produces radial and spectral layouts, and integrates analysis and visualisation of networks facilitated by simple means of graphical interaction [17]. Handcock et al. created Statnet, which applies an algorithm which is called central Markov Chain Monte Carlo (MCMC) and focuses on statistical modelling of network data [18]. Rossi and Ahmed built up a web-based graph analytics platform, which is called NR, allowing users to analyse and visualise data online interactively in real-time [19]. Other similar software packages include RSiena [20], igraph [21], UCINet [22], Pajek [23], NodeXL [24,25] and Gephi [26].
Most existing visualisation tools may lose relevant data and relations among data units when they are finalising graph layouts as they place emphasis on creating graphs as abstract and straightforward as possible. Additionally, related methods adopted in the financial sector do not offer capabilities on the initiative ‘unknown’ relationship discovery of large-scale financial datasets, especially, to the best of our knowledge, not in the Australian stock market.
2.2. Graph Centrality Metrics
SNA (Social Networks Analysis) has experienced tremendous advances in recent years, and much research has been reported in the literature [27,28]. Centrality indices are critical metrics for network analysis. They have long been applied in SNA to provide different perceptions on the social relationships within the network, expressing the relative importance of a vertex or an edge in a network [29], and offering a detailed description of social structures [30]. Similarly, graph centrality measurements such as degree and PageRank factors etc., can provide information with importance ‘ranking’ in the stock market, hence, offering stakeholders a general idea on their future investments with consideration of related stocks, not only on individual shares.
Relevant studies that apply centrality metrics have been processed before. Wang et al. constructed a network to grasp the correlation structure and evolution of the world stock markets. Raw data was gathered on daily-based price indices of 57 stock markets during the 2005 to 2014 period, influence strength, betweenness centrality, and closeness centrality were adopted, and betweenness and closeness centrality metrics performed well [31]. Kazemilari et al. analysed the daily closure prices data of 70 stocks of renewable energy companies during the period from October 13, 2010 to March 4, 2015. Three centrality measures including degree, closeness and betweenness centralities were adopted to analyse the topological properties of minimum spanning trees. The outcomes showed extensive stocks within the network that played significant roles in renewable energy development in terms of market capitals. Moreover, degree, closeness and betweenness centralities provided similar results [32]. The closeness centrality was applied to measure the 2008 market crash of tensor financial network in Thailand, and it was claimed that the closeness centrality algorithm is the best tool to detect market crash [33]. Junior et al. used node strength (the sum of all values assigned to each edge that a node has) as a measure of node centrality to rank the most strong influencing nodes of related networks, including 83 stock market indices [34]. Dimitrios and Vasileios analysed stock relationships between 2007 and 2012 in the Greek Stock Market, degree, closeness, betweenness, eigenvector centralities and clustering coefficients were adopted to conclude the topology and in finding the most central shares. The outcomes showed that the Greek Market is a “shallow” market, meaning it can be affected easily by a few big investors or the economic climate [35]. Gao et al. studied the influence relations among listed stocks through generating a directed network of the Chinese stock market. They adopted in-degree, PageRank, eigenvector, authority, hub and betweenness metrics to obtain critical nodes in the influence network, and found that the in-degree, PageRank, eigenvector and authority performed well in characterising the importance of listed companies, while betweenness and hub measurements failed to do so [36]. Djauhari and Gan developed an optimal minimal spanning tree onto the daily data of closing prices of 98 stocks during the whole year of 2012, to overcome the non-optimality problem. In the experiments, degree centrality was applied to analyse network topology and determine the degree distribution [37]. Tu proposed a method based on cointegration to construct a sophisticated financial network in the Chinese stock market. In that study, directed, weighted and non-symmetric graphs were generated for showing network structure, and degree centrality, PageRank, HITS, local clustering coefficient, K-shell and strongly and weakly connected components were applied. Outcomes from the Cointegration Planar Graph (CIPG), Cointegration Threshold Network (CITN) and Partial Correlation Planar Graph (PCPG) were compared [38].
Five graph centrality metrics were proposed and applied to analyse stock market networks in this research. They are all characterized by the same monotonicity (higher statistics lead to higher centrality), symmetry (nodes’ centralities only depend on their statistics and not their labels), and additivity (statistics are processed in an additively separable manner) axioms [39]. Degree centrality is adapted to show the number of connections of a stock in the stock market; closeness centrality indicates the average length of a stock to all other shares in the network; betweenness centrality presents the number of geodesics between all pairs of shares in the network that pass through the specific capital; and PageRank is applied to relevance networks. Some metrics are more suitable than others in the stock market data analytics, yet, the stock impact cannot be measured adequately by any individual factor.
3. Methodology
To explore the relationship between data in the financial sector, a new approach was conducted, and the specific purposes of the study areas were to grasp whether significant stocks may affect others; to discover potential ‘unknown’ relationships among massive stock market raw data; to further explore the correctness of visualised relationship representation; and to quantitatively examine the feasibility of the approach in practice. To the best of our knowledge, few efforts that combine centrality metrics and node-link algorithms have been made to conduct visual analytics of the stock market datasets. This proposed approach combines the force-directed algorithm and five centrality metrics methods, to grasp significant stocks and show an overview of the entire structure of the Australian stock market. Although we place emphasis on the centrality metrics methods’ performance in experiments, graph visualisation algorithms are included for layout representation only, see [40,41] for details regarding data processing and graph visualisation techniques involved in this work.
3.1. Data Processing and Graph Modelling
We collected all raw data in the experiments from the ASX, including 5088 stocks in the Australian stock market, which ranged from January 2, 1997 to June 30, 2017. Nearly 6.4 million data entries were gathered. In the data processing step, individual stock prices’ changing rates between every two continues trading days were computed, and then the price changing rates between every two stocks during same two continues trading days were compared, hence, grasping the similarity of those two shares’ price changing trends, and finding the potential connections between those two stocks. Eventually, 1379 shares and 11,535 links were generated for the graph modelling step. For details, please see [40].
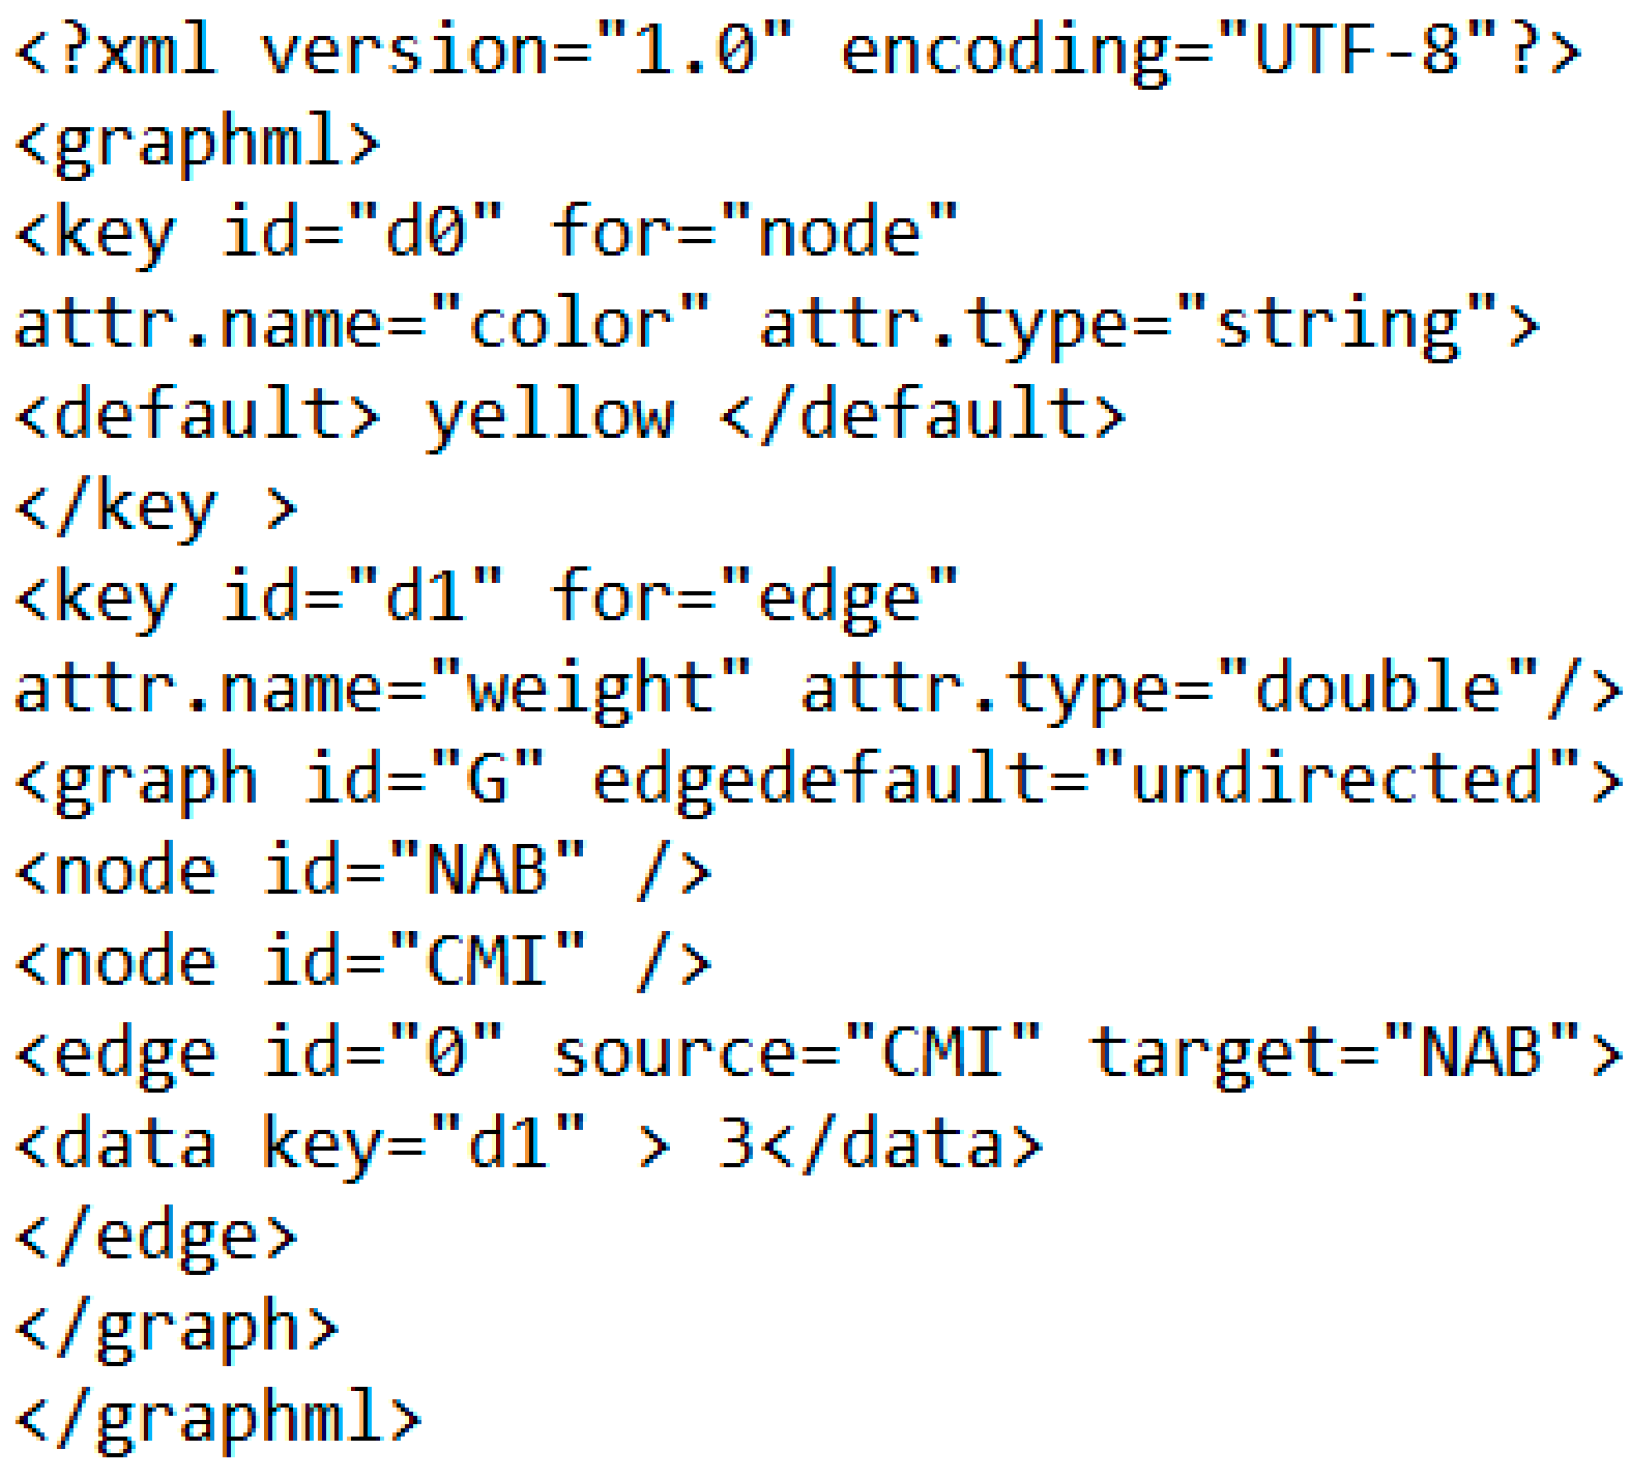
In this research, each share is treated as a ‘node’. Further, a relation between a stock and its connected stock can be established, and the connection is represented as an ‘edge’. Hence, raw data can be transferred into undirected graph models. For example, in Figure 1, stock ‘NAB’ is connected to the ‘CMI’, and the edge weight (connection strength) (see [40,41]) is 3 in the case.
3.2. Force-Directed Algorithm
Force-directed algorithms treat graph elements as a mechanical system, applying energies such as spring force onto every vertex and edge, keep working on nodes to move them to reasonable positions until the termination state is reached, for example, the energy is minimised. They usually offer aesthetically pleasing graph layouts [42,43]. The FA (ForceAtlas) layout algorithm [44] is a spatial layout method under the category of force-directed algorithms, and it addresses giving a simple shape to large real-world networks. FA2 (ForceAtlas2) offers more options and innovative optimisations; it brings good performances for a network of fewer than 100,000 nodes. FA2 is empirically observed at its best with strongly clustered networks, it excels at presenting social networks, and it takes in account the degree of the nodes in the repulsion so that the specific visual cluttering is reduced [44].
Forces involved in FA2 are the attraction force and repulsive force. Suppose there is the classical attraction force fa between two connected nodes n1 and n2 depends linearly on the distance d(n1, n2), then
fa(n1, n2) = d(n1, n2).
FA2 brings poorly connected nodes closer to very connected nodes, and it tweaks the repulsion force so that poorly connected nodes and very connected nodes repulse less. The repulsive force fr is proportional to the product of the degrees plus one (deg+1) of the two nodes n1 and n2, and the coefficient kr is pre-defined by the settings, then
Given a graph G = (V, E), the combined force applied to vertex v is represented as:
3.3. Centrality Metrics
To grasp a more comprehensive impression on all the stock data collected, we conducted a study to determine which stocks are at the centre of all stocks; therefore, graph centrality metrics exist to discover relationships between stocks. Here, the centrality measurements were characterized by the same axioms of monotonicity, symmetry and additivity, and symmetry guarantees that a centrality measure does not depend on the identity of a node. Note that in most of the unweighted networks, the edges are treated equally, which is not the instance in this study. Each connection in the stock market network may have different underlying significances in network structures and functions, and centrality metrics can be influenced by taking into account the weightings that are applied to them [45,46]. For different kinds of network flows, various centrality measures should be used [47]. More specifically, five metrics were adopted in our experiments to examine the stock’s network. Here, a stock network is a labelled undirected weighted graph G = (V, E, w), in which V presents the set of vertices, E is the set of edges and w is the weight function (see [40]).
Eigenvector centrality is an expansion of the degree centrality metric. It considers the importance of the nodes connected to the current node, which means not all vertices are equivalent. The eigenvector centrality attributes a value that represents the connection intensity among nodes, a higher value indicates a more critical node, and a node that has few but essential linkers is still with high eigenvector centrality [48,49,50]. In this study, the eigenvector centrality concept is adopted in undirected graphs as a ranking measure to analyse the importance of stocks; it measures the extent to which a stock interacts with other shares in the stock market. Let A show an (n × n) similarity matrix, λ be the largest eigenvalue of A and x the corresponding eigenvector, the eigenvector centrality xi of node i is defined as the ith entry in the normalized eigenvector belonging to the largest eigenvalue of A, N(i) are the node i’s neighbouring nodes, consider a particular node i with its adjacent nodes N(i), then
PageRank defines a link analysis method to evaluate a user’s influence, so that not only the immediate information flow is incorporated, but the information flow after that would also be considered. A node here acts more critical when it is linked from other nodes that play essential roles, or it is highly connected. It assigns probability distributions to each node, indicating the importance of the node through determining the probability of being at that node throughout the random walk [51,52]. The PageRank centrality is also applied in undirected graphs here. At each node in an undirected graph, the next node is selected with probability from the set of successors of the present node. Or else, when a node has no successors, the next node is chosen from all nodes, and nodes with higher measurement are more likely to be determined.
The weighted degree centrality takes into consideration the weights of ties, and this has been the preferred measure for analysing weighted networks [46,53]. In this research, a number of connections pointing to or emerging from a stock in the graph, and edge weight is included. Suppose w is the weighted adjacency matrix, V is the nodes added, if node i is connected to node j then wij is greater than 0, and the value indicates the weight of the tie. Then the weighted degree xi of a node i is the sum of weight values that from all nodes connect to it, the weight is defined as:
Betweenness centrality is a primary measure in SNA, and it expresses the importance of elements (vertex/edge) involved in a network, evaluating traffic in communication networks, and also identifies critical intersections in road networks [29]. Betweenness centrality is generally observed as a measure of others’ dependence on a given node, and therefore as a measure of potential control. A node comes with high betweenness centrality if it lies between many other nodes concerning their shortest path, and this node controls the flow of information between many other nodes. The vertex with the highest betweenness value is on the closest link among all nodes in a network [54,55].
Closeness centrality is designed as the reciprocal of the sum of the length of the shortest paths between the selected node and all other nodes in a network. Accordingly, the more central a node is, the closer it is to all other nodes. Closeness centrality is usually construed either as a measure of access efficiency or of independence from potential control by intermediaries. The node with the highest closeness metrics can reach every other node in a network on a short path, and it has the power of access [54,55,56].
3.4. Procedure
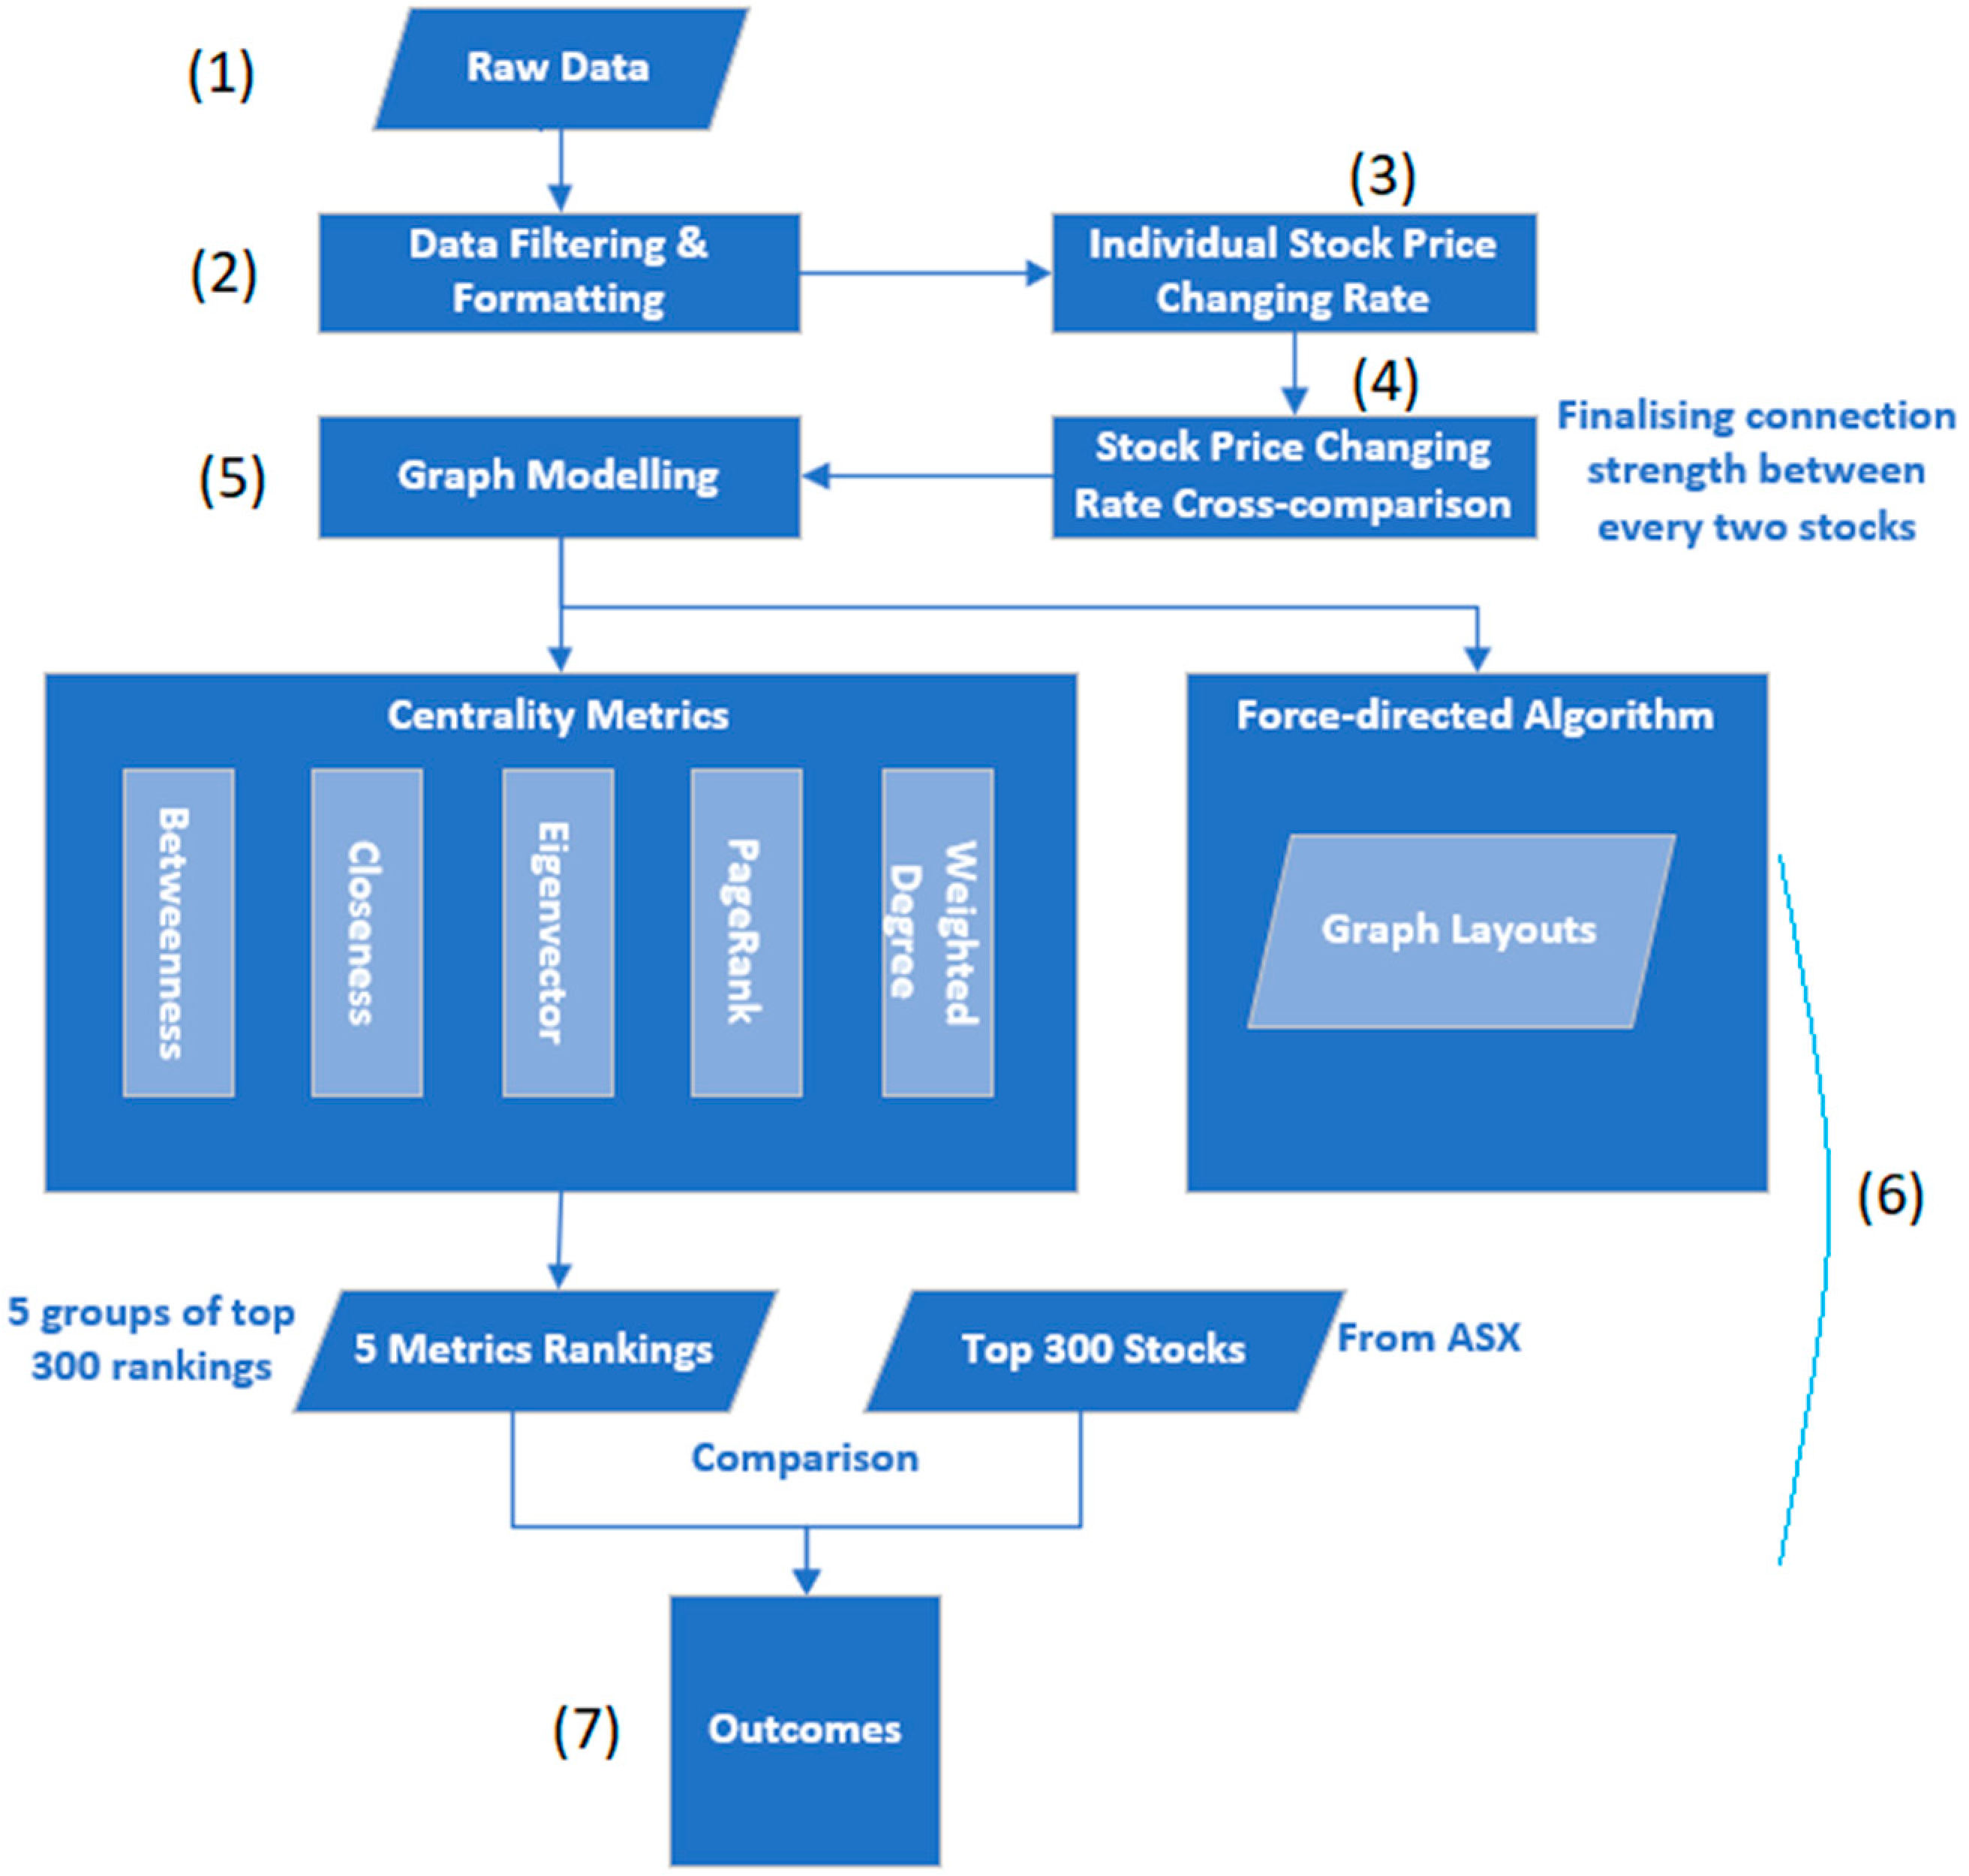
Based on the raw data generated from data processing and graph modelling steps, the proposed approach applies five centrality metrics onto finalised graph models; then, compares the metrics results with top 300 stocks from ASX to find out which central metrics algorithms are suitable for analysis of the stock market data. The steps included in the workflow of this study are shown below, as well as in Figure 2.
- (1)
- Collecting raw data from ASX;
- (2)
- Data filtering and formatting, such as removing stocks not existing at present and stocks’ existence are less than one year;
- (3)
- Computing individual stocks’ price changing rates;
- (4)
- Cross comparing stocks’ price changing rate and finding similarities between every two stocks;
- (5)
- Generating graph models based on stock data processed (every stock is a node, and connections among stocks are edges, the relationship strength is presented via edge weight);
- (6)
- Finalising experiments:
- Applying the FA2 algorithm to the graph models and generating graph layouts;
- Using five centrality metrics methods to the graph models and getting five groups of top 300 rankings, comparing results to the top 300 stocks from ASX;
- (7)
- Outcomes and discussion.
3.5. Tools and Technology Summary
A summary containing details of evaluations and relevant technologies is shown in Table 1.
4. Results
Eventually, 1379 stocks were kept after data processing steps, as well as 11,535 edges for presenting relationships among shares. Table 2 shows all the comparison results. For example, the top 300 shares from the weighted degree centrality match 64.13% of the top 300 stocks from the S&P/ASX 300 (XKO) on January, 2019. The S&P/ASX 300 (XKO) Index provides information to Australia’s large-, mid- and small-cap equities, and this index consists of all S&P/ASX 200 companies plus 100 smaller-cap companies that have market capitalisations’ above $100 million (AUD). Investors typically use the ASX 300 as a benchmark for superannuation portfolios and managed funds due to its exposure to smaller companies. On the other hand, PageRank metrics match 61.56%, and closeness and eigenvector centrality only reach 50.57% and 48.74%. In this case, the weighted degree and PageRank tend to have a ‘better’ similarity in practice, and all other three metrics present worse.
In Table 3, due to the limitation of paper length, an example of only the top 20 stocks of giving centrality measurements are given (stock information details such as stock name and sector etc. can be referred from https://www.asx.com.au/). In the experimental evaluation the top 300 rankings were applied.
In addition, the similarity rates of the top 300 shares from giving centrality metrics are shown in Table 4. PageRank and weighted degree metrics are subject to provide similar results, and their outcomes are 81.33% matching; the others all differ a lot.
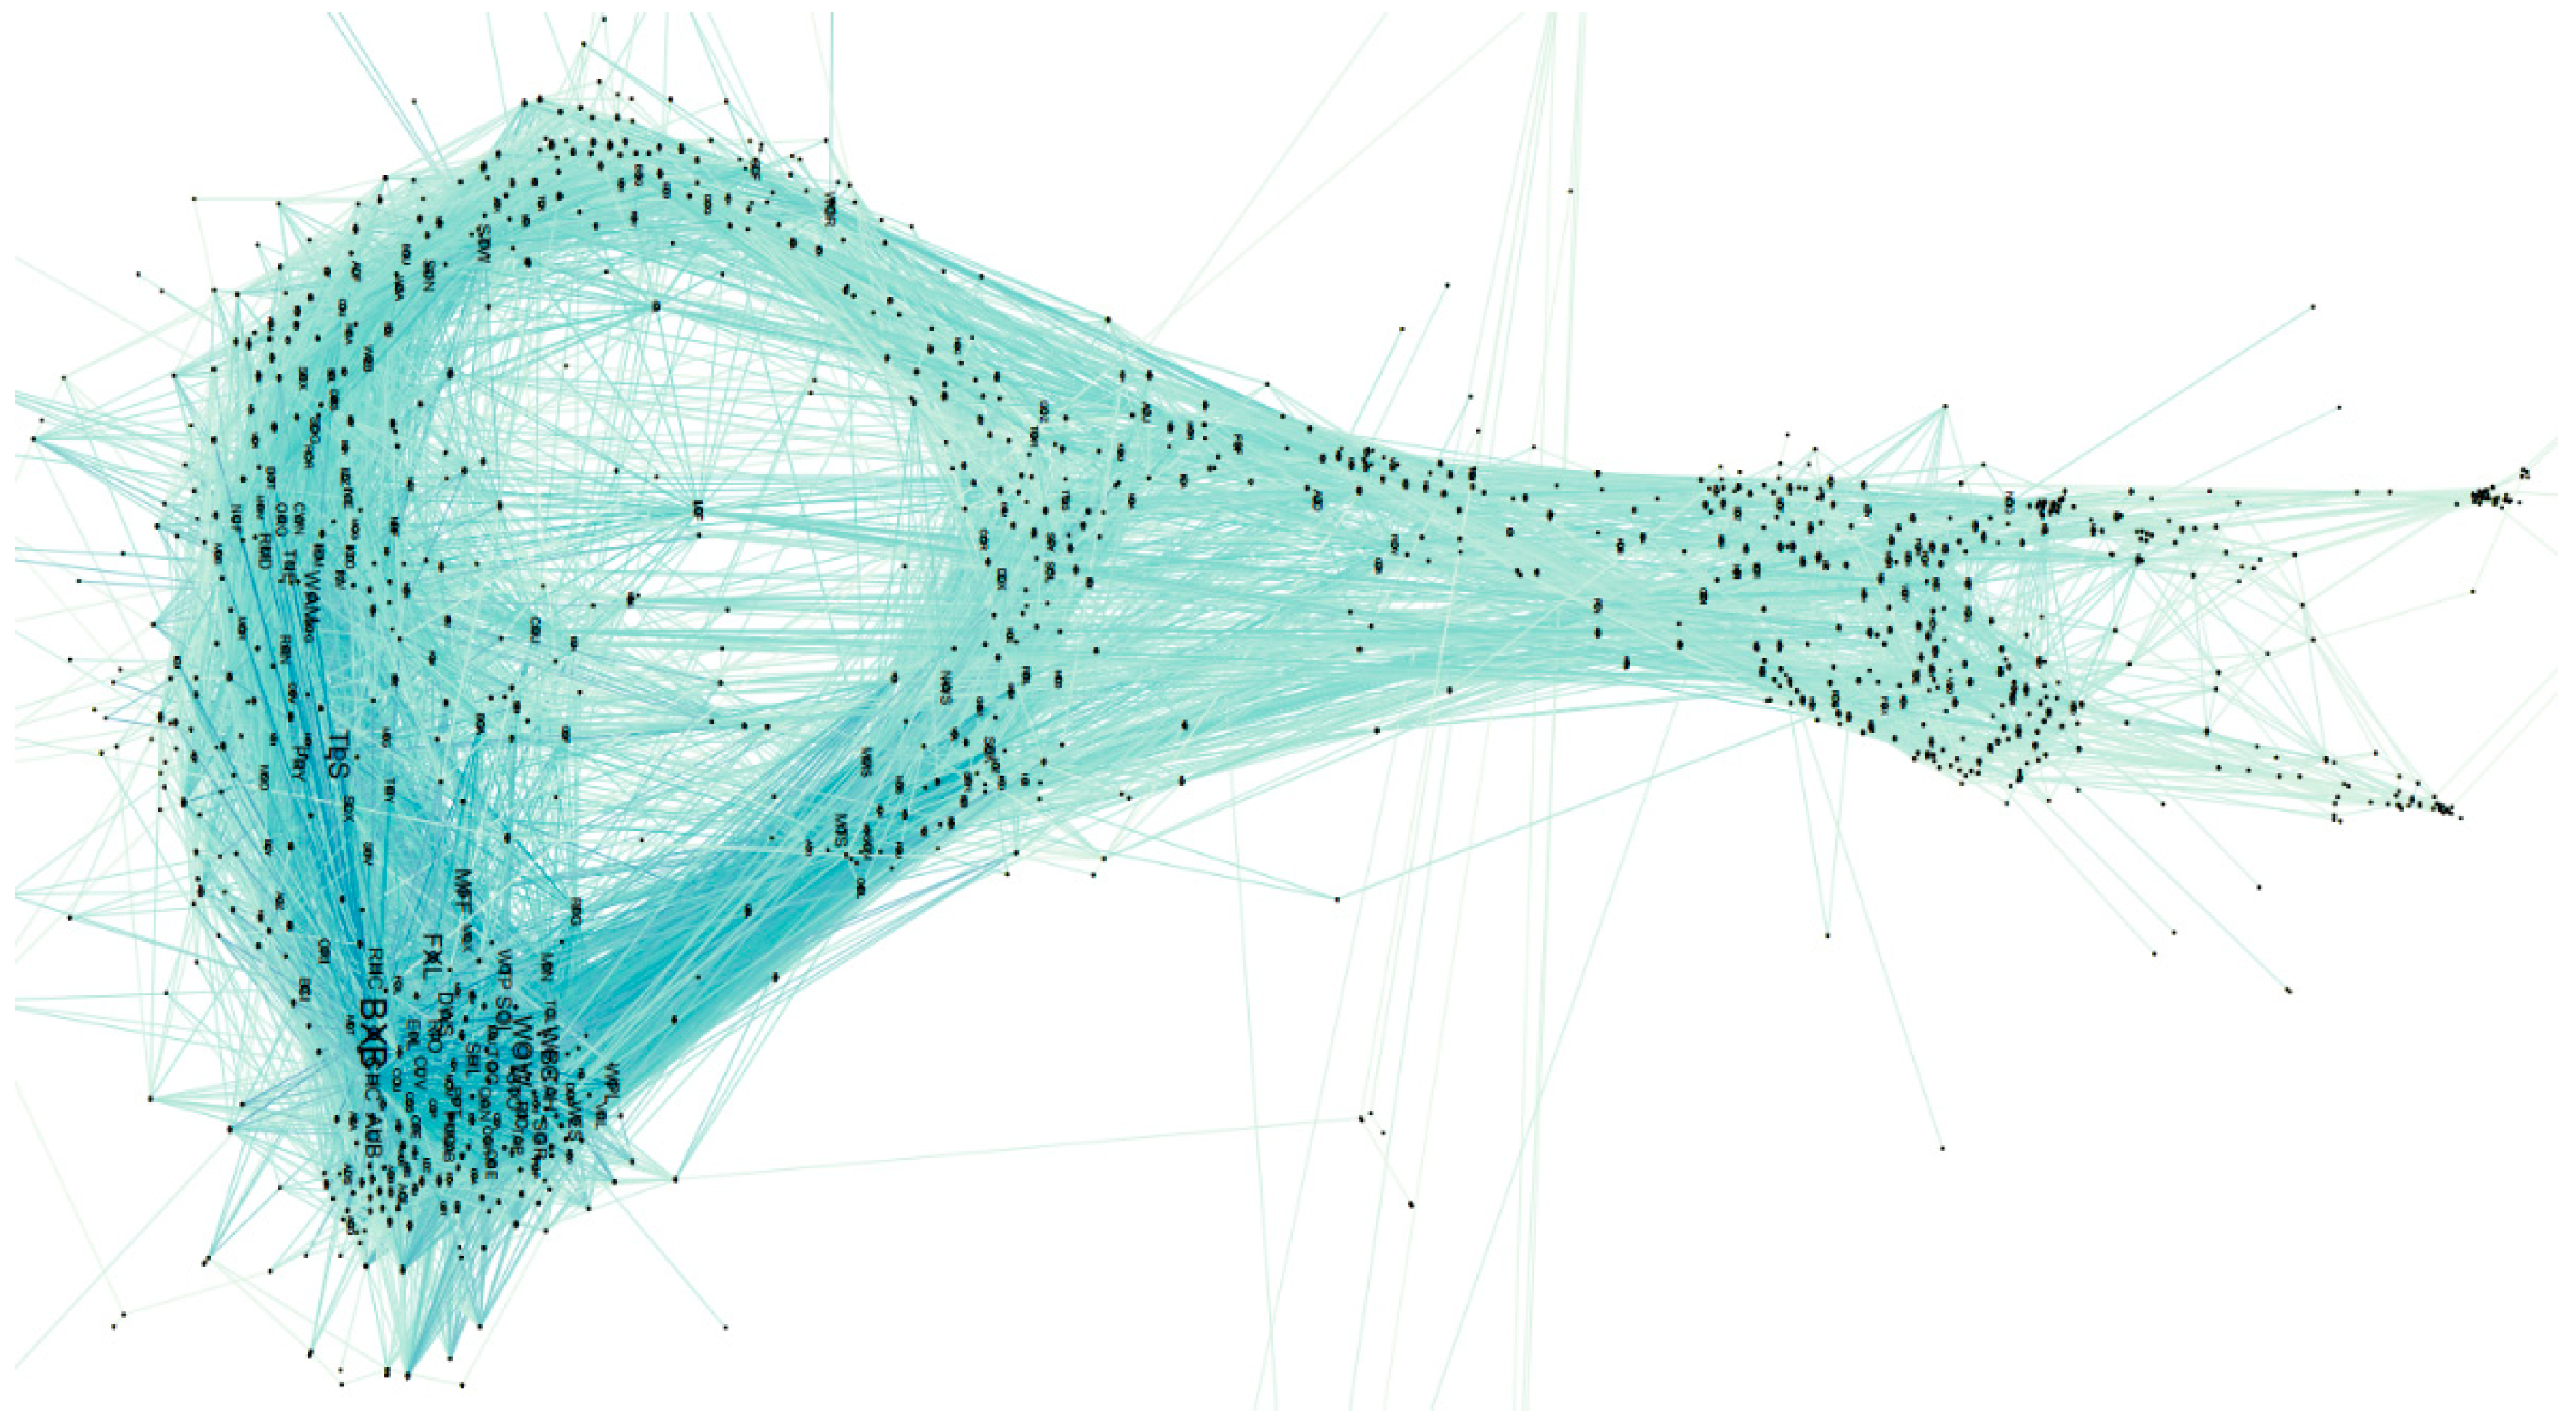
Figure 3 offers an overview of the entire Australian stock market network based on shares cleansed in this study, which includes 1379 stocks and 11,535 connections among them. Some peripheral vertices may not be shown in Figure 3 due to the paper layout size limit. Figure 3 applies the weighted degree centrality measurement for computing the ranking of each share, the darker colour and larger node name indicate significant (higher ranking) stocks, and the thicker edge width represents stronger connections between two shares.
5. Discussion
From the results in Table 2, it can be found out that centrality measurements’ rankings do not match the actual top 300 stocks perfectly. The best similarity percentages are 64.13% (weighted degree metrics on January, 2019) and 61.56% (PageRank metrics on January, 2019), and the worst is 45.35% (eigenvector metrics on August, 2016). The possible reasons may include:
- The S&P/ASX 300 (XKO) provides comprehensive information on the Australian share market. It has a diverse mix of large-, mid- and small-cap shares, yet, the index only accounts for the partially Australian equity market. For example, it accounted for 89% of the Australian equity market in March 2018; it did not involve all the stocks at that time. Additionally, the index takes into account the market capitalisation of each stock, and the connections among stocks are not included;
- The ASX 300 consists of all S&P/ASX 200 companies plus 100 smaller-cap companies. ASX 200 indicates a company’s contribution relative to its total market value. In addition the ASX 200 is also float-adjusted, which presents that the total numerical contribution to the index of a stock is comparable to the stock’s value at the float of the stock [57]. The calculation of the ASX 200 starts with a sum of the market capitalisation of the constituent stocks, and it is intended to reflect changes in share price, not only market capitalisation, and only consider the other 100 smaller-cap stocks with market capitalisations’ above $100 million (AUD). On the other hand, our experiments rely on the price changing rates between every two stocks on the same continuous trading days. Hence, the relationship of stocks was emphasised; the capitalisation was not taken into account at this stage; this may lead to incorrect results.
- The top 300 stocks vary on a different period; it considers present market capitalisations of each share. For example, the weighted degree metrics’ similarity with the real top 300 shares on January, 2019 was 64.13%, and the value was 60.69% on August, 2016, that makes a 3.44% difference between those two months. The proposed approach focuses on the historical data and ignores the short-term data changing; this may also cause unmatched outcomes.
Hence, due to different calculations between ASX 300 and our methodology, the results are not perfectly matched, albeit expectedly so. Additionally, from Table 1, the weighted degree and PageRank measurements perform well, closeness and eigenvector centrality metrics hardly reach 50% similarity, however betweenness metrics, on the other hand, have average performance among the five methods. What is more, most top shares in Table 2 belong to the financial and mining sector, for example, in the weighted degree metrics ranking category, there are 35% in the economic sector (FXL, WBC, MFF, AUB, WAM, CHC, SOL); 20% are in the mining/energy area (RIO, WES, WPL, STO); the health/medical, construction and retail industries own others. These results are in line with people’s common sense of the Australian market, but further discovery of the stock sector distribution has not been done at the stage.
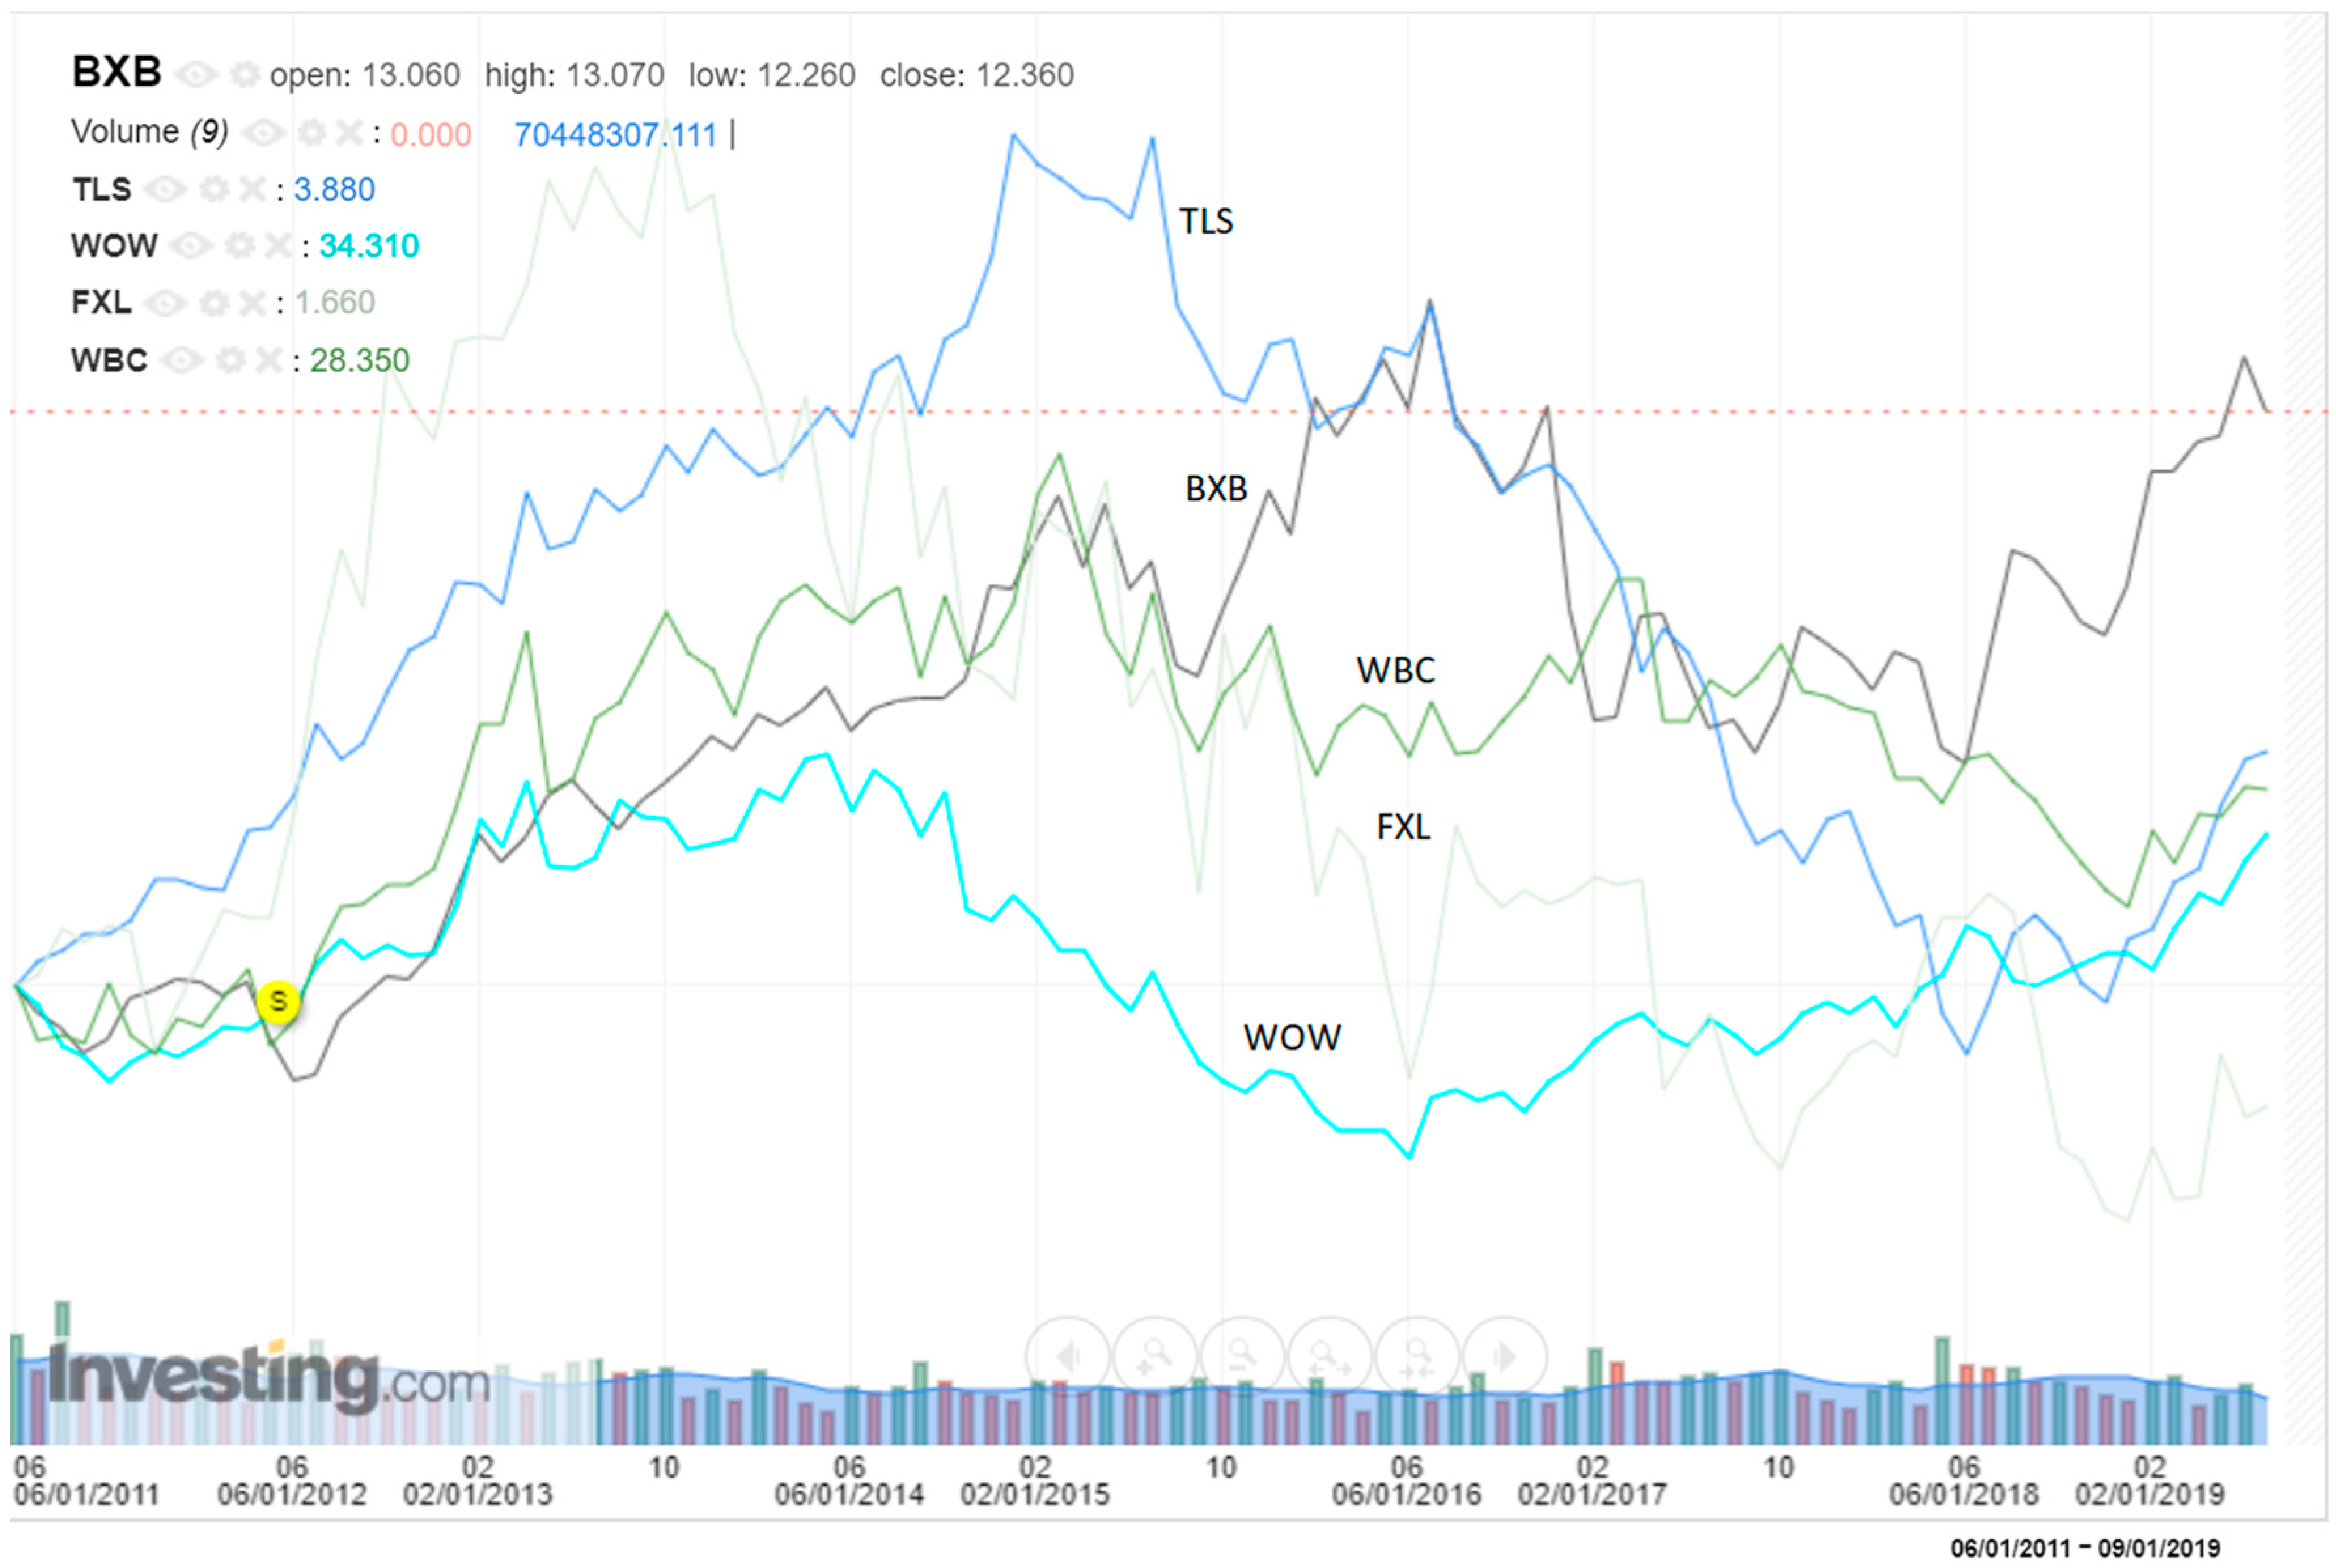
In the stock market, there are drawbacks of traditional data analysis methods. For example, stock charts can only present selected shares in limited amounts (see Figure 4, it shows a case that only contains five stocks BXB, TLS, WOW, FXL, WBC, stock details can be referred from https://www.asx.com.au/); treemap’s capability is restricted in a complex network, and the way of representing parallel coordinates’ makes it hard to understand and show complicated datasets. Comparing to those existing works, this research combines data processing, graph visualisation and centrality metrics methods, calculates edge weights based on stocks’ price changing rates, provides not only the structure of the Australian stock market network (Figure 3), but also offers a feasible way to do the ‘importance’ analytics among massive stocks (top rankings). Hence, the methodology could deliver significant shares and relations among them that previous studies may lack.
6. Conclusions
The existing approaches apply proper centrality measurements to analyse the relationship among complex stock markets and grasp the importance of stocks. However, details of the network generation and centrality metrics comparisons are still lacking in most cases. Our methodology offers a clear procedure of raw data processing, generates graph models and compares centrality measurements’ performance based on the S&P/ASX 300 (XKO) in practice. Hence the results are more convincing theoretically.
Based on raw data collected between 1997 and 2017 from ASX, we conducted an approach that applied betweenness, closeness, eigenvector, PageRank and weighted degree centrality measurements on graph models generated, furthermore, we compared the top 300 ranking stocks from five measurements and the ASX top 300, revealing that PageRank and weighted degree centrality measurements performed well. As far as we know, this study is the first work which has adopted the methodology above in the Australian stock market. The experimental results were computed based on historical data gathered in a 20 years period, and only considered the connection among stocks, but in practice, a new company with high capitalisation, which does not have relations to other shares, can still be in top 300 at ASX. Hence, the differences between our approach and practical market ranking were reported.
The present approach provides a static pattern that offers stakeholders relationship descriptions of all stocks, and each share’s centrality metrics changes over time which has not been taken into account at the stage. On the other hand, the epdf (Equal-Error Probability Density Function) can identify the network topology quickly [58]; and probability distribution of centrality would offer a powerful supplementary aspect to the proposed approach, which can draw dynamic changing patterns of selected essential shares to study the symmetry of the stock market network, and grasp deep insights of those shares in the Australian stock market. Hence, the trend analytics would be more convincing; the probability distribution of centrality will be included in our future work. In addition, the present stock capitalisation, as well as the increasing rate of the stock capitalisation, will be taken into account as node weights to enhance the approach’s feasibility.
Author Contributions
Conceptualization, J.H.; methodology, J.H. and M.H.; software, J.H.; validation, J.H.; formal analysis, C.H.; investigation, J.H.; resources, J.H.; data curation, J.H.; writing—original draft preparation, J.H.; writing—review and editing, J.H., M.H. and C.H.; visualisation, J.H.
Funding
This research received no external funding.
Conflicts of Interest
The authors declare no conflict of interest.
References
- Bereznoi, A. Business model innovation in corporate competitive strategy. Probl. Econ. Transit. 2015, 57, 14–33. [Google Scholar] [CrossRef]
- De Bondt, W.F.; Thaler, R.H. Financial decision-making in markets and firms: A behavioral perspective. Handb. Oper. Res. Manag. Sci. 1995, 9, 385–410. [Google Scholar]
- McAfee, A.; Brynjolfsson, E.; Davenport, T.H.; Patil, D.J.; Barton, D. Big data: The management revolution. Harv. Bus. Rev. 2012, 90, 60–68. [Google Scholar] [PubMed]
- Larson, D.; Chang, V. A review and future direction of agile, business intelligence, analytics and data science. Int. J. Inf. Manag. 2016, 36, 700–710. [Google Scholar] [CrossRef]
- Gärling, T.; Kirchler, E.; Lewis, A.; Van Raaij, F. Psychology, financial decision making, and financial crises. Psychol. Sci. Public Interest 2009, 10, 1–47. [Google Scholar] [CrossRef]
- Bikakis, N.; Sellis, T. Exploration and visualization in the web of big linked data: A survey of the state of the art. arXiv preprint 2016, arXiv:1601.08059. [Google Scholar]
- Zhang, L.; Stoffel, A.; Behrisch, M.; Mittelstadt, S.; Schreck, T.; Pompl, R.; Weber, S.; Last, H.; Keim, D. Visual analytics for the big data era—A comparative review of state-of-the-art commercial systems. In Proceedings of the 2012 IEEE Conference on Visual Analytics Science and Technology (VAST), Seattle, WA, USA, 14–19 October 2012. [Google Scholar]
- Parsons, P.; Sedig, K.; Didandeh, A.; Khosravi, A. Interactivity in Visual Analytics: Use of Conceptual Frameworks to Support Human-Centered Design of a Decision-Support Tool. In Proceedings of the 2015 48th Hawaii International Conference on System Sciences, Kauai, HI, USA, 5–8 January 2015; pp. 1138–1147. [Google Scholar]
- Šimunić, K. Visualization of Stock Market Charts. In Proceedings of the 11-th International Conference in Central Europe on Computer Graphics, Visualization and Computer Vision 2003, Plzen, Czech Republic, 3–7 February 2003. [Google Scholar]
- Johnson, J.E.; Morris, J.K.; de Brun, S.C.; Gunther, N.L. Visible Market, Inc., Dynamic Visual Statistical Data Display and Method for Limited Display Device. U.S. Patent 8,972,295, 3 March 2015. [Google Scholar]
- Kolomeets, M.; Chechulin, A.; Kotenko, I.; Strecker, M. Voronoi Maps for Planar Sensor Networks Visualization. In Communications in Computer and Information Science, Proceedings of the International Symposium on Mobile Internet Security, Jeju Island, Korea, 19–22 October 2017; Springer: Singapore, 2017. [Google Scholar]
- Blue, R.; Dunne, C.; Fuchs, A.; King, K.; Schulman, A. Visualizing real-time network resource usage. In Lecture Notes in Computer Science, Proceedings of the International Workshop on Visualization for Computer Security, Cambridge, MA, USA, 15 September 2008; Springer: Berlin/Heidelberg, Germany, 2008; pp. 119–135. [Google Scholar]
- Johansson, J.; Forsell, C. Evaluation of parallel coordinates: Overview, categorization and guidelines for future research. IEEE Trans. Vis. Comput. Graph. 2015, 22, 579–588. [Google Scholar] [CrossRef]
- Card, S.K.; Nation, D.A. Xerox Corp. System and method for browsing hierarchically based node-link structures based on an estimated degree of interest. U.S. Patent 7,392,488, 24 June 2008. [Google Scholar]
- Huang, W.; Hong, S.H.; Eades, P. Effects of crossing angles. In Proceedings of the 2008 IEEE Pacific Visualization Symposium, Kyoto, Japan, 5–7 March 2008; pp. 41–46. [Google Scholar]
- Brandes, U.; Wagner, D. Analysis and visualisation of social networks. In Graph Drawing Software; Springer: Berlin/Heidelberg, Germany, 2004; pp. 321–340. [Google Scholar]
- Baur, M.; Benkert, M.; Brandes, U.; Cornelsen, S.; Gaertler, M.; Köpf, B.; Lerner, J.; Wagner, D. Visone Software for visual social network analysis. In Lecture Notes in Computer Science, Proceedings of the International Symposium on Graph Drawing, Vienna, Austria, 23–26 September 2001; Springer: Berlin/Heidelberg, Germany, 2001. [Google Scholar]
- Handcock, M.S.; Hunter, D.R.; Butts, C.T.; Goodreau, S.M.; Morris, M. statnet: Software Tools for the Representation, Visualisation, Analysis and Simulation of Network Data. J. Stat. Softw. 2005, 14, 1548–7660. [Google Scholar] [CrossRef]
- Rossi, R.; Ahmed, N. The network data repository with interactive graph analytics and visualization. In Proceedings of the Twenty-Ninth AAAI Conference on Artificial Intelligence, Austin, TX, USA, 25–30 January 2015. [Google Scholar]
- Ripley, R.; Boitmanis, K.; Snijders, T.A.B. RSiena: Siena Simulation Investigation for Empirical Network Analysis. R package version 1.1-232. 2013. Available online: http://CRAN.R-project.org/package=RSiena (accessed on 5 April 2019).
- Csárdi, G.; Nepusz, T. The igraph software package for complex network research. Inter. J. Comp. Syst. 2006, 1695, 1–9. [Google Scholar]
- Borgatti, S.; Everett, M.G.; Freeman, L.C. UCINET 6.0 Version 1.00; Analytic Technologies: Natick, MA, USA, 1999. [Google Scholar]
- Batagelj, V.; Andrej, M. Pajek—Analysis and visualization of large networks. In Lecture Notes in Computer Science, Proceedings of the International Symposium on Graph Drawing, Vienna, Austria, 23–26 September 2001; Springer: Berlin/Heidelberg, Germany, 2001; pp. 477–478. [Google Scholar]
- Bonsignore, E.M.; Dunne, C.; Rotman, D.; Smith, M.; Capone, T.; Hansen, D.L.; Shneiderman, B. First steps to NetViz Nirvana: Evaluating social network analysis with NodeXL. In Proceedings of the 2009 International conference on computational science and engineering, Vancouver, BC, Canada, 29–31 August 2009; pp. 332–339. [Google Scholar]
- Hansen, D.L.; Shneiderman, B.; Smith, M.A. Analyzing Social Media Networks with NodeXL: Insights from a Connected World; Morgan Kaufmann: San Mateo, CA, USA, 2010. [Google Scholar]
- Bastian, M.; Heymann, S.; Jacomy, M. Gephi: An Open Source Software for Exploring and Manipulating Networks; Association for the Advancement of Artificial Intelligence: Palo Alto, CA, USA, 2009. [Google Scholar]
- Scott, J.; Carrington, P.J. The SAGE Handbook of Social Network Analysis; SAGE Publications: Thousand Oaks, CA, USA, 2011. [Google Scholar]
- Aggarwal, C.C. An introduction to social network data analytics. In Social Network Data Analytics; Springer: Boston, MA, USA, 2011; pp. 1–15. [Google Scholar]
- Riondato, M.; Kornaropoulos, E.M. Fast approximation of betweenness centrality through sampling. Data Min. Knowl. Discov. 2016, 30, 438–475. [Google Scholar] [CrossRef]
- Mika, P.; Gangemi, A. Descriptions of social relations. Benefits 2016, 1, 14. [Google Scholar]
- Wang, G.J.; Xie, C.; Stanley, H.E. Correlation structure and evolution of world stock markets: Evidence from Pearson and partial correlation-based networks. Comput. Econ. 2018, 51, 607–635. [Google Scholar] [CrossRef]
- Kazemilari, M.; Mardani, A.; Streimikiene, D.; Zavadskas, E.K. An overview of renewable energy companies in stock exchange: Evidence from minimal spanning tree approach. Renew. Energy 2017, 102, 107–117. [Google Scholar] [CrossRef]
- Kanjamapornkul, K.; Pinčák, R.; Bartoš, E. The study of Thai stock market across the 2008 financial crisis. Phys. A Stat. Mech. Its Appl. 2016, 462, 117–133. [Google Scholar] [CrossRef] [Green Version]
- Junior, L.S.; Mullokandov, A.; Kenett, D.Y. Dependency Relations among International Stock Market Indices. J. Risk Financ. Manag. 2015, 8, 227–265. [Google Scholar] [CrossRef] [Green Version]
- Dimitrios, K.; Vasileios, O. A network analysis of the Greek stock market. Procedia Econ. Financ. 2015, 33, 340–349. [Google Scholar] [CrossRef]
- Gao, Y.C.; Zeng, Y.; Cai, S.M. Influence network in the Chinese stock market. J. Stat. Mech. Theory Exp. 2015, 2015, P03017. [Google Scholar] [CrossRef] [Green Version]
- Djauhari, M.A.; Gan, S.L. Optimality problem of network topology in stocks market analysis. Phys. A Stat. Mech. Its Appl. 2015, 419, 108–114. [Google Scholar] [CrossRef]
- Tu, C. Cointegration-based financial networks study in Chinese stock market. Phys. A Stat. Mech. Its Appl. 2014, 402, 245–254. [Google Scholar] [CrossRef]
- Bloch, F.; Jackson, M.O.; Tebaldi, P. Centrality measures in networks. arXiv 2017, arXiv:1608.05845. [Google Scholar] [CrossRef]
- Hua, J.; Huang, M.; Zreika, M.; Wang, G. Applying Data Visualization Techniques for Stock Relationship Analysis. Filomat 2018, 32, 1931–1936. [Google Scholar] [CrossRef]
- Zreika, M.; Hua, J.; Wang, G. Applying Data Processing Method for Relationship Discovery in the Stock Market. In Recent Developments in Data Science and Business Analytics; Springer: Cham, Switzerland, 2018; pp. 247–253. [Google Scholar]
- Gansner, E.R.; North, S.C. Improved force-directed layouts. In Proceedings of the Graph Drawing 98, Montreal, QC, Canada, 13–15 August 1998; pp. 364–373. [Google Scholar]
- Kobourov, S.G. Force-directed drawing algorithms. In Handbook of Graph Drawing and Visualization; CRC Press: Boca Raton, FL, USA, 2013; pp. 383–408. [Google Scholar]
- Jacomy, M.; Heymann, S.; Venturini, T.; Bastian, M. Force Atlas 2, a Graph Layout Algorithm for Handy Network Visualisation. 2011. Available online: https://medialab.sciencespo.fr/publications/Jacomy_Heymann_Venturini-Force_Atlas2.pdf (accessed on 5 April 2019).
- Friedkin, N.E. Theoretical foundations for centrality measures. Am. J. Sociol. 1991, 96, 1478–1504. [Google Scholar] [CrossRef]
- Wang, J.; Hou, X.; Li, K.; Ding, Y. A novel weight neighborhood centrality algorithm for identifying influential spreaders in complex networks. Phys. A Stat. Mech. Its Appl. 2017, 475, 88–105. [Google Scholar] [CrossRef]
- Borgatti, S. Social Network Analysis. Available online: http://www.analytictech.com/mb109/slides/networks.pdf (accessed on 5 April 2019).
- Bonacich, P. Some unique properties of eigenvector centrality. Soc. Netw. 2007, 29, 555–564. [Google Scholar] [CrossRef]
- sci.unich.it. Eigenvector Centrality. Available online: https://www.sci.unich.it/~francesc/teaching/network/eigenvector.html (accessed on 2 April 2019).
- Lohmann, G.; Margulies, D.S.; Horstmann, A.; Pleger, B.; Lepsien, J.; Goldhahn, D.; Schloegl, H.; Stumvoll, M.; Villringer, A.; Turner, R. Eigenvector centrality mapping for analyzing connectivity patterns in fMRI data of the human brain. PloS ONE 2010, 5, e10232. [Google Scholar] [CrossRef] [PubMed]
- Langville, A.N.; Meyer, C.D. Google’s PageRank and beyond: The science of search engine rankings; Princeton University Press: Princeton, NJ, USA, 2011. [Google Scholar]
- Page, L.; Brin, S.; Motwani, R.; Rajeev, M.; Terry, W. The PageRank Citation Ranking: Bringing Order to the Web; Stanford InfoLab Publication Server: Stanford, CA, USA, 1998. [Google Scholar]
- Tang, X.; Wang, J.; Zhong, J.; Pan, Y. Predicting essential proteins based on weighted degree centrality. IEEE/ACM Trans. Comput. Biol. Bioinform. (TCBB) 2014, 11, 407–418. [Google Scholar] [CrossRef] [PubMed]
- Brandes, U.; Borgatti, S.P.; Freeman, L.C. Maintaining the duality of closeness and betweenness centrality. Soc. Netw. 2016, 44, 153–159. [Google Scholar] [CrossRef]
- Krebs, V. Power in Networks. Available online: http://www.orgnet.com (accessed on 28 March 2019).
- Hua, J.; Huang, M.; Huang, W.; Zhao, C. Applying Graph Centrality Metrics in Visual Analytics of Scientific Standard Datasets. Symmetry 2019, 11, 30. [Google Scholar] [CrossRef]
- Spindices, Index Mathematics Methodology. Standard & Poor’s. Available online: https://us.spindices.com/documents/methodologies/methodology-index-math.pdf (accessed on 28 March 2019).
- Li, J.; Covertino, M. Optimal Microbiome Networks: Macroecology and Criticality. Entrop 2019, 21, 506. [Google Scholar] [CrossRef]
Figure 1.
An XML graph model sample that contains two vertices and one edge.

Figure 2.
The workflow of this study.

Figure 3.
An overview of the Australian stock market (|E| = 1379; |V| = 11,535; weighted degree metrics applied).
Figure 3.
An overview of the Australian stock market (|E| = 1379; |V| = 11,535; weighted degree metrics applied).

Figure 4.
An example of a traditional chart for showing five stocks’ price changing trends (from https://www.investing.com/charts/real-time-stocks-charts).
Figure 4.
An example of a traditional chart for showing five stocks’ price changing trends (from https://www.investing.com/charts/real-time-stocks-charts).


Table 1.
Tools and technology summary in this study.
| Evaluation | Tools and Technology |
|---|---|
| Data formatting/filtering/cleansing | Individual stock price changing rate calculation Cross-comparisons of stock price changing rates |
| Graph model generation | XML/graphml |
| Graph layout generation | Gephi/ForceAtlas 2 |
| Centrality measurements | Betweenness/Closeness/Eigenvector/PageRank/Weighted Degree |
Table 2.
Similarity rates between five centrality measurements results and top 300 stocks from ASX on selected dates.
Table 2.
Similarity rates between five centrality measurements results and top 300 stocks from ASX on selected dates.
| Similarity Rate (%) | ||||||
|---|---|---|---|---|---|---|
| Metrics | Betweenness | Closeness | Eigenvector | PageRank | Weighted Degree | |
| ASX Date | ||||||
| January, 2019 | 57.17 | 50.57 | 48.74 | 61.56 | 64.13 | |
| December, 2018 | 56.98 | 50.41 | 48.58 | 61.00 | 63.56 | |
| July, 2018 | 55.72 | 49.53 | 47.71 | 59.73 | 62.64 | |
| February, 2018 | 54.94 | 48.76 | 46.57 | 59.31 | 61.86 | |
| December, 2017 | 55.19 | 48.98 | 46.78 | 59.58 | 62.13 | |
| July, 2017 | 54.46 | 48.94 | 46.73 | 59.25 | 62.19 | |
| January, 2017 | 52.29 | 47.84 | 45.98 | 57.11 | 61.56 | |
| August, 2016 | 50.16 | 45.72 | 45.35 | 55.39 | 60.59 | |
Table 3.
Top 20 stocks of five centrality measurements (please refer to www.asx.com.au for stock details).
Table 3.
Top 20 stocks of five centrality measurements (please refer to www.asx.com.au for stock details).
| Betweenness | Closeness | Eigenvector | PageRank | Weighted Degree | |
|---|---|---|---|---|---|
| 1 | SCP | MIG | BXB | RAC | BXB |
| 2 | IAM | VGL | WOW | WOR | TLS |
| 3 | WOR | CQG | FXL | WMC | WOW |
| 4 | IAF | SGC | WBC | WAM | FXL |
| 5 | RCB | PGS | CHC | STW | WBC |
| 6 | CNU | SAS | DWS | SLF | MFF |
| 7 | MPL | ICI | TAH | TLS | AUB |
| 8 | CAT | CCE | EHL | SMI | WAM |
| 9 | OML | SRO | STO | WOW | CHC |
| 10 | BIR | LI3 | MFF | WBC | SOL |
| 11 | RAC | TRA | SHL | TNE | TAH |
| 12 | SMI | ITL | AUB | MAY | RHC |
| 13 | QFY | CIA | SGP | MRD | RIO |
| 14 | WAM | KSM | SOL | BXB | DWS |
| 15 | INA | SUM | WPL | SUN | WPL |
| 16 | PLG | TMT | CUV | AUB | STO |
| 17 | TLS | AGC | TGG | RHC | SHL |
| 18 | FCT | GTT | RIO | SEK | SGP |
| 19 | SLF | AJN | WTP | WTP | WTP |
| 20 | HUB | AJO | CFE | MIG | WES |
Table 4.
Similarity rates between five centrality measurements results (%).
| Betweenness | Closeness | Eigenvector | PageRank | Weighted Degree | |
|---|---|---|---|---|---|
| Betweenness | 100 | 56.67 | 39 | 68.67 | 62.33 |
| Closeness | 56.67 | 100 | 47.67 | 54 | 56.33 |
| Eigenvector | 39 | 47.67 | 100 | 54 | 65 |
| PageRank | 68.67 | 54 | 54 | 100 | 81.33 |
| Weighted Degree | 62.33 | 56.33 | 65 | 81.33 | 100 |
© 2019 by the authors. Licensee MDPI, Basel, Switzerland. This article is an open access article distributed under the terms and conditions of the Creative Commons Attribution (CC BY) license (http://creativecommons.org/licenses/by/4.0/).
Share and Cite
MDPI and ACS Style
Hua, J.; Huang, M.; Huang, C. Centrality Metrics’ Performance Comparisons on Stock Market Datasets. Symmetry 2019, 11, 916. https://doi.org/10.3390/sym11070916
AMA Style
Hua J, Huang M, Huang C. Centrality Metrics’ Performance Comparisons on Stock Market Datasets. Symmetry. 2019; 11(7):916. https://doi.org/10.3390/sym11070916
Chicago/Turabian StyleHua, Jie, Maolin Huang, and Chengshun Huang. 2019. "Centrality Metrics’ Performance Comparisons on Stock Market Datasets" Symmetry 11, no. 7: 916. https://doi.org/10.3390/sym11070916
Note that from the first issue of 2016, this journal uses article numbers instead of page numbers. See further details here.