1. Introduction
Bank lending activities are extremely appealing to companies, as they allow them, within a relatively short period of time, to acquire the financial resources they need in order to invest in business activities. Most business activities have investment return rates that secure the bank from the reimbursement point of view. Furthermore, banks require guarantees. These guarantees are able to protect banks from potential business disruptions. This action puts the companies in a situation in which it is impossible to repay their financial debts. Another measure taken by banks is the financial sustainability analyses which are carried out to substantiate the lending decisions that relate both to the business itself as well as to the investment project that is the subject of financing. Banks are, thus, theoretically a shelter, in the face of possible cash-flow crises that may interfere in the repayment of loans and interest.
Bank loans, especially those used for long-term investments, generate assets that, irrespective of their nature, have an important impact on companies’ business. Whether we are discussing them in terms of increasing labor productivity, reducing specific consumption, expanding production/services, or in terms of improving companies’ economic performance, their impact is reflected in increasing company market value. The assets resulting from bank financing and from other sources of finance constitute the basic infrastructure of any economic activity carried out by companies. In addition, they contribute to meeting consumption needs through products and services. Assets that are part of this ecosystem are subject to the irreversible process of depreciation, through which they transfer parts of their value to resulting products and services. However, asset depreciation (especially for infrastructure and production assets) becomes a cost element for the company which is found in the production cost unit and, later, in price. By collecting current receivables, the company basically forms the necessary funds for the repayment of financial debts to the bank. When there are serious differences between the projected assets production capacity and the volume of finished goods and services that are sold to consumers, the risk of cash-flow deficits is present, which makes it difficult for the firm to pay the debts to its financial creditors.
Asset depreciation depends on asset value and estimated lifetime, which are two important elements of the depreciation system which determine the proportion of the asset value transferred to the products and services obtained. This value transfer is an essential element in the process of cash-flow formation needed to repay debts to financial creditors. Depreciation becomes the transport means of value between assets in the production ecosystem and the finished products or services resulting from the company’s operational activity.
On the other hand, cash-flow is needed for credit repayment and this is based on the amount and duration of credit, which is often lower than the asset’s life. The gap between the loan repayment period and the asset depreciation period is the main cause of cash-flow deficits, which are covered from the company’s current activity.
These cash-flow deficits are random variables by nature that depend on the company’s economic performance and are detected in this paper using the Mamdani fuzzy logic system [
1,
2,
3].
The proposed system aims to determine the values for the output variable in a probabilistic environment and to estimate the value of the available cash-flow (CFA) using fuzzy variables. Once cash flow deficits have been detected, urgent measures need to be identified to avoid the financial contagion risk that may ultimately lead to chronic delays in repaying debts to financial creditors. Financial contagion harms the company, making it no longer able to comply with its obligations to financial creditors, and, in this way, leading to the occurrence of synapses and even to bankruptcy.
The purpose of this paper was to develop a modern and complex financial management tool with the help of artificial intelligence techniques to detect the risk probability that emerges in the bank lending process as a result of fluctuations occurring in the operating activity of a company.
The novelty of this paper is its use of fuzzy stochastic variables based on two specific functions, namely, the probabilistic density function (as a stochastic variable) and the membership function (as a triangular fuzzy variable). With the help of the Mamdani fuzzy logic system developed in this study, the probabilistic values of the influence factors in the credit process are identified—earnings before interest, taxes, depreciation, and amortization (EBITDA) and the change in working capital —in order to subsequently detect the risks due to probabilistic cash-flow deficits (ΔCFD).
2. State of the Art
Fuzzy logic systems in stochastic environments have piqued the interest of researchers in recent years, being used especially in the following domains: engineering, computer science, and applied mathematics. Thus, starting from 1992, there were 485 scientific papers published in ISI (International Scientific Index) journals worldwide, as can be observed in
Figure 1 [
4].
Most articles have been published in the field of engineering electrical electronic (32%), followed by artificial intelligence (31%), and automation control system (22%). Other areas of interest have been computer science theory methods (11%), computer science information systems (8%), computer science interdisciplinary applications (8%), operation research (8%), engineering multidisciplinary (7.6%), mathematics applied (6%), computer science and cybernetics (5%), management (0.8%), business (0.4%), economics (0.4%), and social sciences (0.2%).
Among the authors of these, Liu and Li [
5] created a fuzzy logic system in order to improve the stochastic modeling capability. Their model used a three-dimensional membership function for managing the random noise effect and stochastic uncertainties and a unique defuzzification method. In another paper, Liu and Li [
6] developed an instrument to process stochastic and imprecise information. The authors created a probabilistic fuzzy logic system for modeling the stochastic and imprecise information using a 3-dimensional probabilistic fuzzy set.
Li et al. [
7] used a Dempster-Shafer structure based fuzzy logic system in stochastic modeling to improve the fuzzy inference under the complex stochastic environment. Their model was able to capture the stochastic disturbance acting on the fuzzy membership function and to provide a more effective inference under strong stochastic uncertainty.
Dabbous [
8] realized a fuzzy logic system in order to filter the observed systems governed by linear stochastic differential equations using the Takagi-Sugeno linear fuzzy model and assuming membership functions of Gaussian type.
Spall and Cristion [
9] solved the problem of a stochastic system controller with unknown equations by using discrete-time measurements, managing at the same time to accommodate complex systems with possibly time-varying dynamics.
In the economic field, Ferreira et al. [
10] created indices for bank branch financial performance measurements using multi-criteria decision analysis (MCDA) techniques by integrating cognitive maps with measuring attractiveness by a category-based evaluation technique.
Aksoy et al. [
11] constructed a fuzzy logic system to solve multi-period dynamic decision making for strategic supplier selection with stochastic demand, while Ghani et al. [
12] developed a fuzzy logic intelligent system for measuring customer loyalty and decision making. Bolos et al. [
13] elaborated on a model that adjusts the
GM(1, 2) errors for financial data series that measure changes in the public sector financial indicators. Adjusting the errors in grey models must follow some rules that cannot be determined based on the chaotic trends they register in reconstructing data series. In order to ensure the adjustment of these errors, for improving the robustness of
GM(1, 2), an adaptive fuzzy controller was constructed. The adaptive fuzzy controller has the advantage of setting the values for error adjustments by the error’s intensity, making it possible to determine the value adjustments for each element of the reconstructed financial data series.
Nielsen and Kristensen [
14] created a system that modeled Markov decision processes using directed hypergraphs in order to find the
K best policies in a finite-horizon. The system ranked the first
K deterministic Markov policies in non-decreasing order using an additive criterion of optimality. The European options were modeled with uncertainty of both randomness and fuzziness in output by Yoshida in 2003, by introducing fuzzy logic to the stochastic financial model. The randomness and fuzziness in the systems were evaluated by both probabilistic expectation and fuzzy expectation, taking account of the seller’s/buyer’s subjective judgment.
Other practical applications including fuzzy logic that can be mentioned are: the design of a warning system and fire monitoring system for smart buildings [
15], modeling pedestrian dynamic behavior [
16], choosing the location for power plants [
17], supplier evaluation and selection [
18], investment decision optimization [
19], assessing the commercial viability of technology start-up businesses [
20], e-commerce regional cooperation [
21], material selection procedures [
22], risk assessment [
23], cooperative mobile robots’ learning [
24], and alternatives’ evaluation [
25], etc. As for the theoretical aspects related to fuzzy logic application with regard to multi-attribute decision making, more can be read in [
26,
27,
28,
29,
30,
31,
32,
33,
34,
35,
36,
37].
The novelty of this paper is better reflected in comparison with the studies elaborated to date and presented in this section. The proposed paper presents a series of novelty elements, among which are:
It is the first financial management tool that uses an artificial intelligence technique for bank lending issues;
The Mamdani fuzzy logic system uses stochastic fuzzy variables, which allows for the identification of probable lending periods in which credit reimbursement risk may occur;
It examines the lending risk for future periods during the reimbursement period according to two important economic indicators, namely, EBITDA and changes in working capital . The values of these two indicators are also probabilistic values;
It allows for identification of cash-flow deficits for future periods of time underlying the credit reimbursement risk during the lending period;
It allows preventive measures to be taken in order to avoid or even mitigate bank lending risks.
3. The EBITDA and Available Cash-Flow Rule, and the Influence of Stochastic Elements
Credit lending policies are geared towards analyzing the company’s financial performance both in terms of operating activity and projects’ profitability. Among the most important key performance indicators (KPIs) of a company are EBITDA and CFA [
19]. Both of these have a very important role in measuring and assessing a company’s financial performance for bank financing as both contain information about the company’s ability to repay debt to its financial creditors.
EBITDA provides information on the company’s profitability of the operating activity by summing the net profit (
) with the interest expense (
), the depreciation charge (
), and the tax expenses (
), using a relatively simple formula:
CFA in turn measures the financial potential of the company to repay debt to the financial creditors, but also to pay tax liabilities and pay the shareholders. It is obtained by summing the earnings before interest and taxes (EBIT) with the reversible and irreversible depreciation expenses
), and deducting the change in working capital (
) and the change in capital expenditures (
) using a formula of the form:
Both CFA and EBITDA evolve over time in a random, assumed continuum manner and the stochastic values of these elements depend on various factors of influence.
Definition 1. EBIT(t) is a random variable that evolves over time in a random mode and can take any value from, or EBIT (t) ∈. It is assumed that EBIT (t) describes a continuous stochastic process which is normally distributed and has the probability density function of the formwhich will always take positive values,. The distribution function can be written as a primitive form of the probability density function: Geometrically, the above condition can be interpreted as that the under-graph area of the probability density function should be equal to 1. The probability density function has the mean (μ) and the variance () and can be denoted as .
Theorem 1. The dynamic equation of EBIT (t), as a standard normal distribution process (μ = 0 and σ = 1) over the credit period Δt, may be expressed as follows:
Proof. EBIT, as an indicator for measuring the return value of the operating activity, may take different values within the credit repayment period. For the interval
, the change in value is of the form:
If we split (Δ
t) into subintervals of the form
, any increase in
EBIT over the
can be written as:
By logarithm of the above expression we obtain:
According to the central limit theorem, it is known that for very large values of n we will have , so in a normal distribution with μ = 0 and σ = 1 it will follow that:
. has a log-normal distribution;
is normally distributed;
, with random, independent and finite variables.
We consider the assumption that EBIT evolution describes a log-normal law. In order to write the EBIT variance (
) as a stochastic process with a normal distribution, we start from the expression of the company’s profitability for the operating activity (
):
The above relationship can be written as follows:
By logarithm, the following is obtained:
. For small values of
x we will have
, so that
. Since
has a normal distribution and
μ is the average or annual profitability of
EBIT during the lending period (Δ
t) and
σ, the annual volatility may be expressed as:
The dynamic EBIT equation as a normal distribution stochastic process can be written as
or
where
, with
being a random variable with standard normal distribution:
and
. □
Theorem 2: The likelihood that EBIT will take certain values over a certain period (t) of the credit interval Δt under the conditions in which CFA = lnEBIT (with logarithmic evolution) or CFA = f(EBIT) can be established by the relation: Proof: We assume that the evolution of the available cash-flow is logarithmic and characteristic of the assets resulting from bank financing, which mostly depend on EBIT evolution. The logarithmic evolution of CFA is explained by the fact that its values are large at first, but as assets depreciate, the CFA values begin to decrease as a result of increased operating costs. This assumes that or .
EBIT dynamics have been described above and are given by the relationship:
According to Itô’s lemma [
38], between
CFA and
EBIT a relationship will be established which takes the following form:
Calculation of derivatives leads to the following results, namely:
By replacing the predetermined partial derivatives in Itô’s lemma [
38], we will have:
or
By taking into consideration that at the initial moment
we will have a value of
, we assume that:
From Theorem 1 it results that
is normally distributed with the following normal distribution:
By applying the probability formula for the standard normal distribution we will have:
By solving the above inequality, it follows that
or
In conclusion, it can be stated that the EBIT evolution during the lending period depends on the initial EBIT value, which is also presumed by its annual average (μ) and the standard deviation (σ), according to the above formula. □
4. Cash Flow Deficits during Lending Period
Cash flow deficits during lending periods are unavoidable due to the fact that reimbursement periods () are almost always shorter than the invested capital recovery periods. These recovery periods, also called amortization periods (AP), are an irreversible depreciation. Modern economic theory has introduced the notion of economic life (EL), which is understood as the time period in which the capital invested in infrastructure is recovered. Between the repayment period () and the economic life of the infrastructure assets (EL), there is the relationship () < (EL).
The size of cash flow deficits (CFD) is influenced by two main elements, namely, the amount of capital recovered annually as a result of investment in infrastructure assets and the amount of credit and interest reimbursement rates due to financial creditors.
The amount of capital recovered annually as a result of investments in infrastructure () is also known in the literature as the value of the annual depreciation and depends on two parameters: invested capital (IK) and share of capital recovery (RCS = ). The annual value of the capital recovered as a result of infrastructure investments is given by: = IK × . The capital recovered annually may be linear, degressive, or accelerated, which is similar to the current depreciation rates that companies use for the amortization system. For ease of calculation, it is assumed that the annual share of recovered capital invested in infrastructure assets is linear and the system can be adapted to company needs.
The recovered capital invested in infrastructure assets takes place by including the amounts resulting from the recovery mechanism described above in the products and services value obtained. Thus, during the economic life of assets equal to n (EL = n), taking into account an annual discount rate (), the annual values of the recovered capital may be expressed as follows:
For the first year of asset operation: . For the second year of asset operation: . For the last year (n) of asset operation: . If the discount rate ( = cst) is constant over the asset’s life, the annual amount of the capital recovered as a result of the investments in the infrastructure assets can be written as follows: ; ; …; ; or, in generalized form: .
The amount of credit and interest reimbursement rates () follows the same rules as in the banking domain knowledge. The value of these rates depends on the amount of the borrowed capital (BK) and the credit repayment time () equal to m, with and the interest rate .
For the first year of the reimbursement period, the repayment rate () and the interest rate will be determined using the relationship: . For the second year of the reimbursement period, the repayment rate and the interest rate will be determined using the relationship: . For the last (m) year of reimbursement period, the repayment rate and the interest rate will be determined using the relationship: .
If the discount rate (
=
cst) is constant over the reimbursement period, the repayment rate and the interest rate will be given by the following relationship:
Or, in generalized form:
The option for computing the amount of capital recovered as a result of investments in infrastructure assets (ARC) and for the value of credit and interest reimbursement rates () can be adapted in response to the complexity or specificity of each company in order to prevent cash-flow deficits that may threaten maturity reimbursement.
Since , , which leads to short, medium, and long-term occurrence of cash-flow deficits. The amount of these deficits for each year of the reimbursement period is as follows:
For the first year of the reimbursement period, the amount of the cash-flow deficit will be:
For the second year of the reimbursement period, the amount of the cash-flow deficit will be:
And for the last year (
n) of the reimbursement period, the amount of the cash-flow deficit will be:
The value of the cash-flow deficit during the reimbursement period will be:
Cash-flow deficits are covered by the available cash-flow the company derives from its operating activity. In order to ensure repayment of the loan and interest, the company will have to achieve an annual CFA level that is higher than the annual cash flow deficit (CFD): . The value of the required level of CFA(i) for the compensation of CFD(i) will be determined using fuzzy modeling, with CFA considered the output variable of the probabilistic fuzzy logic system.
5. Identification of Fuzzy Stochastic Variables
Fuzzy variables are extremely useful in studying the reimbursement of bank loans as they capture very well the "vague" notion that is involved in analyzing the company’s financial sustainability. For example, EBIT values can be classified as large or medium, assuring the shift from one linguistic value to another gradually using fuzzy sets.
Definition 2. The EBIT variable is a triangular fuzzy variable defined by fuzzy sets and it is notedif for anyand for any a, b which are two real non-negative numbers, the variableis the fuzzy subset on R, defined by the function of membership: If a and b = 0 thanandfor.
The EBIT values resulting from the company’s operating activity over a period of time (Δt) have different membership degrees. These are determined by the membership function and can take values in . The triangular fuzzy set defined by the fuzzy variable is of the form: , using the aforementioned membership function.
At the same time, the variable EBIT(t) is a random variable that can take any value from R, which describes according to Definition 1 a random, continuous, normally distributed process with the distribution function and with the distribution function written as a primitive of the distribution density function .
Also, according to Theorem 2, the probability for EBIT to take a certain value during the lending period (Δt) is given by the relation: .
Definition 3. The EBIT is called a stochastic fuzzy triangle variable if for any x ∈ R and for any a, b which are two real non-negative numbers, the following conditions are cumulatively met:
- (1)
The variable EBIT = (x, a, b) is defined by the membership function of the form: - (2)
The interval [a, b] is defined by the variable probability of occurrence of the variablewhich is given by the relation:;
- (3)
The number of membership degrees for the stochastic fuzzy triangular variableis located in the range:;
- (4)
is a random variable with the distribution density functionand with the distribution function written as a primitive of the distribution density function
The probabilistic fuzzy values of the input variables for the definition interval are ordered by means of linguistic values to determine the membership degree and the formation of the rules specific to the probabilistic fuzzy logic system. At these probability ranges the membership degree of the fuzzy variables defines the fuzzy set that is formed by the membership function.
6. Elaboration of the Mamdani Fuzzy Logic System in a Stochastic Environment
The existing problem: Most companies have difficulties in assessing the risks involved in banking lending policy. This is because the factors influencing these kinds of risks are extremely complex and diversified. It is not known how the EBITDA will fluctuate or how the working capital will evolve over the lending period to prevent any financial difficulties caused by the lack of available cash-flow from which credit rates and interest are reimbursed. Thus, a financial management tool that detects bank lending periods in which the company may face financial difficulties in credit reimbursement must be identified. The credit reimbursement risk arises in the form of cash-flow deficits that occur during the bank lending period and lead to the impossibility of repaying bank loans and interest, with immediate consequences on the company’s operating activity. The financial management tool which is developed within this study will allow companies to set preventive measures over bank lending periods to avoid as much as possible the credit reimbursement risk mentioned above.
Suggested solution: For the detection of the cash-flow deficit risk during the lending period, as well as to establish preventive measures to mitigate this risk, a Mamdani fuzzy logic system with stochastic fuzzy variables has been developed. These variables allow for the study of reimbursement risk at certain probabilistic value ranges, in order to determine whether this risk may occur during these intervals. The output variable (CFA) indicates whether there is a probability of cash-flow deficits during these intervals.
The probabilistic Mamdani fuzzy logic system aims to determine the values of the output variable and the available cash-flow for future time periods, resulting from the fuzzy modeling of the system input variables. The input variables are stochastic fuzzy variables. The resulting CFA values form the system output variable, which will also be a stochastic fuzzy variable, which analyzes the cash-flow deficit during the lending period.
Definition 4. Any probabilistic fuzzy logic system, normally distributed, has the following features:
The input variables of the fuzzy logic system are stochastic, normally distributed, and have the estimated values determined by the relation:, with the corresponding fuzzy set;
The fuzzy logic system rules are formed on the variation intervals of the fuzzy input stochastic variables and from the fuzzy modeling of the rules, with the output variable also being a stochastic and fuzzy variable;
The rule-based inference operation is a max-min type, specific to the Mamdani fuzzy logic system;
The fuzzy defuzzification of the result after the fuzzy inference operation is obtained with the Center of Aria (COA) method or the centroid defuzzification method. The results obtained using this type of defuzzification are sufficiently linear to obtain a control curve without sudden variations.
To obtain the fuzzy logic system in the probabilistic environment, the following steps are taken:
Step 1. Input variables identification: In the input variables category are included the variables that directly affect the available cash-flow and those considered the variables with direct impact on the cash flow deficit, being EBIT(t) and , being.
The stochastic fuzzy input variable
EBIT(
t) has the main influence on CFA with the following features. The
EBIT(
t) values are established using the following relation:
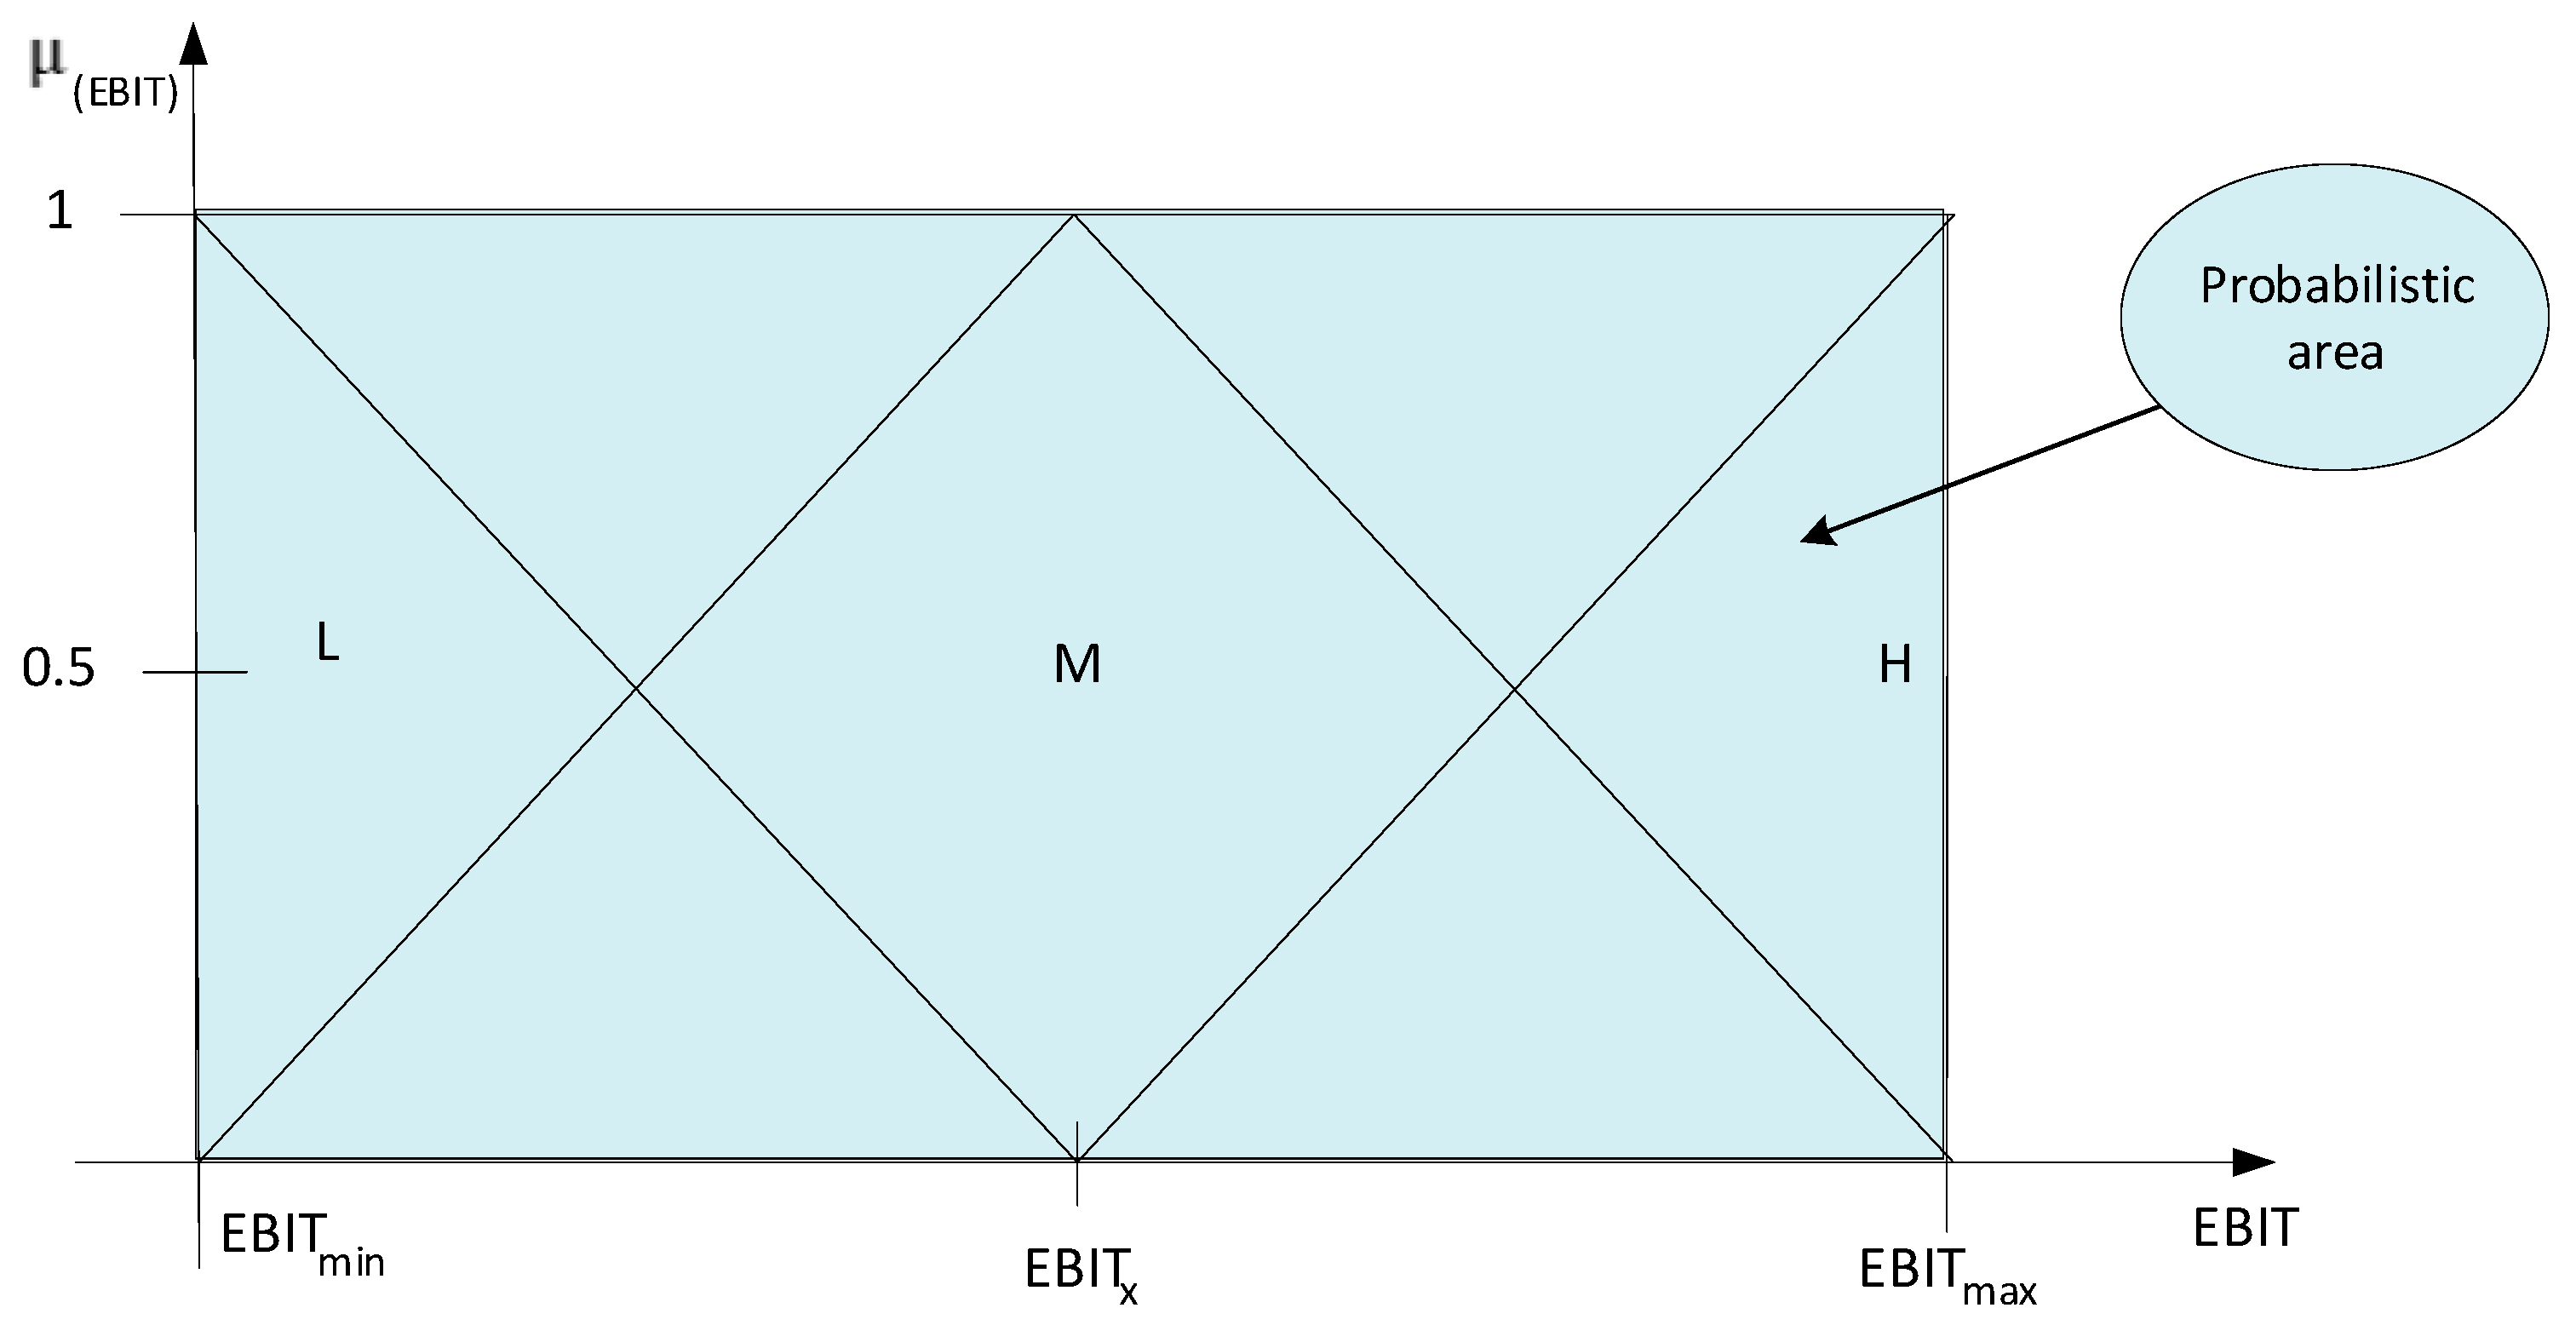
. For the aforementioned interval, the fuzzy set
E has the membership function established by the relation:
The linguistic values attributed to the triangular fuzzy stochastic variable are grouped into three categories—low (L), medium (M), and high (H)—which also take into account the probability values established using the above relation represented in
Figure 2.
The stochastic fuzzy input variable
(
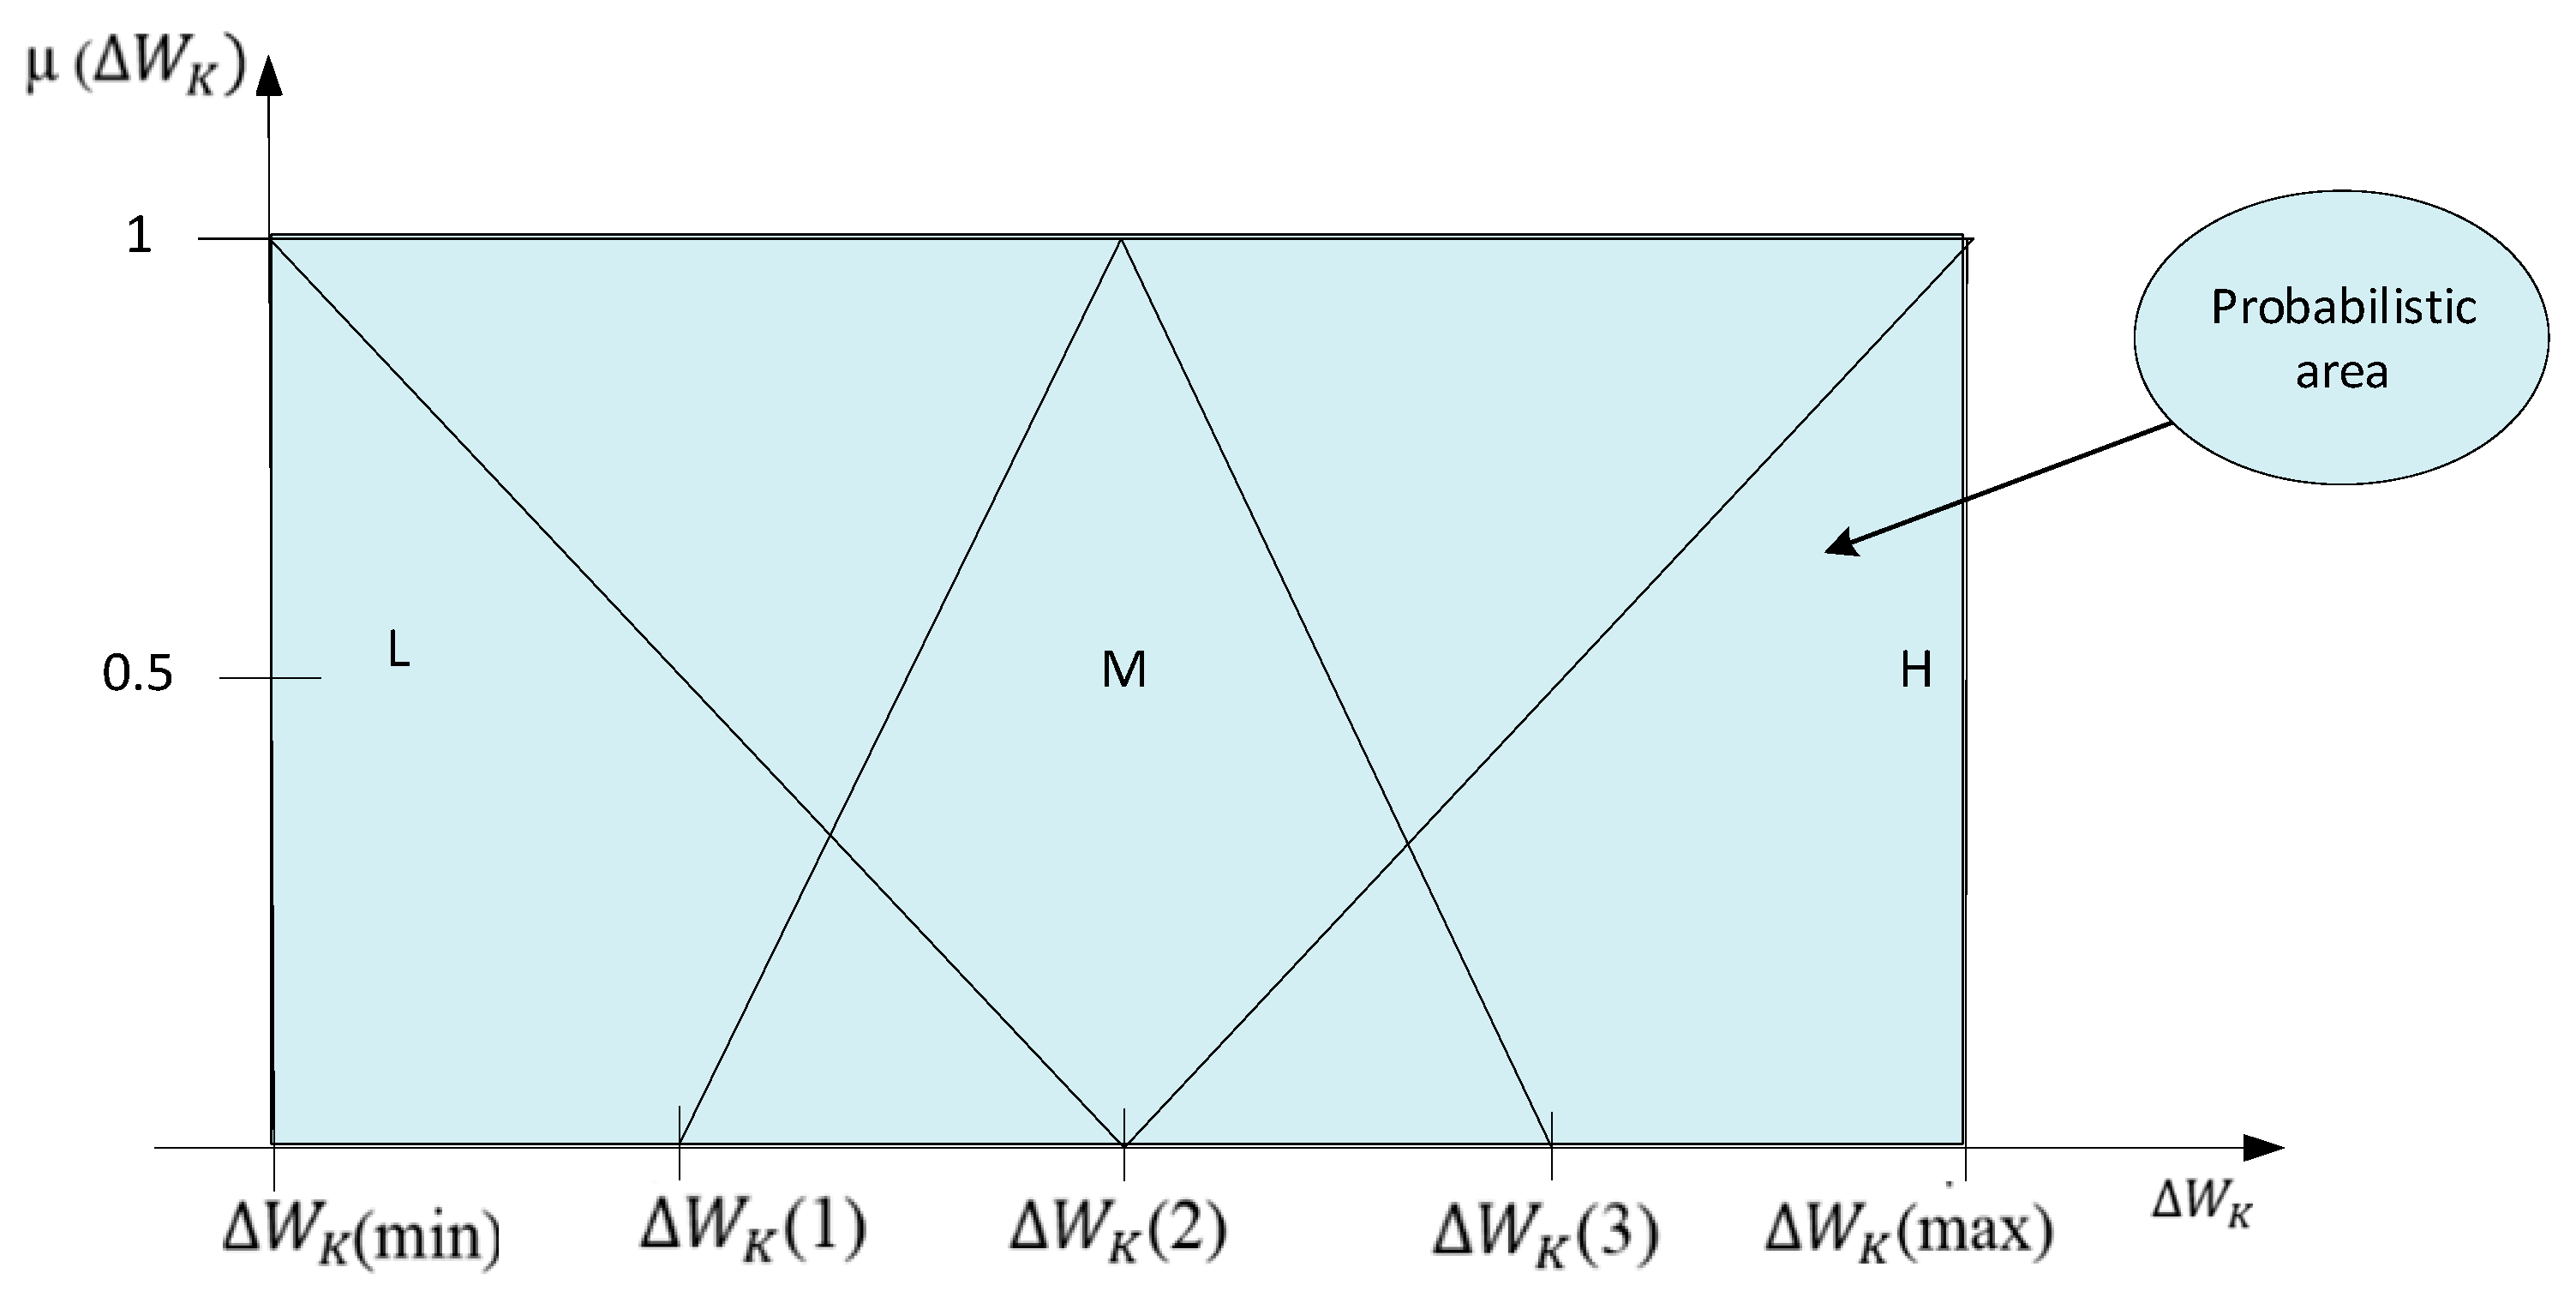
t) is the second variable of influence on the available cash-flow, and has the following characteristics. The values
(
t) are set values for future periods using the calculation relation:
. For the aforementioned variation range, the fuzzy set
has the membership function established by the relation:
Even in this case, the linguistic values attributed to the stochastic input variable are grouped into three categories: low (L), medium (M), and high (H). These also take into account the probability values established using the above relation represented in
Figure 3.
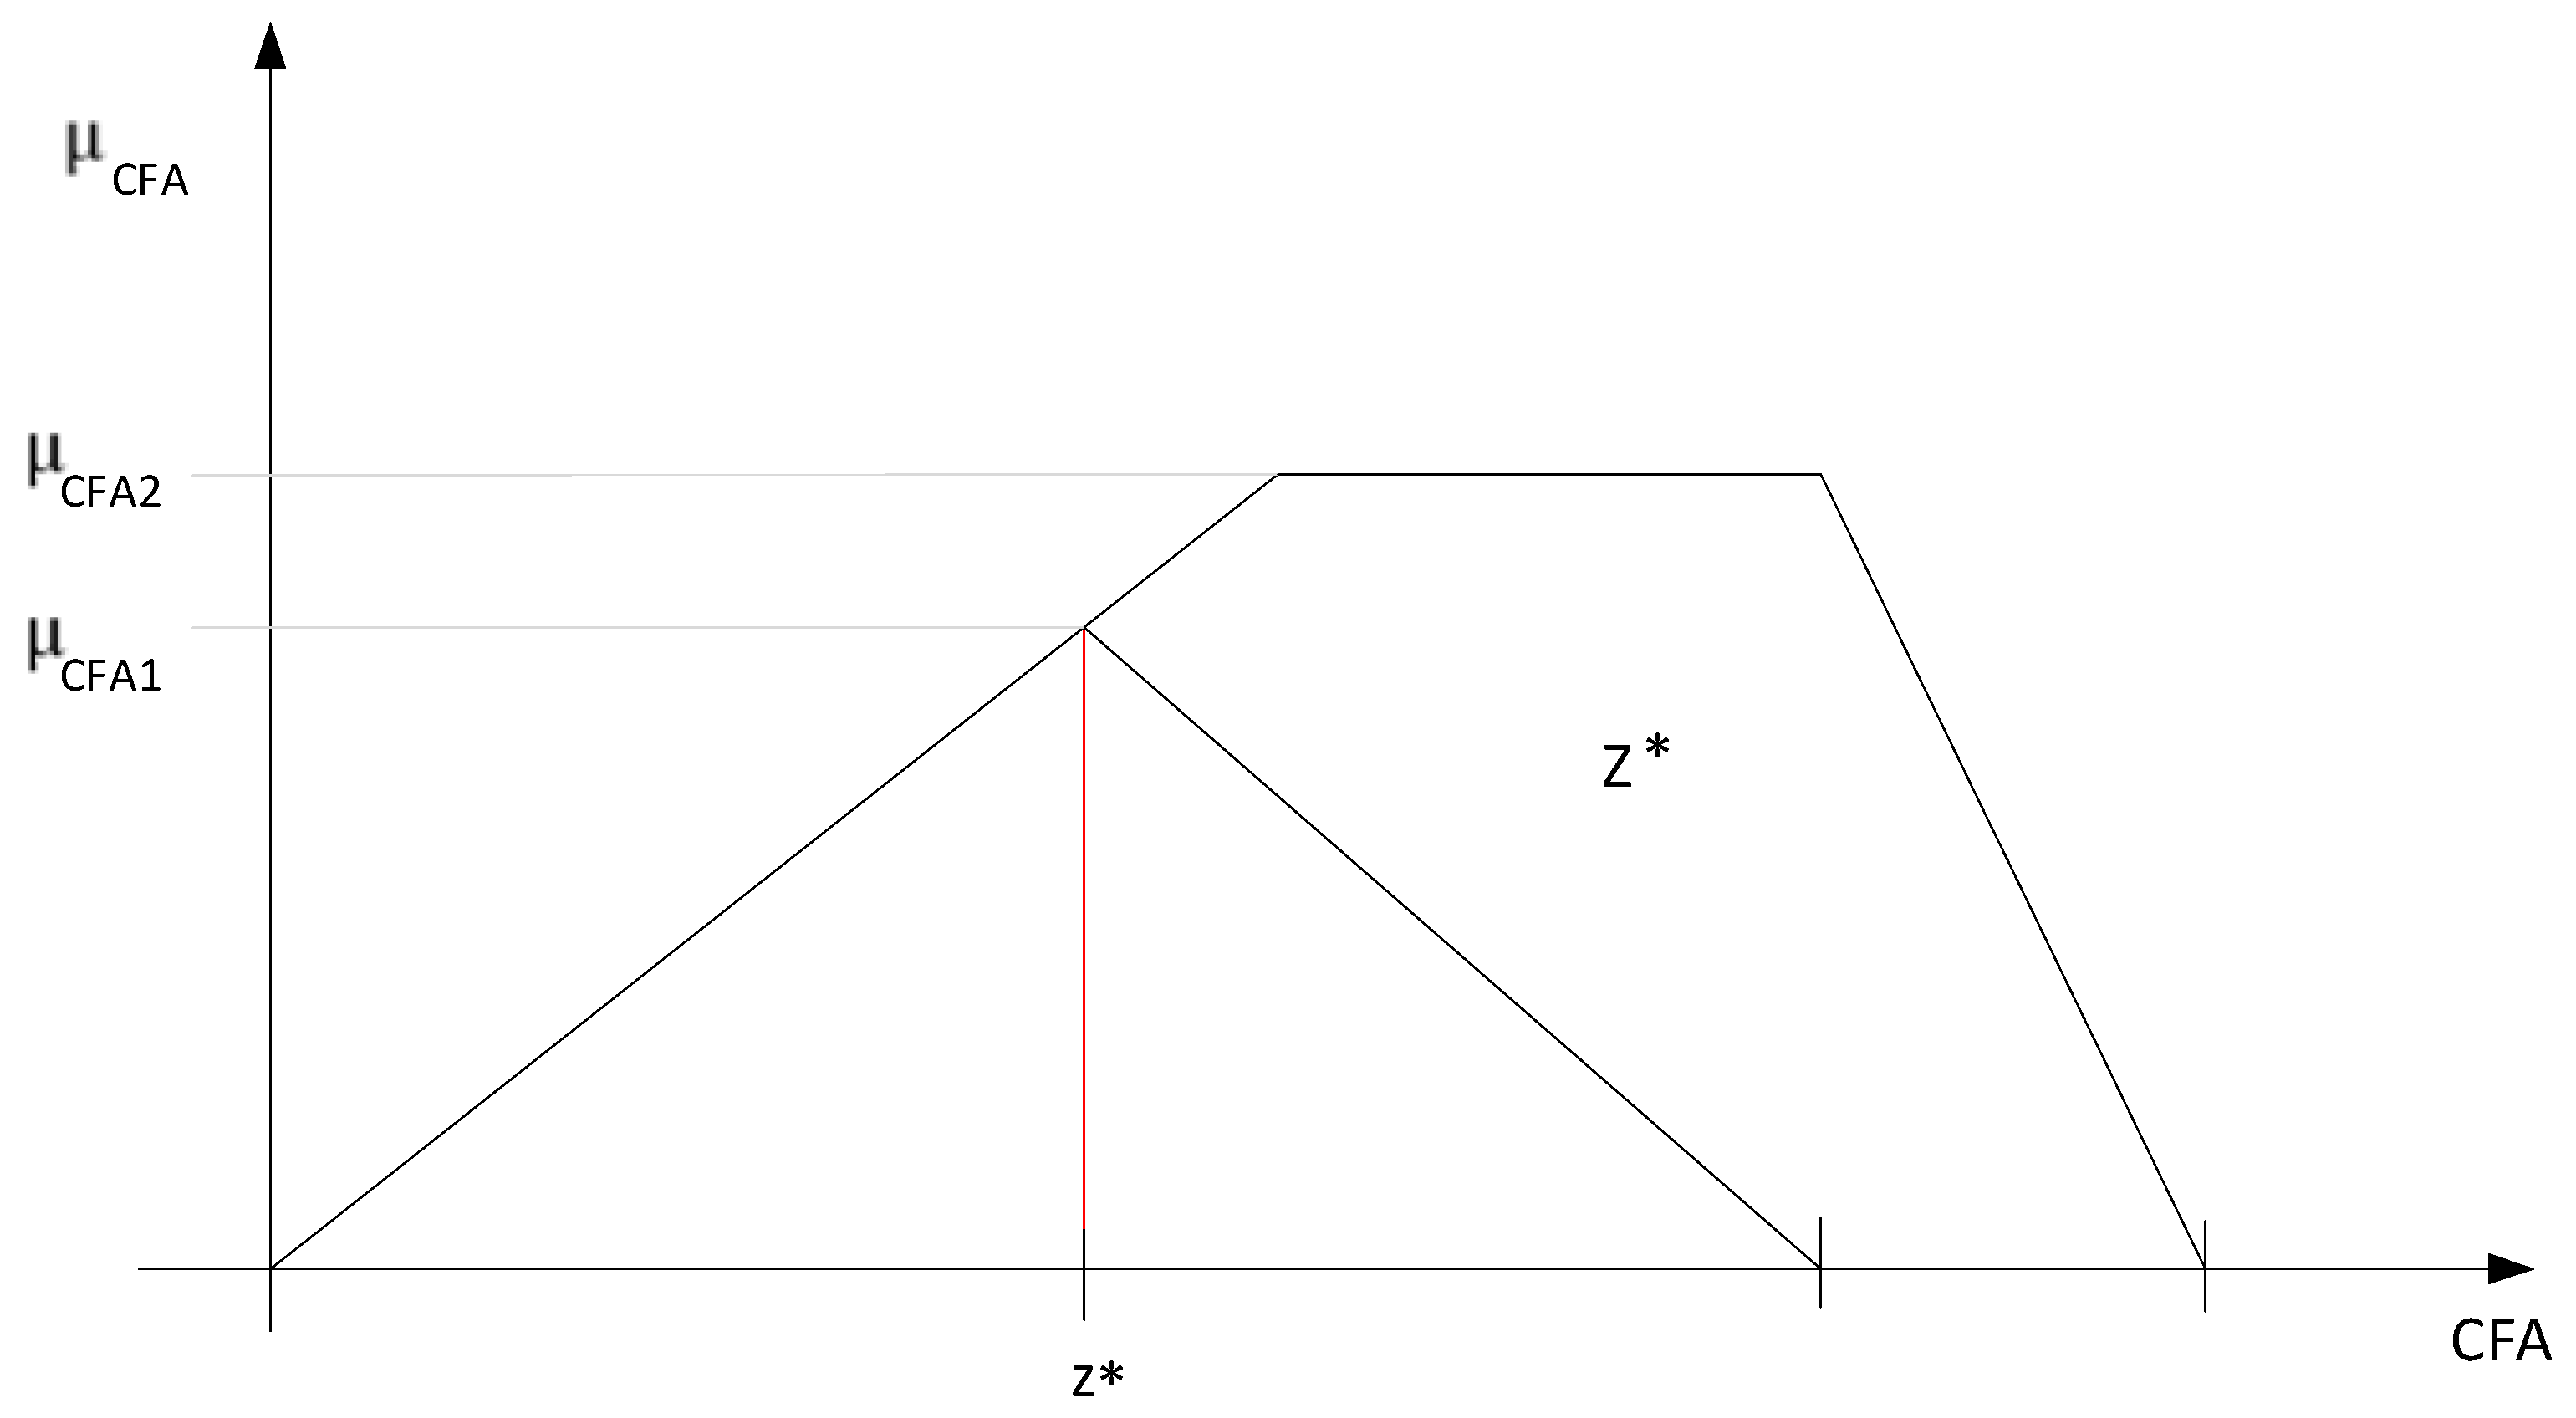
Step 2. Identification of the stochastic fuzzy output variable: the stochastic fuzzy output variable is the available cash-flow whose membership function is of the form:
The linguistic values attributed to the output variable are grouped into five categories—very low, low, medium, high, and very high—according to
Figure 4.
Linguistic variable stratification for the output variable was established to capture the exposure to the cash flow deficit risk so that the company can take early action to avoid financial difficulties.
Step 3. The Probabilistic Fuzzy Rule Base: This is constructed starting from the linguistic values assigned to them so as to set the CFA values to influence the company’s cash flow deficits during the lending period. The resulting rule basis is shown in
Table 1.
The inference operation of the rule-based probabilistic fuzzy logic system designed for the detection of cash-flow deficit within the lending policies is of max-min type. The implication relationship formula used for the mathematical description of each rule in the fuzzy rule base is of min type. The aggregating method of partial conclusions generated by the rules in the fuzzy rule base is of max type.
Step 4. Defuzzification: The final step in the probabilistic fuzzy logic system is the determination of the output variable, the defuzzification of the fuzzy result obtained after the fuzzy inference operation. This operation is known in the literature as the centroid defuzzification, or the Center of Aria (COA) method. The results obtained by this type of defuzzification are sufficiently linear in order to obtain a control curve without sudden variations.
The formula after which the value of the output variable is computed, based on the output fuzzy set, is determined as follows:
For continuous variables:
The output variable of the fuzzy controller
gives us information about the variable evolution when there is a change in the value of the input variables:
EBIT and
. An example is provided in
Figure 5.
7. Implementation of the Probabilistic Fuzzy Logic System for Detecting Cash-Flow Deficiencies in Bank Lending Policies
The mechanism of applying the probabilistic fuzzy logic system is based on the identification and establishment of cash-flow deficits during the lending period, as well as the identification of the risk exposures determined by the output variable (CFA), respectively. Those situations estimated on the future in which the company can no longer repay the debts to financial creditors at maturity consists of two steps:
The first step is to determine the amount of the cash-flow deficit for each year of the lending period according to the above calculation formula:
The formula for computing the cash-flow deficit is based on the calculation of the cash-flow requirement (
CFR) resulting from credit and interest reimbursement, as well as on the calculation of resources (
) from asset depreciation determined as the ratio between the amount of the borrowed capital and the economic life of assets. The structure of the cash-flow deficit is presented in
Table 2.
The data in
Table 2 shows the cash-flow deficit in every year over the reimbursement period, due to the gap between this period and the economic life of the assets. This deficit should be covered by the EBIT generated by the operating activity and the investment itself that is the object of the financing. In the second step EBIT is estimated from the company’s operating activity and from the working capital variation
for each year of the lending period, taking into account that EBIT and
are considered random input variables which are normally distributed and meet the requirements of Definition 3, using the formulas
and
The resulting variation ranges for EBIT and are stratified by local gradients in equal intervals of 10 values, and take the form: and .
The resulting values for EBIT and working capital variation are modeled using the probabilistic Mamdani fuzzy logic system to determine the CFA value attained when a change in EBIT and , as main factors of influence on CFA, is made. The CFA values established with the help of this fuzzy logic system enable the identification of the time periods that would be affected by the cash-flow deficit. In order to avoid the risk of late payment (or non-payment) of debts to financial creditors during these periods, the company must adopt measures to increase the value of CFA.
8. Fuzzy Logic Simulation in a Stochastic Environment
In order to conduct a simulation of the fuzzy logic system, two categories of data were considered: data related to the bank’s lending policy and data related to the company’s current activity. The bank lending policy refers to asset acquisition required for the operating activity with an estimated value of EUR 10 million, repayment duration of five years, an interest rate of 5%, and an economic life of 10 years. For each year the cash-flow deficit during the lending period was computed, starting from the cash flow requirements (credit and interest) and the available resources.
Cash-flow deficits are recorded each year during the lending period as the gap between the assets economic life (10 years) and the credit repayment period (five years). These cash-flow deficits must be covered by the available cash-flow resulting from the company’s operating activity. For the company’s current activity, the
EBIT was computed, as shown in
Table 3.
According to the calculations made using the second formula from Definition 3(2) for one year of the lending period, an estimated value for
EBIT(1) was obtained, with a probability of 99%:
Also, from the company’s current activity, the working capital variation
was obtained, and is presented in
Table 4 below:
According to the calculations made using the formula of Definition 3(2) for one year of the lending period, an estimated value for
was obtained, with a probability of 99%:
Based on the probabilistic values stated above, the input variables of the probabilistic fuzzy logic system have been modeled as
EBIT(
t) and
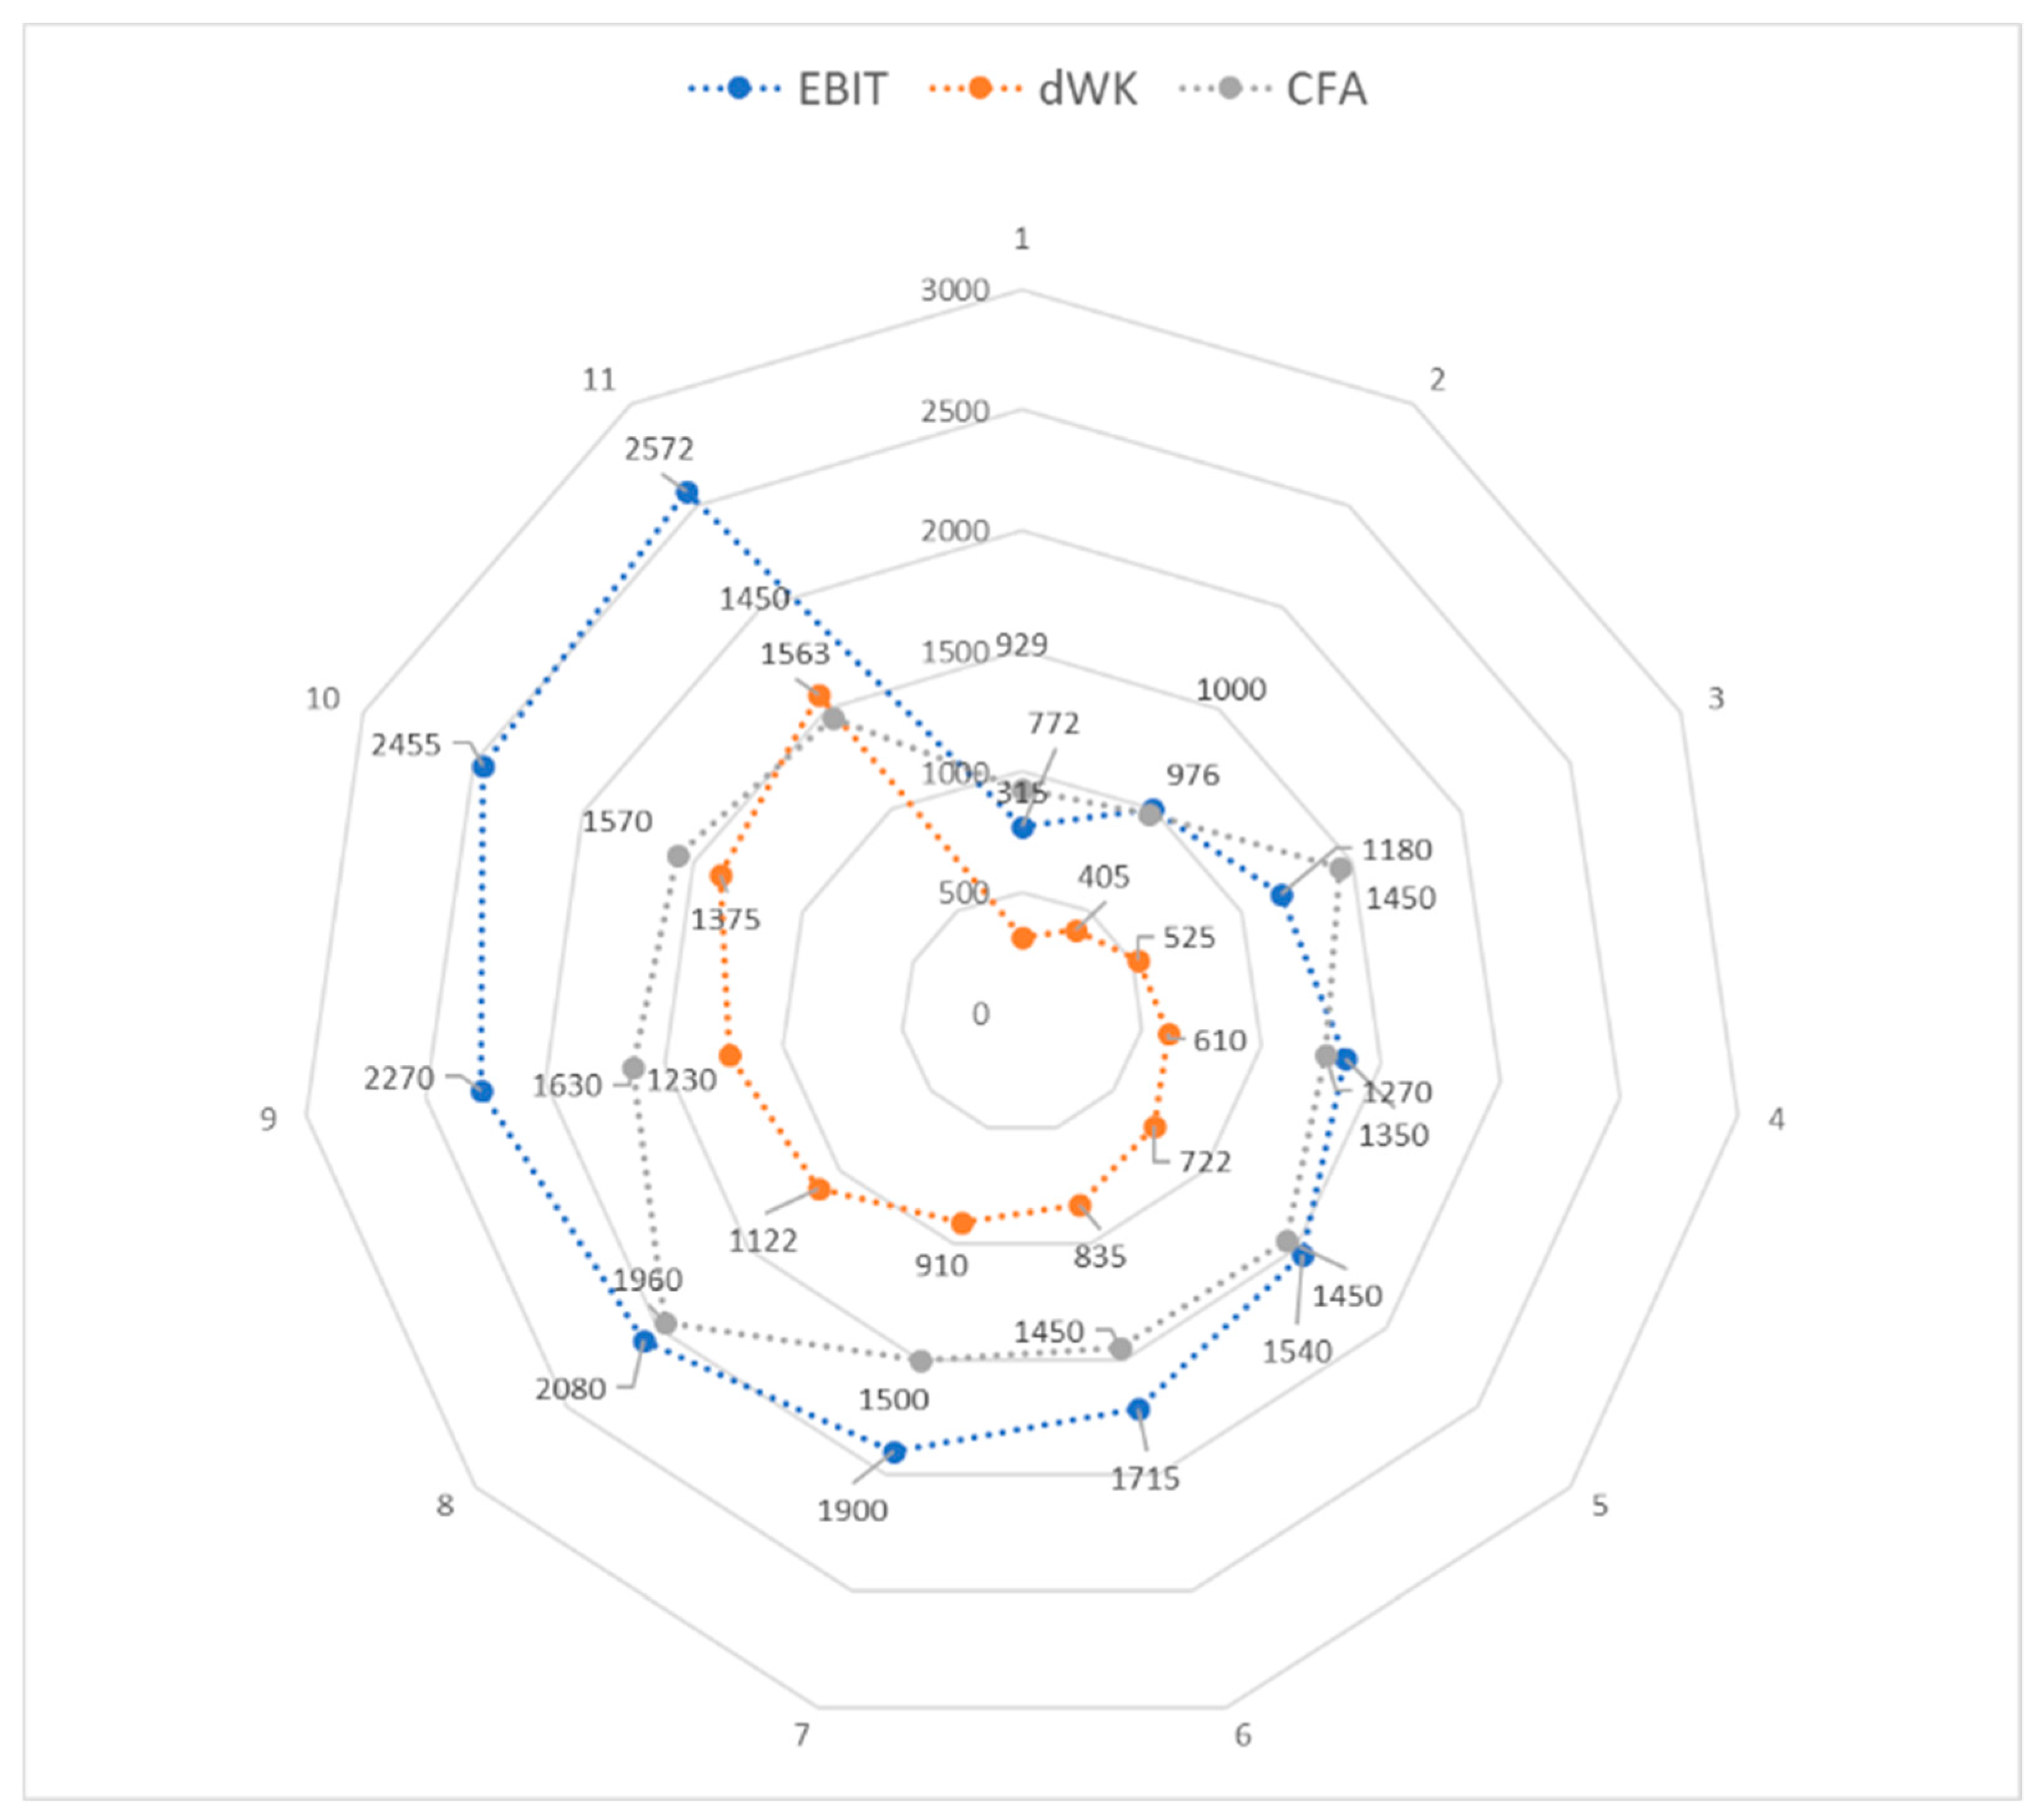
, and the output variable as CFA. The values of the output variable have been obtained by applying the max-min inference operation and the COA defuzzification method. The variation interval of the
EBIT(
t) and
was stratified with the help of local gradients. Also, the CFA was computed using the probabilistic fuzzy logic system, giving the results in
Figure 6.
From the above data it can be concluded that it is likely that in the first year of the credit period there will be cash-flow deficits for CFA values lower than the CFR for values of CFA smaller than 1500 million where the company will need to adopt a series of prudential measures aimed at increasing the CFA value. For values above 1500 million, the company will not register cash-flow deficits, but it is still useful to monitor CFA values that are closer to the funding requirement (1500 million) to avoid cash-flow deficits that make debt repayment impossible at maturity.
9. Conclusions
The proposed Mamdani fuzzy logic system in a stochastic environment uses stochastic variables as input variables: EBIT(t) and working capital variation . The main characteristic of these stochastic input variables is that they allow for estimation of the values for future time periods in the form of interval limits (min, max). Based on their values and using the fuzzy logic system, an output variable was obtained. The estimation interval used in the probabilistic fuzzy logic system is equal to one year. In order to obtain the results and to conduct an analysis related to cash flow deficit detection in corporate loan policy, a series of steps were followed.
The first step targeted the determination of the cash-flow requirement resulting from the reimbursement loan and interest rates. This stage had the role of determining the financial need of a company to cover its financial obligations to creditors. A second step was based on the identification of fuzzy stochastic variables with a role in influencing cash-flow deficits (EBIT and ) and also on estimating their probability values by making probability calculations.
Based on these values, and using the Mamdani fuzzy logic system, estimations for the output variable were computed. The estimated values of the output variable (CFA) were then used to detect probable risk situations in which the company would not have enough resources to cover its liabilities to financial creditors.
The main advantages of the proposed Mamdani fuzzy logic system in a probabilistic environment to substantiate financial decisions are the following:
The system allows for the study of the behavior of input variables for future periods of time, making it easy to anticipate situations of financial difficulty within a company;
The system allows for fuzzy modeling of the evolution and behavior of the output variables on which the financial decisions are based. Values of output variables are determined for future time periods by probabilistic calculations, which makes it possible to identify the anticipation of financial risks. Consequently, the company can take measures to mitigate or even avoid risks;
The system helps to substantiate the company’s financial decisions by anticipating the development of exogenous factors with high risk, which have an unfavorable influence on the company’s economic performance.


