Article

Effects of Cobalt Loading, Particle Size, and Calcination Condition on Co/CNT Catalyst Performance in Fischer–Tropsch Reactions

by
Omid Akbarzadeh
1,*,
Noor Asmawati Mohd Zabidi
2,
Yasmin Abdul Wahab
1,
Nor Aliya Hamizi
1,
Zaira Zaman Chowdhury
1,
Zulkifli Merican Aljunid Merican
2,
Marlinda Ab Rahman
1,
Shamima Akhter
3,
Md Shalauddin
1 and
Mohd Rafie Johan
1
1
Nanotechnology & Catalysis Research Centre, University of Malaya, Kuala Lumpur 50603, Malaysia
2
Department of Fundamental and Applied Sciences, Universiti Teknologi PETRONAS, Bandar Seri Iskandar 32610, Perak, Malaysia
3
Department of Chemistry, University of Malaya, Kuala Lumpur 50603, Malaysia
*
Author to whom correspondence should be addressed.
Symmetry 2019, 11(1), 7; https://doi.org/10.3390/sym11010007
Submission received: 12 October 2018 / Revised: 7 November 2018 / Accepted: 9 November 2018 / Published: 22 December 2018
(This article belongs to the Special Issue Nanocatalysis and Symmetry in Chemistry)

Abstract

:
The strong electrostatic adsorption (SEA) method was applied to the synthesis of a cobalt (Co) catalyst on a multi-walled carbon nanotube (CNT) support. In order to uptake more of the cobalt cluster with higher dispersion, the CNT was functionalized via acid and thermal treatment. The Co/CNT catalyst samples were characterized by a range of methods including the Brunauer–Emmet–Teller (BET) surface area analyzer, transmission electron microscopy (TEM), X-ray powder diffraction (XRD) analysis, atomic absorption spectroscopy (AAS), and H2-temperature programmed reduction (H2-TPR) analysis. The data from the TEM images revealed that the catalyst was highly dispersed over the external and internal walls of the CNT and that it demonstrated a narrow particle size of 6–8 nm. In addition, the data from the H2-TPR studies showed a lower reduction temperature (420 °C) for the pre-treated catalyst samples. Furthermore, a Fischer–Tropsch synthesis (FTS) reaction was chosen to evaluate the Co/CNT catalyst performance by using a fixed-bed microreactor at different parameters. Finally finding the optimum value of the cobalt loading percentage, particle size, and calcination conditions of Co/CNT catalyst resulted in a CO conversion and C5+ selectivity of 58.7% and 83.2%, respectively.

1. Introduction

Fischer–Tropsch synthesis (FTS) is known to convert syngas (H2 + CO) to hydrocarbons and can be considered as an alternative choice for the production of eco-friendly fuels and the management of renewable energy resources. Declining of crude oil reserves and abundance of natural gas and coal reserves as feedstock, made FTS process attractive in recent years. Hydrocarbon fuels synthesized with the FTS method contain a very low percentage of sulfur and aromatic rings. In addition, cobalt is one of the most common metallic catalysts for FTS [1]. Cobalt loading, the dispersion of the size of the cobalt particles on a support, and catalyst reducibility play an important role in catalyst activity. Therefore, the desired catalyst on a suitably chosen support should be considered together with the presence of potentially dispersed catalytic active sites and enhanced catalytic reduction properties. Catalyst activity and product selectivity were shown to increase within the cobalt optimum particle size range of 6–8 nm. Methane selectivity was shown to increase with a catalyst particle size of less than 6 nm [2,3].
A Co catalyst was prepared by the conventional impregnation method, which results in a agglomeration of cobalt on the carbon nanotube (CNT) support. Strong electrostatic adsorption (SEA) enhances the dispersion of the catalyst active sites, resulting in a narrower distribution [4,5,6,7,8]. SEA is based on the electrostatic attraction between oppositely charged particles. The surface of the silica and alumina supports, as well as the CNT and other metal oxides, contain hydroxyl groups. In addition, the pH value of the medium where the hydroxyl groups remain neutral is the point of zero charge (PZC). In the case where pH < PZC, the hydroxyl groups become protonated, and their resulting positive charges attract anions. If pH > PZC, the hydroxyl groups, on the other hand, become deprotonated, and the resulting negative charges attract cations. A series of experiments was conducted to evaluate the optimum pH range for the catalyst particle uptake on a support [5,7]. The objective of this study is to prepare a cobalt catalyst that is supported on a CNT support using the SEA method and to characterize the effect of Co supported on a CNT in order to study the impact of the cobalt loading, particle size, and calcination condition on the overall performance of the catalyst.

2. Experimental

2.1. Purification and Functionalization of a CNT Support

Prior to loading the metal catalyst to the CNT support (purity >95%, chemical vapor deposition, length: 10−20 µm and diameter: 30−50 nm, purchased from ILJIN Nanotech Co. Ltd., Seoul, Korea), CNT functionalization and activation steps had to be conducted. The aim of these steps was to enhance the interaction between the CNT support and the catalyst active sites. The functionalization and activation steps increased the purification of the CNT, resulting in the opening of the terminal caps of the tubular CNT and introducing OH surface functionality over the CNT. From a reaction with concentrated nitric acid, the OH functional groups were found present on the surface of the CNT, which provides active sites for the attachment of the cobalt particles. Wet chemical oxidation is the most common method for functionalizing and activating the CNT. Accordingly, 2 g of as-received CNT was charged into a single-necked, round-bottom flask with 35 vol% nitric acid (Merck, Petaling Jaya, Malaysia). The solution was then refluxed at 110 °C for 10 h. At the end of the reflux, the mixture was cooled down to room temperature, the reaction solution was then diluted with deionized water, filtered, and washed several times until the pH of the last filtrate reached 7. The sample was dried at 120 °C for 12 h. Subsequent to this acid treatment, the sample (CNT.A.) was subjected to a thermal treatment at 900 °C under argon flowing at 20 mL/min [9,10]. The as-synthesized acid- and thermal-treated carbon nanotube support (CNT.A.T.) was subsequently used in the next step in this work.

2.2. The Point of Zero Charge, Co Impregnation on a Support, and Catalyst Preparation

To determine the PZC of the CNT support, the equilibrium pH at high oxide loading method was applied [11]. A series of solutions with a pH value ranging from 2–14 was prepared by adding nitric acid and ammonium hydroxide to distilled water. Accordingly, each 50 mL of the solution containing a specific pH reading (from a pH of 2–14), was charged into a conical flask containing the pre-weighted CNT. All the mixtures in the series of various pH solutions were shaken for 1 h on a rotary shaker. A weighted amount of CNT was then added to a cobalt precursor solution with a pH of 14, where the cobalt particles adsorbed into the CNT support from an excess solution to prevent changes in the pH value. Finally, the resulting CNT-supported catalyst was filtered and air dried for 24 h, followed by calcination at 400 °C for 4 h in a tubular furnace under a flow of argon.

2.3. Characterization

The physicochemical properties of the catalyst can significantly affect the catalyst’s Fischer-Tropsch (FT) performance. A physical adsorption study, a temperature programmed desorption of hydrogen (H2-TPD), and a temperature programmed oxidation (TPO) analysis of the catalysts was carried out using a Thermo Finnigan (TPDRO 1100 MS, Waltham, MA, USA) instrument. The transmission electron microscopy (TEM) was carried out by Zeiss LIBRA 200 FE TEM. X-ray powder diffraction (XRD) analysis was performed on a Bruker (A&S D8 Advanced Diffractometer, Singapore) instrument. In addition, Fourier-transform infrared spectroscopy (FTIR) analysis, atomic absorption spectrometer (AAS) analysis, thermogravimetric analysis (TGA), Brunauer–Emmet–Teller (BET) total surface area analysis, and total pore volume analysis was also conducted to further characterize the designed catalyst.
%   Reduction =   O 2   Uptake   × 2 3   × Atomic   Weight   Percent   Metal
where O2-uptake = amount of O2 in μmol/g.cat calculated from TPO spectra of the catalyst, atomic weight = Molecular weight (MW) of the metal, and % Metal = the weight percentage of the metal in the catalyst.
%   Dispersion   ( total   Co ) = H 2 Uptake × Atomic   Weight × Stoichiometry %   Metal = Number   of   Co   Atoms   on   Surface Total   Number   of   Co   Atoms   in   Sample × 100
where H2-uptake = amount of H2 consumed in mmol/g.cat calculated from the peak area of the H2-TPD spectra, atomic weight = MW of the metal, % Metal = the weight percentage of the metal in the catalyst, and Stoichiometry = 2.
The number of active sites was calculated using Equation (3) [12].
No .   of   active   sites   = Wt   of   Co   in   the   Sample   × Reduction   × Dispersion   × N A MW
where NA = Avogadro’s number, and MW = the atomic weight of the metal.
H 2   uptake   ( moles gcat ) = Analytical   Area   from   TPD   × Calibration   Value   Sample   Weight × 24.5 .
O 2   uptake   ( moles / gcat ) = Sum   of   the   Consumed   Pulse   Areas   ×   Calibration   Value Sample   Weight   × 24.5 .

2.4. Microreactor Setup, Sampling, and Composition Analysis

To study the catalyst performance, a microactivity-reference reactor (Micromeritics, GA 30093-2901, USA) was used, and the reaction products were analyzed by an online gas chromatography Agilent (Hewlett-Packard Series 6890, Santa Clara, CA, USA). To calculate the gas product conversion for the CO, methane (CH4) selectivity and C5+ selectivity were calculated using Equations (6)–(8), respectively [12].
CO   conversion   ( % ) =   CO in   CO out CO in   × 100 .
CH 4   selectivity   ( % ) =   Mole   of   CH 4 Total   moles   of   hydrocarbons   × 100 .
C 5 +   selectivity   ( % ) =   Moles   of   C 5 + Total   moles   of   hydrocarbons   × 100 .
To calculate the Fischer–Tropsch synthesis rate, Equation (9) was used for calculating the formation rate of the carbon dioxide (RFCO2), and Equation (10) was necessary [13,14,15]:
RFTS   ( g   HC / g   cat / h )   = g   hydrocarbons   produced / g   cat   h 1 .
RWGS   ( g   CO 2 / g   cat / h ) =   RFCO 2   =   g   CO 2   produced / g   cat h 1 .

3. Results and Discussion

Figure 1a shows a plot of the final solution’s pH versus the initial pH for the determination of the PZC of the CNT. The plot shows a plateau, and the PZC was identified at 9.5. In order to find an optimum pH value of a cobalt nitrate solution for the Co uptake in the CNT, the solution pH was adjusted within a range of 2–14, a weighted amount of CNT was added to each of the pre-determined pH solutions, and all the mixtures were shaken for 1 h. Figure 1b shows a plot of the Co uptake versus the solution pH from each sample prepared above, obtained from atomic absorption spectrophotometer (AAS) analysis. The optimum pH of the cobalt adsorption on the CNT support is also shown in Figure 1b.
Th reduction and activation of the resulting calcined catalyst is an important step prior to the catalytic performance reaction. The as-synthesized catalyst was activated under the flow of H2 at the rate of 1.8 L/h at 420 °C for 10 h in a fixed-bed reactor. After in situ activation of the catalyst, the temperature was cooled down to 240 °C under a helium gas flow before the Fischer–Tropsch reaction was carried out at a 2/1 H2/CO (v/v) ratio, 40 L/g-cat.h, at 240 °C and at 20 atm pressure.

3.1. Effect of Co Loading on Catalyst Properties and Performance

The effect of cobalt metal loading on the morphology of the treated Co/CNT catalyst sample was investigated. Transmission electron spectroscopy (TEM) micrographs of Co/CNT catalyst with cobalt loading of 5, 10, 15, and 20 wt % are shown in Figure 2a–d. The 5 and 10 wt % dispersions of cobalt were homogenous and well dispersed inside and outside of the CNT channels, whereas, for 10 wt % loading, it was expected that a higher amount of cobalt would be present over the CNT walls (Figure 2a,b). However, in Figure 2c,d, the TEM micrographs show that increasing the metal loading percentage to 15 and 20 wt % resulted in agglomeration and lower dispersion of the nanoparticles. The figures also show the presence of blockage on the CNT pores. Generally, it has been reported that the extent of the metal loading has a significant effect on the particle size and dispersion of the catalyst on the support, which, in turn, has an effect on the catalyst activity and selectivity [16,17,18,19,20,21,22].
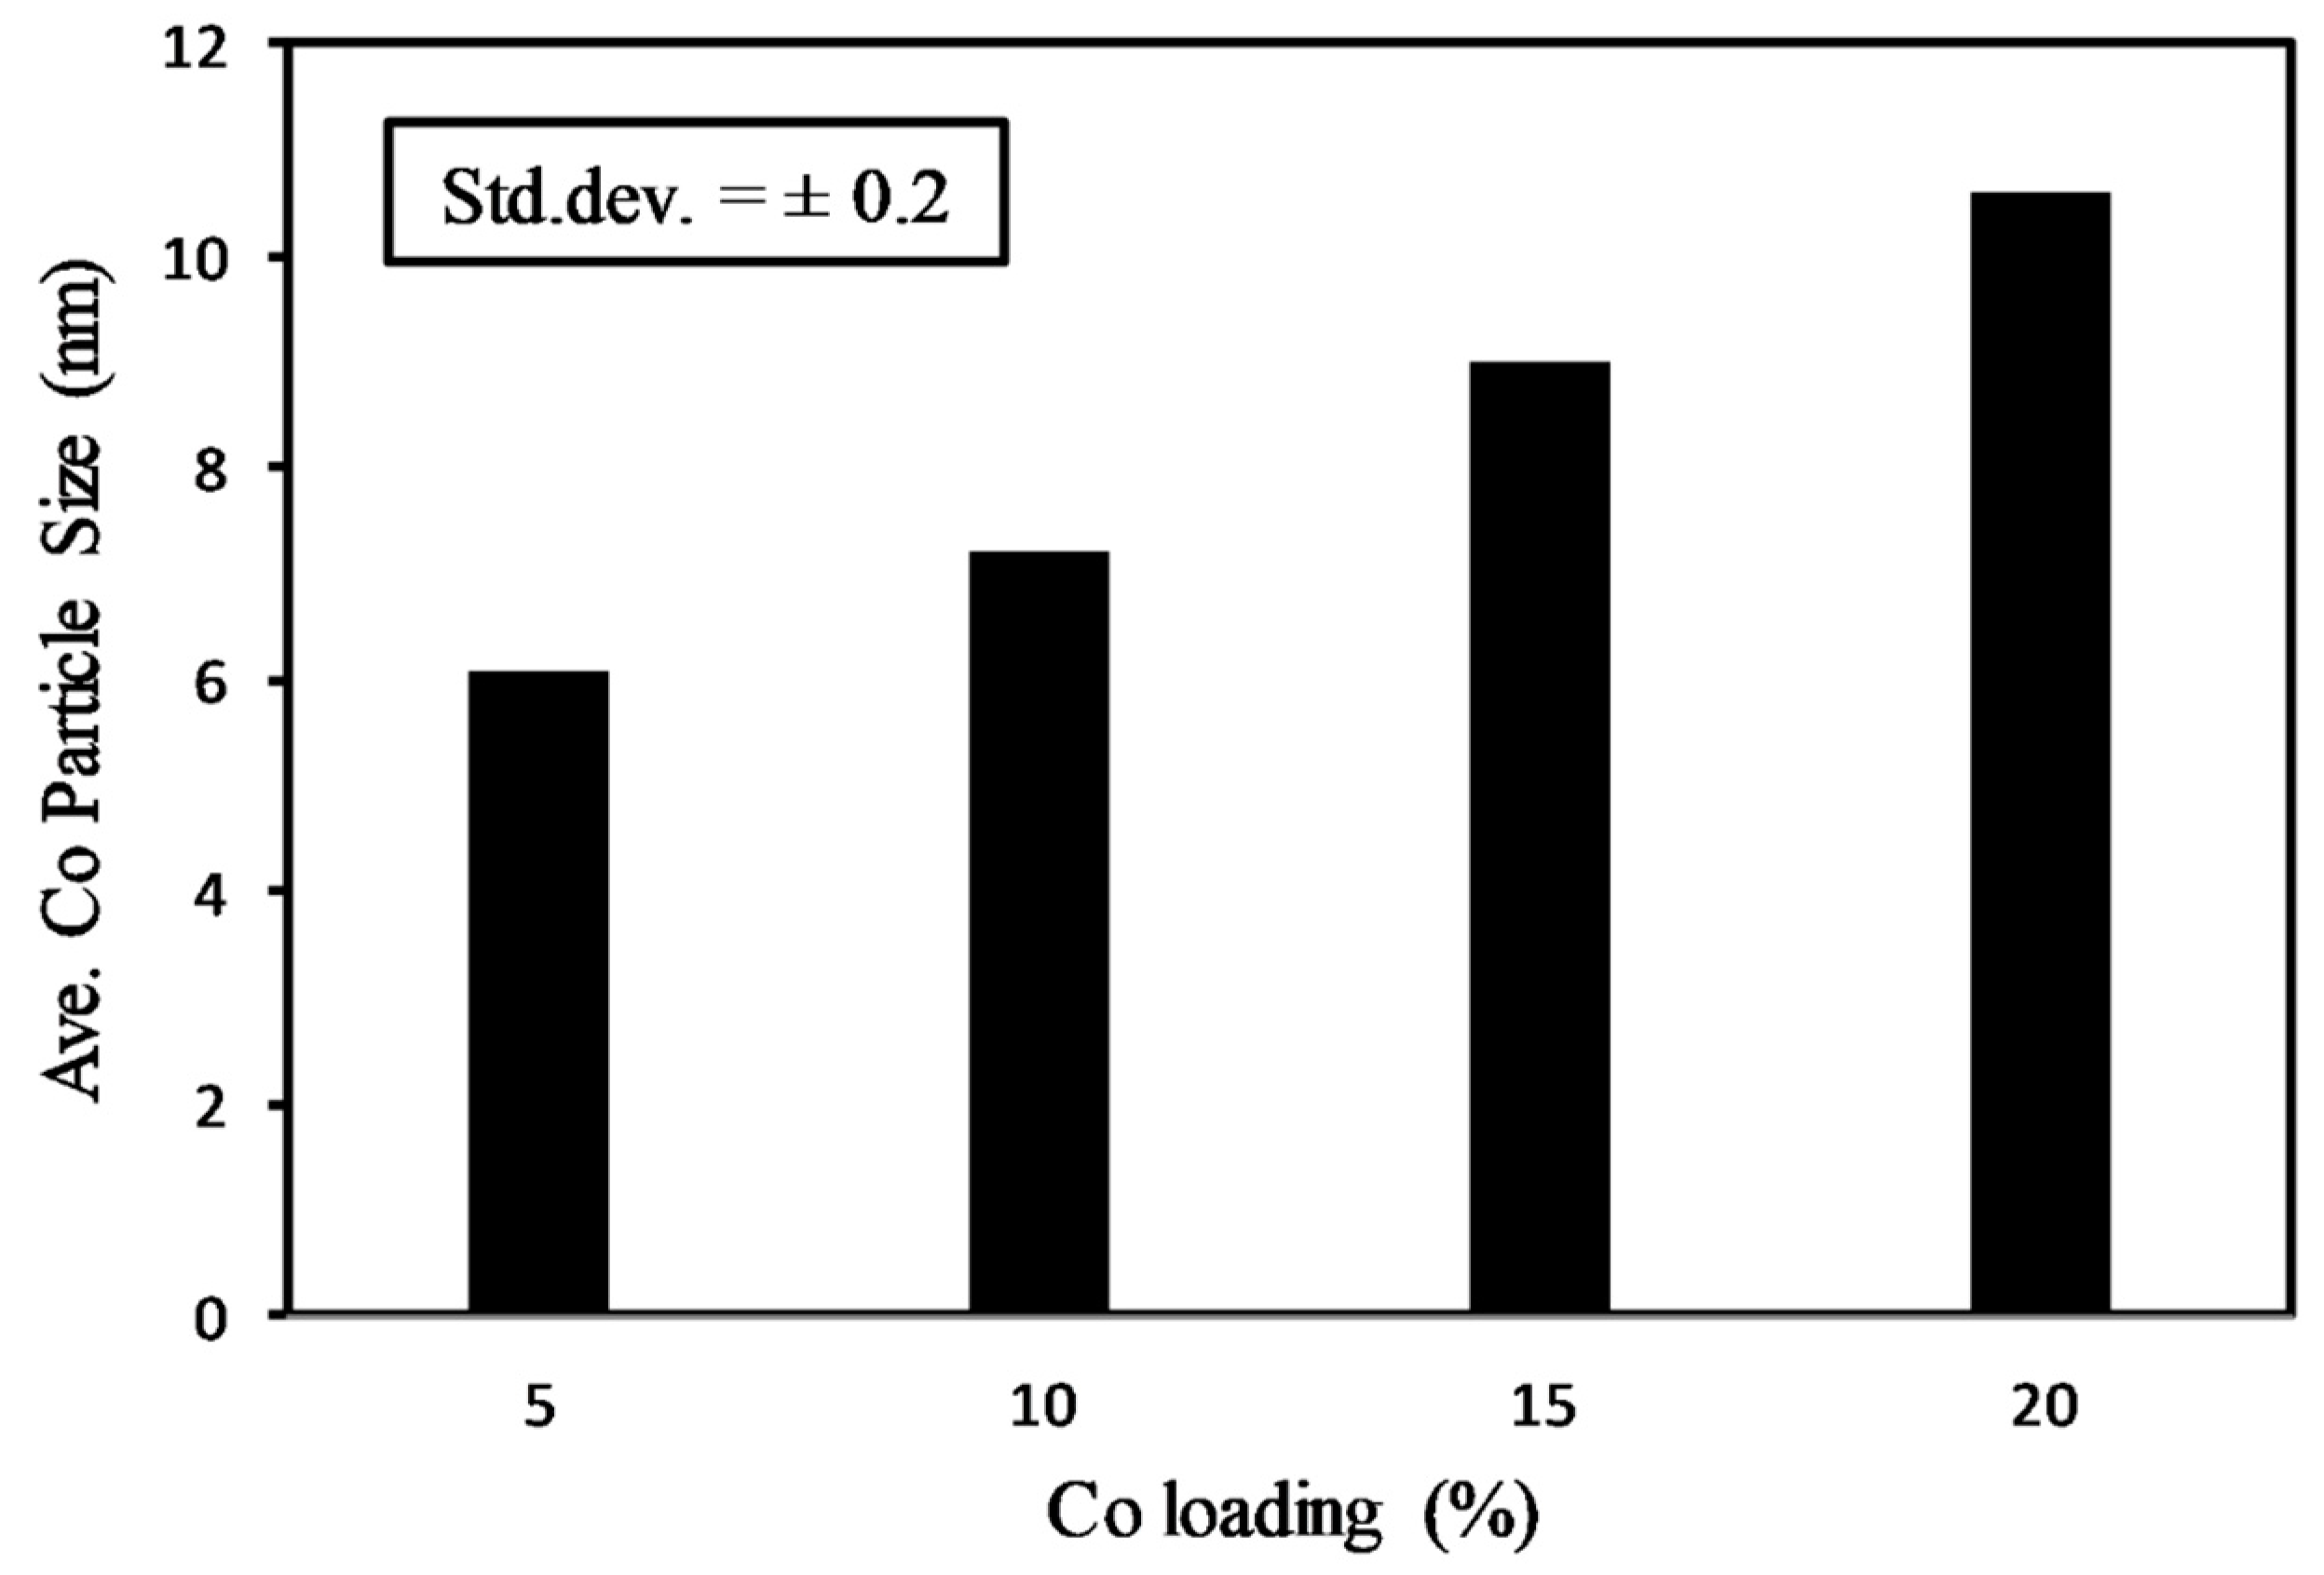
The particle size distribution is shown in Figure 3 for different cobalt loading percentages on the pre-treated CNT support. For each as-synthesized catalyst sample, the number count of about 200 particles was obtained, which reflected an overall representative on the number average of the Co particles. The average particle size was 6.1, 7.2, 9.0, and 10.6 nm, corresponding to the metal loading of 5, 10, 15, and 20 wt % on the pre-treated CNT support. The optimum metal particle size for obtaining a high selectivity and reactivity in a Fischer–Tropsch reaction is about 6–8 nm [21,23]. Hence, from the above observation, by exploiting the SEA method and metal loading of 10 wt % on the pre-treated CNT support, the desired size of the nanoparticles was obtainable within the range of 6–8 nm.
Based on the average inner diameter of the CNT channels, the catalyst particles in the size range of 3–8 nm were found to occupy the inside of the CNT channels uniformly. On the other hand, the catalyst particles from about 8 to 10 nm in size were found at the outer surface of the CNT support. In addition, Figure 4 shows the distribution of catalyst particle size based on the cobalt loading percentage, which can be obtained from TEM micrograph analysis from each 5, 10, 15 and 20% of cobalt loading.
According to Figure 4, increasing the cobalt loading from 5 wt % to 20 wt % leads to an increase in the catalyst particle size from 2 to 10 nm. For 5 wt % cobalt loading, the average size of the catalyst particles is 6.1 nm, whereas for 20 wt % cobalt loading the average size of catalyst particles is 10.6 nm.
Table 1 shows a decrease for the BET surface area from 224.6 to 214.1 (m2/g) and the total pore volume from 0.43 to 0.34 (cm3/g) for samples with 5 wt % and 20 wt % Co loading, respectively. Increasing the Co loading from 5 wt % to 20 wt % leads to pore blockage and agglomeration of the cobalt particles, as shown by TEM analysis, and these combined effects eventually lead to a decrease in the BET surface area and total pore volume.
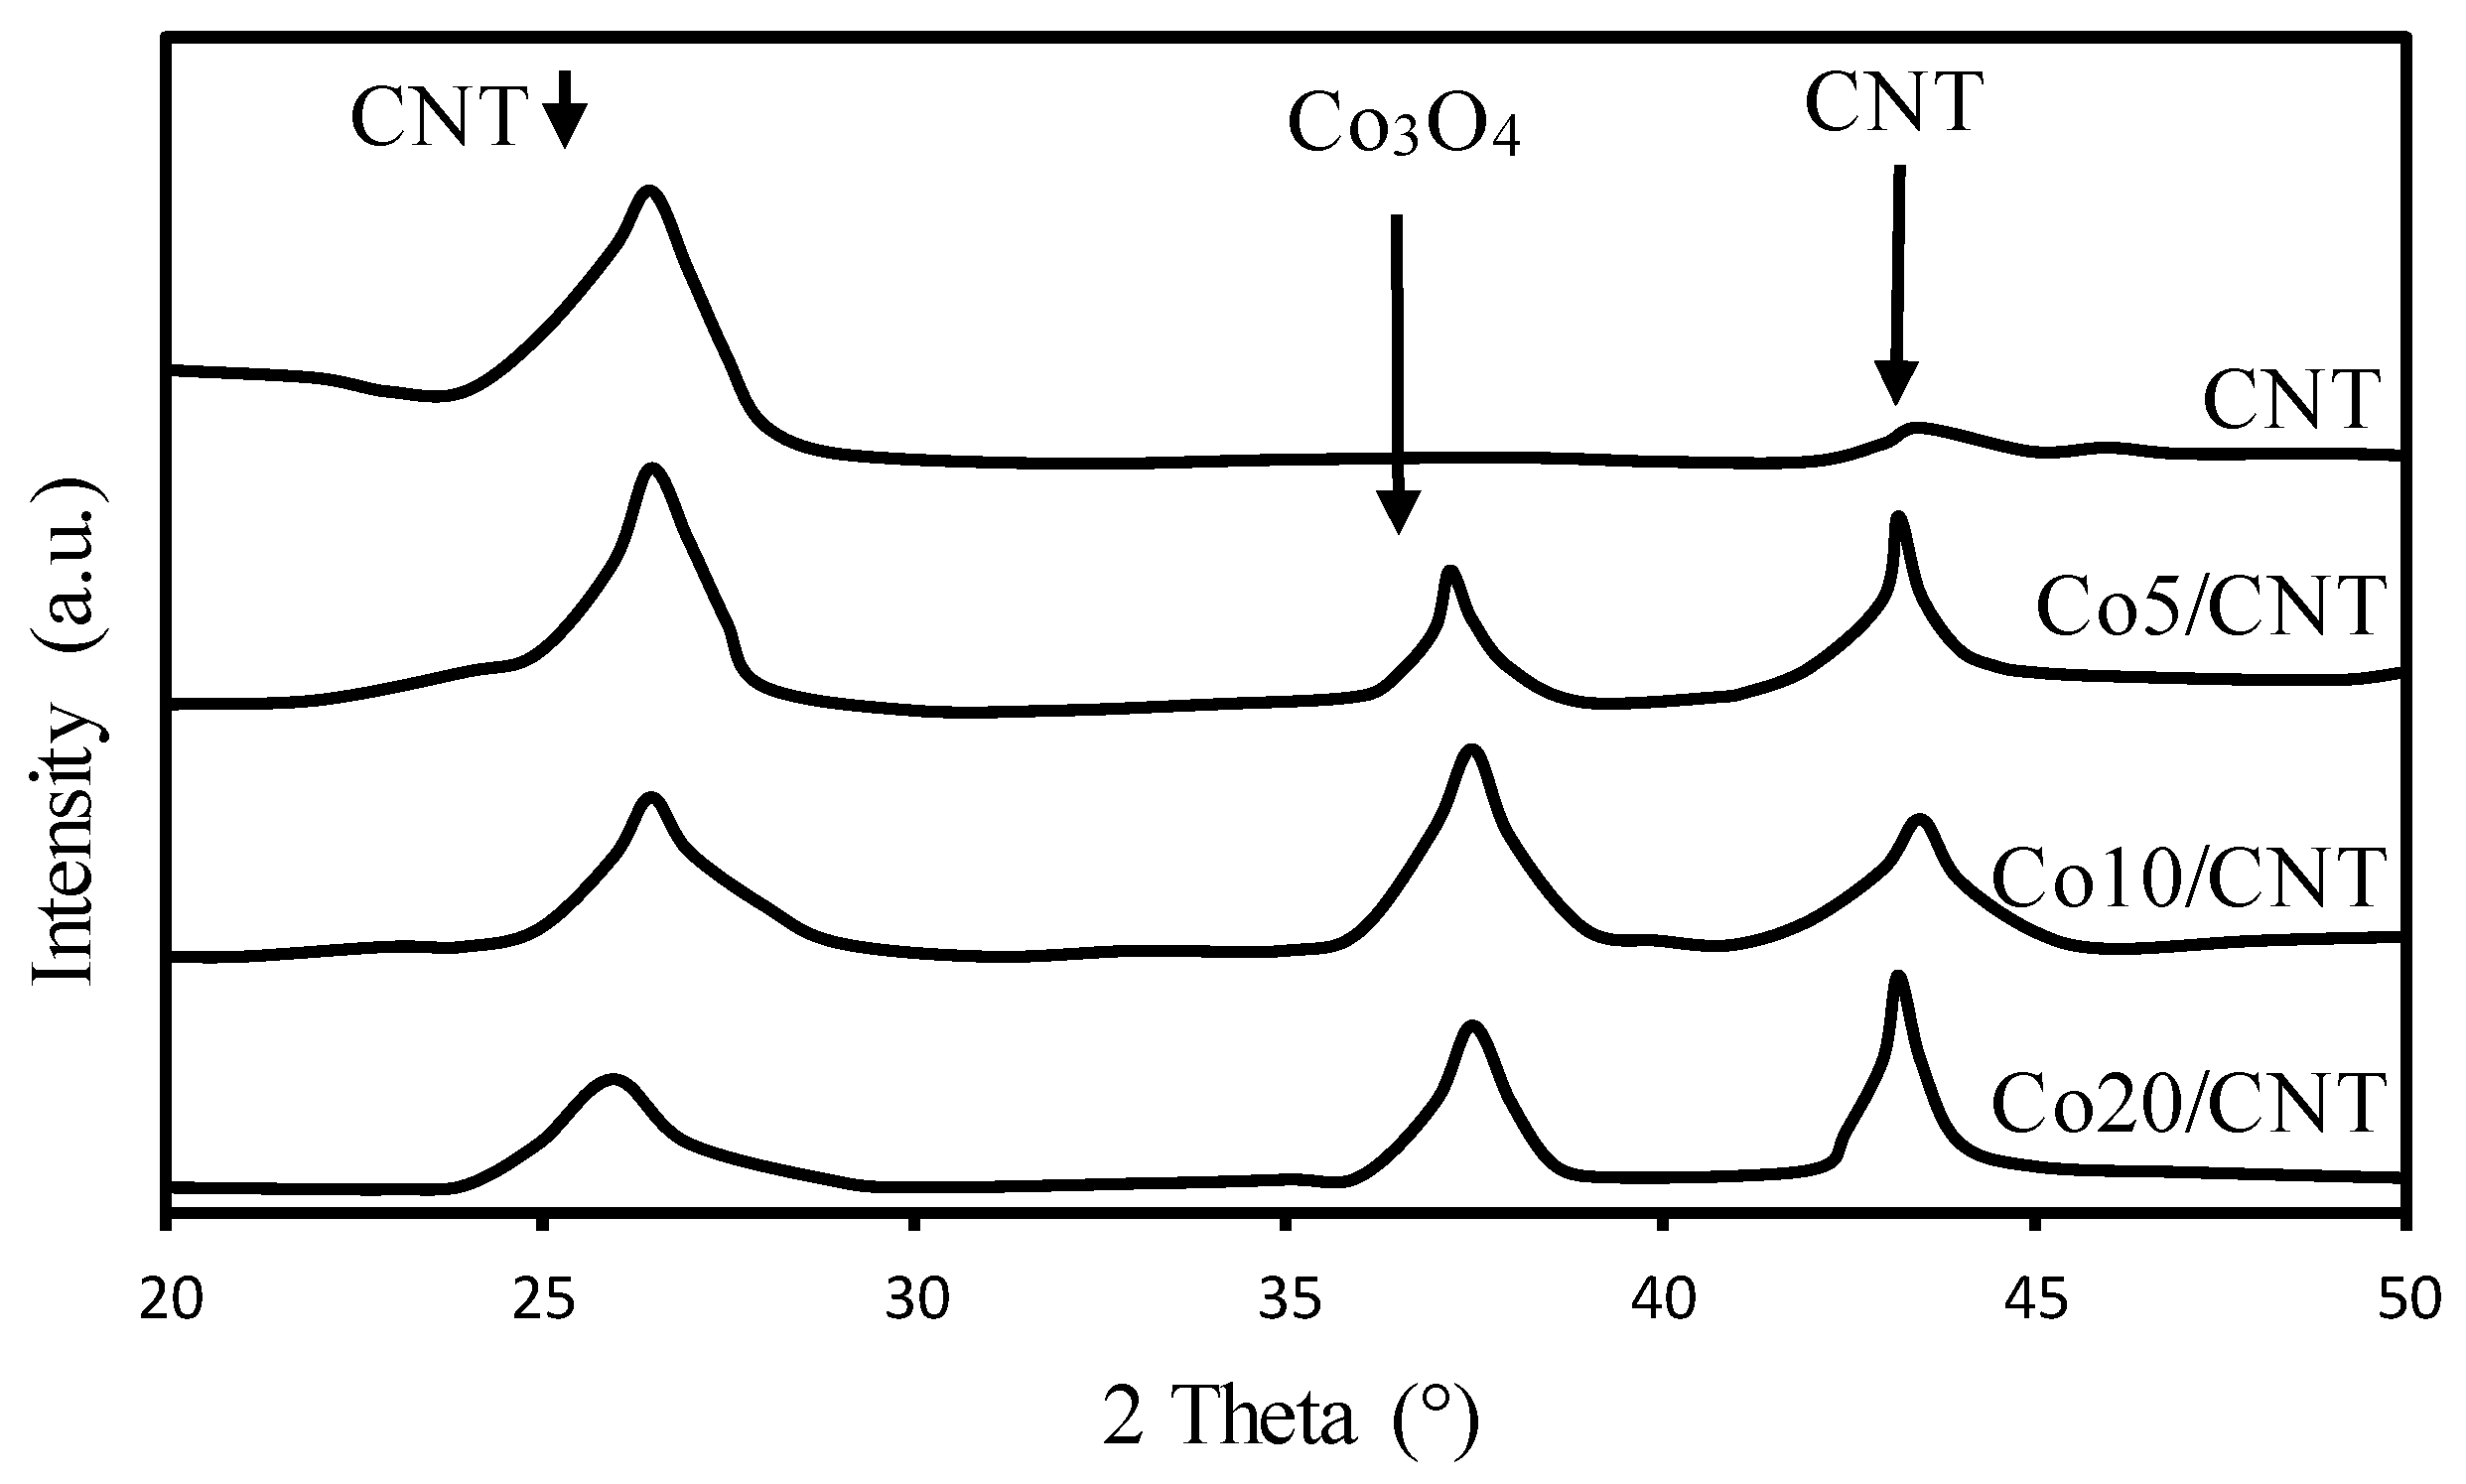
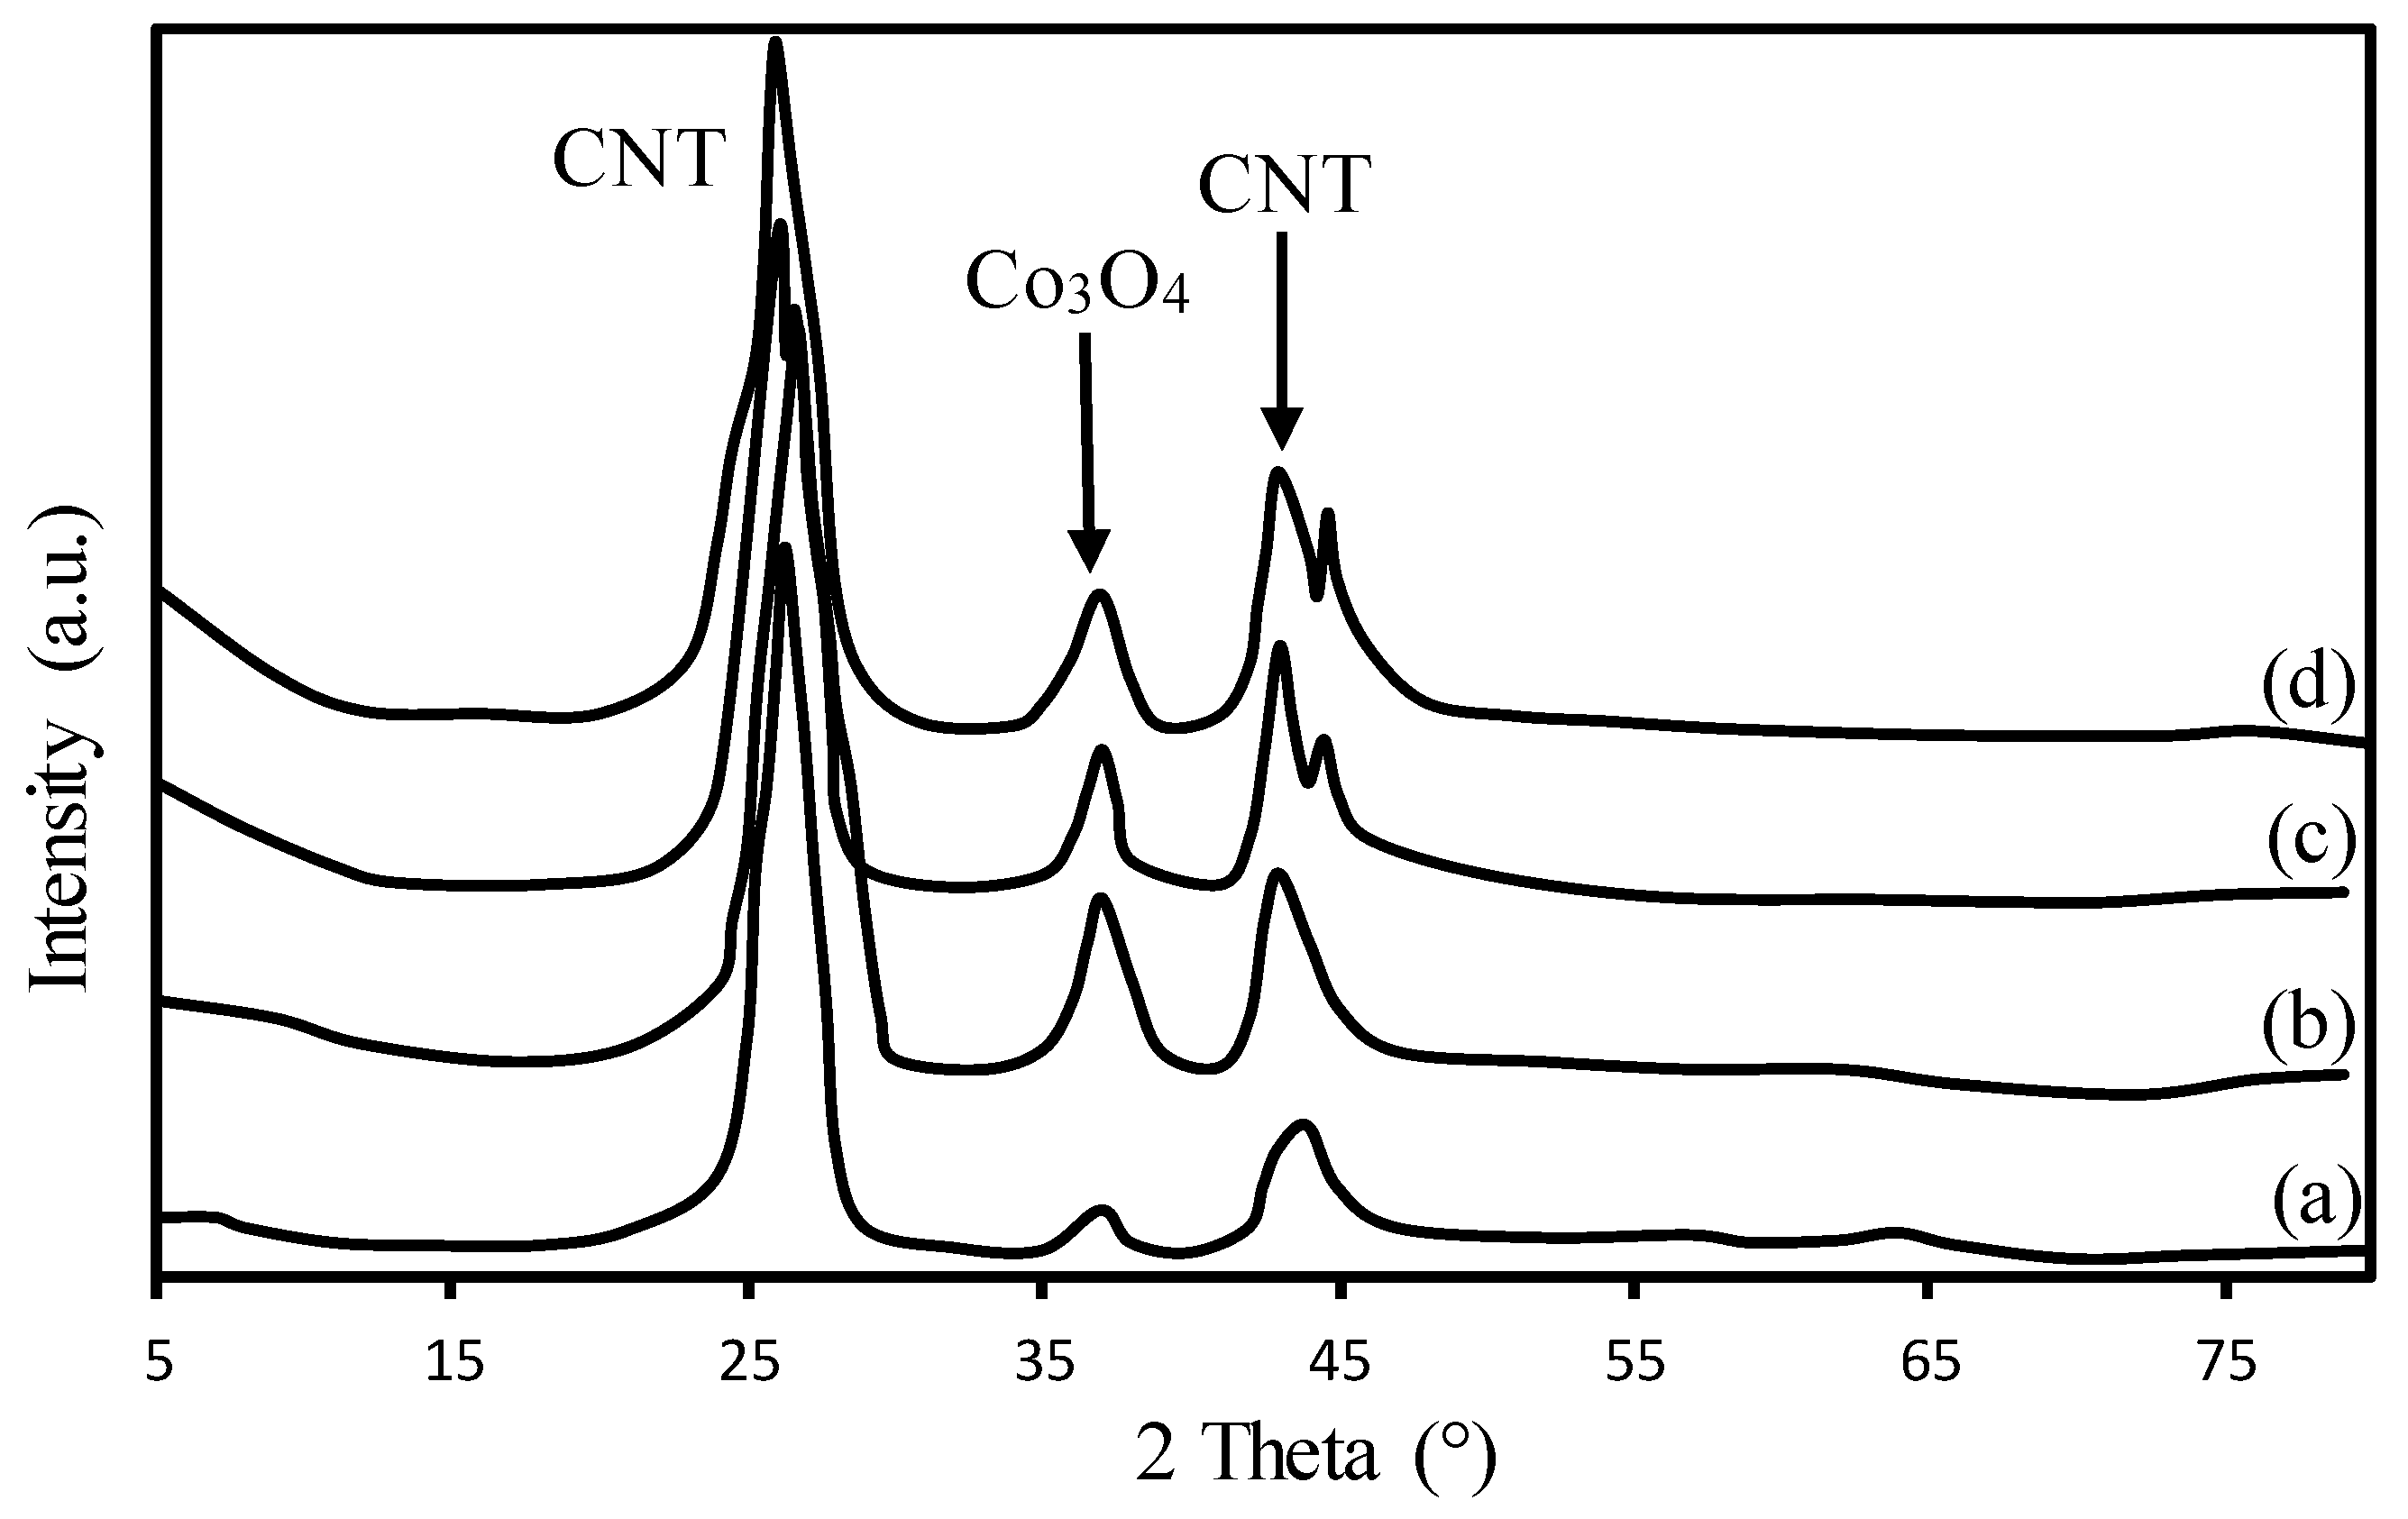
Figure 5 shows the XRD patterns of the CNT and Co/CNT materials. From the XRD spectrum, peaks at 26 and 43 degrees are related to carbon nanotubes, and the most intense peak from the catalyst samples was observed at 36.8 degrees, which corresponds to Co3O4 [24]. The average particle size of Co3O4 from the catalyst was calculated from the TEM images and the XRD spectrum using the Scherrer equation [25] and are shown in Table 2. The results show that increasing the cobalt loading from 5 wt % to 20 wt % led to an increase in the average particle size of Co3O4 from 6.1 to 10.6 nm and that the average particle size calculated from the TEM images was also in agreement with a size increase trend, which can be related to the agglomeration of the larger size of the cobalt particles.
Figure 6 shows the TPR profiles of the calcined catalyst samples with 5, 10, 15, and 20 wt % cobalt loading. For 10 wt % Co loading, the reduction of Co3O4 to CoO occurred at 238 °C, and part of the resulting peak overlapped with the peak from the subsequent reduction of the CoO species to Co [26]. The second peak observed from the TPR profile corresponded to the second step of the reduction of CoO to Co and the interaction of the cobalt particles with the CNT support at 449 °C [26]. In addition, the gasification of the purified CNT support occurred at 600 °C. Furthermore, increasing the Co loading led to an increase in the second reduction peak intensity and, therefore, a higher degree of reduction. In addition, an increase in the cobalt loading shifted the reduction temperature of the catalyst to a lower temperature and led to a lower strength of interaction between the CNT support and catalyst particles.
The metal loading percentage is a key factor that affects the particles size and dispersion of catalysts [20]. Table 3 shows that by increasing the cobalt loading from 5 wt% to 20 wt%, the temperature of the first TPR peak dropped from 291 to 250°C, and for the second TPR peak, it dropped from 481 to 400 °C. These results are in agreement with the average particle size of the catalyst (Table 2) and their interaction with the CNT support.
To calculate the H2 consumption, the data from the TPR profile of all the catalyst samples were divided into two categories of temperature. In the first category, the temperature range was between 25 and 500 °C, while the temperature ranged from 500 to 800 °C in the second category. The area under the TPR peaks was calculated by integration and was proportional to the amount of H2 consumption at each temperature range. Table 3 shows that by increasing the Co loading from 5 wt % to 20 wt %, the amount of the catalyst active sites that were reduced at the lower range of temperature (i.e., the first category) decreased with the H2 consumption (from 102.4 to 85.8) due to Co particle agglomeration as the metal loading increased. Table 3 also shows that across the cobalt loading of 5–10 wt %, the catalyst dispersion increased from 19.3% to 29.1%, while catalyst reduction increased from 55.4% to 68.1%, and consequently, the H2 uptake increased from 97.4% to 102.4%, respectively.
Catalyst activity and selectivity in the FTS process can be affected significantly by the extent of the metal (in wt %) [27]. Table 4 shows that by increasing the metal loading from 5 to 10 wt %, the CO conversion increased from 45.5% to 58.7%, which could be due to an increase in the number of active sites. However, increasing the Co loading from 10 wt % to 20 wt % led to a decrease in the CO conversion from 58.7% to 40.3%, which could be related to metal particle agglomeration and a decrease in the particle dispersion in the catalyst. Increasing the metal loading from 5 wt % to 20 wt % led to an increase in the CH4 selectivity from 19.0% to 23.0%. Furthermore, the selectivity of the heavier hydrocarbons (C5+) also increased from 70.3% to 83.2% when increasing the Co loading from 5 wt % to 10 wt %. However, when the metal loading was reduced from 10 wt % to 20 wt %, there was a decrease in the C5+ selectivity from 83.2% to 57.4%. From the effect of the Co loading, our studies show that the highest CO conversion and C5+ selectivity was obtained at 10 wt % cobalt loading on the CNT support, and Co loading of more or less than 10 wt % resulted in a lower C5+ selectivity of 57.4%.
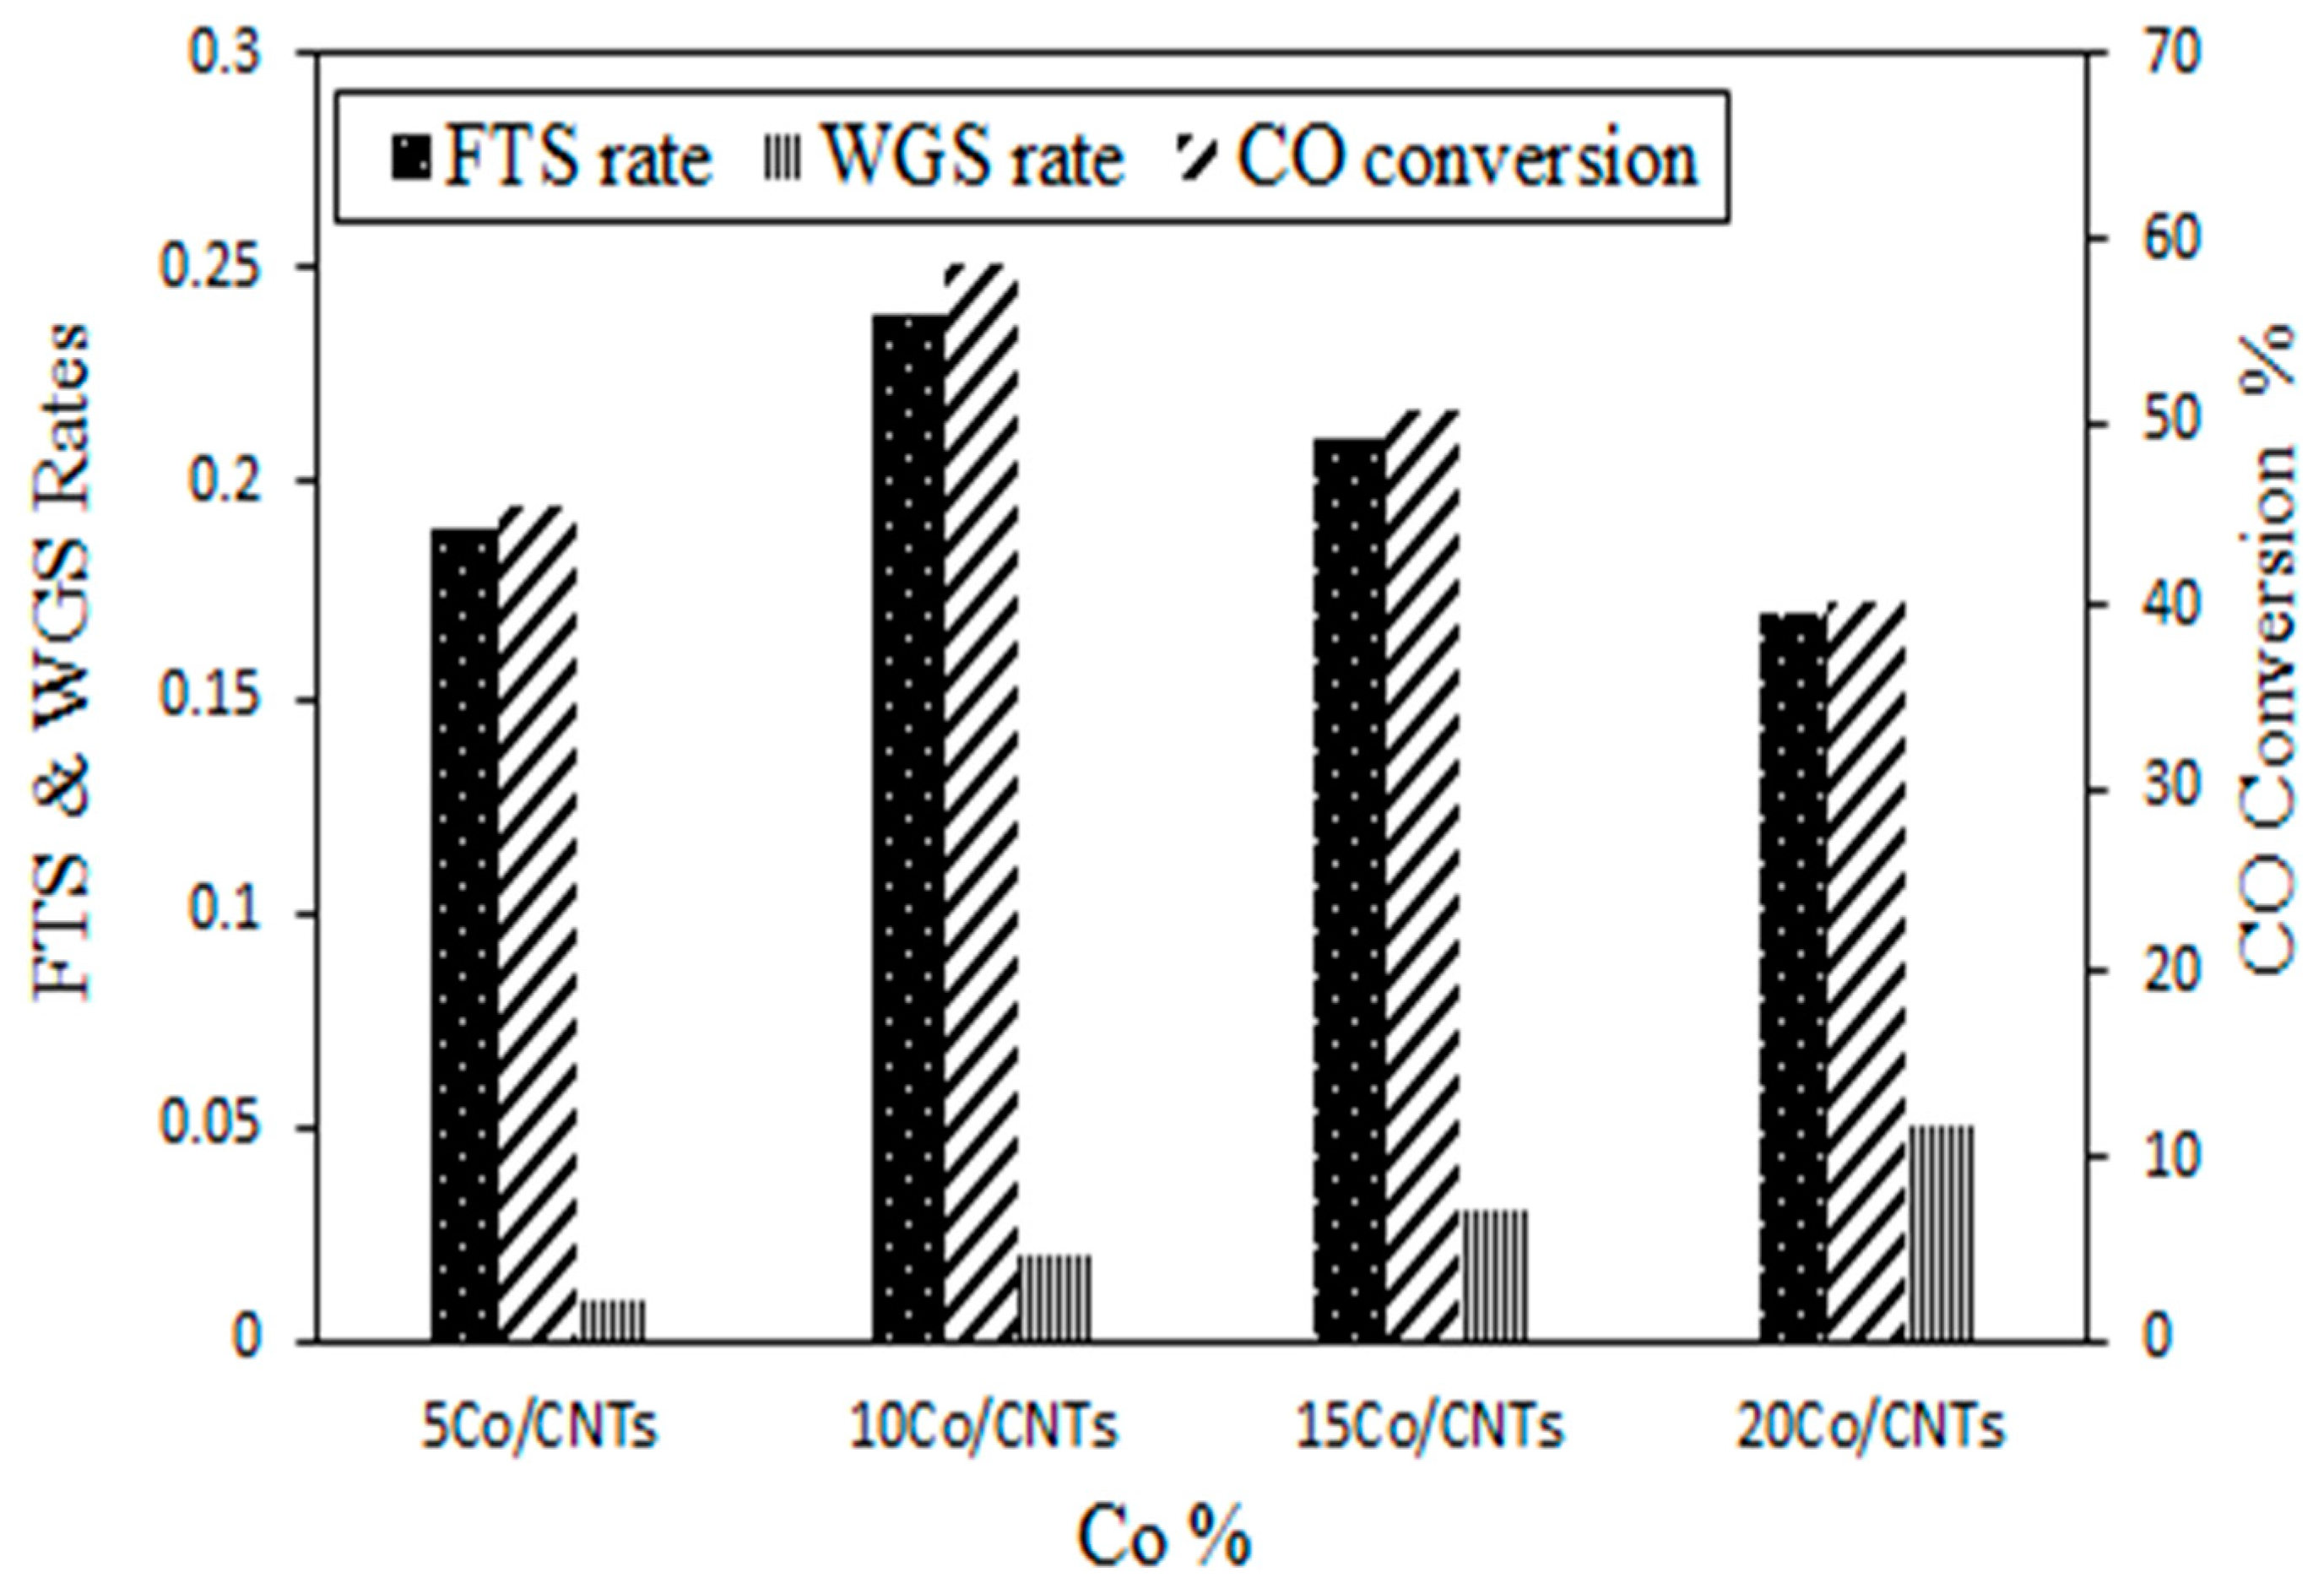
Figure 7 shows catalytic activity and selectivity of different wt % of cobalt-loaded catalysts. It shows that increasing the cobalt loading from 5 wt % to 10 wt % resulted in an increased rate of FTS from 0.18 to 0.25 (g HC/g cat/h), whereas increasing the cobalt loading from 10% to 20% resulted in a decrease of the FTS from 0.25 to 0.16 (g HC/g cat/h).
Increasing the cobalt loading from 5% to 10% increased the number of available surface active sites for FTS, and this increased the CO conversion from 45.5% to 58.7%. On the other hand, increasing the Co metal loading from 10 wt % to 20 wt % caused cobalt metal particles to agglomerate on the surface of the CNT support and resulted in the reduction of the number of the metal active sites, which contributed to a drop in the CO conversion from 58.7% to 40.3% and in C5+ selectivity from 83.2% to 57.4%.
Figure 7 and Table 4 show that cobalt particles in the size range of 6–8 nm are more selective for C5+ hydrocarbons, while those of less than 5 nm are more selective for methane and light hydrocarbons [2]. Table 4 also shows the chain growth probability (α) for FTS products. Increasing the cobalt loading led to a shift towards higher hydrocarbon chains. The highest chain growth (0.542) occurred at 10 wt % Co loading, and increasing the cobalt loading from 10 wt % to 20 wt % resulted in a decrease in the chain growth from 0.542 to 0.432; this observation can be attributed to the agglomeration of cobalt particles with higher wt % cobalt loading.

3.2. Effect of Calcination Condition on Catalyst Properties and Performance

Table 5 tabulates the surface area and porosity properties of various catalyst samples at various calcination temperatures. In a typical Co/CNT sample preparation, 10 wt % cobalt catalyst particles were loaded onto the acid- and thermal-treated CNT support, followed by calcination at 300, 350, 400, and 450 °C for 4 h. For ease of reference, the last three digits of sample coding (i.e., Co/CNT.A.T.C300) refer to the calcination temperature (T = 300 °C). The calcination of a catalyst sample at 400 °C indicated the optimum value of the BET surface area and total pore volume, which corresponded to the removal (by thermal treatment) of the precursor used during the synthesis of the catalyst. These tabulated results show that by increasing the calcination temperature from 300 to 400 °C, an increase in the BET surface area of the catalysts was observed from 208.8 to 221.4 m2/g. The pore volumes of the different catalysts prepared by the strong electrostatic adsorption method increased from 0.54 to 0.71 cm3/g. The lower BET surface area of the catalyst sample with higher loading of Co metal particles was comparable to the values obtained for CNT.A, indicating some pore blockage due to cobalt loading on the support, but, on the other hand, increasing the calcination temperature, led to the removal of the impurities from the catalyst sample, and as a result, higher BET surface area and total pore volume was observed. 
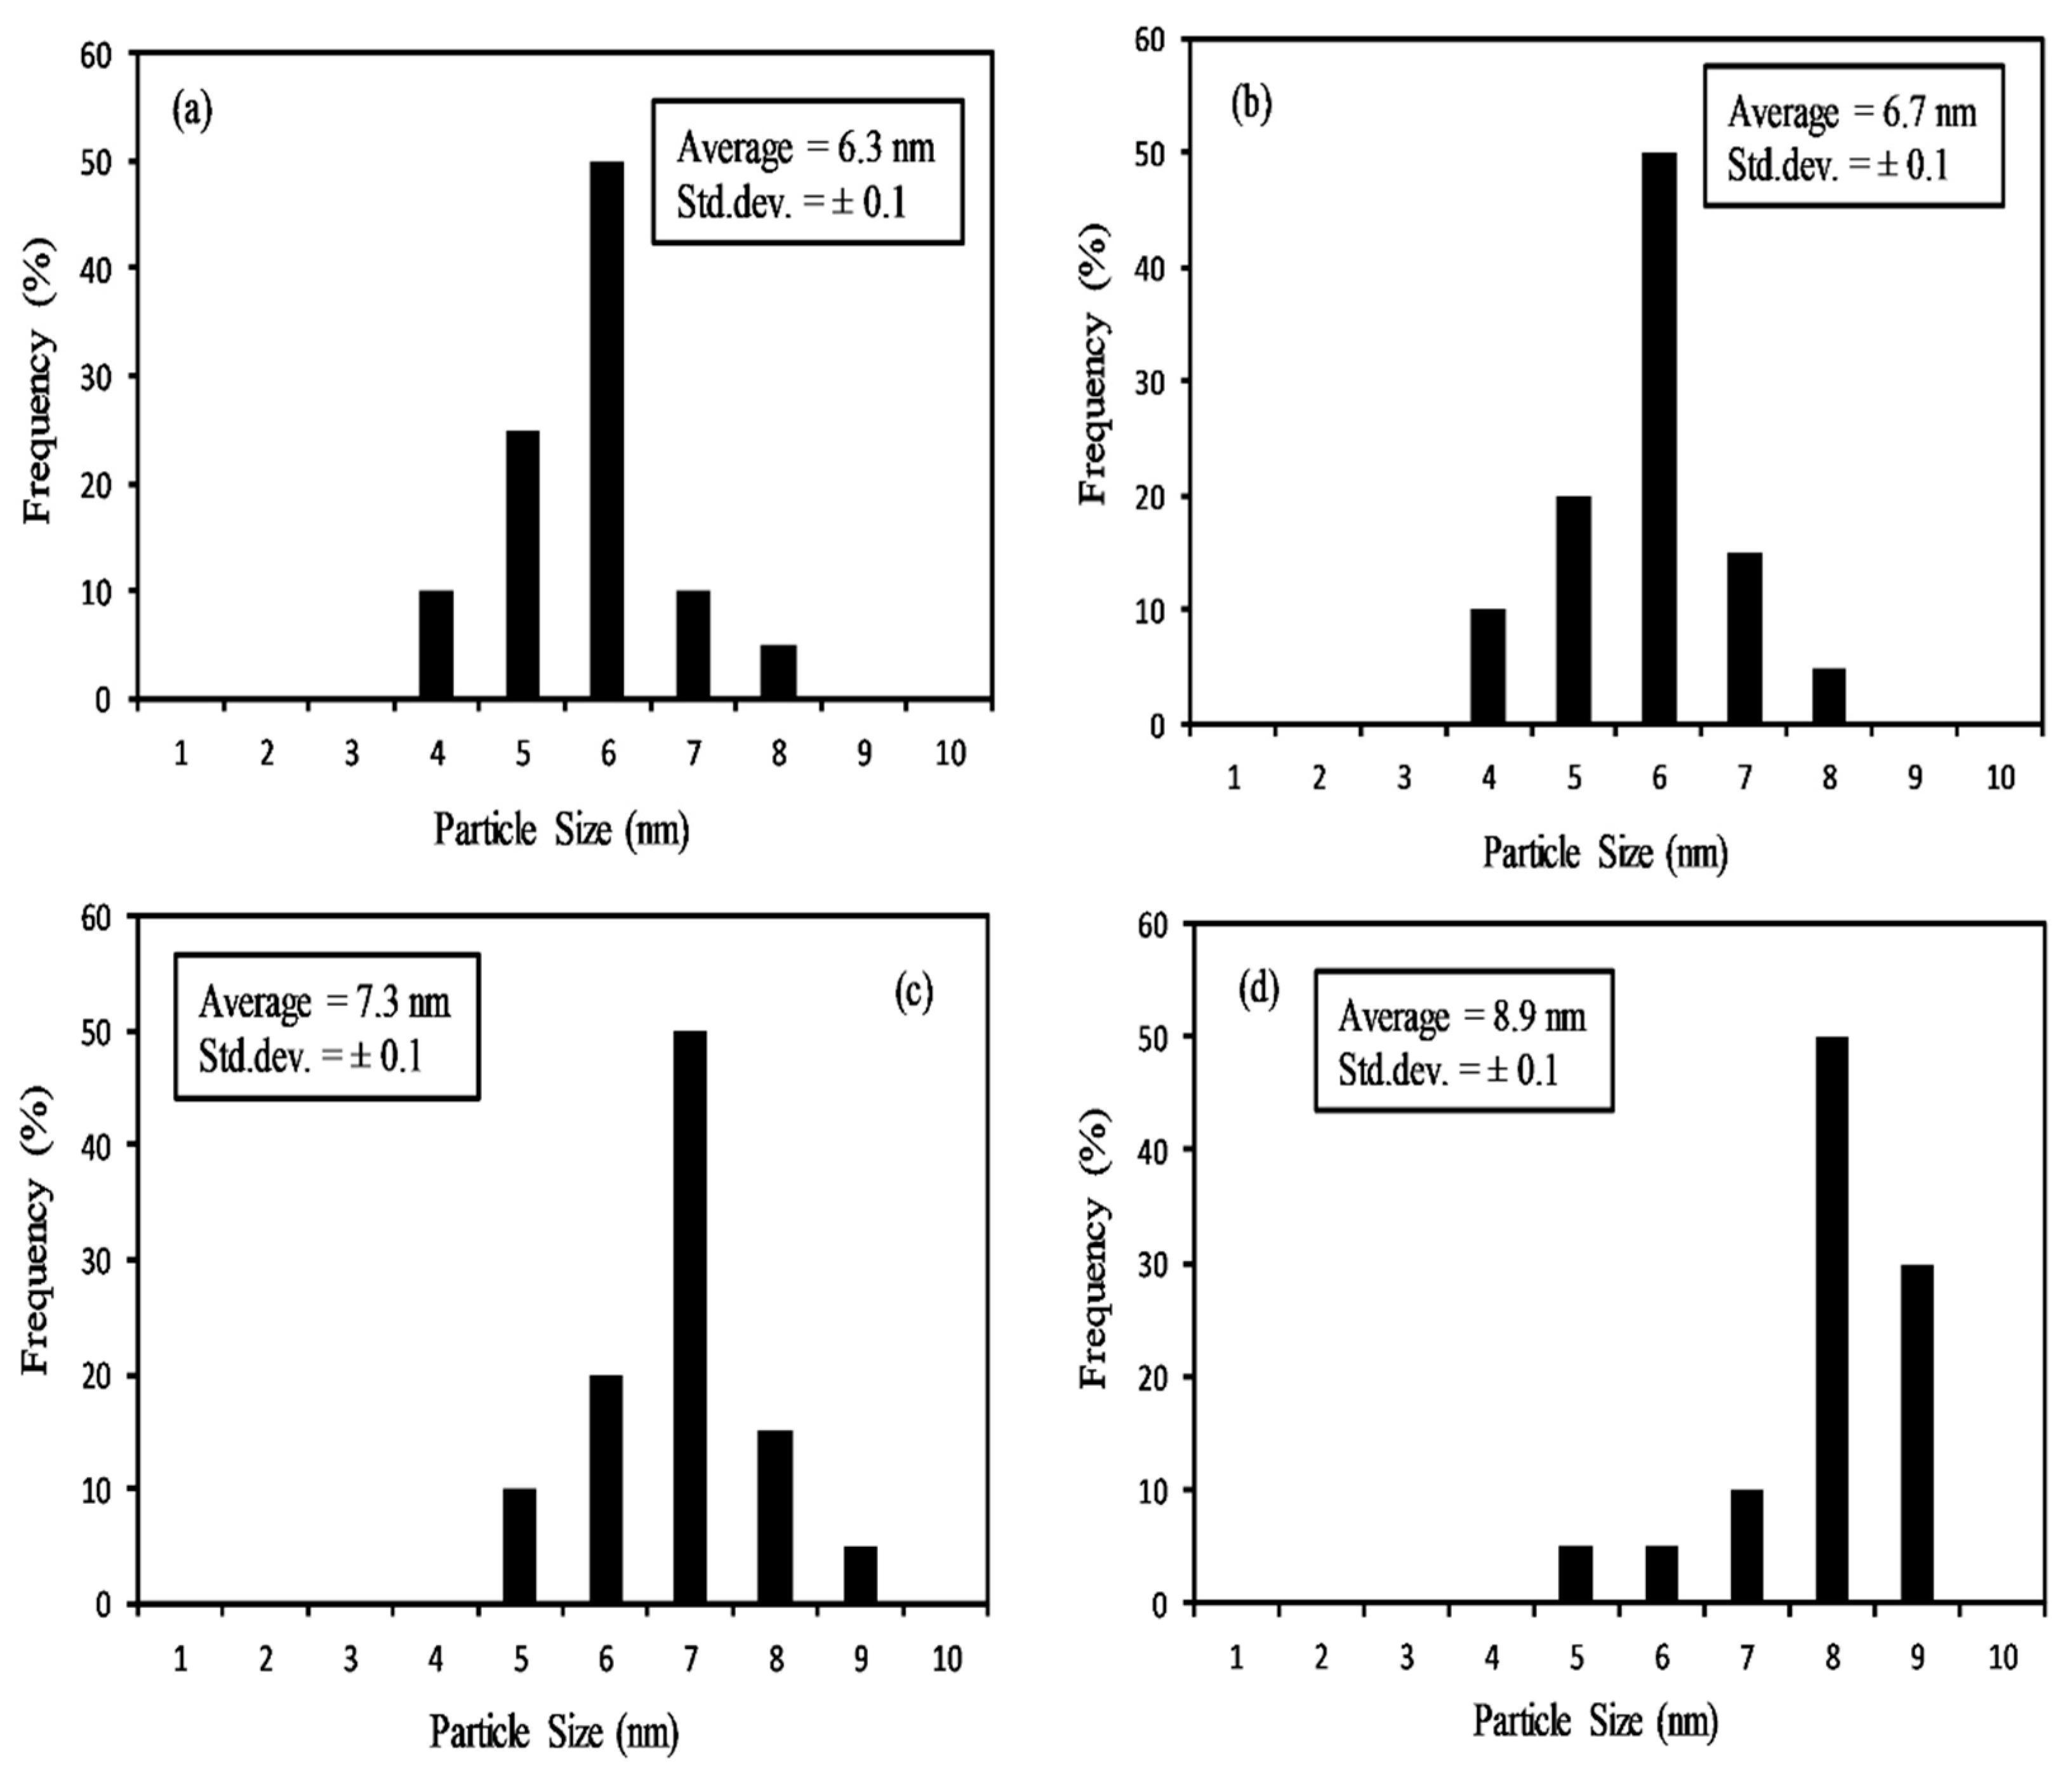
Figure 8 shows the effect of the calcination temperature on the cobalt particle size as analyzed by TEM.
The results shown in Figure 8 and Table 6 indicate that increasing the calcination temperature from 300 to 450 °C led to an average particle size increase from 6.3 to 8.9 nm. In addition, an increase in the calcination temperature also led to an increase in the grain boundaries and resulted in a particle size increase. From a microscopical analysis perspective, the driving force for calcination is a reduction of the total surface energy. Differential surface energy with different surface curvatures is linked to mass transport during calcination [28,29]. The effect of the calcination temperature on the cobalt particle size is shown in Figure 9. Particle size is one of the key factors in the FTS process. In order to obtain the desired particle size, calcination is one of the functional treatments that may be used to increase the particle size [28].
Figure 10 and Figure 11 show the effect of the calcination duration on the cobalt particle size. In this section of the study, cobalt particles were pre-loaded onto the acid- and thermal-treated CNT support by the SEA method and were calcined for 2, 3, and 4 h. The results from Figure 11 show that increasing the calcination duration from 2 to 4 h resulted in an increase in the cobalt particle size from 4 to 10 nm. Increasing the calcination period enhanced the growth of the nanoparticles on the treated CNT support [30].
Figure 12 shows the performed X-ray diffraction plot of the calcined catalyst for the calcination temperature of 300, 350, 400, and 450 °C. The results from the XRD patterns show peaks at 2θ values of 26° and 43°, which can be attributed to the CNT support. Other peaks in the catalyst XRD pattern correspond to different crystal planes attributed to Co3O4 [24]. Therefore, the peak at the 2θ value of 36.8° is the most intense peak, corresponding to Co3O4 from the catalyst samples. In addition, Table 6 illustrates the average particle size of the cobalt particles from the TEM image and XRD spectra using the Scherrer equation [25].
The reducibility of the catalysts in the H2 atmosphere was determined by TPR experiments. The TPR spectra of the different calcining temperature of Co/CNT.A.T.C300, Co/CNT.A.T.C350, Co/CNT.A.T.C400, and Co/CNT.A.T.C450 are shown in Figure 13, and the specific reduction temperatures are presented in Table 6.
Figure 13 shows that a higher calcination temperature resulted in a bigger particle size and therefore led to easier reduction, as shown by the peaks shifted to a lower temperature range. In TPR spectra, the peak at the low range of temperature (325–395 °C) corresponded to the reduction of Co3O4 to CoO [31]. A subsequent reduction of CoO to Co was indicated by a second broad peak during the reduction of the catalyst active sites on the CNT support. A small peak at 600 °C from Figure 13a can be attributed to CNT support gasification. Based on Figure 13, the calcination of the catalyst at a higher temperature shifted the reduction step of Co3O4 to the CoO species (first peak) to a lower temperature compared with the catalyst calcined at a lower temperature, which indicated higher uniform particle reducibility at 400 °C. On the other hand, increasing the cobalt particle size from 3 to 10 nm led to a decrease in the reduction temperature. Based on the TEM analysis, the majority of the cobalt particles in the range of less than 9 nm were impregnated inside the CNT channels, and this observation resulted in a better interaction with the electron-deficient CNT interior and led to a higher reduction rate of the Co3O4 species [32]. The tubular-shaped structure of CNT offers uniquely different properties in comparison with other carbon-based supports. External surfaces of CNT are electron-rich and internal surfaces of CNT channels are electron-deficient, and effect to the interactions of metal and metal oxide particles with the internal and external CNT surfaces [32]. In addition, Chen et al. reported that catalyst particles inside the CNT channels have a higher reduction rate and activity compared with those located on the external surface of the CNT support [32].
It was also observed that the second reduction peak for the catalyst samples (Co/CNT.A.T.C300, Co/CNT.A.T.C350, Co/CNT.A.T.C400, and Co/CNT.A.T.C450) shifted to higher temperatures of 435, 460, 475, and 480 °C, respectively, due to the presence of smaller-sized cobalt particles (>10 nm). Furthermore, the size of the catalyst particles affected the interaction between the particles and their support, where larger catalyst particles showed a stronger interaction with the support and hence could be reduced at a lower temperature. A smaller catalyst particle size can be reduced at a higher temperature [30].
Figure 13 shows an absence of a significant reduction peak above 500 °C, and therefore, the formation of metal support compounds on the CNT support surface was negligible. Tavasoli and Martinez et al. reported a reduction peak that was present at above 530 °C with an oxidic support—an indication of the formation of a cobalt species—which was difficult to be reduced (oxide compounds). Carbon nanotubes are an inert support for a cobalt catalyst and cannot support the formation of metal-support compounds as compared with Co/α-Al2O3 catalysts possessing a higher reduction rate with CNTs but not with oxidic supports [18]. The data for the catalyst reduction percentage and the amount of hydrogen consumption (area under the peak) for each part of the reduction steps (Co3O4 to CoO and CoO to Co), which corresponded to a reduction percentage, are shown in Table 7. The first part of the reduction was in the range of 325–395 °C, and the second part of the reduction was from 435–480 °C. From the results in Figure 13, the TPR graphs indicate that by increasing the calcination temperature from 300–450 °C, the ratio of the H2 consumption for part two to that of part one decreased from 0.6 to 0.54 and 0.49, respectively. The results also illustrate that increasing the cobalt particle size decreased the temperature of the reduction and resulted in an easier reduction at a lower temperature. Consequently, well-dispersed catalyst particles synthesized by the SEA method and impregnated on CNT channels were able to increase the reduction rate of the first step and decrease the reduction temperature of CoO to the Co compounds. The confinement of the catalyst particles by the CNT support improved the first step reduction in comparison with other types of supports, and furthermore, the particle size was an important player for the second step of the reduction [32].
The results of the temperature programmed desorption (TPD) of the catalysts are also given in Table 7. This table shows that in the case of the Co/CNT.A.T.C300, Co/CNT.A.T.C350, Co/CNT.A.T.C400, and Co/CNT.A.T.C450 catalysts, the hydrogen chemisorption (H2 uptake) decreased with the increasing calcination temperature, and the dispersion increased with the increasing calcination temperature up to 400 °C; however, at the higher calcination temperature of 450 °C, the dispersion decreased possibly due to the sintering of the particles (Table 7).
In this study, samples prepared at different calcination temperatures and consequently different Co particle sizes were examined in Fischer–Tropsch reactions (Table 8). Increasing the calcination temperature from 300 to 450 °C resulted in an increase in the CO conversion, as well as in the hydrocarbon selectivity, which could be related to the small particle size of the cobalt catalysts. However, increasing the calcination temperature from 400 to 450 °C led to a decrease in the CO conversion and selectivity, which could be related to the particle size and Co dispersion over the CNT support.
While comparing the catalyst samples calcined at 300 and 400 °C, the calcination performed at 400 °C showed a reduction of 7% selectivity towards methane with a ±0.1% systematic error. A drop of 7% selectivity of CH4 for a cobalt catalyst can be attributed to the significant presence of olefins in the carbon–carbon chain propagation. For the catalyst sample calcined at 400 °C, R–CH=CH2 (α-olefins) had to compete with heavier olefins and CO with respect to the chain initiation and re-adsorption. Increasing an average particle size from 2–4 to 6–8 nm led to an increase in C5+ selectivity from 61.5% to 83.2%. However, Bezemer et al. reported that the range of 6–8 nm cobalt particle sizes was optimum for higher C5+ selectivity [33]. In Figure 9, it was shown that a catalyst particle size of 6.3 nm resulted in 61.5% C5+ selectivity. The results also indicated that in the 6.3 nm catalyst size range, the propagation step of the adsorption of CO and the chain growth probability (α-olefins re-adsorption) was efficient due to the unique electronic properties of the interior CNT walls. In addition, the presence of CO chemisorption inside the CNT channels was due to the electron deficiency of the CNT interior walls and the tubular-shaped structure of CNT was reported to increase the resident time of the reactants in order to react with the catalyst active sites and hence the selectivity of long carbon chains (C5+) [32].
Nevertheless, C5+ selectivity was predominant for the Co/CNT catalyst particles within the range of 7–8 nm. Bezemer et al. reported that smaller-size particles (<8 nm) supported on an oxidic support resulted lower selectivity in compared to CNT support. This differentiation is due to the confinement of the catalyst with smaller particle sizes inside the CNT channels and the better stability in contrast with the catalyst particles located on the exterior surface of the conventional oxidic supports [33]. Chen et al. reported that the tubular shape of the CNT channels prevented catalyst particles inside the CNT channels from sintering and thus led to higher activity and stability [32]. Moreover, increasing catalyst particle size from 4 to 8 nm led to an increase in the olefin/paraffine mass ratio from 0.55 to 0.69. Increasing the paraffin/olefin ratio can also be attributed to the presence of catalyst particle sizes of smaller than 6–8 nm, therefore leading to high selectivity [34,35].

4. Conclusions

Well-dispersed Co nanoparticles on the CNT support was successfully prepared from 10 wt % Co loading via the SEA method. However, increasing the cobalt loading to 20 wt % led to the agglomeration of Co on the support. In terms of the catalyst’s particle size, increasing the Co loading from 5 wt % to 20 wt % resulted in an increase in particle size from 6.1 to 10.6 nm. We have demonstrated that a higher catalyst activity and C5+ selectivity in the Fischer–Tropsch reaction were observed within the optimum range of the Co particle size of 6–8 nm and with 10 wt % cobalt loading. Furthermore, the cobalt particle size distribution could affect the FT activity and selectivity. The unique, tube shape of CNT with open caps could give allowance for the Co particles to enter the CNT tubular channels due to the electron deficiency of the interior CNT surface. Hence, it is envisaged that the CNT support of the catalyst could provide a higher reducibility property in the catalyst as compared with conventional oxide catalysts. Increasing the calcination temperature from 300 to 450 °C resulted in an increase of the Co particle size from 6.3 to 8.9 nm, and increasing the calcination duration from 2 to 4 h resulted in an increase in the Co particle size from 4 to 10 nm. In addition, the results showed by increasing the Co loading from 5 wt % to 10 wt % led to a decrease in the reduction temperature from 530 to 420 °C, while increasing the Co particle dispersion from 19.3% to 29.1%, led to an increase in the CO conversion from 45.5% to 58.7% and in the C5+ selectivity from 70.3% to 83.2%.

Author Contributions

Conceptualization, O.A.; Methodology, O.A.; Software, M.S.; Validation, Y.A.W.; Formal analysis, N.A.H.; Investigation, O.A.; Resources, M.A.R.; Data curation, O.A.; Original draft preparation, O.A.; Review and editing of the writing, Z.M.A.M.; Visualization, Z.Z.C.; Supervision, M.R.J. and N.A.M.Z.; Project administration, S.A.; and Funding acquisition, M.R.J. and N.A.M.Z.

Funding

Funding was provided by the Universiti Teknologi PETRONAS, University of Malaya, Nanotechnology and Catalysis Research Centre (RU011-2017 Grant) and Ministry of Education of Malaysia under the Fundamental Research Grant Scheme FRGS/1/2012/SG01/UTP/02/01.

Acknowledgments

The authors acknowledge the Universiti Teknologi PETRONAS and the University of Malaya for their support.

Conflicts of Interest

The authors declare no conflict of interest.

References

  1. Iglesia, E. Design, synthesis, and use of cobalt-based Fischer-Tropsch synthesis catalysts. Appl. Catal. A Gen. 1997, 161, 59–78. [Google Scholar] [CrossRef]
  2. Elbashir, N.O.; Roberts, C.B. Enhanced incorporation of α-olefins in the Fischer-Tropsch synthesis chain-growth process over an alumina-supported cobalt catalyst in near-critical and supercritical hexane media. Ind. Eng. Chem. Res. 2005, 44, 505–521. [Google Scholar] [CrossRef]
  3. Sudarsanam, P.; Hillary, B.; Deepa, D.K.; Amin, M.H.; Mallesham, B.; Reddy, B.M.; Bhargava, S.K. Highly efficient cerium dioxide nanocube-based catalysts for low temperature diesel soot oxidation: The cooperative effect of cerium- and cobalt-oxides. Catal. Sci. Technol. 2015, 5, 3496–3500. [Google Scholar] [CrossRef]
  4. Maitlis, P.M.; Zanotti, V. The role of electrophilic species in the Fischer–Tropsch reaction. Chem. Commun. 2009, 13, 1619–1634. [Google Scholar] [CrossRef] [PubMed]
  5. Dry, M. Chemical concepts used for engineering purposes. Stud. Surf. Sci. Catal. 2004, 152, 196–257. [Google Scholar]
  6. Akbarzadeh, O.; Mohd Zabidi, N.A.; Abdullah, B.; Subbarao, D. Influence of Acid and Thermal Treatments on Properties of Carbon Nanotubes. Adv. Mater. Res. 2014, 832, 394–398. [Google Scholar] [CrossRef]
  7. Hexana, W.M. A Systematic Study of the Effect of Chemical Promoters on the Precipitated Fe-Based Fischer-Tropsch Synthesis Catalyst; Faculty of Science, University of the Witwatersrand: Johannesburg, South Africa, 2009. [Google Scholar]
  8. Akbarzadeh, O.; Mohd Zabidi, N.A.; Abdullah, B.; Subbarao, D. Synthesis and Characterization of Co/CNTs Catalysts Prepared by Strong Electrostatic Adsorption (SEA) Method. Appl. Mech. Mater. 2014, 625, 328–332. [Google Scholar] [CrossRef]
  9. Sudarsanam, P.; Zhong, R.; Van den Bosch, S.; Coman, S.M.; Parvulescu, V.I.; Sels, B.F. Functionalised heterogeneous catalysts for sustainable biomass valorisation. Chem. Soc. Rev. 2018. [Google Scholar] [CrossRef]
  10. Akbarzadeh, O.; Zabidi, N.A.M.; Abdullah, B.; Subbarao, D. Dispersion of Co/CNTs via strong electrostatic adsorption method: Thermal treatment effect. AIP Conf. Proc. 2015, 1669, 020052. [Google Scholar] [CrossRef]
  11. Park, J.; Regalbuto, J.R. A simple, accurate determination of oxide PZC and the strong buffering effect of oxide surfaces at incipient wetness. J. Colloid Interface Sci. 1995, 175, 239–252. [Google Scholar] [CrossRef]
  12. Zolfaghari, Z.; Tavasoli, A.; Tabyar, S.; Pour, A.N. Enhancement of bimetallic Fe-Mn/CNTs nano catalyst activity and product selectivity using microemulsion technique. J. Energy Chem. 2014, 23, 57–65. [Google Scholar] [CrossRef]
  13. Jacobs, G.; Das, T.K.; Zhang, Y.; Li, J.; Racoillet, G.; Davis, B.H. Fischer–Tropsch synthesis: Support, loading, and promoter effects on the reducibility of cobalt catalysts. Appl. Catal. A Gen. 2002, 233, 263–281. [Google Scholar] [CrossRef]
  14. Jacobs, G.; Patterson, P.M.; Das, T.K.; Luo, M.; Davis, B.H. Fischer–Tropsch synthesis: Effect of water on Co/Al2O3 catalysts and XAFS characterization of reoxidation phenomena. Appl. Catal. A Gen. 2004, 270, 65–76. [Google Scholar] [CrossRef]
  15. Tavasoli, A.; Mortazavi, Y.; Khodadadi, A.A.; Mousavian, M.A.; Sadagiani, K.; Karimi, A. Effects of different loadings of Ru and Re on physico-chemical properties and performance of 15% Co/Al2O3 FTS catalysts. Iran. J. Chem. 2005, 24, 9–17. [Google Scholar]
  16. Serp, P.; Corrias, M.; Kalck, P. Carbon nanotubes and nanofibers in catalysis. Appl. Catal. A Gen. 2003, 253, 337–358. [Google Scholar] [CrossRef]
  17. Abbaslou, R.M.M.; Tavasoli, A.; Dalai, A.K. Effect of pre-treatment on physico-chemical properties and stability of carbon nanotubes supported iron Fischer–Tropsch catalysts. Appl. Catal. A Gen. 2009, 355, 33–41. [Google Scholar] [CrossRef]
  18. Tavasoli, A.; Sadagiani, K.; Khorashe, F.; Seifkordi, A.; Rohani, A.; Nakhaeipour, A. Cobalt supported on carbon nanotubes—A promising novel Fischer–Tropsch synthesis catalyst. Fuel Process. Technol. 2008, 89, 491–498. [Google Scholar] [CrossRef]
  19. Akbarzadeh, O.; Mohd Zabidi, N.; Abdul Wahab, Y.; Hamizi, N.; Chowdhury, Z.; Merican Aljunid Merican, Z.; Ab Rahman, M.; Akhter, S.; Rasouli, E.; Johan, M. Effect of Cobalt Catalyst Confinement in Carbon Nanotubes Support on Fischer-Tropsch Synthesis Performance. Symmetry 2018, 10, 572. [Google Scholar] [CrossRef]
  20. Ozkara, S.; Akin, A.N.; Misirli, Z.; Aksoylu, A.E. The effect of metal loading on structural characteristics and low temperature CO oxidation activity of coprecipitated Co/Al2O3. Turk. J. Chem. 2005, 29, 219–224. [Google Scholar]
  21. Pendyala, V.R.R.; Jacobs, G.; Ma, W.; Klettlinger, J.L.; Yen, C.H.; Davis, B.H. Fischer–Tropsch synthesis: Effect of catalyst particle (sieve) size range on activity, selectivity, and aging of a Pt promoted Co/Al2O3 catalyst. Chem. Eng. J. 2014, 249, 279–284. [Google Scholar] [CrossRef]
  22. Hillary, B.; Sudarsanam, P.; Amin, M.H.; Bhargava, S.K. Nanoscale Cobalt–Manganese Oxide Catalyst Supported on Shape-Controlled Cerium Oxide: Effect of Nanointerface Configuration on Structural, Redox, and Catalytic Properties. Langmuir 2017, 33, 1743–1750. [Google Scholar] [CrossRef] [PubMed]
  23. Akbarzadeh, O.; Mohd Zabidi, N.A.; Abdullah, B.; Subbarao, D. Synthesis of Co/CNTs via Strong Electrostatic Adsorption: Effect of Metal Loading. Adv. Mater. Res. 2014, 1043, 101–104. [Google Scholar] [CrossRef]
  24. Bezemer, G.; Van Laak, A.; Van Dillen, A.; De Jong, K. Cobalt supported on carbon nanofibers-a promising novel Fischer-Tropsch catalyst. Stud. Surf. Sci. Catal. 2004, 147, 259–264. [Google Scholar]
  25. Bechara, R.; Balloy, D.; Vanhove, D. Catalytic properties of Co/Al2O3 system for hydrocarbon synthesis. Appl. Catal. A Gen. 2001, 207, 343–353. [Google Scholar] [CrossRef]
  26. Tavasoli, A.; Abbaslou, R.M.M.; Trepanier, M.; Dalai, A.K. Fischer–Tropsch synthesis over cobalt catalyst supported on carbon nanotubes in a slurry reactor. Appl. Catal. A Gen. 2008, 345, 134–142. [Google Scholar] [CrossRef]
  27. Bezemer, G.L.; Bitter, J.H.; Kuipers, H.P.; Oosterbeek, H.; Holewijn, J.E.; Xu, X.; Kapteijn, F.; van Dillen, A.J.; de Jong, K.P. Cobalt particle size effects in the Fischer-Tropsch reaction studied with carbon nanofiber supported catalysts. J. Am. Chem. Soc. 2006, 128, 3956–3964. [Google Scholar] [CrossRef] [PubMed]
  28. Kennedy, M.; Kruis, F.; Fissan, H.; Mehta, B.; Stappert, S.; Dumpich, G. Tailored nanoparticle films from monosized tin oxide nanocrystals: Particle synthesis, film formation, and size-dependent gas-sensing properties. J. Appl. Phys. 2003, 93, 551–560. [Google Scholar] [CrossRef]
  29. Akbarzadeh, O.; Mohd Zabidi, N.A.; Abdullah, B.; Subbarao, D. Synthesis of Co/CNTs Catalyst via Strong Electrostatic Adsorption: Effect of Calcination Condition. Adv. Mater. Res. 2015, 1109, 1–5. [Google Scholar] [CrossRef]
  30. Trépanier, M.; Tavasoli, A.; Dalai, A.K.; Abatzoglou, N. Co, Ru and K loadings effects on the activity and selectivity of carbon nanotubes supported cobalt catalyst in Fischer–Tropsch synthesis. Appl. Catal. A Gen. 2009, 353, 193–202. [Google Scholar] [CrossRef]
  31. Huffman, G.P.; Shah, N.; Zhao, J.; Huggins, F.E.; Hoost, T.E.; Halvorsen, S.; Goodwin, J. In-situ XAFS investigation of K-promoted Co catalysts. J. Catal. 1995, 151, 17–25. [Google Scholar] [CrossRef]
  32. Chen, W.; Fan, Z.; Pan, X.; Bao, X. Effect of confinement in carbon nanotubes on the activity of Fischer− Tropsch iron catalyst. J. Am. Chem. Soc. 2008, 130, 9414–9419. [Google Scholar] [CrossRef] [PubMed]
  33. Bezemer, G.L.; Radstake, P.; Koot, V.; Van Dillen, A.; Geus, J.; De Jong, K. Preparation of Fischer–Tropsch cobalt catalysts supported on carbon nanofibers and silica using homogeneous deposition-precipitation. J. Catal. 2006, 237, 291–302. [Google Scholar] [CrossRef] [Green Version]
  34. Martínez, A.; Prieto, G. Breaking the dispersion-reducibility dependence in oxide-supported cobalt nanoparticles. J. Catal. 2007, 245, 470–476. [Google Scholar] [CrossRef]
  35. Madon, R.J.; Iglesia, E. The importance of olefin readsorption and H2/CO reactant ratio for hydrocarbon chain growth on ruthenium catalysts. J. Catal. 1993, 139, 576–590. [Google Scholar] [CrossRef]
Figure 1. (a) The point of zero charge (PZC) of the carbon nanotube (CNT) support, and (b) the Co uptake versus the pH analyzed by atomic absorption spectroscopy (AAS).
Symmetry 11 00007 g001
Figure 2. TEM images of the as-synthesized catalyst at (a) 5 wt %, (b) 10 wt %, (c) 15 wt %, and (d) 20 wt % Co loading on the CNT.
Symmetry 11 00007 g002
Figure 3. Average Co particle size of the catalyst prepared at different Co loadings.
Symmetry 11 00007 g003
Figure 4. Size distribution of the cobalt particles from different catalyst samples based on transmission electron microscopy (TEM) micrograph analysis.
Symmetry 11 00007 g004
Figure 5. XRD spectra for CNT, Co5/CNT, Co10/CNT, and Co20/CNT catalysts.
Symmetry 11 00007 g005
Figure 6. TPR-H2 profiles of (a) CNT.A.T, (b) Co20/CNT, (c) Co15/CNT, (d) Co10/CNT, and (e) Co5/CNT.
Symmetry 11 00007 g006
Figure 7. CO conversion, Fischer–Tropsch synthesis (FTS) rate (g HC/g cat/h), and water gas shift reaction (WGS) rate (g CO2/g cat/h) for different Co/CNT catalyst loadings.
Symmetry 11 00007 g007
Figure 8. TEM image of the catalyst calcined for 4 h at (a) 300, (b) 350, (c) 400, and (d) 450 °C.
Symmetry 11 00007 g008
Figure 9. Metal particle size for the samples calcined at (a) 300, (b) 350, (c) 400, and (d) 450 °C.
Symmetry 11 00007 g009
Figure 10. TEM images of catalysts calcined at 450 °C for (a) 2 h, (b) 3 h, and (c) 4 h.
Symmetry 11 00007 g010
Figure 11. Average cobalt particle size for various calcination durations at 450 °C.
Symmetry 11 00007 g011
Figure 12. XRD patterns of Co/CNT catalysts calcined for 4 h at (a) 300, (b) 350, (c) 400, and (d) 450 °C.
Symmetry 11 00007 g012
Figure 13. TPR profiles for the catalyst (a) Co/CNT.A, (b) Co/CNT.A.T.C300, (c) Co/CNT.A.T.C350, (d) Co/CNT.A.T.C400, and (e) Co/CNT.A.T.C450.
Symmetry 11 00007 g013
Table 1. Surface area and porosity properties of the catalytic samples at various Co wt % loadings.
SamplesBET Surface Area (m2/g)Total Pore Volume (m3/g)
As-received CNT138.20.32
CNT.A223.20.41
CNT.A.T266.40.54
Co5/CNT.A.T224.60.43
Co10/CNT.A.T221.40.40
Co15/CNT.A.T217.60.37
Co20/CNT.A.T214.10.34
Table 2. Catalyst particle size based on X-ray powder diffraction (XRD) and transmission electron microscopy (TEM) results.
CatalystXRD (dCo3O4) (nm)TEM Average Size (nm)
Co5/CNT.A.T6.16.0
Co10/CNT.A.T7.27.3
Co15/CNT.A.T9.08.9
Co20/CNT.A.T10.610.5
Table 3. H2 Chemisorption results *.
Catalyst1st Peak °C2nd Peak °CH2 Uptake *%Disp.Reduction (%)No of Active Sites × (1020)
Co5/CNT.A.T29148197.419.355.43.4
Co10/CNT.A.T273477102.429.168.15.8
Co15/CNT.A.T23844988.116.851.92.7
Co20/CNT.A.T25040085.814.447.52.3
* H2 uptake (μ mole H2 desorbed/g cat.).
Table 4. Effect of the wt % cobalt loading on the CO conversion and hydrocarbons selectivity.
Catalyst (w/w)%%COConv.CO2%CH4%C2-C4%C5+%O/Pα
Co5/CNT.A.T45.50.519.010.270.30.550.505
Co10/CNT.A.T58.70.59.56.883.20.600.542
Co15/CNT.A.T50.60.518.215.665.70.650.476
Co20/CNT.A.T40.30.523.019.157.40.690.432
Table 5. Surface area and porosity properties of samples calcined at various temperatures (°C).
SamplesBET Surface Area (m2/g)Total Pore Volume (m3/g)
As-received CNT138.20.32
CNT.A223.20.41
CNT.A.T266.40.54
Co/CNT.A.T.C300208.80.40
Co/CNT.A.T.C350214.60.63
Co/CNT.A.T.C400221.40.88
Co/CNT.A.T.C450211.30.71
Table 6. Particle size comparison by XRD and TEM analysis for catalytic samples with various calcination temperatures (°C).
CatalystTEM Ave. Size(nm)XRD d (Co3O4) nm
Co/CNT.A.T.C3006.36.4 ± 0.2
Co/CNT.A.T.C3506.76.6 ± 0.2
Co/CNT.A.T.C4007.37.2 ± 0.2
Co/CNT.A.T.C4508.98.8 ± 0.2
Table 7. TPR and temperature programmed desorption (TPD) results of the catalyst samples at various calcination temperatures.
Samples1st TPR Peak °C2nd TPR Peak °CReduction (%)H2 Uptake *Disp.%
CNT.A600----------------
Co/CNT.A.T.C30039548048.351518.5
Co/CNT.A.T.C35039147552.136820.2
Co/CNT.A.T.C40033844968.1102.429.1
Co/CNT.A.T.C45032543555.421121.4
* H2 uptake: (μ mole H2 desorbed/g cat.).
Table 8. Effect of the calcination temperatures on the performance of the catalysts.
Catalyst T(°C)%COConv.CO2%CH4%C2-C4%C5+%
Co/CNT.AT.C30044.60.518.919.161.5
Co/CNT.A.T.C35050.20.514.912.372.3
Co/CNT.A.T.C40058.70.59.56.883.2
Co/CNT.A.T.C45052.10.514.510.474.6

