Pressure Fluctuation and Flow Characteristics in a Two-Stage Double-Suction Centrifugal Pump


1
College of Water Resources and Civil Engineering, China Agricultural University, Beijing 100083, China
2
Beijing Engineering Research Center of Safety and Energy Saving Technology for Water Supply Network System, China Agricultural University, Beijing 100083, China
*
Author to whom correspondence should be addressed.
Symmetry 2019, 11(1), 65; https://doi.org/10.3390/sym11010065
Submission received: 3 December 2018
/
Revised: 21 December 2018
/
Accepted: 2 January 2019
/
Published: 8 January 2019
Abstract
:Pressure fluctuation is the primary factor that affects the stability of turbomachines. The goal of the present work is to explore the propagation of pressure fluctuations in a two-stage double-suction centrifugal pump. The pressure fluctuation characteristics of each component of a two-stage double-suction centrifugal pump are simulated under four typical flow rates based on the SST k-ω turbulence model. It is shown that the pressure fluctuation frequency at blade passing frequency and its first harmonic is the same at the suction chamber, the leading edge, and the middle of the first-stage impeller, which is different from the rotor–stator interaction. Moreover, the uneven impeller inlet flow distribution will produce fluctuations with rotation frequency and its harmonics at the leading edge of the impellers in both stages. Finally, broadband frequency is found at the trailing edge of the impellers in both stages associated with the first harmonic of the rotation frequency, especially under the part load condition. The large size backflow vortex appears in the blade flow channel leading to the low-pressure zone between the impeller, the tongue, and the start of the partition. That is why the pressure drops significantly twice in one rotation period when the blades pass through the tongue and the start of the partition.
1. Introduction
There are two main issues in pump operation. One issue is the high consumption of energy, and the other is the unstable performance, such as large pressure fluctuations. Pumps with both high operation efficiency and low pressure fluctuation will make a significant contribution to energy savings. A two-stage double-suction centrifugal pump is a kind of large-scale pump, which is designed to satisfy the requirement for both high head and huge flow rate in agricultural irrigation. Its structure is more complicated than usual centrifugal pumps, and its pressure fluctuation performance is becoming one of the most important and complicated issues due to its high power consumption. Therefore, the purpose of this paper is to investigate the pressure fluctuation and flow characteristics in the prototype pump in order to provide inside information for its stable operation in actual application.
The pressure fluctuation study of pumps has been carried out for many years, since Tatsuji et al. [1] studied the periodic fluctuating flow in a volute pump. Many phenomena such as rotor–stator interaction [2], vibration, noise [3], and cavitation [4,5] are closely related. At present, the main focus was put on the parameter impact of different components of the pump on the pressure fluctuation characteristics. For example, Guelich et al. [6] studied the pressure fluctuation performance in terms of the finite number of blades with finite edge thickness, large-scale turbulence, and vortices generated by flow separation, which may influence the fluctuation level. Yao et al. [7] investigated the characteristic of the suction chamber and the volute in a double-suction centrifugal pump by a time-frequency analysis method. However, more study is needed on the pressure fluctuation relationship between different components of the pumps. When pressure fluctuation occurs, it will affect the flow characteristic of both the upstream and the downstream. Taking a typical pressure fluctuation in the pump caused by rotor–stator interaction as an example, the periodic interaction between the impeller and guide vane or volute tongue can result in the creation of Blade Passing Frequency (BPF) and its harmonics near the guide vane or volute tongue, while Rotation Frequency (RF) and its harmonics occur on each blade. In this paper, the BPF means the frequency measured within the rotating coordinate system. Pressure fluctuations caused by rotor–stator interaction have a certain impact on the pressure fluctuation performance at the downstream, especially in the volute channel. However, most studies ignored the issue and still focused on the pressure fluctuation performance in the area between the impeller and the volute tongue.
An important reason that hinders the study of pressure fluctuation in a pump is that it is very difficult to set monitoring points on the rotating impeller in experiments [8]. It is easier to set monitors at stationary parts; for example, Spence et al. [9,10] put ten pressure sensors at various stationary locations to study the geometrical variations on the pressure fluctuation performance of a centrifugal pump. However, more details about the pressure fluctuation generation and the propagation within the pump need to be studied. With the development of Computational Fluid Dynamics (CFD), more and more researchers turn to applying the numerical methods to study pressure fluctuations with flow details [11,12]. Gonza’lez et al. [13], for example, studied the effect of impeller-volute interaction in a single-stage centrifugal pump by both experimental and numerical ways. The good agreement with the experimental results shows that CFD simulation is a feasible and reliable tool in the study of pressure fluctuations in turbomachinery. The turbulence model plays an important role in the CFD simulation. While attempting to simulate the flow within the pump, different turbulence models may perform differently under the same boundary and grid conditions, relying on their own typical assumptions. Both Large Eddy Simulation (LES) and the Reynolds-Averaged Navier–Stokes (RANS) model are widely used in numerical study [14]. However, the strict grid requirement and large consumption of computing resource of the LES method make the application of RANS become popular. The RANS model has been applied widely in industrial flow due to its simplicity and efficiency. However, the RANS model like standard k-ε has poor performance in flow simulation with large curvature and rotation effects like the flow in pumps. Since the Shear Stress Transport (SST) turbulence model proposed by Menter [15] has been verified and proven to be an appropriate choice in the flow simulation of turbomachinery [16,17], it was selected and applied in the present work.
In this paper, the pressure fluctuation and flow characteristics in a two-stage double-suction centrifugal pump are studied based on CFD analysis. Monitor points are arranged in the full flow channel from the inlet to the outlet of the pump in order to show the whole pressure fluctuation characteristics of the pump. Especially, in the rotation parts, the monitor points are rotating with the impeller. The pressure fluctuation characteristics are analyzed under four typical flow rates based on the Fast Fourier Transform (FFT). The remaining parts of the paper are arranged as follows. In Section 2, the research object and numerical method are described. In Section 3, the basic fluctuation characteristic of the pump is presented first. Then, the propagation of the main fluctuation is discussed. The main conclusions are given in Section 4.
2. Research Object and Numerical Method
2.1. Two-Stage Double-Suction Centrifugal Pump
A two-stage double-suction centrifugal pump was studied. The specific speed of the pump is nq = 26, which is defined as,
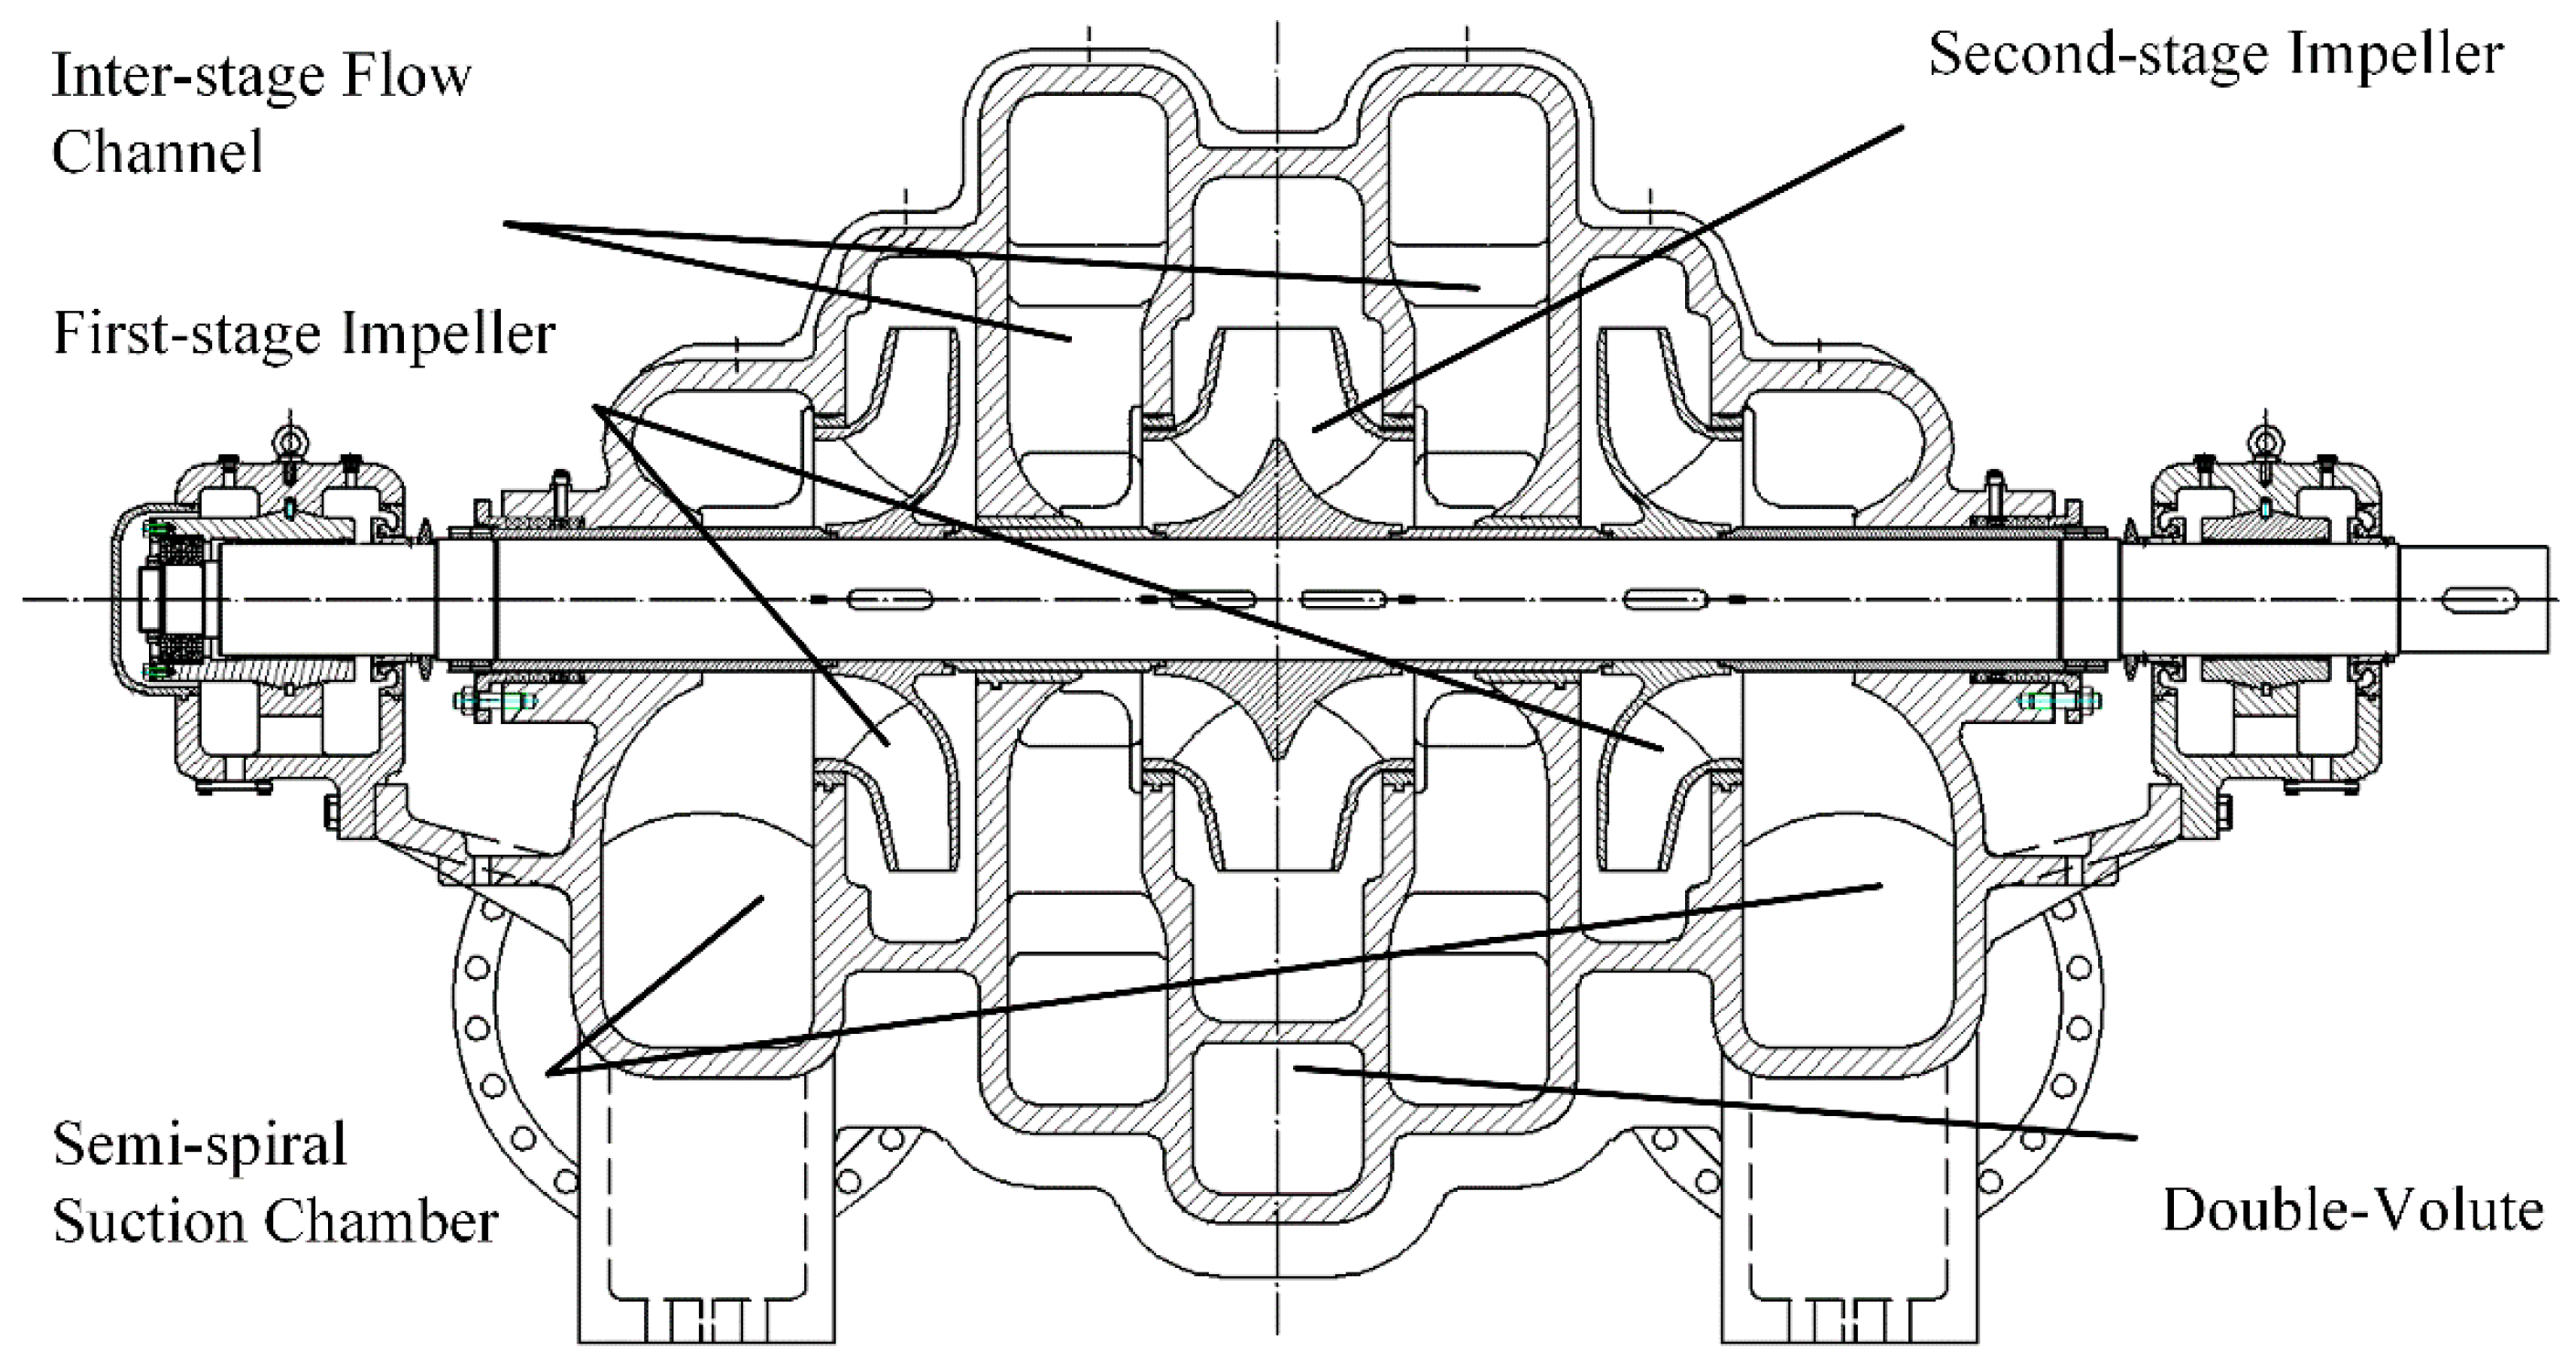
where the Q is the mass flow rate, m3/s; n is the rotating speed, 750 rpm; H is the head of the pump, m. The pump consists of two suction chambers and two parallel two-stage impellers with a common shaft in the same casing. The horizontal split pump case is used. A cross-section view of the pump is shown in Figure 1. The two-stage double-suction centrifugal pump has two semi-spiral suction chambers symmetrically distributed on the left and right sides, leading the fluid to the first-stage impellers on each side, respectively.
The inter-stage flow channel transports the outflow of the first-stage impeller to the inlet of the second-stage impeller. The main function of the inter-stage flow channel is to convert kinetic energy into pressure energy by reducing the velocity with a minimum loss [18]. It has to make a 180° turn to direct the flow into the second-stage impeller. The second-stage impeller is a double-suction impeller whose trailing edge is parallel with the pump shaft. The fluid on both sides is gathered in a common volute. Both the first-stage impeller and the second-stage impeller have six blades. The inlet diameter of the pump is the same as the volute outlet diameter.
2.2. Turbulence Model and Boundary Conditions
The SST k-ω turbulence model [19] was used for the numerical simulation in this study. The model is a widely-used and robust two-equation turbulence model for turbomachinery flow. The model combines the k-ω model and k-ε model in which the k-ω model is used in the near-wall region and switches to the k-ε model in the free shear flow region based on the blending function. More reasonable information can be obtained in the near-wall region by the model with the same convergence level as the standard k-ε model. The basic formulations of the SST model are as follows.
where ρ is the fluid density, which is constant for water here, k is the turbulence kinetic energy, ω is the specific rate of turbulence dissipation, is the production term, μ is the dynamic viscosity, μt is the turbulence eddy viscosity, β = 0.075, β* = 0.09, σk = 0.5, σω = 0.5, σω2 = 0.856 are the model coefficients, and F1 is the blending function, which is used to blend the k-ω model (F1 = 0) and k-ε model (F1 = 1).
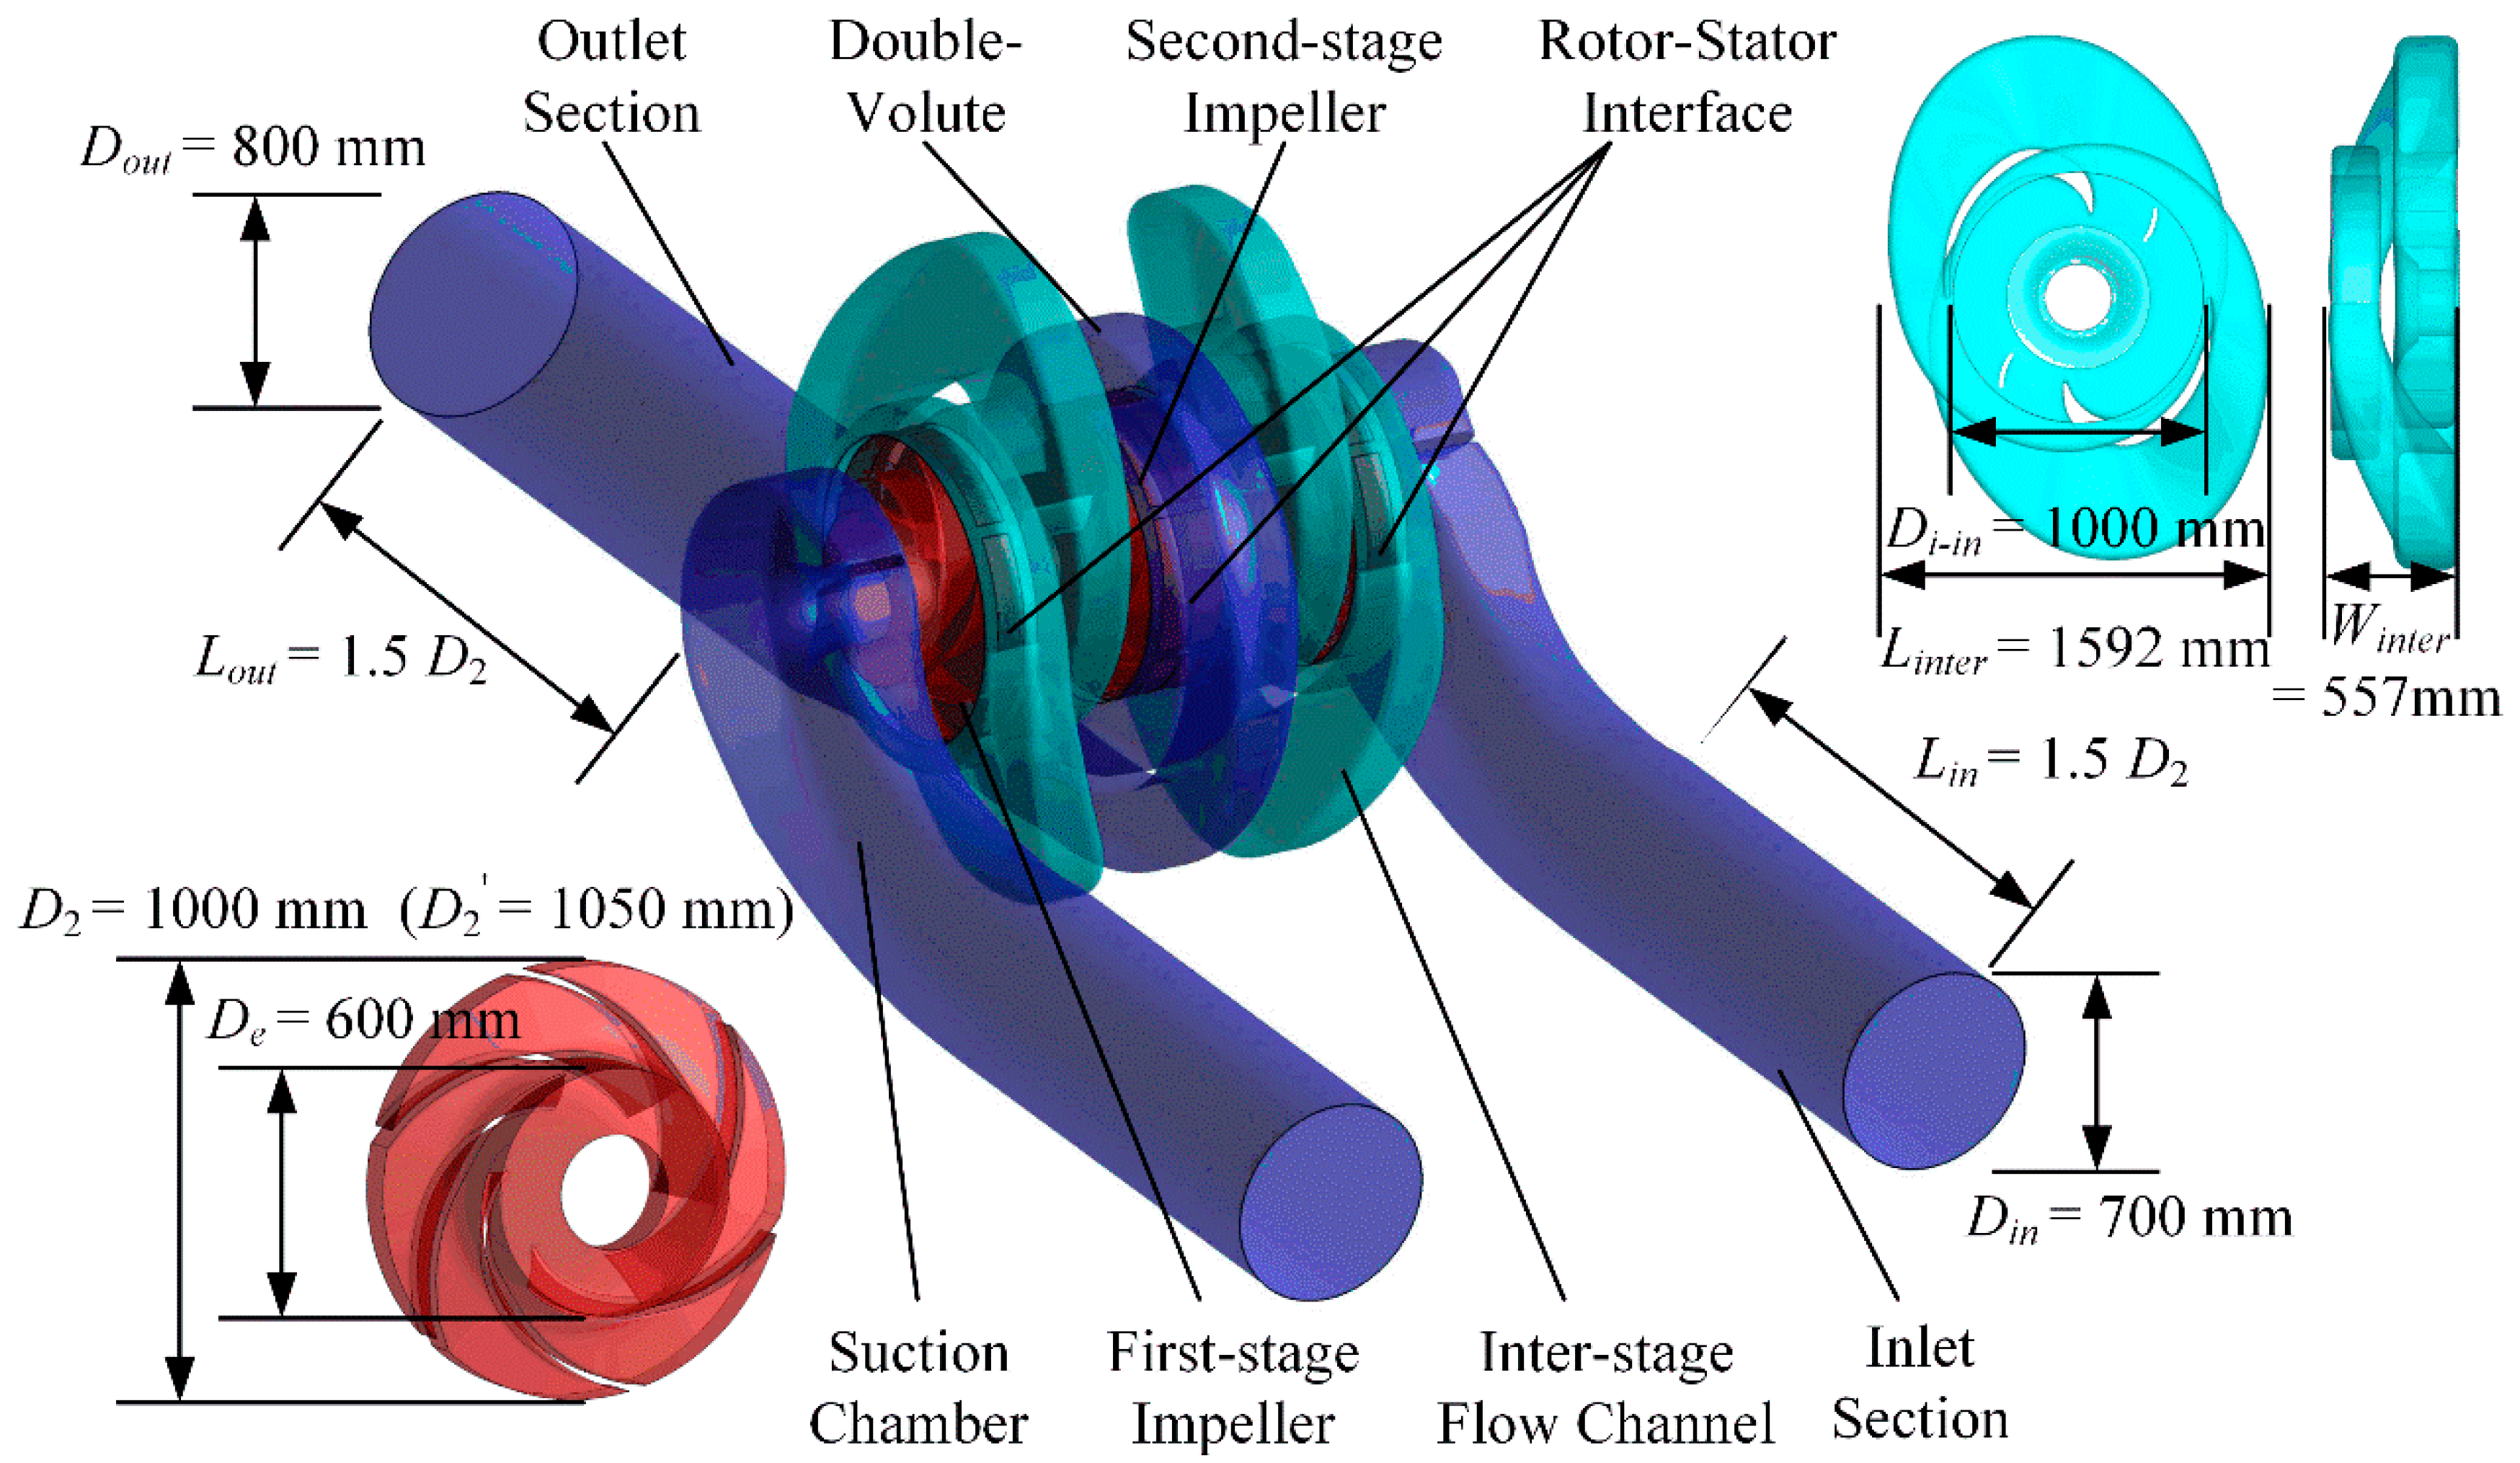
The commercial code ANSYS CFX was used to simulate the internal flow of the pump. The inlet boundary was placed at 1.5D2 (where D2 is the diameter of the impeller) upstream away from the inlet of the suction chamber with the mass flow rate condition. The static pressure condition is given at 1.5D2 downstream away from the volute outlet. The transient rotor-stator approach with moving mesh was used for the simulation of the domain including both the rotating impeller and stationary part. The no-slip wall boundary condition was set at all the walls. Information exchanged between the rotating part and the stationary part was settled by the rotor–stator interface. Four typical flow conditions, 0.6Qn, 0.8Qn, 1.0Qn, 1.2Qn, (Qn is the rated flow rate of the pump) were studied in the unsteady simulation. The simulation domain is shown in Figure 2.
2.3. Monitor Points
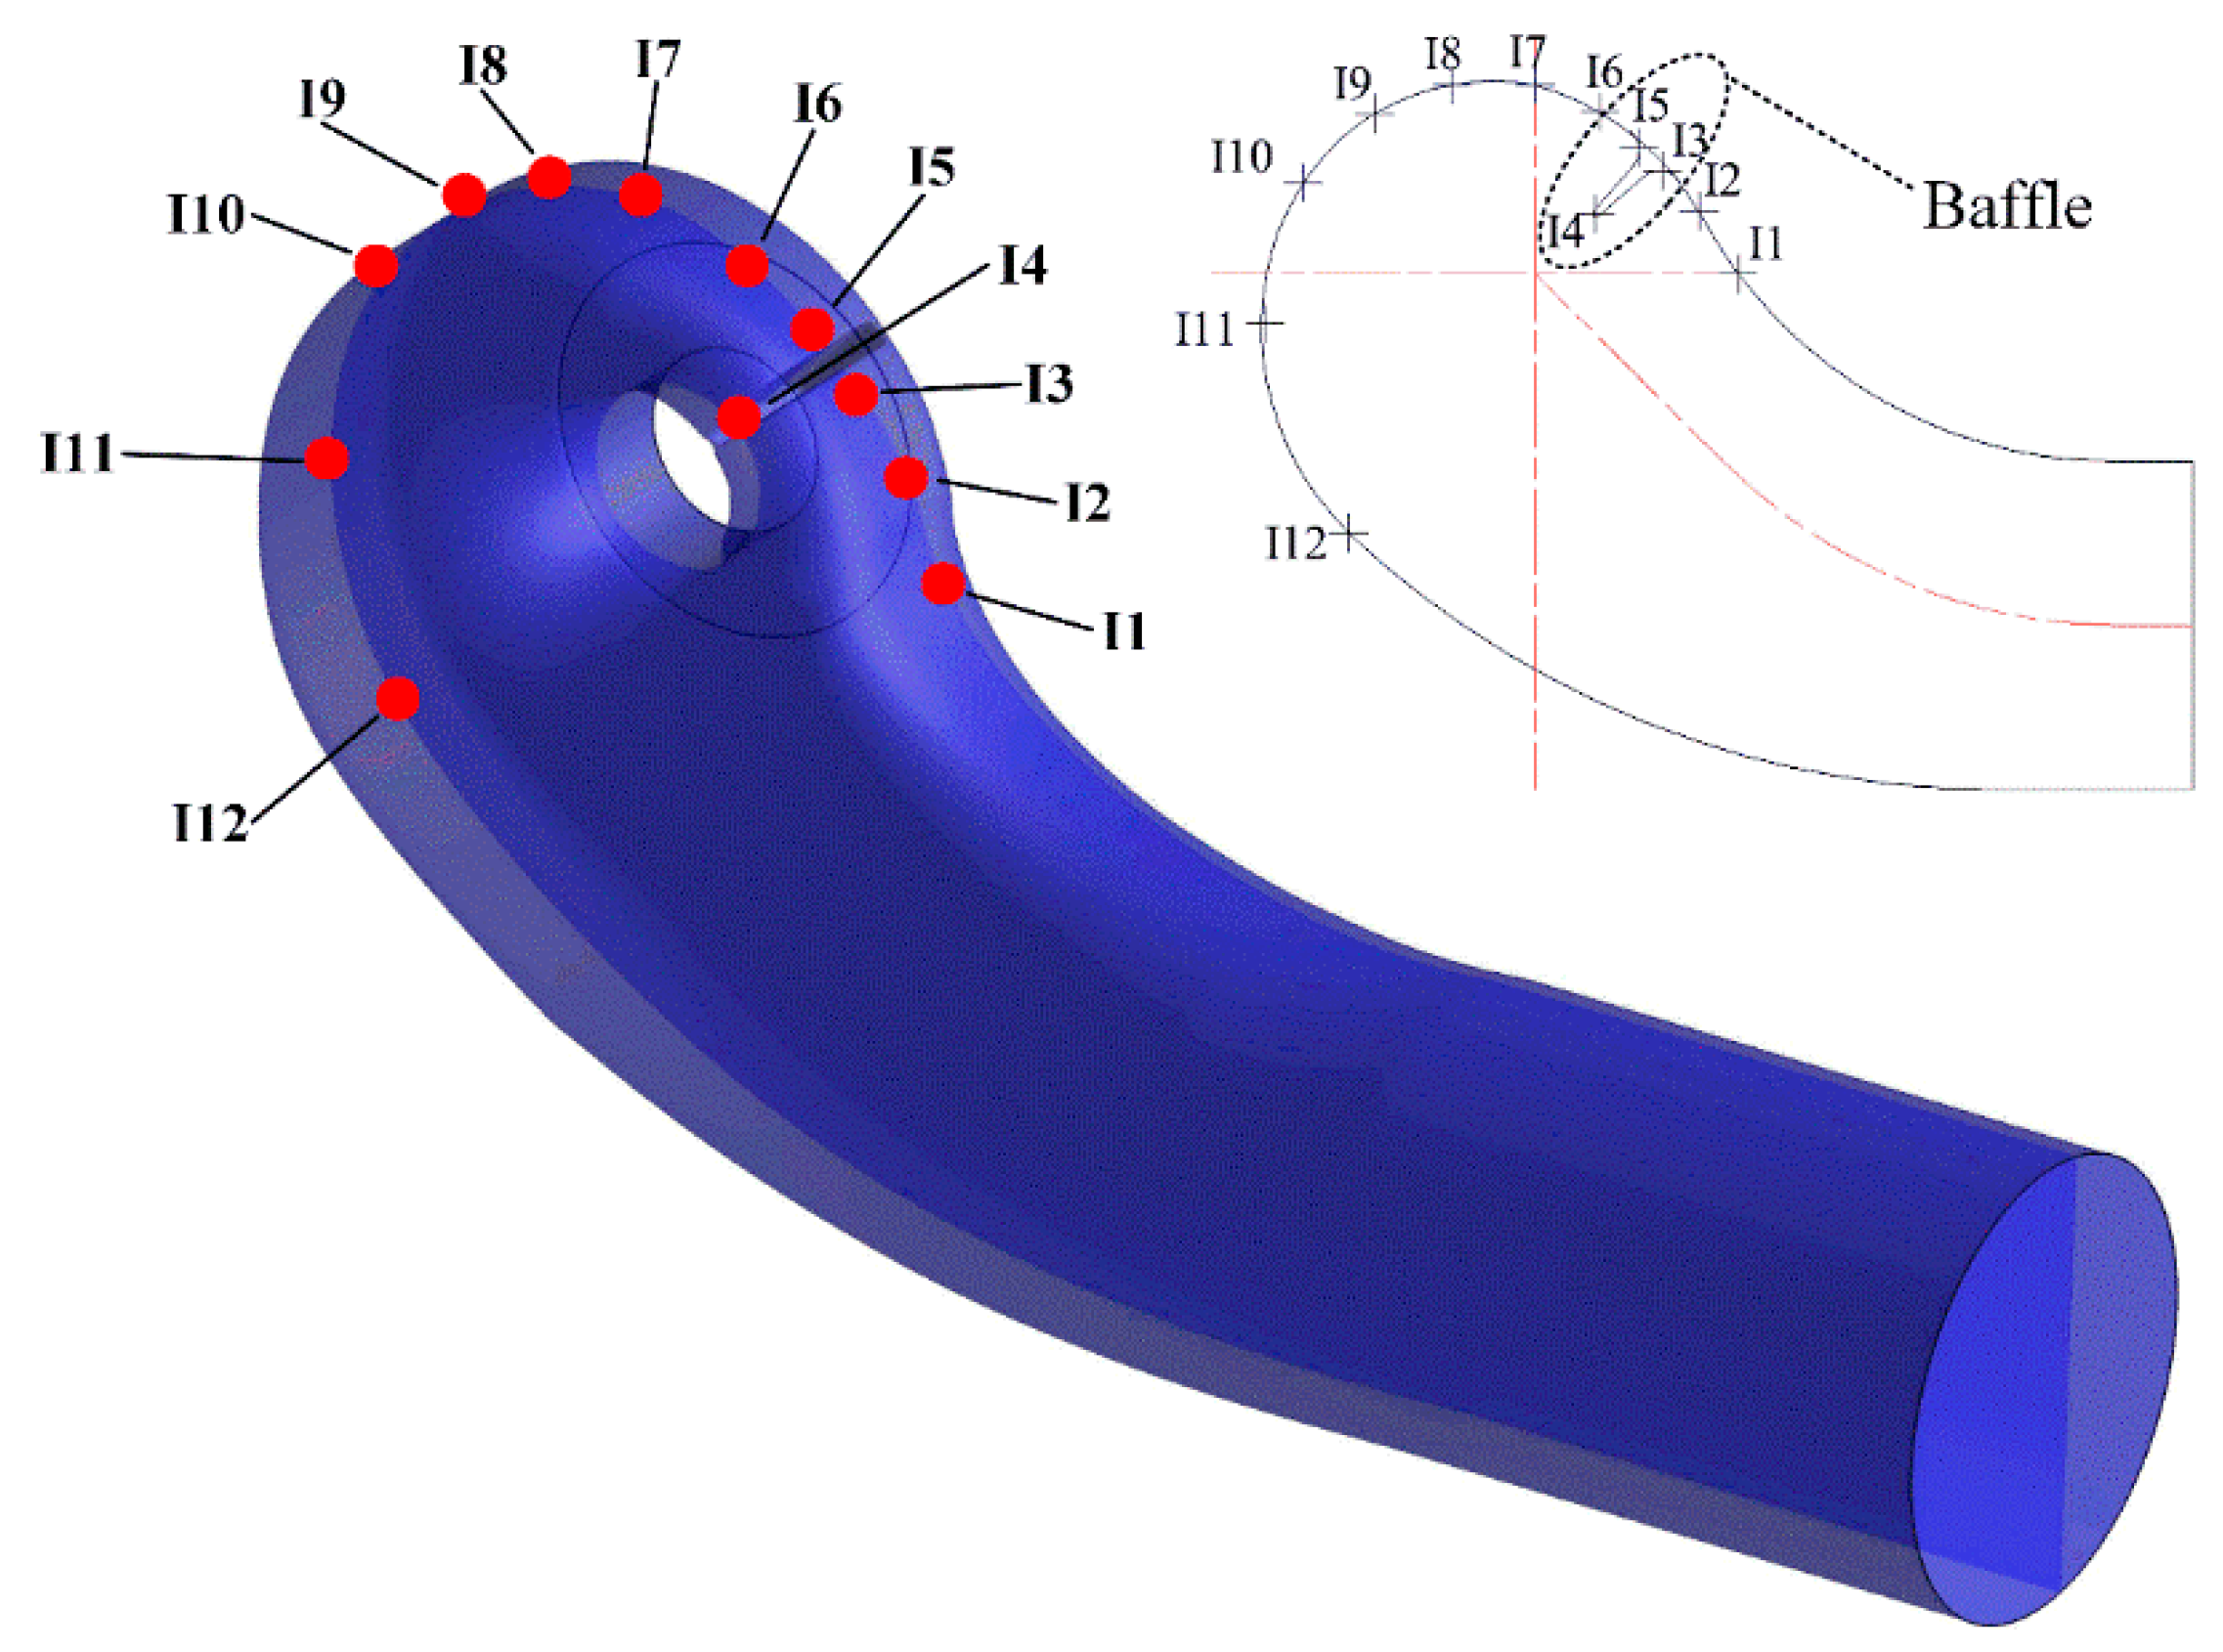
The monitor points at different positions of different components of the pump are shown in Figure 3, Figure 4, Figure 5 and Figure 6. Monitor Points I1–I12 were set at the middle section of the suction chamber (Figure 3). The points are numbered by order from upstream to downstream. Points I3–I5 were set around the baffle as shown in Figure 3.
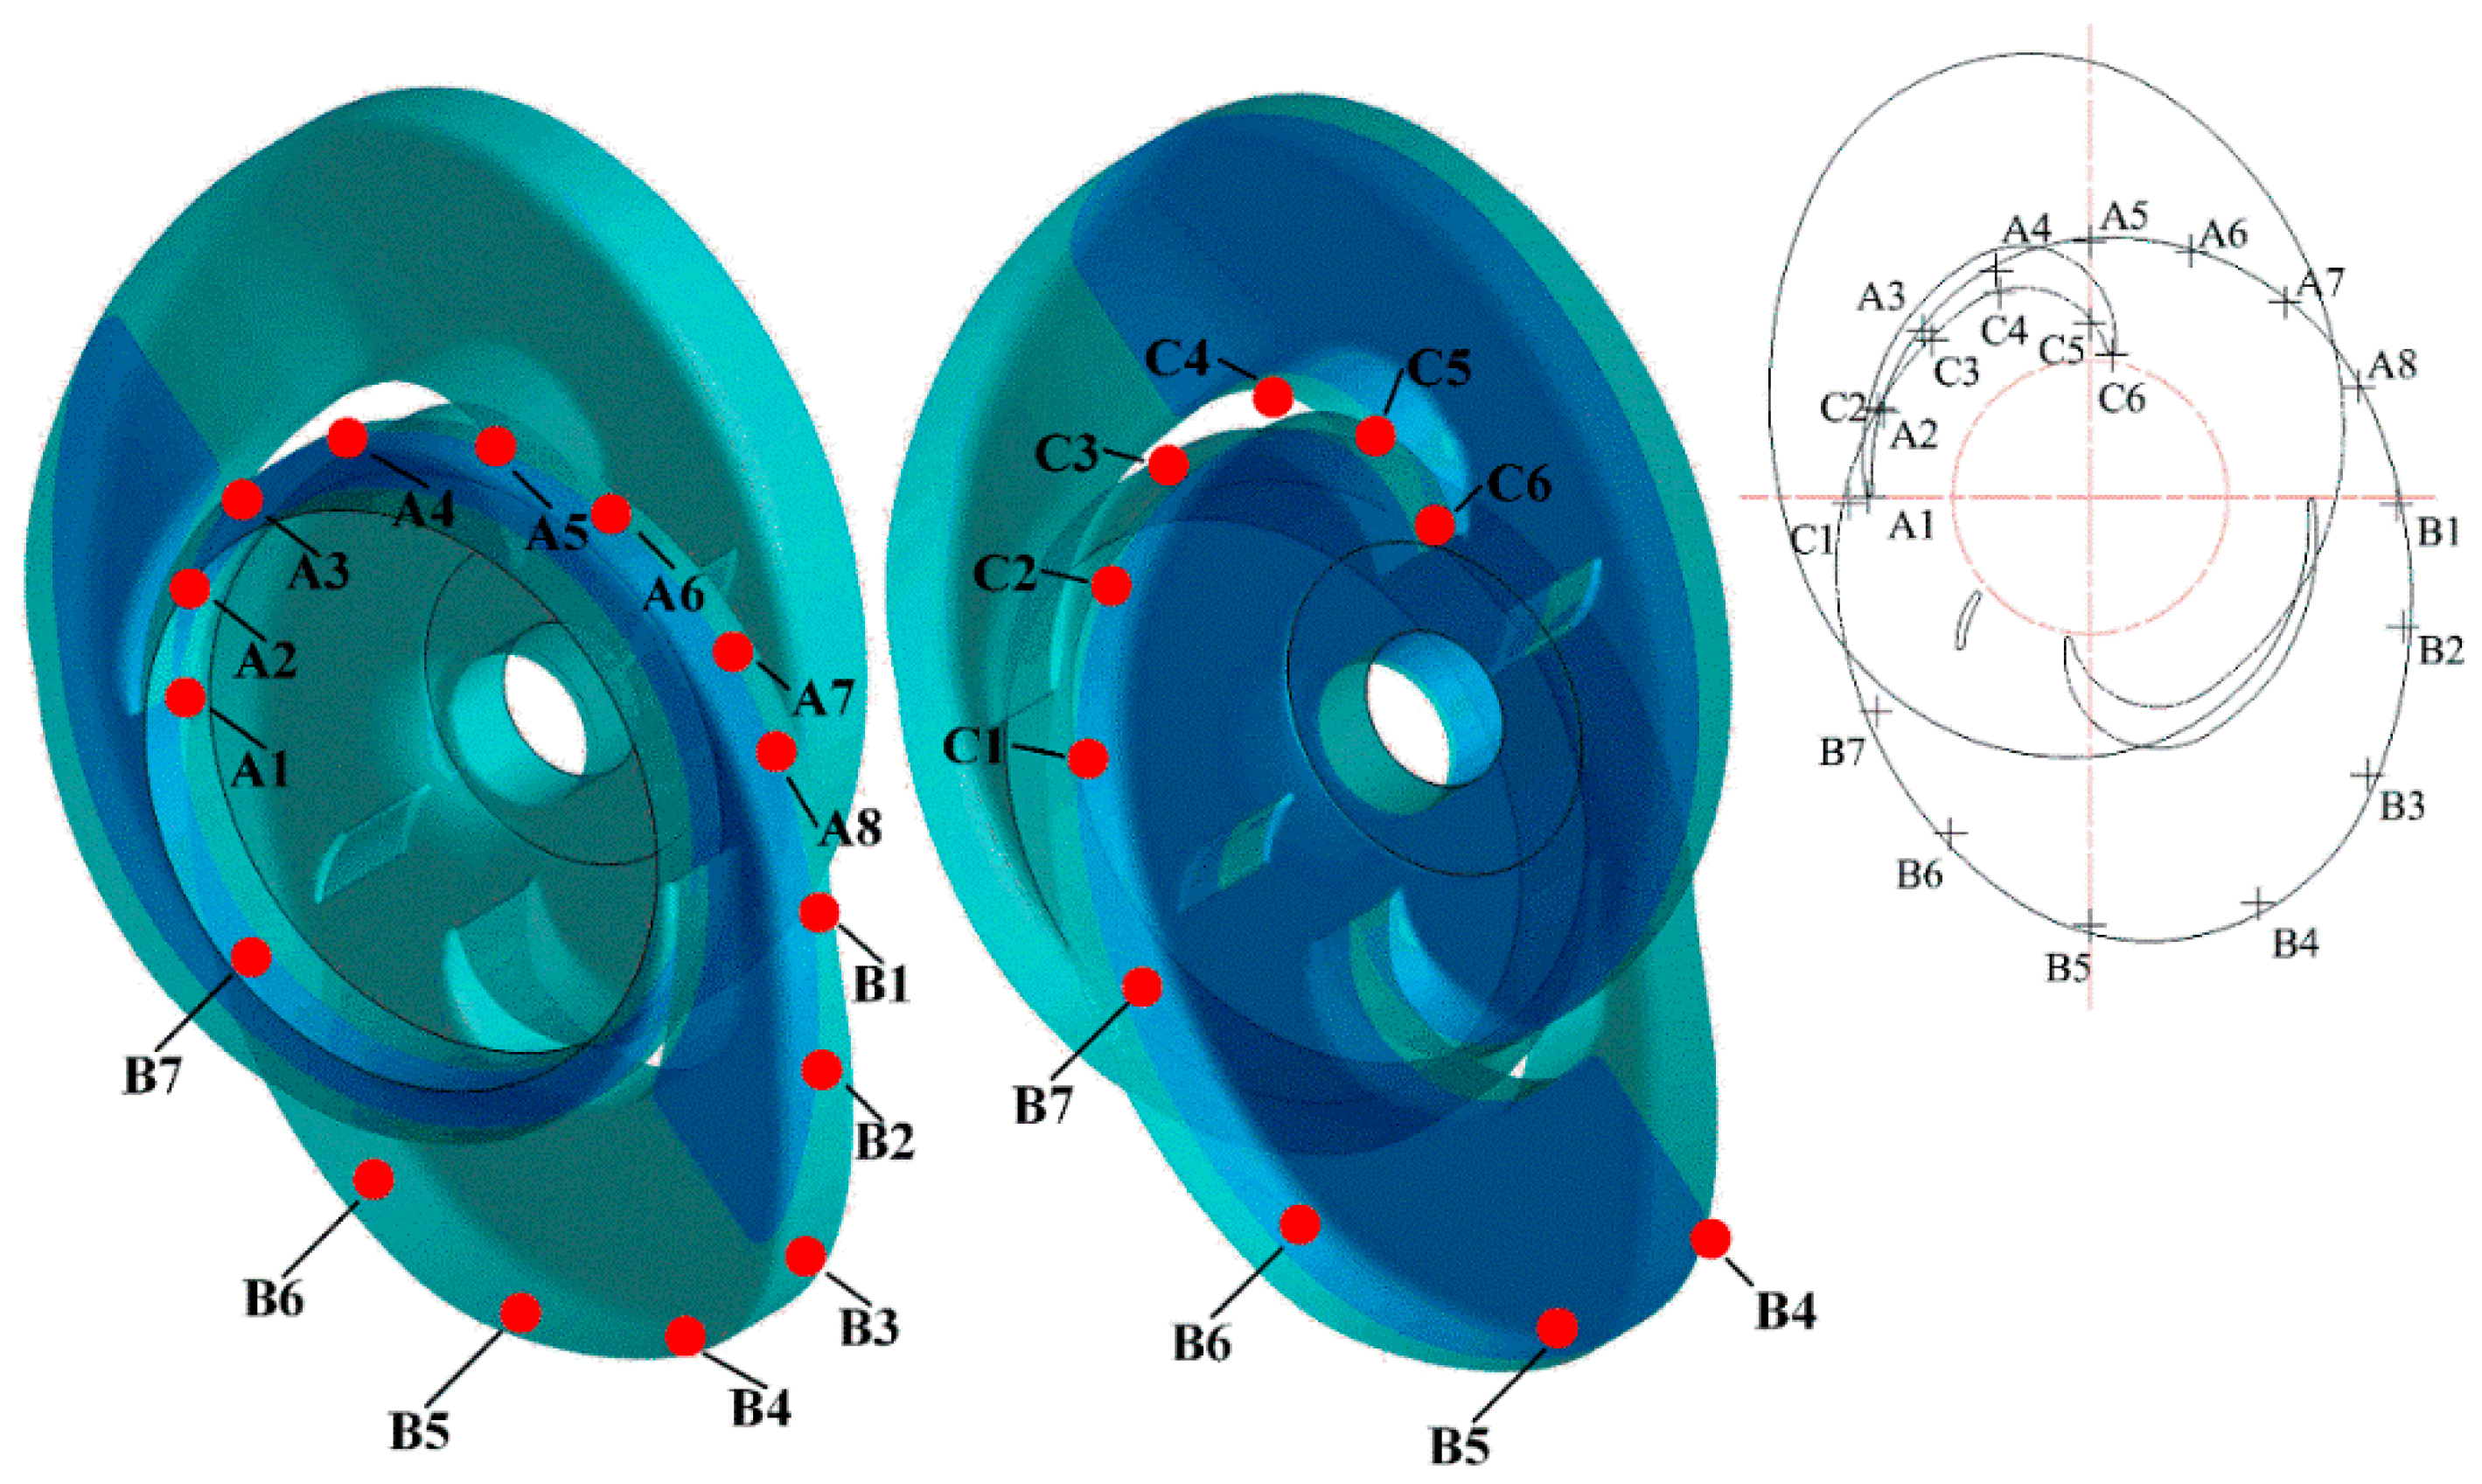
The structure of the inter-stage flow channel is complex with a 180° turnaround channel, as shown in Figure 4. The inter-stage flow channel is divided into three parts as the exit section, corner section, and confluence section. Points A1–A8 were set at the exit section. Monitor Points B1–B8 were set at the corner section. Monitor points C1–C6 were set at the confluence section. A1–C6 are continuously distributed from the upstream to the downstream.
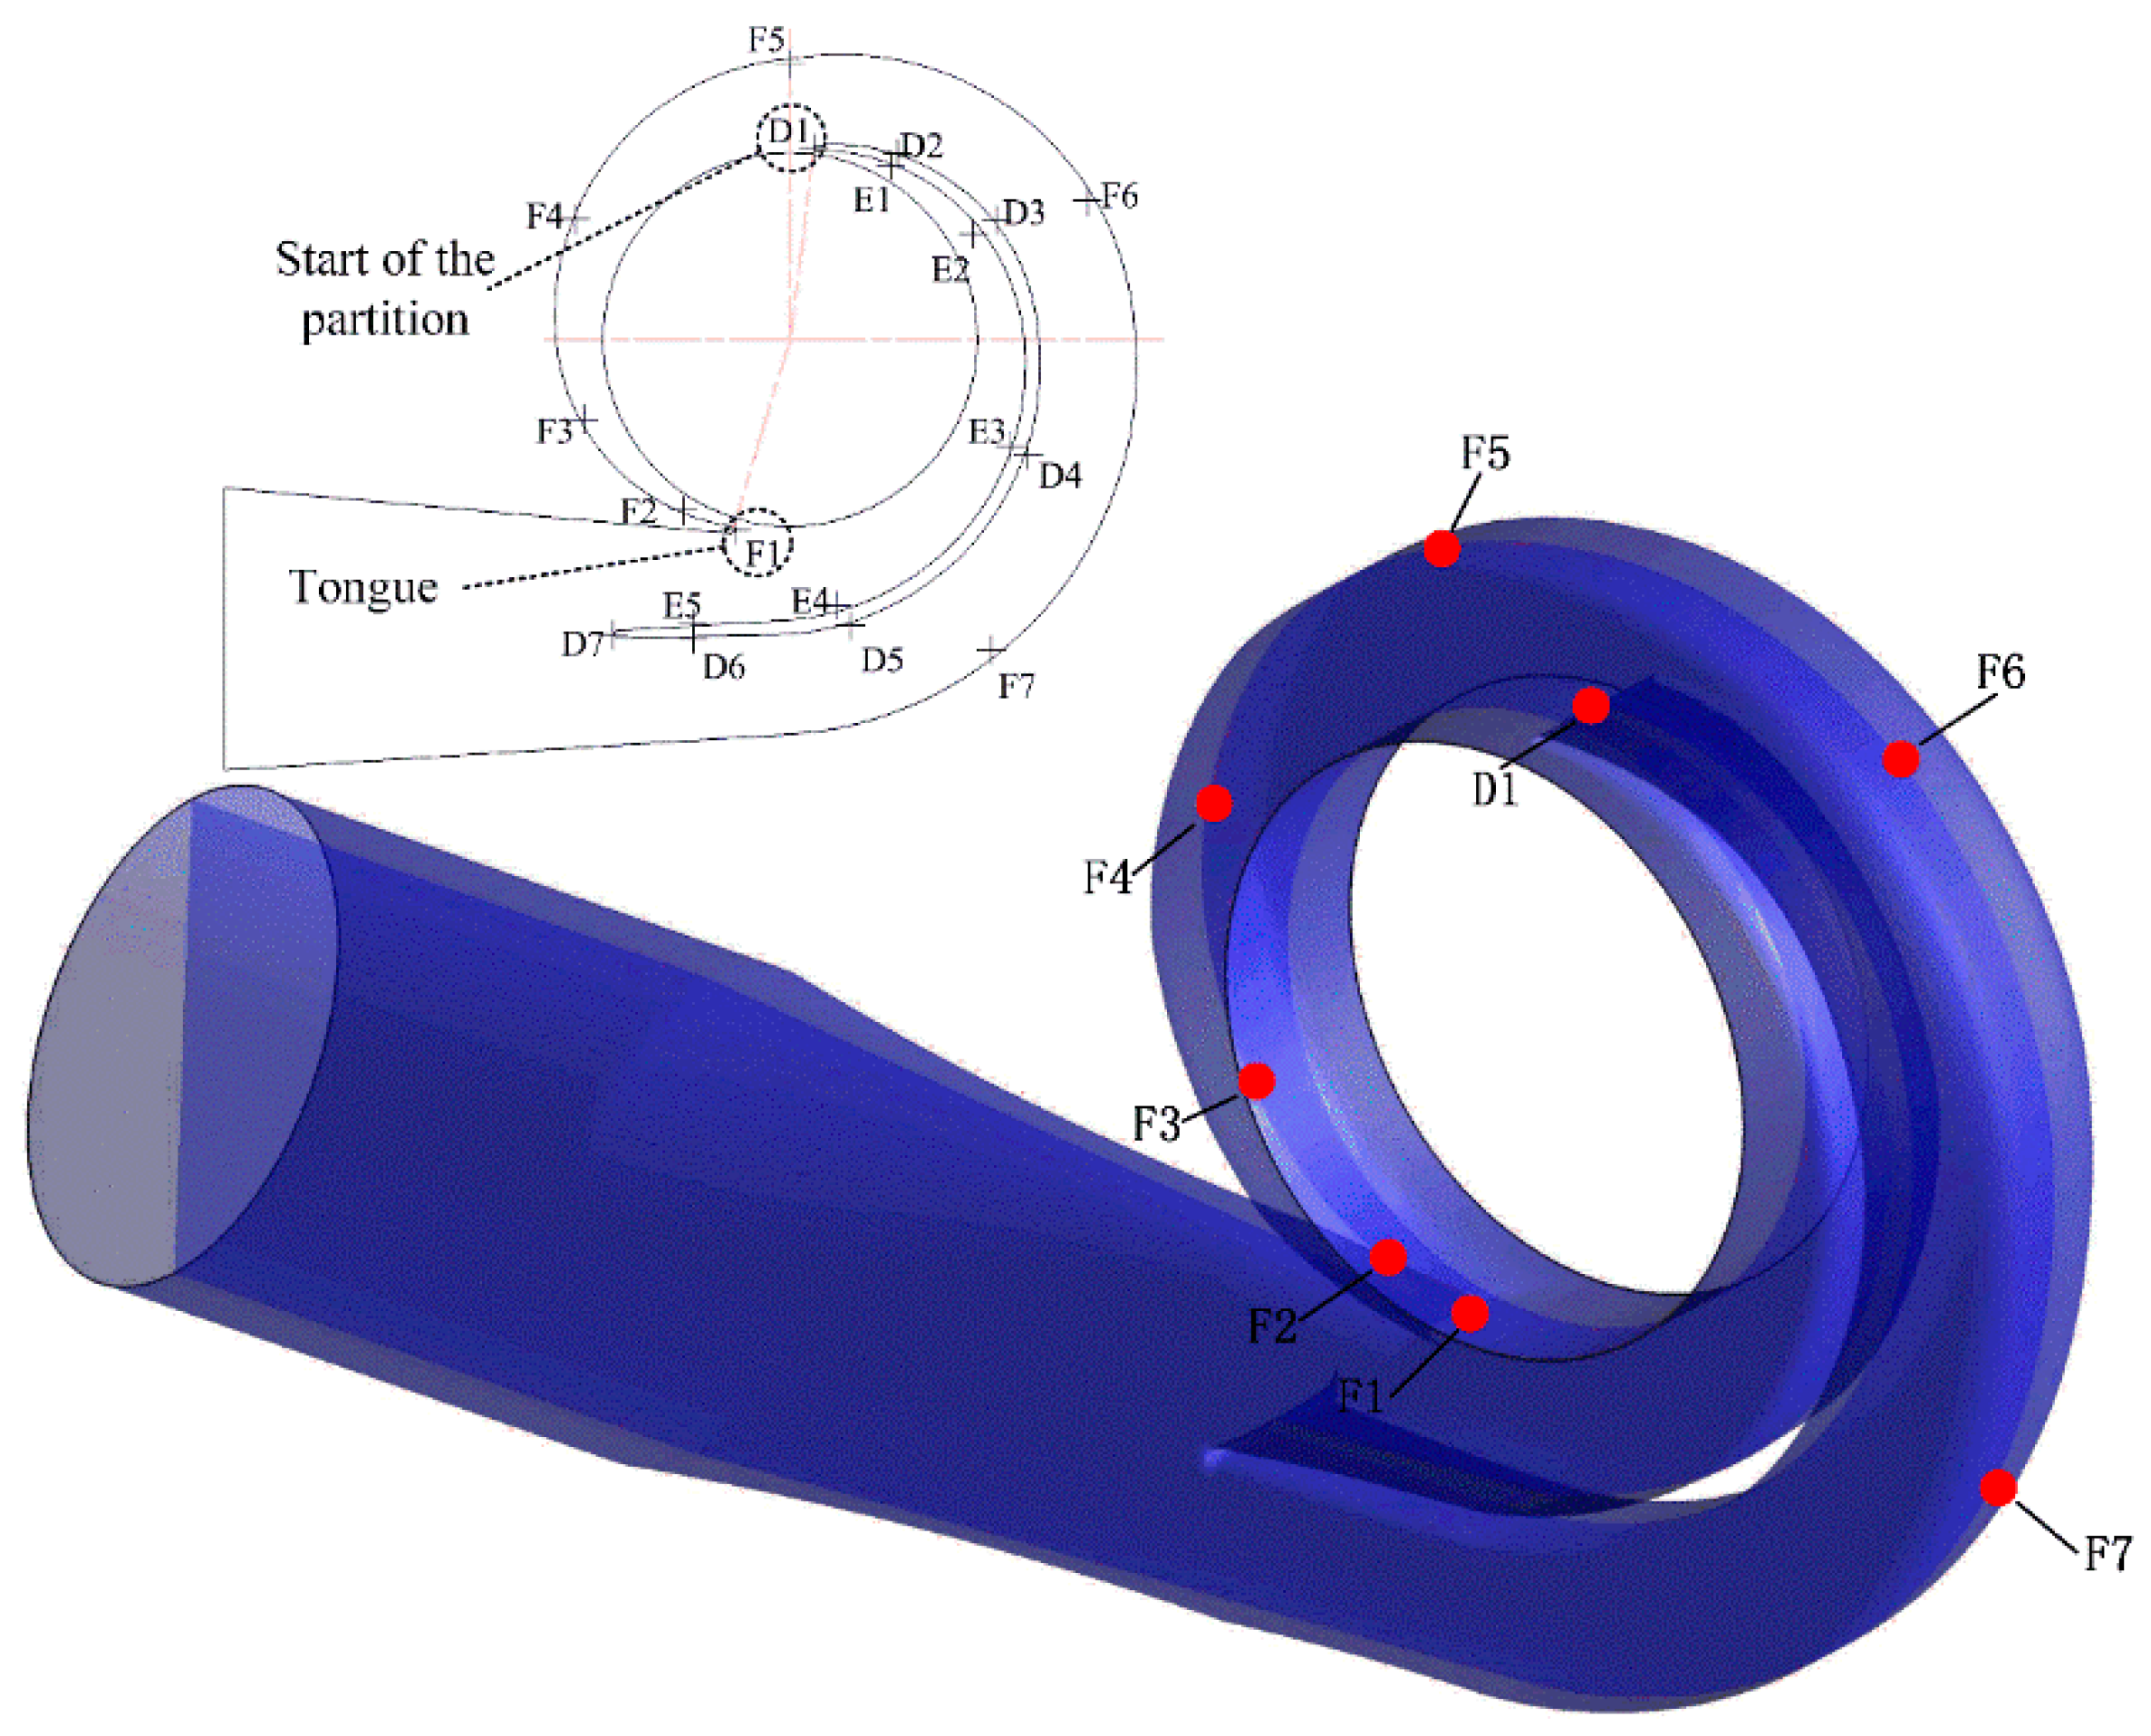
The double volute structure is used in the two-stage double-suction centrifugal pump. Monitor points were set along the flow direction within the flow channel. Point F1 is on the head of the volute tongue, and Point D1 is on the head of the partition, as shown in Figure 5.
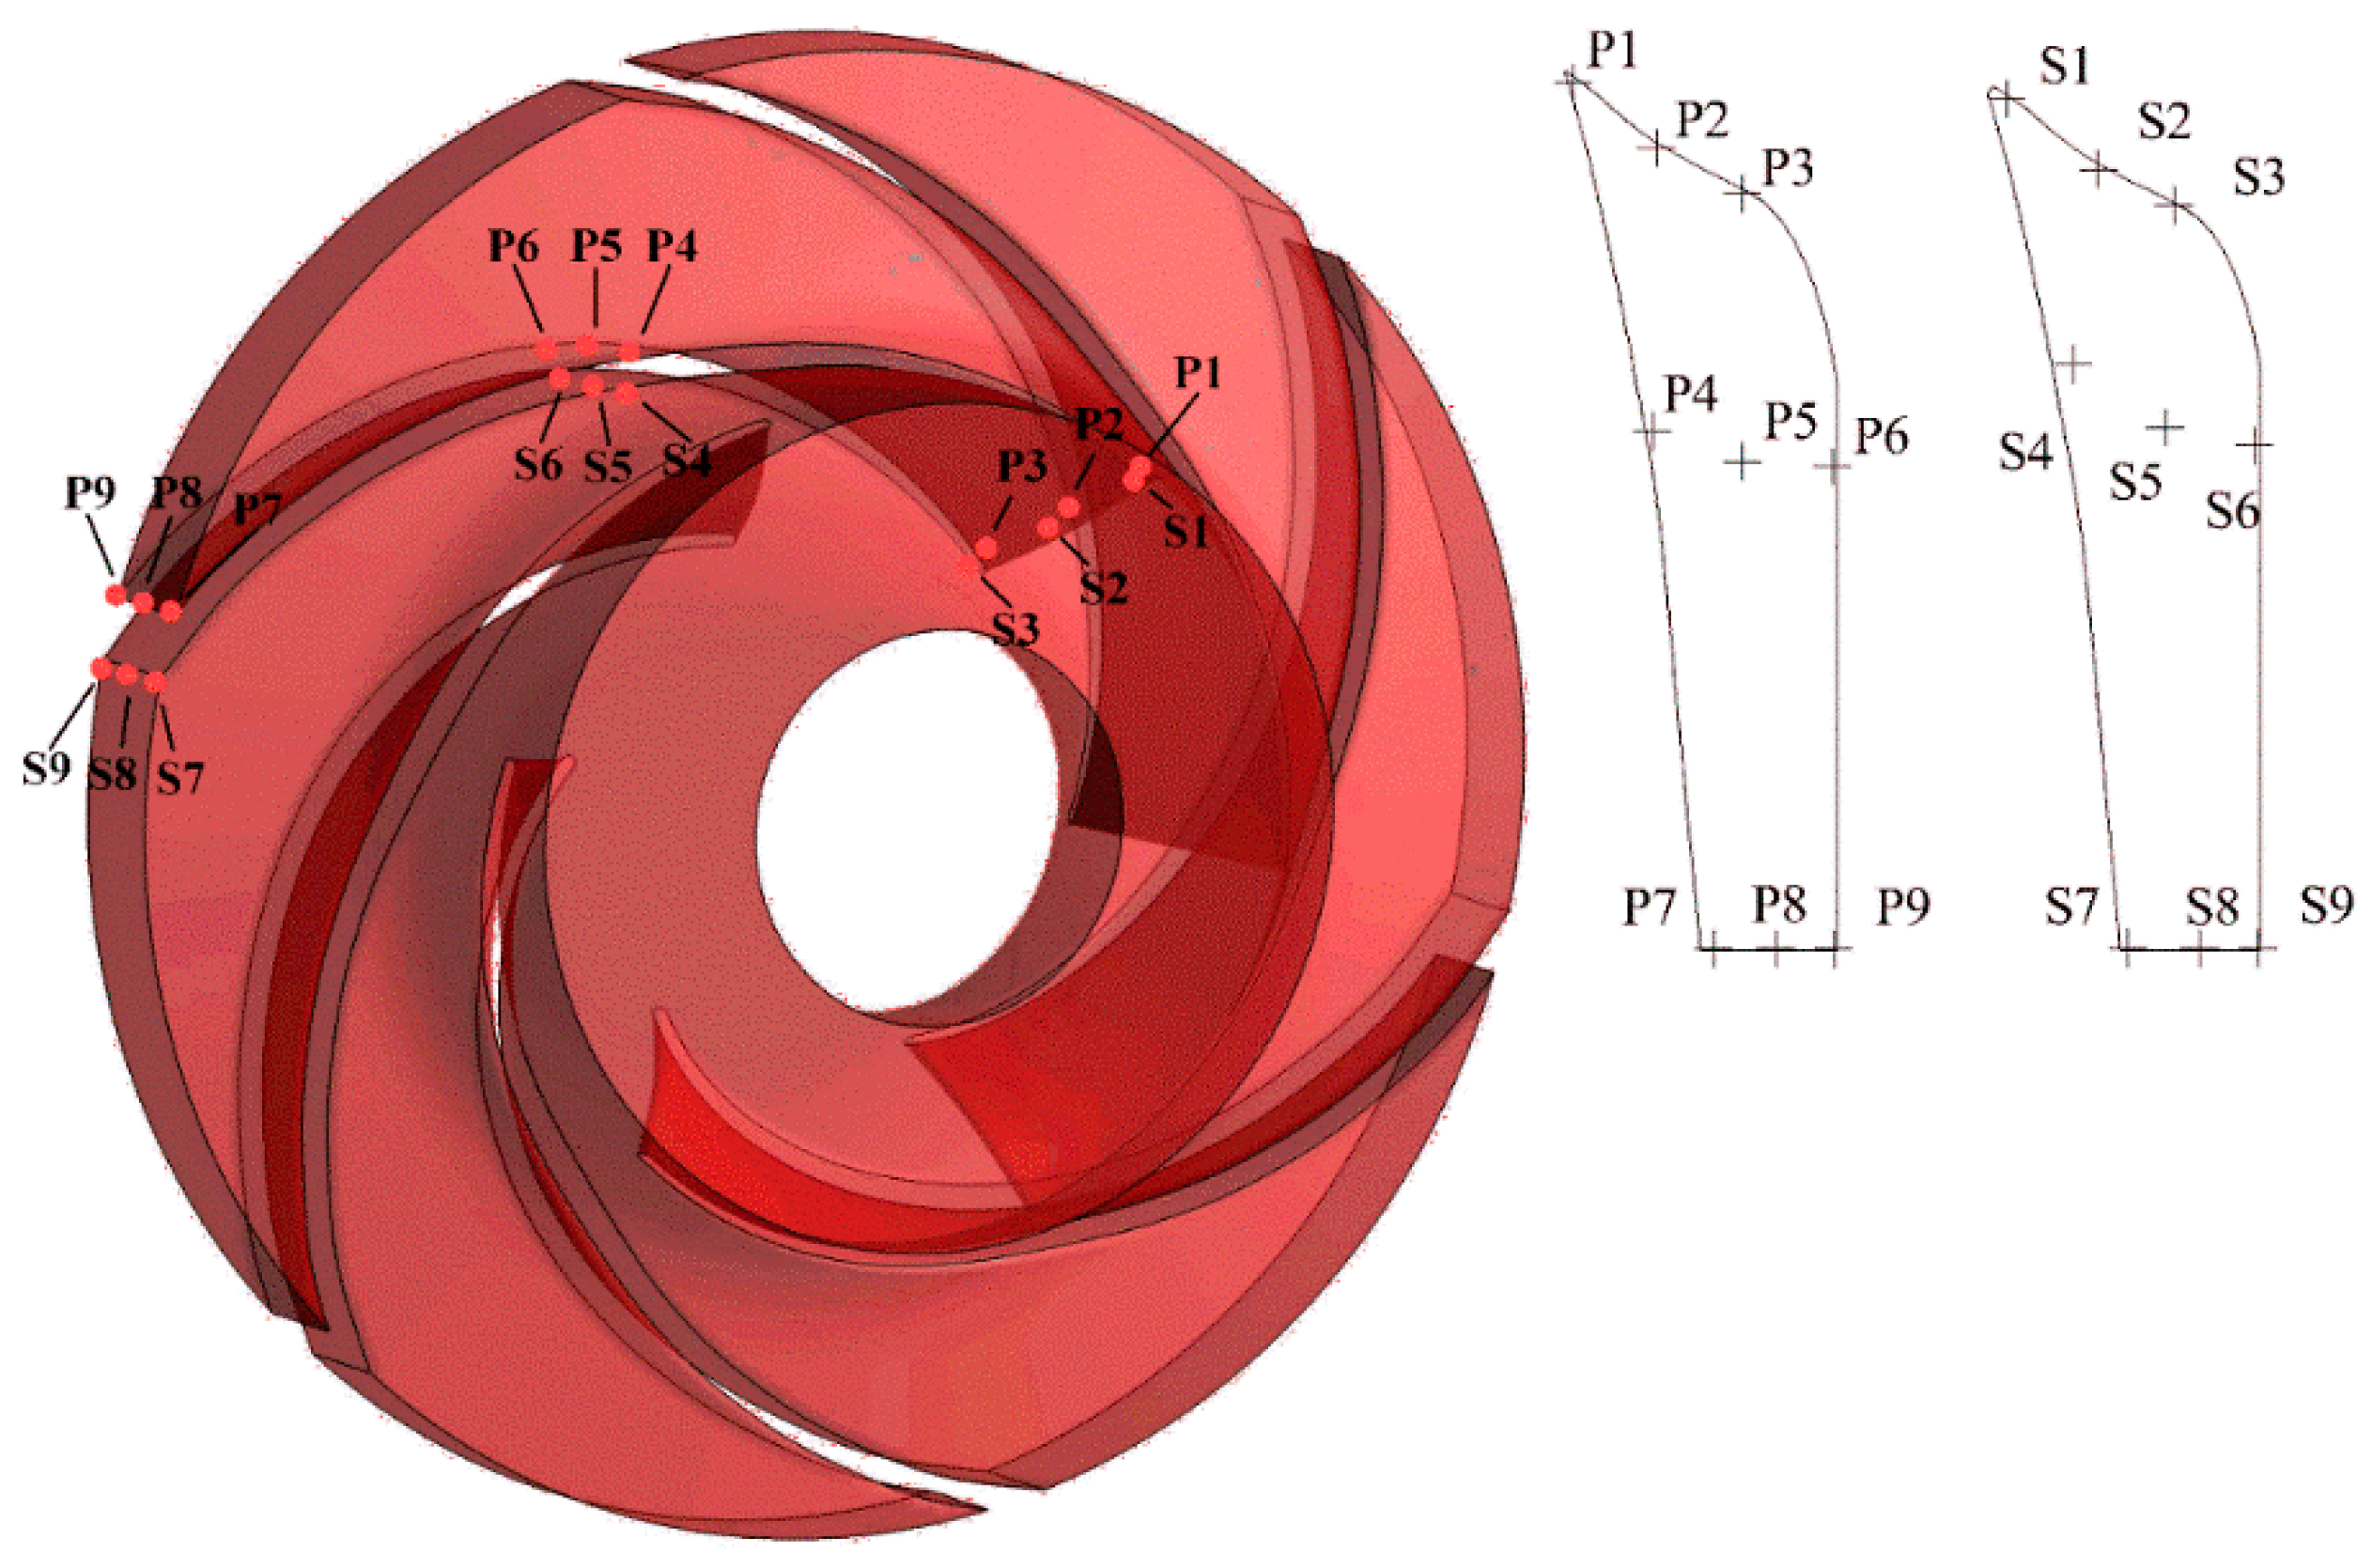
Monitor points were set at the leading edge, middle part, and the trailing edge of both the pressure side and suction side of the blade in the two impellers, as shown in Figure 6. At every position, there are three monitor points from the hub side to the shroud side. The monitor points on the pressure side of the first-stage impeller are from P11–P19. They are from P21–P29 for the second-stage impeller. The monitor points on the suction side of the first-stage impeller are from S11–S19. They are from S21–S29 for the second-stage impeller. All the monitor points are rotating with the impeller.
2.4. Grid Convergence and Time Step Analysis
2.4.1. Grid Convergence Analysis
Grid generation has a significant influence on the simulation accuracy [20]. The simplest way to estimate the error is to generate a series of grids with different sizes and see whether the flow parameters vary in an acceptable range. However, this method has no theoretical basis, but great randomness. A more reasonable way such as the Richardson Extrapolation (RE) method [21] recommended by Journal of Fluids Engineering is required to provide reference for grid generation by evaluating the grid uncertainty.
The basic idea of RE is to establish a proportional relationship between the approximation error and the exact solution, and usually, three sets of grids are used to calculate an extrapolated value when the grid spacing tends to infinity [22]. Although the pros and cons of the traditional RE method have been widely investigated, including the oscillatory convergence, it is still one of the most reliable methods to estimate the grid uncertainty of the numerical simulation at present. A fine Grid Convergence Index (GCI) proposed by Roache [23] for grid uncertainty evaluation was used in the present work. Here, grids were generated by three different grid sizes. The grid size, h, is given by:
where ∆Vi is the cell volume and N is the total number of the cells in the grid generation. Three sets of grids with 9.5 × 10⁵, 2.1 × 10⁶, and 4.8 × 10⁶ elements were generated to ensure that the grid refinement factor was greater than 1.3. The velocity of 100 points in the middle section of the volute was chosen as a key variable for the grid convergence analysis. Fixed-point iteration was used to calculate the apparent order, p. The expression is shown below,
where ε32 = ϕ3 − ϕ2, ε21 = ϕ2 − ϕ1, ϕk denotes the solution on the kth grid.
According to the three solutions and the apparent order, the extrapolated value can be calculated as follows,
The fine-grid convergence index is defined as,
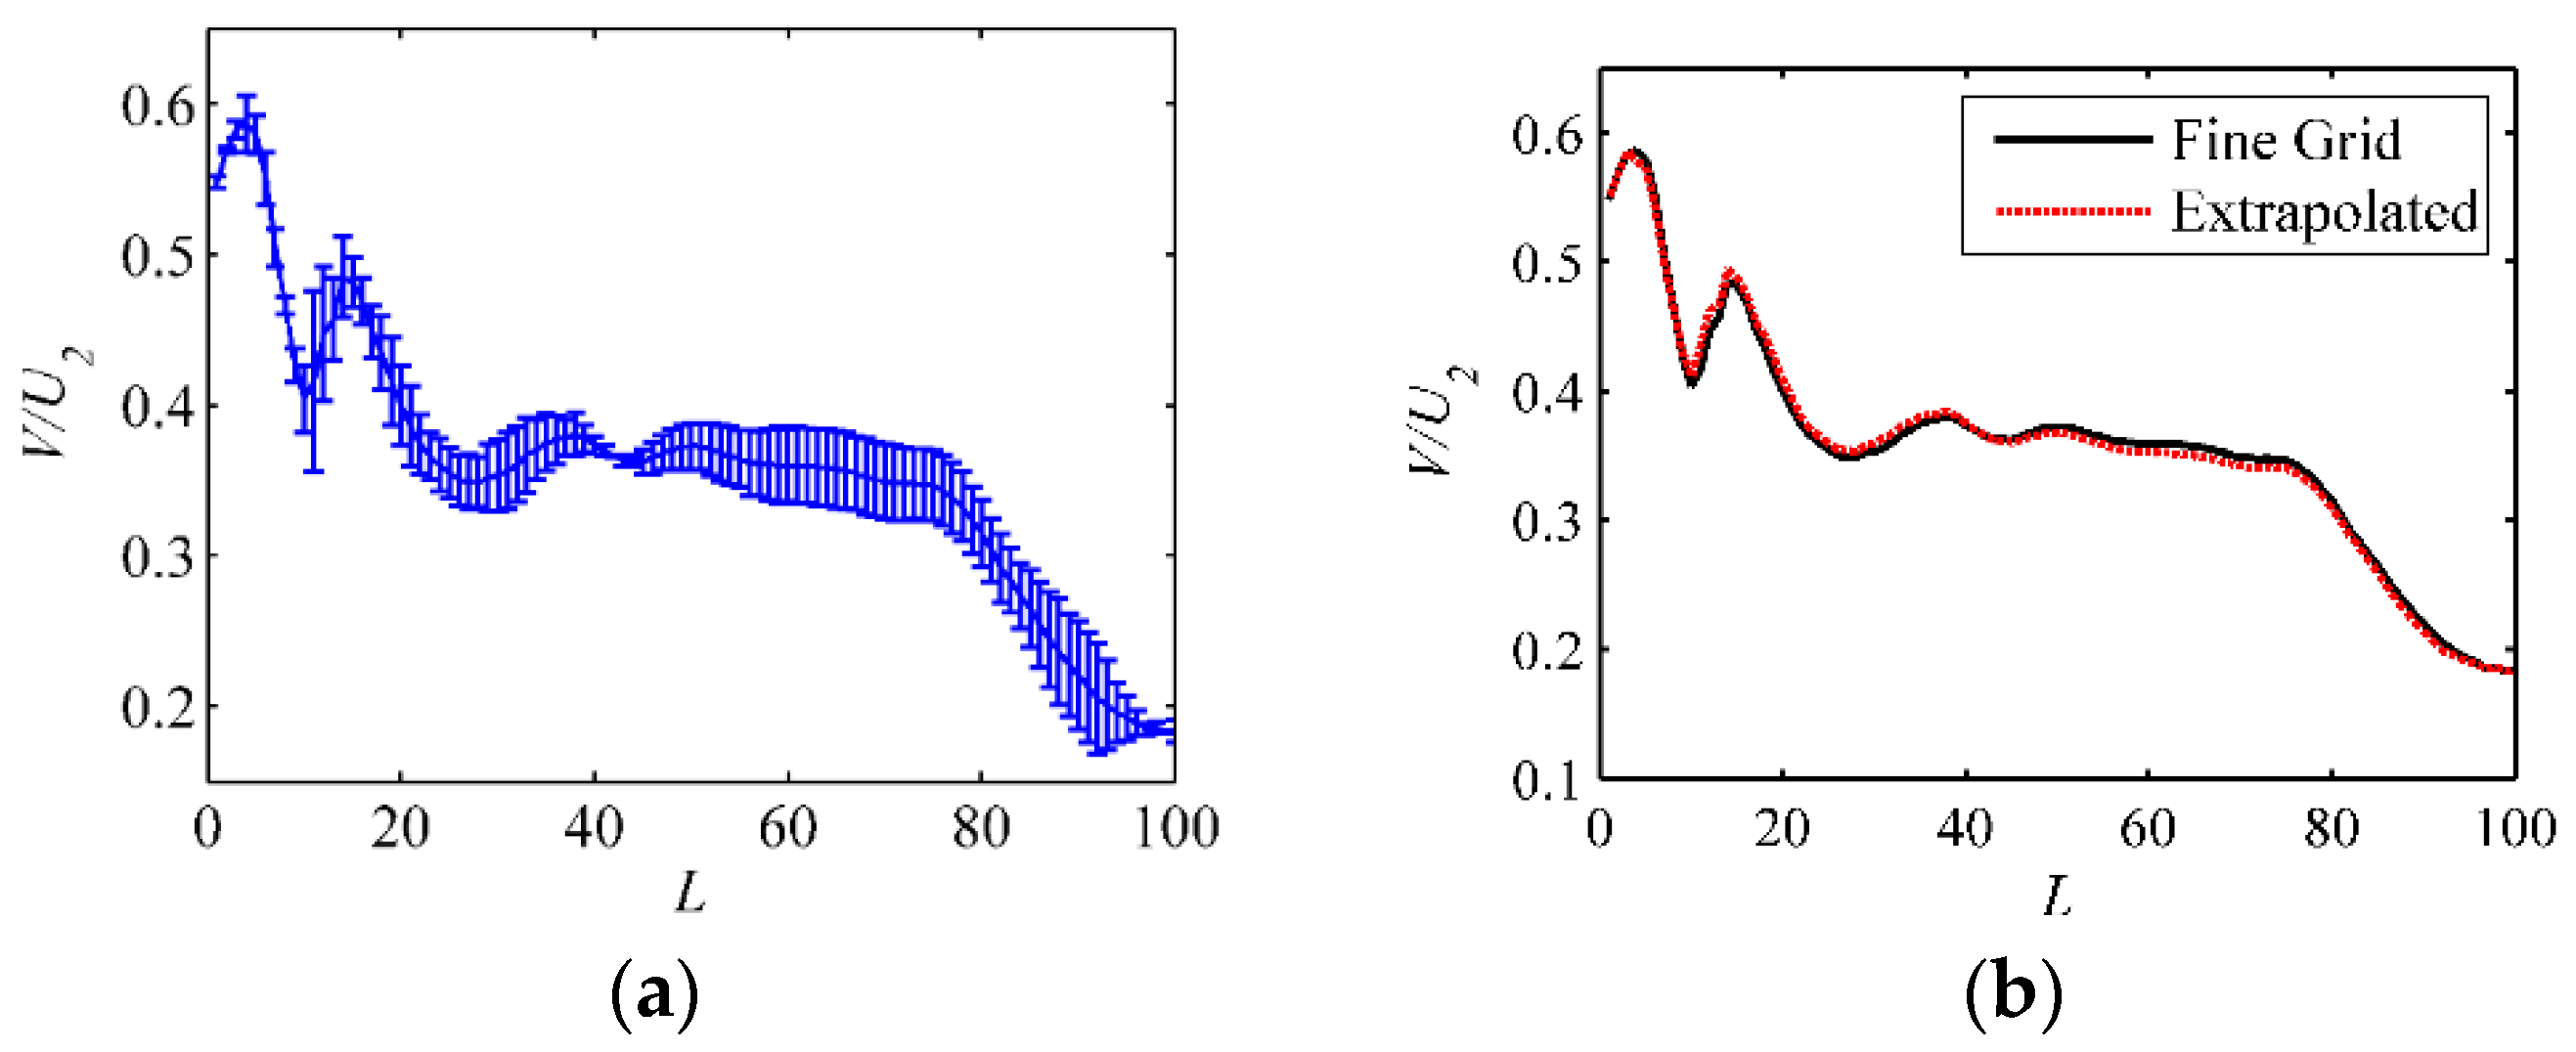
The fine grid convergence index and the extrapolated value of the present simulation results are shown in Figure 7.
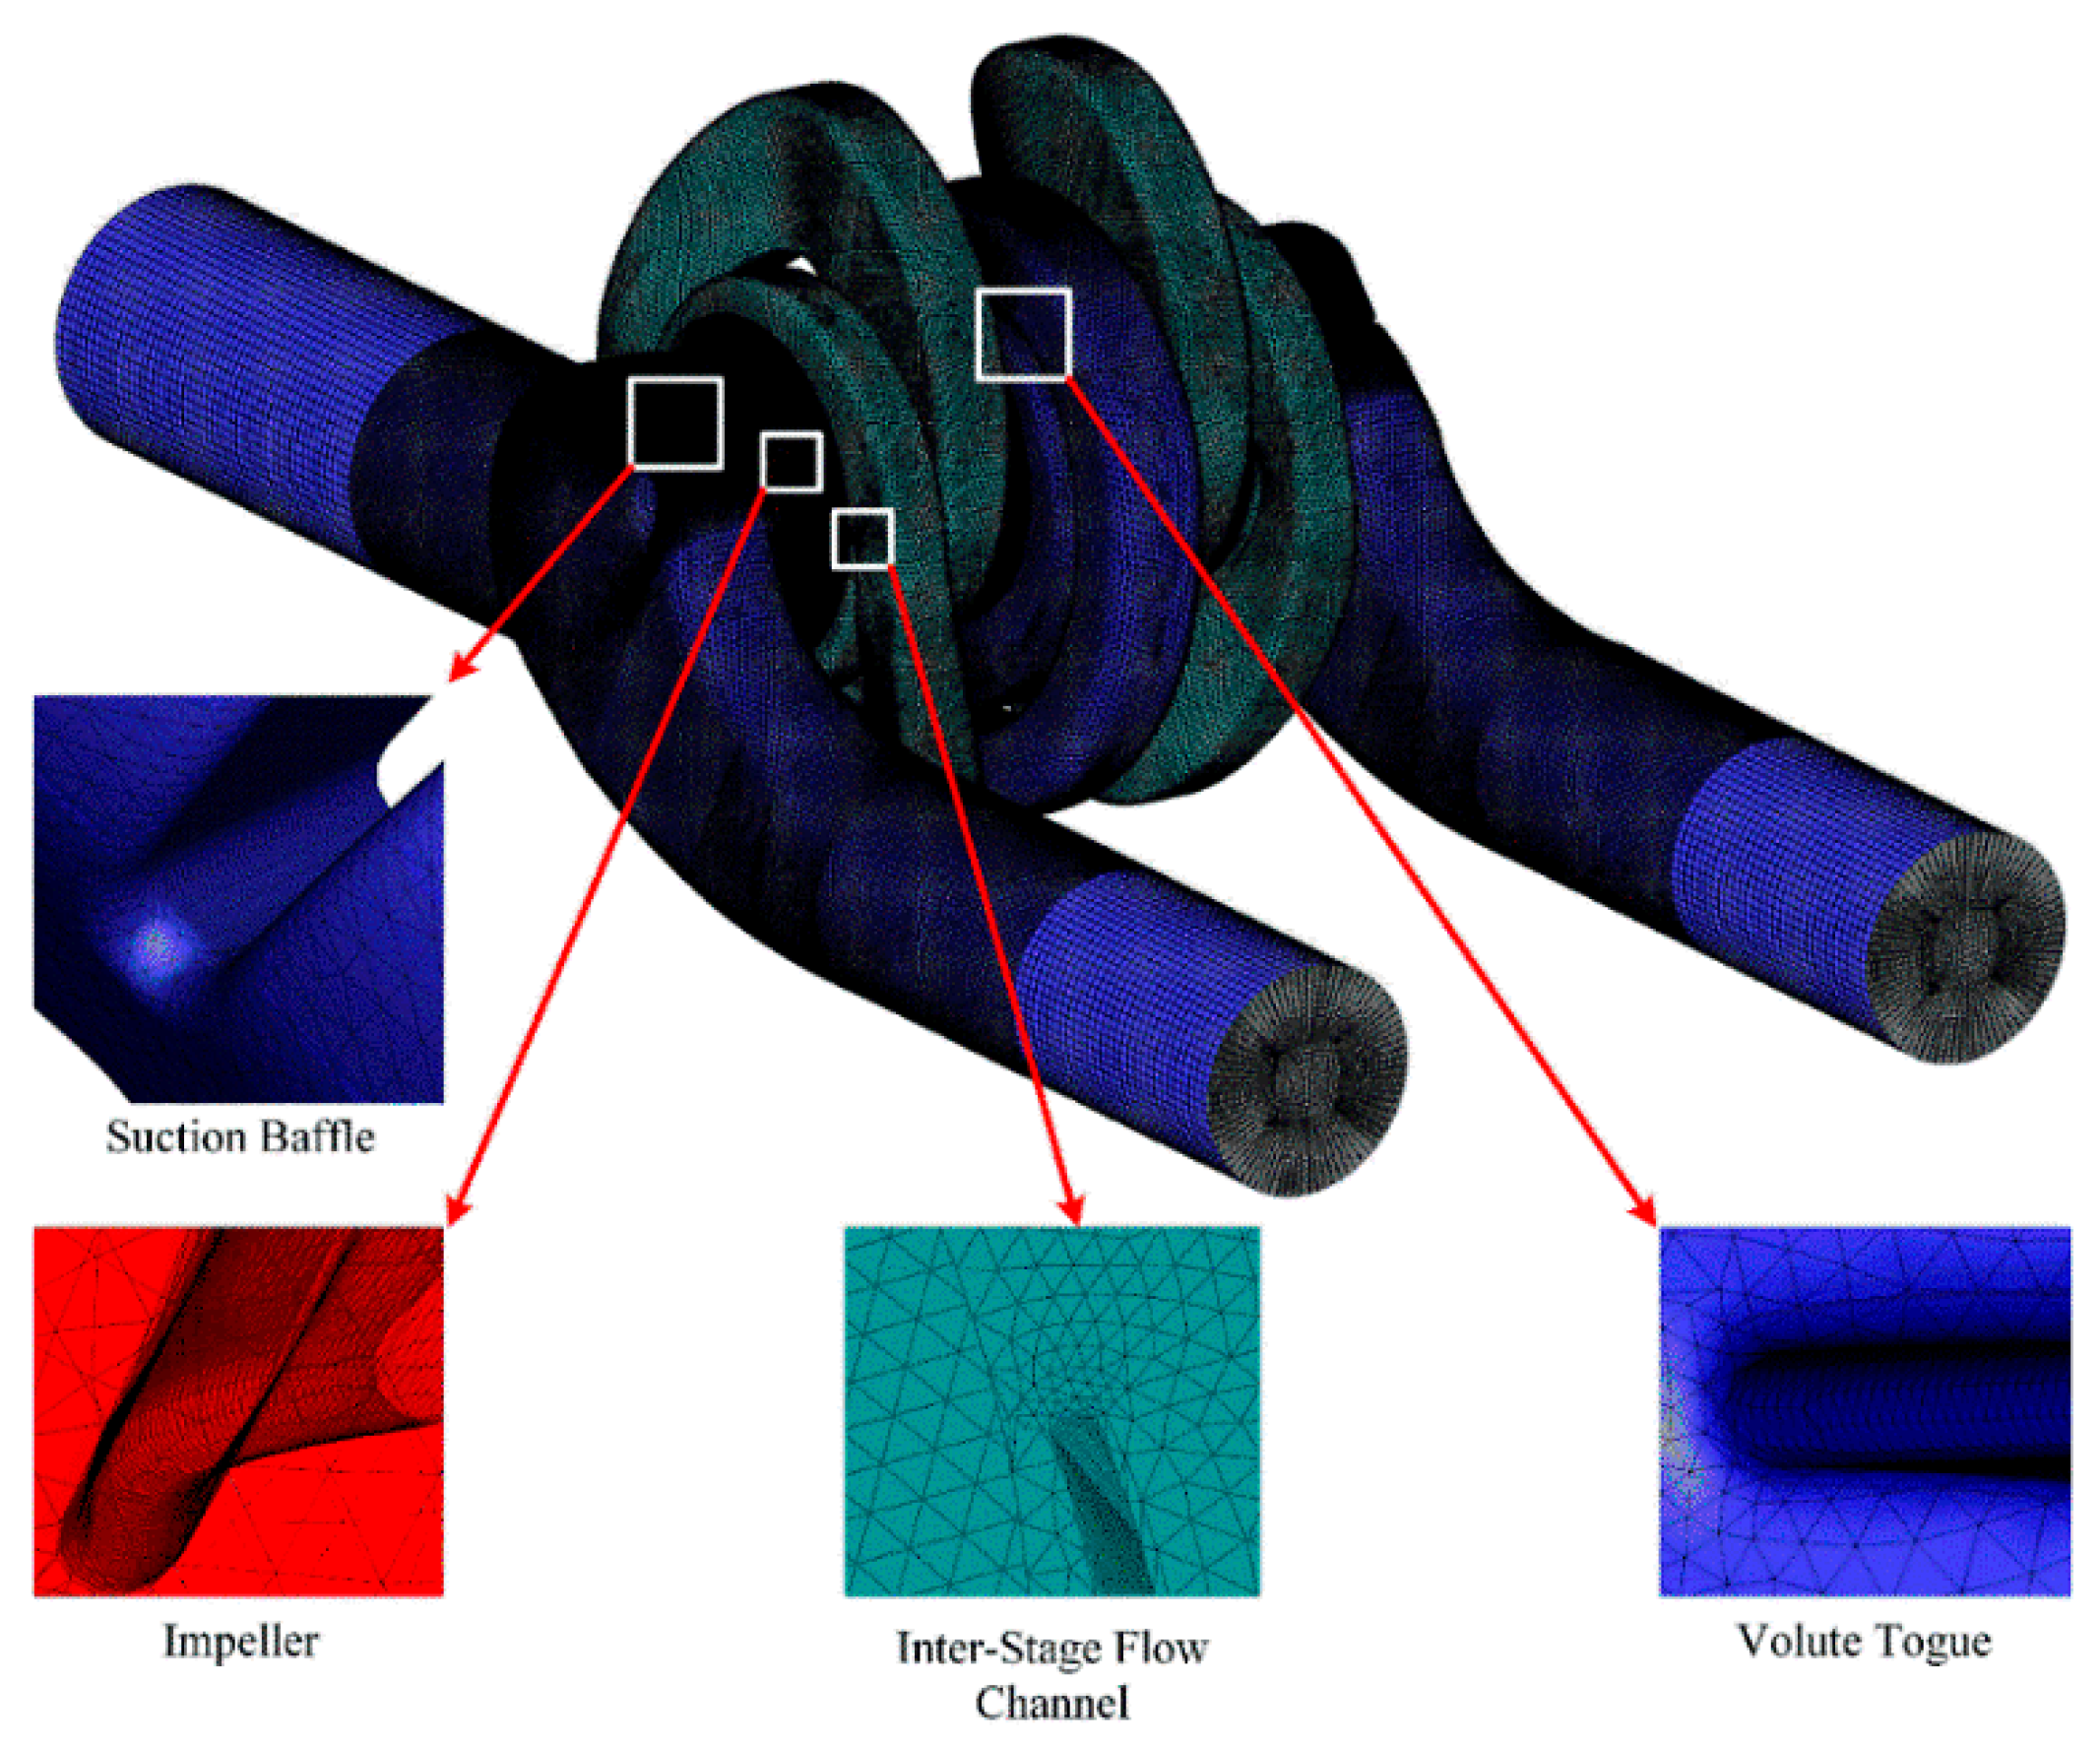
The value of the fine grid convergence index (with 4.8 × 10⁶ elements) is small as shown in Figure 7a. The maximum discretization uncertainty is 6.1%, which is lower than the 10% recommended [20]. Figure 7b shows that the extrapolated value is close to that of the fine grid solution. The whole apparent order, p, is between 0.019 and 19.48 with an average value of 4.03. Both the GCI and the apparent order satisfy the requirement of grid convergence analysis. Therefore, a grid with 4.8 × 10⁶ elements was used in the following study. Figure 8 shows the final grid resolution.
The y plus of the different component of the pump with the final grid is shown in Table 1. It can be seen that the maximum value of the y plus in the pump is less than 300, which satisfies the minimum requirement of the wall function used in the simulation.
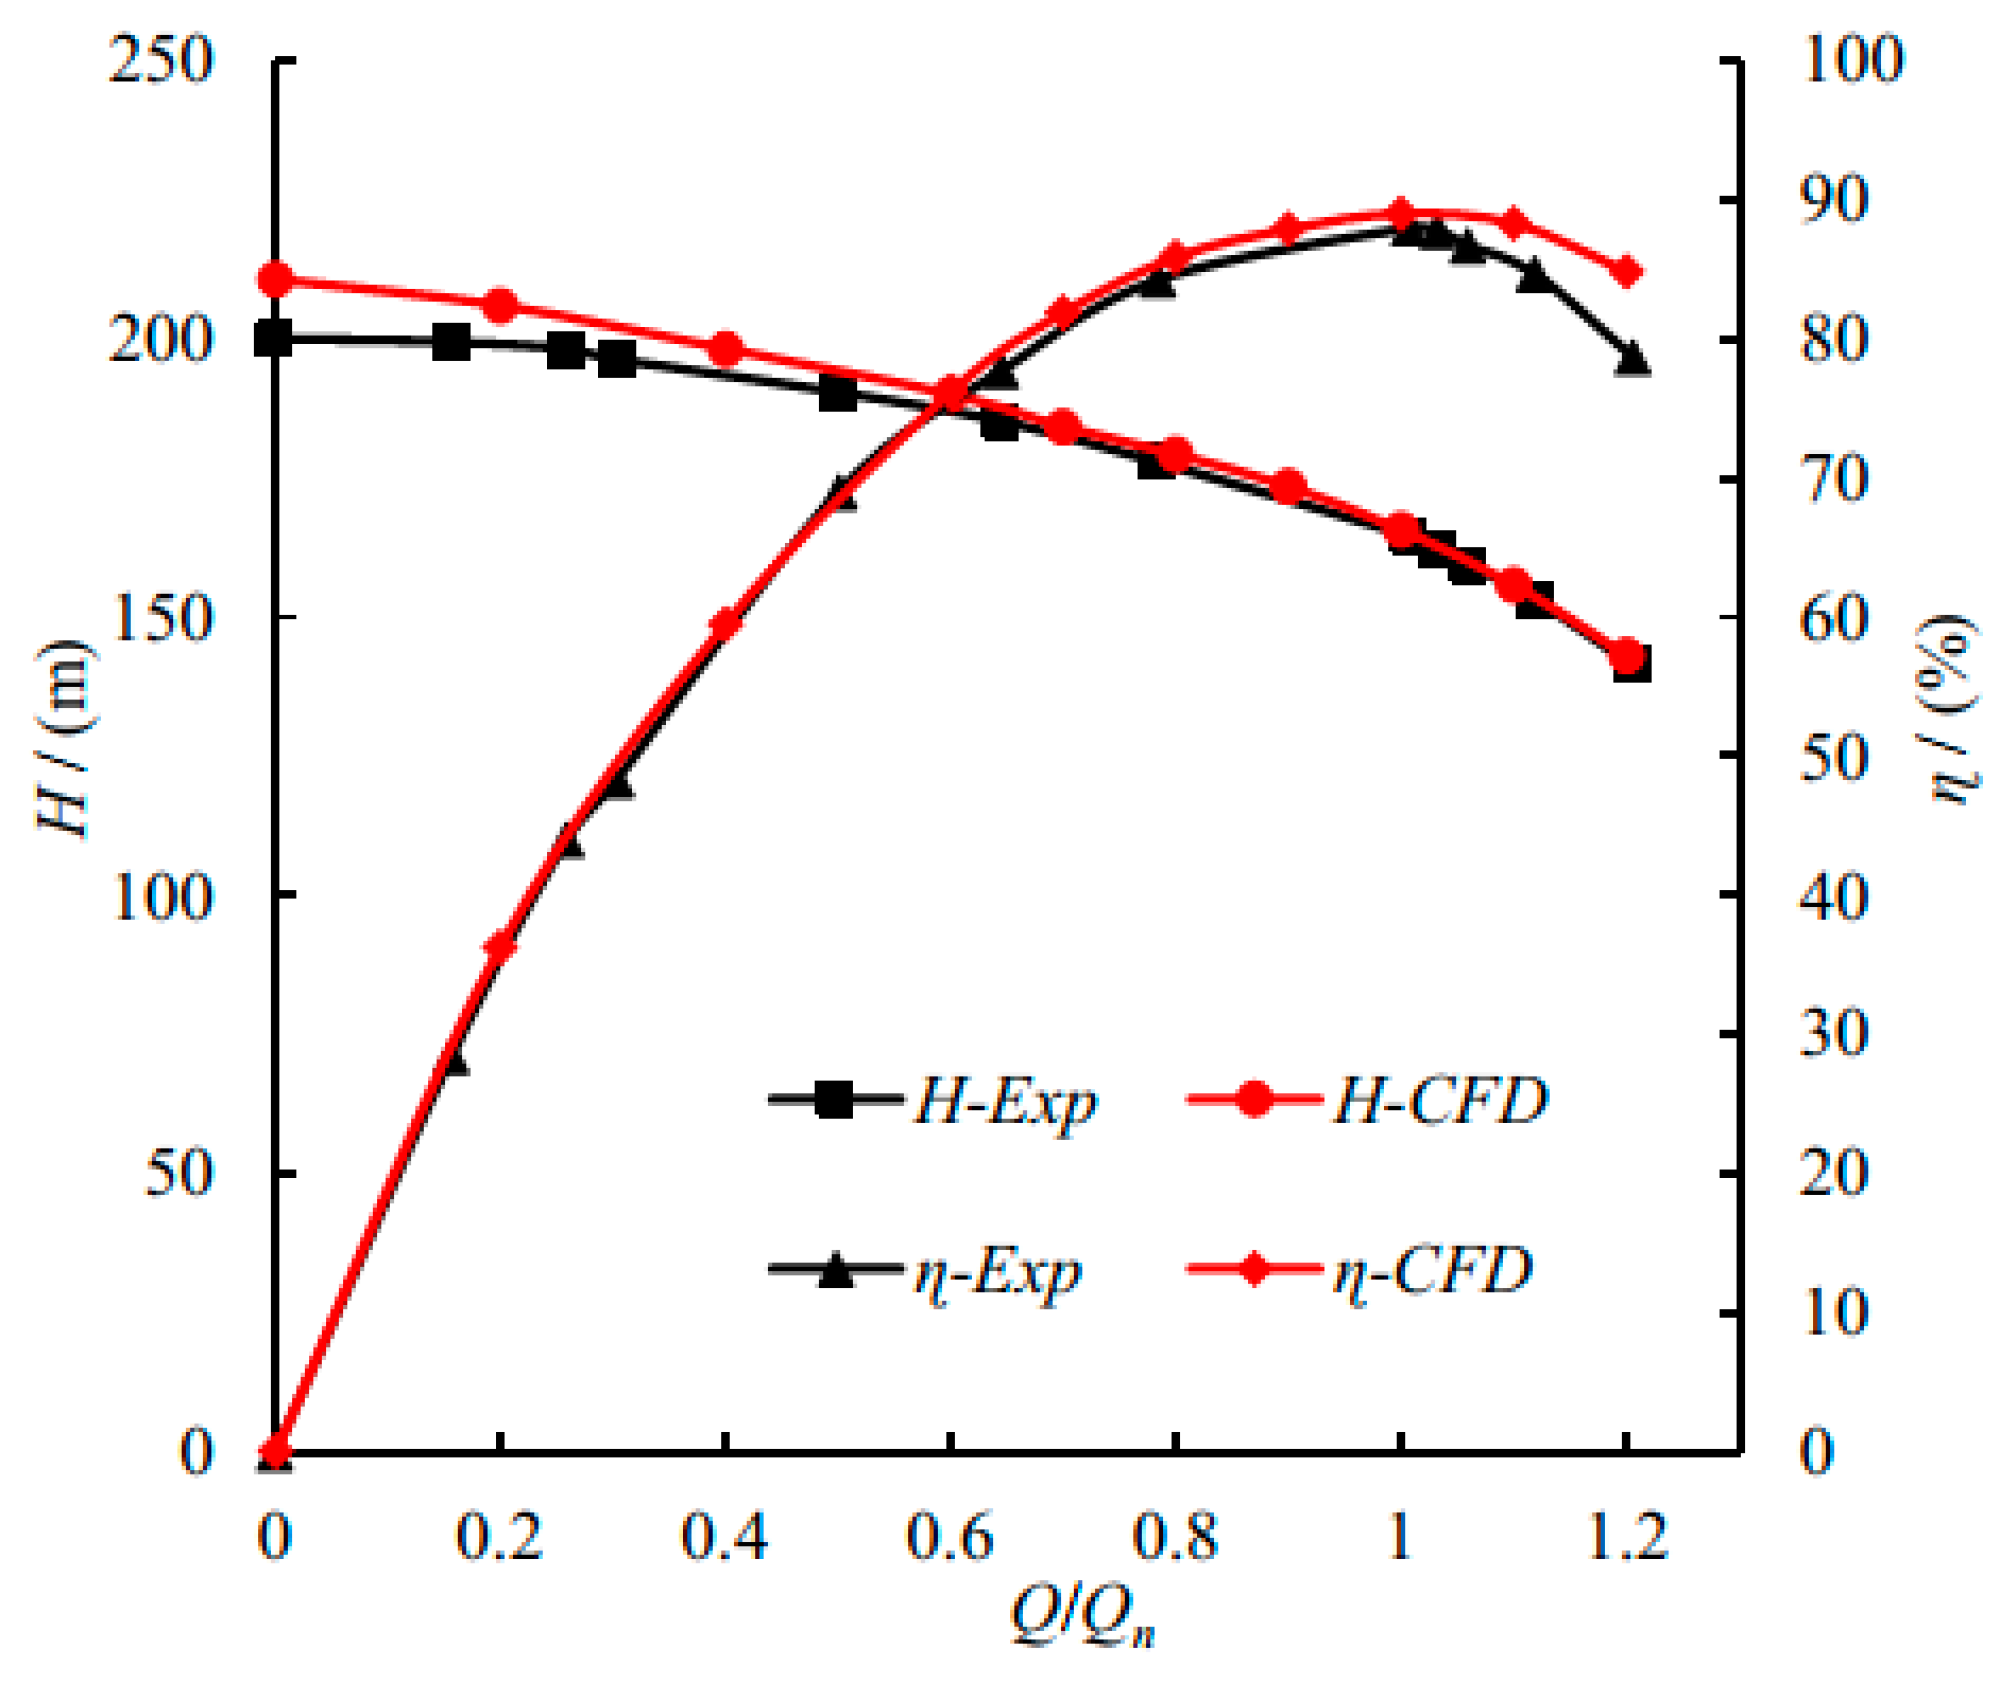
Figure 9 shows the simulated performance curve with different flow rates compared to the experimental results by using the final fine grid. The experimental test was finished in the pump test bench of Shanghai Liancheng Company(Shanghai, China), and the total test error of the experiment was ±0.5% [24]. The maximum deviation of the simulation results was 6.2% and 6.7% for efficiency and head, respectively, while the average deviation was 2.3% and 1.7%, respectively. Meanwhile, the trend of the simulation results was the same as that of experimental values, which verifies the current grid and numerical method.
2.4.2. Time Step Analysis
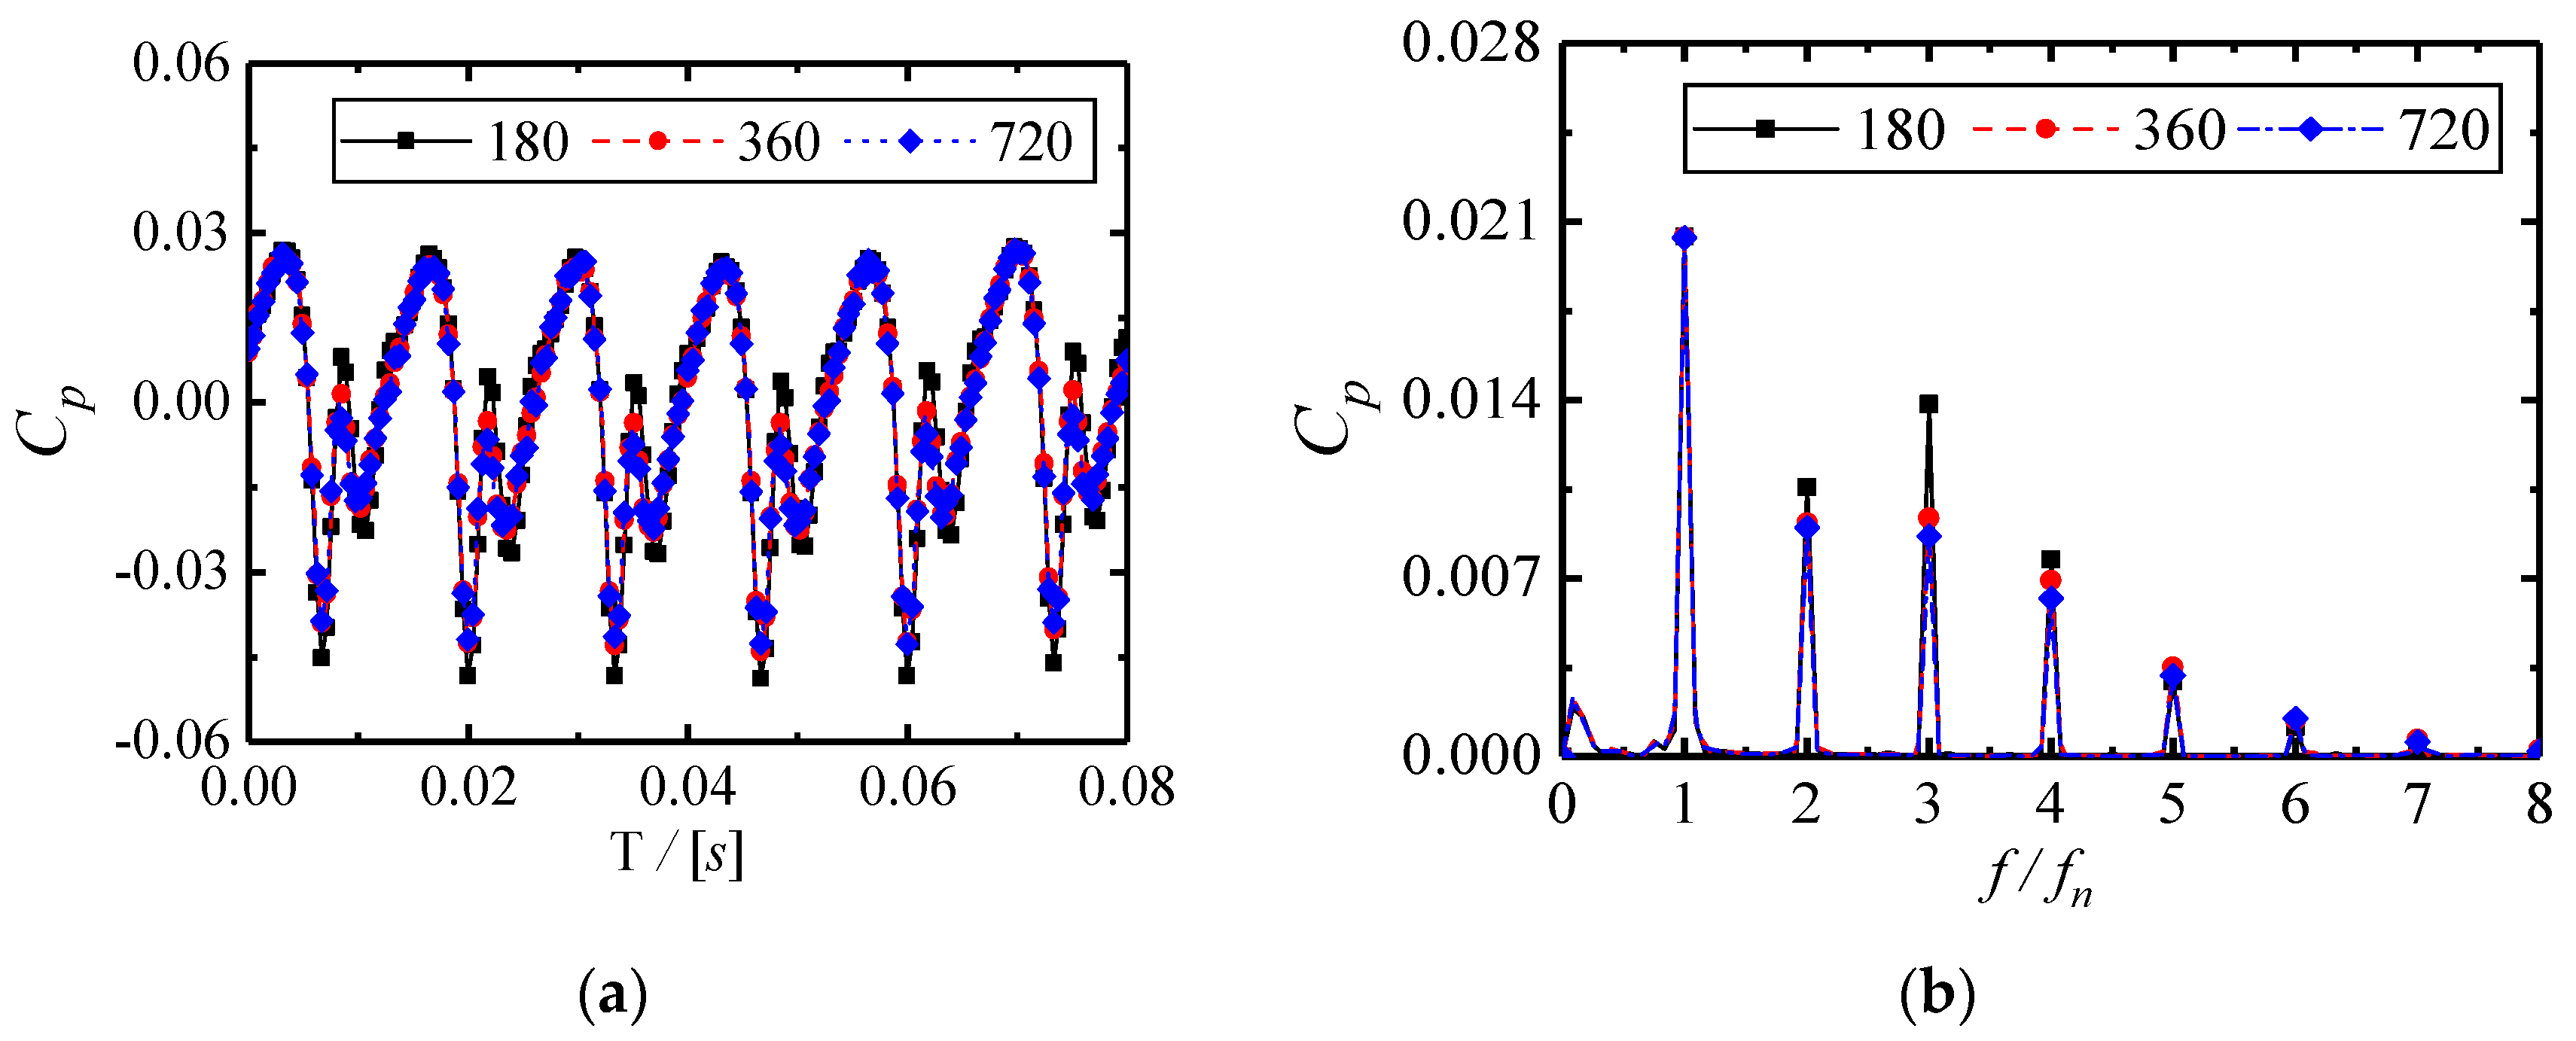
The time step of unsteady simulation plays an important role in the balance between calculation precision and computational cost. Three different time steps with 180 steps, 360 steps, and 720 steps respectively in one rotation period were compared in this paper. The corresponding sampling frequency was 2250 Hz, 4500 Hz, and 9000 Hz, which was at least 30 times that of the BPF. The harmony of the fluctuation is usually around 10 times that of the BPF, so the time step chosen above is sufficient. Figure 10 shows the dimensionless pressure coefficient distribution of the monitor point F1 at the head of the volute tongue. Both the time domain and frequency domain distribution were obtained. The pressure coefficient Cp is defined as:
where u2 is the circumferential velocity at the impeller outlet, n is the rotation speed, and ∆p is the difference between the transient pressure and the time-averaged value.
The time domain distributions of the pressure coefficient at the monitor point F1 with three different time steps show obvious periodicity. All three time-steps can capture enough information in the frequency domain as shown in Figure 10b. The predicted fluctuation components at different frequencies are basically the same, but the amplitude is different. For the pressure distributions in the time domain, the peak value of the pressure coefficient with 180 steps was higher than that of the other two time-steps. For the results in the frequency domain, the peak value of the pressure amplitude at the BPF was the same under the three time-steps. As the time-step decreased, the amplitude of the pressure fluctuation became more consistent. The results in both time domain and frequency domain were almost the same for 360 steps and 720 steps, which means that the numerical solution was temporally stable when the number of the time step was bigger than 360 in one rotation period. Therefore, 360 steps per rotation was used as the final choice for the following unsteady simulation. More than ten rotation periods were calculated until the monitored pressure signals showed distinct periodicity. Then, five more rotation periods were calculated, and the data were sampled for analysis.
3. Results and Discussions
3.1. General Fluctuation Performance in the Whole Passage
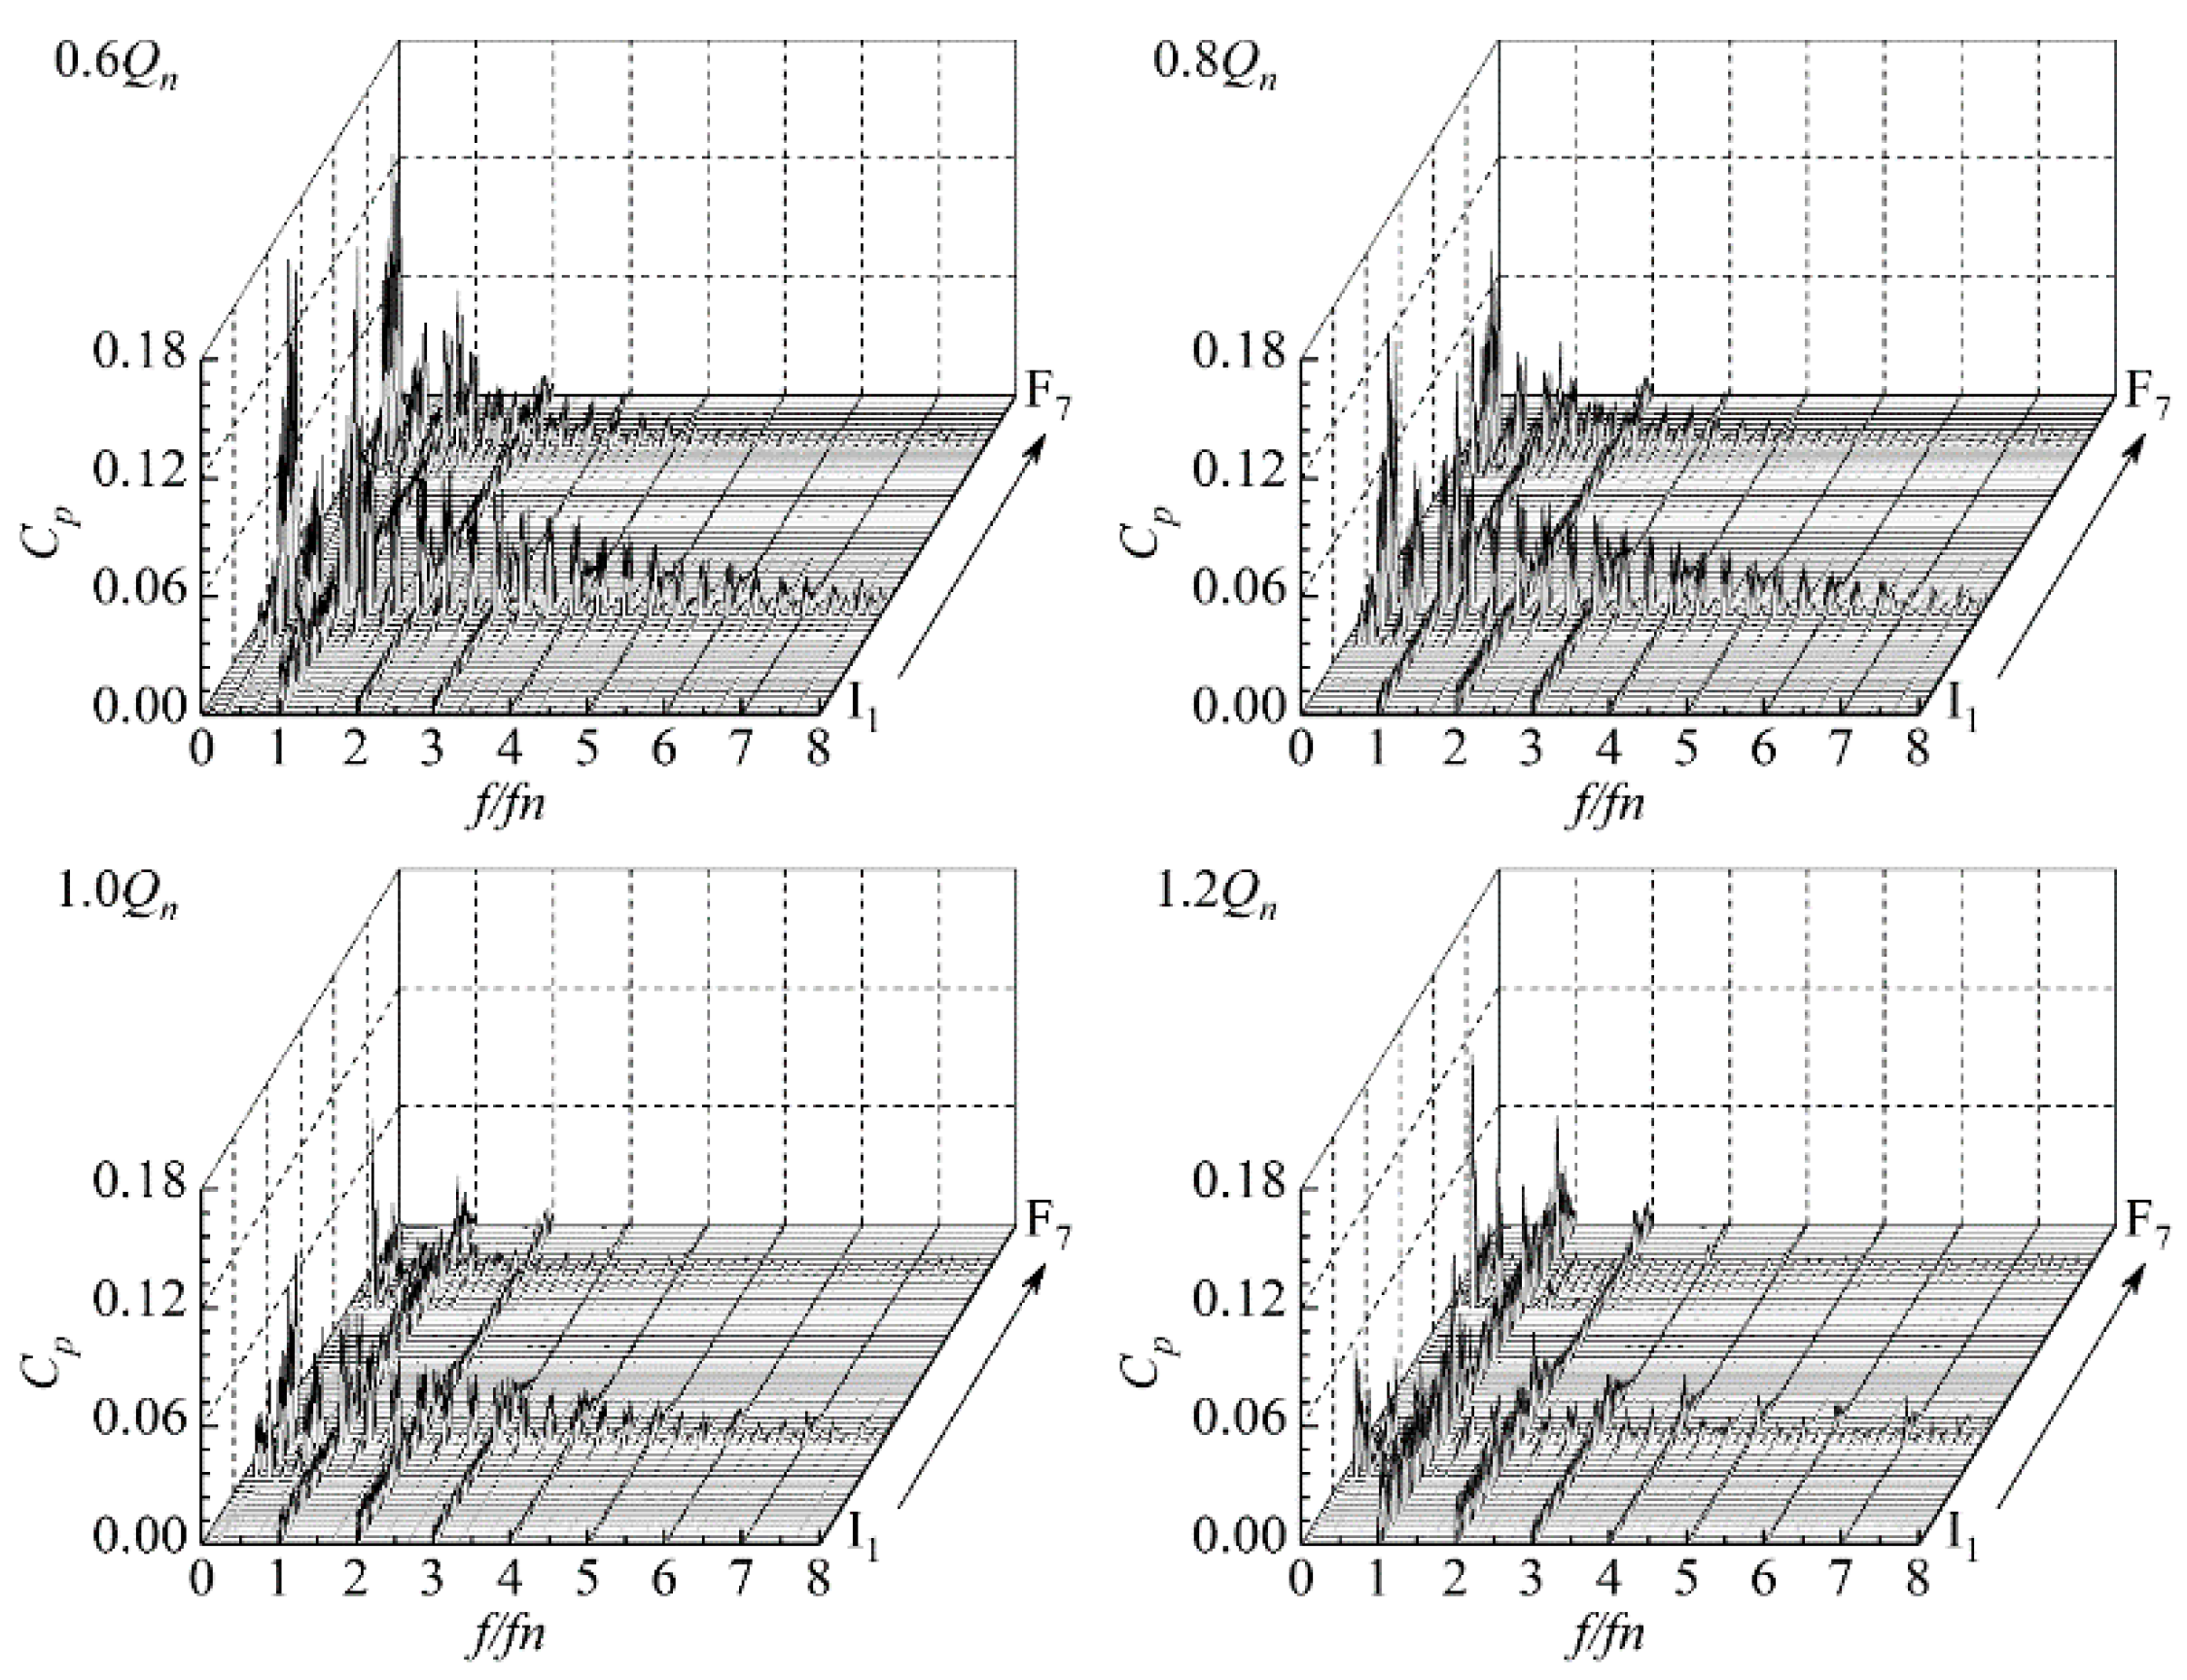
Figure 11 shows the frequency distribution of pressure fluctuation in the two-stage double-suction centrifugal pump from the inlet of the suction chamber to the outlet of the volute under four typical flow rates. The X coordinate is the dimensionless frequency divided by the BPF fn, which was 75 Hz. The Y coordinate is the order of the monitor points, which was from I1–I12, P11–P19, A1–C6, P21–P29, and F1–F8, and the Z coordinate is the pressure coefficient Cp. It can be seen that the pressure fluctuation of the two-stage double-suction centrifugal pump was mainly based on the BPF and its harmonics under the four typical flow rates. BPF and its first harmonic existed at each monitor point of the pump.
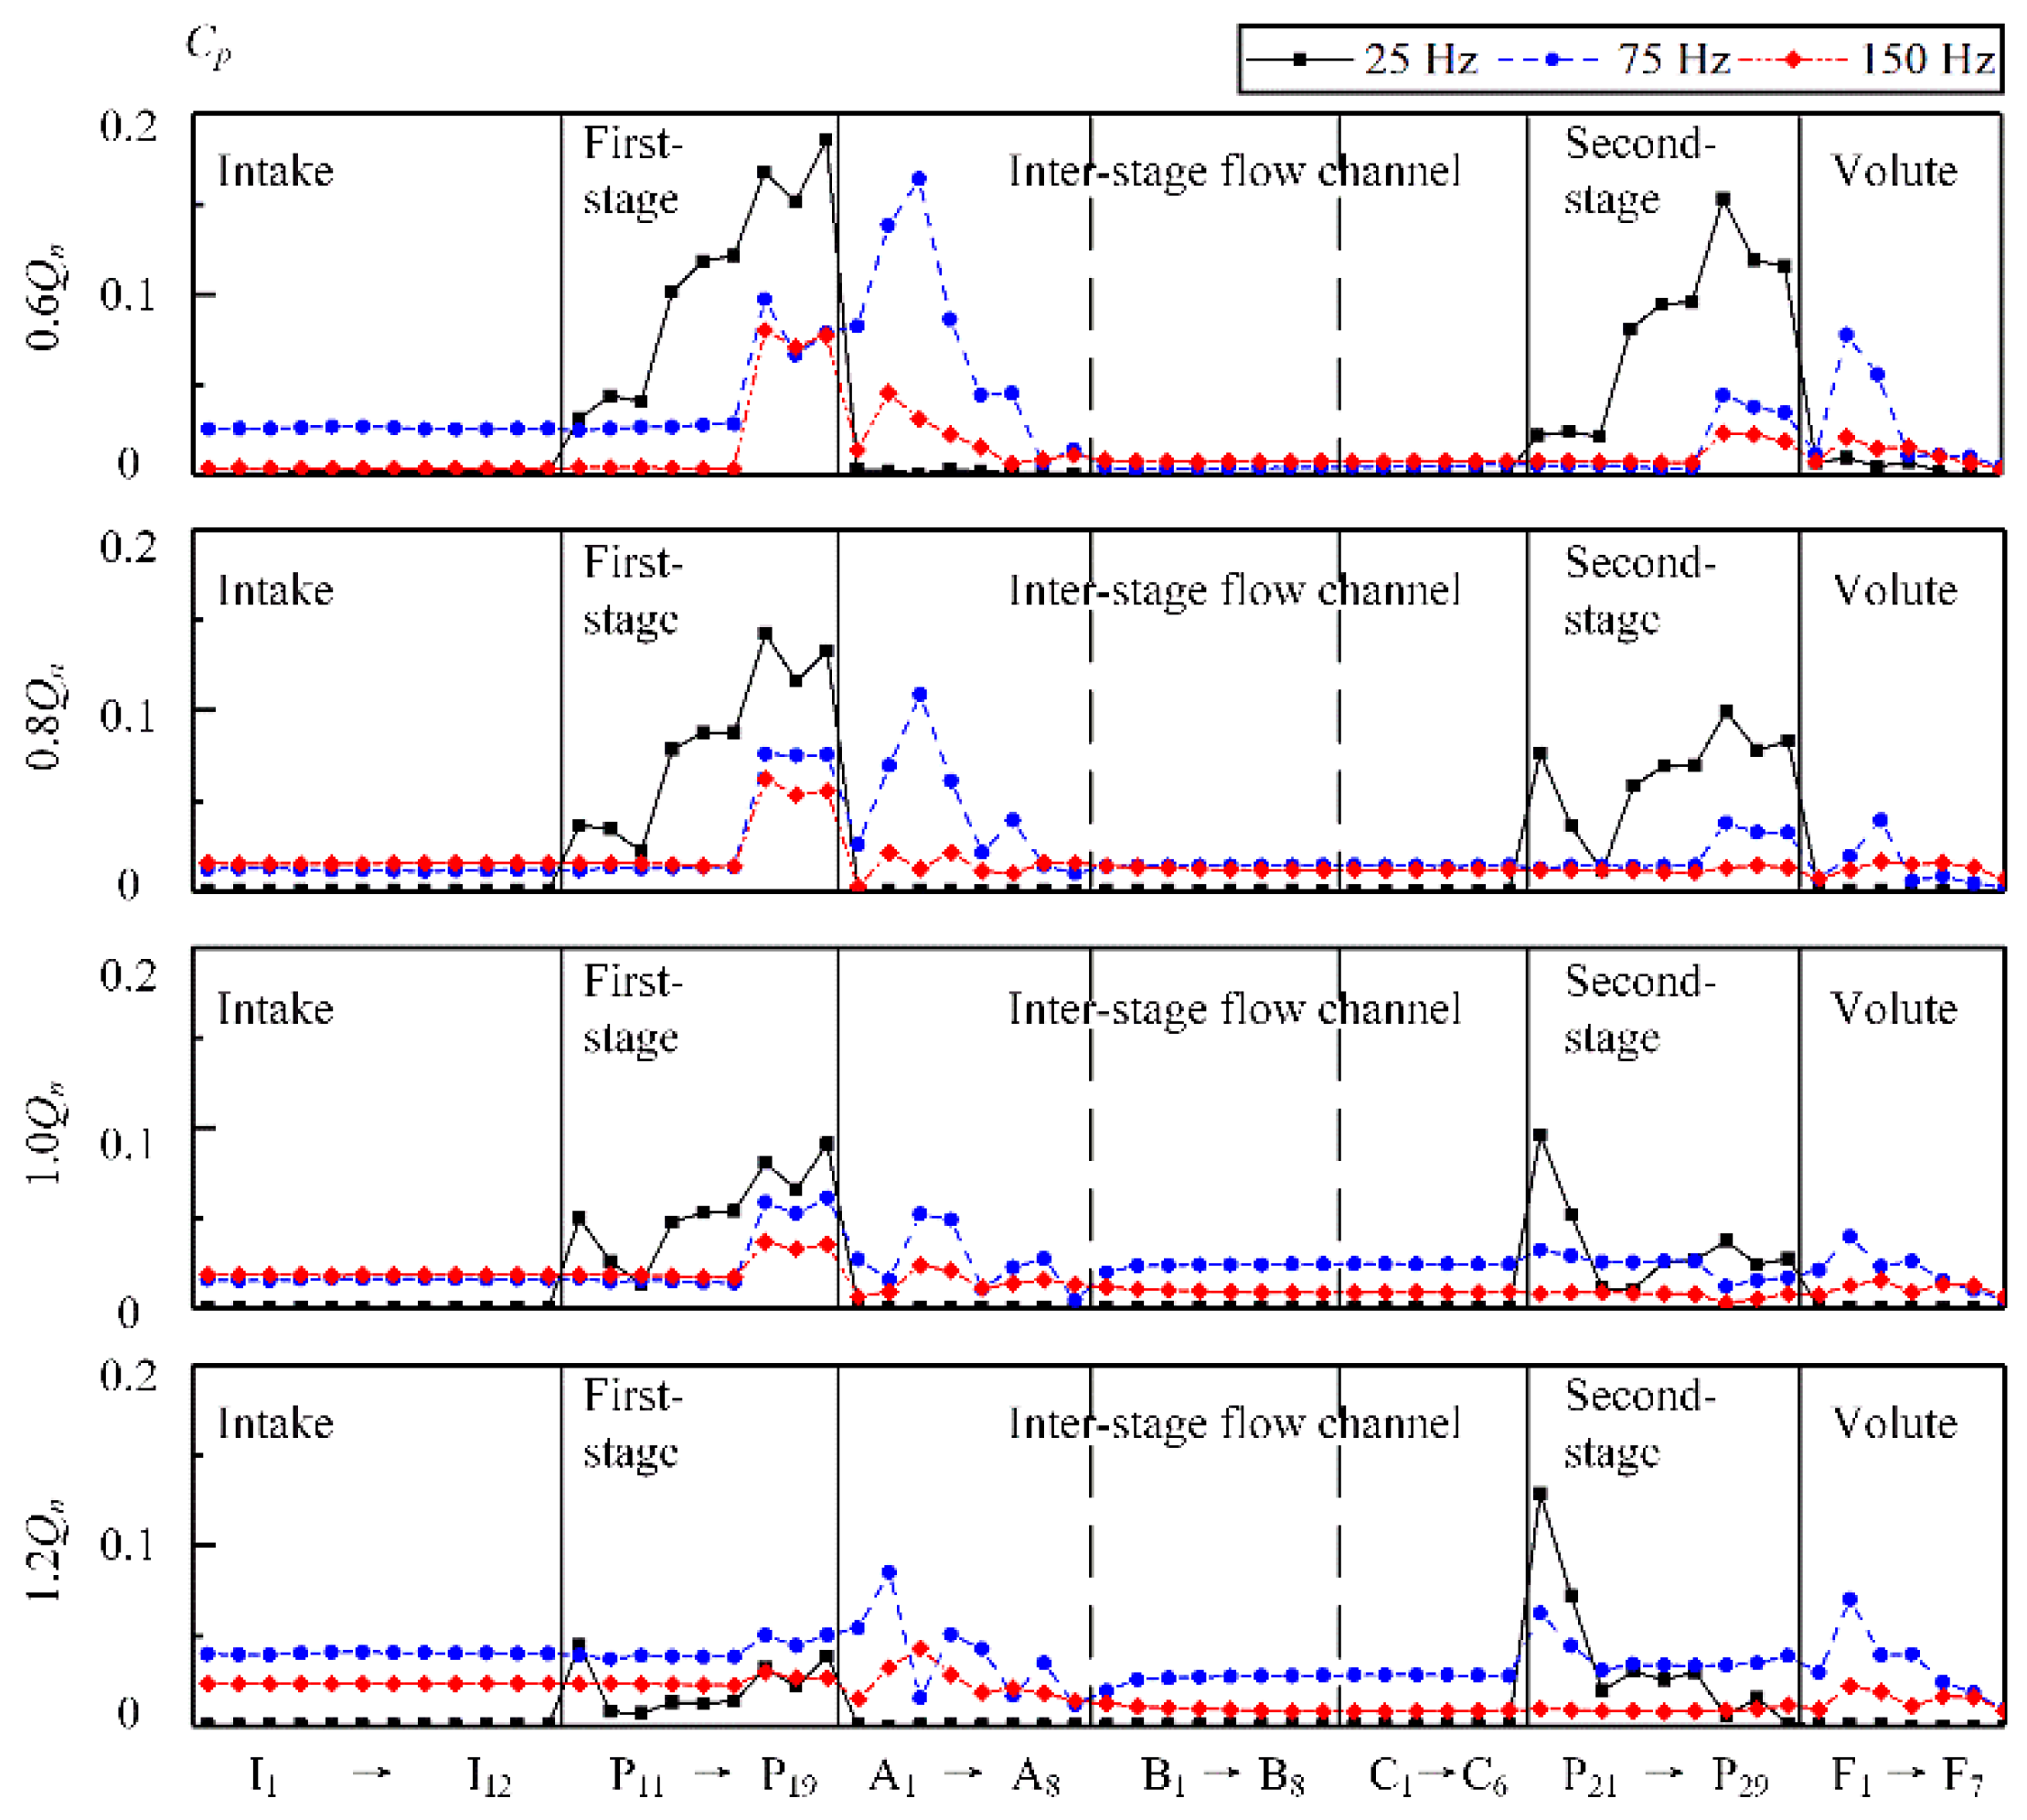
It can be found in Figure 11 that the pressure fluctuations in the impellers were different from those at other positions. Broadband fluctuations with wide bandwidth occurred near the exit of the pressure side of the two impellers (Monitor Points P17~P19 and P27~P29), especially under part load conditions. The bandwidth of the broadband was obviously narrowed as the flow rate increased. The bandwidth of the second-stage impeller was smaller than that of the first-stage impeller. At 1.2Qn, the broadband almost disappeared in the second-stage impeller, and only BPF and its harmonics remained. Figure 12 shows the pressure fluctuation amplitude distribution at BPF (75 Hz), the first harmonic of BPF (150 Hz), and the first harmonic of RF (25 Hz) along the flow direction in each part of the two-stage double-suction centrifugal pump under four typical flow rates. It can be found that a component with a frequency of 25 Hz showed the strongest fluctuation under each flow rate especially under 0.6Qn and 1.2Qn in both the first-stage impeller and the second-stage impeller. A high pressure fluctuation amplitude with BPF was also found in both the inter-stage channel and the volute. Pressure fluctuations with BPF and its harmonics and fluctuations with the first harmonic of the RF are discussed in detail in the following sections.
3.2. Pressure Fluctuation with BPF and Its Harmonics
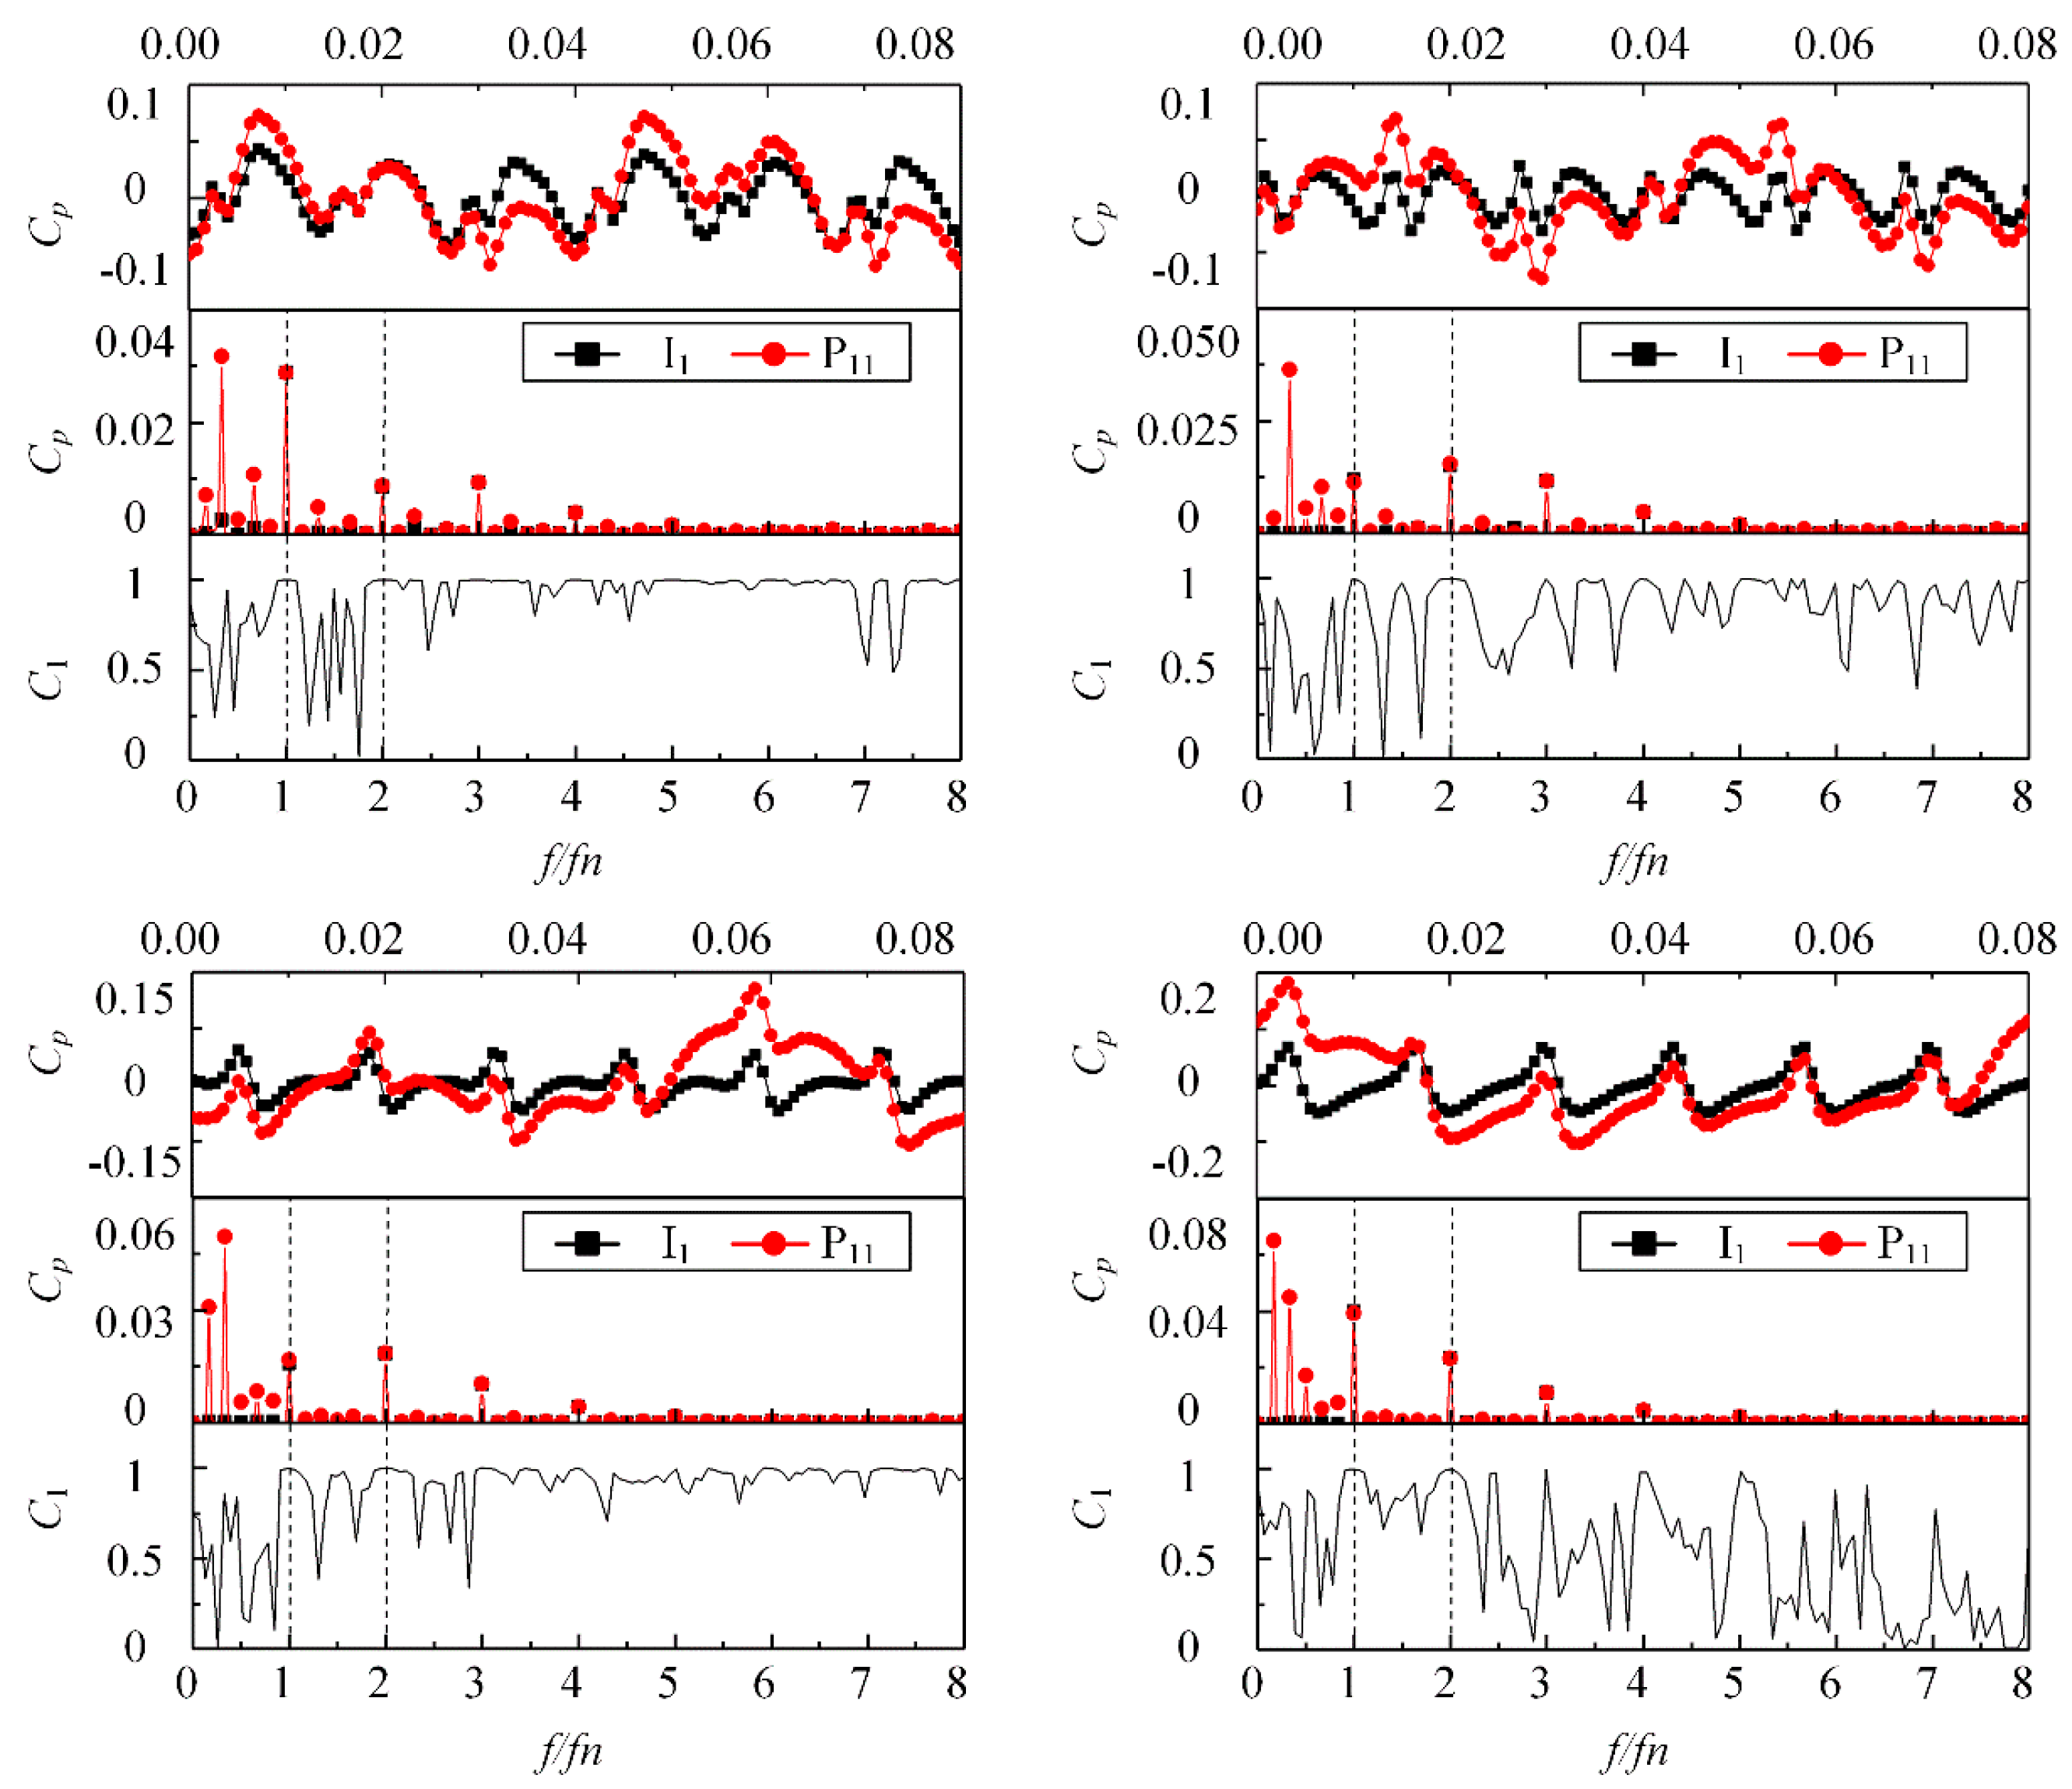
In this paper, the monitor points at the impeller rotated with the impeller. It was found that the fluctuation amplitudes at BPF and its first harmonic at both the leading edge and the middle of the blade (P11–P16) were the same as that of the suction chamber. In order to explore the relationship between the suction chamber, the leading edge, and the middle of the impeller, the time domain characteristic, the frequency domain characteristic, and coherence analysis were conducted. Figure 13 shows the comparison under the four typical flow rates of the monitor point I1 at the suction chamber and the monitor point P11 at the leading edge of the first-stage impeller. The coherence coefficient C1 is defined as,
where Rxy is the cross power spectral density of the x and y signals, while Rxx and Ryy are the power spectral densities of x and y, respectively.
It can be seen from Figure 13 that the time-domain pressure distribution at the suction chamber and the leading edge of first-stage impeller exhibited obvious periodicity under all conditions. The monitor points at both the suction chamber and the leading edge of the first-stage impeller had six valleys per rotation, and the phase were the same. In the frequency domain distributions, Monitor Point I1 was dominated by fluctuation with BPF and its harmonics. In addition to BPF and its harmonics, components with RF and its first harmonic also appeared at Monitor Point P11. However, the fluctuation amplitude at the two monitor points was the same at BPF and its harmonics. The coherence analysis in Figure 13 shows that the coherence coefficient of P11 and I1 was close to unity at the BPF and its harmonics, which means a strong correlation between those two monitor points.
The fluctuations at both the BPF and its first harmonic in the suction chamber, the leading edge, and the middle of the blade had a high correlation coefficient and a similar variation trend with the flow rate (Figure 13). The pressure fluctuation propagation in the suction chamber and the leading edge of the first-stage impeller were different from that caused by rotor–stator interaction. The propagation of the fluctuation with BPF and its harmonics at the suction chamber was caused by the interaction of the blade and the baffle of the suction chamber during the rotation process of the impeller. However, in the rotating reference frame, the monitor points on the impeller were relatively stationary, and the frequency should be RF and its harmonics, which was found at the monitor point P11 at the leading edge of the first-stage impeller.
3.3. Pressure Fluctuation with 25 Hz
3.3.1. Fluctuation at the Leading Edge
According to the fluctuation performance at 25 Hz shown above, it was found that the fluctuations in the two impellers had a common characteristic at the leading edge. Both the first-stage impeller and the second-stage impeller had 25-Hz fluctuation at the monitor point (P11, P21) near the shroud side of the leading edge. The amplitude of the 25 Hz fluctuation rose up as the flow rate increased. The fluctuation at the second-stage impeller was more obvious than that at the first-stage impeller. Under the 1.0Qn and 1.2Qn condition, this component had the largest amplitude among all the monitor points.
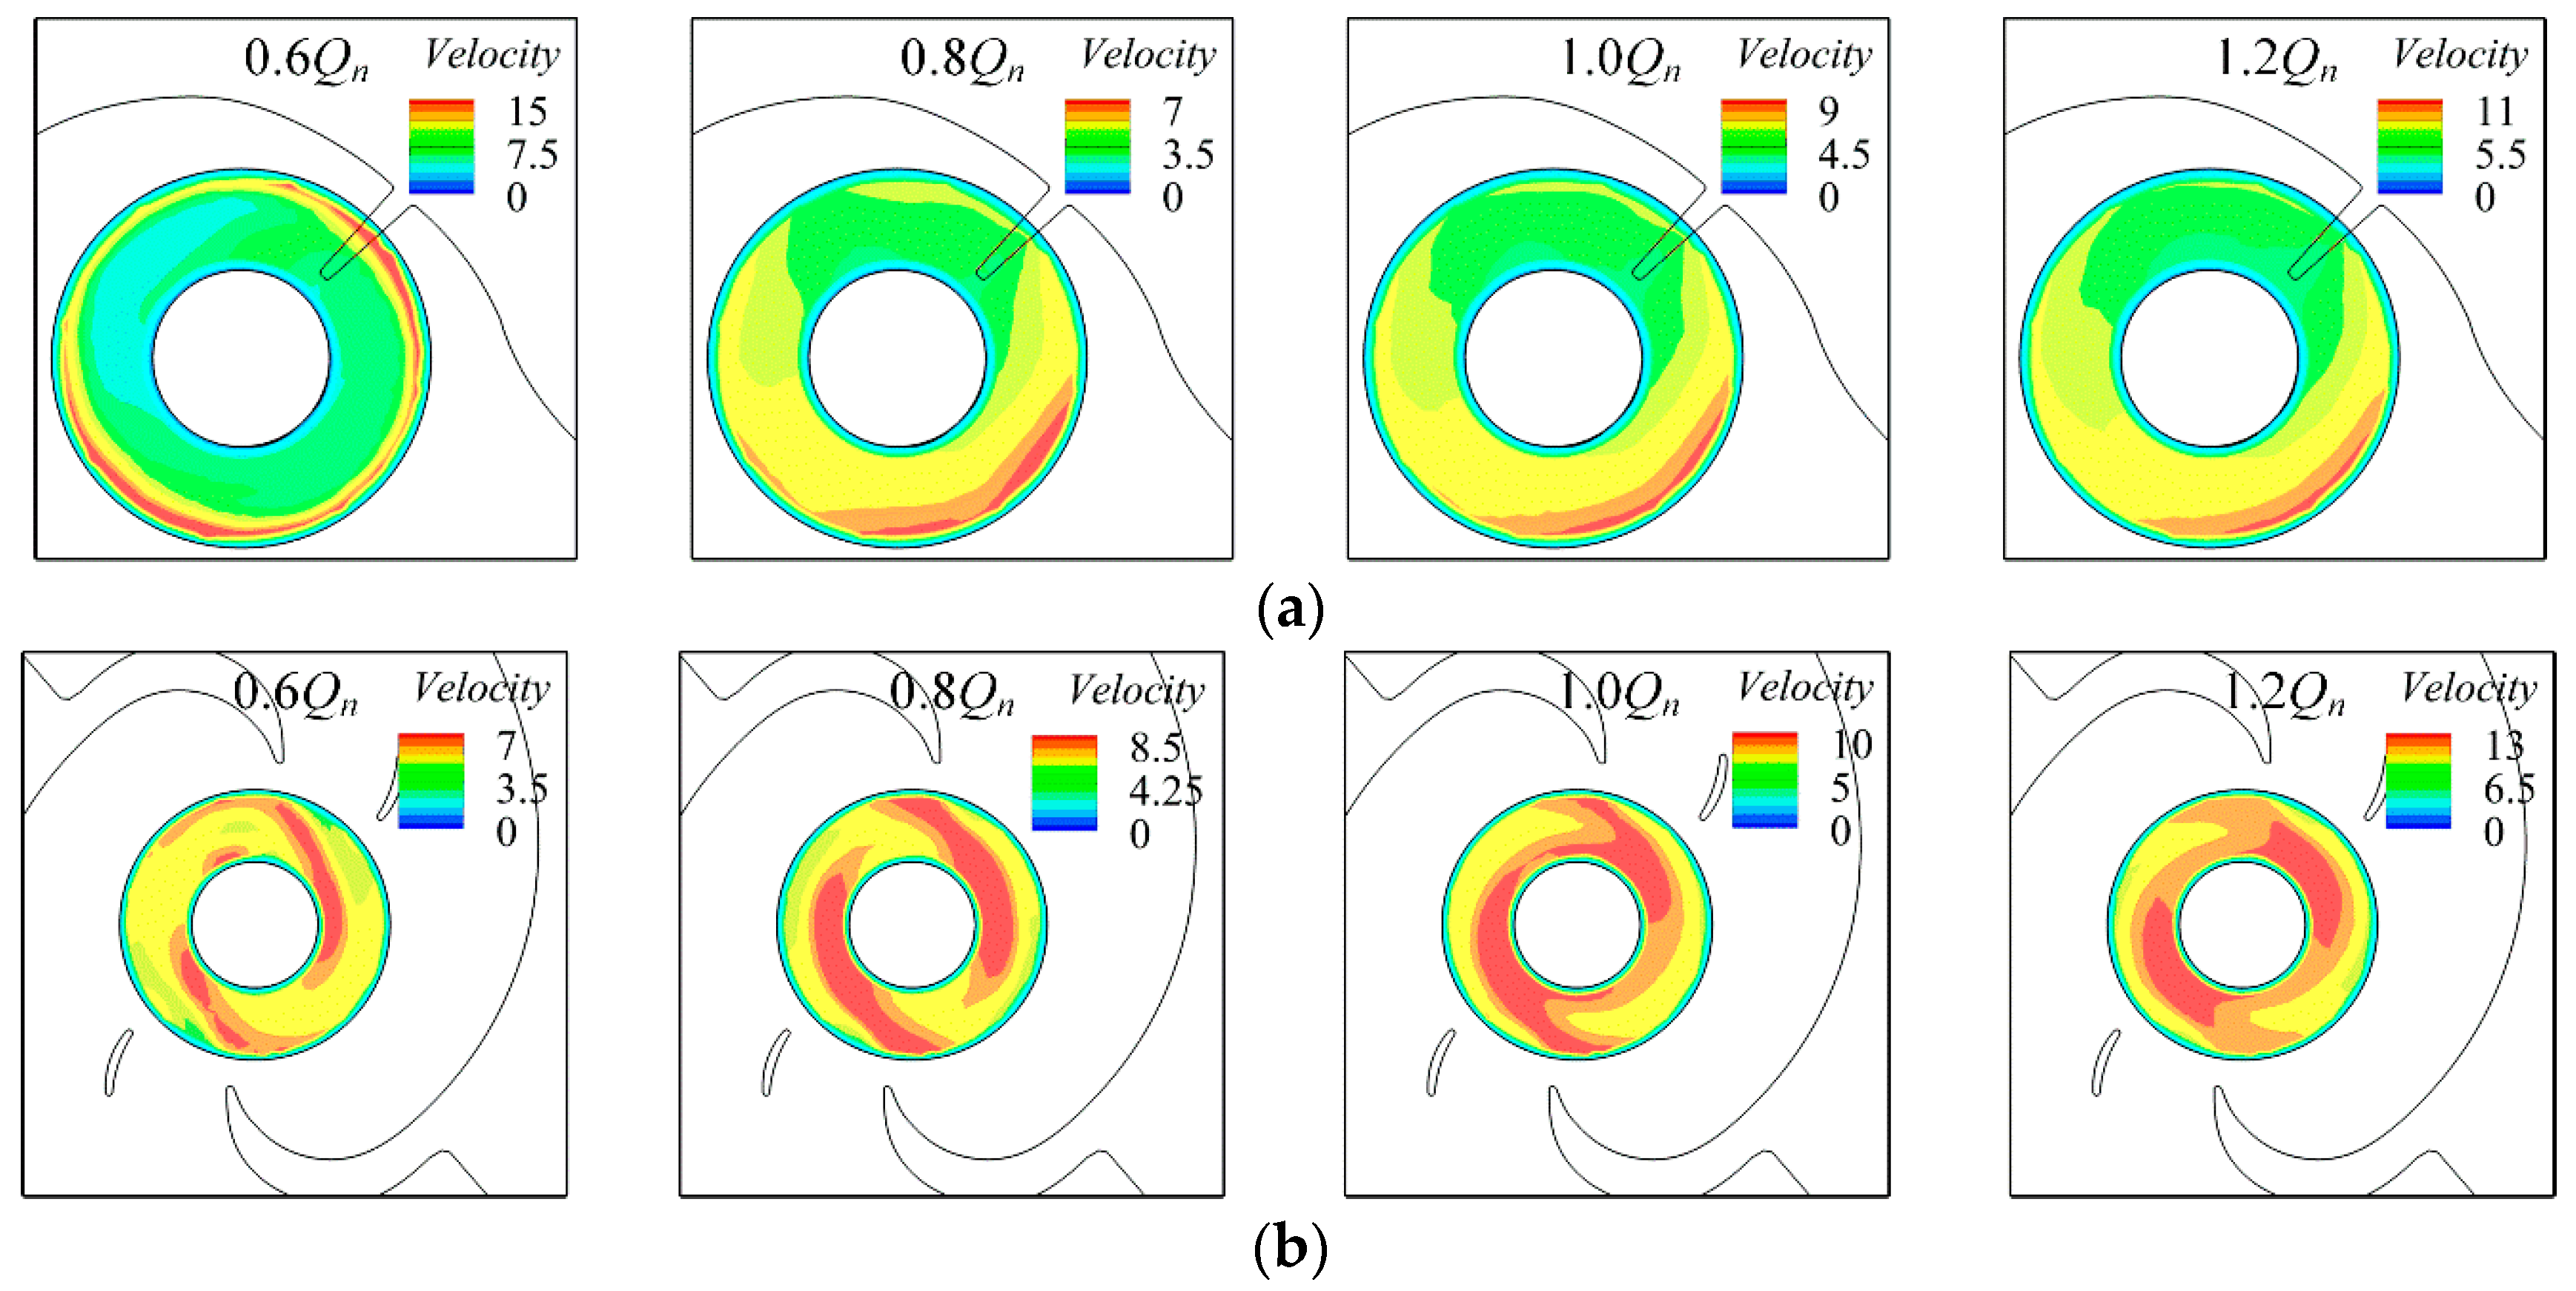
Figure 14 shows the velocity distributions at the inlet of the two impellers. It was found that the velocity distributions did not change with time. For the velocity distribution at the first-stage impeller inlet, there was a symmetrically-distributed high velocity zone under 0.6Qn as shown in Figure 14a. However, as the flow rate gradually increased, the symmetrical high velocity distribution disappeared, and a high-speed zone appeared in the direction of the suction chamber inlet. The high-speed zone also appeared in front of the second-stage impeller. The area of the high-speed zone increased as the flow rate increased, but the distribution of the high-speed zones was not the same as that in the first-stage impeller. There was a pair of symmetrically-distributed high-speed zones in front of the second-stage impeller inlet. Under 0.6Qn, as shown in Figure 14b, the area of the symmetrically-distributed high-speed zone around the impeller inlet was small, and the velocity was relatively lower. With the increase of the flow rate, starting from the 0.8Qn condition, the area and the velocity gradient of the symmetrically-distributed high-speed zone increased gradually.
Comparing the pressure fluctuation distribution in frequency domain at the monitor point P11 in the first-stage impeller and the monitor point P21 in the second-stage impeller under different conditions (Figure 15), it can be found that the fluctuation with the first harmonic of RF at the two impellers increased with the flow rate obviously. The main frequency component at the monitor point P21 was the first harmonic of the RF; while, the fluctuation component at the monitor point P11 was more complex compared to that at the monitor point P21, and the main fluctuation frequency was RF and its first harmonic. Under part load conditions, the main frequency was the first harmonic of the RF. As the flow rate increased, the fluctuation with RF gradually became the main fluctuating component.
Combined with the flow field shown in Figure 14a, it can be found that the fluctuation with the first harmonic of the RF under 0.6Qn was mainly caused by the blade passing through the high-speed zone twice in one rotation. As the flow rate increased, the distribution of the high-speed zone changed and merged into a single high-speed zone near the inlet direction, and the frequency of the fluctuation also changed to RF. The symmetrically-distributed high-speed zone at the leading edge of the second-stage impeller as shown in Figure 14b was due to the symmetrically-distributed structure of the inter-stage flow channel. At the intersection of the two channels, the symmetrically-distributed high-speed zones appeared near the impeller inlet and were only influenced by the flow rate of the inter-stage flow channel. This indicates that the fluctuation with the first harmonic of the RF at the leading edge of the second-stage impeller was caused by the leading edge passing the high-speed zones two times in one rotation period.
3.3.2. Fluctuation at the Trailing Edge
An obvious broadband fluctuation appeared near the trailing edge of both the first-stage impeller and second-stage impeller, as shown in Figure 16. The fluctuation at the trailing edge of the two impellers can be divided into two categories. One is the fluctuation with the frequency of the first harmonic of the RF. The fluctuation amplitudes at the first harmonic of the RF were significantly higher than the other frequencies. The other is the fluctuation with broadband frequency, which can be characterized by a wide bandwidth of the band, and the amplitude decreased as the frequency increased. The bandwidth and fluctuation amplitude of the broadband at the trailing edge in the two impellers under 0.6Qn was significantly higher than that under the other flow rates. As the flow rate increased, both the amplitude and bandwidth of the broadband decreased. Under the 1.2Qn condition, the broadband vanished at the trailing edge of the second-stage impeller, and only fluctuation with BPF and its first harmonic existed.
In order to study the causes of the fluctuation with 25 Hz, the flow around the exit of the second-stage impeller under 0.6Qn and 1.2Qn was analyzed. Figure 17 shows the time domain comparison of the pressure coefficient and radial velocity in one rotation period at the monitor point P28. It was found that the radial velocity reached the valley as the pressure dropped to the valley under 0.6Qn when the blade passed through the tongue and the start of the partition. Figure 18 shows the flow details when the blade rotated at the tongue position. It should be noted that the phase difference between the tongue and the start of the partition was π. Therefore, when one blade passed through the tongue, there must have been another blade passing the start of the position at the same time since there were six blades in total; see Figure 18. This is why the fluctuation with the first harmonic of the RF existed in the second-stage impeller near the trailing edge.
It can be found from the instantaneous Q distribution in Figure 18 that the vortices existed in the volute channel near the impeller outlet. When the blade passed through the volute tongue and the start of the partition, vortices were created between blades, the volute tongue, and the start of the partition. There was a vortex train near the outlet of the runner, which was close to the start of the partition and the tongue under 0.6Qn. Under 1.2Qn, the radial velocity distribution was smooth, but slight fluctuations were still available when the blade passed through the tongue and the start of the partition; see Figure 17. Different from the 0.6Qn condition, the impeller outlet was evenly distributed with small vortexes. It should be noted that those small vortexes near the impeller outlet remained unchanged even when the blade passed through the volute tongue and the start of the partition. This means that the impeller outflow under 1.2Qn was less affected by the volute tongue and the partition. As a result, the pressure fluctuation amplitude with 25 Hz under 1.2Qn was lower than that under 0.6Qn, as shown in Figure 12.
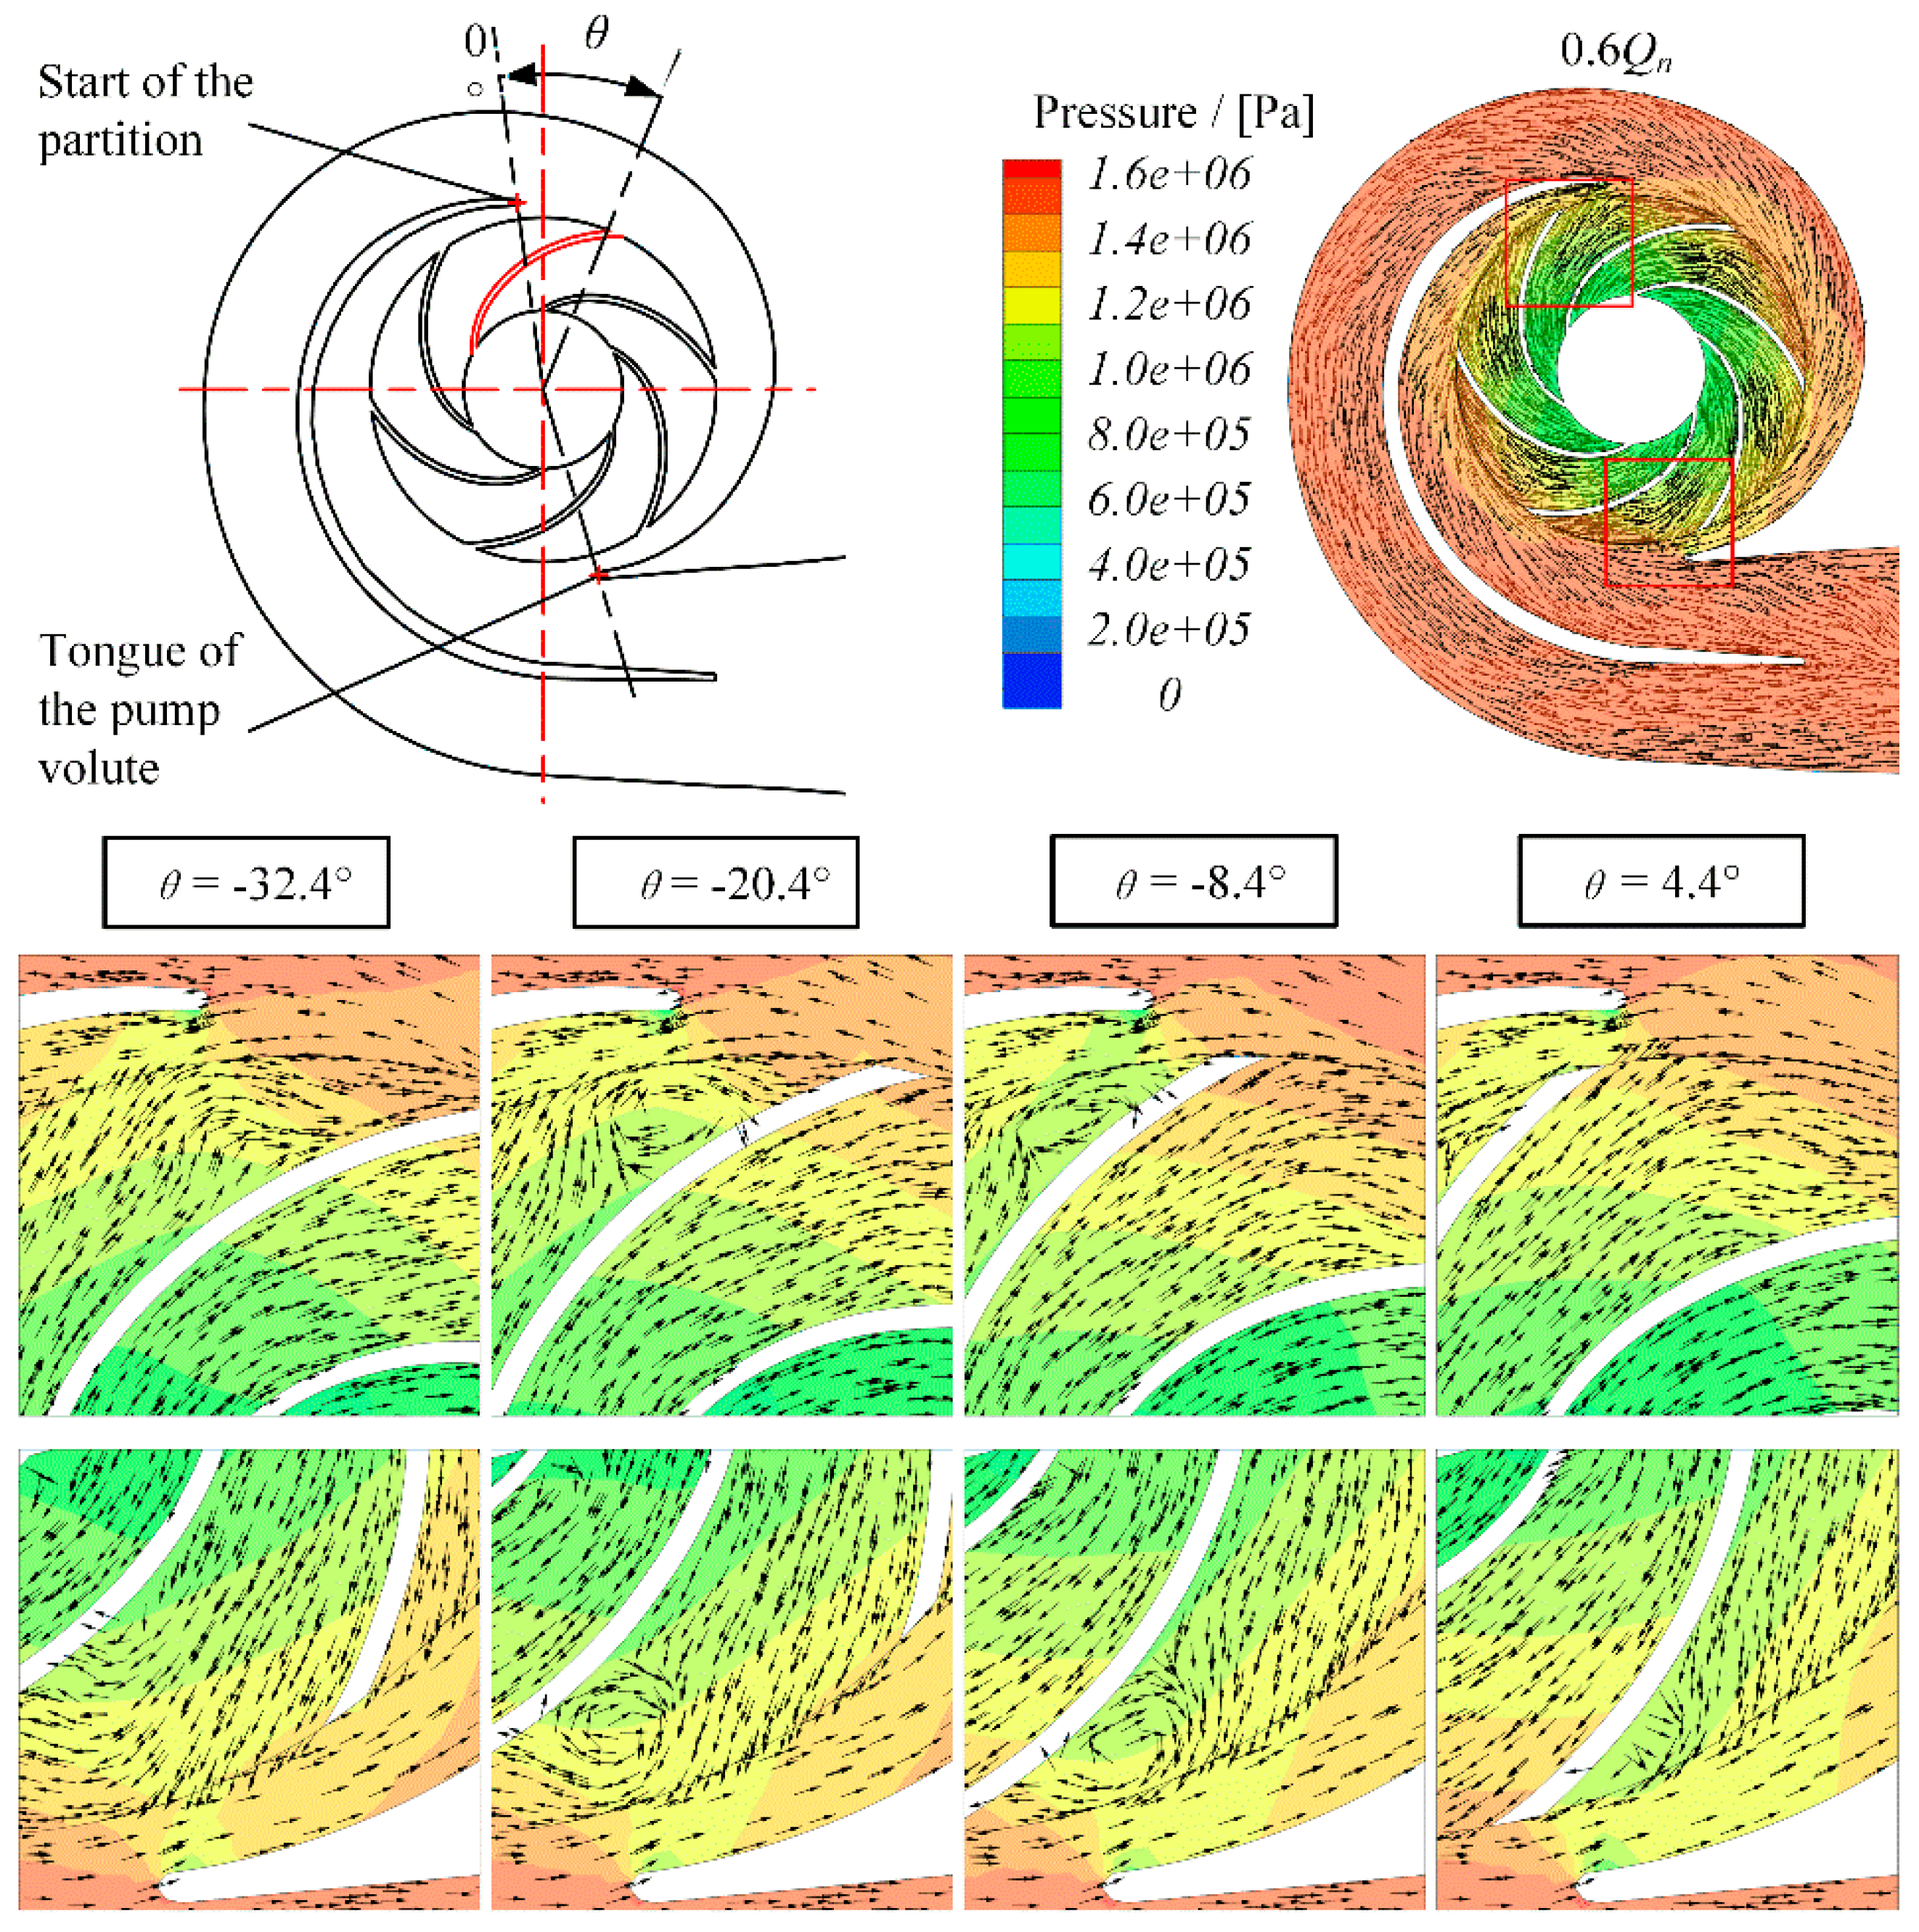
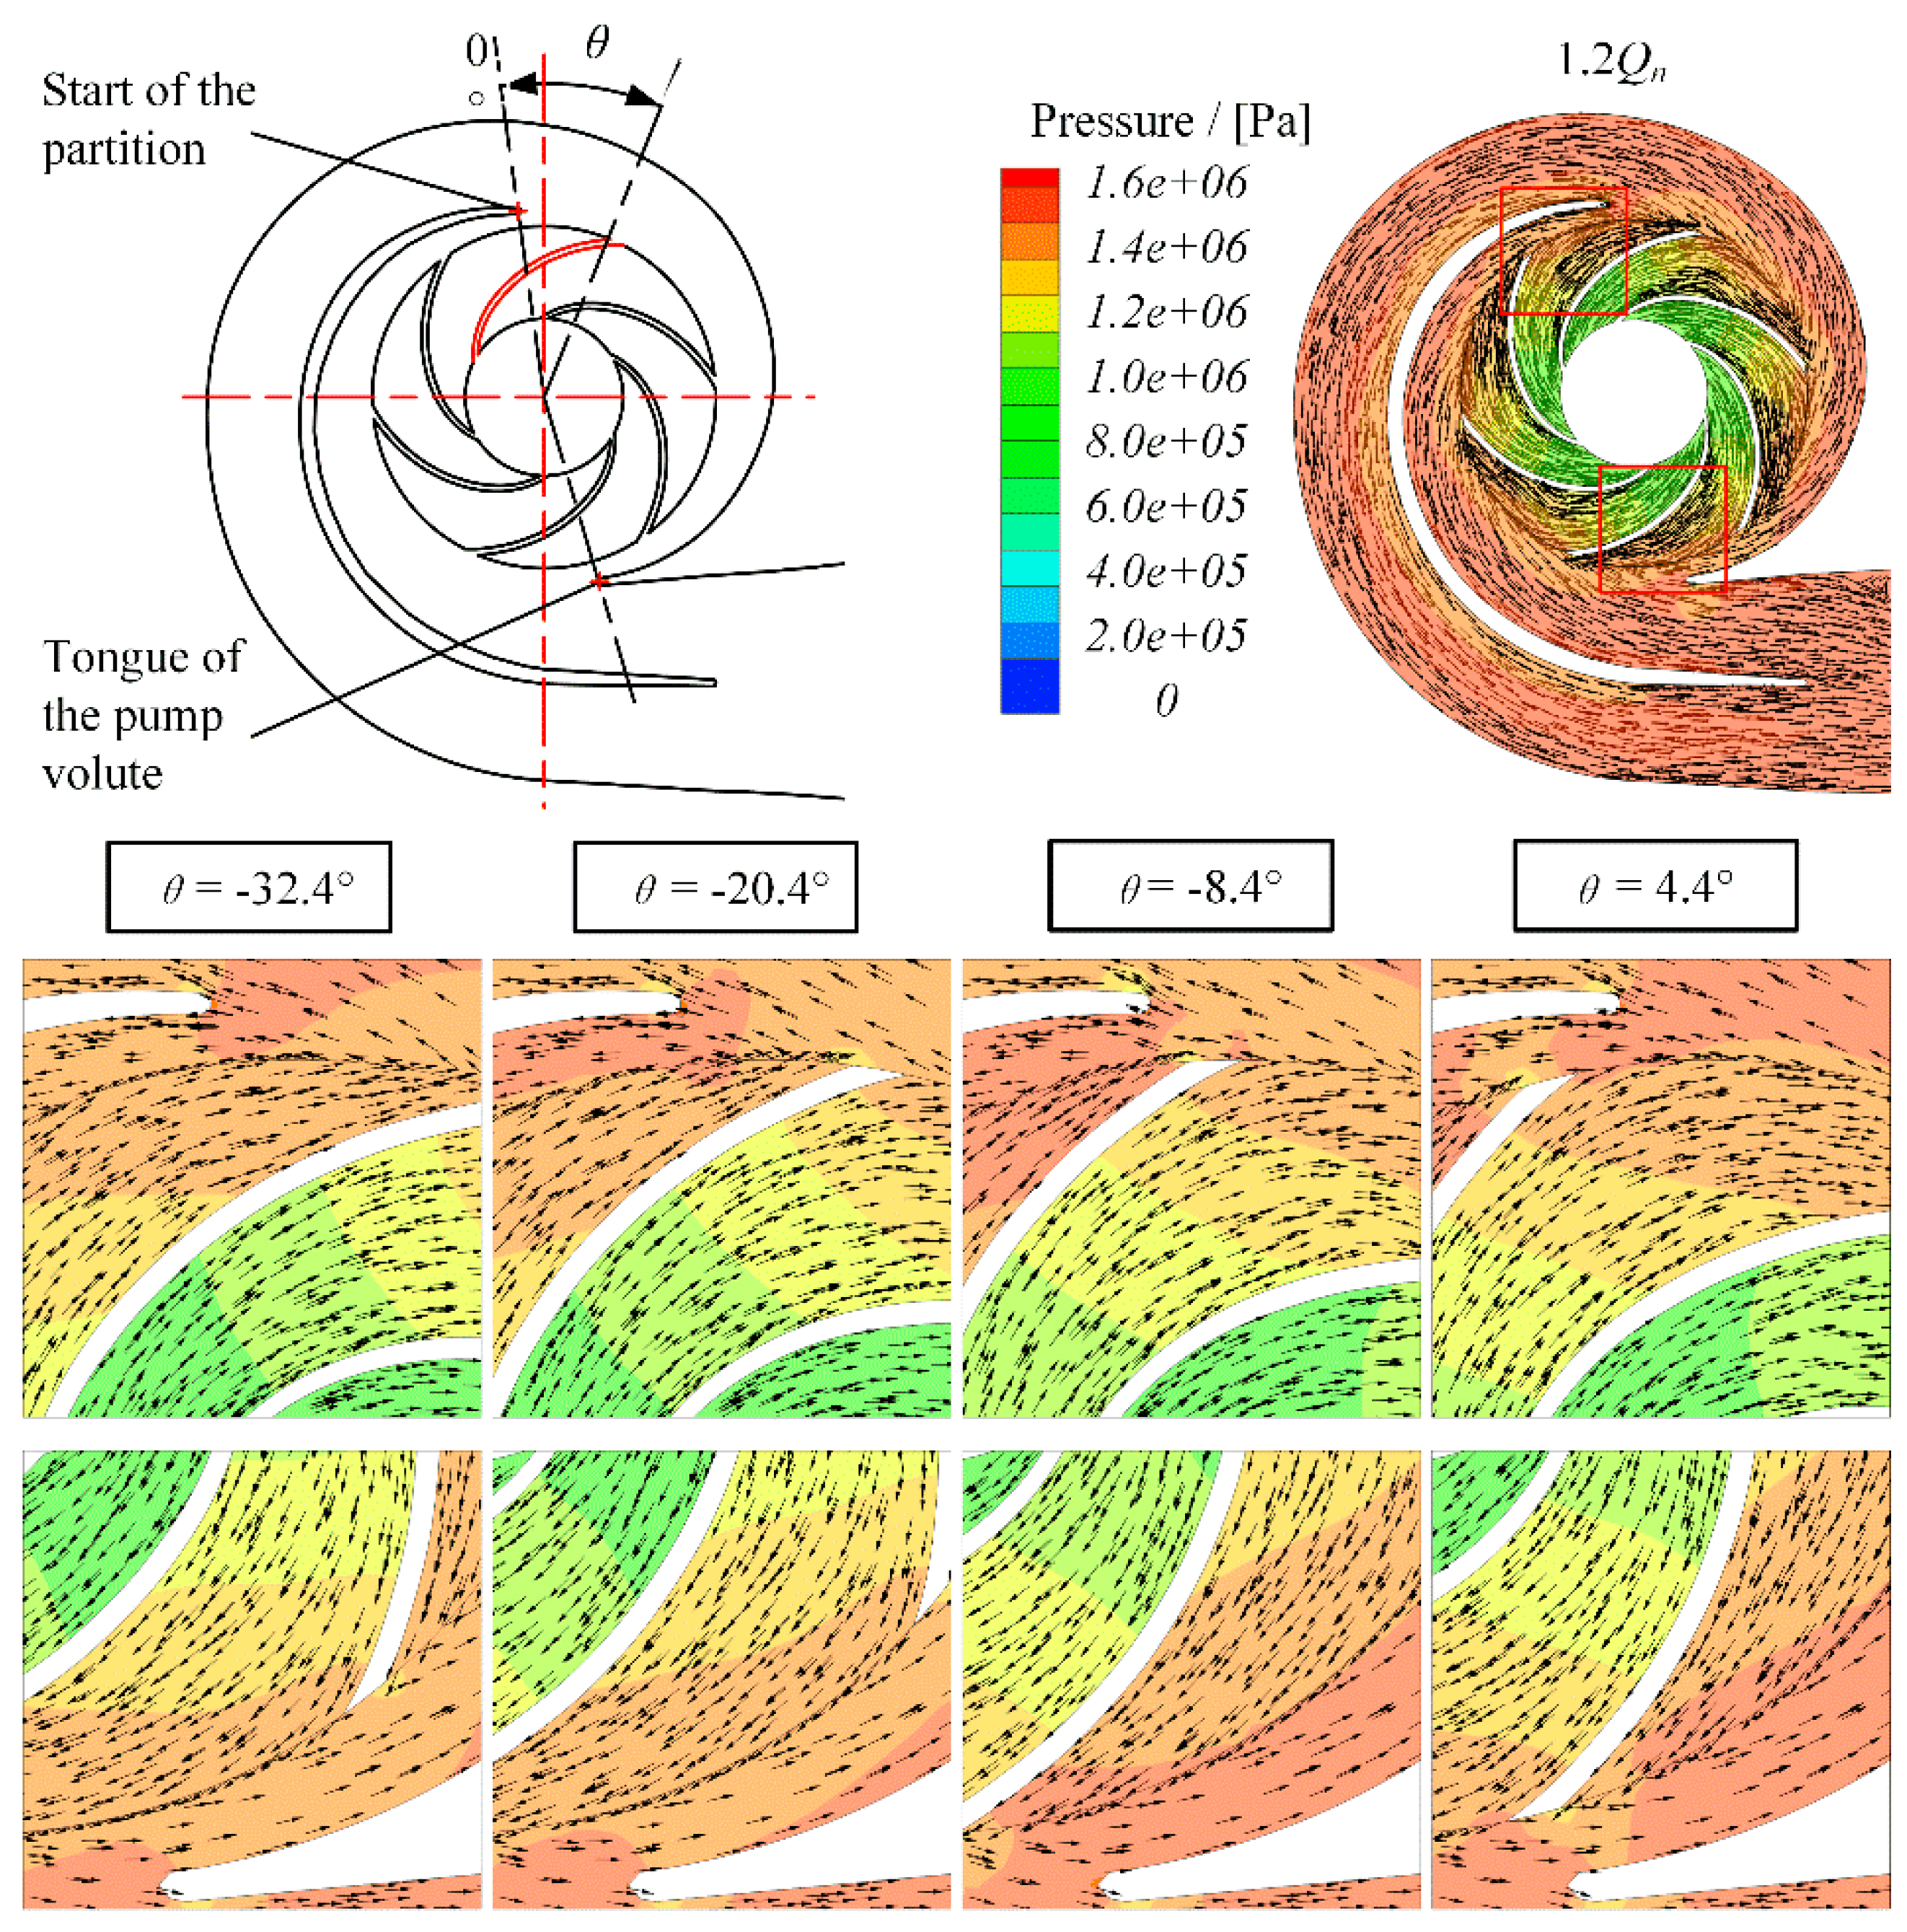
It can be found in Figure 19 that the outflow of the impeller was nonuniform when the blade passed through the tongue and the start of the partition under 0.6Qn. A large size backflow vortex appeared in the blade flow channel. It generated a low-pressure zone between the impeller, volute tongue, and the start of the partition, which made a large pressure difference between the two sides of the tongue and the start of the partition. That is why the pressure at the monitor point P28 dropped suddenly as the blade passed through the tongue and the start of the partition (Figure 17). Affected by the backflow vortex, the radial velocity of the blade was suppressed. Therefore, the fluctuation with the first harmonic of the RF was generated as the blade passed through the tongue and the start of the partition in every rotation period. However, under 1.2Qn, the flow at the impeller outlet was smooth, and the impact of the nonuniform outflow disappeared (Figure 20), which explains the pressure fluctuation performance with the first harmonic of the RF in the second-stage impeller shown in Figure 12.
4. Conclusions
The propagation of the pressure fluctuation in a two-stage double-suction centrifugal pump was studied in this paper by unsteady numerical simulation with the SST k-ω turbulence model. A reasonable and reliable result was obtained by grid convergence and time step analysis. Three main characteristics of the pressure fluctuation in the pump were found.
First, broadband fluctuations with a wide bandwidth were found near the trailing edge of the pressure side in both impellers under part load conditions since prominent vortexes with multiple scales existed in the impeller. The bandwidth of the broadband decreased with the increase of the flow rate, and it was narrower in the second-stage impeller than that in the first-stage impeller.
Second, pressure fluctuation with BPF and its harmonics was found in the suction chamber, both the leading edge and the middle part of the two impellers. The fluctuations at those positions have a high correlation coefficient and a similar variation trend with the flow rate, which means they are closely related to each other. Moreover, there is no phase difference between the monitor points at those positions, indicating that this pressure fluctuation may not be spread by the flow structures.
Third, low frequency fluctuations with the first harmonic of the RF were found in the two impellers near the leading edge, and their amplitudes rose up as the flow rate increased. It was found that the uneven inlet flow velocity near the entrance of the impeller was the main reason for the low frequency fluctuation in the first-stage impeller. For the second-stage impeller, the fluctuation with the first harmonic of the RF was mainly caused by the blade periodically sweeping over the tongue and the start of the partition. Since the two-stage double-suction centrifugal pump is a kind of large-scale pump with a large size in geometry and a large weight in structure, low frequency pressure fluctuations are more dangerous than the other fluctuations. Therefore, serious attention should be payed to avoiding the low frequency pressure fluctuations for a large-scale pump like the two-stage double-suction centrifugal pump studied in this paper.
Author Contributions
Conceptualization, W.Y.; methodology, Z.W.; software, Z.W.; validation, Z.W. and W.Y.; resources, W.Y.; writing, original draft preparation, Z.W.; writing, review and editing, W.Y.; supervision, W.Y. and R.X.; project administration, W.Y.
Funding
The authors would like to acknowledge the financial support given by the National Key Research and Development Plan, Grant Number 2018YFB0606103.
Conflicts of Interest
The authors declare no conflict of interest.
References
- Tatsuji, Y.; Tatsuo, H. Fluctuating Flow behind the Impeller of Centrifugal Pump. Bull. JSME 1979, 22, 1746–1753. [Google Scholar] [CrossRef]
- Raú, B.L.; Blanco, E.; Jorge, P.; Parrondo, J.; González, J. The Effect of Impeller Cutback on the Fluid-Dynamic Fluctuations and Load at the Blade-Passing Frequency in a Centrifugal Pump. J. Fluids Eng. 2008, 130, 1349–1357. [Google Scholar] [CrossRef]
- Parrondo, J.; Pérez, J.; Barrio, R.; González, J. A Simple Acoustic Model to Characterize The Internal Low Frequency Sound Field in Centrifugal Pumps. Appl. Acoust. 2011, 72, 59–64. [Google Scholar] [CrossRef]
- Cooper, P.; Sloteman, D.P.; Graf, E.; Vlaming, D.J. Elimination of Cavitation-Related Instabilities and Damage in High-Energy Pump Impellers. In Proceedings of the eighth International Pump Users Symposium, Houston, TX, USA, 5–7 March 1991; pp. 3–19. [Google Scholar]
- Luo, X.W.; Bin, J.; Tsujimoto, Y. A Review of Cavitation in Hydraulic Machinery. J. Hydrodyn. B 2016, 28, 335–358. [Google Scholar] [CrossRef]
- Guelich, J.F.; Bolleter, U. Pressure Fluctuations in Centrifugal Pumps. J. Vib. Acoust. 1992, 114, 272–279. [Google Scholar] [CrossRef]
- Yao, Z.F.; Wang, F.J.; Qu, L.X.; Xiao, R. Experimental Investigation of Time-Frequency Characteristics of Pressure Fluctuations in a Double-Suction Centrifugal Pump. J. Fluids Eng. 2011, 133, 1076–1081. [Google Scholar] [CrossRef]
- Guo, S.; Maruta, Y. Experimental Investigations on Pressure Fluctuations and Vibration of the Impeller in a Centrifugal Pump with Vaned Diffusers. JSME Int. J. Ser. B 2005, 48, 136–143. [Google Scholar] [CrossRef] [Green Version]
- Spence, R.; Joao, A.T. Investigation into Pressure Pulsations in a Centrifugal Pump Using Numerical Methods Supported by Industrial Tests. Comput. Fluids 2008, 37, 690–704. [Google Scholar] [CrossRef]
- Spence, R.; Joao, A.T. A CFD Parametric Study of Geometrical Variations on the Pressure Pulsations and Performance Characteristics of a Centrifugal Pump. Comput. Fluids 2009, 38, 1243–1257. [Google Scholar] [CrossRef]
- Li, C.; Wang, F.; Xu, J.; Li, R.; Wang, J. Pressure Fluctuation of a Two-Stage Double-Suction Centrifugal Pump. Trans. Chin. Soc. Agric. Mach. 2011, 42, 41–49. [Google Scholar]
- Ye, C.; Wang, F.; Li, H.; Li, Z. Pressure Fluctuation Characteristics in Inter-Stage Flow Channel of Double-Inlet Two-Stage Double-Suction Centrifugal Pump. Trans. Chin. Soc. Agric. Mach. 2017, 48, 126–134. [Google Scholar]
- González, J.; FernáNdez, J.; Blanco, E.; Santolaria, C. Numerical Simulation of the Dynamic Effects due to Impeller-Volute Interaction in a Centrifugal Pump. J. Fluids Eng. 2002, 124, 348–355. [Google Scholar] [CrossRef]
- Nagahara, T.; Inoue, Y.; Sato, T.; Sakata, S. Investigation of the Flow Field in a Multistage Pump by Using LES. In Proceedings of the ASME 2005 Fluids Engineering Division Summer Meeting, Houston, TX, USA, 19–23 June 2005; pp. 1321–1329. [Google Scholar] [CrossRef]
- Menter, F.R. Two-Equation Eddy-Viscosity Turbulence Models for Engineering Applications. AIAA Stud. J. 2012, 32, 1598–1605. [Google Scholar] [CrossRef]
- Liu, J.; Liu, S.; Wu, Y.; Jiao, L. Numerical Investigation of the Hump Characteristics of a Pump-Turbine Based on an Improved Cavitation Model. Comput. Fluids 2012, 68, 105–111. [Google Scholar] [CrossRef]
- Li, D.; Wang, H.; Xiang, G.; Gong, R.; Wei, X.; Liu, Z. Unsteady Simulation and Analysis for Hump Characteristics of a Pump-Turbine Model. Renew. Energy 2015, 77, 32–42. [Google Scholar] [CrossRef]
- Gülich, J.F. Centrifugal Pumps, 2th ed.; Springer: Berlin/Heidelberg, Germany; London, UK, 2010; ISBN 978-3-642-12823-3. [Google Scholar]
- Menter, F.R.; Kuntz, M.; Langtry, R. Ten Years of Industrial Experience with the SST Turbulence Model. Int. J. Heat Mass Transf. 2003, 4, 625–632. [Google Scholar]
- Celik, I.; Ghia, U.; Roache, P.J.; Freitas, C.J. Procedure of Estimation and Reporting of Uncertainty Due to Discretization in CFD Applications. J. Fluids Eng. 2008, 130, 078001. [Google Scholar] [CrossRef]
- Richardson, L.F. The Approximate Arithmetical Solution by Finite Differences of Physical Problems Involving Differential Equations, with an Application to the Stresses in a Masonry Dam. Philos. Trans. R. Soc. Lond. A 1911, 210, 307–357. [Google Scholar] [CrossRef] [Green Version]
- Roache, P.J. Quantification of Uncertainty in Computational Fluid Dynamics. Annu. Rev. Fluid Mech. 1997, 29, 123–160. [Google Scholar] [CrossRef]
- Roache, P.J. Verification and Validation in Computational Sciencend Engineering; Hermosa Pub: Sierra County, NM, USA, 1998. [Google Scholar] [CrossRef]
- Ye, C.; Wang, F.; Li, H.; Li, Z.; Song, Q. Investigation on the Clocking Effect of a Double-Entry Two-Stage Double Suction Centrifugal Pump with High Head. J. Hydraul. Eng. 2018, 49, 858–868. [Google Scholar] [CrossRef]
Figure 1.
Cross-section view of the two-stage double-suction centrifugal pump.

Figure 2.
Simulation domain and boundary conditions of the two-stage double-suction centrifugal pump.
Figure 2.
Simulation domain and boundary conditions of the two-stage double-suction centrifugal pump.

Figure 3.
Monitor points on the suction chamber.

Figure 4.
Monitor points on the inter-stage flow channel.

Figure 5.
Monitor points on the volute.

Figure 6.
Monitor points on the impeller. The positions are the same on both the first-stage impeller and second-stage impeller.
Figure 6.
Monitor points on the impeller. The positions are the same on both the first-stage impeller and second-stage impeller.

Figure 7.
Grid convergence analysis. (a) Fine grid convergence index; (b) extrapolated value compared with the result of the fine grid.
Figure 7.
Grid convergence analysis. (a) Fine grid convergence index; (b) extrapolated value compared with the result of the fine grid.

Figure 8.
Final grid resolution.

Figure 9.
Simulated pump performance compared with experimental result [24].
Figure 9.
Simulated pump performance compared with experimental result [24].

Figure 10.
Pressure coefficient distribution with three different time steps at Monitor Point F1: (a) time domain distribution; (b) frequency domain distribution.
Figure 10.
Pressure coefficient distribution with three different time steps at Monitor Point F1: (a) time domain distribution; (b) frequency domain distribution.

Figure 11.
Pressure coefficient distributions in the frequency domain at different monitor points under four typical flow rates of the two-stage double-suction centrifugal pump.
Figure 11.
Pressure coefficient distributions in the frequency domain at different monitor points under four typical flow rates of the two-stage double-suction centrifugal pump.

Figure 12.
The pressure fluctuation amplitude distribution at the Blade Passing Frequency (BPF) (75 Hz), the first harmonic of BPF (150 Hz), and the first harmonic of Rotation Frequency (RF) (25 Hz) along the flow direction in each part of the two-stage double-suction centrifugal pump under four typical flow rates.

Figure 13.
Comparison of the time domain pressure distribution, frequency domain characteristic, and the coherence of Monitor Point I1 at the suction chamber and the monitor point P11 at the leading edge of the first-stage impeller under four typical flow rates.
Figure 13.
Comparison of the time domain pressure distribution, frequency domain characteristic, and the coherence of Monitor Point I1 at the suction chamber and the monitor point P11 at the leading edge of the first-stage impeller under four typical flow rates.

Figure 14.
Velocity distributions at the first-stage impeller and the second-stage impeller inlet under four typical flow rates: (a) velocity distribution at the first-stage impeller inlet; (b) velocity distribution at the second-stage impeller inlet.
Figure 14.
Velocity distributions at the first-stage impeller and the second-stage impeller inlet under four typical flow rates: (a) velocity distribution at the first-stage impeller inlet; (b) velocity distribution at the second-stage impeller inlet.

Figure 15.
Pressure fluctuation distribution in the frequency domain at Monitor Point P11 in the first-stage impeller and Monitor Point P21 in the second-stage impeller under four typical flow rates.
Figure 15.
Pressure fluctuation distribution in the frequency domain at Monitor Point P11 in the first-stage impeller and Monitor Point P21 in the second-stage impeller under four typical flow rates.
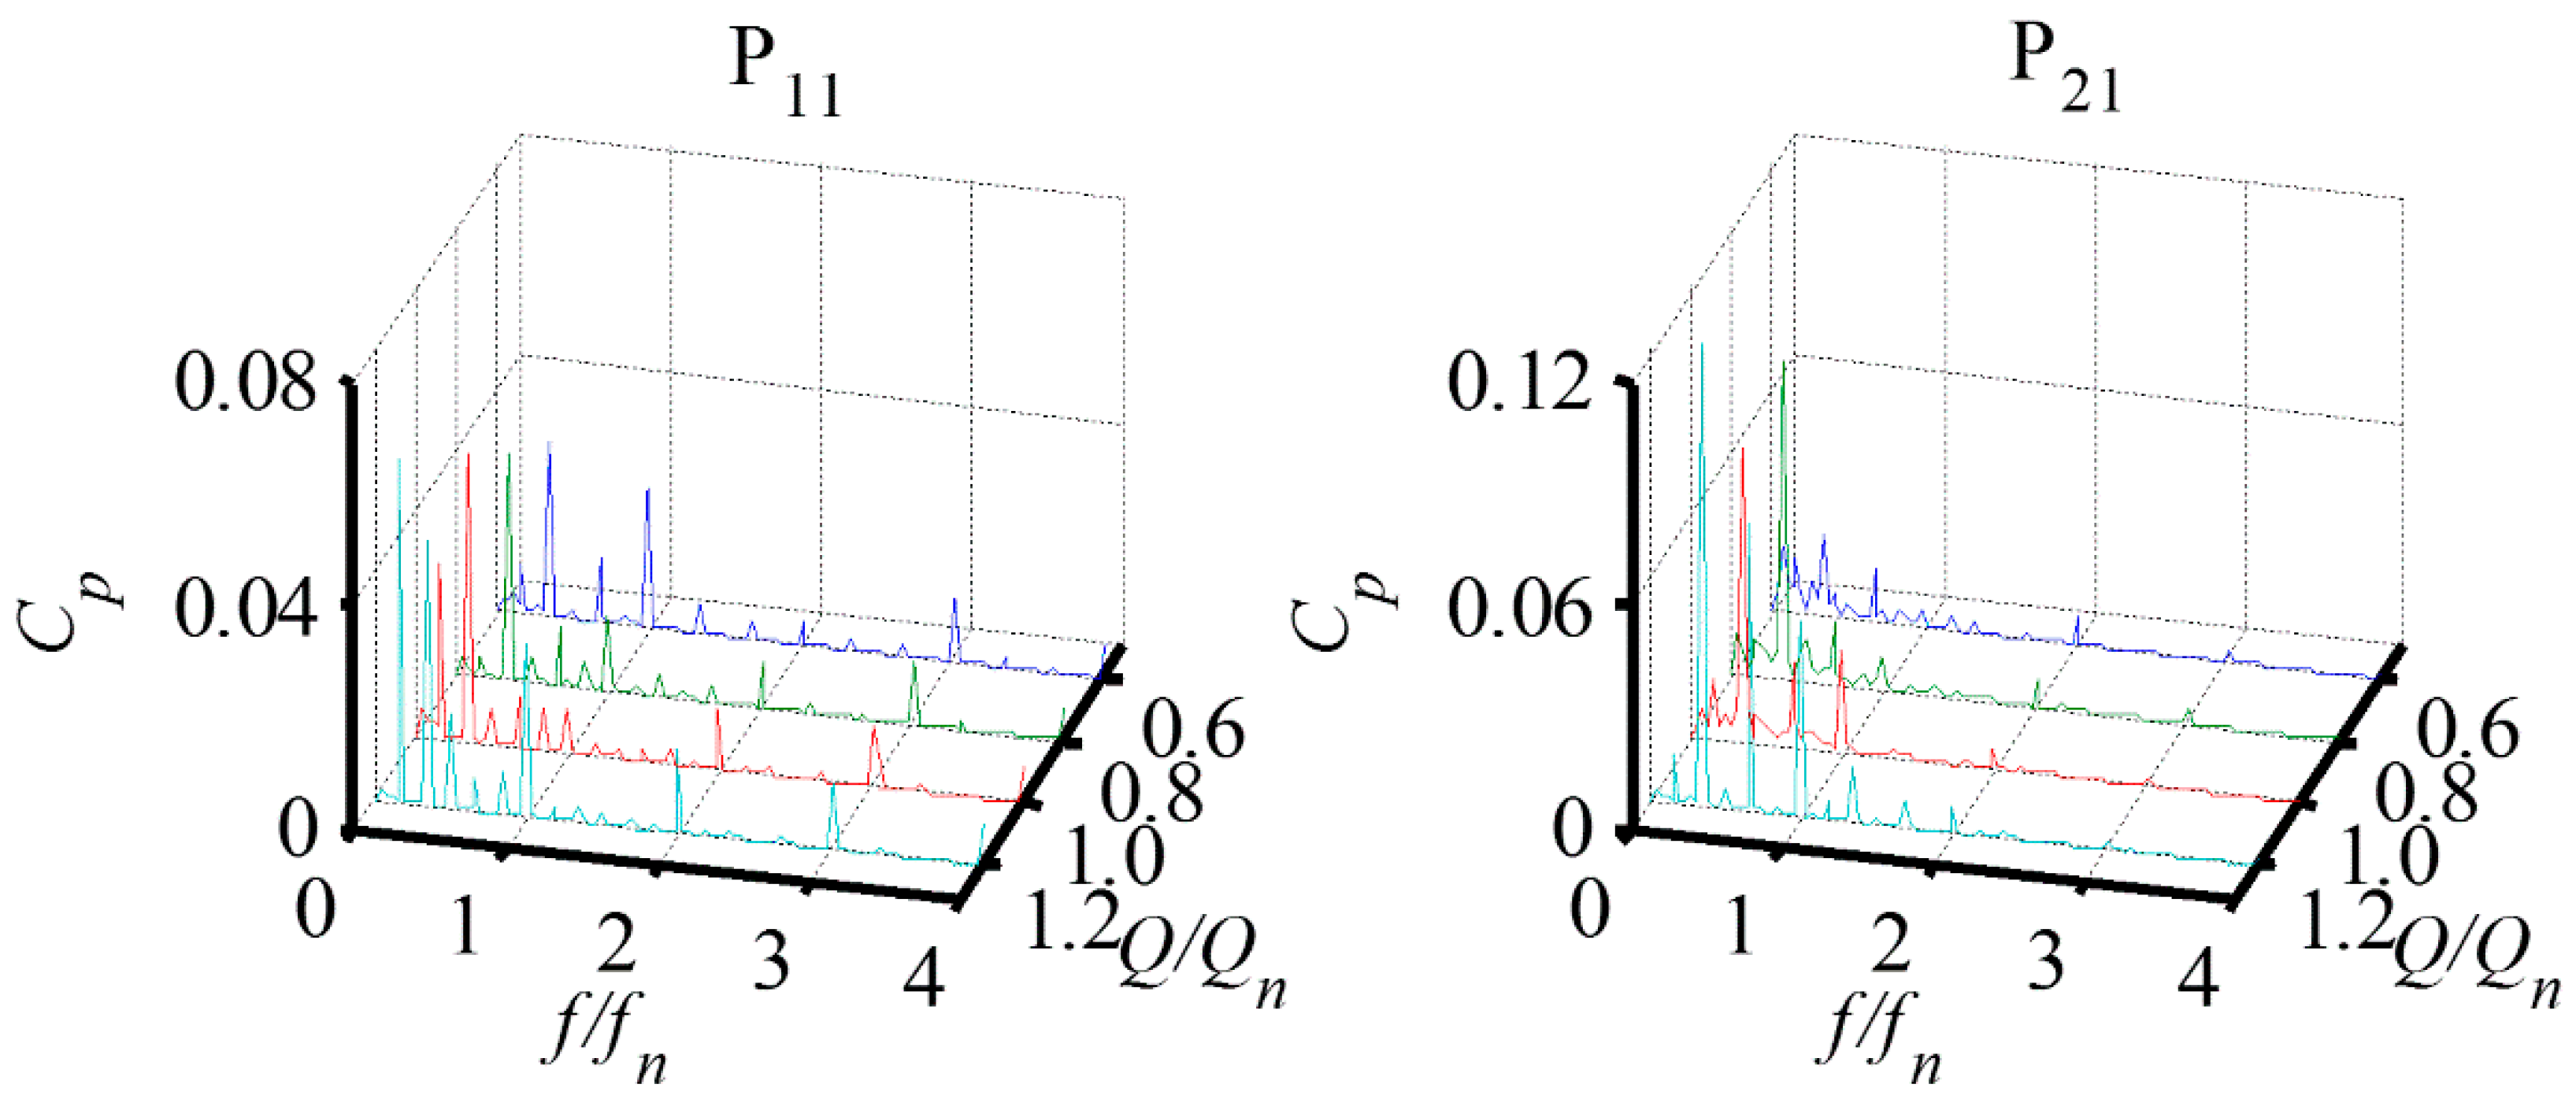
Figure 16.
Pressure fluctuation at the trailing edge of both the first-stage impeller (P17~P19) and the second-stage impeller (P27~P29) under four typical flow rates. The red dot indicates the pressure amplitude at 25 Hz.
Figure 16.
Pressure fluctuation at the trailing edge of both the first-stage impeller (P17~P19) and the second-stage impeller (P27~P29) under four typical flow rates. The red dot indicates the pressure amplitude at 25 Hz.
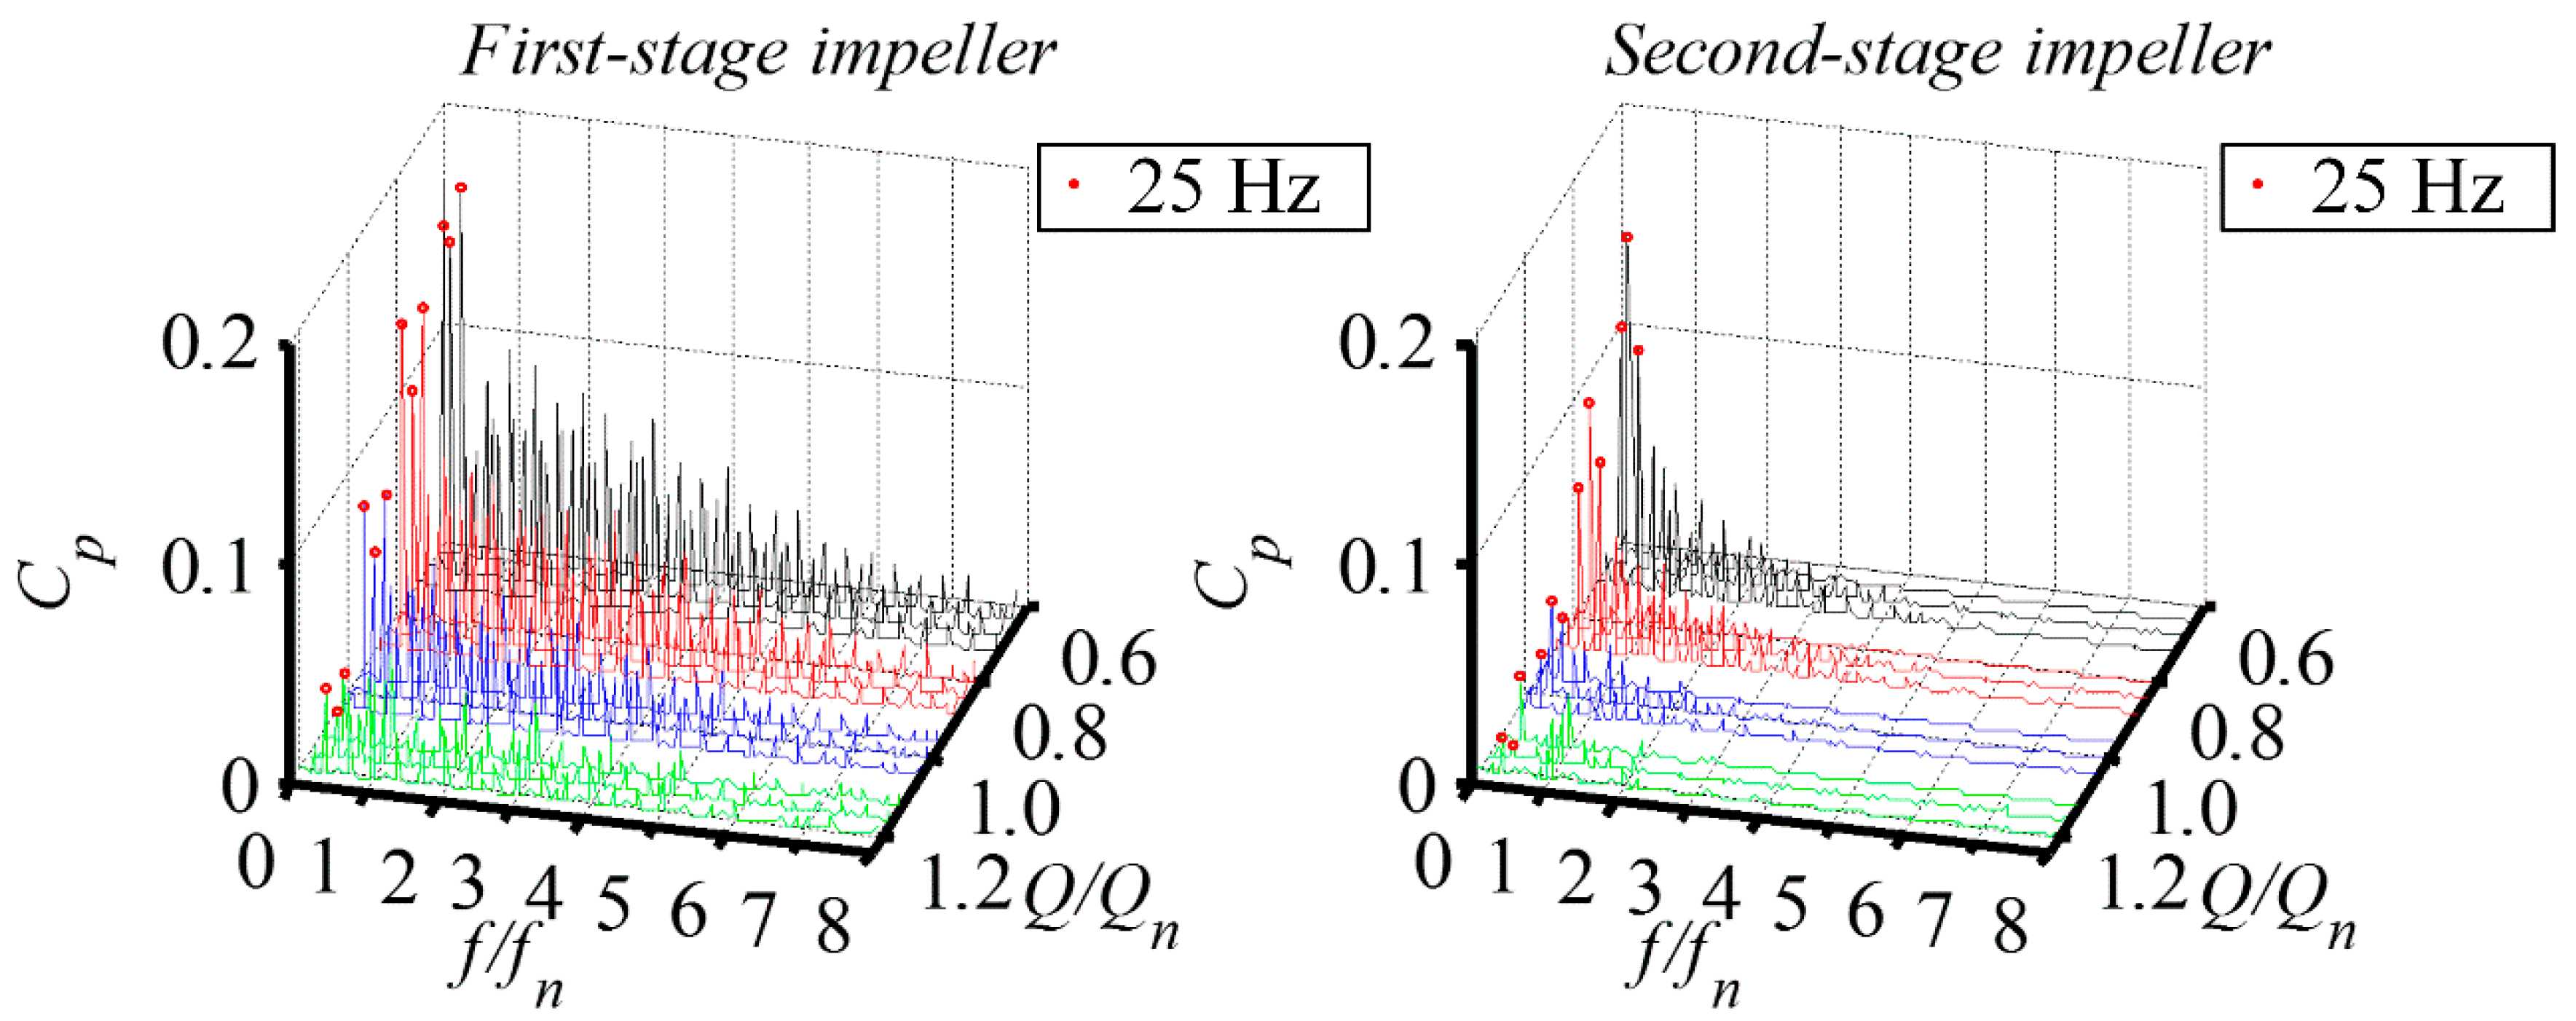
Figure 17.
Comparison of the pressure distribution and radial velocity at the trailing edge of the second-stage impeller (Monitor Point P28) under 0.6Qn and 1.2Qn. The red dashed line indicates the moment when the blade passes through the tongue and the start of the partition.
Figure 17.
Comparison of the pressure distribution and radial velocity at the trailing edge of the second-stage impeller (Monitor Point P28) under 0.6Qn and 1.2Qn. The red dashed line indicates the moment when the blade passes through the tongue and the start of the partition.
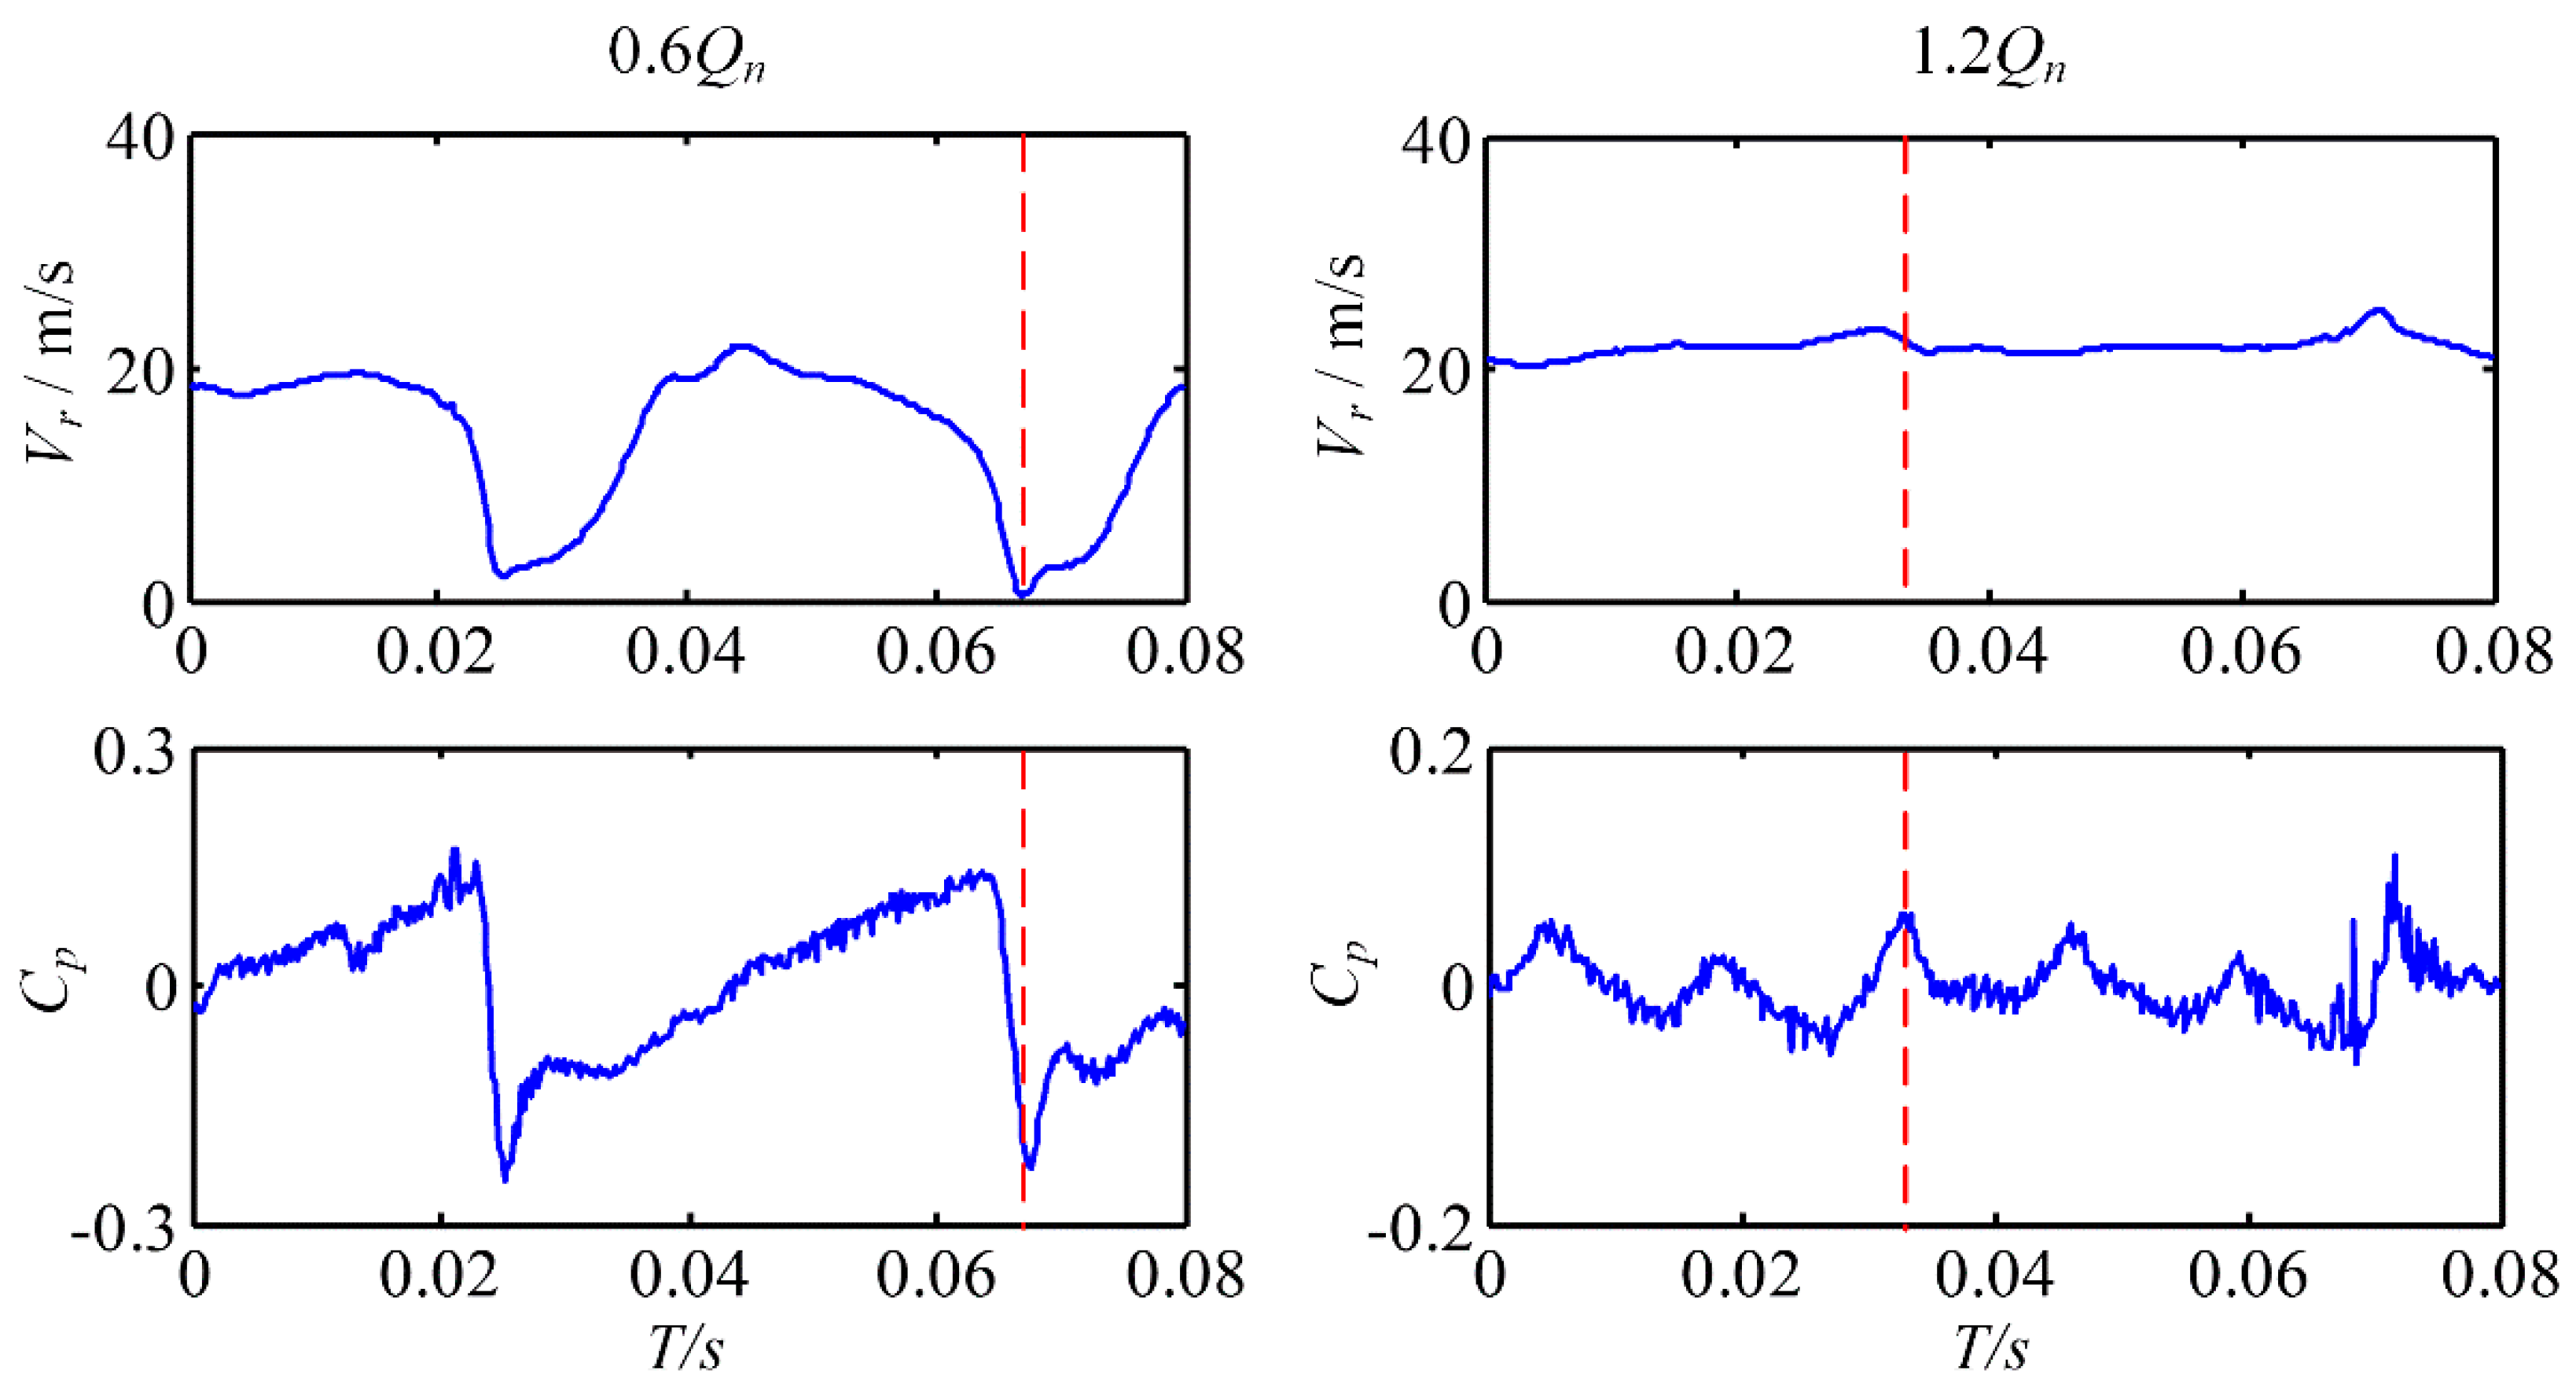
Figure 18.
Isosurface of the Q distribution (colored by pressure) in the second-stage impeller and the volute at the moment indicated by the red lines in Figure 17. The black dashed line indicates the position of the impeller outlet. (a) 0.6Qn; (b) 1.2Qn.
Figure 18.
Isosurface of the Q distribution (colored by pressure) in the second-stage impeller and the volute at the moment indicated by the red lines in Figure 17. The black dashed line indicates the position of the impeller outlet. (a) 0.6Qn; (b) 1.2Qn.
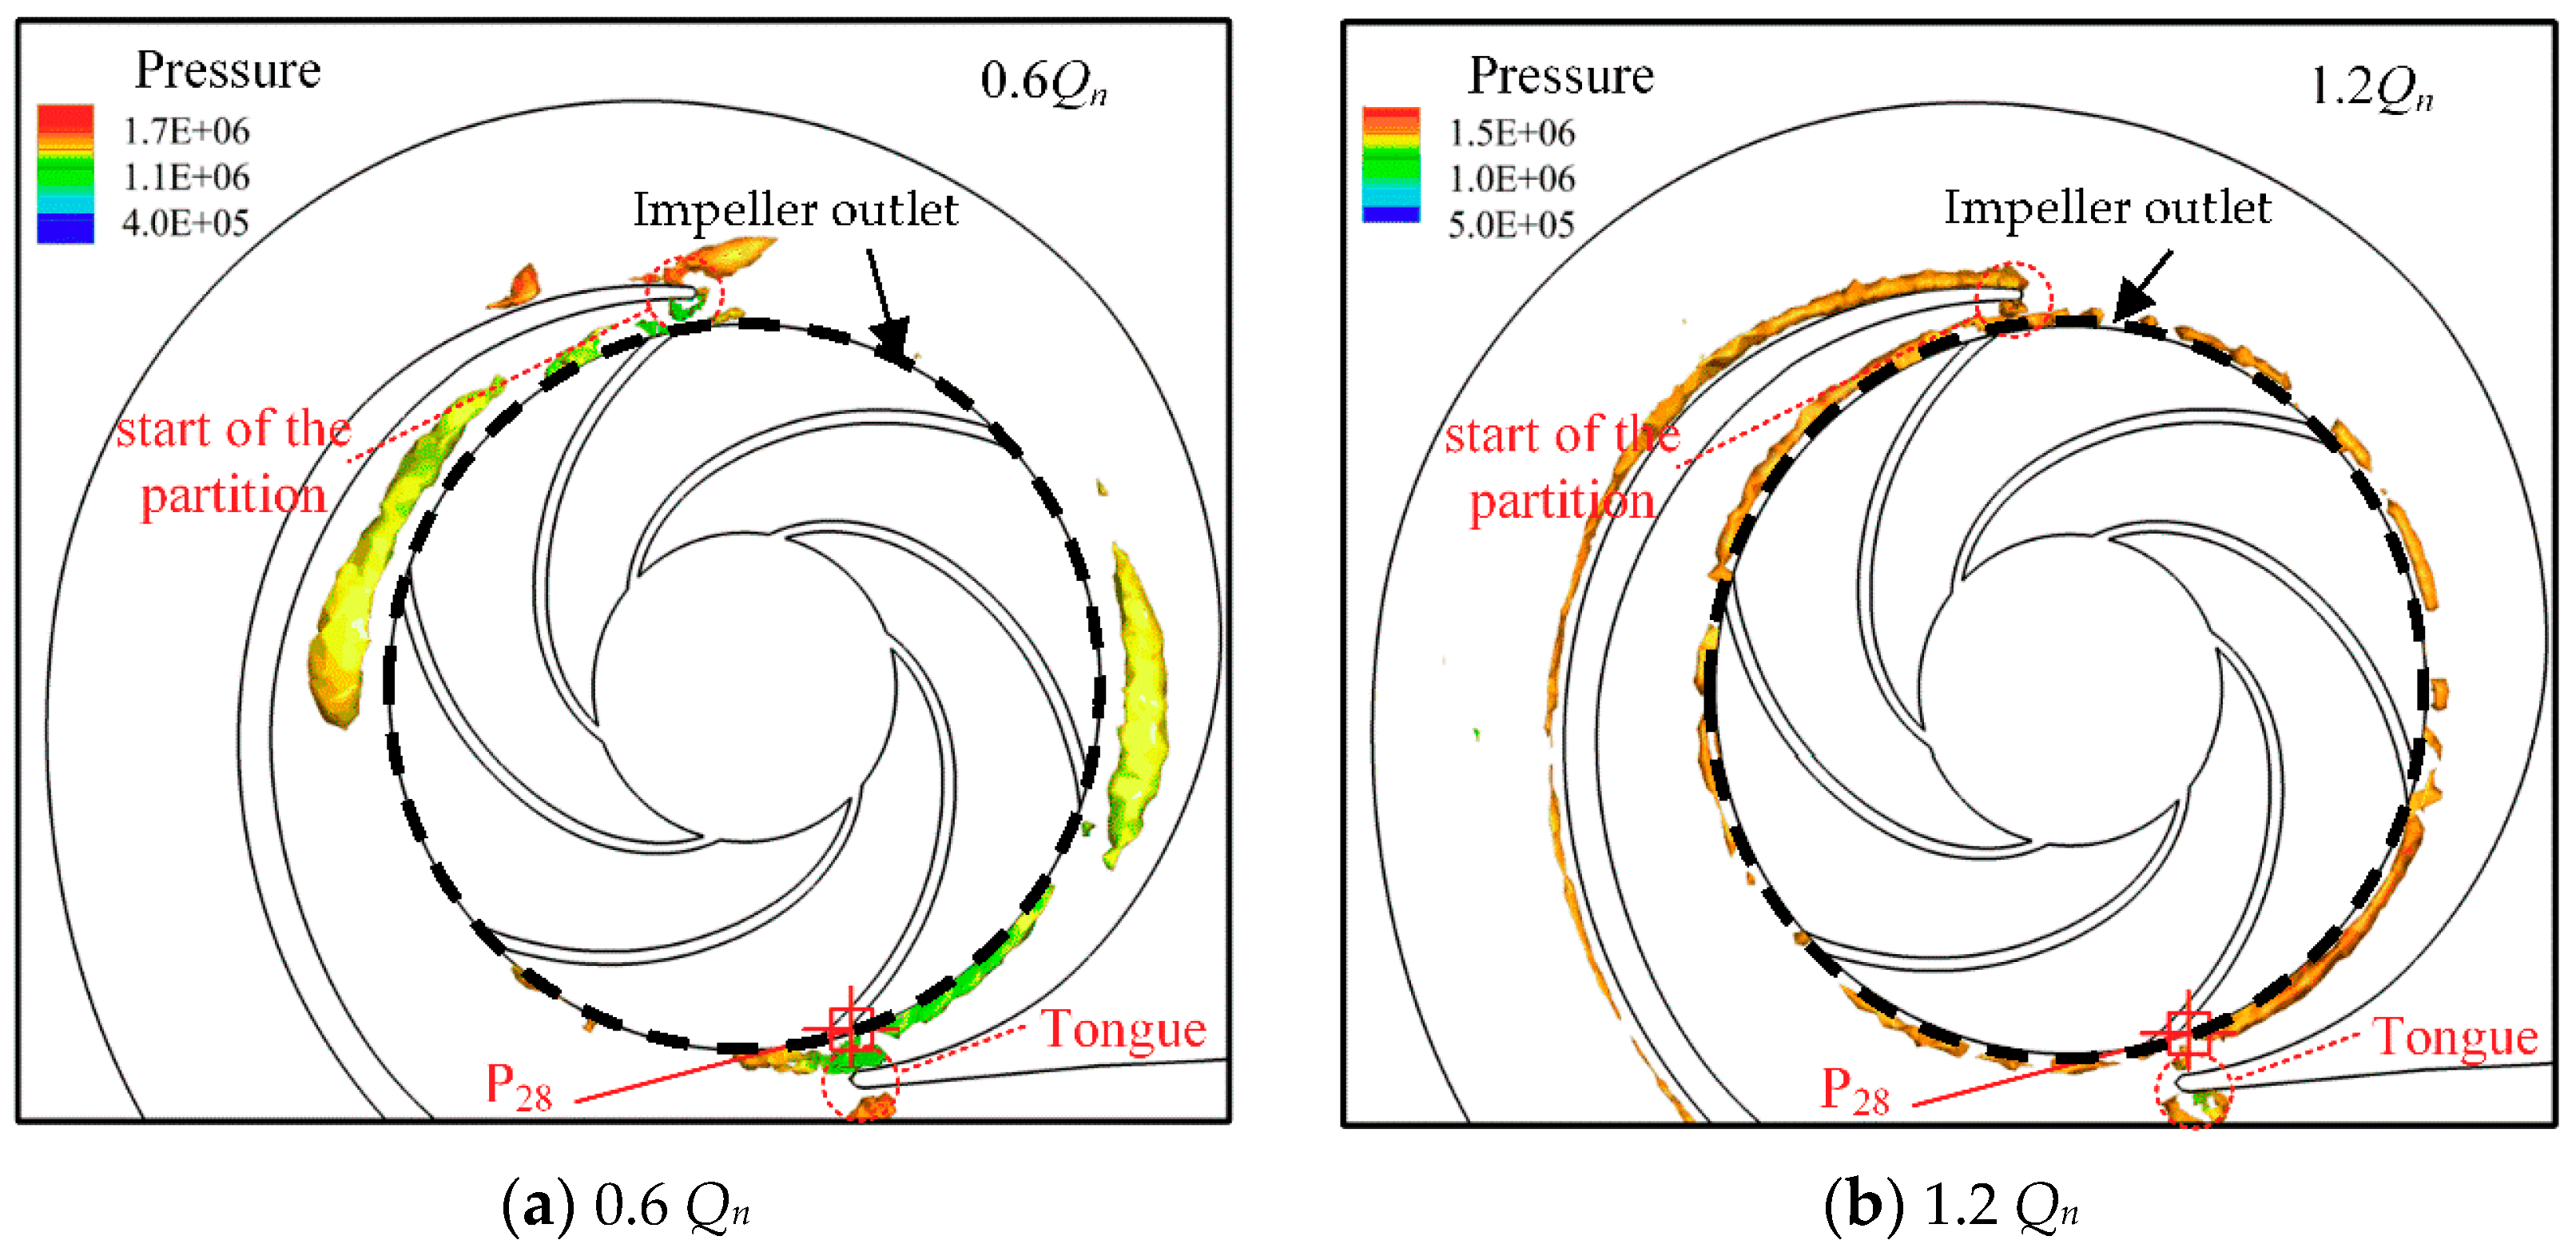
Figure 19.
Velocity vector and pressure distribution near the volute tongue and the start of the partition in the second-stage impeller under the 0.6Qn condition.
Figure 19.
Velocity vector and pressure distribution near the volute tongue and the start of the partition in the second-stage impeller under the 0.6Qn condition.

Figure 20.
Velocity vector and pressure distribution near the volute tongue and the start of the partition in the second-stage impeller under the 1.2Qn condition.
Figure 20.
Velocity vector and pressure distribution near the volute tongue and the start of the partition in the second-stage impeller under the 1.2Qn condition.


Table 1.
The y plus value of the different components in the pump.
| y Plus | Suction Chamber | First-Stage Impeller | Inter-Stage Flow Channel | Second-Stage Impeller | Volute |
|---|---|---|---|---|---|
| Averaged | 21.16 | 38.74 | 55.99 | 49.70 | 73.15 |
| Maximum | 57.00 | 110.34 | 221.79 | 111.31 | 162.53 |
© 2019 by the authors. Licensee MDPI, Basel, Switzerland. This article is an open access article distributed under the terms and conditions of the Creative Commons Attribution (CC BY) license (http://creativecommons.org/licenses/by/4.0/).
Share and Cite
MDPI and ACS Style
Wei, Z.; Yang, W.; Xiao, R. Pressure Fluctuation and Flow Characteristics in a Two-Stage Double-Suction Centrifugal Pump. Symmetry 2019, 11, 65. https://doi.org/10.3390/sym11010065
AMA Style
Wei Z, Yang W, Xiao R. Pressure Fluctuation and Flow Characteristics in a Two-Stage Double-Suction Centrifugal Pump. Symmetry. 2019; 11(1):65. https://doi.org/10.3390/sym11010065
Chicago/Turabian StyleWei, Zhicong, Wei Yang, and Ruofu Xiao. 2019. "Pressure Fluctuation and Flow Characteristics in a Two-Stage Double-Suction Centrifugal Pump" Symmetry 11, no. 1: 65. https://doi.org/10.3390/sym11010065
Note that from the first issue of 2016, this journal uses article numbers instead of page numbers. See further details here.