Analytical Model of a Multi-Step Straightening Process for Linear Guideways Considering Neutral Axis Deviation


1
School of Mechanical and Electronic Engineering, Wuhan University of Technology, Wuhan 430070, China
2
Department of Mechanical Engineering, School of Engineering, University of Birmingham, Birmingham B15 2TT, UK
*
Author to whom correspondence should be addressed.
Symmetry 2018, 10(8), 316; https://doi.org/10.3390/sym10080316
Submission received: 5 July 2018
/
Revised: 18 July 2018
/
Accepted: 20 July 2018
/
Published: 1 August 2018
Abstract
:The cross-sectional shape of a linear guideway has been processed before the straightening process. The cross-section features influence not only the position of the neutral axis, but also the applied and residual stresses along the longitudinal direction, especially in a multi-step straightening process. This paper aims to present an analytical model based on elasto-plastic theory and three-point reverse bending theory to predict straightening stroke and longitudinal stress distribution during the multi-step straightening process of linear guideways. The deviation of the neutral axis is first analyzed considering the asymmetrical features of the cross-section. Owing to the cyclic loading during the multi-step straightening process, the longitudinal stress curves are then calculated using the linear superposition of stresses. Based on the cross-section features and the superposition of stresses, the bending moment is corrected to improve the predictive accuracy of the multi-step straightening process. Finite element analysis, as well as straightening experiments, have been performed to verify the applicability of the analytical model. The proposed approach can be implemented in the multi-step straightening process of linear guideways with similar cross-sectional shape to improve the straightening accuracy.
1. Introduction
With the rapid development of the automation industry, linear transmission parts will increasingly focus on the growing demands for straightness accuracy. The cold-straightening process for rolling bars has a wide range of applications including linear transmission automation, steel structure industry, and military industry. It mainly consists of rough and precise straightening processes according to various stages in the whole machining process. The straightening efficiency is largely dependent upon the predictive accuracy of straightening stroke.
In the existing research of precise straightening, predictive models are mainly focused on the single straightening process, which is based on the assumption that the straightness of a workpiece can meet the requirement through a one-step straightening process [1,2,3,4]. The theoretical modelling approaches of the cold-straightening process include the following three aspects: bending models based on straightening curvature, bending models based on load and deflection, and analytical models based on elasto-plastic theory [5,6,7]. The theories of predictive models are comprehensive and relatively mature, but the complex interaction between different procedures has not been considered in multi-step straightening processes, which limits the improvement of straightening accuracy. The straightening process is actually continuous and it is a multi-step deformation process based on the classical elasto-plastic theory. The residual stress generated by the previous straightening process would influence the loading stress of the following process due to stress superposition, and the straightening properties of workpiece are also influenced [8,9]. Therefore, it is imperative to establish a more accurate predictive model of straightening stroke considering the stress superposition of different straightening procedures.
According to the plane assumption during bending process, there is a fiber layer along longitudinal direction keeping constant length during the bending process, and this fiber layer is defined as a neutral surface. In the precise straightening process, the linear guideway obtains the entire part features that will have a direct influence on the position of the neutral axis. The distributions of residual stress and loading stress are also varied, especially when the bending directions are opposite between the sequential straightening procedures [10].
Many analytical models have been established to predict the straightening stroke based on different mathematical approaches. Tsai et al. [11,12] established a load-deflection model to predict straightening stroke of the uniformly loaded, rectangular cross-section, cantilever beam. Based on the proposed model, the bending curves of workpieces with different load schemes were obtained. Kazan et al. [13] predicted the springback of sheet metal by artificial neural network and finite element method, considering the factors such as sheet thickness, tooling geometry, lubrication conditions, and material properties. Panthi et al. [14] proposed a total-elastic-incremental-plastic algorithm for large deformation and large rotational problems of sheet metal considering process parameters. Baseri et al. [15] established a fuzzy learning back-propagation algorithm to predict springback of V-die bending process. Based on the bending springback equation of the symmetrical section curved beam, a multi-roller straightening analytical model of H-beams was developed by Yin et al. [16], and Kato et al. [17] was mainly focused on the analysis of elasto-plastic theories of round bars and a simple three-point bending model was applied in actual operation. However, all the predictive models were established by simplifying irregular cross-sections as a rectangular shape, and the offset of neutral surface caused by the entire features of parts was also neglected.
In addition, there are different experimental methods for measuring the residual stresses in various materials. The measurement of residual stresses is mainly realized by destructive, semi-destructive, and non-destructive techniques. Based on a general classification, the measurement methods can be categorized as mechanical, optical, diffraction, and stress-relevant property methods [18]. Among these methods for measuring the residual stresses, the mechanical method by strain gauges is the most common one for measurement of residual stresses in stress analysis [19]. Non-destructive methods used by various researchers have been developed over the years for the measurement of residual stresses. X-ray diffraction method has been applied in the strain measurement of lattice parameter changes at the surface of the workpiece [20]. Compared with X-rays, neutrons diffraction method can penetrate the material more easily, which also makes the measurement of residual stresses further into the surface. A radioactive source is required for the neutron diffraction method, which makes it expensive and time consuming. Therefore, there are many complexities and difficulties in the application of non-destructive techniques for the measurement of residual stresses [21]. All these experimental methods can offer information of stress distribution on the surface of workpiece.
In this investigation, an analytical straightening model is proposed to predict straightening stroke and longitudinal stress distribution with respect to the multi-step straightening process of linear guideways. In addition, the multi-step straightening process of linear guideways is simplified as two steps in this paper. The straightening process can be recognized as an elasto-plastic deformation process, which is mainly influenced by geometrical parameters and material properties. To improve predictive accuracy of straightening process, the variance of neutral surface and superposition of residual stress are also considered in the analytical straightening model. Finally, the proposed model has been applied to LG series linear guideways and straightening machine ROSE-JZ50 (122 Luoshi Road, School of Mechanical and Electronic Engineering, Wuhan University of Technology, Wuhan, 430070, China).
2. Straightening System of Linear Guideway
2.1. Straightening Principle
The straightening machine for the linear guideways used for precise straightening was designed by following the three-point pressure straightening principle. As the deflection curve of the linear guideway is assumed as a single-arc shape, the straightening precision was determined by supporting distance, straightening stoke, and the measurement accuracy of deflection. The layout of the straightening machine with respect to the linear guideways is shown in Figure 1. The straightening machine consists of a horizontal frame in which the indenter for loading and two clamps for supporting are horizontally fixed on opposite sides. The roller conveyers were symmetrically placed on both sides of the worktable to finish the conveying process of the workpiece. The distance between two clamps can be adjusted by the span adjusting mechanism to adapt the length of the workpiece. The stroke of indenter generated by slider-crank mechanism is then calculated to realize the reciprocating motion for loading and unloading. The straightening indenter library is also established to meet demands of straightening process for linear guideways with different cross-section parameters.
During the straightening process, the linear guideway is horizontally placed with the two symmetrical supports (clamps), and the concentrated load is applied by the indenter until the desired straightness accuracy meets the requirements. The initial deflection of the workpiece is measured as , and the deflection of plastic deformation can be calculated as according to the elasto-plastic theory. If the residual deflection meets , where represents the standard of straightness, the workpiece is satisfied with the straightness requirement and the straightening process is finished.
2.2. Geometrical and Material Models
In traditional prediction method of straightening stroke, the cross-section of the linear guideway is generally simplified as a rectangle with two-dimensional axisymmetric coordinates. As a result of its symmetrical features, the straightening process can be regarded as a multiple bending processes. On basis of the plane assumption during bending process, there is always a fiber layer that does not vary during the straightening process. Besides, the neutral surface would coincide with the geometrical center layer. The position of neutral surface is determined by the geometrical model of the cross-section and the real strain-stress curve in tension and compression. Since the asymmetrical geometry model is adopted based on the entire part features of a linear guideway in this straightening process, the neutral surface is not always constant in the whole elasto-plastic bending process.
The cross-section parameters with respect to the linear guideways for grinding, milling and drilling machine (LG series) are shown in Figure 2, in which H is the height of the cross section and B is the width. The positions of the neutral axis and neutral surface generate deviation compared with the ideal rectangular section because of the asymmetrical geometry model. This deviation changes not only the geometrical characteristic of the cross-section, but also stresses distribution and external moment. The straightening process for the linear guideway with the entire part features is also based on the basic assumptions for bending processes, so it still has the longitudinal symmetry plane.
According to the basic assumptions for bending processes, the position of the neutral axis is determined by the conditions that the inner axial force caused by the bending moment is equal to zero on the cross-section [22]. The static equation can be expressed as:
where is normal stress and represents a small area on the cross-section.
In the straightening process, the plastic area continuously extends with the increasing of the external load. When the bending reaches limit condition, the normal stress meets in both tensile and compressive regions. The static equation is modified as:
where represents the yield stress of the material, is the area of tensile region, and is the area of compressive region.
According to Equation (2), the deviation of the neutral axis can be obtained, and the neutral axis exactly divides the cross-section into two equal areas. When the external bending moment is applied on the guideway in the straightening process, the actual process of deformation contains the elastic stage and plastic stage, which is regarded as a complicated nonlinear problem. To simplify the calculation process, the linear hardening material model has been adopted to describe true stress-strain curve in the bending process [23]. As the linear hardening material obtains obvious elastic limit and short yield procedure, the yield limit is used in the calculation process. The stress-strain curve can be given as:
where is the elastic modulus, is the hardening elastic modulus, is the yield stress of the material, and is the elastic-limit strain of the selected material.
3. Analytical Model of Multi-Step Straightening Process
3.1. Straightening Moment
The straightening process of linear guideways with asymmetrical geometry model can be also regarded as plane bending despite the offset of the neutral axis and neutral surface, so the basic assumptions including plane assumption and longitudinal fiber assumption still apply in this situation. The bending deformation of the workpiece is shown in Figure 3. The micro unit MN is chosen to analyze the bending characteristic of the linear guideway, the length of which is constant on the neutral surface. Assuming the curvature radius of neutral surface is , the angle of curvature of the micro unit is . The deformation of a fiber layer whose height is from neutral surface can be expressed as:
The physical relations of the straightening process are described on a straight workpiece by the bending graphing method as shown in Figure 4. The strain value of the longitudinal fiber layer of the workpiece is defined as the distance between line AB and the lateral symmetry plane.
where, is expressed as .
The strain value of surface fibers is given by:
The bending workpiece is divided into an elastic region and a plastic region along a lateral direction in the elasto-plastic deformation process, and the stress distribution is shown in Figure 4. Since the deformation of each longitudinal fiber layer is directly proportional to the distance between that and the neutral surface, the fiber layers reaching elastic limit are distributed symmetrically on the side of the neutral surface.
where, is the height of elastic region.
According to Equations (6) and (7), the height of elastic region is expressed as:
The calculation methods of different longitudinal fiber layers are based on the division of elastic and plastic regions. The longitudinal fiber layers on the sides of the neutral surface belong to the stage of elastic deformation, so the stress is given by a linear formula.
The plastic deformation is produced in the outer surfaces of the workpiece, and the stress is described combining with Equations (4), (7), and (9).
where, is the hardening coefficient of material.
According to Equations (9) and (10), the stress distribution for the first loading can be expressed as:
The workpiece produces bending deformation by external moment, and the internal moment, being equal and opposite, is also generated simultaneously. Based on the division of elastic and plastic regions and geometrical parameters of the cross section, the moment is calculated by sectional integration method.
3.2. Mechanism of Residual Stress and Strain
Because of the deviation between the theoretical prediction model and actual working condition, the secondary straightening process is necessary in the straightening process of linear guideways. The plastic deformation of the first straightening process has generated residual stress and strain, which influences the distribution of loading stress for the secondary straightening process. It also leads to an error for the prediction of straightening stroke in the secondary process.
The workpiece generates inhomogeneous elasto-plastic deformation under external moment in the first loading of the straightening process. The deformation recovery capability of the elastic region is limited by that of the plastic region after unloading. This condition makes the strain within the material unevenly distributed in adjacent fiber layers, and the residual stress is generated to maintain the inner balance of the workpiece. Based on the unidirectional stress assumption, the mechanism of residual stress and strain of the linear guideway with hardening material, which generates asymmetric bending in the straightening process, is shown in Figure 5.
On the basis of the plane assumption, the longitudinal fiber layer generates bending deformation to position in the first loading of straightening process, which linearly decreases along to neutral surface. The strain value of the intersection of and neutral surface is zero, and segments 14 and represent the strain of top and bottom surfaces, respectively. The workpiece produces springback after the first unloading in the elastic and plastic regions. Assuming that there is no interference of each fiber in the longitudinal direction, the fibers in the elastic region generate elastic deformation, which would totally rebound after unloading. During the springback of the unloading process, segments 14 and rebound to segments 24 and , while segments and totally rebound to the initial state by . When the springback process is finished, the segment would retain the plastic deformation energy of the region . As a result, the segment cannot totally rebound, which actually rebounds to region . According to the plane assumption, each section of the workpiece remains plane in the bending process. By following this constrained condition, the transfinite deformation of segment 14 makes the fiber of top surface to rebound from point 4 to point 2. Because of the unaccomplished deformation caused by plastic deformation, the segment 57 rebounds to segment 67. The bottom surface of the workpiece experiences the same changing process, so the segment finally rebounds to segment by . The residual deformation consists of the areas and caused by transfinite deformation, while the areas and by unaccomplished deformation.
Based on the elasto-plastic theory [24], the rebound strain of the workpiece surface can be expressed as:
where, represents the height from top and bottom surface to neutral surface, and is the product of inertia with respect to the cross-section.
Due to the offset of the neutral axis and neutral surface, there are differences between the plastic deformations of the top and bottom parts of the workpiece. The residual stress after the first unloading in the straightening process is calculated as:
where, is the elastic-limit moment during the straightening process.
By combining with Equation (12), the formula of residual stress after the first unloading can be given by
3.3. Analytical Model of the Second Straightening Process
In the second straightening process, the residual stress generated by the first loading and unloading is coupled with the second loading stress, which would change the deformation resistance of workpiece and the influence parameter setting of prediction of the straightening stroke. The coupling between residual stress and loading stress leads to linear superposition of stresses, and it is defined as the actual loading stress for the second straightening process.
Due to the residual stress from the first straightening process, the stress distribution of the longitudinal fiber layer has been changed, which has a significant influence on the bending deformation characteristics of the workpiece. Assuming the height of the elastic region for the second straightening process is , there are two different situations based on the relation between and . If , the residual stress caused by the first straightening process is totally eliminated by the second loading stress. If , the residual stress caused by the first straightening process is partly eliminated by the second loading stress. In the whole straightening process, the straightening stroke reduces gradually until the height of elastic region is equal to the height of the cross-section. As a result, the height of the elastic region generated by bending deformation is less than that of the previous process.
According to the bending direction of the first straightening process, the straightening direction of the second process can be divided into two kinds of situations. The bending after the first straightening process is in the same direction as the initial deflection of the workpiece or in the opposite direction.
In the straightening process, if the bending direction is not changed after the first straightening process, the direction of the second loading stress is the same as the first straightening process. According to Equations (11) and (15), the distribution function of the second loading stress can be expressed as
Based on the continuity of function, the height of the elastic region has a minor variance in different sections of the workpiece.
If the reverse bending occurs in the first straightening process, the direction of the second loading stress is opposite to the moment of the first loading process. According to Equations (11) and (16), the distribution function of the second loading stress can be expressed as
According to the continuity of function, the height of elastic regions can be given by
The bending moment can be calculated with the geometrical parameters of the cross-section and the second loading stress.
When the applied external moment is unloaded after the straightening process, the unloading process can be regarded as the complete elastic deformation caused by the external moment 23. On basis of plane assumption, the springback after unloading can be expressed as:
where, represents the half of distance between two supports.
As a result, the straightening stroke with respect to the straightening process can be given as:
The following formula defines the moment and straightening stroke of different straightening steps based on Equations (20)–(22).
4. Numerical Simulation of the Multi-Step Straightening Process
4.1. Analytical Model of the Straightening Process
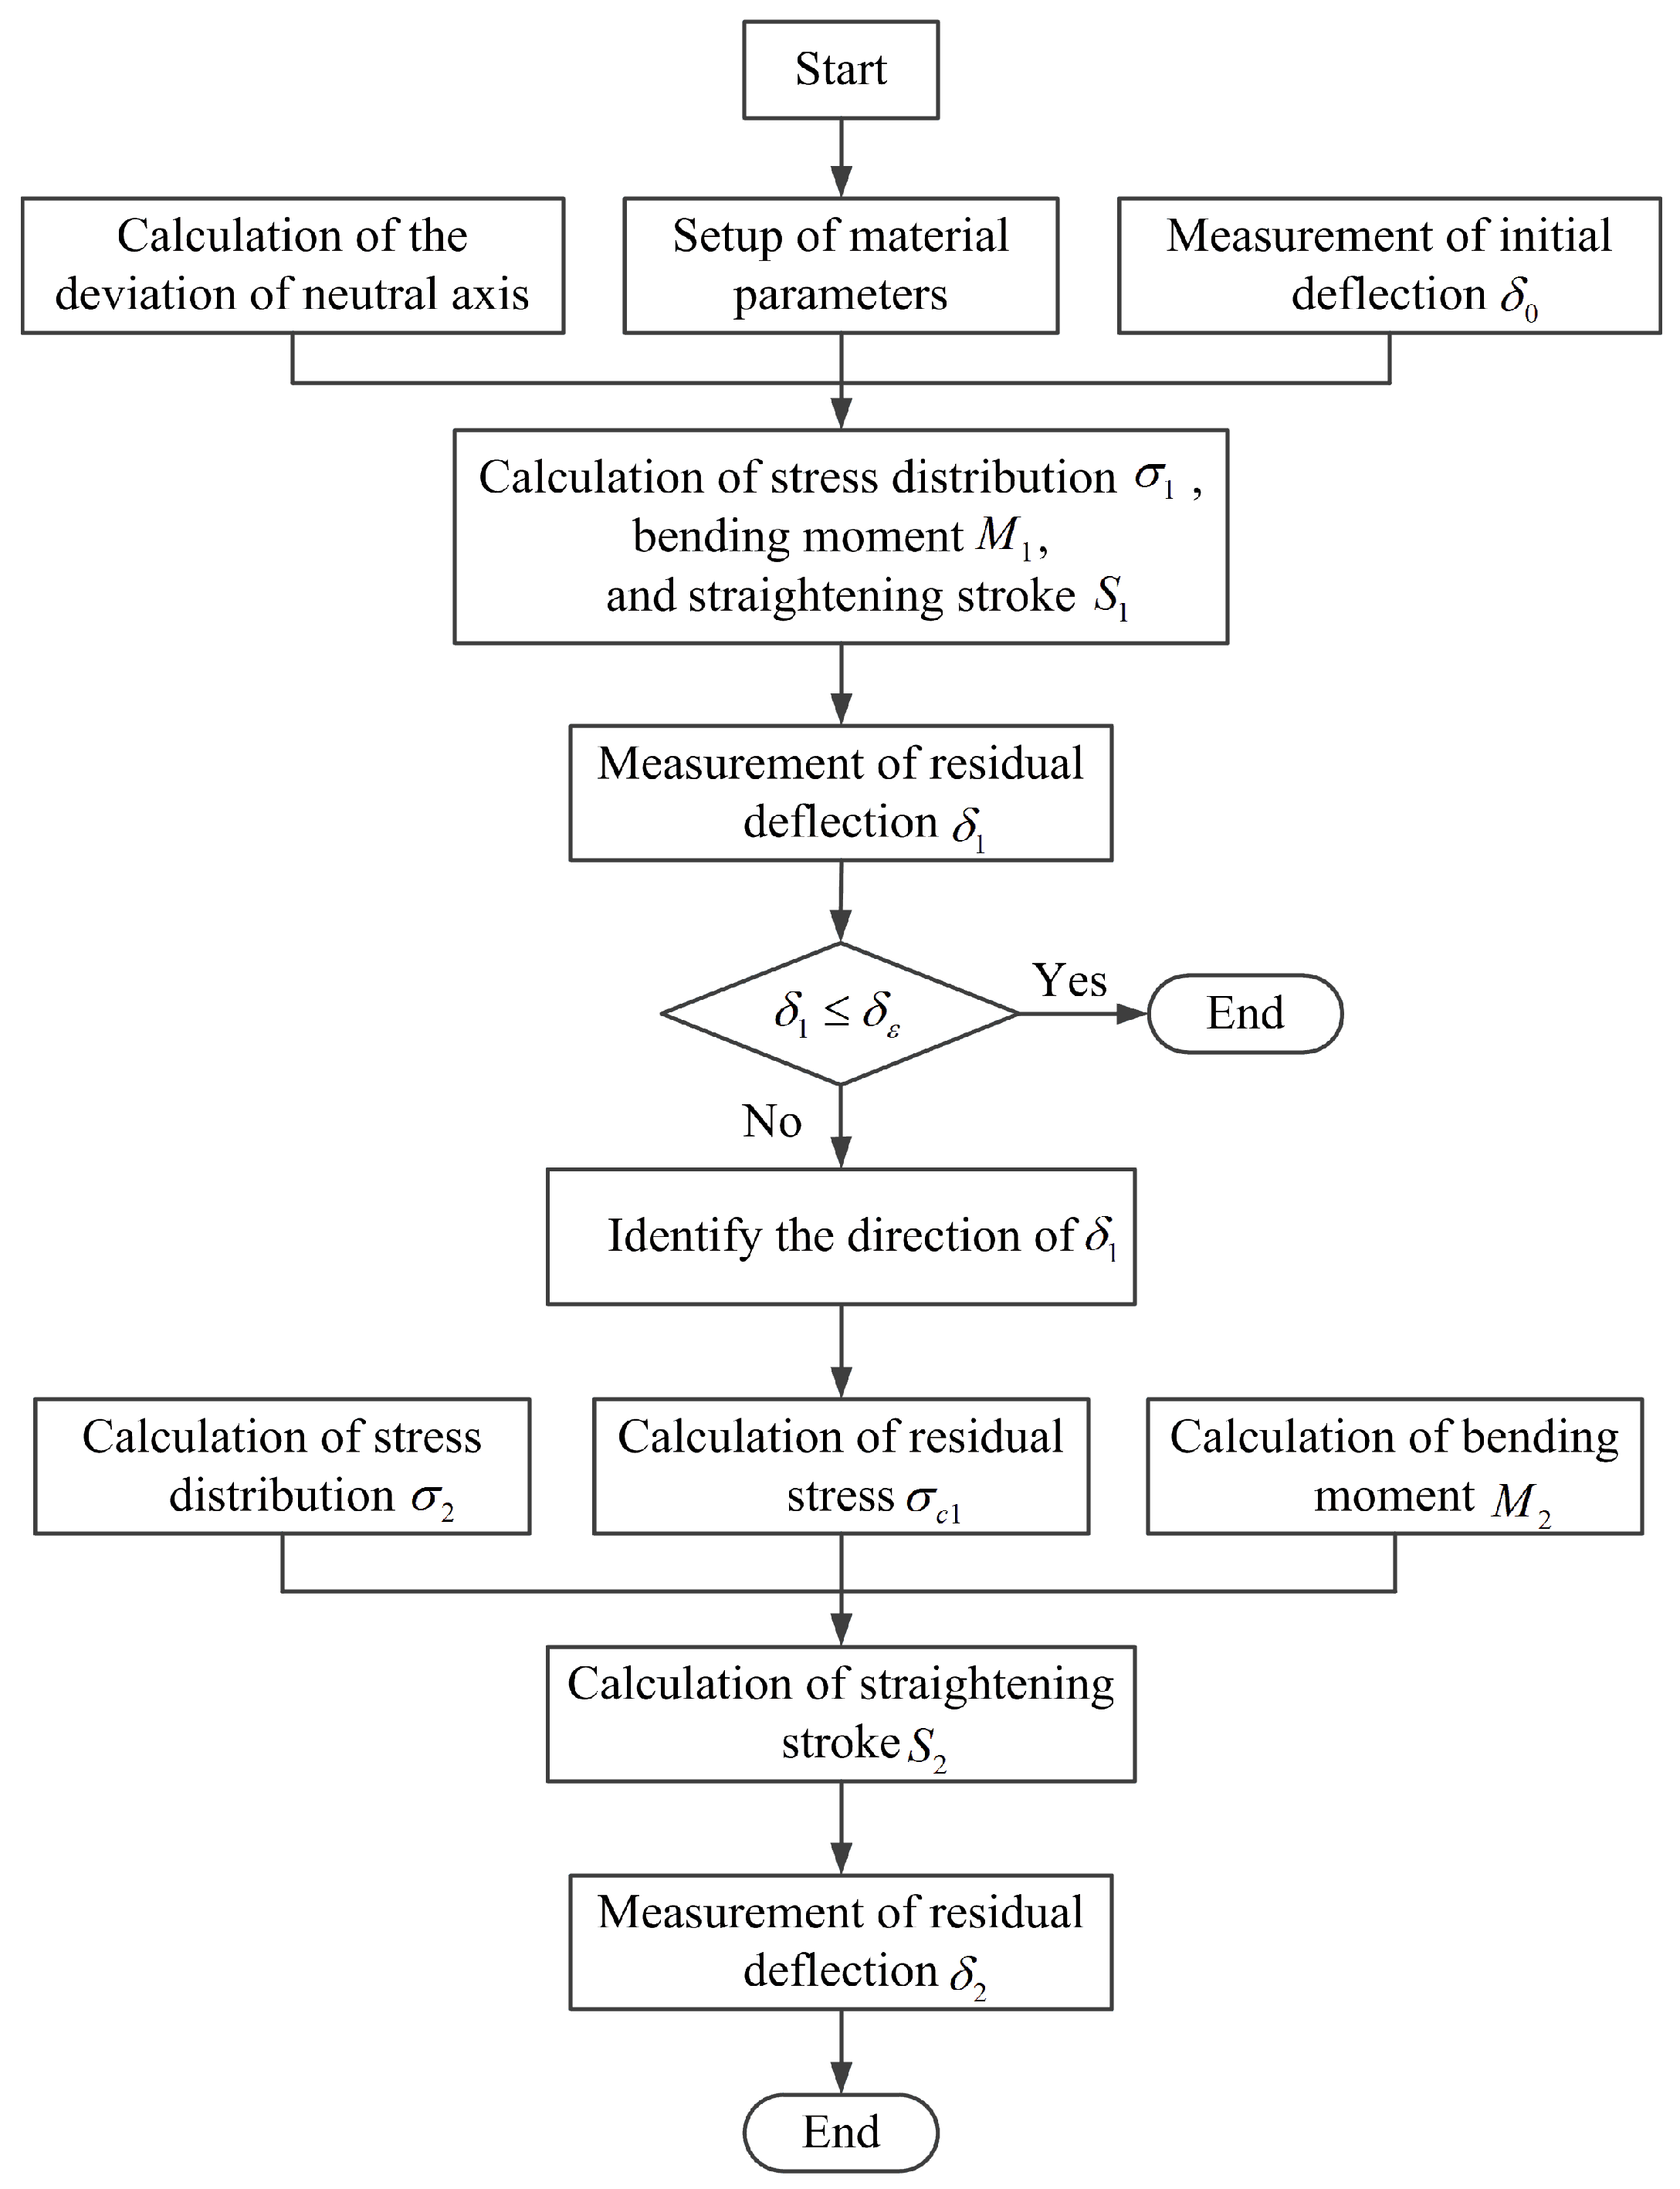
As the straightening stoke in every step is predicted with the measured deflection of the last step, a software with high computational speed and accuracy with respect to the straightening process is necessary. The numerical calculation of the multi-step straightening process as shown in Figure 6 has been performed using MATLAB by using the symbolic computation method.
In the programme of the analytical model, the positions of the neutral axis are calculated based on the sectional dimensions of the workpiece. During the simulation, the parameters have been initialized by the actual work condition, which have the influence on the straightening accuracy, such as the parameters of material properties , , and , machine kinematics . The straightening process actually begins with the measurement of initial deflection with respect to the workpiece, so the distribution of loading stress and the bending moment can be calculated by Equations (11) and (12). The straightening stroke of the first step is finally predicted based on initial deflection , parameters of material properties, and bending moment . The residual deflection is measured when the first step of straightening process is finished. If the residual deflection meets , it means that the workpiece has satisfied the requirement of accuracy.
Otherwise, it is necessary to conduct the second step straightening process with respect to the workpiece when the residual deflection . The distribution of residual stress can be expressed as Equation (16) according to the springback of bending. In case that the reverse bending may occur after the first step straightening process, the bending direction needs to be detected during the calculation process. As result of residual stress by the first step straightening, the final distribution of loading stress is calculated by the linear superposition of theoretical value and residual stress . The predictive stroke for the second stage of the straightening process is then generated by combining residual deflection with bending moment . At the end of the straightening process, the residual reflection of the workpiece is measured, and the results would be compared to the standard value. The established programme also can be used to predict the straightening stroke of linear guideways with the same type of cross-section.
4.2. Finite Element (FE) Simulation of the Multi-Step Straightening Process
Combining with the analytical results calculated by MATLAB in the last section, the simulation of the multi-step straightening process with respect to linear guideways is performed in the finite element analysis software ANSYS. The parameters with respect to material properties and the kinematics of the straightening machine are presented in detail, as shown in Table 1. The particular cross-section parameters of the linear guideway are illustrated in Figure 7 and the stress-strain curve is shown in Figure 8 based on the results of uniaxial tensile test. According to small deformation theory and isotropy assumption, the isotropic elasticity model is used in elastic deformation stage and linear isotropic hardening model in the plastic deformation stage.
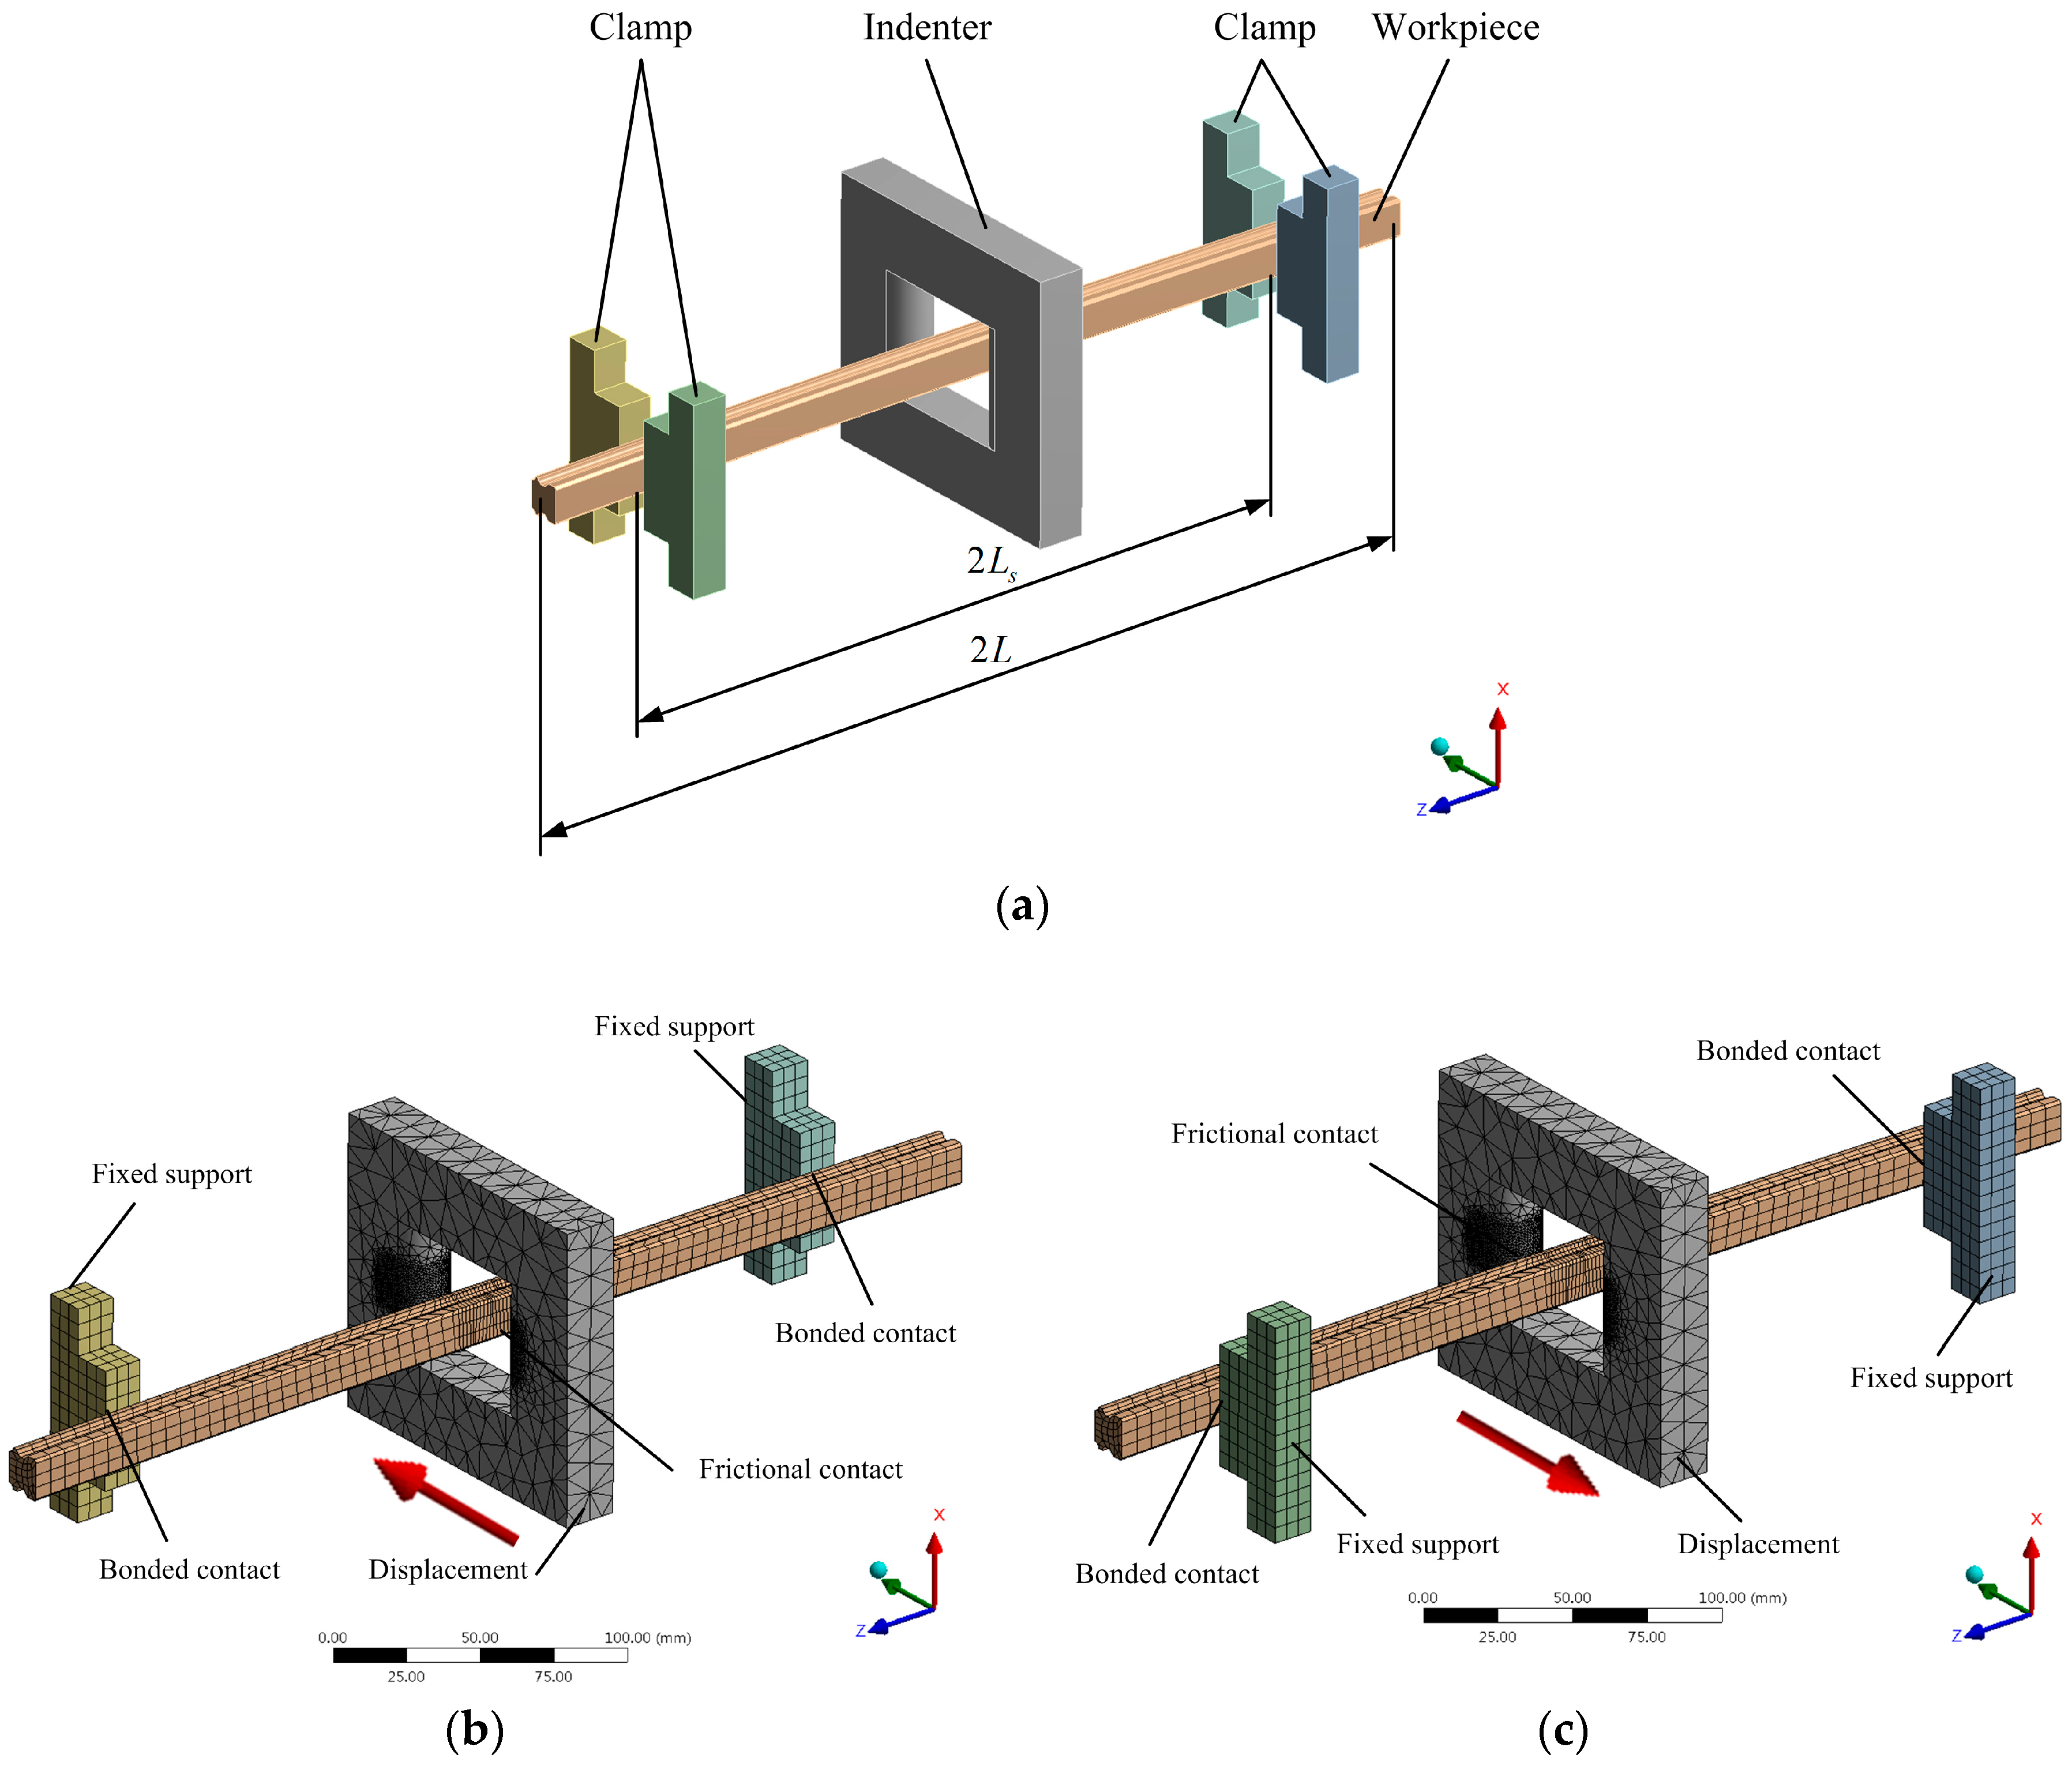
The 3D numerical model established by SOLIDWORKS consists of supporting clamps, straightening indenter, and a linear guideway as shown in Figure 9a, which is established based on cross-section features of a linear guideway and parameters of material properties, as well as the actual kinematics of the straightening machine. Figure 9b,c are the FE models in different straightening directions, in which the line contact is set up as the initial contact state between linear guideway and clamps. Besides, taking the stress superposition into account, the simulation was performed by a continuous process. The simulation results were then obtained to compare with the theoretical results and experimental results verifying the accuracy of prediction by the proposed method.
Most of research on the simulation of straightening processes generally applied concentrated force on the workpiece [8,9,14,16]. However, it is difficult to accurately control the force in the actual straightening process. Instead of concentrated force, the displacement of indenter, representing the straightening stroke, is set up to simulate the straightening process, while the clamps are defined as the fixed supports. The contact constraints must be set on the contact regions to avoid the interpenetration between indenter and workpiece. As the deformation during the straightening process belongs to nonlinear behavior and relative sliding occurs between indenter and workpiece, the contact type is defined as fictional contact. In terms of the contact regions between workpiece and clamps, the contact types are defined as bonded contact. Augmented Lagrange algorithm is applied in the FE model considering the nominal clearance in the contact region, and the value of normal stiffness value should be in the range of 0.01 to 0.1. In addition, to distinguish the contact and non-contact regions more precisely, the radius of Pinboll is set up to detect the contact region. In the contact region, the bisection method, which can accurately judge the contact stage between indenter and workpiece, is used to control the time step. The proper radius of Pinboll can avoid the interpenetration between indenter and workpiece and improve the calculation efficiency.
The straightening indenter is considered as a rigid body, which is meshed with rigid quadrilateral elements (SOLID187) by swept method. As the workpiece generates elasto-plastic deformation in the straightening process, the element type of workpiece is important to simulation accuracy. The hexahedral elements (SOLID186) are applied for the workpiece according to the actual deformation extent. To guarantee the simulation accuracy of the straightening process, the restricted function for meshing size in contact regions is adopted. Owing to the balance between simulation accuracy and solution speed, the maximum value in the contact region of the indenter and workpiece is set up as 1 mm. In terms of the analysis of simulation results, the deflection of the linear guideway during the simulation process is detected by the deformation applied on the linear guideway as shown in Figure 10a, while a path is generated along the longitudinal direction to describe the longitudinal stress. Based on the defined path, the graph and tabular data with respect to longitudinal stress can be obtained (Figure 10b).
The constraints of the linear guideway, clamps, and indenter are set up in accordance with the configurations of the straightening machine, while the displacement is acted on the indenter to simulate straightening stroke. The initial deflection of the sample workpiece is selected as 1.581 mm by the measurement of sample workpieces. Based on the proposed analytical model in MATLAB, the displacement of indenter in the first straightening step is calculated as 8.428 mm. When the indenter reaches the target position of the straightening process, the longitudinal stress distribution of the workpiece can reflect the external force of bending deformation. Consequently, the loading process is analyzed through the longitudinal stress distribution of the target position.
As the stress distribution detected by the paths on top and bottom surfaces only has a very small fluctuation, it indicates that longitudinal fibers when bending are in accordance with unidirectional stress assumption. Figure 11 shows theoretical results and simulation results of longitudinal stress distribution along the height direction on cross-section during the multi-step straightening process with respect to linear guideways. It can be detected that the height of the elastic region based on theoretical results is almost the same with it based on simulation results. Besides, there is a very small difference with respect to the deviation of the neutral axis between theoretical and simulation results.
If the residual deflection of the first straightening step does not meet the requirement of straightness, it is necessary to conduct the second straightening step. In this case, the residual deflection is measured as −0.920 mm based on the simulation results, and the predictive stroke for the second loading is calculated as −2.077 mm. Due to the repetitive loading and unloading processes, the residual stress has been generated inside the workpiece, which would have an influence on the calculation of bending moment. The theoretical results with respect to residual stress curve are in good agreement with simulation results as illustrated in Figure 11b.
Owing to the existence of residual stress, the longitudinal stress distribution with respect to the second straightening step would be changed. It is considered as a linear superposition of residual stress and theoretical loading stress based on the basic assumptions. As shown in the Figure 11c, there are some differences with respect to the stress curve between theoretical results and simulation results. However, the height of elastic region, the yield stresses in tension and compression based on theoretical results are basically consistent with that by simulation results.
In addition, the accuracy of simulation is also influenced by the contact deformation between indenter and workpiece, which is determined by mesh quality and contact preferences. The permeation between indenter and workpiece during the multi-step straightening process is shown in Figure 11d. The maximal permeation of the straightening process occurs on the maximal displacement of the first straightening step. However, it can be neglected compared with the straightening stroke.
Assuming that the straightening process is divided into two straightening steps in the same direction, the longitudinal stress curve and the deviation of neutral axis during multi-step straightening process based on theoretical results are highly consistent with that based on simulation results as shown in Figure 12. The permeation between workpiece and indenter is higher in this case, but it has little or no influence on the simulation accuracy. All of the relevant analyses show that there is a good agreement with respect to the deviation of neutral axis and longitudinal stress curve between theoretical and simulation results.
5. Results
5.1. Experimental Schemes of Straightening Process and Deflection Measurement
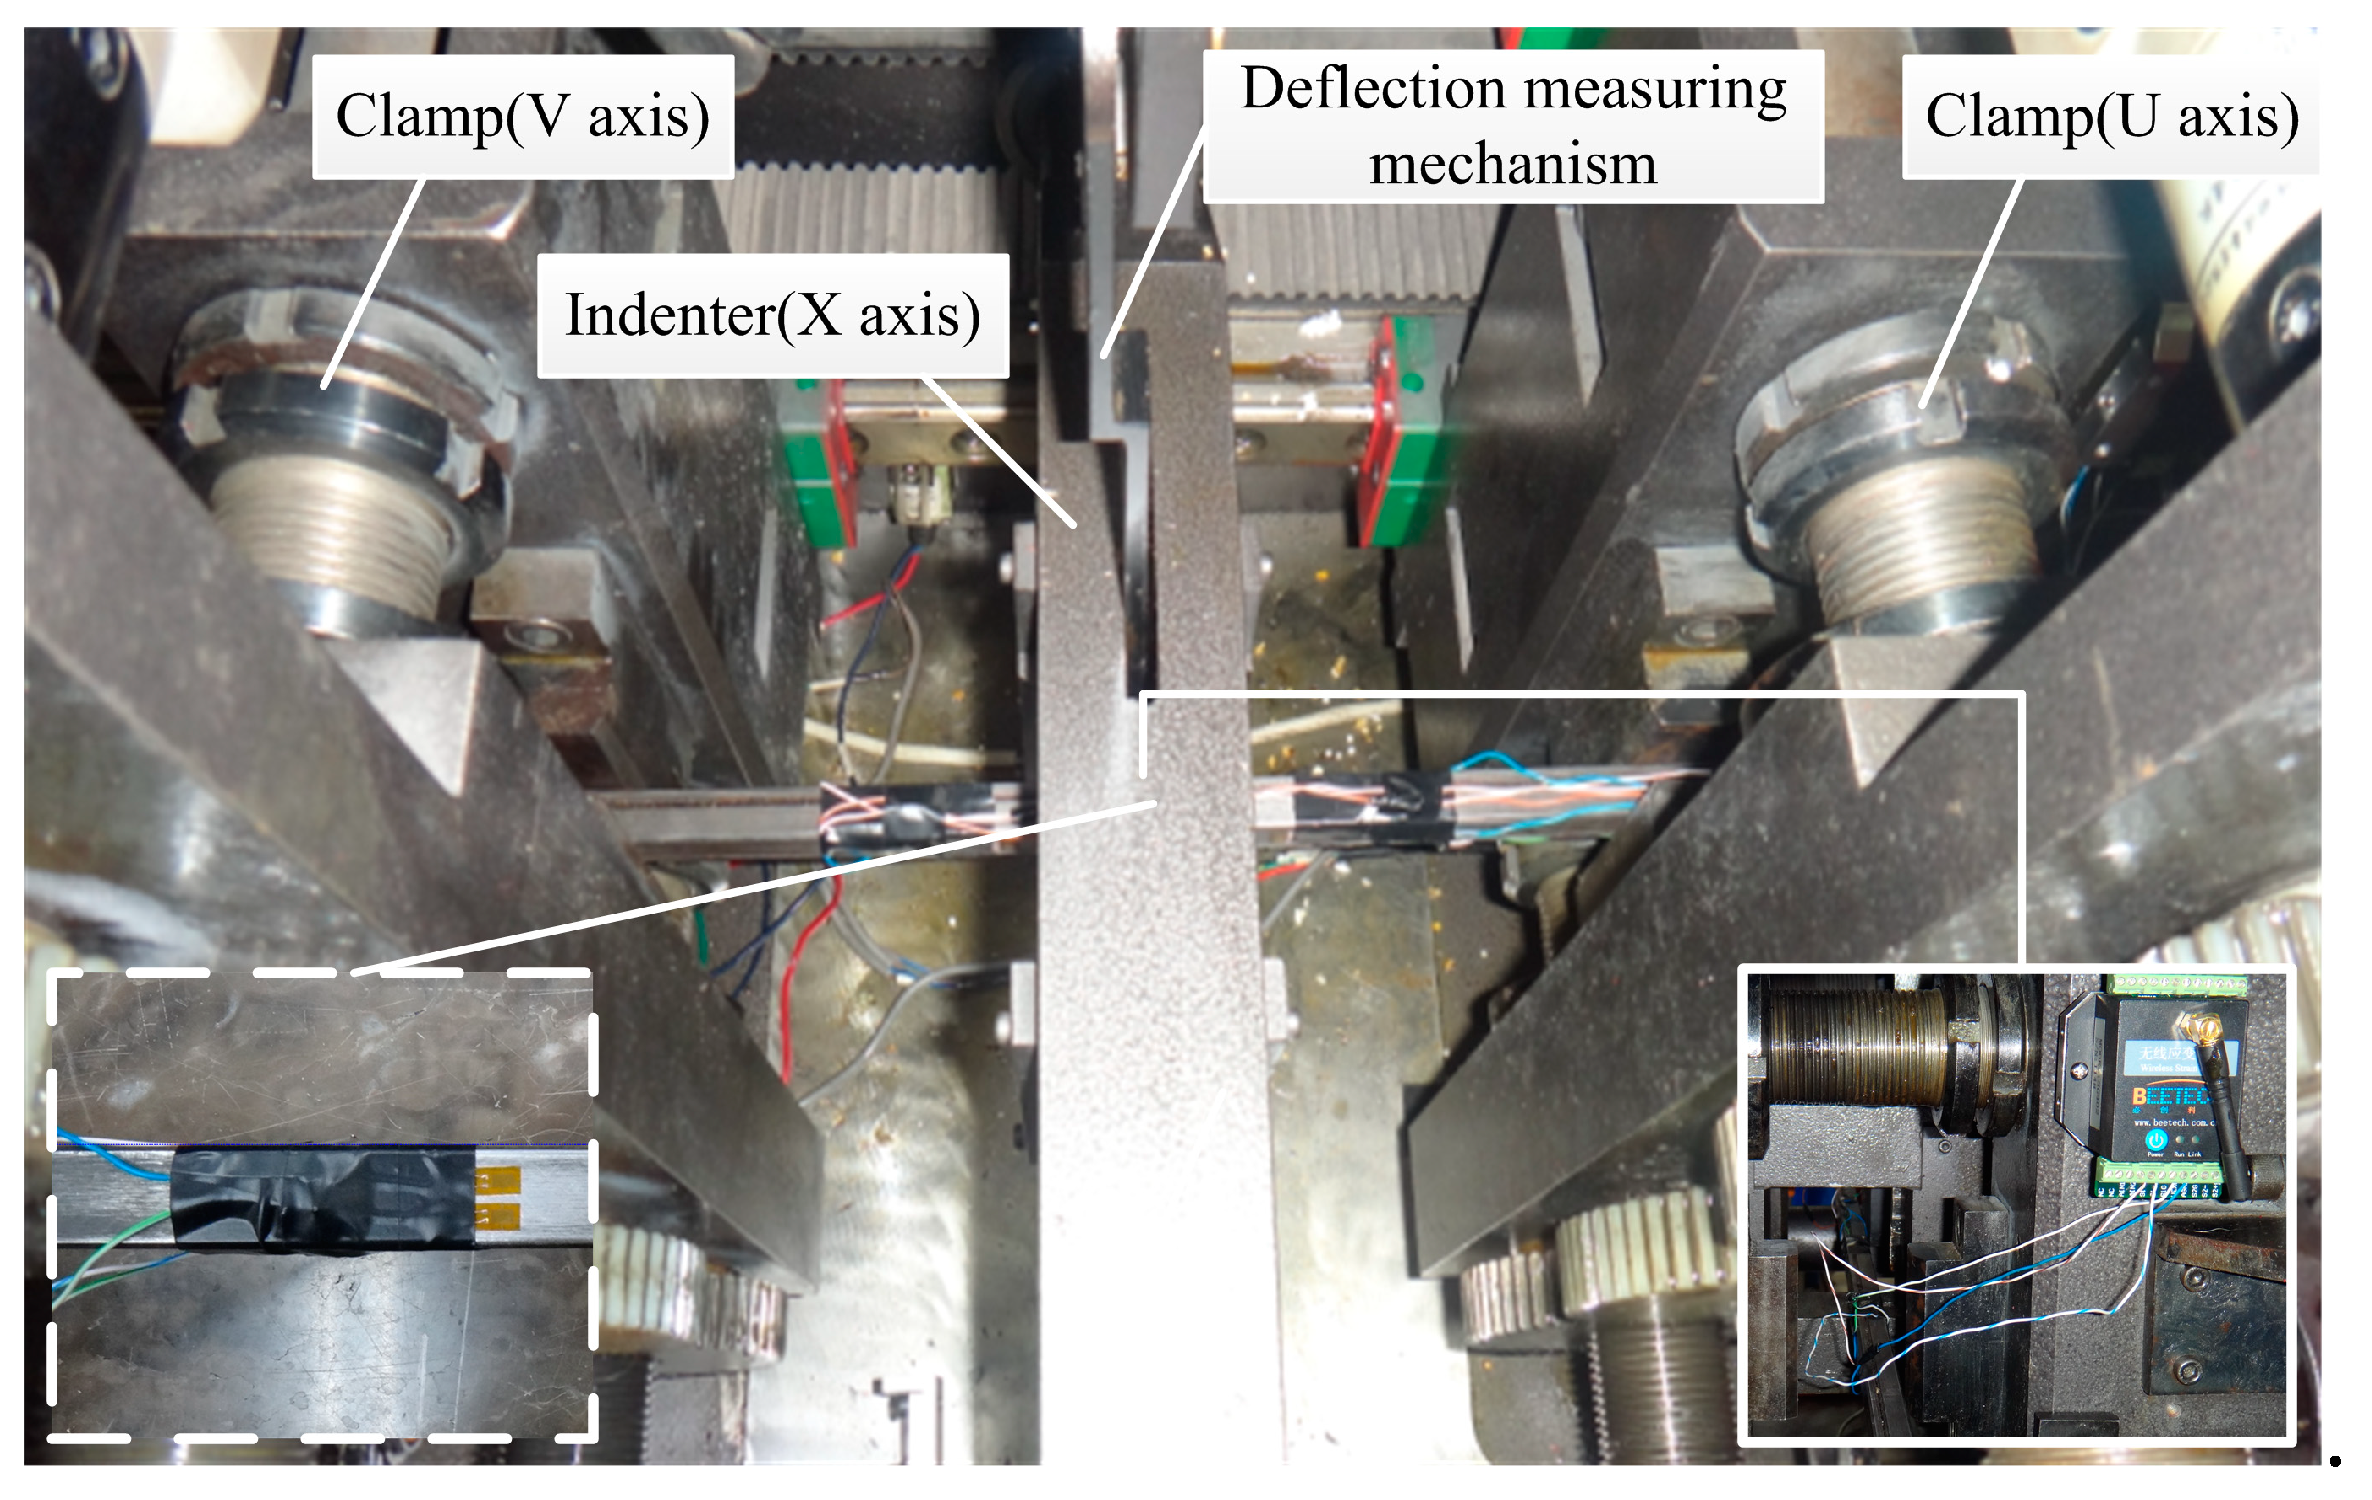
The experiments of the multi-step straightening process were performed by the ROSE-JZ50 straightening machine (Accuracy: 0.15 mm/m). The indenter driven by servo motors and crank-link mechanism was horizontally installed to the reference surface consisting of clamps, while the measurement system was fixed on the straightening direction as shown in Figure 13. The closed-loop control of four axes was realized by servo system, sensors, and motion control card by the bus control pattern. In order to achieve the online measurement of deflection, the measurement system consisting of inductive pen and data acquisition card was established, whose performance parameters are shown in Table 2.
To detect stress variation in the straightening process, the released strains are measured by WSN (Wireless Sensor Network) as shown in Figure 13, and the residual stresses are then calculated based on elasto-plastic theory. The WSN system is a multi-hop network formed by wireless communication. It consists of sensor nodes and wireless gateway to finish data collection and data transmission. The full-bridge circuit was adopted in the WSN system, and its connection with internal circuit of sensor nodes is shown in Figure 14. The output voltage can be expressed as [25]:
where, , , and are the operating resistances, , , , are the resistances variation of strain gauges when bending, V is the bridge voltage, K is the sensitivity of resistance strain gage, , , and are the strain values.
The LG15 series linear guideway (Table 1) is chosen for the confirmatory experiment of the multi-step straightening process. The strain gauges were symmetrically pasted on both sides of the linear guideway, as illustrated in Figure 15. The full-bridge circuit consisting of strain gauges was connected to the wireless sensor nodes by welding lines.
5.2. Results
The initial deflection of the sample workpiece was selected as 1.581 mm according to the measured results. Based on the proposed analytical model established by MATLAB, the straightening stroke of the first straightening step is calculated as 8.428 mm. After unloading of the first straightening step, the residual deflection was measured as −1.087 mm by deflection measuring mechanism, which is a little smaller than the simulated results. The stroke of the second straightening step was predicted as −2.244 mm. Finally, the residual deflection was measured by inductive pen as 0.085 mm, which fully meets the straightness requirement.
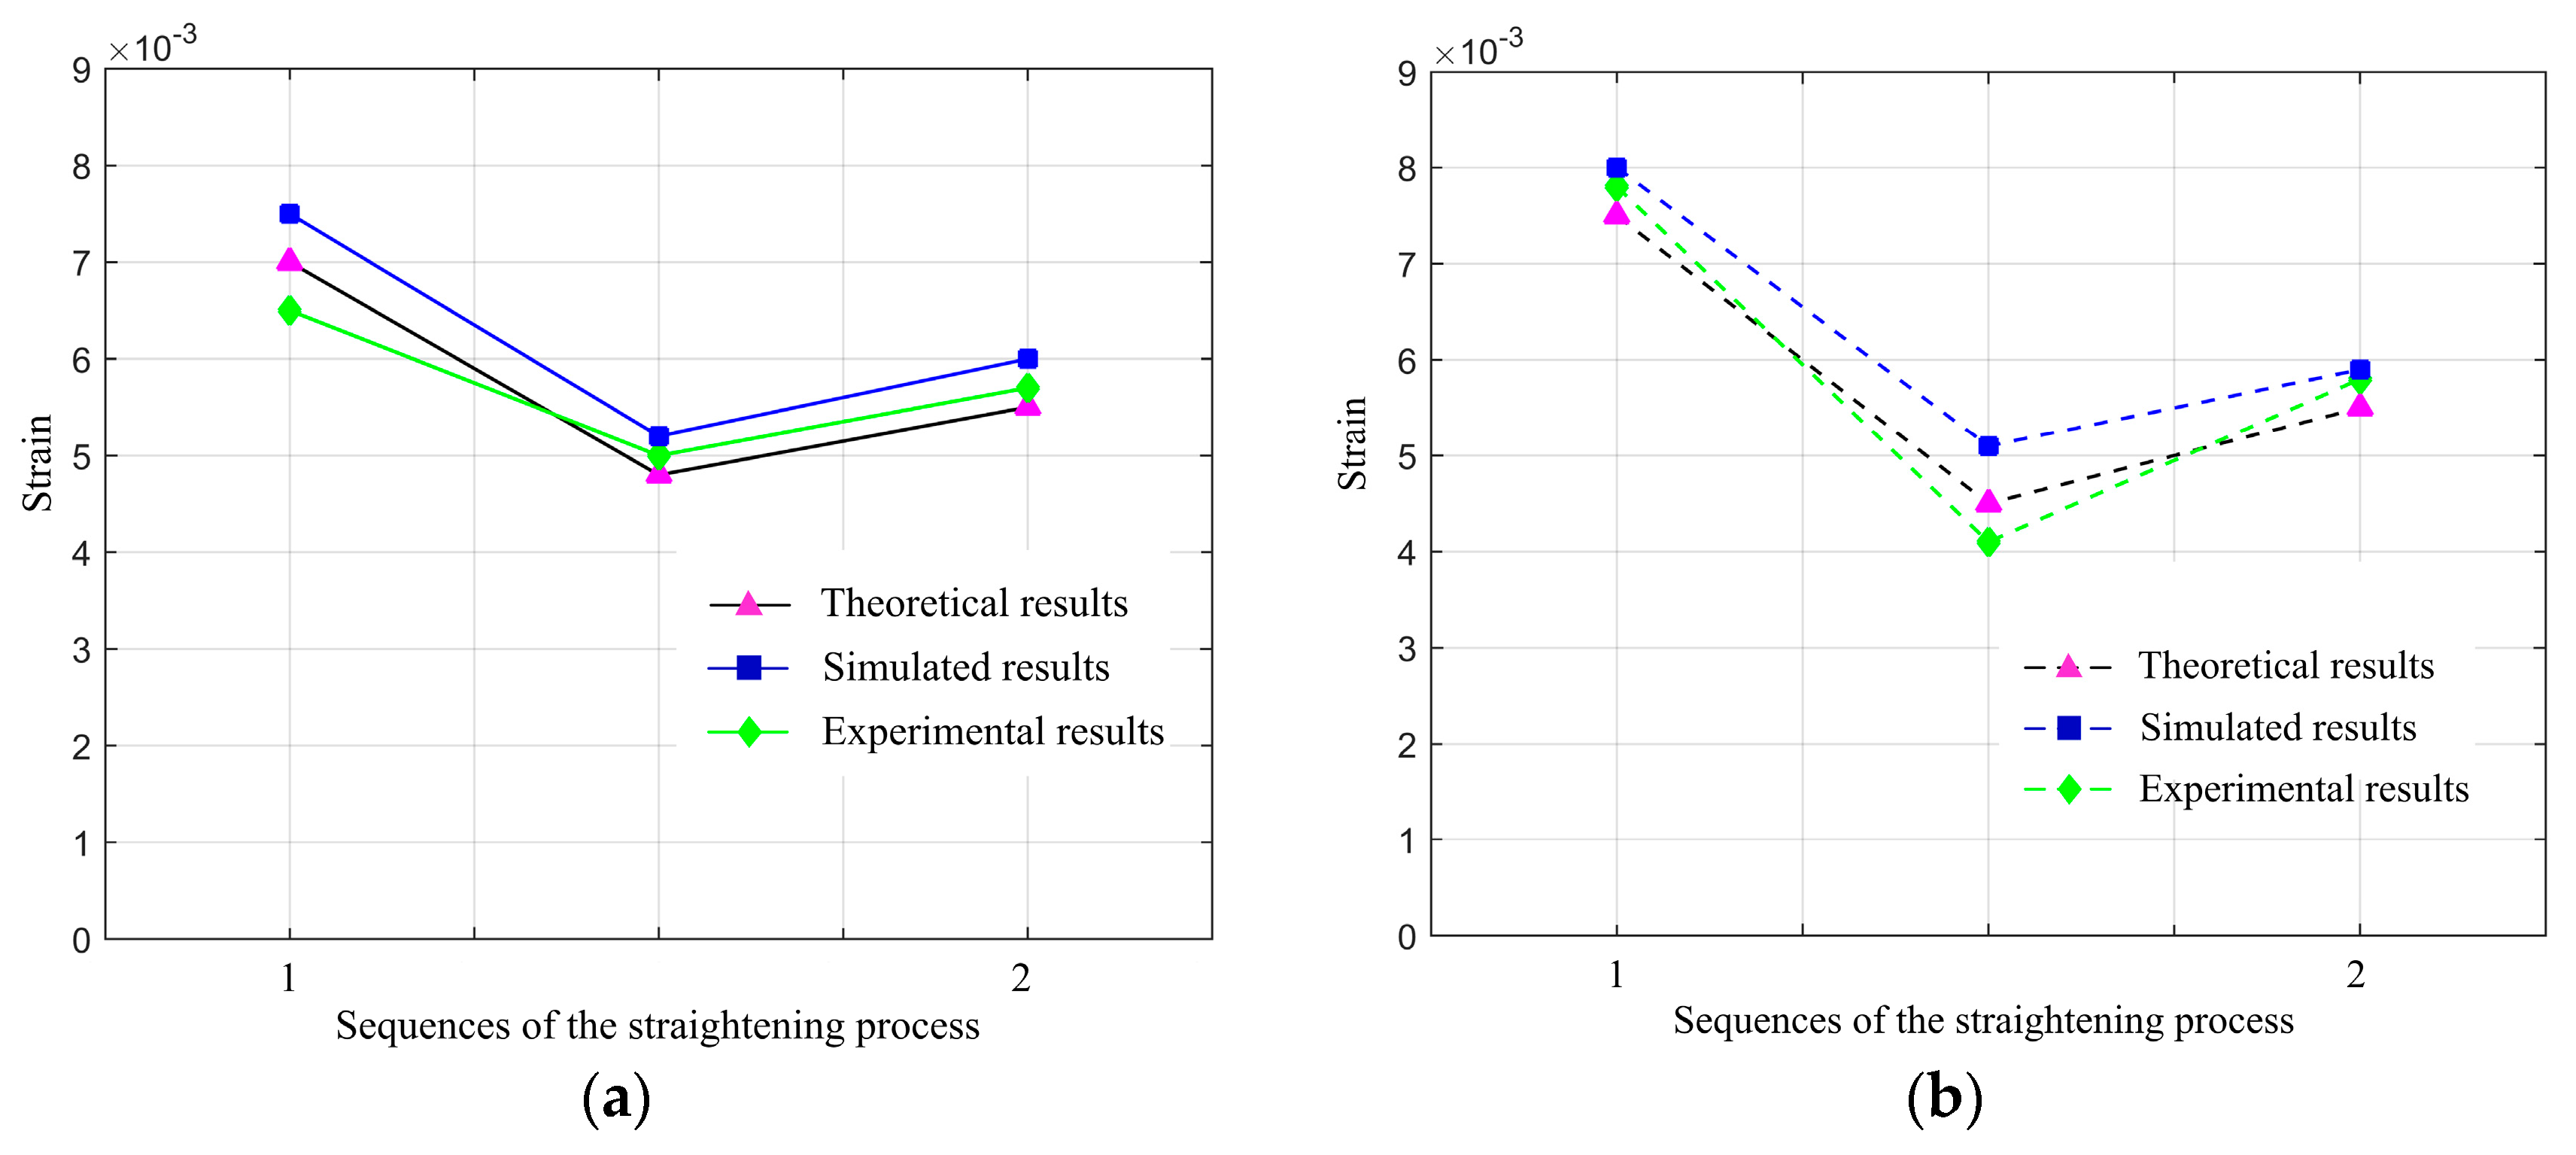
In Table 3, the stress and strain on the tensile and compressive surfaces based on theoretical results, simulation results, and experimental results are shown for the two-step straightening process of the sample workpiece. However, the stresses on the tensile and compressive surfaces cannot be directly detected by the straightening experiments. In Figure 16, the experimental results of strain variation on tensile and compressive surfaces with respect to the sample workpiece are displayed, together with the theoretical results and simulation results, using the same sample workpiece. The simulation and experimental results also show the asymmetry of stresses in tensile and compressive regions was caused by the deviation of neutral axis. This is in accordance with expectations. The max errors between theoretical results and simulation results are 6.37% and 0.74%, while the max errors between theoretical results and experimental results are 7.14% and 9.09%, in different sequences of the straightening process, respectively. Although there is a slight difference in the simulation results of bending strain and stress, they still confirm the applicability and accuracy of the proposed analytical model.
6. Conclusions
The different sequences of the straightening processes are analytically modelled based on geometrical model and material model of the linear guideway with cross-sectional shape in this paper. Taking the asymmetrical cross-section features into account, the position of the neutral axis and surface is varying during the straightening process, thereby influencing the longitudinal stress-strain distributions. As the multi-step straightening process is actually a cyclic loading and unloading process, the residual stresses are generated for different processes. To obtain the accurate bending moment of the straightening process, the linear superposition of stresses has been considered in the proposed analytical model. The predictive model of straightening stroke is then established using symbolic computation method followed by the proposed analytical straightening model. The finite element analysis has been performed to simulate the longitudinal stress distribution of different straightening procedures and its influence on the prediction of straightening stroke under initial stress free conditions. The multi-step straightening process of linear guideways with cross-sectional shape have been experimentally investigated on a ROSE-JZ50 machine. It can be found that the straightness of linear guideway meets the requirement after the multi-step straightening process. Both the simulation and experimental results show that the proposed straightening model is capable of predicting the stroke for multi-step straightening processes. However, the multi-step straightening process is focused on the single straightening point in this paper. Future work should develop the analytical model about the multipoint and multistep straightening process considering the cross-sectional shape and the stress superposition.
Author Contributions
Conceptualization, Y.Z. and H.L. (Hong Lu); Methodology, H.L. (He Ling); Software, Y.L.; Validation, Y.Z. and M.M.; Writing-Original Draft Preparation, Y.Z.; Writing-Review & Editing, H.L. (Hong Lu).
Acknowledgments
This work was supported by the National Natural Science Foundation of China [grant numbers 51675393, 51505355]; the Special Fund for Key Project of Science and Technology of Hubei Province [grant number 2017AAA111]; the Fundamental Research Funds for the Central Universities [grant number 2016-YB-021]; and the Chinese Government Scholarship by the China Scholarship Council [grant number 201706950051].
Conflicts of Interest
The authors declare no conflict of interest.
References
- Gergess, A.N.; Sen, R. Curving structural steel girders by two-point bending. J. Constr. Steel Res. 2016, 122, 511–519. [Google Scholar] [CrossRef]
- Gergess, A.N.; Sen, R. Cambering structural steel I girders using cold bending. J. Constr. Steel Res. 2008, 64, 407–417. [Google Scholar] [CrossRef]
- Mujika, F.; Arrese, A.; Adarraga, I.; Oses, U. New correction terms concerning three-point and four-point bending tests. Polym. Test. 2016, 55, 25–37. [Google Scholar] [CrossRef]
- Seo, Y.H.; Park, J.W.; Song, W.J.; Kang, B.S.; Kim, J. Flexible die design and springback compensation based on modified displacement adjustment method. Adv. Mech. Eng. 2014, 6, 1–15. [Google Scholar] [CrossRef]
- Eggertsen, P.A.; Mattiasson, K. On the modeling of the bending–unbending behavior for accurate springback predictions. Int. J. Mech. Sci. 2009, 51, 547–563. [Google Scholar] [CrossRef]
- Eggertsen, P.A.; Mattiasson, K. On the identification of kinematic hardening material parameters for accurate springback predictions. Int. J. Mater. Form. 2011, 4, 103–120. [Google Scholar] [CrossRef]
- Zhang, S.; Wu, J. Springback prediction of three-dimensional variable curvature tube bending. Adv. Mech. Eng. 2016, 8, 1–13. [Google Scholar] [CrossRef]
- Pernía, A.; Martínez-de-Pisón, F.J.; Ordieres, J.; Alba, F.; Blanco, J. Fine tuning straightening process using genetic algorithms and finite element methods. Ironmak. Steelmak. 2010, 37, 119–125. [Google Scholar] [CrossRef]
- Biempica, C.B.; Díaz, J.J.D.C.; Nieto, P.J.G.; Sánchez, I.P. Nonlinear analysis of residual stresses in a rail manufacturing process by FEM. Appl. Math. Model. 2009, 33, 34–53. [Google Scholar] [CrossRef]
- Guan, B.; Zang, Y.; Pang, X.N.; Lu, Z.Y.; Liu, F.N.; Feng, W. Study on residual stresses evolution mechanism of H-beam during straightening process. J. China Univ. Pet. (Ed. Nat. Sci.) 2012, 36, 122–135. [Google Scholar]
- Tsai, S.H.; Kan, H.C. The exact solution of the load-deflection model of a uniformly loaded rectangular cross-section cantilever beam. J. Phys. D Appl. Phys. 2008, 41. [Google Scholar] [CrossRef]
- Tsai, S.H.; Wang, Y.T.; Kan, H.C. Analysis on the uniformly loaded rectangular cross-section cantilever by a modified load-deflection model. J. Phys. D Appl. Phys. 2009, 42. [Google Scholar] [CrossRef]
- Kazan, R.; Fırat, M.; Tiryaki, A.E. Prediction of springback in wipe-bending process of sheet metal using neural network. Mater. Des. 2009, 30, 418–423. [Google Scholar] [CrossRef]
- Panthi, S.K.; Ramakrishnan, N.; Ahmed, M.; Singh, S.S.; Goel, M.D. Finite Element Analysis of sheet metal bending process to predict the springback. Mater. Des. 2010, 31, 657–662. [Google Scholar] [CrossRef]
- Baseri, H.; Bakhshi-Jooybari, M.; Rahmani, B. Modeling of spring-back in V-die bending process by using fuzzy learning back-propagation algorithm. Expert Syst. Appl. 2011, 38, 8894–8900. [Google Scholar] [CrossRef]
- Yin, J.; Zhao, S.; Wang, S.; Li, Y. Multiroller straightening analytical model of H-beam. Ironmak. Steelmak. 2014, 41, 521–528. [Google Scholar] [CrossRef]
- Kato, M.; Hasegawa, A.; Sugyo, S.; Nakamura, H.; Kobayashi, M.; Morimoto, Y. Straightening technology of round bars using 2-roll rotary straightener. Procedia Eng. 2014, 81, 233–238. [Google Scholar] [CrossRef]
- Spoorenberg, R.C.; Snijder, H.; Hoenderkamp, J.C.D. Experimental investigation of residual stresses in roller bent wide flange steel sections. J. Constr. Steel Res. 2011, 66, 737–747. [Google Scholar] [CrossRef]
- Xiao, B.; Li, K.; Rong, Y. Automatic determination and evaluation of residual stress calibration coefficients for hole-drilling strain gauge integral method. Sratin 2011, 47, 525–534. [Google Scholar] [CrossRef]
- Joseph, J.; Martell, C.; Richard, L.; Jing, S. Experimental investigation on variation of machined residual stresses by turning and grinding of hardened AISI 1053 steel. Int. J. Adv. Manuf. Technol. 2014, 74, 1381–1392. [Google Scholar] [CrossRef]
- Sasaki, T.; Yaguchi, O.; Suzuki, H. Neutron residual stress measurement of railway rails using image plate. Mate. Sci. Forum 2010, 652, 260–265. [Google Scholar] [CrossRef]
- Kosel, F.; Videnic, T.; Kosel, T.; Brojan, M. Elasto-plastic springback of beams subjected to repeated bending/unbending histories. J. Mater. Eng. Perform. 2011, 20, 846–854. [Google Scholar] [CrossRef]
- Song, Y.S.; Yu, Z.H. Springback after the lateral bending of T-section rails of work-hardening materials. J. Mater. Eng. Perform. 2013, 22, 3539–3549. [Google Scholar] [CrossRef]
- Zhao, J.; Zhai, R.; Ma, R.; Zhan, P.; Song, X. Springback theory of plane bending and the progress of study on its engineering application. Steel Res. Int. 2013, 84, 1230–1240. [Google Scholar] [CrossRef]
- Lu, H.; Zhang, Y.Q.; Valentine, O.T.; Gao, S. A straightening stroke-deflection modeling and simulation approach based on online measurement. In Proceedings of the 8th ASME 2014 Manufacturing Science and Engineering Conference 2014 (MSEC 2014), Detroit, MI, USA, 9–13 June 2014. [Google Scholar]
Figure 1.
Scheme for the structure of the straightening machine.
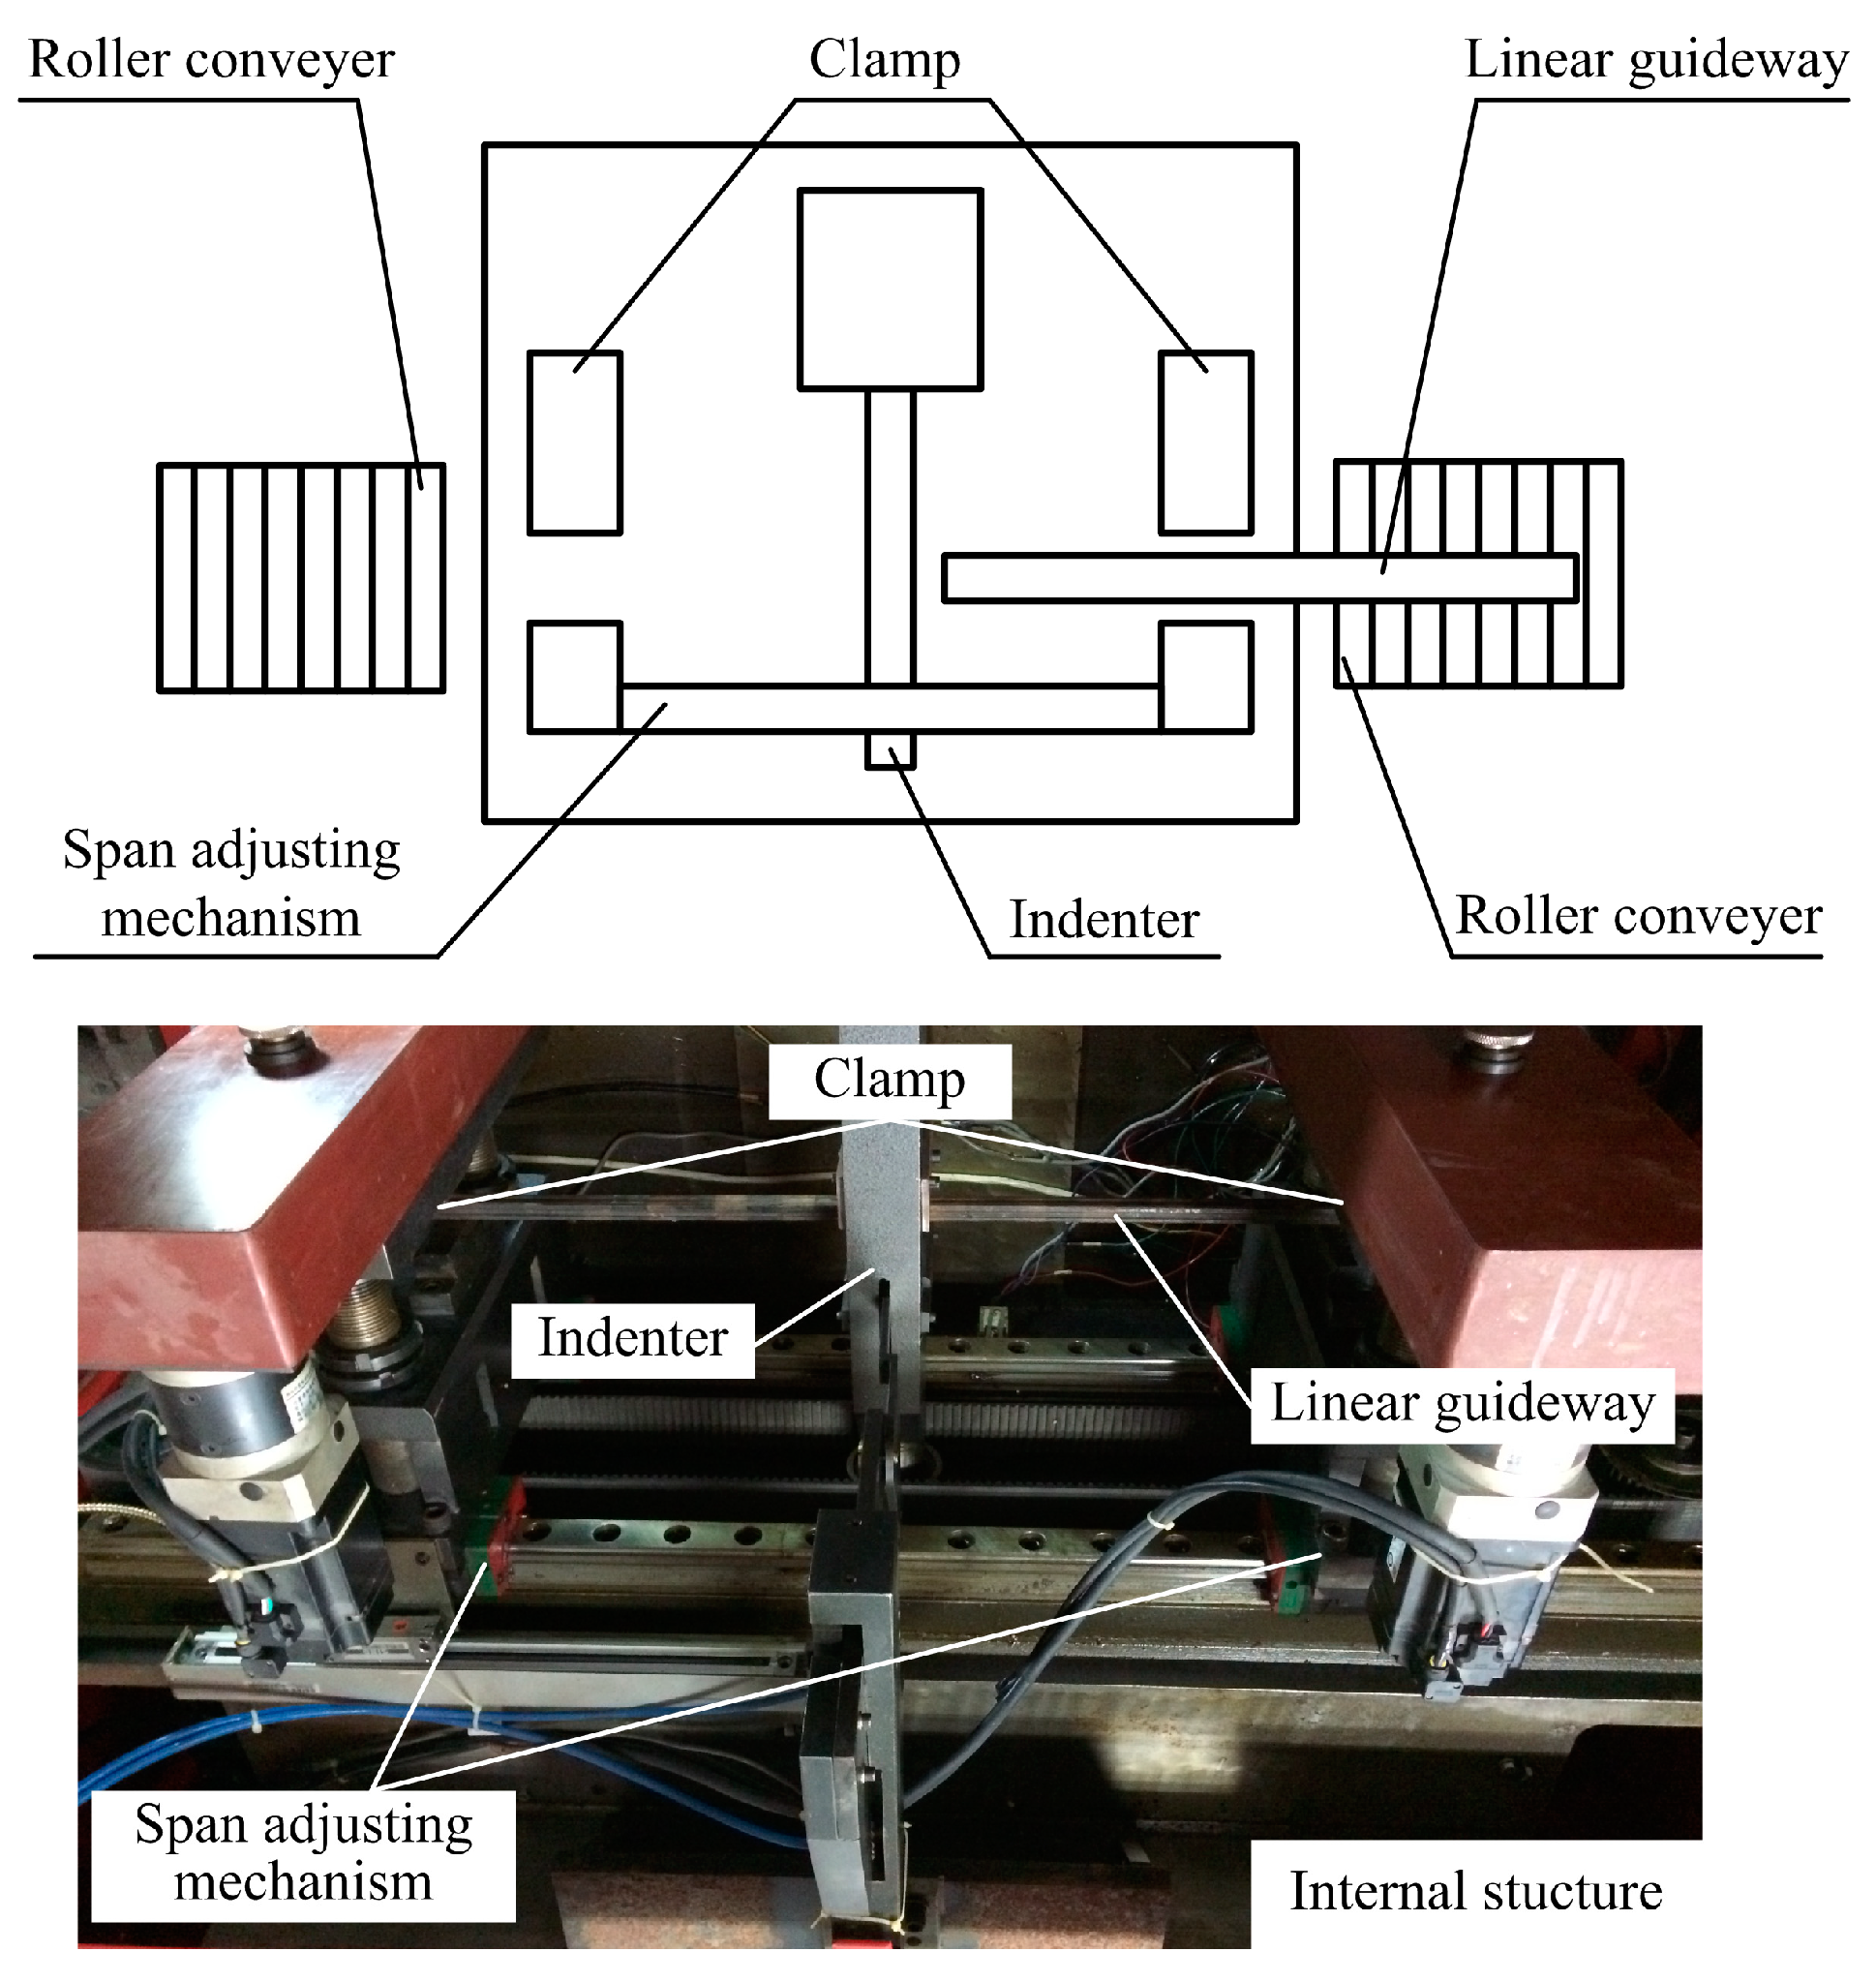
Figure 2.
Cross-section parameters of an LG series linear guideway.
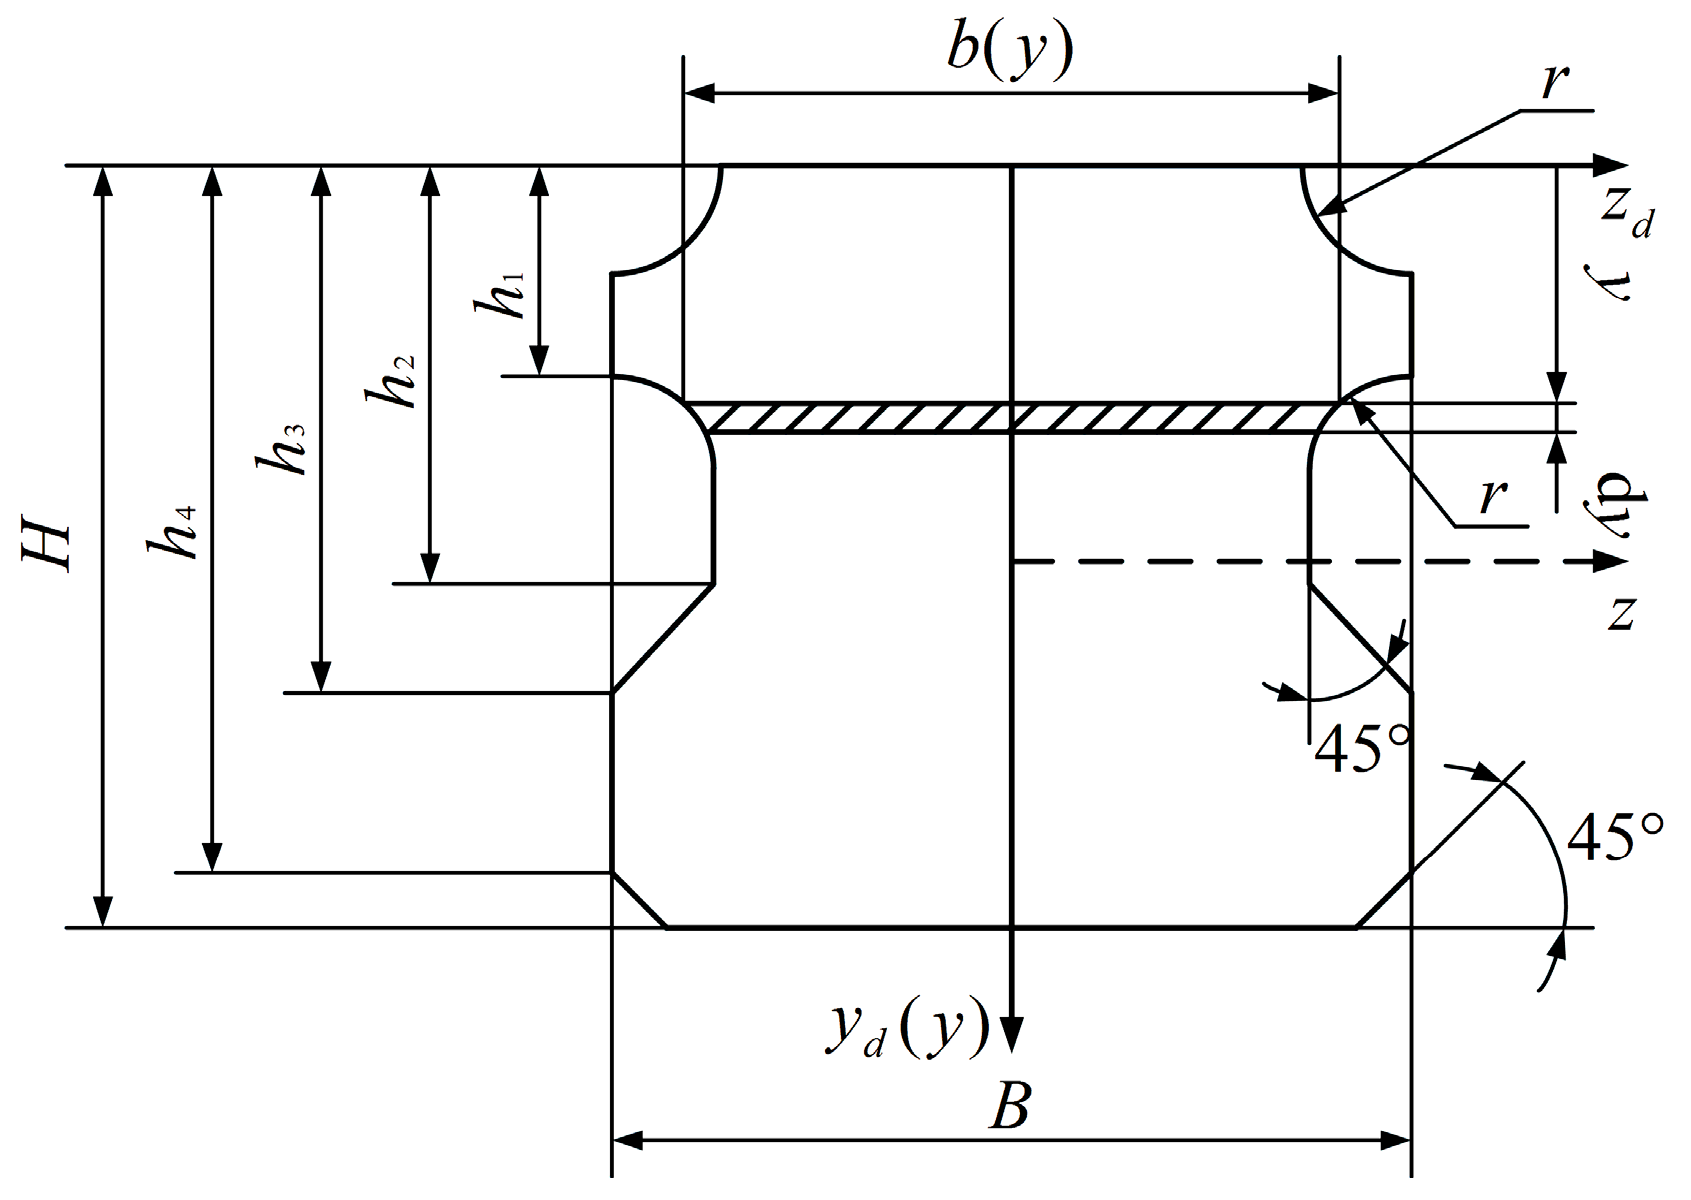
Figure 3.
The bending deformation of the workpiece.
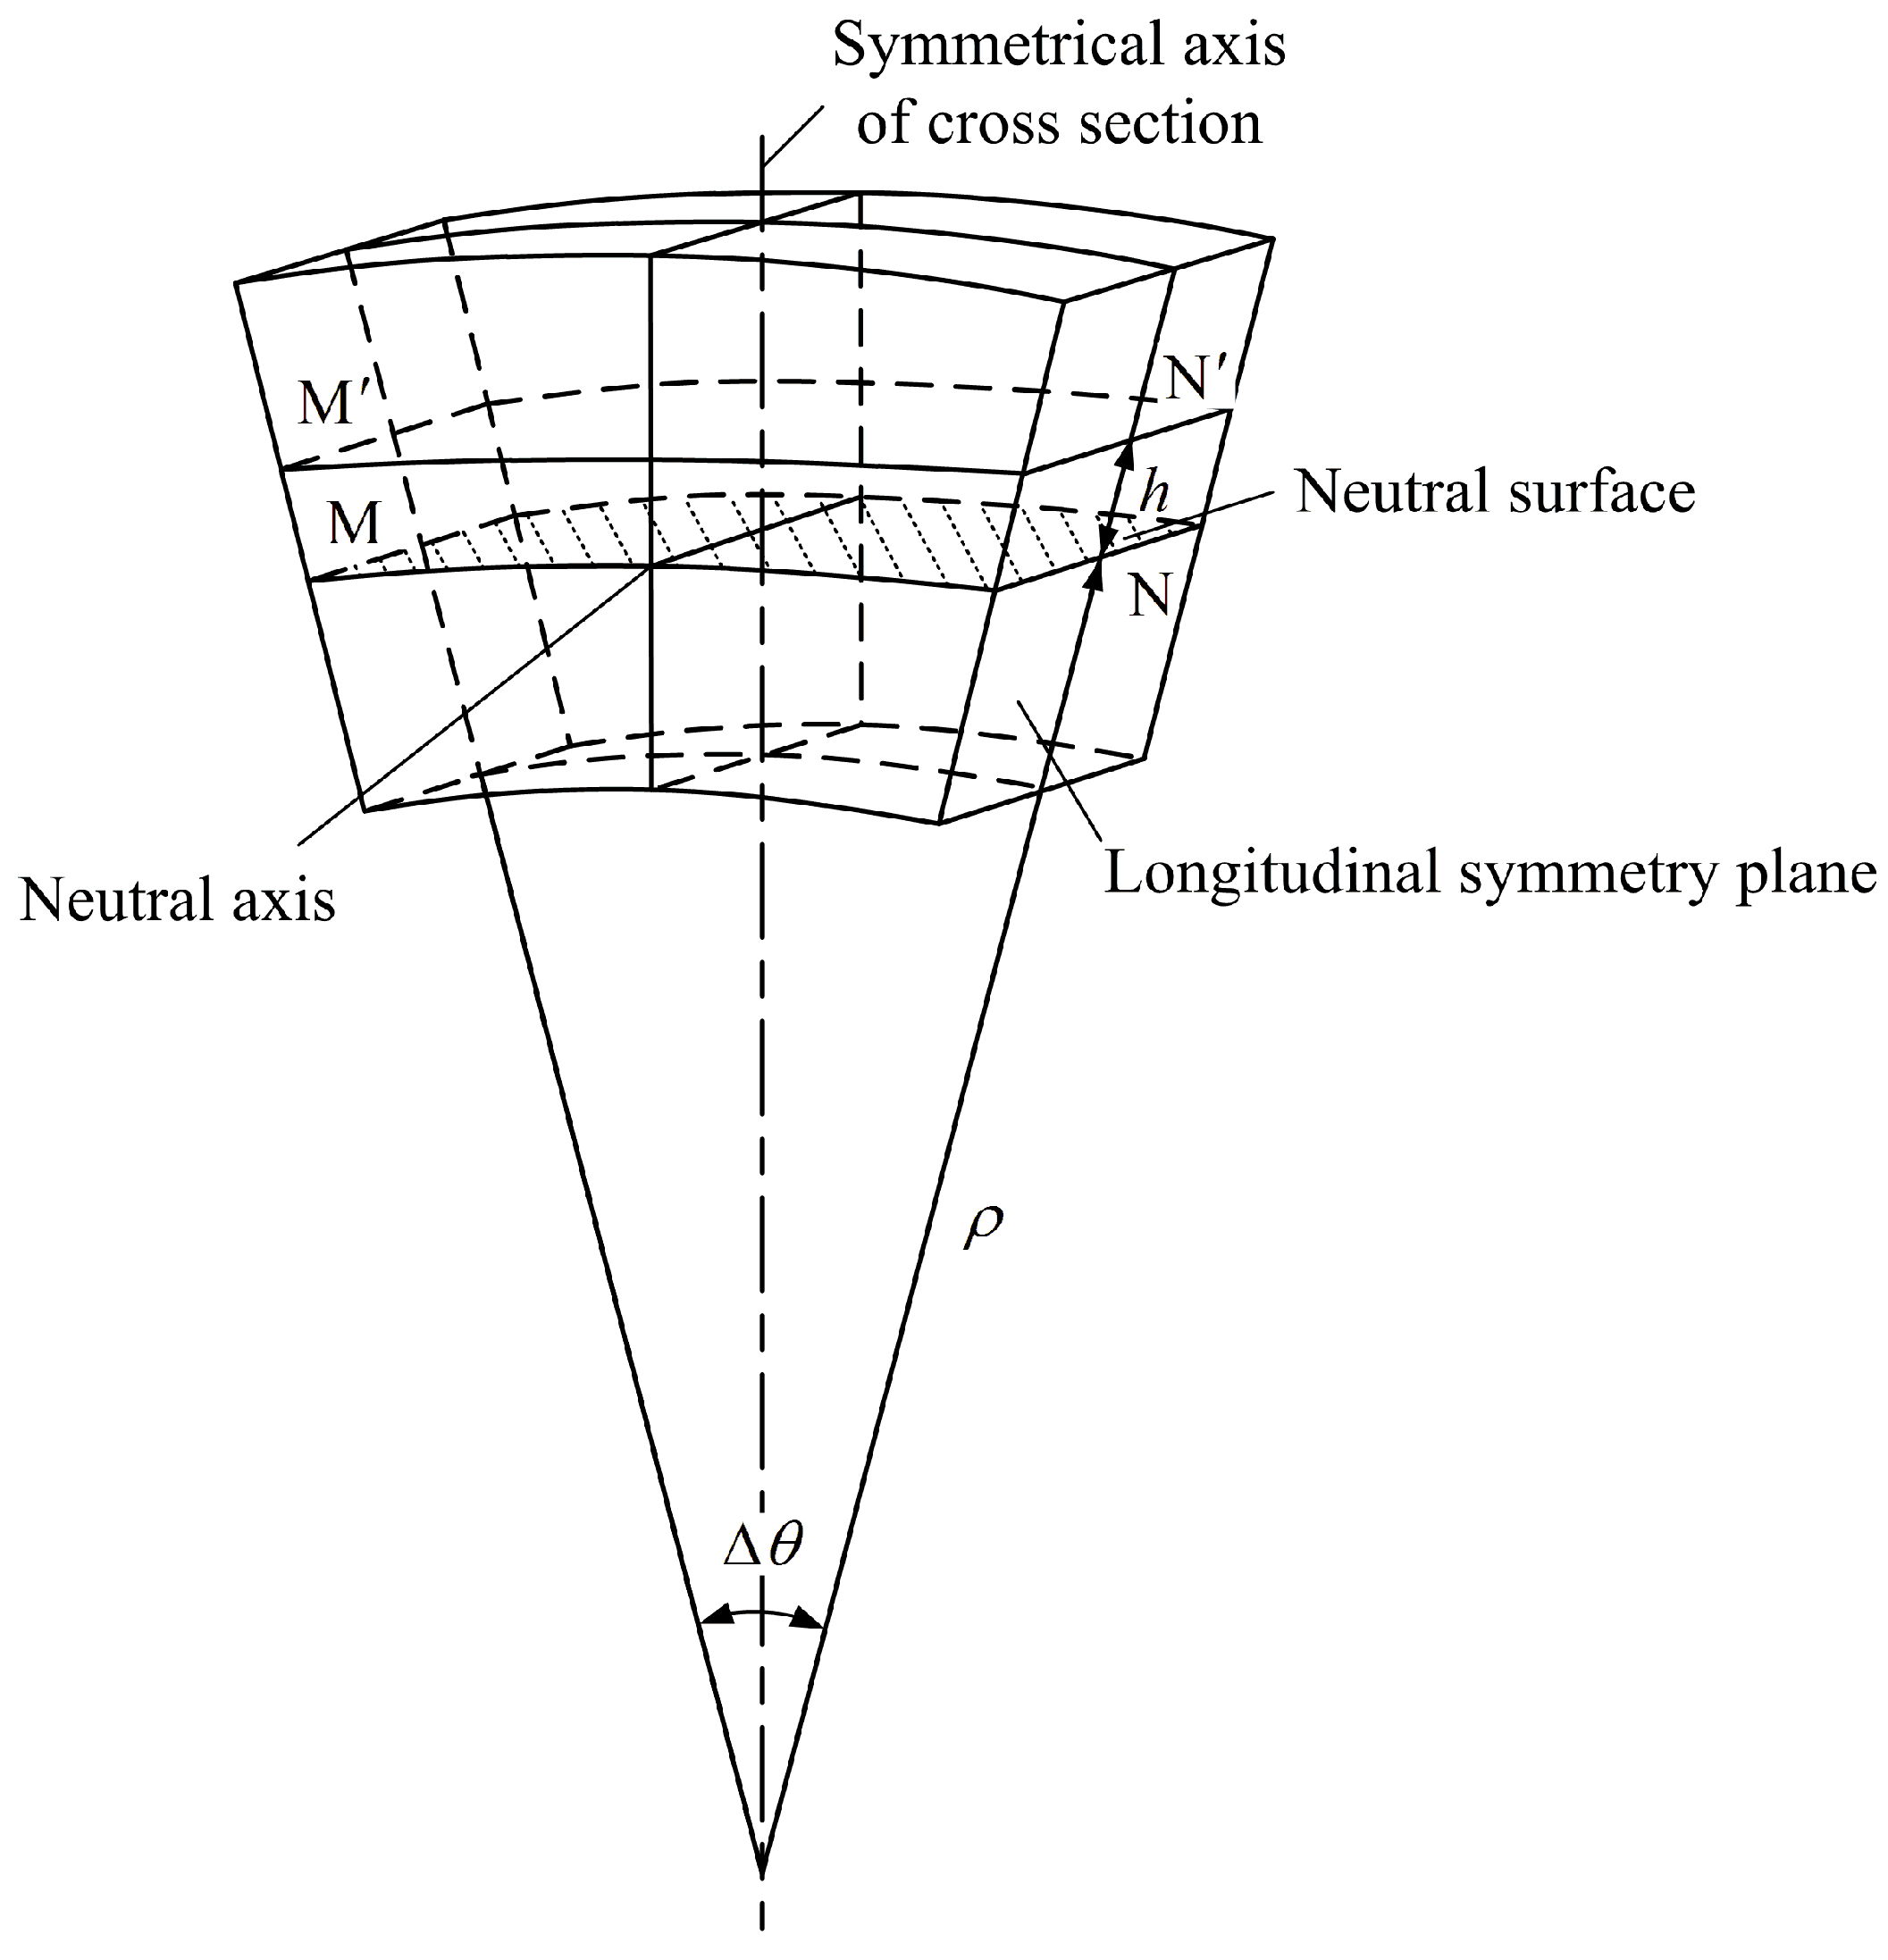
Figure 4.
Stress-strain distribution during bending process.
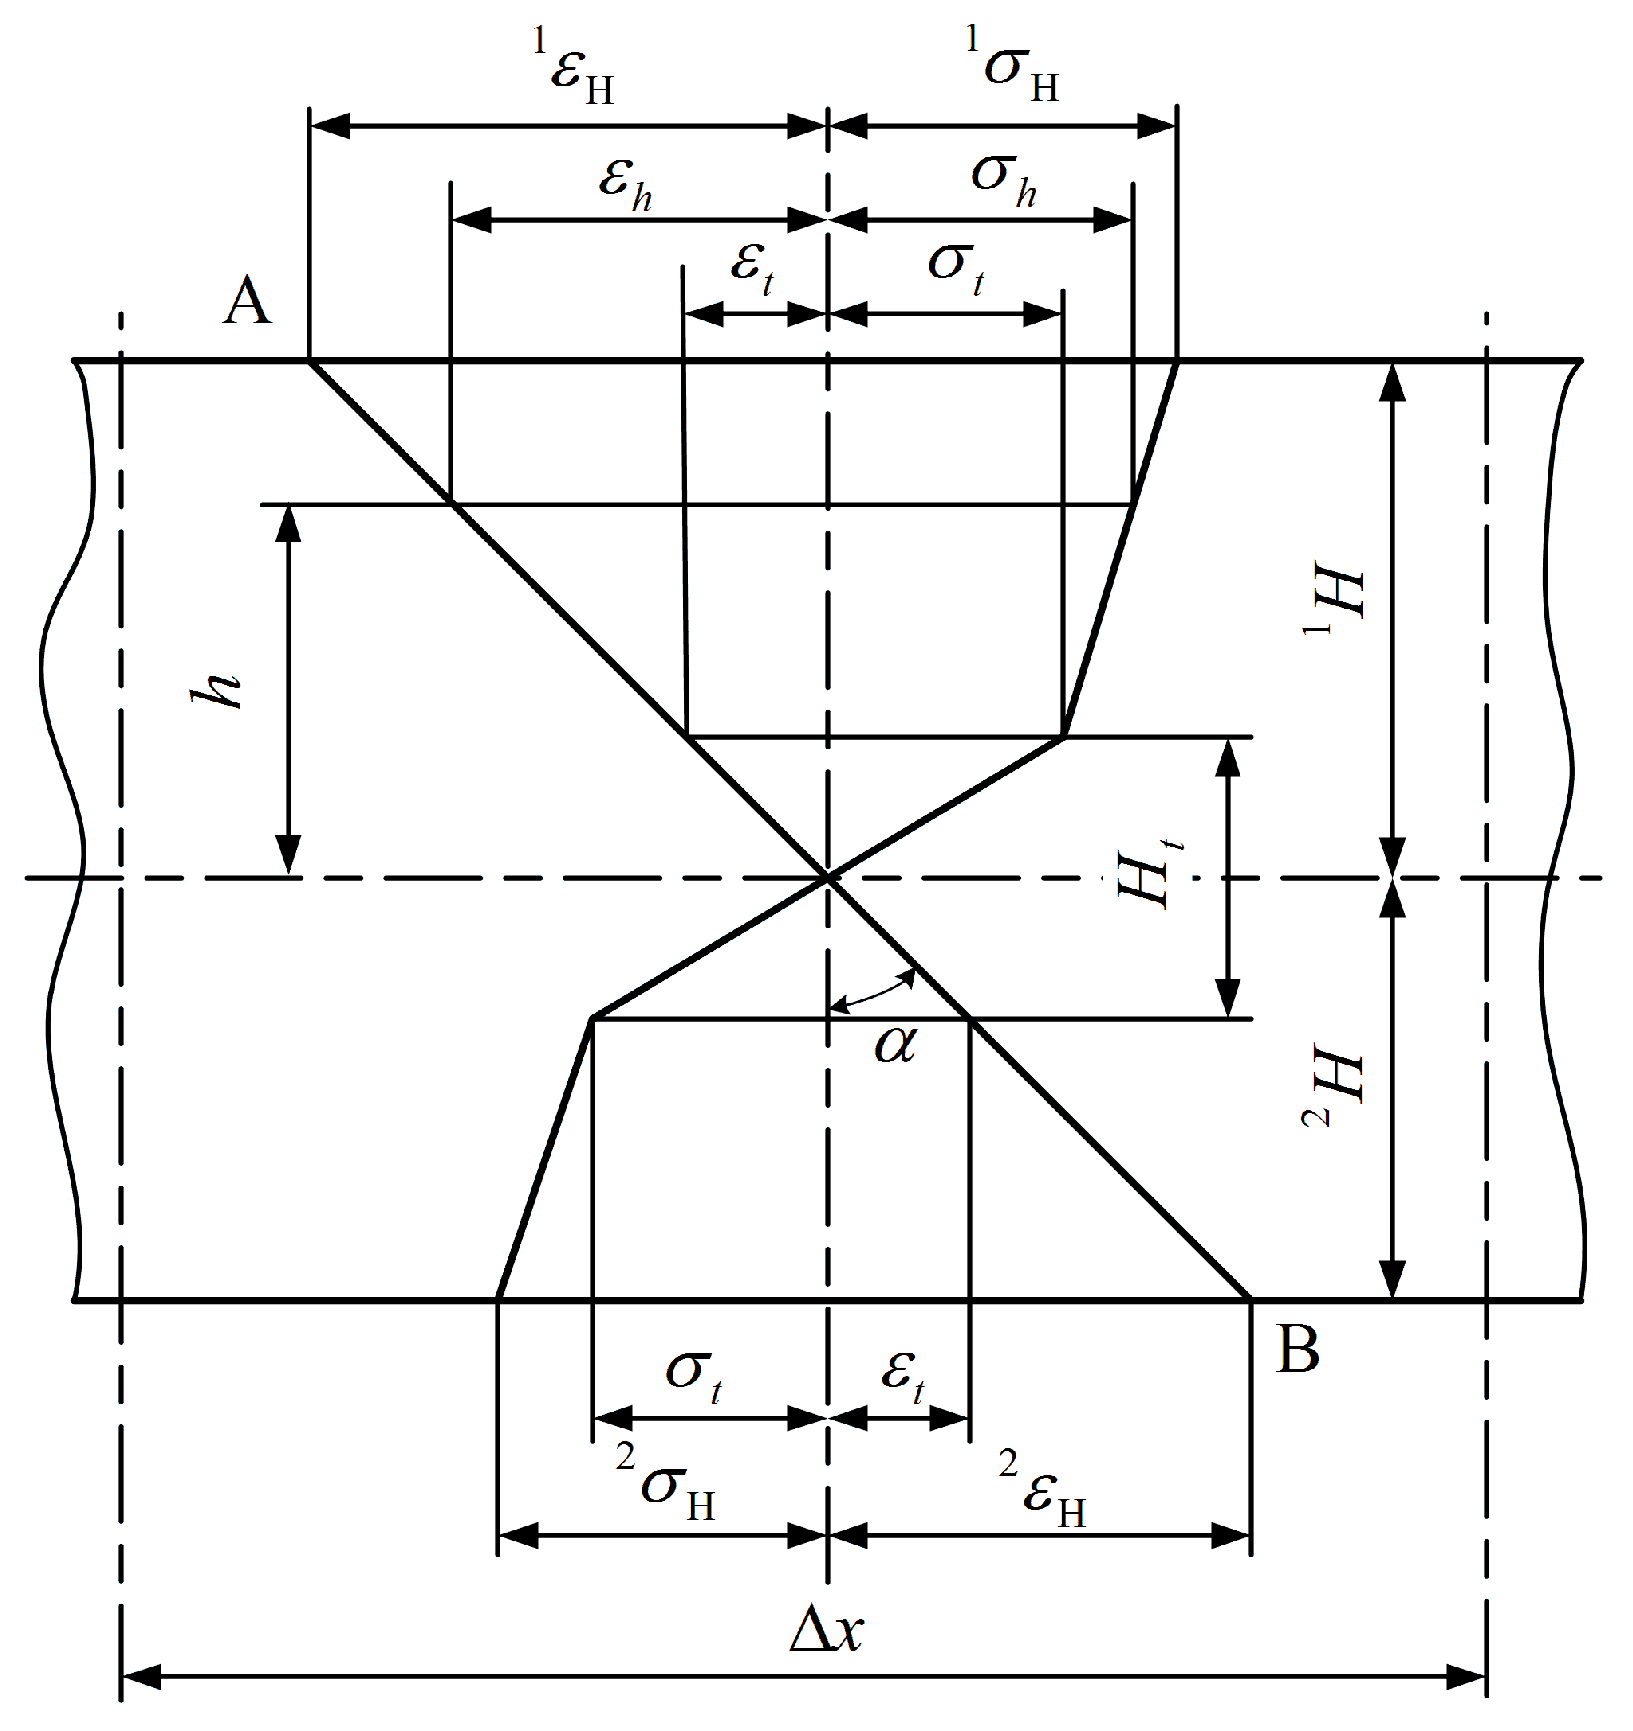
Figure 5.
The mechanism of residual stress and strain.

Figure 6.
Flow chart with respect to the calculation of the analytical model.

Figure 7.
Cross-section parameters of sample workpiece.
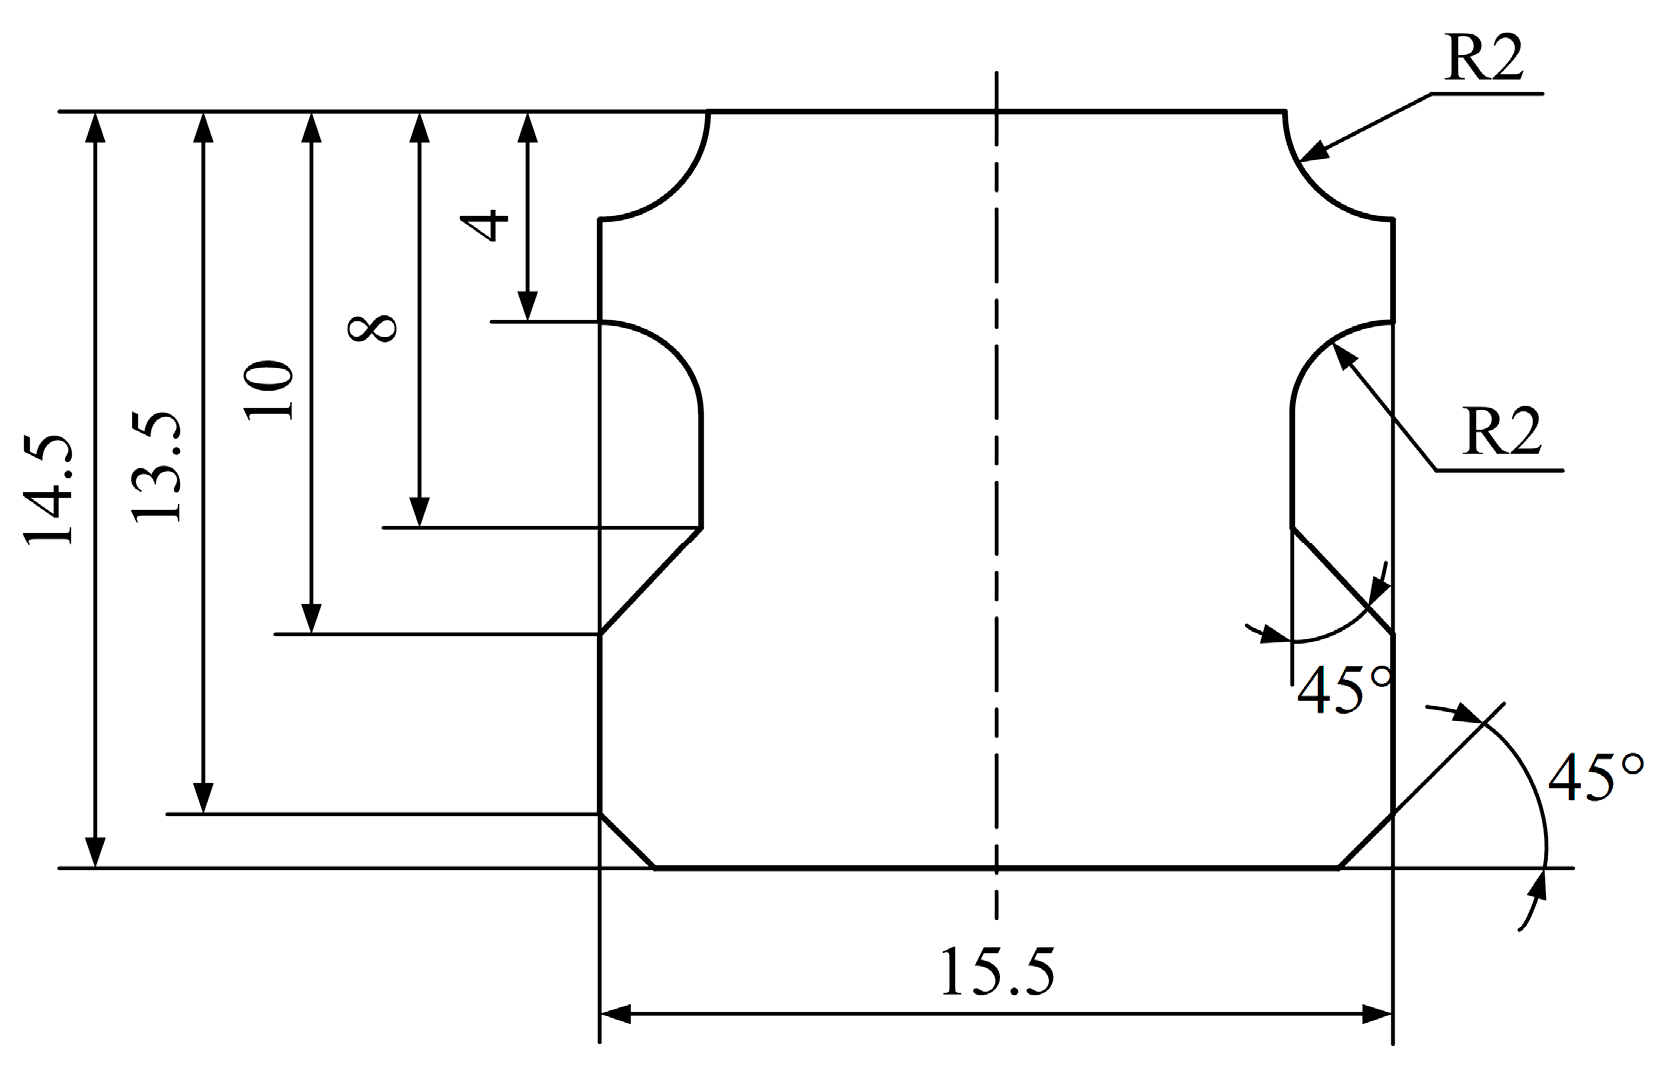
Figure 8.
Stress-strain curve of GCr15.
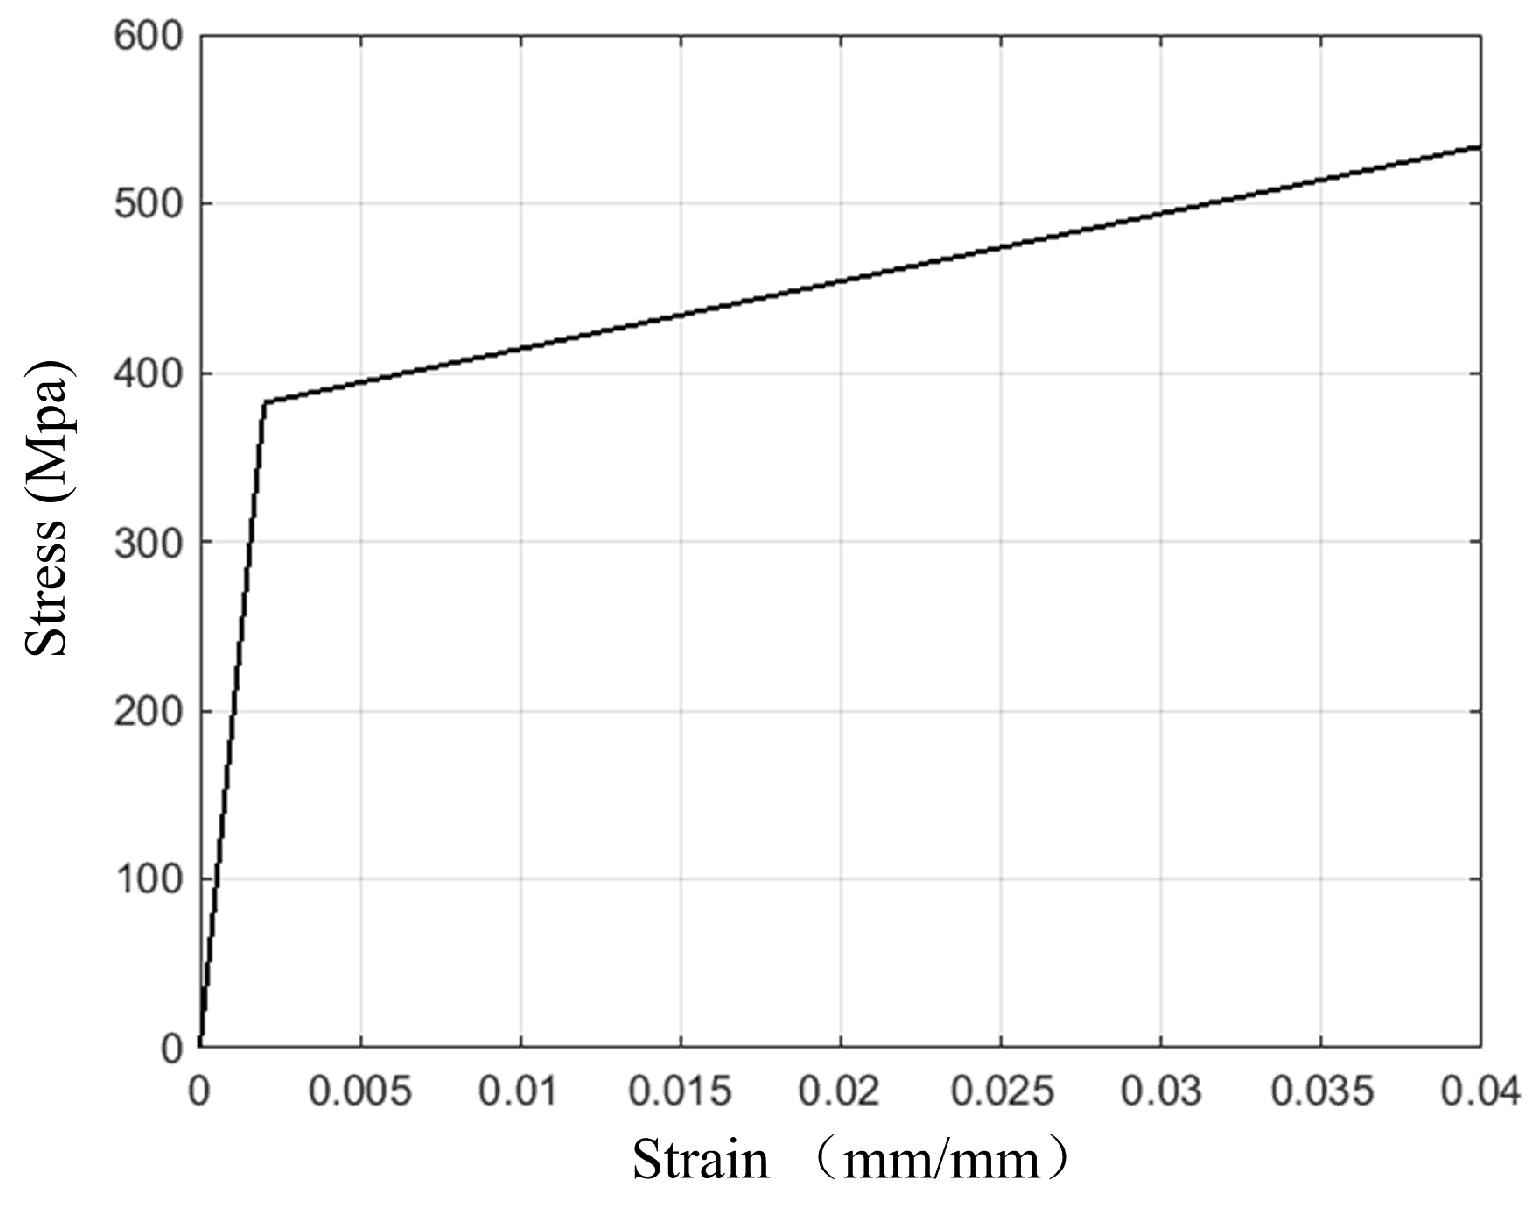
Figure 9.
FE model of the multi-step straightening process with respect to linear guideways: (a) the 3D numerical model of the straightening process; (b) meshing and boundary conditions in the compressive direction of straightening process; (c) meshing and boundary conditions in the tensile direction of straightening process.

Figure 10.
Analysis of simulation results with respect to the multi-step straightening process of linear guideways: (a) deformation of linear guideway after the straightening process; (b) longitudinal stress curve obtained by the defined path.
Figure 10.
Analysis of simulation results with respect to the multi-step straightening process of linear guideways: (a) deformation of linear guideway after the straightening process; (b) longitudinal stress curve obtained by the defined path.

Figure 11.
Theoretical results and simulation results of longitudinal stress distribution during the multi-step straightening process with respect to the opposite straightening directions: (a) stress curves with respect to first loading process; (b) residual stress curves with respect to first unloading process; (c) stress curves with respect to second loading process; (d) permeation between workpiece and indenter during the multi-step straightening process.
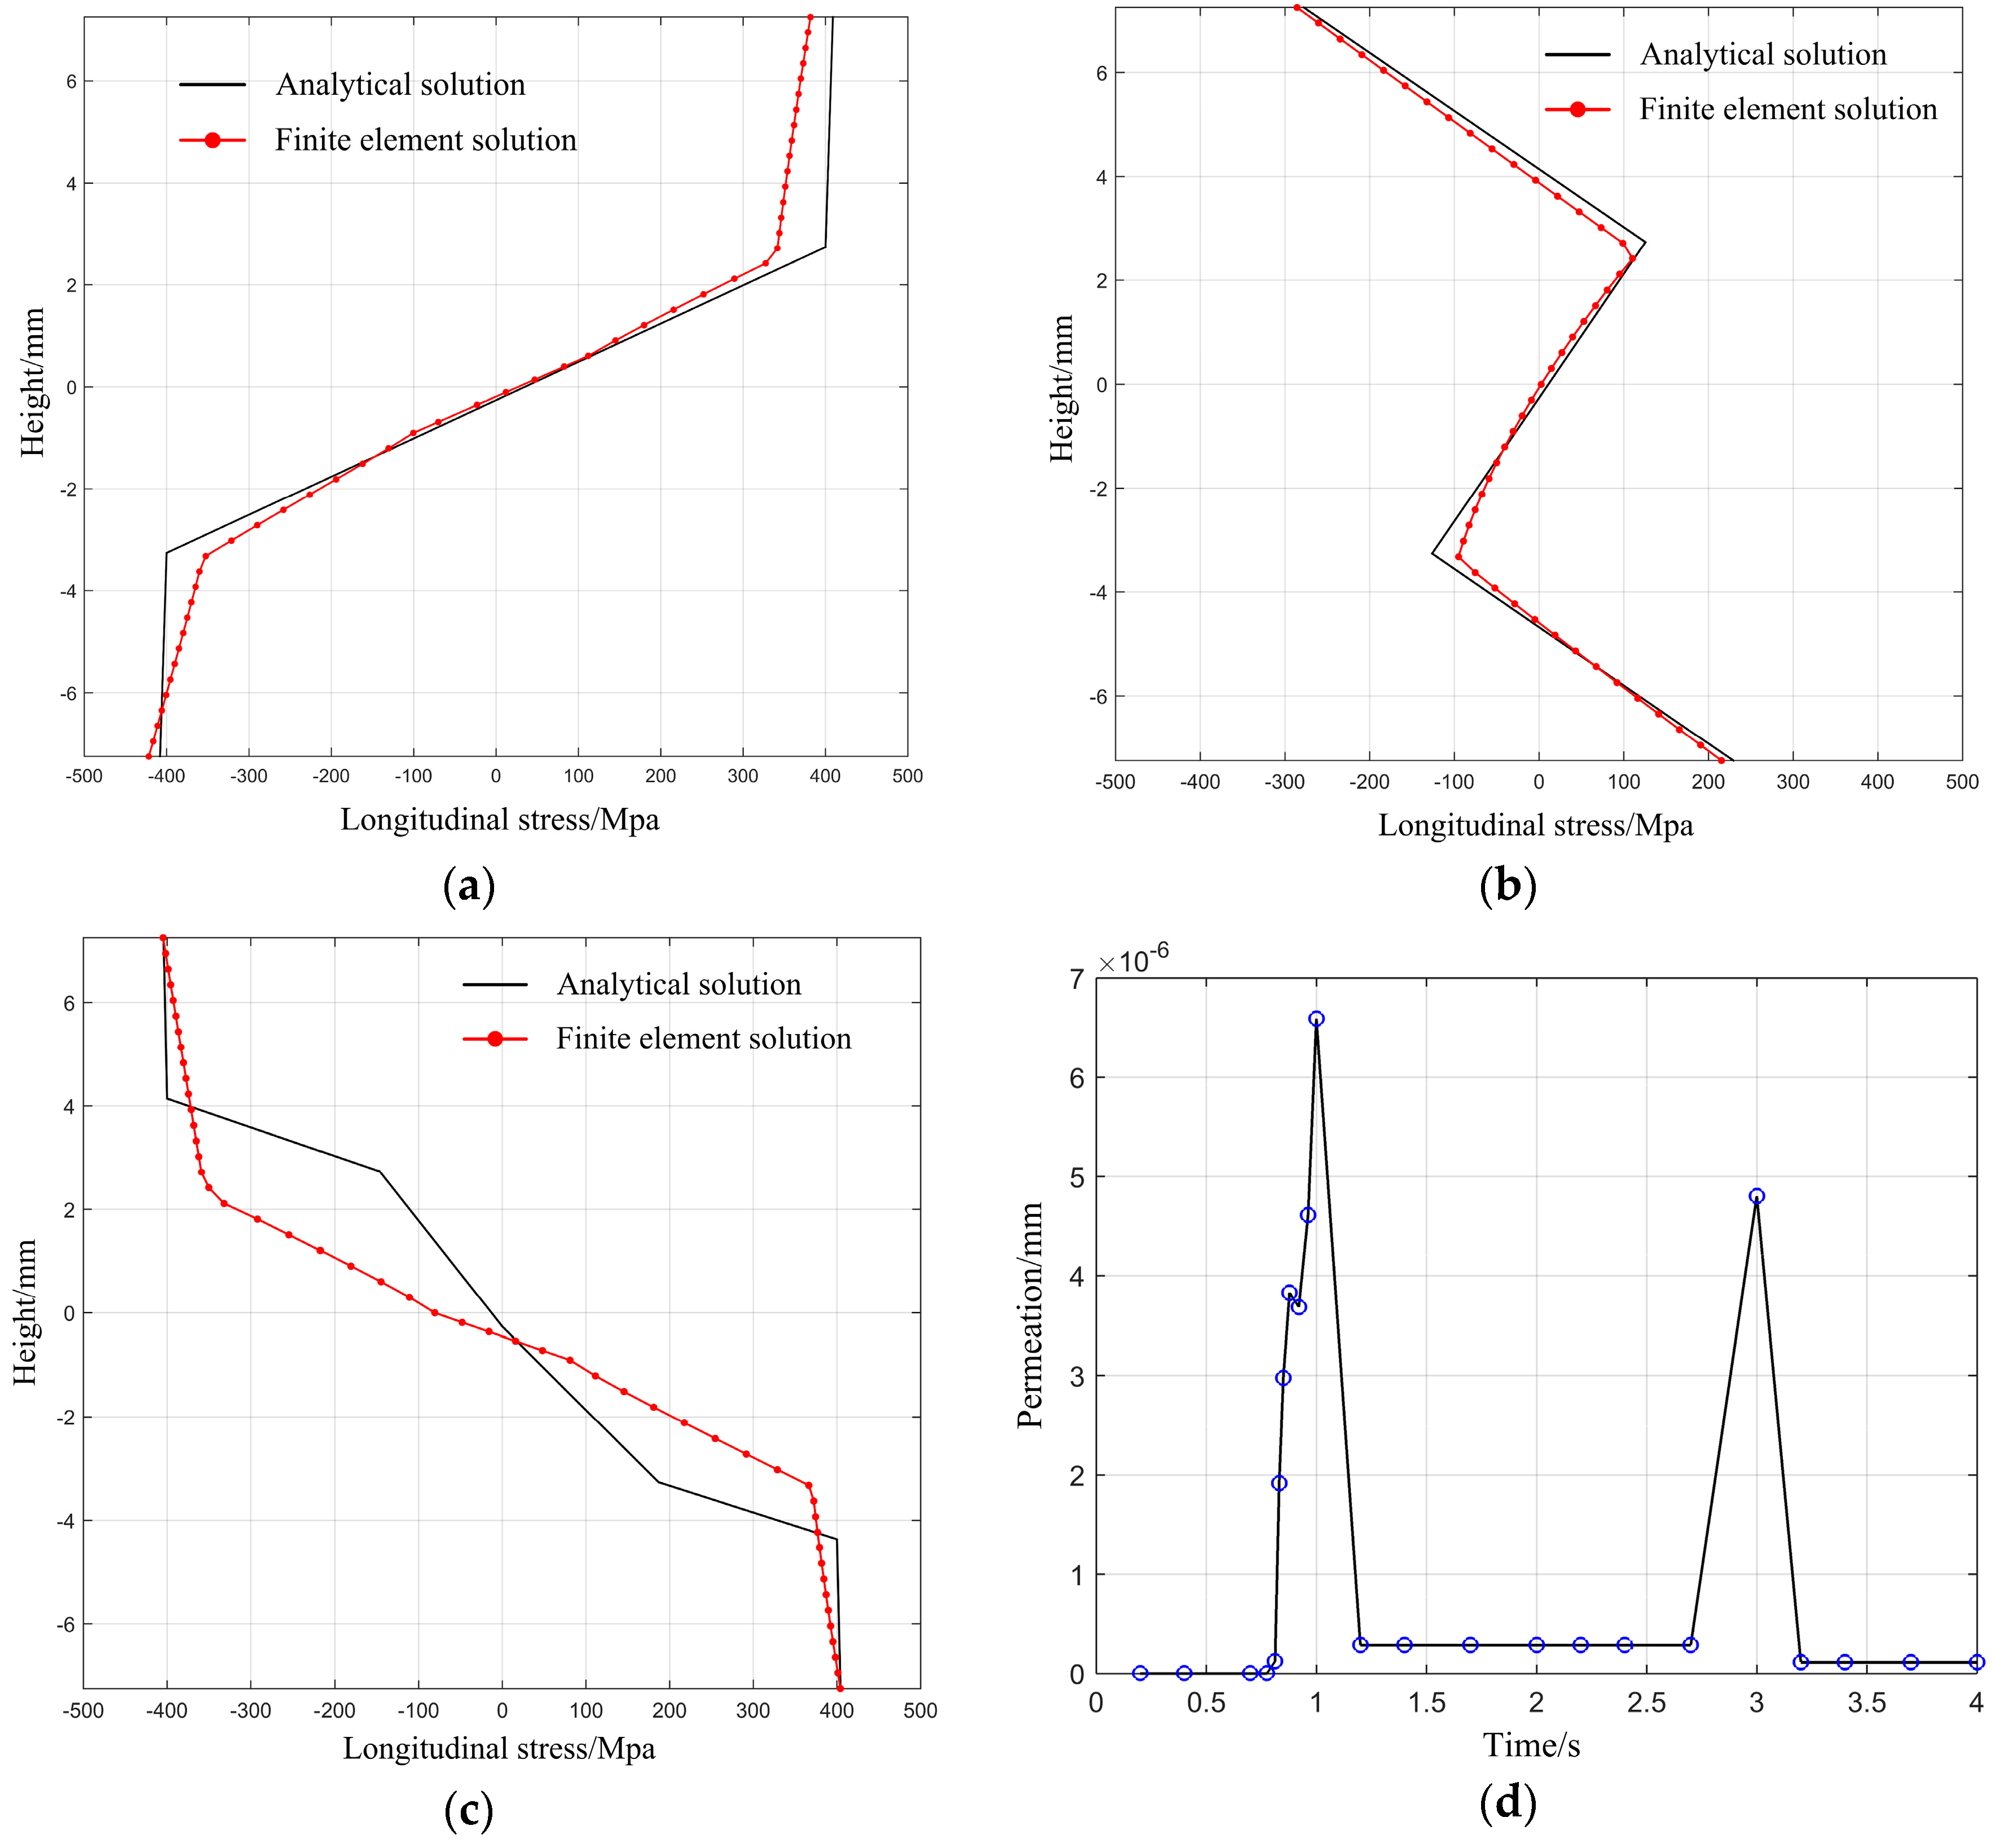
Figure 12.
Theoretical results and simulation results of longitudinal stress distribution during the multi-step straightening process with respect to the same straightening directions: (a) stress curves with respect to first loading process; (b) residual stress curves with respect to first unloading process; (c) stress curves with respect to second loading process; (d) permeation between workpiece and indenter during multi-step straightening process.
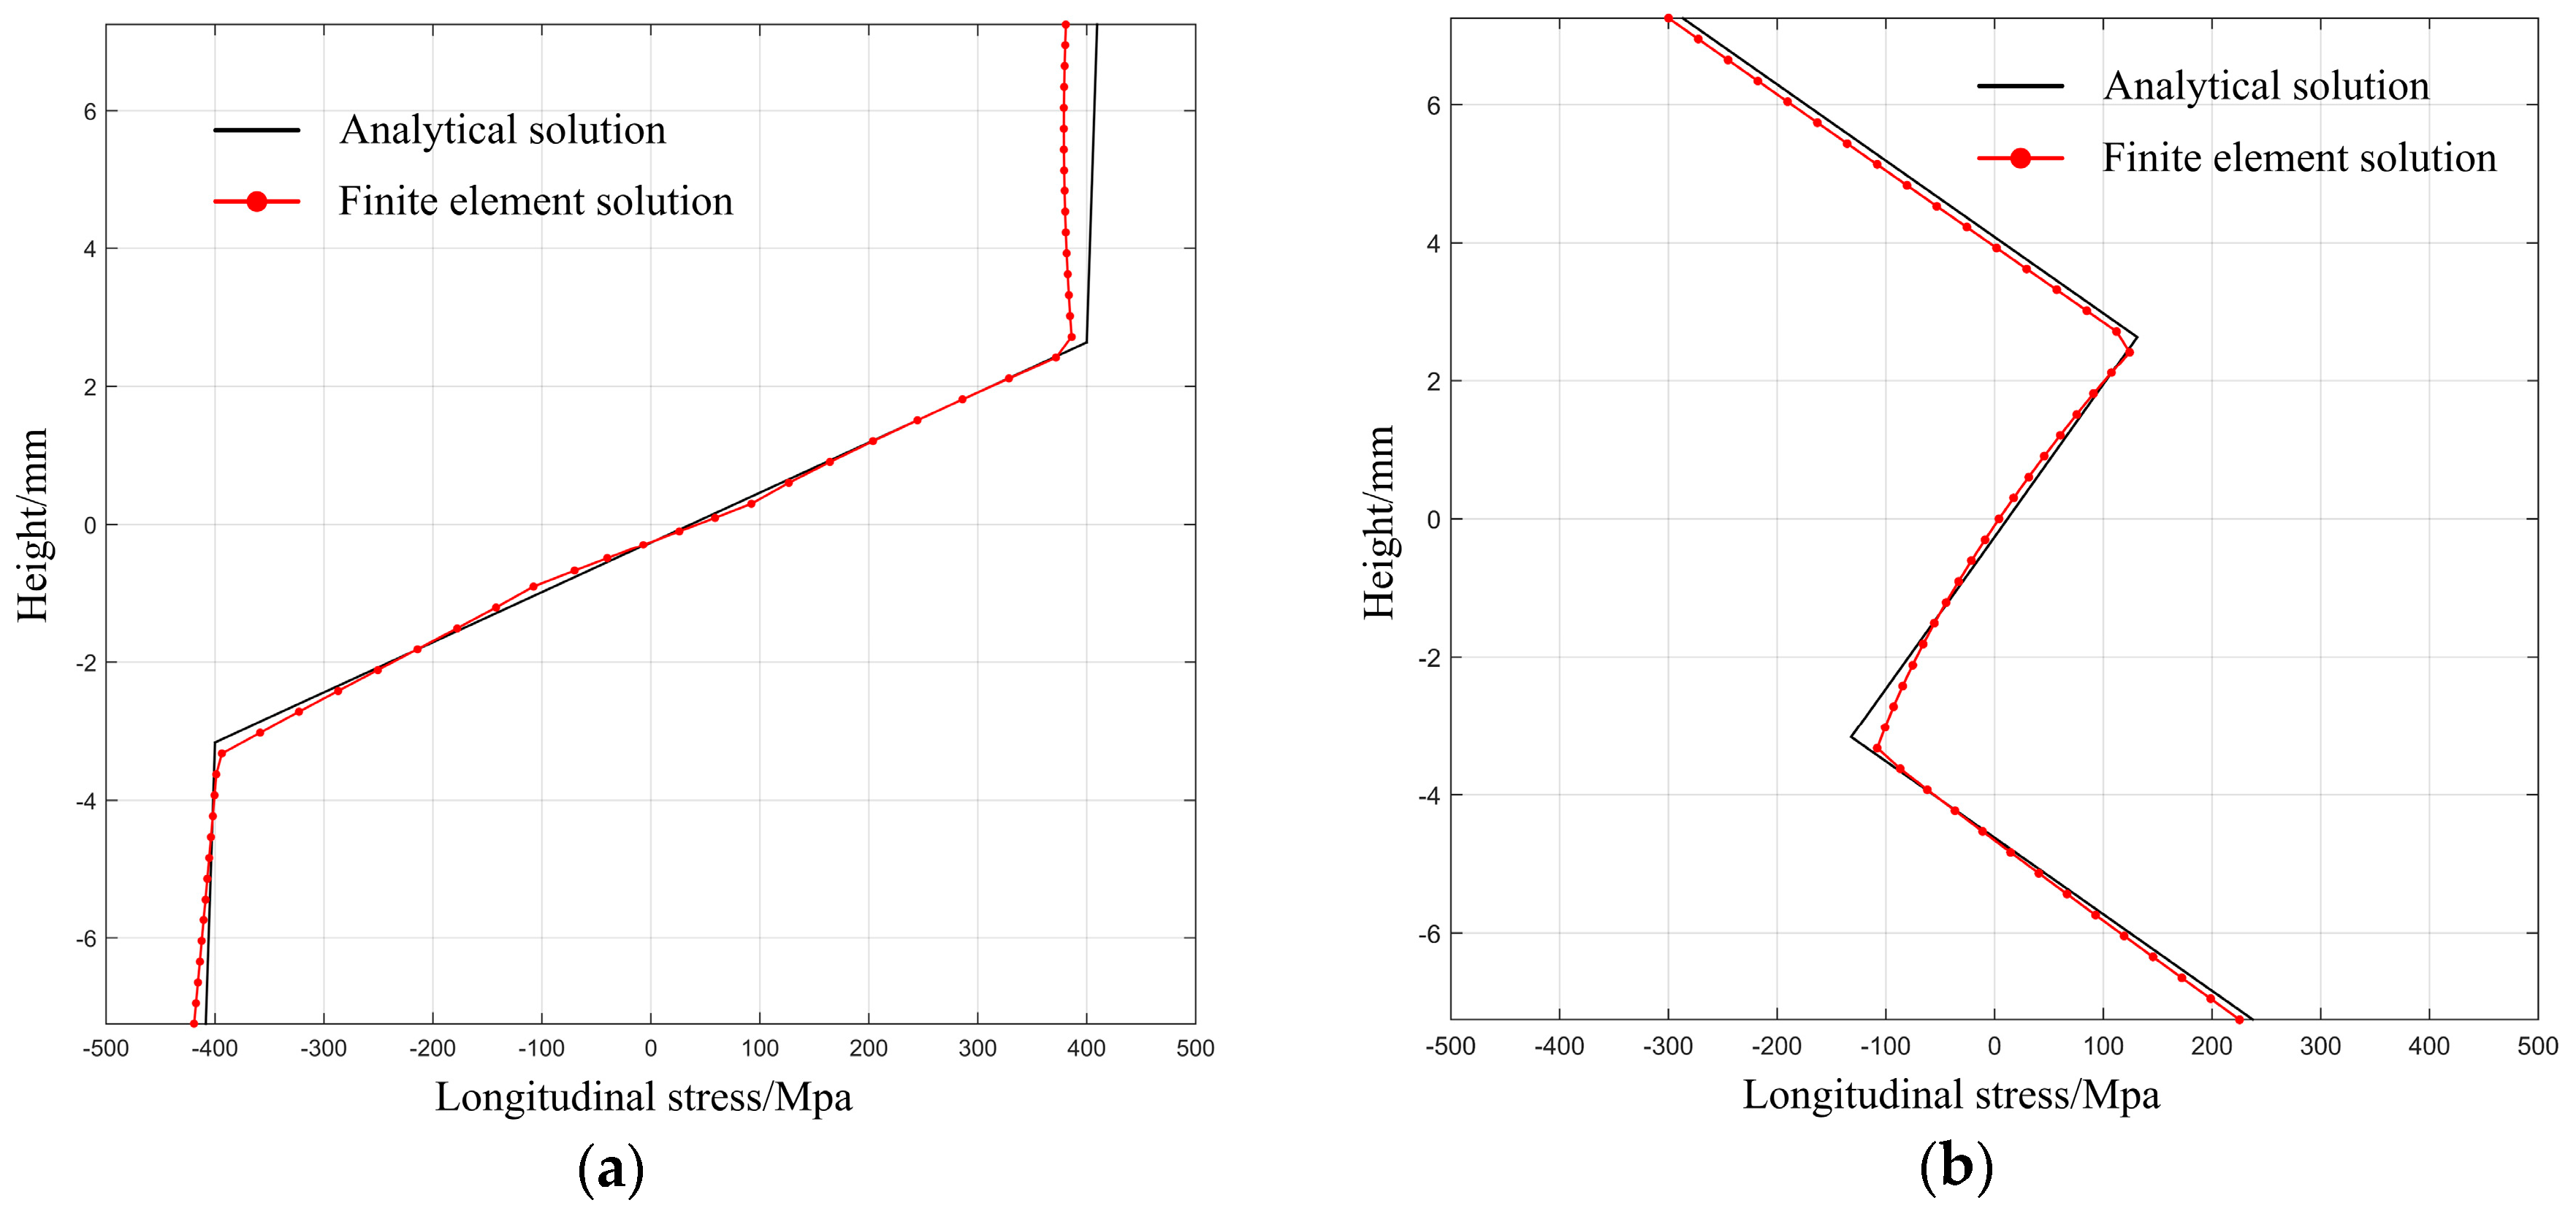
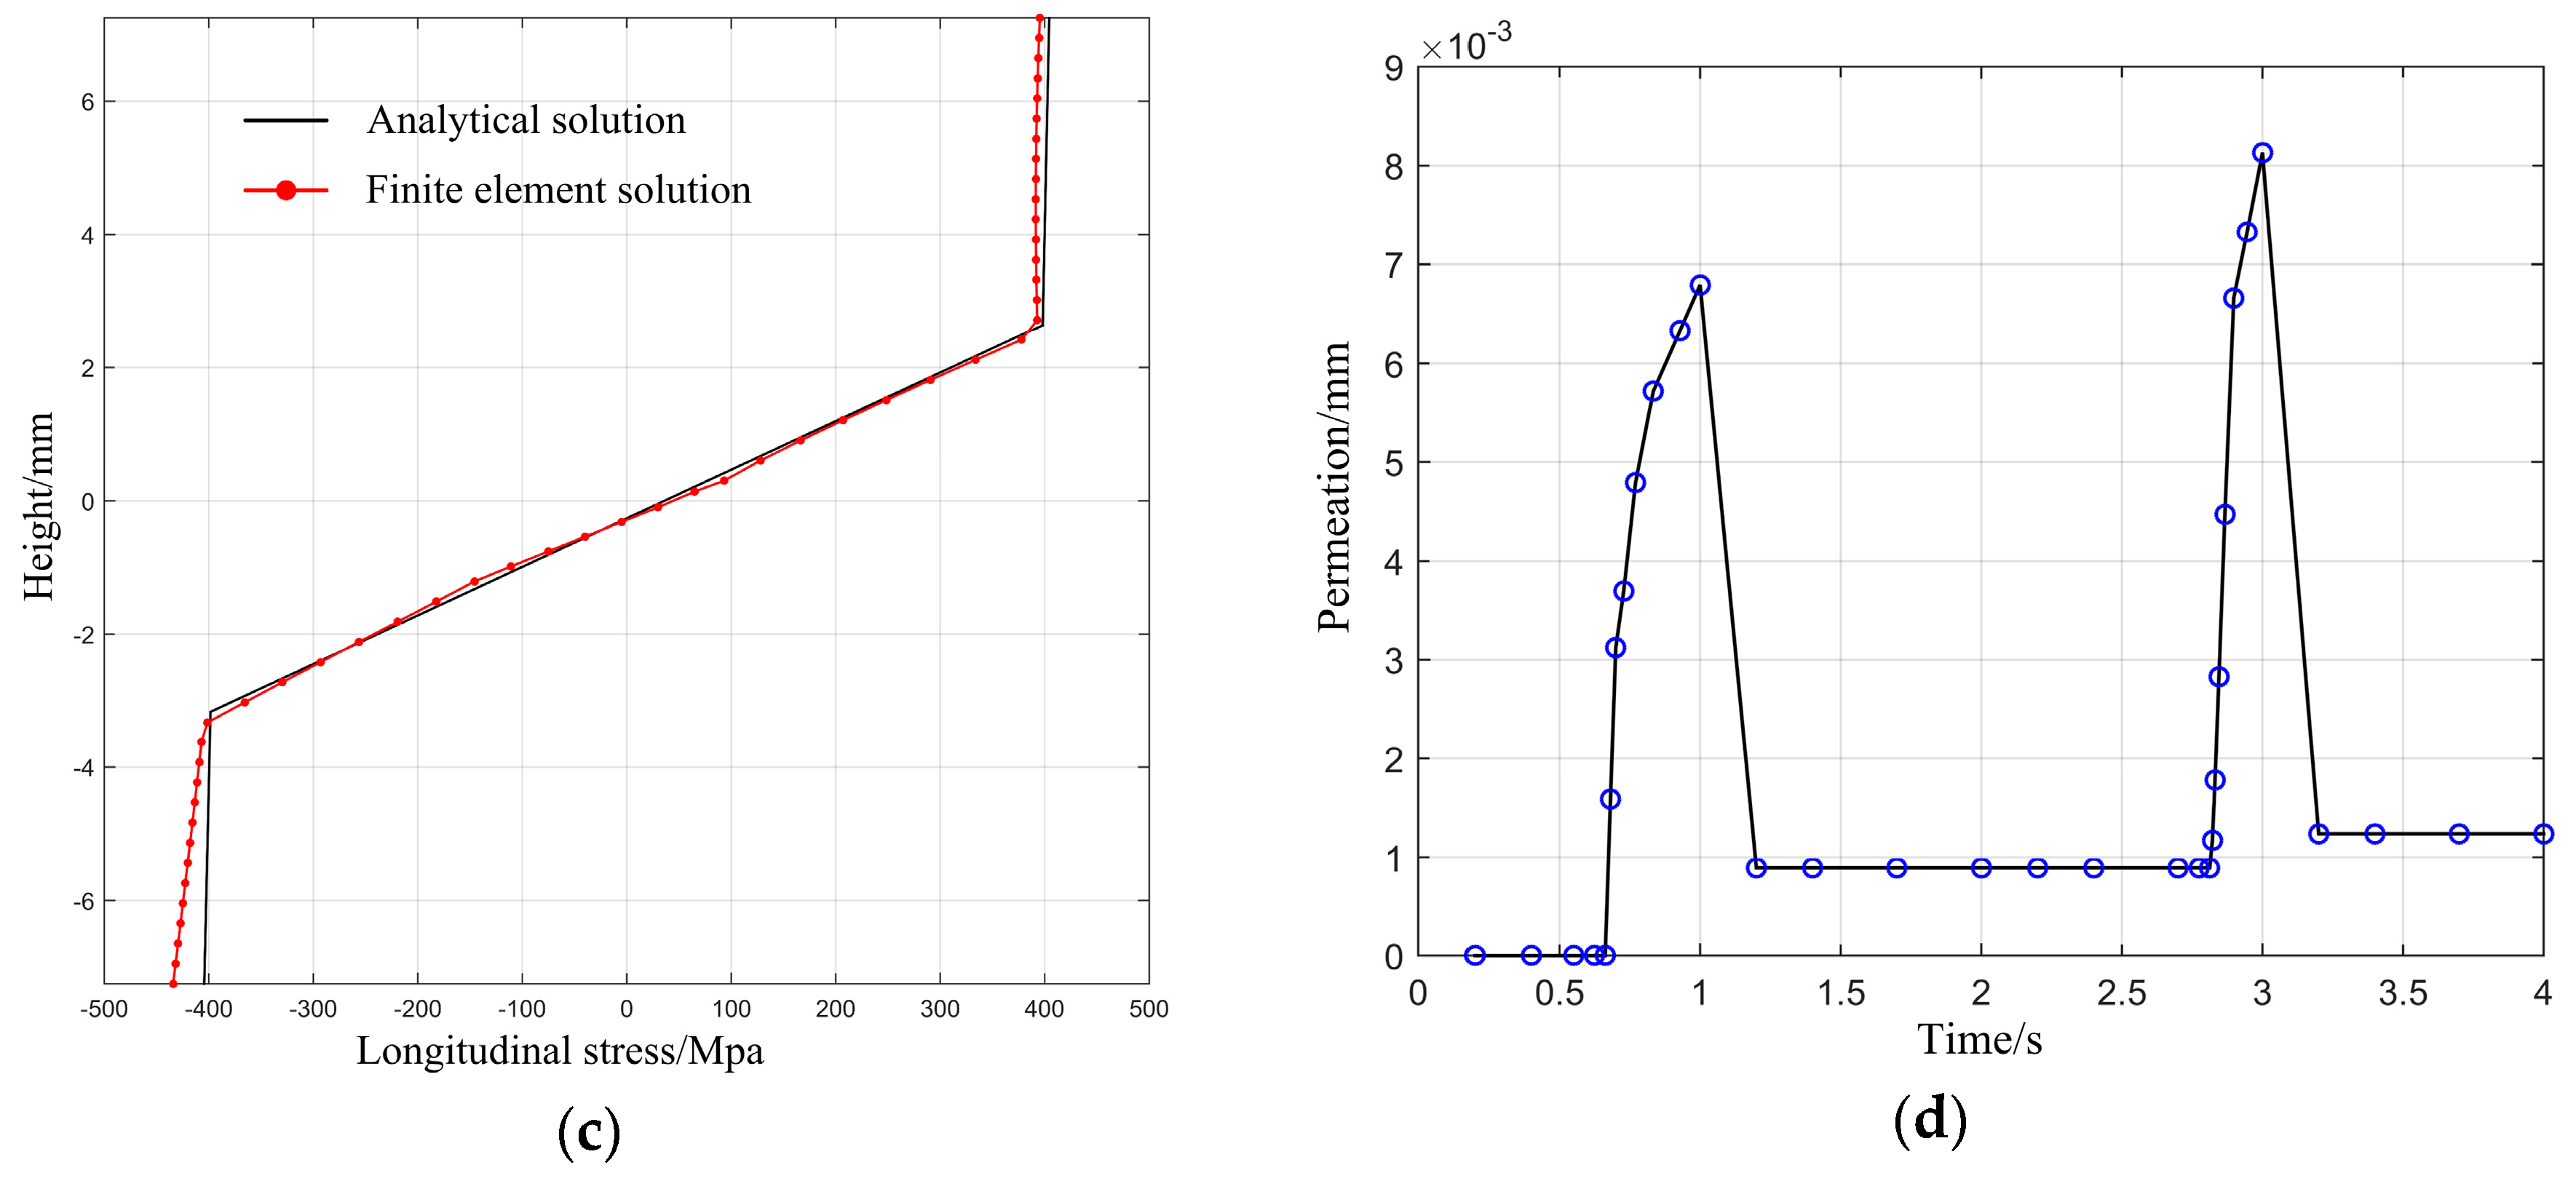
Figure 13.
Configurations for straightening experiments.

Figure 14.
Bridge circuit of strain measurement.
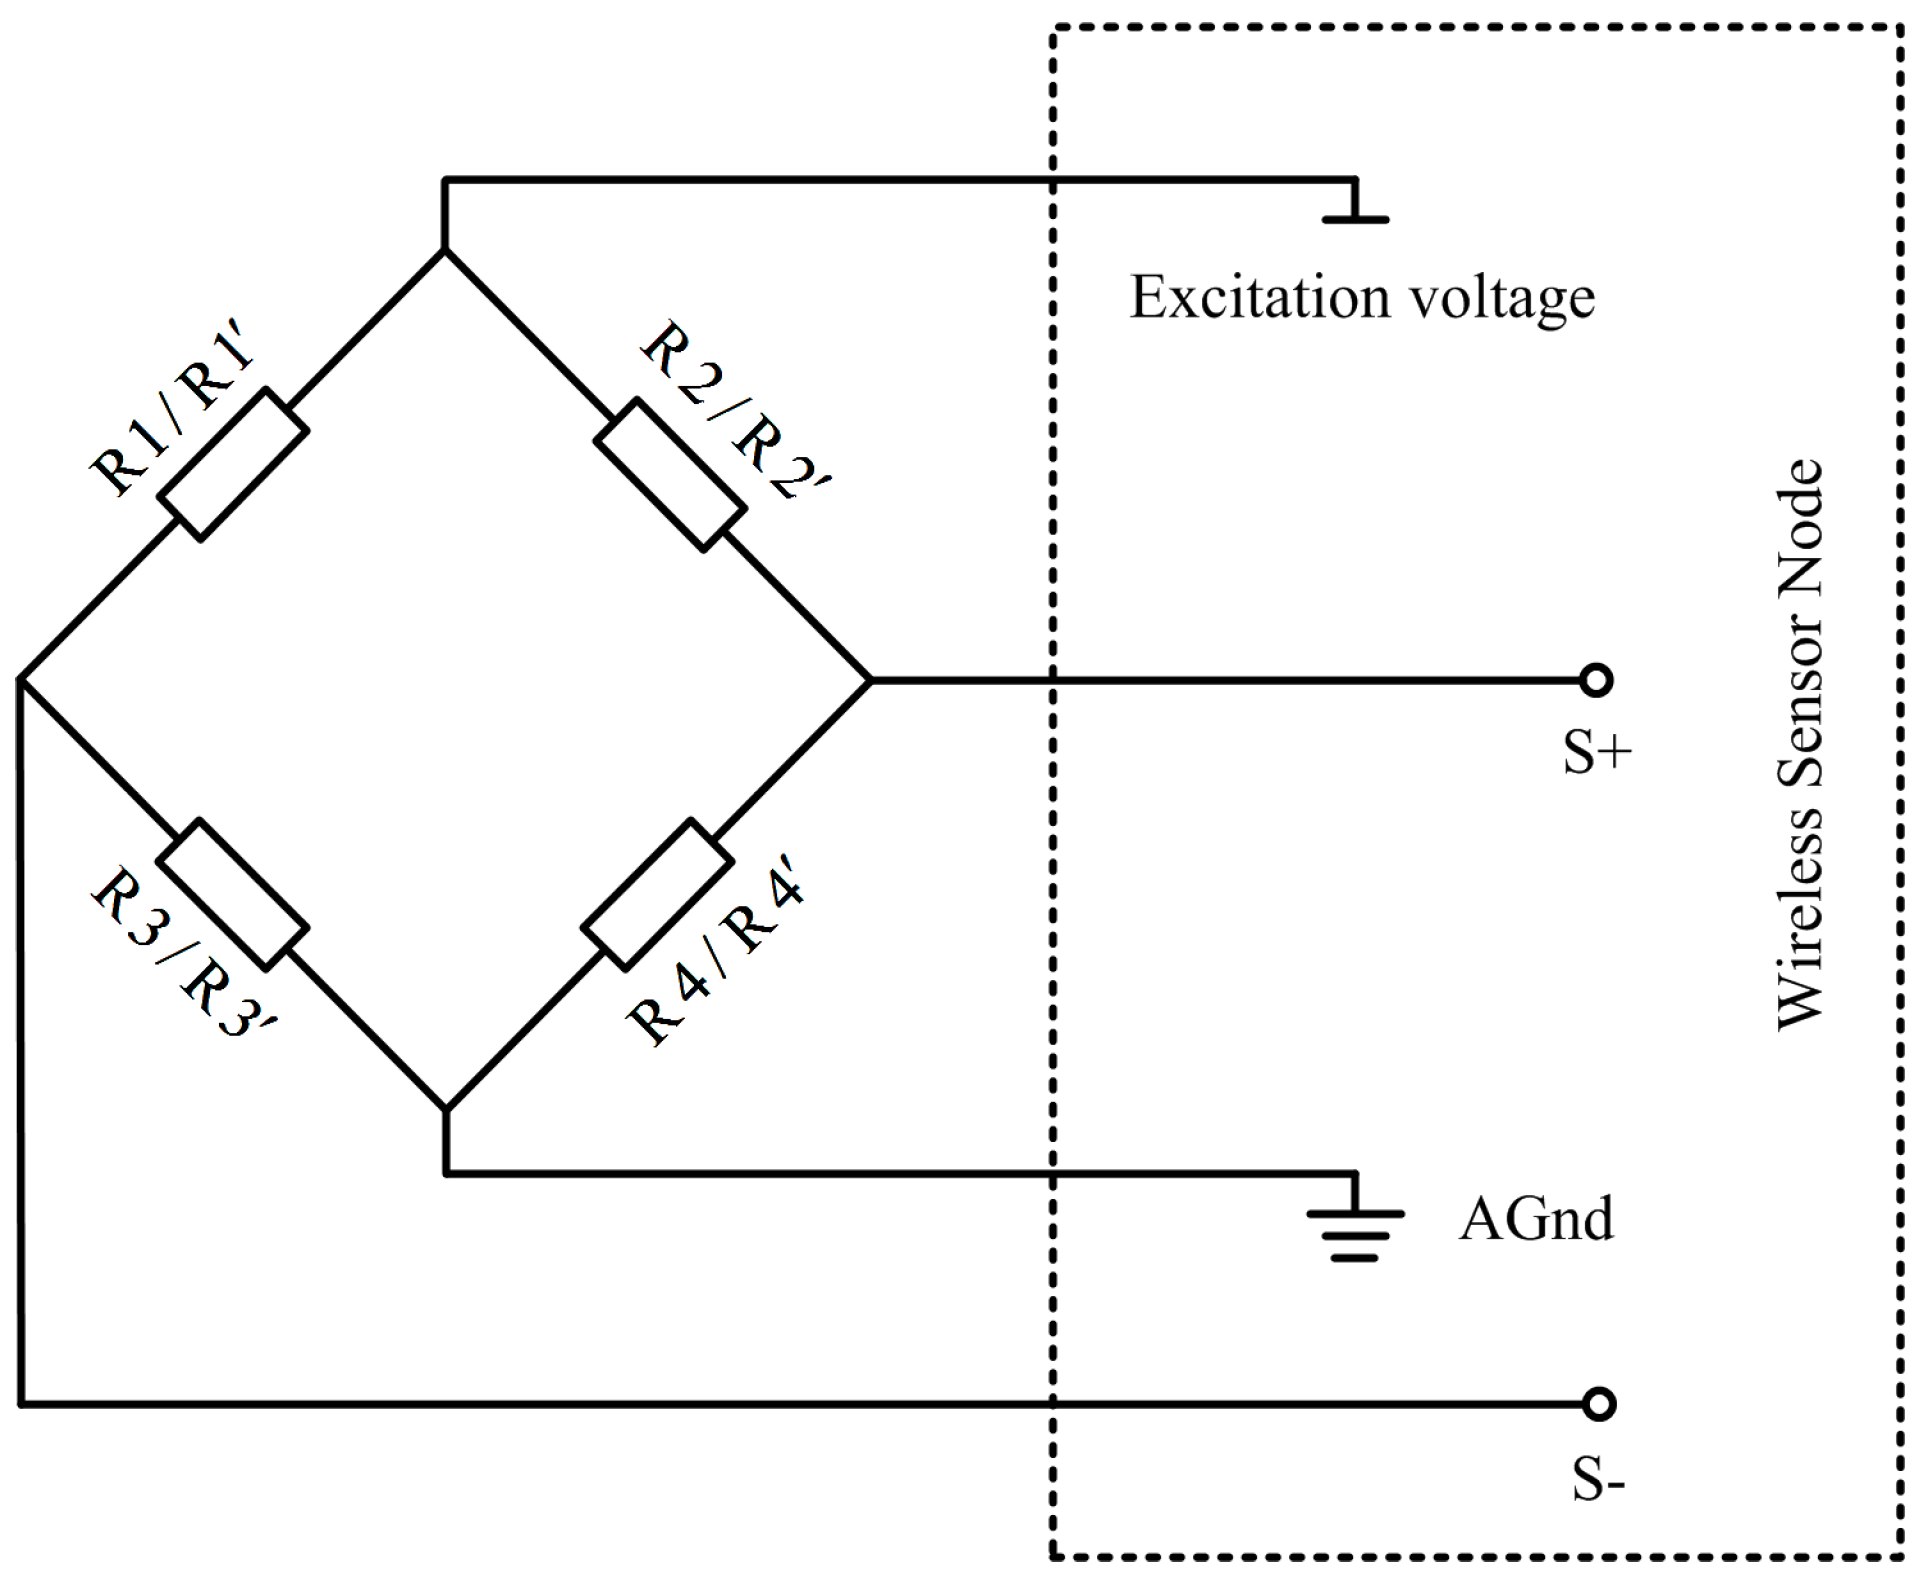
Figure 15.
Experimental setup of straightening process.

Figure 16.
Superficial strain of the sample workpiece: (a) superficial strain on tensile surface; (b) superficial strain on compressive surface.
Figure 16.
Superficial strain of the sample workpiece: (a) superficial strain on tensile surface; (b) superficial strain on compressive surface.

Table 1.
Parameters of FE model.
| Material | GCr15 |
|---|---|
| Density (kg/m3) | 7810 |
| Young’s modulus (E/Mpa) | 190,089 |
| Hardening modulus (/Mpa) | 3800 |
| Poison’s ratio | 0.3 |
| Yield stress (/Mpa) | 402 |
| Elastic-limit strain () | 0.004 |
| Specifications (mm) | LG15.5 × 14.5 × 400 |
| Distance between two clamps (/mm) | 300 |
| Initial deflection (/mm) | 1.581 |
Table 2.
Performance parameters of measurement system.
| Measurement range | ±3 mm |
| Measurement accuracy | 1/1024 mm |
| Linear error | ±1% |
| Repeatability error | 0.2 μm |
Table 3.
Theoretical, Finite Element Analysis (FEA), and experimental results.
| First Straightening Step | First Unloading | Second Straightening Step | ||||||||
|---|---|---|---|---|---|---|---|---|---|---|
| Theor. | FEA | Expt. | Theor. | FEA | Expt. | Theor. | FEA | Expt. | ||
| Tensile region | Strain (10−3) | 7.0 | 6.5 | 7.5 | 4.8 | 5.0 | 5.2 | 5.5 | 5.7 | 6.0 |
| Stress (Mpa) | 408 | 382 | ─ | 278 | 286 | ─ | 405 | 407 | ─ | |
| Compressive region | Strain (10−3) | 7.5 | 7.8 | 8.0 | 4.5 | 4.1 | 5.1 | 5.5 | 5.8 | 5.9 |
| Stress (Mpa) | 409 | 421 | ─ | 230 | 216 | ─ | 405 | 408 | ─ | |
© 2018 by the authors. Licensee MDPI, Basel, Switzerland. This article is an open access article distributed under the terms and conditions of the Creative Commons Attribution (CC BY) license (http://creativecommons.org/licenses/by/4.0/).
Share and Cite
MDPI and ACS Style
Zhang, Y.; Lu, H.; Ling, H.; Lian, Y.; Ma, M. Analytical Model of a Multi-Step Straightening Process for Linear Guideways Considering Neutral Axis Deviation. Symmetry 2018, 10, 316. https://doi.org/10.3390/sym10080316
AMA Style
Zhang Y, Lu H, Ling H, Lian Y, Ma M. Analytical Model of a Multi-Step Straightening Process for Linear Guideways Considering Neutral Axis Deviation. Symmetry. 2018; 10(8):316. https://doi.org/10.3390/sym10080316
Chicago/Turabian StyleZhang, Yongquan, Hong Lu, He Ling, Yang Lian, and Mingtian Ma. 2018. "Analytical Model of a Multi-Step Straightening Process for Linear Guideways Considering Neutral Axis Deviation" Symmetry 10, no. 8: 316. https://doi.org/10.3390/sym10080316
Note that from the first issue of 2016, this journal uses article numbers instead of page numbers. See further details here.