False Data Injection Attack Based on Hyperplane Migration of Support Vector Machine in Transmission Network of the Smart Grid


1
College of Computer, National University of Defense Technology, Changsha 410000, China
2
Department of Electronic Information and Electrical Engineering, Changsha University, Changsha 410022, China
*
Authors to whom correspondence should be addressed.
Symmetry 2018, 10(5), 165; https://doi.org/10.3390/sym10050165
Submission received: 8 April 2018
/
Revised: 13 May 2018
/
Accepted: 14 May 2018
/
Published: 15 May 2018
(This article belongs to the Special Issue Symmetry and Asymmetry Applications for Internet of Things Security and Privacy)
Abstract
:The smart grid is a key piece of infrastructure and its security has attracted widespread attention. The false data injection (FDI) attack is one of the important research issues in the field of smart grid security. Because this kind of attack has a great impact on the safe and stable operation of the smart grid, many effective detection methods have been proposed, such as an FDI detector based on the support vector machine (SVM). In this paper, we first analyze the problem existing in the detector based on SVM. Then, we propose a new attack method to reduce the detection effect of the FDI detector based on SVM and give a proof. The core of the method is that the FDI detector based on SVM cannot detect the attack vectors which are specially constructed and can replace the attack vectors into the training set when it is updated. Therefore, the training set is changed and then the next training result will be affected. With the increase of the number of the attack vectors which are injected into the positive space, the hyperplane moves to the side of the negative space, and the detection effect of the FDI detector based on SVM is reduced. Finally, we analyze the impact of different data injection modes for training results. Simulation experiments show that this attack method can impact the effectiveness of the FDI detector based on SVM.
1. Introduction
All aspects of modern social life are inseparable from the normal running of the power grid. Once the power grid fails, the normal operation in many fields such as education, medical treatment, national defense, and finance will be affected. In recent years, with the development of new technologies, the combination of power grid and cyber information becomes tighter. Many smart meters are installed in the smart grid [1]. The control center estimates the running state of the smart grid through the data measured by these intelligent instruments and regulates the operation of the whole smart grid. However, many works have proposed attack methods in order to damage the estimation results, and the false data injection (FDI) attack is one of these methods.
An FDI attack is a malicious attack that has an adverse effect on estimating the state of the smart grid. The attackers can intrude the sensors to modify the measurement data. By directly falsifying the measurement data of the sensors, the measurement data received by the control center is not equal to the actual measurement data, and it is difficult for the detector to detect the attack vectors which are specially constructed [2]. Therefore, the result of state estimation may be wrong.
The state estimation is a basic method for the detection of bad data such as noise measurement and FDI, and its essence is to use the maximum standard residual method to verify whether the measurement data contains bad data. Much research has improved the detection effect of the state estimation [3,4,5,6,7,8]. However, some scholars have found that the methods based on state estimation have difficulty detecting the specially constructed attack data [9,10,11,12,13,14,15]. For example, Mohammad et al. proposed a “stealth attack”, and they proved that the state estimation has no effect on detecting this kind of attack [13]. Fortunately, many studies have proven that the method of using a support vector machine (SVM) to detect false data is more accurate [16,17,18].
However, the FDI detector based on SVM is also vulnerable. In this paper, we will analyze its vulnerability and propose an attack for degrading the effectiveness of the detector based on SVM. By injecting the attack vectors into the training set, the hyperplane will change and then the accuracy of training result will be decreased.
The contributions of this paper are as follows:
- We analyze the vulnerability of the detector based on SVM, which is the adverse effect of the updating of the training set of the detector based on SVM.
- Utilizing the above vulnerability, we propose an attack method that attackers can inject data into the positive sample space to shift the hyperplane towards the side of the negative sample space.
- We investigate two kinds of data injection modes: centralized injection and identically distributed injection, and analyze the impact of the two kinds of injection modes on the training set and the effectiveness of detecting them.
The rest of the paper is organized as follows. In Section 2, we introduce the basic idea of SVM and give a basic model for using SVM to detect FDI. In Section 3, we describe the attack model and propose the attack method. In Section 4, we verify the effectiveness of the proposed method through experiments. We conclude this paper in Section 5.
2. Preliminary
In this section, we briefly introduce the system model and the FDI attack model and then depict the detector based on SVM.
2.1. System Model
The system model of the smart grid is shown in Figure 1 [19]. First, the sensors transfer the real-time information of each node to the supervisory control and data acquisition (SCADA) system through the network. The SCADA system then transmits these measurements to the state estimator in the energy management system (EMS). The state estimator contains state estimation module and false data processing module [20]. The state estimation module is used to estimate the state of the smart grid, and the false data processing module is used to detect the measurement data. Through these two modules, when the real-time measurement data contains measurement or transmission errors, these can be detected [21]. The estimation results will be applied to control the operation of smart grid, such as optimal power flow, accident analysis, and economic dispatch. The control center makes decisions according to the real-time state of the system, which can affect the operation of the smart grid.
This is the system model. In this paper, we will thoroughly research the attack of the detector in the false data processing module.
2.2. False Data Injection Attack
In a DC system, the state estimation can be expressed in terms of formula (1) [22]:
where ; represents the measurement data, generally including the voltage amplitude of the node, active power, and reactive power; H is Jacobi matrix which contains the information on the structure parameters of the system; is the state variable of the system, including the voltage amplitude and phase angle of the node; and represents a measurement error. It is generally believed that obeys Gaussian distribution with a mean of 0. State estimation needs to calculate the estimation value , which is the closest to the real state vector . With the weighted least square (WLS) method, we can obtain formula (2) [23]:
where is a weighting matrix. It is believed that distribution of is basically the same as , so take as an identity matrix [2]. Therefore,
If the measurement data satisfies (3), it is assumed that the measurement data is normal data. Otherwise, the measurement data is abnormal data and then the abnormal data will be deleted.
The FDI attack is the original measurement vector with a nonzero attack vector . Then, the observed measurement vector is . If satisfies (3), the state estimation module may obtain a wrong estimated result, which is recorded as , where is the estimation error caused by the attack. The literature [2] proposes an effective attack strategy: when the attack vector is a linear combination of column vectors of H, the FDI cannot be detected by the maximum standard residual method. The data for attacking the smart grid is constructed based on this method, e.g., .
Formula (4) shows that the LNR method cannot detect the attack vector .
2.3. Detector Based on SVM
Many studies have proposed that using the detector based on SVM is more effective to detect FDI attacks than using the state estimation [13,16,17,18]. For example, literature [19] has proven that using the detector based on SVM can obviously improve the accuracy rate of detection. Therefore, in this system model, we used the FDI detector based on SVM in the false data processing module.
SVM is one of the most commonly used classifiers and has a good classification effect. It has been applied to the detection of FDI in smart grids and has achieved good results.
The basic idea of SVM is to convert a nonlinear problem in the original sample space to a linear problem in another space through multiple nonlinear transformations. By nonlinear transformation, SVM maps the input data to a high-dimensional inner product space, performs linear classification on the high-dimensional inner product space, and obtains the optimal classification hyperplane in the new inner product space. The nonlinear transformation is achieved by defining a proper inner product kernel function.
Given a sample set and a label set , where is an m-dimensional vector, , and , we can obtain the training set
where, is an attack vector. If , there is no attack, so then we mark as a positive sample and the label . If , there is an attack, so then we mark as a negative sample and the label . Then, the problem of detecting FDI is defined as a binary classification problem.
We used the SVM to train the training set . In the actual power grid, we assumed that the positive samples were normal data and the negative samples were abnormal data. Therefore, the training result can be used to detect measurement data and judge whether the measurement data is normal data or abnormal data.
When the detector based on SVM judges the newly acquired measurement data as abnormal data, the data will be discarded and will not be transmitted into the state estimation module to affect the state estimation result of the smart grid. Conversely, when the detector judges the newly acquired measurement data as normal data, the data will be transmitted into the state estimation module and have an effect on the state estimation result of the smart grid. Due to different time periods, the operation state of the smart grid is not exactly same, even at different times in the same time period. Therefore, the detector needs to update the training set by using the data of the most recent time to replace the oldest data in the training set and obtain more accurate training results by retraining the training set. When the detector regularly updates the training set, the normal data is updated into the positive sample set of the training set and the abnormal data is updated into the negative sample set of the training set according to the judgment result of the detector for the measurement data. Then, the new training set is retrained and new training results are obtained.
The update period of the training set depends on the size of the training set, as well as the storage space and the computing power of the control center. Because the operation of the smart grid has modest real-time requirements and the computing capacity of the control center is also limited, the size of the training set will not be large. The storage space of the control center restricts the amount of data in buffer which is detected but not updated.
3. Attack and Detection Model
In this section, we analyze the vulnerability of the detector based on SVM, and then propose the attack method by utilizing this vulnerability and give a proof.
3.1. The Vulnerability Analysis of the Detector Based on SVM
We have mentioned in Section 2.2 that the detector based on SVM needs to update the training set for acquiring the more accurate training result. The normal data is updated into the positive sample set of the training set and the abnormal data is updated into the negative sample set of the training set. It is a benefit matter if there is no attack. However, the attackers can utilize this point to attack the detector so that the training set should be updated. The attackers can construct special attack vector to make sure that the attack vector can be replaced into the training set. Once the attack vector is replaced into the training set, whether it is replaced into the positive sample set or negative sample set, the retraining result will be impacted. With the increase of the number of the attack vectors, the effect on training results becomes more significant. Essentially, it is the migration of the hyperplane that leads to the change of the training result. If the attack vectors can make the hyperplane continually move towards a direction which has an adverse effect on training result, the detection effect of the detector will be reduced continually.
The vulnerability is inevitable unless the training set is not updated. Unfortunately, the operation state of the smart grid, which is constantly changing, needs the regular update of the training set. Therefore, the attackers can utilize this vulnerability.
3.2. Attack Method for the Detector Based on SVM
Based on the vulnerability of the detector based on SVM, we propose an attack method.
We make two assumptions: (1) The attacker has the ability to modify the data in the sensors to arbitrary value; (2) The transmission of measurement data from the sensors to the control center has no transmission error.
We know that changes in the training set will affect the training results of SVM. It is a root of the vulnerability and the attack method proposed in this article is based on this point. We focus on the position of the training set into which the attackers inject the data and how the data is injected. The attack method will be described in detail next.
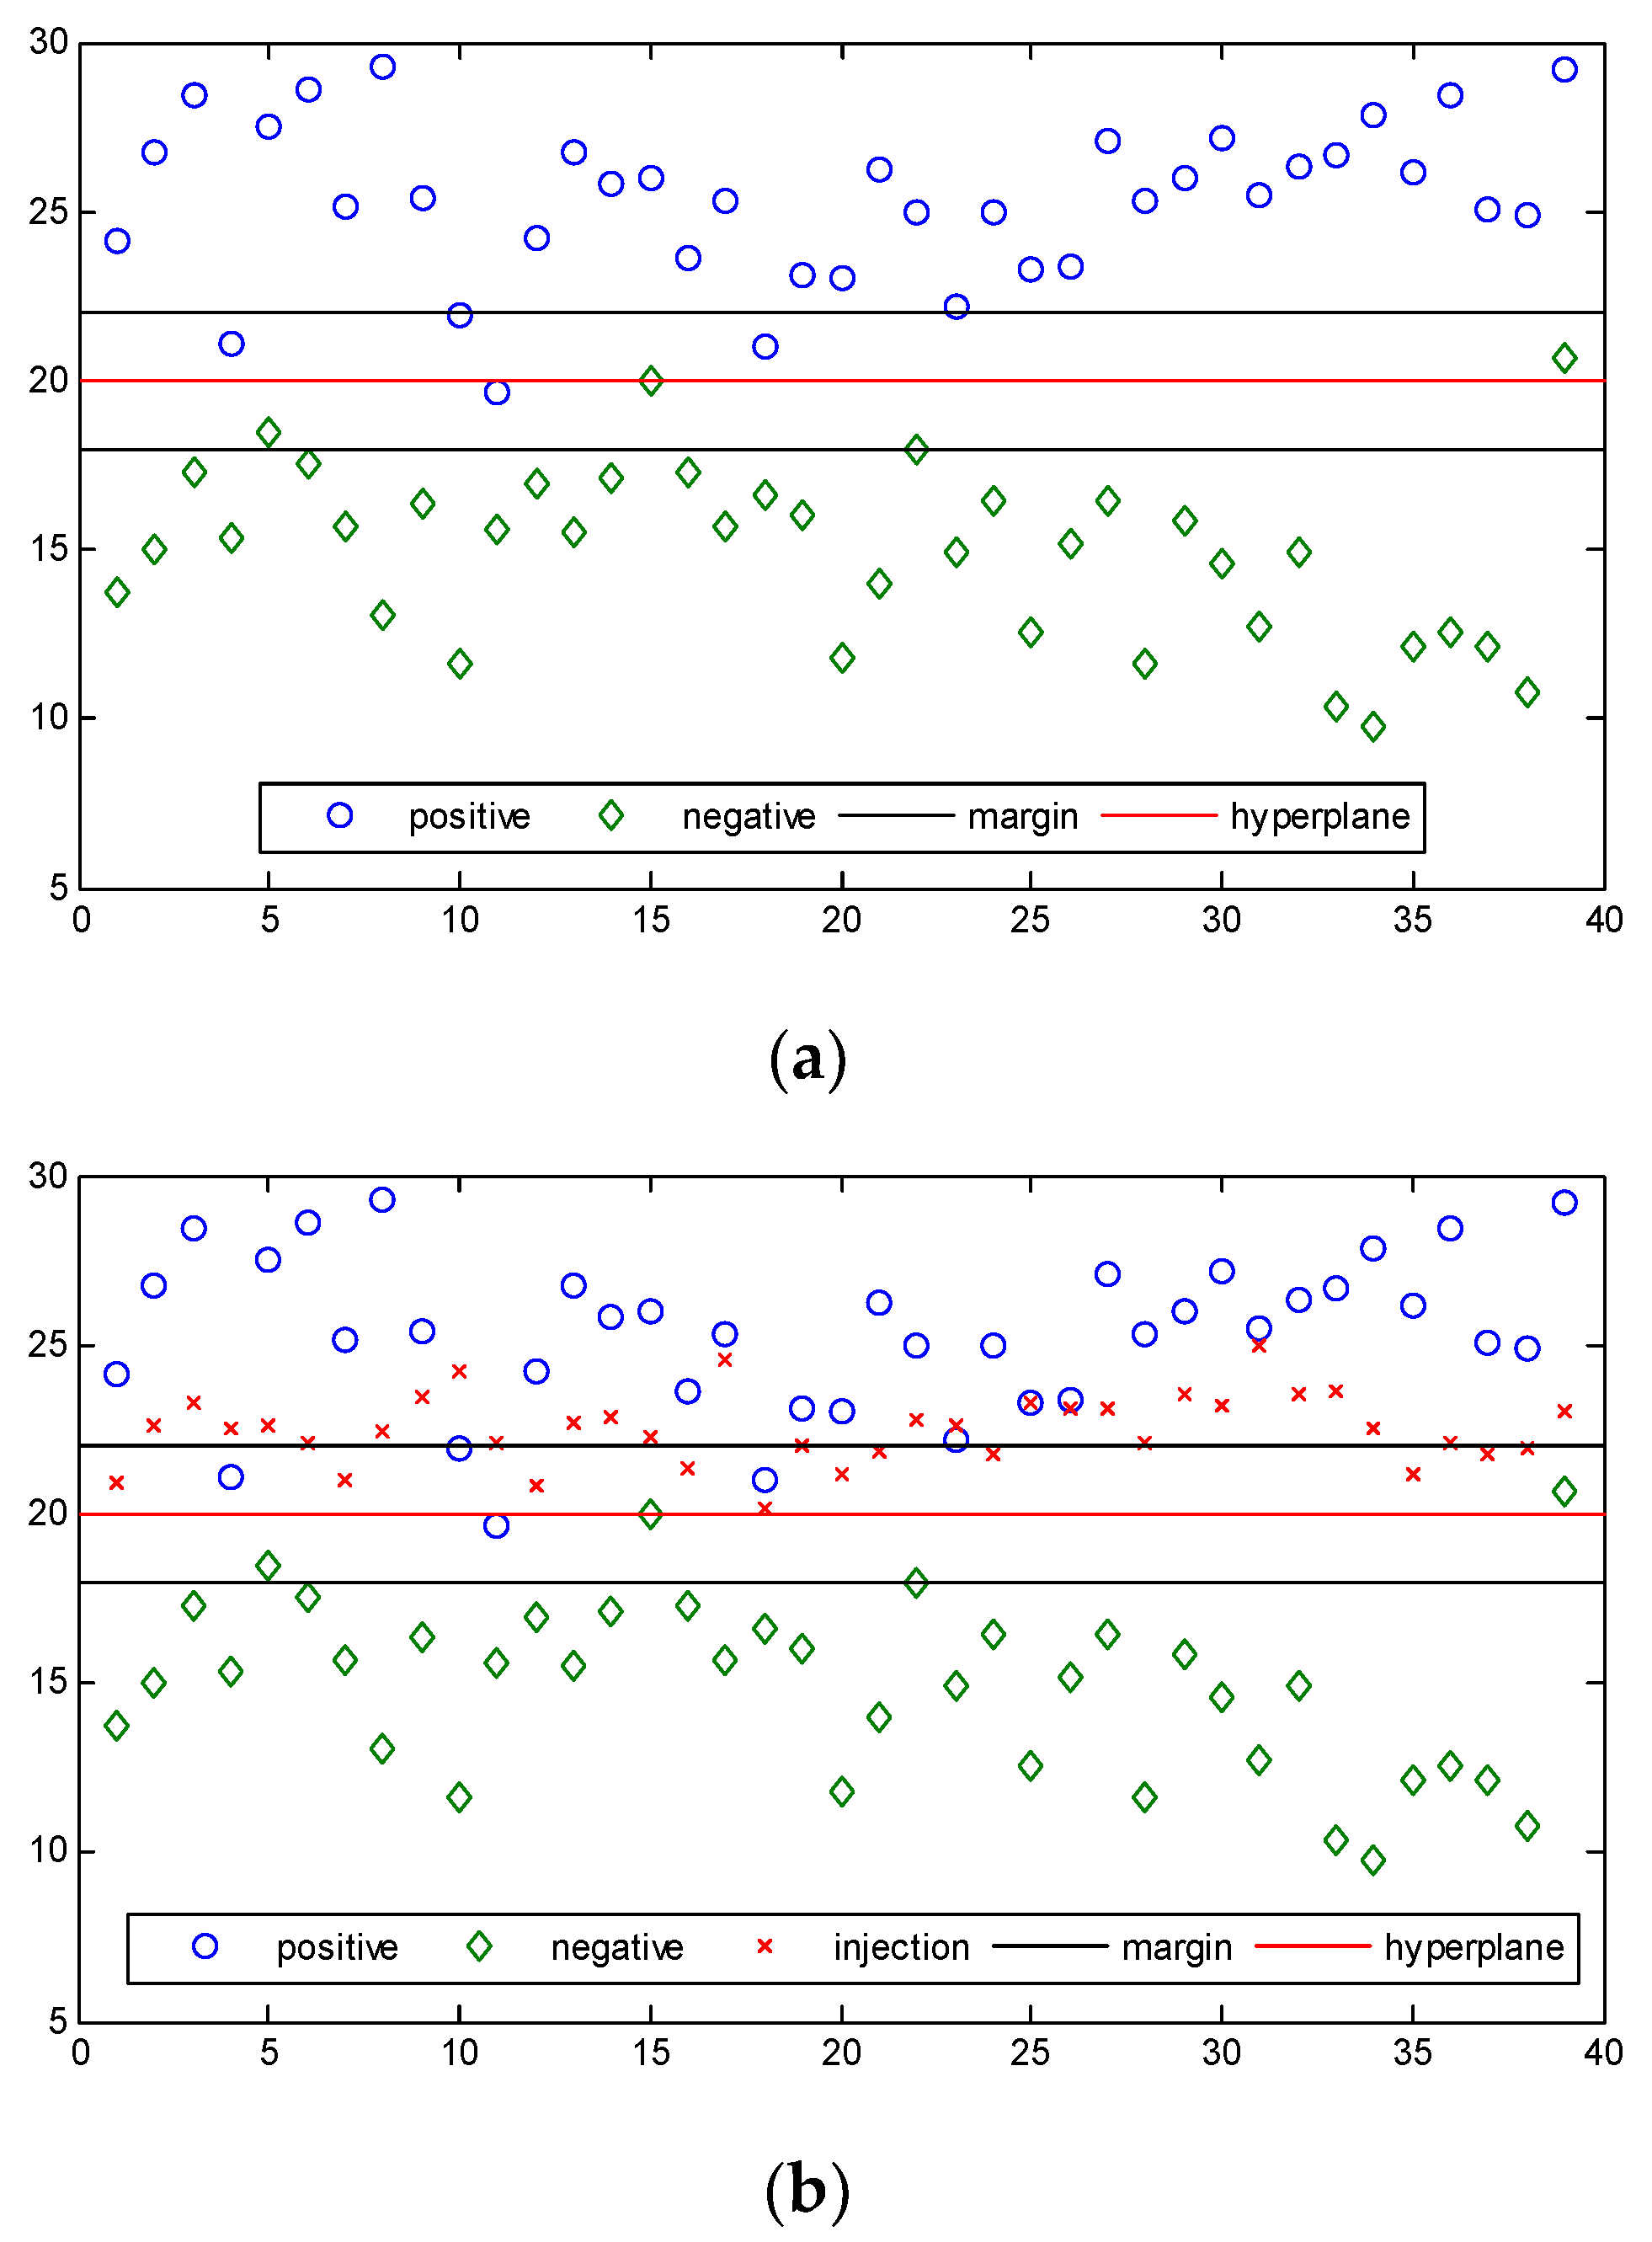
For the convenience of description, we draw a specific diagram of the SVM when the data in the training set is two-dimensional. For example, when the data is two-dimensional, the basic situation of training set and SVM classification without attack are shown in Figure 2a.
Our attack goal is to shift the hyperplane of SVM. This requires the change of the data in the training set. The core of this method is how the attacker makes the hyperplane move towards the direction he wants. The direction of hyperplane migration basically falls into two categories. One is the direction towards the positive sample space, and the other is the direction towards the negative sample space. Both of these migrations will have an adverse effect on SVM detection. When the hyperplane shifts toward the positive sample space, some data that should be judged to be correct by the detector is eventually judged to be wrong. Conversely, when the hyperplane shifts toward the negative sample space, some data that should have been judged to be wrong by the detector is eventually judged to be correct. We hope to move the hyperplane towards the negative sample space direction, because it is easy to be detected as an attack when the data in the positive sample space is judged by the detector as abnormal data in the smart grid. For moving the hyperplane towards the negative sample space direction, there are two approaches. One is injecting the data into the positive sample space near the hyperplane. The other is injecting the data into the negative sample space far from the hyperplane. When the data is two-dimensional, the two approaches are respectively shown in Figure 2b,c. In the actual smart grid, if the measurement data measured by the certain sensors is always judged as normal data by the detector, the control center will mark the sensors as the damaged sensors and cannot transmit their measurement data into state estimation module. Therefore, the attackers must adopt the former approach for continuously injecting data into the training set.
Next, we define two injection modes: centralized injection and identically distributed injection.
Centralized injection: The attackers inject a large amount of data into a given area of the sample space of the training set. Its advantage is that it has a quick effect on the training results, and the disadvantage is that it is easily detected by the detector. For example, when the data is two-dimensional, this injection mode is specifically shown in Figure 2b. In Figure 2b, the distribution of the injected data is obviously different from the distribution of the positive sample. In the figure, the injected samples are basically kept near the upper boundary of the margin and they are more concentrated, while the positive sample space is more decentralized.
Identically distributed injection: The attackers inject the data whose distribution is similar to the distribution of data in the training set. The advantage is that it is not easily detected by the detector. The disadvantage is that it has slower effects on the training results than centralized injection. For example, when the data is two-dimensional, this injection mode is specifically shown in Figure 2d. In Figure 2d, the injected samples are obtained by moving the positive samples 2.5 units downwards, so the distribution of the injection data is similar to the distribution of the training set data.
If the attackers use the centralized injection, the detector can compare the distribution of the data that are detected in the buffer with the distribution of the training set data. Then, the detector can obtain a value which represents the degree of similarity. When the value is larger than a certain threshold, the detector can identify the anomalies. Obviously, using the centralized injection, it is easy for the value of similarity to exceed the threshold. Therefore, the centralized injection is easy to be detected. Unfortunately, it is very difficult for the detector to detect the attack behavior when the attackers utilize the identically distributed injection mode and the distance from the injection data to replaced data in the training set is small. Since the identical distribution injection is difficult to detect by the detector, we mainly discuss this injection mode.
The update of the training set refers to replacing the oldest data in the training set with the detected data in buffer, and its essence is the movement of the training set samples. After training data is completely updated, for example, when the data is two-dimensional and the identically distributed injection is used, the distribution of the data in the training set is shown in Figure 2e.
The attackers can inject data into the positive sample space near the hyperplane. It will lead to the positive samples in the training set moving towards the hyperplane. In next subsection, we will prove that this change in the training set can shift the hyperplane to the side of the negative sample space.
3.3. The Limitation of the Detector Based on SVM
When the positive samples in the training set move towards the hyperplane, the hyperplane will move towards the negative sample space. Next, it is proved.
Give the training set , where,, d is the number of the dimensions of a single sample point, and is the label value of the sample points.
In the sample space, the hyperplane can be described by a linear Equation (6) [24]:
where, is the normal vector which determines the direction of the hyperplane, and b is a displacement term which determines the distance between the hyperplane and the origin. The hyperplane can be uniquely determined by and b, and it is recorded as (, b). The distance from arbitrary point to the hyperplane (, b) in the sample space is
We assume that the hyperplane can classify the training samples correctly. That is, for every sample point , if , then ; if , then , which is
The problem is converted to determine the value of and b to minimize the objective function. The objective function is (9):
Ideally, the value of (9) can be equal to zero. For ease of proof, it may be assumed that (9) = 0. We assume that when ,
Then when ,
Arbitrarily take n (0 < n < m) points from D to satisfy . The n points move in the opposite direction of , that is, towards the hyperplane direction. We assume that the moving distance is , and . When ,
Then,
In order to minimize the value of (9), when , the left side of the equal sign of (11) must become large. Thus, the values of and b in the hyperplane need to be redetermined. Obviously, because this can reduce the value of (9) and keep a balance between the positive samples and the negative samples, the direction of movement of the hyperplane will be essentially the same as the opposite direction of ω. In other words, the hyperplane shifts towards the side of points which satisfy .
3.4. The Detection Method
We have mentioned two injection modes: centralized injection and identically distributed injection. Next, we will propose the detection methods in order to detect the attack and decrease the attack effect in actual smart grid.
When the attackers use the centralized injection, we can detect the attack through comparing the distribution of the data in the buffer with the distribution of the training set data. We can quantify the difference level between the distribution of the data in the buffer with the distribution of the training set data. If the quantitative difference reaches the threshold, the detector can get the result that there is an attack.
However, when the attackers use the identically distributed injection, it is difficult to detect the attack because the change of training set led by the attack may become in actual smart grid which is running normally. There are many factors that can cause the changes of the measure data, and then the training set will change. For example, when the weather and the population change, the need of active power will change. The change led by the external factors is similar to the change led by the attack using the identically distributed injection. Therefore, it is important to judge the truth of the factors which can influence the smart grid. We can estimate the influence degree led by the external factors, and then compare with the change degree of the training set. If the quantitative difference surpasses the range of threshold value, the detector can judge that there is an attack; conversely, the detector can judge that there is no attack.
4. Numerical Results
In this section, we prove the effectiveness of the attack method through experiments. It can decrease the accuracy of the detector.
We performed simulation experiments on three systems: IEEE-14bus system, IEEE-39bus system, and IEEE-118bus system. The compile and run environment was MATLAB, using MATPOWER 6.0 toolkit. In this experiment, the initial training set included 10,000 positive samples and 5000 negative samples. The positive samples were generated by the function of MATPOWER. We assumed the results of the calculation of the function were correct, and the error range was allowed within 3%. The negative samples were generated by adding the random vector to positive samples, and they were beyond the error range, where, satisfied the Gaussian distribution with a mean of zero and a variance of . The test set had 10,000 pieces of data which were generated by adding the random vector to positive samples, and satisfied a Gaussian distribution with a mean of zero and a variance of (). When the amount of buffered data reached 5% of the training set, that is, 750 pieces of data, the training set would be updated. The updated part was the 750 pieces of data which remained the longest time in the training set.
In this experiment, the identically distributed injection was used, and the specific results are detailed as follows.
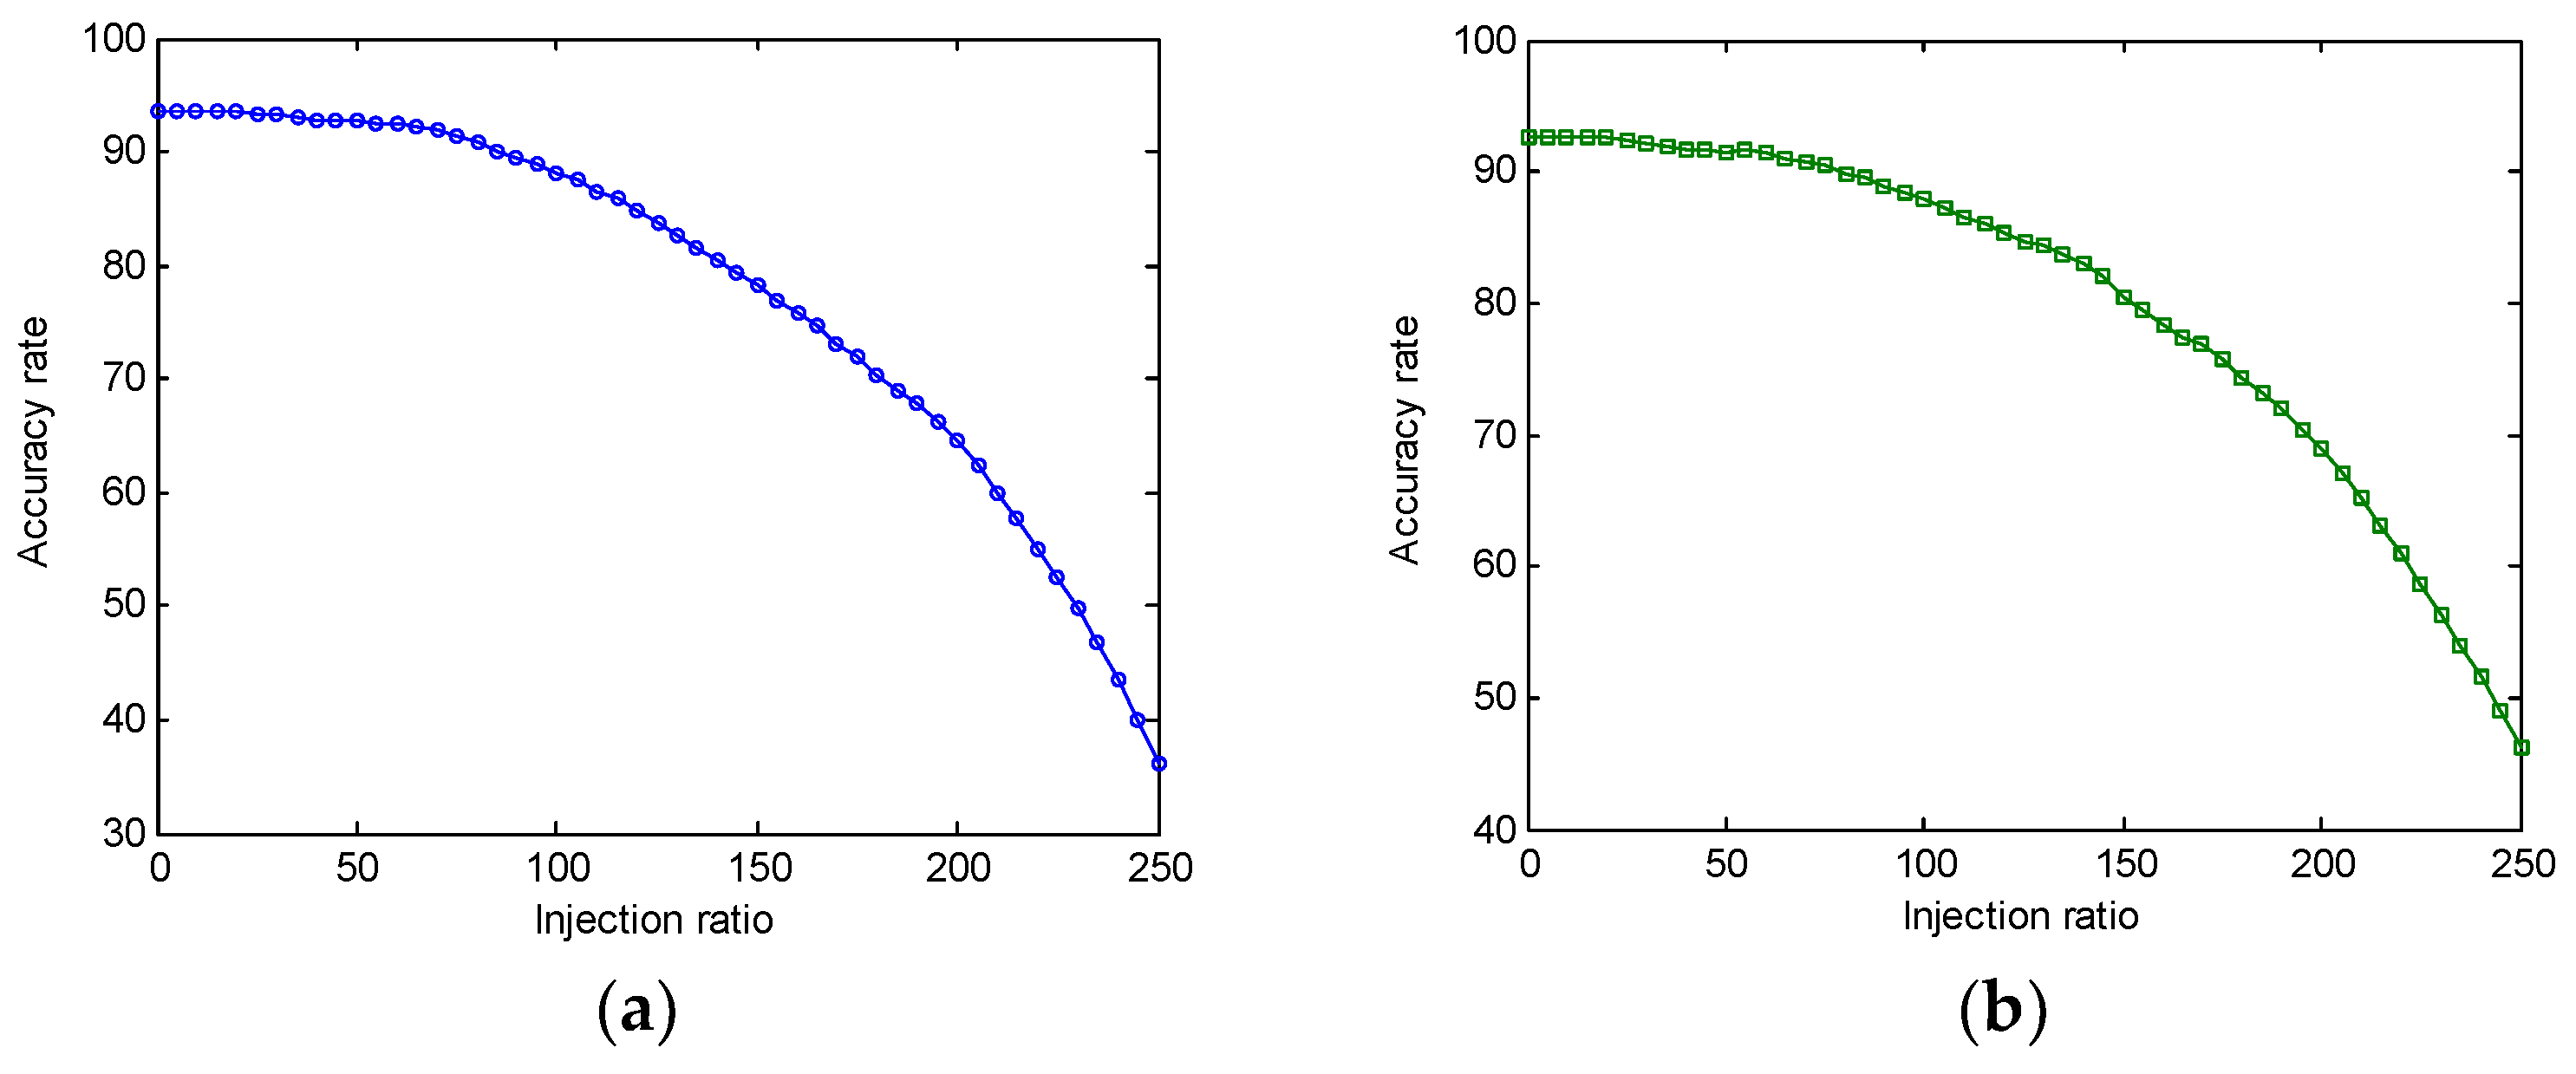
The results of the experiment are as shown in Figure 3 and Figure 4. In Figure 3, the horizontal axis represents the amount of FDI, and the values on the horizontal axis represent the percentage of the training set. The longitudinal axis represents the accuracy of the detection result obtained by the detector detecting the test set, and the unit of the value is the percentage. The value of the horizontal axis can exceed 100% because the injection process should not end when the data of the initial training set is completely updated. As the injection process continues, the update of the training set is continuing, as well as replacing the oldest data in the training set.
Figure 3a–c respectively describe the amount of FDI when the accuracy is reduced to 50% in the three simulation environments. In the IEEE-14bus system, when the amount of FDI reaches 230%, the accuracy of detection result for test set is reduced to less than 50%, which is 49.83%. In the IEEE-39bus system, the amount of FDI is slightly increased, which needs to be 245%, and the accuracy is 49.04%. In the IEEE-118bus system, the amount of FDI needs to reach 260%, and the accuracy is 48.86%. It is obvious that when the number of nodes increases, the number of FDI attacks will be increased in order to achieve the same attack effect. There are two main reasons. On the one hand, with the increase of the number of nodes, the dimension of the data in the training set will be increased, which, to a certain extent, will reduce the effect on the training results when attackers inject the same amount of false data. On the other hand, because of the number of nodes is increasing, the relationship between the nodes will limit the generation range of constructing the attack vectors, and the distance between attack vectors and normal data will decrease, which will then reduce the impact on training results.
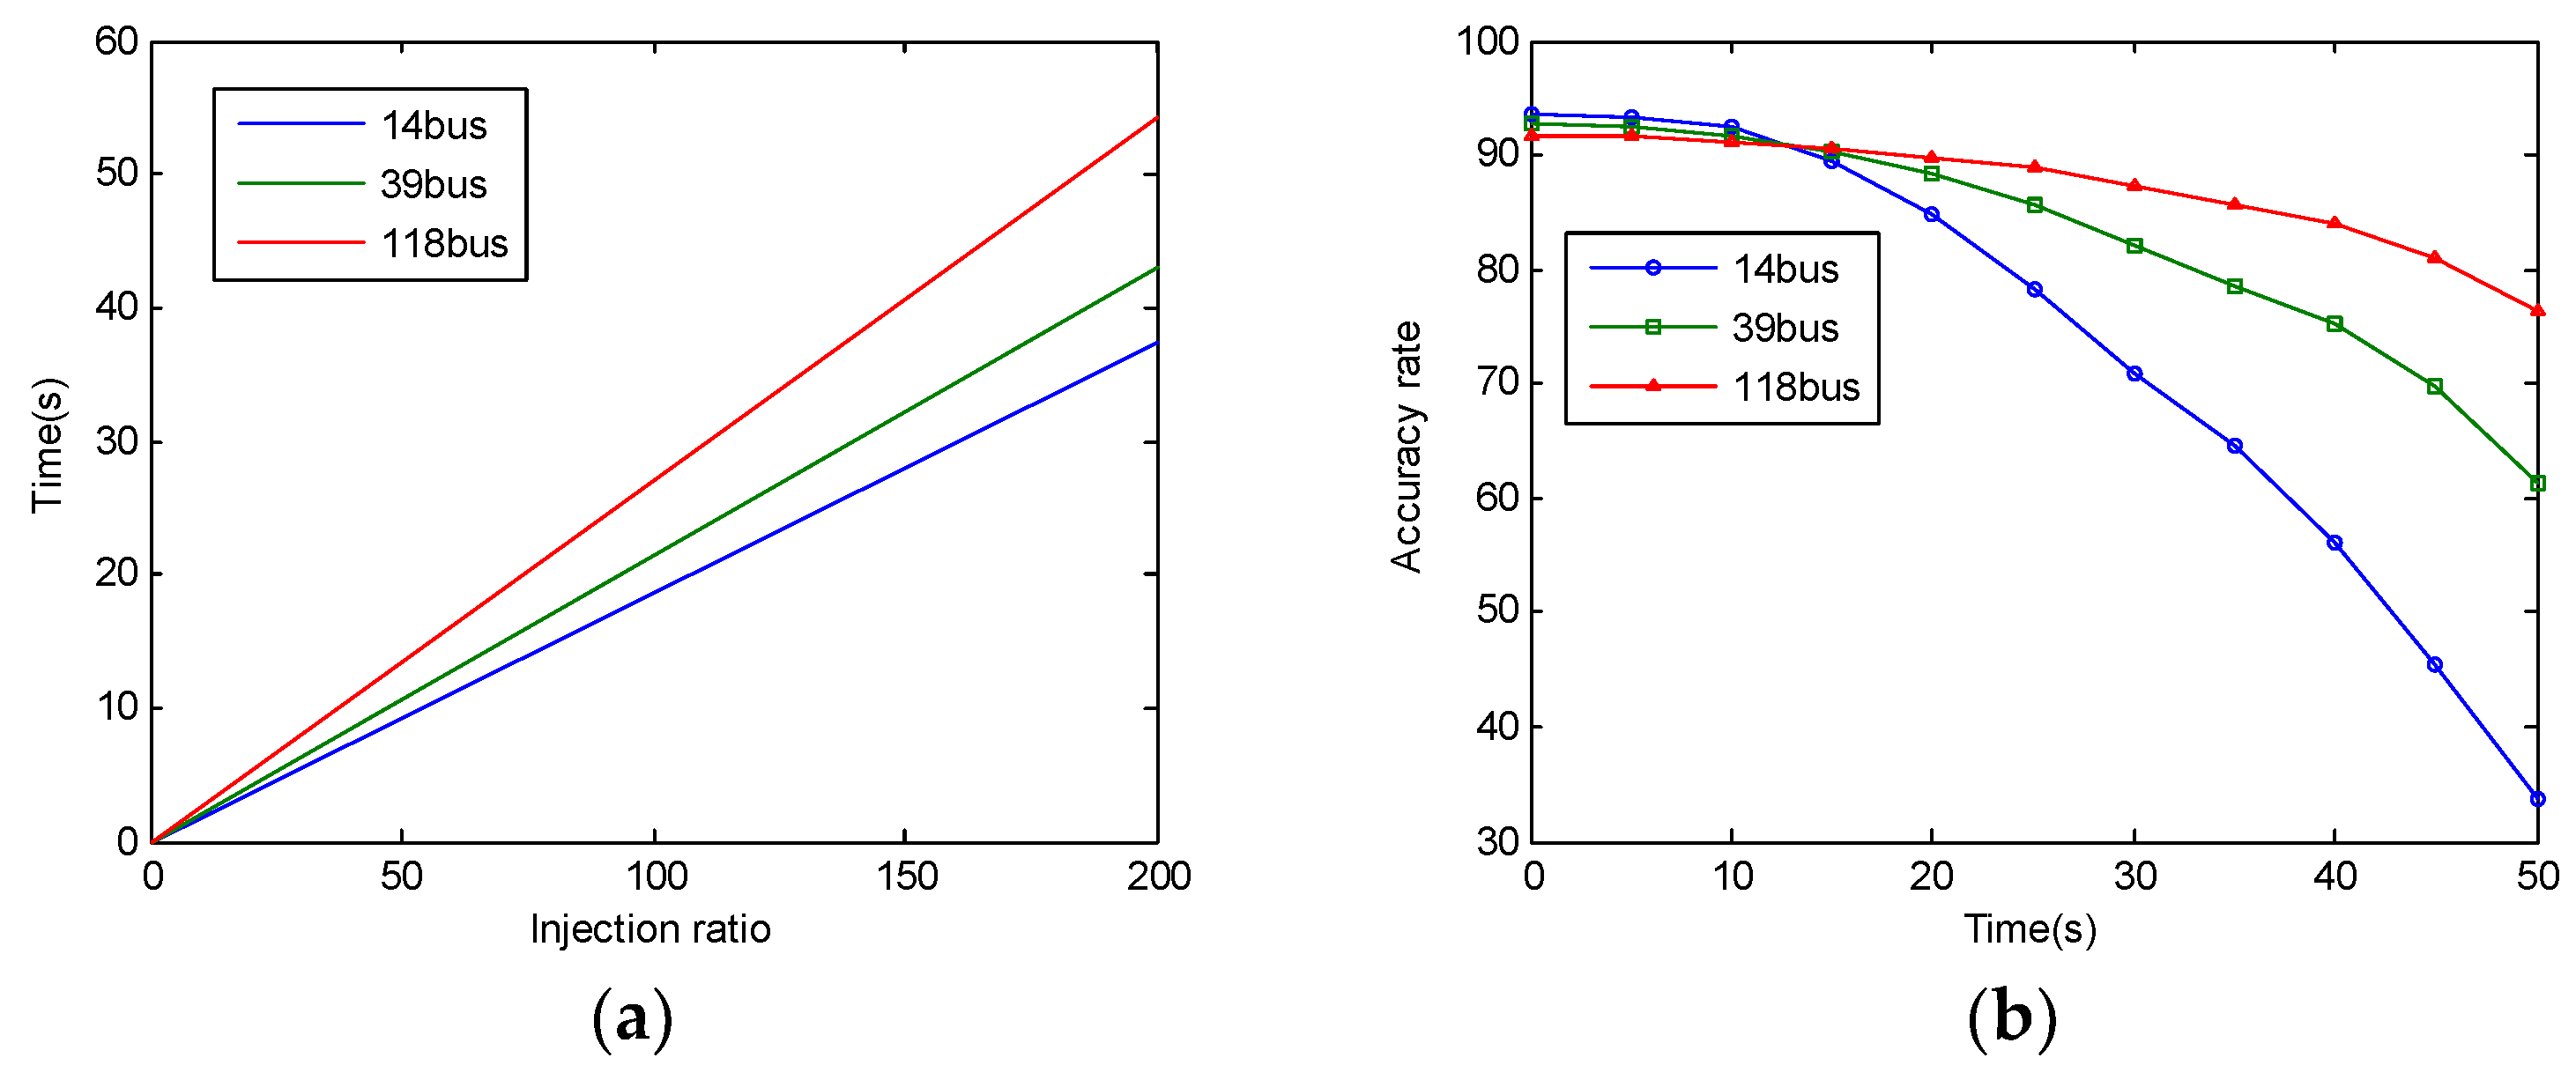
Figure 3d depicts the comparison of the different reactions among the three simulation environments during the injection from 0 to 200%. This figure shows that the difficulty level of the attack increases when the nodes increase. When the injection ratio is lower than 20%, the accuracy rate does not decrease significantly and is basically at the same level. The attack may have no effect on the system. Unfortunately, after the injection ratio reaches 50%, the accuracy rate will decrease obviously with the injection ratio increasing. The results cannot change completely even though the simulation environment changes. Figure 4a describes the relationship between the amount of FDI and time. In the process of the experiment, it was found that the amount of FDI was basically linear with time. When the amount of FDI is 200%, the time spent by three systems was recorded. In the IEEE-14bus system, it is 37.274 s; in the IEEE-39bus system, it is 43.016 s; in the IEEE-118bus system, it is 54.218 s. As the nodes increase, the dimensions of the training set are also increased, and the training time of SVM will increase. Figure 4a shows the effect this produces. Figure 4b describes the relationship between attack time and attack effect (accuracy). Because the cache capacity is 5% of the training set, it is difficult to guarantee that the update time is just the entire number of seconds. The accuracy rate in this picture is the accuracy of the latest update whose occurrence time is the most near the entire number of seconds. When the time reaches 50 s, the accuracy of 14bus system is only 33.74%, while the accuracy of 118bus system is still at a high level, which is 76.35%. The results show that the attacking time increases when the number of nodes increases.
5. Conclusions
In this paper, we propose an attack method for the FDI detector based on SVM. The attackers can make it possible to inject data into the training set by constructing attack vectors which are in the positive sample space. We performed research on the influence of the training results when the training set is changed and analyzed the different effects of the centralized injection and identically distributed injection on the training results. Then, we proposed the solutions to detect the attack. In the actual smart grid, there are many factors that can cause the changes of the measure data, and the effect of some factors may be similar to the effect of an attack using identically distributed injection. Therefore, the identical distribution injection mode is difficult to detect, which can increase the achievability of the attack. We consider the detector should add a module which can judge the truth of the factors and we will further study how to detect the attack effectively. In short, there are some problems that need to be considered when we used the detector based on the SVM to detect the FDI attacks, and further research is needed.
Author Contributions
B.W. and P.Z. conceived and designed the experiments; Y.C. and P.X. performed the experiments; Z.Z. analyzed the data; B.W. and P.X. contributed analysis tools; all authors wrote the paper.
Acknowledgments
This work was supported by the National Natural Science Foundation of China (Grant 61572514) and Changsha Science and Technology Program (Grant K1705007).
Conflicts of Interest
The authors declare no conflict of interest.
References
- Sun, C.C.; Liu, C.C.; Xie, J. Cyber-Physical System Security of a Power Grid: State-of-the-Art. Electronics 2016, 5, 40. [Google Scholar] [CrossRef]
- Liu, Y.; Ning, P.; Reiter, M.K. False data injection attacks against state estimation in electric power grids. In Proceedings of the 16th ACM Conference on Computer and Communications Security, Chicago, IL, USA, 9–13 November 2009; pp. 21–32. [Google Scholar] [CrossRef]
- Beg, O.; Johnson, T.; Davoudi, A. Detection of False-data Injection Attacks in Cyber-Physical DC Microgrids. IEEE Trans. Ind. Inform. 2017. [Google Scholar] [CrossRef]
- Qin, Z.; Li, Q.; Chuah, M.C. Unidentifiable Attacks in Electric Power Systems. In Proceedings of the 2012 IEEE/ACM Third International Conference on Cyber-Physical Systems, Beijing, China, 17–19 April 2012; pp. 193–202. [Google Scholar] [CrossRef]
- Kosut, O.; Jia, L.; Thomas, R.J.; Tong, L. Malicious Data Attacks on the Smart Grid. IEEE Trans. Smart Grid 2011, 2, 645–658. [Google Scholar] [CrossRef]
- Kosut, O.; Jia, L.; Thomas, R.J.; Tong, L. Limiting false data attacks on power system state estimation. In Proceedings of the 2010 44th Annual Conference on Information Sciences and Systems (CISS), Princeton, NJ, USA, 17–19 March 2010; pp. 1–6. [Google Scholar] [CrossRef]
- Huang, Y.; Li, H.; Campbell, K.A.; Han, Z. Defending false data injection attack on smart grid network using adaptive CUSUM test. In Proceedings of the 2011 45th Annual Conference on Information Sciences and Systems, Baltimore, MD, USA, 23–25 March 2011; pp. 1–6. [Google Scholar] [CrossRef]
- Gu, C.; Jirutitijaroen, P.; Motani, M. Detecting False Data Injection Attacks in AC State Estimation. IEEE Trans. Smart Grid 2015, 6, 2476–2483. [Google Scholar] [CrossRef]
- Mousavian, S.; Valenzuela, J.; Wang, J. Real-time data reassurance in electrical power systems based on artificial neural networks. Electr. Power Syst. Res. 2013, 96, 285–295. [Google Scholar] [CrossRef]
- Sandberg, H.; Teixeira, A.; Johansson, K.H. On Security Indices for State Estimators in Power Networks. In Proceedings of the Preprints of the First Workshop on Secure Control Systems, CPSWEEK 2010, Stockholm, Sweden, 12–16 April 2010. [Google Scholar]
- Dán, G.; Sandberg, H. Stealth Attacks and Protection Schemes for State Estimators in Power Systems. In Proceedings of the First IEEE International Conference on Smart Grid Communications, Gaithersburg, MD, USA, 4–6 October 2010; pp. 214–219. [Google Scholar] [CrossRef]
- Valenzuela, J.; Wang, J.; Bissinger, N. Real-time intrusion detection in power system operations. IEEE Trans. Power Syst. 2013, 28, 1052–1062. [Google Scholar] [CrossRef]
- Esmalifalak, M.; Liu, L.; Nguyen, N.; Zheng, R.; Han, Z. Detecting Stealthy False Data Injection Using Machine Learning in Smart Grid. IEEE Syst. J. 2014, 1–9. [Google Scholar] [CrossRef]
- He, X.; Yang, X.; Lin, J.; Ge, L.; Yu, W.; Yang, Q. Defending against Energy Dispatching Data integrity attacks in smart grid. In Proceedings of the 2015 IEEE 34th International Performance Computing and Communications Conference (IPCCC), Nanjing, China, 14–16 December 2015; pp. 1–8. [Google Scholar] [CrossRef]
- Landford, J.; Meier, R.; Barella, R.; Wallace, S.; Zhao, X.; Cotilla-Sanchez, E.; Bass, R.B. Fast Sequence Component Analysis for Attack Detection in Synchrophasor Networks. Comput. Sci. 2015, 9, 1–8. [Google Scholar]
- Ozay, M.; Esnaola, I.; Yarman Vural, F.T.; Kulkarni, S.R.; Poor, H.V. Machine Learning Methods for Attack Detection in the Smart Grid. IEEE Trans Neural Netw. Learn. Syst. 2015, 27, 1773. [Google Scholar] [CrossRef] [PubMed]
- Wang, Y.; Amin, M.; Fu, J.; Moussa, H.B. A Novel Data Analytical Approach for False Data Injection Cyber-Physical Attack Mitigation in Smart Grids. IEEE Access 2017. [Google Scholar] [CrossRef]
- Srikantha, P.; Kundur, D. A DER Attack-Mitigation Differential Game for Smart Grid Security Analysis. IEEE Trans. Smart Grid 2017, 7, 1476–1485. [Google Scholar] [CrossRef]
- Hao, J.; Piechocki, R.J.; Kaleshi, D.; Chin, W.H.; Fan, Z. Sparse Malicious False Data Injection Attacks and Defense Mechanisms inSmart Grids. IEEE Trans. Ind. Inform. 2017, 11, 1–12. [Google Scholar] [CrossRef]
- Amin, S.; Lin, Z.S.; Huang, Y.L.; Huang, C.-Y.; Sastry, S. Attacks against process control systems: Risk assessment, detection, and response. In Proceedings of the 6th ACM Symposium on Information, Computer and Communications Security, Hong Kong, China, 22–24 March 2011; pp. 355–366. [Google Scholar] [CrossRef]
- Lin, J.; Yu, W.; Yang, X.; Xu, G.; Zhao, W. On False Data Injection Attacks against Distributed Energy Routing in Smart Grid. In Proceedings of the 2012 IEEE/ACM Third International Conference on Cyber-Physical Systems, Beijing, China, 17–19 April 2012; pp. 183–192. [Google Scholar] [CrossRef]
- Wood, A.J.; Wollenberg, B.F.; Sheblé, G.B. Power Generation, Operation, and Control, 3rd Edition. IEEE Power Energy Mag. 2013, 12, 90–93. [Google Scholar]
- Cuello-Reyna, A.A.; Cedeno-Maldonado, J.R. Differential Evolution-Based Weighted Least Squares State Estimation with Phasor Measurement Units. In Proceedings of the 2006 49th IEEE International Midwest Symposium on Circuits and Systems, San Juan, Puerto Rico, 6–9 August 2006; pp. 576–580. [Google Scholar] [CrossRef]
- Cortes, C.; Vapnik, V. Support-Vector Networks. Mach. Learn. 1995, 20, 273–297. [Google Scholar] [CrossRef]
Figure 1.
System model of the smart grid [19].
Figure 1.
System model of the smart grid [19].

Figure 2.
The training set of SVM. (a) The normal classification of SVM; (b) Centralized injection; (c) Injecting data into the negative sample space; (d) Identically distributed injection; (e) Training set update. In these pictures, the blue circles represent positive examples, the green diamonds represent counterexamples, the red crosses represent the injected data, the black lines represent the boundaries of margin, and the red line represents the hyperplane.


Figure 3.
The relationship between accuracy and injection ratio. (a) Attack effect in IEEE-14bus environment; (b) Attack effect in IEEE-39bus environment; (c) Attack effect in IEEE-118bus environment; (d) Comparison of attack effects.
Figure 3.
The relationship between accuracy and injection ratio. (a) Attack effect in IEEE-14bus environment; (b) Attack effect in IEEE-39bus environment; (c) Attack effect in IEEE-118bus environment; (d) Comparison of attack effects.


Figure 4.
The results of the influence of the time. (a) Time of injection; (b) The relationship between time and attack effect. The time unit is the second (s).
Figure 4.
The results of the influence of the time. (a) Time of injection; (b) The relationship between time and attack effect. The time unit is the second (s).
© 2018 by the authors. Licensee MDPI, Basel, Switzerland. This article is an open access article distributed under the terms and conditions of the Creative Commons Attribution (CC BY) license (http://creativecommons.org/licenses/by/4.0/).
Share and Cite
MDPI and ACS Style
Wang, B.; Zhu, P.; Chen, Y.; Xun, P.; Zhang, Z. False Data Injection Attack Based on Hyperplane Migration of Support Vector Machine in Transmission Network of the Smart Grid. Symmetry 2018, 10, 165. https://doi.org/10.3390/sym10050165
AMA Style
Wang B, Zhu P, Chen Y, Xun P, Zhang Z. False Data Injection Attack Based on Hyperplane Migration of Support Vector Machine in Transmission Network of the Smart Grid. Symmetry. 2018; 10(5):165. https://doi.org/10.3390/sym10050165
Chicago/Turabian StyleWang, Baoyao, Peidong Zhu, Yingwen Chen, Peng Xun, and Zhenyu Zhang. 2018. "False Data Injection Attack Based on Hyperplane Migration of Support Vector Machine in Transmission Network of the Smart Grid" Symmetry 10, no. 5: 165. https://doi.org/10.3390/sym10050165
Note that from the first issue of 2016, this journal uses article numbers instead of page numbers. See further details here.