Article

Antecedents of Symmetry in Physicians’ Prescription Behavior: Evidence from SEM-Based Multivariate Approach

by
Rizwan Raheem Ahmed
1,*,
Zahid Ali Channar
2,
Riaz Hussain Soomro
3,
Jolita Vveinhardt
4,
Dalia Streimikiene
5,* and
Vishnu Parmar
6
1
Faculty of Management Sciences, Indus University, Block-17, Gulshan, Karachi 75300, Pakistan
2
Department of Business Administration, Sindh Madressatul Islam University, Karachi 74000, Pakistan
3
Institute of Health Management, Dow University of Health Sciences, Mission Road, Karachi 74200, Pakistan
4
Faculty of Economics and Management, Vytautas Magnus University, Daukanto str. 28, 44248 Kaunas, Lithuania
5
Lithuanian Sports University, Institute of Sport Science and Innovations, Sporto str. 6, 44221 Kaunas, Lithuania
6
Institute of Business Administration, University of Sindh, Jamshoro 76080, Pakistan
*
Authors to whom correspondence should be addressed.
Symmetry 2018, 10(12), 721; https://doi.org/10.3390/sym10120721
Submission received: 8 November 2018 / Revised: 28 November 2018 / Accepted: 3 December 2018 / Published: 5 December 2018

Abstract

:
The aim of this paper is to examine the direct impact of marketing and medical tools on the symmetry of physicians’ prescription behavior in the context of the Pakistani healthcare sector. This research also investigates the moderating influence of corporate image and customer relationship in an association of marketing & medical tools, and the symmetry of physicians’ prescription behavior. The survey involved a research sample of 740 physicians, comprising 410 general practitioners and 330 specialists. A series of multivariate approaches such as exploratory factor analysis, confirmatory factor analyses, and conditional process analysis are employed. The findings of the study showed that marketing & medical tools have a direct, positive, and significant influence on physicians’ symmetrical prescription behavior. Corporate image and customer relationship have also a significant impact as moderating variables between marketing & medical tools, and the symmetry of prescription behavior of physicians. The outcomes of this research are beneficial to marketers and medical managers in the pharmaceutical industry.

1. Introduction

Pharmaceutical marketing and medico marketing are different terminologies which are used in the pharmaceutical industry for the promotion of their brands and products in order to earn substantial revenues. The pharmaceutical companies use different marketing and medical strategies and symmetrical tactics such as medical journal advertising, medical detail aids, free drug samples, gifts, scientific activities (presentations in wards & doctors chambers, RTDs, DGMs, conferences, CMEs etc.), personal obligations, birthday greetings and gifts, airfare tickets, hotel accommodation, travel expenses, and recreational activities to the physicians and their families [1,2,3,4]. These promotional tools not only establish a good relationship with physicians but also bring augmented and symmetrical prescription business from physicians [3,5,6,7]. According to Ahmed et al. [1], and Masood et al. [8], the pharmaceutical industry is a lucrative business in Pakistan; therefore, there are several marketing and medical factors, which are helpful for generating the maximum revenue in the form of symmetrical prescription business. Thus, there is a strong need to re-evaluate the predictors (marketing & medical factors) that strongly influence physicians’ symmetrical prescription behavior [3,9,10]. Modern marketing scholars and practitioners show ever-growing interest in the antecedents of symmetry in physicians’ prescription behavior such as promotional material, medical activities, direct-to-consumer advertising, scientific activities, medical representatives’ effectiveness, and other marketing & communications [1,11,12,13]. Similarly, pharmaceutical marketing costs have increased significantly over the last few years because of intense competition and deregulation of the pharmaceutical industry worldwide [14,15,16].
According to the IMS World Review 2017, pharmaceutical sales reached USD $1105 billion in the global market, indicating an increase of 8% in constant values compared to 2016 sales. The US pharmaceutical market’s net worth is around USD341.1 billion, which is the largest in the world; it comprises approximately 36.5% of the global market. The North American market is lucrative due to effective healthcare systems, and the presence of major transnational pharmaceutical companies in the region. The Asia Pacific region pharmaceutical market is the second largest, comprising approximately 21.5% of the global market. However, the estimated size of the Pakistani pharmaceutical market is $3.40 billion, with average growth of 12% in 2017 [3]. During the same year, marketing expenditure of pharmaceutical products reached $6.1 billion, accounting for 6% growth as compared to the year 2016 for the global pharmaceutical industry. However, in Pakistan, electronic and print media advertising is allowed only for over-the-counter (OTC) drugs; therefore, there is an increasing tendency of marketing expenditure for prescription drugs in order to compete with rivals, especially due to the intensifying power of generic drugs. The major share of generic or copy brands accounts for more than 58.5% of the total pharmaceutical market in Pakistan [3].
Thus, given the above facts, there is tremendous pressure on pharmaceutical companies to justify marketing expenditures in terms of returns on investments, and measuring the marketing efforts that justify these investments. Since the pharmaceutical industry is quite unique, and intense regulations apply on the advertising of pharmaceutical drugs, this industry has adopted very aggressive personal promotional activities to indirect customers (physicians) that cost huge sums of money [1,17]. The business structure of the pharmaceutical industry is quite different to that of other industries. In the pharmaceutical industry, the consumers (Patients) are not the direct customers; rather, the physician is a decision maker on behalf of the patient. Thus, the physician is the direct customer of the pharmaceutical industry. The cost of the prescription is borne by the healthcare system or the patient himself; therefore, a physician is free to choose any medicine, whether it is expensive or cheap. The physician is in the driving seat, and he/she takes benefits from both sides, such as charging a fee from the patients/health insurance companies, while also receiving huge benefits from the pharmaceutical companies for prescribing their drugs [3,18]. The existing literature pertaining to pharmaceutical marketing has fixated on the effect of advertising cost on price elasticity, and the dissemination of new drugs, i.e., the influence of medical detailing (a form of personal selling), the role of marketing mix symmetry (samples, gifts, scientific activities, sponsorships etc.), the impact of customer relationships on the prescription business, the influence of direct-to-consumer advertising (DTCA), and personal obligations on physicians’ symmetrical prescription behavior [1,19,20,21].

2. Significance and Objectives of the Study

However, pharmaceutical practitioners and research scholars have published numerous studies pertaining to the marketing strategies and their effectiveness in order to understand the influence of these strategies on physicians’ symmetrical prescription behavior. Though, to the best knowledge of the authors, limited attention has been given to this topic, especially, the effect of marketing on physicians’ symmetrical prescription behavior. Moreover, limited work has been carried out on customer relationships with pharmaceutical companies and physicians’ personal traits with preference to marketing communication elements, and the impact of a corporate image with reference to the physicians’ prescription decisions. This study will attempt to address this deficiency. The present study may help to provide a better understanding of marketing and medical tools, and their influence on physicians’ symmetrical prescription behavior. Besides marketing and medical factors, we incorporate two important moderating variables, and examine the influence of corporate image and customer relationship in an association of medical and marketing factors, and the symmetry of physicians’ prescription behavior in this study. The results of this study could be more conclusive to the pharmaceutical marketing and medical managers to improve their strategies and to make the best use of their financial and human resources for optimal gain of prescription business in an efficient and effective manner.

3. Academics Relevance

This research study has a unique academic perspective, which is relevant in offering comprehensive insight regarding the influential factors for the symmetry of physicians’ prescription behavior within the context of Pakistani Pharmaceutical industry. The undertaken study examines the existing and novel factors that may influence the physicians’ symmetrical prescription behavior. This research will examine a comprehensive analysis of exogenous, moderating factors on the physicians’ symmetrical prescription behavior. In this research, besides marketing factors, we have also included medical factors that could be important for reshaping the symmetry of physicians’ behavior. Finally, the undertaken study is unique in nature because it examines the effects of moderating variables such as corporate image and customer relationships in an association of medical & marketing factors, and the symmetry in physicians’ prescription behavior [3,14,22]. Thus, the undertaken study could be a significant addition to the current literature regarding pharmaceutical marketing and physicians’ behavior. Moreover, this research may also set a new horizon for future research studies, and provide the foundation for forthcoming literature regarding antecedents of physicians’ symmetrical prescription behavior.

4. Previous Literature and Conceptual Framework

The Physicians’ Prescription Behavior Definition

The symmetry in physicians’ prescription behavior is multi-faceted and has a broad concept that includes several dimensions; however, in this study we focus on the symmetry of physicians’ prescription behavior as an “adoption” [23,24]. The American Marketing Association has defined “adoption” as: “new product awareness, gathering information, developing positive attitudes towards the product, testing it in some direct or indirect way, finding satisfaction in the trial and adopting the product into a standing usage or repurchase pattern [3,18,25]”. The process of diffusion is also signified as the process of adoption; it is a process in which novel ideas and products become norms and are accepted by society. According to Rogers [26], and Masood et al. [8], adoption is a social process, and social tendencies originate from the process of adoption. In pharmaceutical marketing, it is a process of influential activities to change the behavior, attitude, knowledge, and symmetry patterns of prescriptions of physicians [1,27,28].

5. Pharmaceutical Medical and Marketing Tools

Medical Literature & Journal Advertising

The medical literature has played a significant role in shaping the symmetry of the prescription behavior of physicians for a specific drug. Research articles published in credible journals such as British medical journal, Lancet, JAMA, and American journal of medicine etc., set or change the direction of physicians’ symmetrical prescriptions [27]. Pharmaceutical companies spend millions of dollars to conduct different large-scale studies, and favorable results of a drug to publish in credible journals to influence the symmetry of physicians’ prescription behavior [25,29]. According to Stafford et al. [30], and Hersh et al. [31], the pharmaceutical companies fund multicenter trials, and significant medical breakthroughs are being brought to the attention of the general public and the medical community to change the perception of a given disease area and its cure. Interestingly, nobody knows who is behind these trials, and pharmaceutical companies usually fund the medical universities and research centers to obtain favorable results. Then, these results are utilized to influence the symmetry of physicians’ prescription behavior [1,15,32]. Medical Journals’ advertising is another significant window of opportunity to enhance the awareness of a drug. According to Loden and Liebman [33], the pharmaceutical industry spent $278.9 million on medical journal advertising in 1999, and that figure reached over $752 million in 2002. According to Leffler [34], journal advertising plays a double role: it enhances awareness, and also increases the influence on physicians; thus, medical journal advertising has been revealed as pro-competitive and lessening drug price following entry of a new drug. Rizzo [35] and Liebman [36] have studied the effectiveness of journal advertising, and concluded that journal advertising disseminates the right message and implementation that establish drug acceptance more than advertising expenditure. Several research studies have demonstrated the superiority and effectiveness of medical journals in terms of influence on the symmetry of physicians’ prescription behavior [37,38]. Hence, the following hypothesis is formulated on the basis of previous research studies:
H1. 
Medical literature & Journals advertising has a significant positive influence on physicians’ prescription behavior.

6. Scientific Activities

Pharmaceutical companies sponsor symposia, lectures, local speaker programs, doctors group meetings, ward presentations, and roundtable discussions to individual doctors and hospitals to influence the symmetry of physicians’ prescription behavior [3,16]. There is sufficient evidence that these scientific activities are part of the medical and marketing activities of pharmaceutical companies, which definitely pays off for the pharmaceutical industry in terms of strong relationships and prescription business from the doctors and hospitals [10,15,39]. According to Rahman et al. [25], Ziegler [40], and Chren and Landefeld [41], doctors who are sponsored to attend these scientific activities are more convincing at writing the prescription of a drug of a sponsor company without doing a cost of benefit analysis of the drug. Pharmaceutical sponsored scientific activities include national and international conferences, training programs, and CME programs to the hospitals to include their drugs in the formulary [32,42,43]. Pharmaceutical companies sponsor individual physicians for international conferences; the objective of these sponsorships are multi-dimensional, such as the sponsored physicians have to get the recent development in the disease area, and then sponsored physicians are expected to deliver series of lectures to the junior doctors after returning to their home countries. However, the apparent objective is very positive and convincing, but pharmaceutical companies get additional prescriptions from the sponsored physicians, and on the other hand, the sponsored physicians play the role of advocator sand brand ambassadors of different drugs of sponsoring companies [10,44]. According to Bowman and Pearle [45], Lexchin [46], Grundy et al. [47], local and international CMEs play a vital role in influencing the symmetry of physicians’ prescription behavior. Studies have revealed that after availing sponsorships, the physicians increase prescription rates by up to three times. Scheffer [24], and Lieb and Koch [48] pointed out those physicians who did not avail the companies’ sponsorships tend to fairly prescribe the medicines on merit as compared to sponsored doctors. According to Vicciardo [49], Wazana [27], and Holmer [50], the CMEs activities are more linked with the pharmaceutical marketing objectives rather than medical activities, and companies usually cross ethical barriers in the name of CMEs. Hence, a substantial amount of literature has demonstrated that these scientific activities are more linked to the marketing of drugs, and CMEs have a significant influence on the symmetry of physicians’ prescription behavior [1,23,51,52,53]. Thus, the following hypothesis is formulated on the basis of previous research studies:
H2. 
Scientific activities have a significant positive influence on the symmetry of physicians’ prescription behavior.

7. Medical Representatives’ Effectiveness

Pharmaceutical marketing is a kind of personal selling in which Medical representatives’ detailing has a significant influence on the symmetry of physicians’ prescription behavior [37,54]. Medical detailing is the most influential factor in pharmaceutical marketing because it is a continuous human interaction with the physicians at regular intervals of time. Moreover, Medical representatives’ competence and skills also play a significant role in changing the physicians’ symmetrical prescription behaviors in an effective and efficient manner [23,55]. Physicians tend to be more eager to see MRs because of new information about drugs, new developments in a given disease area, and to get free samples and gifts; thus, substantial literature has demonstrated the effectiveness of Medical representatives and influence on the physicians’ symmetrical prescription behavior [3,27,56]. The effective sales call has three components, i.e., solid message content, well-utilized resources, and clear message delivery. The components of the sales message are an indication of a drug, side effects, dosage, efficacy, and competitive data [1,56]. Important research was carried out by the Wazana [27] to evaluate the cost and benefit of Physician-MR interaction. He concluded that “interactions with pharmaceutical representatives were found to impact the prescribing practice of residents and physicians in terms of prescribing cost, non-rational prescribing, awareness, preference and rapid prescribing of new drugs, and decreased prescribing of generic drugs” [27]. Caudill et al. [57], and Narayanan et al. [20] concluded that medical representatives’ influence on physician is directly correlated to the level of credibility and effectiveness of MRs. Several research studies have demonstrated that medical representative’s positive attributes such as knowledge about drugs, interpersonal skills, selling skills, and relationship with the physicians have a significant influence on the doctors’ symmetrical prescription behavior [58,59]. Hence, a substantial amount of literature has confirmed the influential impact of MRs on the symmetry of physicians’ prescription behavior [1,6,60]. Thus, the following hypothesis is formulated on the basis of previous research studies:
H3. 
Medical representatives’ effectiveness has a significant positive influence on the symmetry of physicians’ prescription behavior.

8. Promotional Material (Samples & Gifts)

Several researchers have carried out studies on the influence of samples and promotional material on the symmetry of physicians’ prescription behavior. They have revealed in their findings that samples actually provide access to physicians’ chambers, and give confidence to the medical representatives as well [1,58,59,61]. According to Findlay [62], pharmaceutical companies spend a huge portion of their marketing cost on free samples; he estimated companies have spent $7.2 billion in a single year. According to Chew et al. [63], physicians can deviate from their choice of drugs while they give these free samples to their patients. Thus, it is indicated that the free samples have a definite influence on physicians’ symmetrical prescription behavior. Similar results have been reported in another study stating that family physicians give these free samples to their patients to help reduce the cost of filling a prescription [64,65,66]. The free samples are given for several reasons: to compete with other drugs, to launch a new product, to establish an efficacy of a new drug, to introduce a drug to a new doctor, to change the image of a drug, and to enhance the familiarity and demand of drug. Extensive literature has demonstrated that samples have a significant impact, which influences the symmetry of prescription behavior of a physician [37,67]. Apart from free samples, pharmaceutical companies also use inexpensive gifts as reminders, including prescription pads, pens, paperweights, calendars, mountings, table organizers, wall clocks, diaries, and other gifts [27,68]. These gifts play the vital role of giving a constant reminder of a drug beyond the sales calls to the physician; thus, these reminder gifts play a vital role to enhance the physicians’ symmetrical prescription for a certain drug [23,24,69]. Besides these inexpensive gifts, pharmaceutical companies also give some valuable gifts to the physicians for the patients’ welfare such as stethoscopes, weighing machines, BP apparatuses, and Blood sugar test machines with strips, water dispensers, drug refrigerators, and other valuable gifts to buy a physicians’ time for detailing and for maintaining good relationships. Research studies have demonstrated that all kinds of gifts give opportunities to pharmaceutical companies to influence the symmetry of physicians’ prescription behavior [1,51,70]. Thus, the following hypothesis is formulated on the basis of previous research studies:
H4. 
Promotional material has a significant positive influence on the symmetry of physicians’ prescription behavior.

9. Personal Obligations

Pharmaceutical companies usually pay doctors’ travel expenses directly, and sometimes pay even the doctor’s family’s travel expenses [55]. The gifts presented to doctors range from stationery and office-related gifts with minimal value to more personal and innovative gifts such as household related gifts, overseas trips, and air-conditioners; but the huge monetary value gifts such as travel tickets and vacations are less common than inexpensive ones such as pens, notepads, and coffee mugs in pharmaceutical promotion [37,71]. Furthermore, one of the most common pharmaceutical promotional gifts is material for patient care and gifts unrelated to medicine practice [14,72]. There are several and common promotional practices intended by pharmaceutical companies to promote their products to doctors, such as paying for vacations or the travel expenses of doctors, offering them valuable gifts, lavish meals and entertainment, giving them cash commissions for prescribing a specific drug, money for drug trials, free medical samples, and promotional materials, as well as funding Continuing Medical Education (CME) and honoraria for teaching or speaking in such activities [16,27]. Physicians agree that these sorts of personal gifts are the indirect efforts of pharmaceutical companies to augment the symmetrical prescription business [1,73,74]. Personalized pharmaceutical marketing enhances the prescriptions as well as sponsorships for education and recreational activities and expensive gifts. Studies have demonstrated that physicians are more concerned about the ethical norms compared to medical residents (RMOs) [15,32]. However, physicians are more tilted towards local and foreign sponsorships, donations, and expensive give aways at the beginning of their careers that are provided by the pharmaceutical industry [23,24,75,76]. Hence, the following hypothesis is formulated on the basis of previous research studies:
H5. 
Personal gifts have a significant positive influence on the symmetry of physicians’ prescription behavior.

10. The Effect of Direct-to-Consumer Advertising (DTCA)

Pharmaceutical companies are using the direct-to-consumer-advertising (DTCA) channel to provide the prescription information for their existing and new products to consumers (patients) [5,77,78]. The objective of pharmaceutical companies is to persuade patients to ask their physicians for the prescription of these drugs. Thus, pharmaceutical companies indirectly influence the symmetry of physicians’ prescription behavior [6,79,80]. Previous literature adequately suggested that physicians have a tendency to accept patients’ requests. According to Herzenstein et al. [81], and Gupta et al. [23], the DTCA has a positive impact on patients to ask for a specific drug from their physicians, and this may increase the chances of symmetrical prescription business. However, studies are also available in which physicians are not influenced because of the safety profile, inappropriateness of drug, or availability of other, less expensive drugs [82]. Besides the affirmative effects of DTCA, there is a negative impact which is also seen when patients assess the effects of adoption and diffusion through DTCA. Nair et al. [83], and Pirisi [84] have evaluated this effect when physicians are forced to prescribe any specific drug that is not appropriate to the patient; thus, in this manner, patients have to pay the price (side effects, expensive drug, overdose, misuse etc.) of DTCA influence [2,37,85,86]. According to Manchanda et al. [87], and Pirisi [84], the American Association of pharmaceutical scientists stated that 91% physicians felt pressure to fulfill patients’ request. Thus, the following hypothesis is formulated on the basis of previous research studies:
H6. 
Direct-to-consumer-advertising (DTCA) has a significant positive influence on the symmetry of physicians’ prescription behavior.

11. Moderating Influence: Corporate Image and Customer Relationship

Corporate Image

Most organizations are aware that a promising corporate image can distinguish a company with a credible reputation [88,89,90,91,92]. Thus, the organization cannot rely solely on their products and brands as a measure of added value and effective differentiation. This has happened partly due to the convergence of the standards of product quality and capabilities, and the increasing requirement of transparency and accountability. According to Ahmed et al. [1], Anderson and Sullivan [93], Ettenson and Knowles [94], and Dowling [95], building an affirmative corporate image is deemed by many organizations to be an augmented and effective means of differentiation that provides a unique competitive advantage from rival organizations. The building of an appropriate corporate image through individuality entails a significant investment in terms of management efforts, time, and financial capitals; thus, it requires quantifiable and clear returns on investment. The existing literature has demonstrated that some quantifiable returns could be created through a corporate image; the corporate image may help to increase revenue and auxiliary support to the new product development [96,97,98]. According to Newell and Goldsmith [99], corporate image may also enhance financial relations; Smith [100] has argued that corporate image may improve employees’ recruitment, retention, and relations. According to Dowling [101], corporate image is helpful for faster recovery in crises periods; Gotsi and Wilson [102] have pointed out that the corporate image is a great source for the development of emotional values that may improve the brand value as well. Intense transformations in the industry have propelled increased organization interest in the opinions held by the key stakeholders and the favorable corporate image value. Several pharmaceutical organizations now also agree on the prominence of recognizing the key features that are used by numerous stakeholders to craft a good corporate image [58,59,103]. According to Flavian et al. [104], the success of a promising corporate image is based on effective marketing communication strategies that attract existing and new customers. Physicians are more likely to prescribe medicines that are manufactured by to a prestigious company; thus, physicians are more comfortable prescribing branded drugs [105,106]. In the case of Pakistani pharmaceutical industry, doctors are easily tilted towards branded or copy brands that belong to a reputable national and multinational company [3,25]. Hence, the following hypotheses are formulated on the basis of previous research studies:
H7A. 
Corporate image has a significant moderating effect between medical literature & Journal advertising, and physicians’ symmetrical prescription behavior.
H7B. 
Corporate image has a significant moderating effect between scientific activities and, physicians’ symmetrical prescription behavior.
H7C. 
Corporate image has a significant moderating effect between Medical representatives’ effectiveness, and physicians’ symmetrical prescription behavior.
H7D. 
Corporate image has a significant moderating effect between promotional material, and physicians’ symmetrical prescription behavior.
H7E. 
Corporate image has a significant moderating effect between personal obligations, and physicians’ symmetrical prescription behavior.
H7F. 
Corporate image has a significant moderating effect between direct-to-consumer-advertising, and physicians’ symmetrical prescription behavior.

12. Customer Relationship

Customer relationship plays a vital role between the pharmaceutical company and the physician, and its importance has been increasing for years. The marketing and promotion of a drug starts and ends at the level of physician. With pharmaceutical products, the consumer (patient) is not a direct customer of an organization; rather, the physician is the core customer for the pharmaceutical industry [14,22,107]. It is very interesting that, on one hand, the patient is not the direct consumer; however, on the other hand, the actual customer (physician) has to believe and rely on the information that is provided by the pharmaceutical company. Thus, it has a unique relationship that cannot be observed in any other industry [43,108,109,110]. Therefore, in pharmaceutical marketing, the customer relationship management (CRM) process is very significant, and marketing communication mix plays an important role in order to strengthen the relationship between physician and pharmaceutical company. Hence, all the national and transnational companies devise their marketing communication campaigns to enhance and sustain good relationships with physicians across the globe [6,60]. The long-run relationship not only strengthens business relationships, but it is also important to understand the physicians’ psyche and behavioral intentions towards symmetry in the prescription business [64,111]. The customer relationship marketing has now become paramount in every industry, and in the pharmaceutical industry, it has a distinctive importance: relationship marketing is an on-going process to engage physicians in the corporate activities and programs to enhance the mutual economic benefits at minimal cost [1,9,27]. Thus, in the pharmaceutical industry, companies have devised effective relationship-building campaigns with physicians that are helpful in retaining their competitive advantage among today’s intense competition. Medical detailing, company-sponsored conferences, CMEs, drug trials, involvement in scientific activities, personalized gifts, etc. are major and effective tools for developing customer relationships with physicians. Pharmaceutical companies are enjoying a long-lasting relationship with physicians in the form of the augmented and symmetrical prescription business that is based on credibility and trust [3,15]. Thus, the following hypotheses are formulated on the basis of previous research studies:
H8A. 
Customer relationship has a significant moderating effect between medical literature & Journal advertising, and symmetry of physicians’ prescription behavior.
H8B. 
Customer relationship has a significant moderating effect between scientific activities, and symmetry of physicians’ prescription behavior.
H8C. 
Customer relationship has a significant moderating effect between Medical representatives’ effectiveness, and symmetry of physicians’ prescription behavior.
H8D. 
Customer relationship has a significant moderating effect between promotional material, and symmetry of physicians’ prescription behavior.
H8E. 
Customer relationship has a significant moderating effect between personal obligations, and symmetry of physicians’ prescription behavior.
H8F. 
Customer relationship has a significant moderating effect between direct-to-consumer-advertising, and symmetry of physicians’ prescription behavior.
Based on the above discussions and the literature, we have developed and articulated the following conceptual model of our research study (Figure 1):

13. Material and Methods

13.1. Estimation Techniques

We have employed several estimation techniques to analyze the results, such as descriptive statistics to analyze the characteristics of central tendencies and measure of location of variables, reliabilities (factor loading for individual items, and Cronbach’s alpha, composite reliability & average variance extracted for factors) and validities (convergent and discriminant validities to confirm the construct validity) analyses to ascertain items and constructs, and SEM-based multivariate approaches, including exploratory factor analysis to validate and retain the items and variables such as rotated component matrix, KMO and Bartlett’s Sphericity tests, total variance explained, and anti-image matrix. We used confirmatory analysis to ascertain the theoretical constructs and factors. Thus, we employed indices statistics to validate the hypothesized measurement and structural models. Finally, we have employed Hayes conditional process modeling to substantiate the direct and indirect influence of exogenous and moderating variables, such as moderating analysis, R-square increase, conditional indirect effect analysis, and 3D plotting, to validate the moderating influence. For this purpose, we used MS-Excel 10, SPSS 22, AMOS 22, and Hayes conditional process modeling software 2016.

13.2. Data Collection and Respondents’ Profile

We sent out a total of 800 questionnaires to the general practitioners and medical specialists across Pakistan, and we received 740 responses with complete answers; 60 questionnaires were rejected due to incompleteness or inappropriate responses. Therefore, we achieved a 92.50% success rate, and according to MacCallum et al. [112], and Anderson and Gerbing [113], this was considered excellent. The outcomes shown in Table 1 demonstrated the respondents profiling, that shows that 428 (57.8%) responses were from male physicians, and 312 (42.2%) were received from female physicians. In terms of marital status, 295 (39.9%) respondents were single, 426 (57.6%) were married, and 19 (2.6%) respondents were divorced. As far as the age bracket of our respondents is concerned, 266 (35.9%) respondents were within the age bracket of 20–30 years, 164 (22.2%) within the age bracket of 30–40 years, 96 (13.0%) within the age bracket of 40–50 years, 124 (16.8%) within the age bracket of 50–60 years, and 90 (12.2%) were more than 60 years of age. Similarly, in terms of education, 326 (44.1%) received their medical graduate degrees, 227 (30.7%) received local post-graduate degrees, and 123 (16.6%) received foreign post-graduation, whereas, 64 (8.6%) received higher degrees such as a Ph.D. in medicine. As far as the experience of the respondents is concerned, 201 (27.2%) had 1–5 years working experience, 218 (29.5%) had 5–10 years experience, 99 (13.4%) had 10–15 years working experience, 103 (13.9%) had 15–20 years of experience, and the remaining 109 (16.1%) respondents had more than 20 years working experience. Finally, in terms of the income of respondents, 121 (16.4%) physicians had an income ranging between 30–60 thousand Pakistani Rupee per month, 332 (44.9%) of 60–90 thousand, 154 (20.8%) between 90–120 thousand, 80 (10.8%) physicians earned between 120–150 thousand, and 53 (7.2%) respondents earned more than 150 thousand per month.

14. Data Analysis and Results Estimations

In this section, we report the generated results and their interpretations from different software such as MS-Excel 10, SPSS 22, AMOS 22, and Hayes conditional process analysis. The following is a description of the results, which we extracted from the aforementioned software.

15. Descriptive Statistics of Initial Constructs

According to Ahmed et al. [114], and Huang et al. [115], the normality of data is a pre-requisite for the analysis of SEM-based approaches. Therefore, we have transformed our considered data sample into z-scores and used descriptive statistics. The results of Table 2 demonstrate that all the construct values of Kurtosis ranged between (−3 to +3), and the values of standard deviations and Skewness for all the items ranged between −1.5 to +1.5, which also validated that the data sample follows a normality pattern [3,116,117].

16. Reliabilities and AVE Analysis

The outcomes in Table 3 demonstrate that the values of Cronbach’s and composite reliabilities range between 0.80–0.90, which meets the minimum threshold criteria (>0.6) [114,118]. The outcomes of Table 3 further demonstrate that the values of factor loadings range between 0.70–0.95, which also meets the criterion of discriminant validities [114,116]. Similarly, the values of average variance extracted (AVE) are greater than 0.50 in all items; hence, the condition of convergent validity has also been fulfilled, which is also a pre-requisite for the SEM, EFA, and CFA approaches [119].

17. Exploratory Factor Analysis—EFA

For the reduction of the sample data, we employed exploratory factor analysis; the loaded sample data is further divided into factors and constructs. Thus, the EFA recruited the comparable item and factors. The EFA has the tendency and efficiency to shrink large amounts of data into meaningful, small segments. According to Emory and Cooper [120], the EFA approach may support the researcher in examining the precision of variables. The results in Table 4 demonstrate the outcomes of the rotated component matrix that validated the factors and items of the considered data sample. This research study comprises nine factors and twenty-nine items of these factors, for which PPB has three items, and MJA and scientific activities (SAC) have three constructs each. Similarly, MRE, PMT, POB, direct-to-consumer advertising (DTC), corporate image (CIM), and customer relationship have three items each factor. The outcomes of Table 4 further demonstrated that the value of factor loading for each construct is greater than 0.50, which establishes that our considered factors and items are valid [3,118,121].

18. Kaiser Meyer Olkin (KMO) and Bartlett’s Techniques

The Bartlett’s sphericity test and Kaiser Meyer Olkin (KMO) analysis establish the sampling adequacy and sample data fitness. The outcomes of Table 5 demonstrate that the value of KMO is 0.772, which is regarded as fairly good, because Kaiser [121] pointed out the values of KMO ranging between 0.70–0.79 are considered good. The outcomes of Table 5 further demonstrate that the value of Bartlett’s sphericity shows that the corresponding probability is less than 0.000; however, the minimum required threshold value is less than 0.50. Thus, the value of p < 0.05 demonstrates the correlation between the constructs, which shows the correlation amongst the items is significant and adequate, at 5% significance level.

19. Total Variance Explained

We have considered nine factors, and cumulative percentages of variance determined the dispersion of variance of these factors. Moreover, the individual Eigenvalues should also be greater than one. The outcomes of Table 6 establish that the cumulative variance of nine factors is 74.08%, which is well above the minimum required threshold value of 50%. Table 6 further exhibits that the total Eigenvalues of each factor is more than one, which also confirms the amount of variance among the potential factors. The results suggest retaining all the nine variables, and now we can proceed to further analysis.

20. The Anti-Image Matrix

For the selection and de-selection of variables, we employed an anti-image correlation matrix (AICM) approach. If any variable exhibits measures of sampling adequacy (MSA) greater than 0.5 in the diagonal of the anti-image correlation matrix (AICM), then that variable will be retained. The results of Table 7 show that all factors have a MSA value of more than 0.5 in the diagonal of AICM; therefore, we will retain all variables.

21. Confirmatory Factor Analysis—CFA

The confirmatory factor analysis is a direct and suitable approach for checking the measurement model in SEM-based approaches. The CFA confirms the prior theories and also determines whether our considered data sample is fit for the hypothesized measurement model [3,118]. In our measurement model, we have validated the factors for influencing the symmetry of PPB such as medical literature & journal advertising (MLJ), SAC, MRE, PMT, Personal obligations (POB), and DTC. Furthermore, we considered CIM and customer relationship (CRP) as moderating variables between exogenous and endogenous variables. In our measurement model, we considered twenty-nine items among nine factors, and fix the sample data between observed and unobserved variables [3,117]. The results of Table 3 show that the factor loadings of all the items range between 0.70–0.95, establishing that our overall measurement model is acceptable; the factor loading values also confirmed the discriminant validities of the hypothesized measurement model [3]. The outcomes of Table 8 show that the values of fit-indices (RNI:0.96, CFI:0.97, IFI:0.97, GFI:0.96, TLI:0.96, NFI:0.91, PNFI:0.86, PCFI:0.84 & RMSEA:0.003) are within the required threshold criterion for the considered measured model. Hence, it was concluded that our hypothesized measurement model is acceptable [114,118].

22. Structural Equation Modeling—SEM

For the estimations of factors for the (PPB), we employed the SEM-based structural model. We incorporated six factors pertaining to marketing and medical dimensions, namely, medical literature & journal advertising (MLJ), SAC, medical representatives’ effectiveness (MRE), PMT, personal gifts (POB), and DTC. Furthermore, we considered CIM and customer relationship (CRP) as moderating variables between exogenous and endogenous variables. In our measurement model, we considered twenty-nine items from among nine factors, and fixed the sample data between observed and unobserved variables [3,117]. The outcomes of Table 8 demonstrated that based on our proposed research hypotheses, the outcomes of the structural model revealed that our whole model is accepted under the values of minimum threshold criterion of fit-indices. The results of Table 8 show that the values of fit-indices ((RNI:0.97, CFI:0.99, IFI:0.99, GFI:0.97, TLI:0.98, NFI:0.93, PNFI:0.88, PCFI:0.87 & RMSEA:0.004) are within the required threshold criterion for the considered structured model. Hence, it was concluded that our structural model is accepted as a suitable means to asses the symmetry in PPB [114,118].

23. Hypothesized Direct Relationship

For the interpretation of the direct relationship between marketing & medical factors and the symmetry of (PPB), we employed standardized regression weights. We ascertained the direct association of marketing & medical factors: medical literature & journal advertising (MLJ), SAC, MRE, PMT, personal gifts (POB), and DTC on the (PPB). The outcomes of Table 9 show that all the six null hypotheses (H1–H6) have been placed in the rejection region, as corresponding T-values are greater than 2, and p-values are less than 0.05. Thus, it was concluded that medical literature & journal advertising (MLJ), SAC, MRE, PMT, personal obligations (POB), and DTC have a significant positive influence on the symmetry of (PPB). The outcomes of Table 9 further reveal that PMT has the highest impact (0.915) on PPB, followed by the scientific activities (0.897) and personal obligations (0.888). However, MRE has the individual impact of (0.853), medical literature & journal advertising (MLJ) has (0.811), and DTC has an impact of (0.791) on the symmetry of PPB in the context of Pakistani healthcare industry.

24. Moderating Effect of CIM and CRP (Moderation Analysis)

The results of Table 10 show that moderating variables such as CIM and customer relationship (CRP) in association with the exogenous variables for instance medical literature & journal advertising (MLJ), SAC, MRE, PMT, personal gifts (POB), DTC, and symmetry of (PPB). The multiplicative effect of the MLJ and the moderating variable (CIM) exhibited a significant effect because the corresponding probability is less than 0.05. Hence, the null hypothesis H7A has been placed in rejection region, and the decision is in support of the statement. Similarly, the null hypotheses H7B and H8B were rejected, and it was concluded that the moderator CIM and CRP have a significant impact in the association of SAC, and the symmetry of PPB because the corresponding p-values are less than 0.05. The null hypothesis H8C has also been rejected, since the corresponding p-values are less than 0.05 (p < 0.05); hence, the moderator CRP has a significant effect on the relationship of MRE and PPB. Similarly, The null hypotheses H7E and H7F have also been placed in the rejection region (p < 0.05); hence, the moderator CIM has a significant effect on the relationship between POB and PPB, and DTC and PPB. However, the remaining hypotheses, i.e., H8A, H7C, H7D, H8D, H8E, and H8F, do not lie in the rejection region because the corresponding probabilities are greater than p > 0.05. Hence, it was concluded that the moderating variable customer relationship (CRP) does not have a significant impact between MLJ and PPB, and similarly, the moderating variable CIM does not have a significant impact on MRE and PPB, the moderating variables such as CIM and CRP do not have significant impact on PMT and PPB, and POB and PPB, and CRP does not have significant impact on the relationship between DTC and PPB.

25. R-Square Increment

According to Bolin [122], and Hayes [123], the increase in R-square occurs because of the catalyzing influence of the moderating variables. The outcomes of Table 11 show that an increase in R-squared occurs because of the interaction of moderating variables such as CIM and CRP in the association with the exogenous variables, for instance MLJ, SAC, MRE, PMT, POB, DTC, and PPB. The outcomes of moderation are substantiated from the higher values of F-statistics, and their corresponding probabilities are less than 0.05 (p < 0.05). Except for the moderation of CIM between MRE & PPB, PMT & PPB, and moderation of CRP between MLJ & PPB, PMT & PPB, POB & PPB, and DTC & PPB where p > 0.05.

26. Conditional Effect of CIM and CRP (Moderators)

Results of the conditional effect of moderators such as CIM and CRP on independent variables such as MLJ, SAC, MRE, PMT, POB, DTC, and PPB as dependent variable are shown in Table 12. The extreme left column shows the various quantitative values of moderating variables such as CIM and CRP, which are mean of ±1 SD from the mean that matches to the 25th, 50th, and 75th, a percentile of the spreading of the CIM and CRP measures at 0.05 significance level. The results of conditional effect proposed that the independent variables such as MLJ, SAC, MRE, PMT, POB, DTC, and PPB at two measures of moderators (CIM & CRP) is significant, since the corresponding p-values are less than 0.05 [122,123], except for the conditional moderation of CRP between DTC & PPB (p > 0.05).

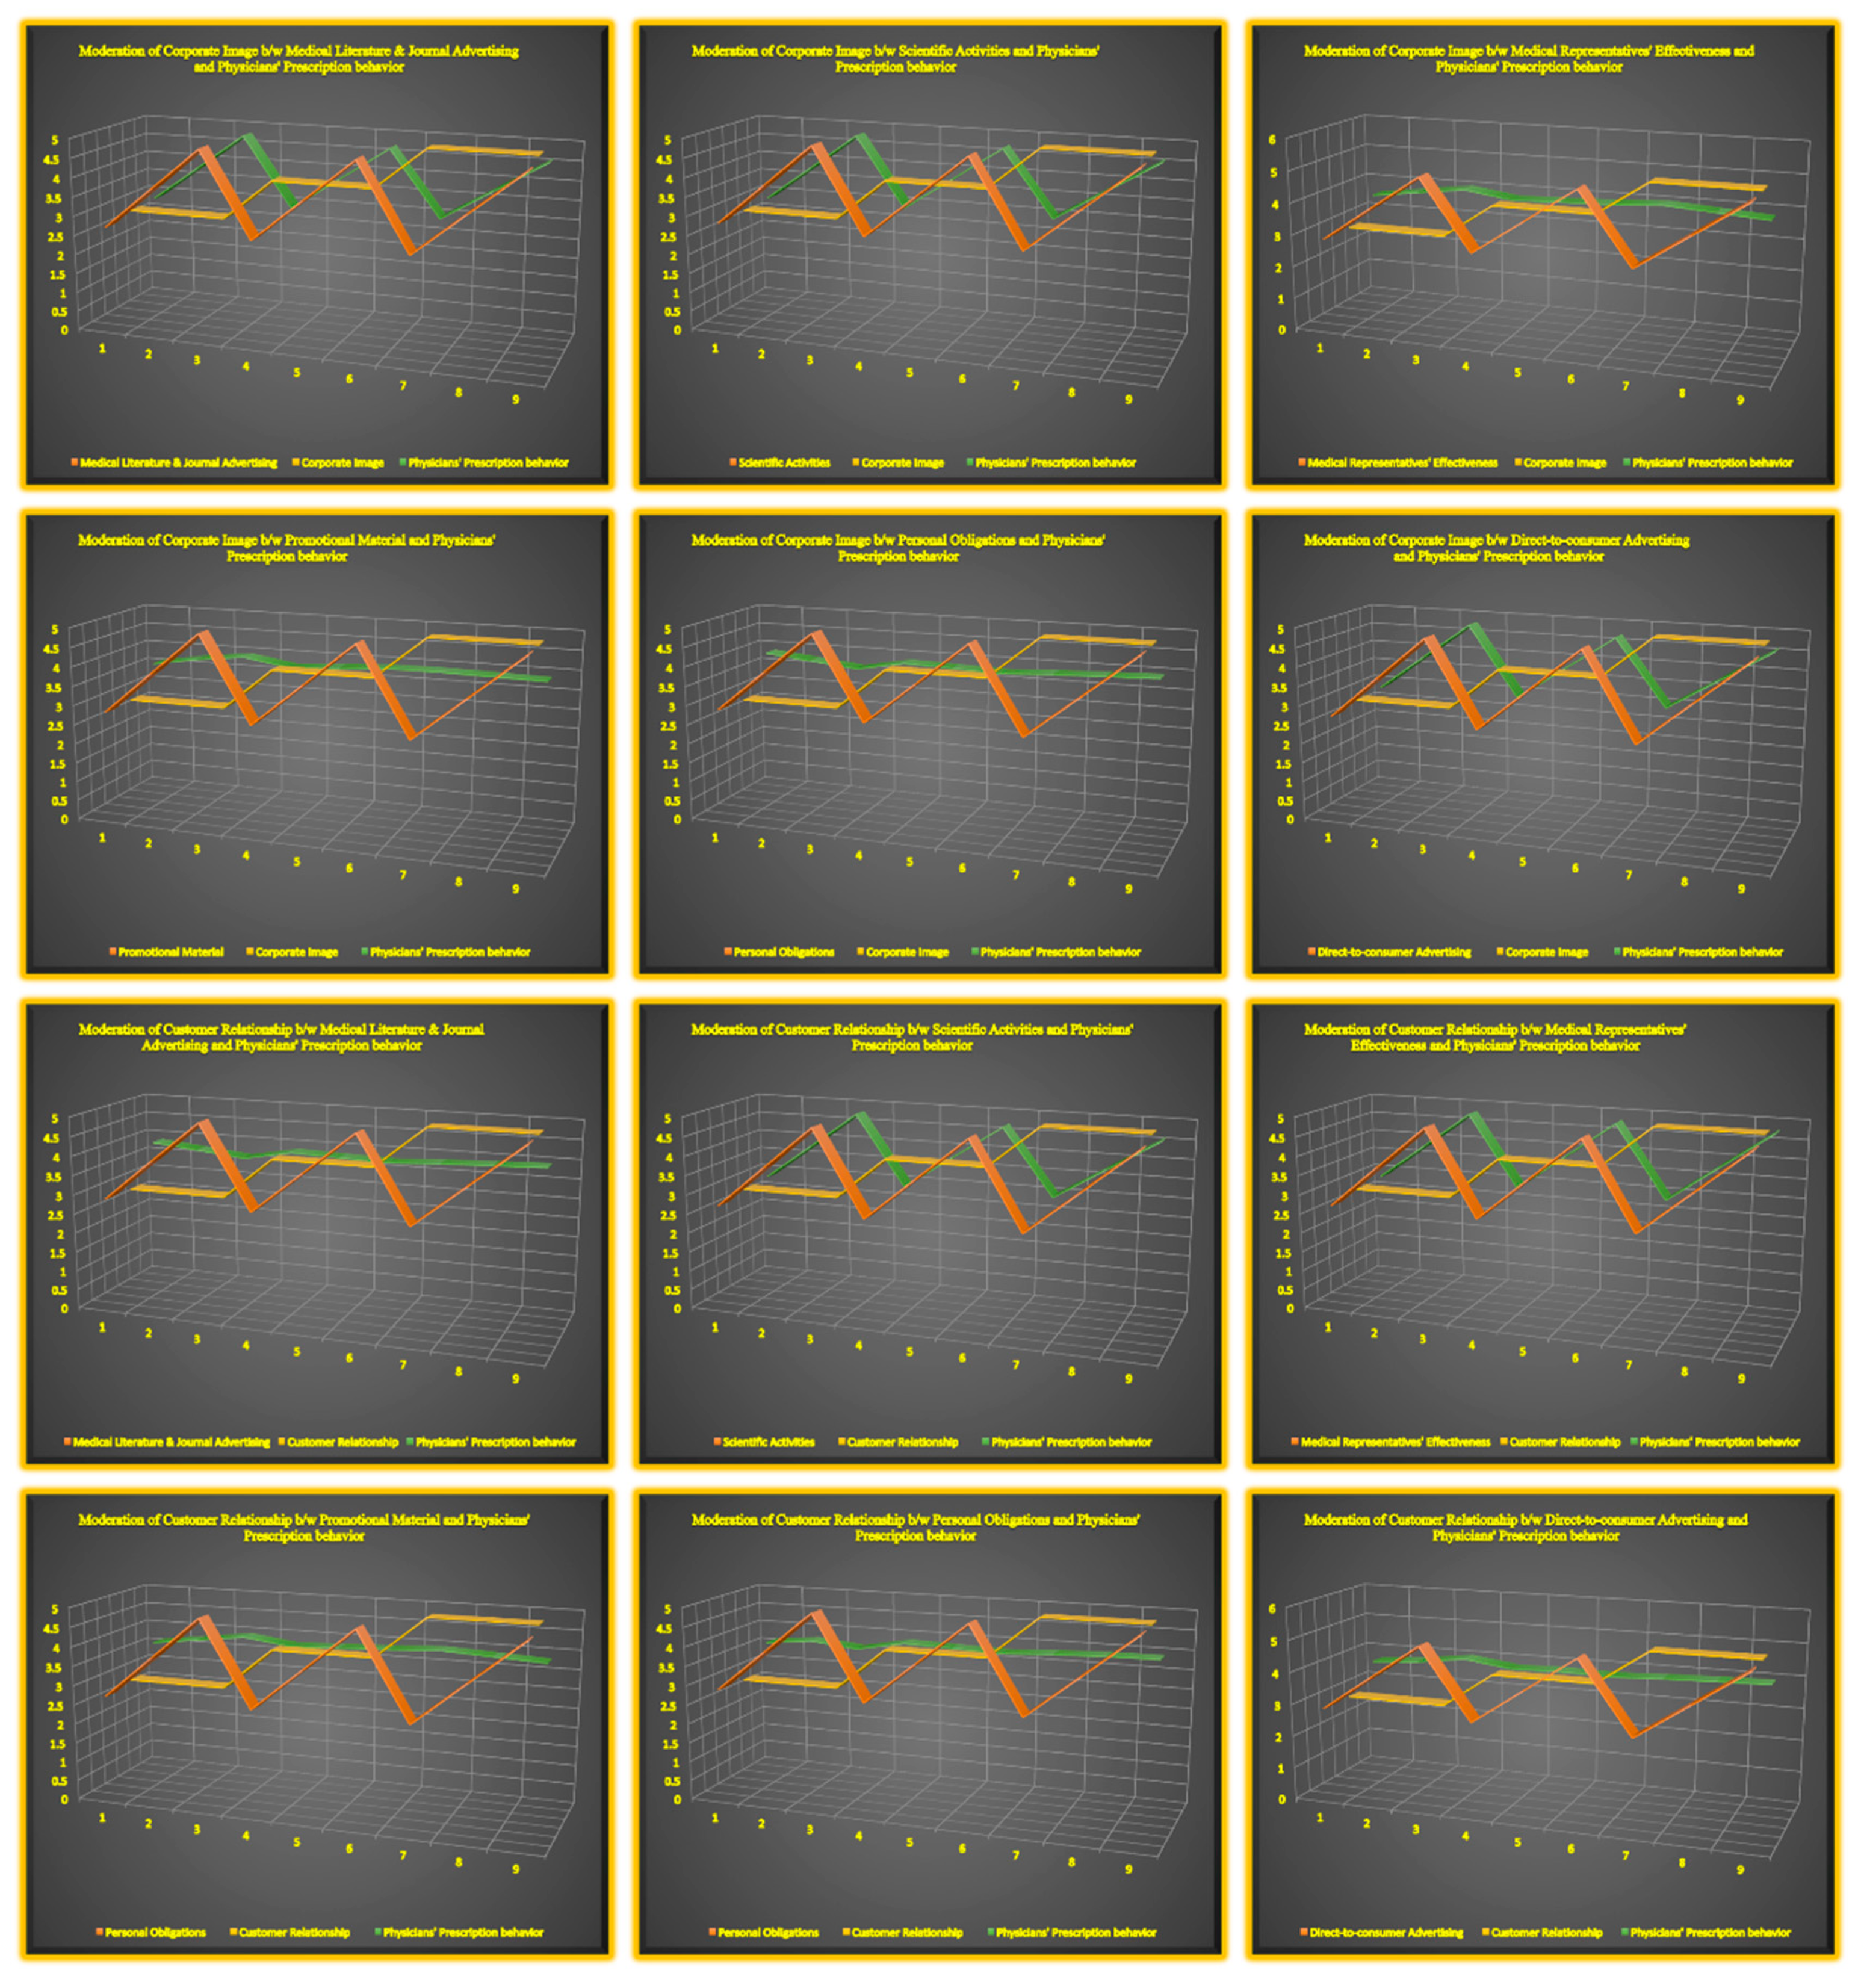
27. Visualization of Conditional Effect

The visualizing conditional effect can be seen in Figure 2, in which the moderating variables CIM, and customer relationship (CRP), in the relationship of MLJ, SAC, MRE, PMT, POB, DTC, and PPB. According to the Figure 2, the 3D plots exhibit that the independent variables such as MLJ, SAC, MRE, PMT, POB, DTC, and PPB experienced a significant influence of moderation, while we inducted two moderating variables such as CIM and customer relationship (CRP). The results of Figure 2 shows that the effect of prescription behavior is changing with the different values of moderating variables (CIM & CRP), with the constant values for independent variables (MLJ, SAC, MRE, PMT, POB & DTC) during this moderating process. Bolin [122], and Hayes [123] pointed out that graphical representation is an essential condition to show the moderation process because it clearly demonstrates the impact of moderation. Figure 2 uses red for the independent variables (MLJ, SAC, MRE, PMT, POB & DTC), orange for the incorporated moderators (CIM & CRP), and green for the effect of symmetry of PPB. Hence, it is, finally, concluded from the 3D graphs of Figure 2, the moderating variable CIM has a cogent influence amongst the association of MLJ, SAC, and DTC, and PPB in the context of the Pakistani pharmaceutical industry. However, the moderating variable customer relationship (CRP) has a significant influence amongst the association of SAC and MRE, and the symmetry of PPB in the context of the Pakistani pharmaceutical industry.

28. Discussions

The objective of this study was to examine the factors which are important antecedents for the symmetry of Physicians’ prescription behavior in the context of Pakistani pharmaceutical market. Another objective was to ascertain the moderating variables such as corporate image and customer relationship between predictors and dependent variable i.e., the symmetry of physicians’ prescription behavior. The results of the study demonstrated that independent variables such as medical literature & journal advertising have a positive and significant impact on Physicians’ symmetrical prescription behavior, which is also substantiated the previous literature, for instance, Mulinari [15], Lotfi et al. [32], Rizzo [35], and DeJong et al. [37]. The outcomes of the study also showed that the scientific activities have a positive and significant influence on the symmetry of physicians’ prescription behavior; this result also validated the previous literature [3,16,23,24,27,48]. The outcomes further demonstrated that the predictor, medical representatives’ effectiveness, also has a strong and positive influence on the physicians’ symmetrical prescription behavior, which is also in line with the previous research studies such as: De Ferrari et al. [6], Gupta et al. [23], Yeh et al. [55], Makowska [58], and Siddiqui et al. [59]. The results also demonstrated the positive and significant impact of promotional material on the symmetry of physicians’ prescription behavior that is validated by the previous literature in works such as Ahmed, et al. [1], Yeh et al. [55], Makowska [58], Siddiqui et al. [59], Hurley et al. [64], and Katz et al. [70]. The outcomes of the study also concluded that the personal obligations have a direct and significant influence on physicians’ prescription behavior; these results are in line with the previous research studies [14,16,27,37,55,71,124]. Finally, the results concluded that the direct-to-consumer advertising (DTCA) has a positive and cogent effect on the physicians’ symmetrical prescription behavior; these results also certified the previous literature, such as Kesselheim et al. [2], Khan et al. [5], De Ferrari et al. [6], Alosaimi et al. [78], Osinga et al. [79], Shalowitz et al. [80], Gonül et al. [86]. The outcomes of moderating variables concluded that the corporate image has a significant influence between predictors such as Medical literature & Journal advertising, scientific activities, and direct-to-consumer advertising (DTCA), and endogenous variable i.e., physicians’ symmetrical prescription behavior. These results are consistent with previous research studies such as Lieb and Scheurich [88], Brown et al. [96], Balmer and Greyser [105], Jaffe and Nebenzahl [106]. The outcomes of the moderator, customer relationship, showed evidence that the customer relationship has a significant impact amongst the association of scientific activities and Medical representative effectiveness, and the symmetry of PPB in the context of the Pakistani pharmaceutical industry. These results also validated the previous literature [9,14,15,22,64,125,126].

29. Conclusions

The undertaken research concluded that there are several factors which are significant for the symmetry of physicians’ prescription behavior in the context of Pakistani pharmaceutical industry. The results of the study concluded that predictors such as medical representatives’ effectiveness, medical literature & journal advertising, scientific activities, personal obligations, promotional material, and direct-to-consumers advertising have positive and significant influence on the physicians’ symmetrical prescription behavior. Since the promotional material has the highest positive and significant, the local and transnational pharmaceutical companies should give maximum allocation of budget to the promotional material such as literature on drugs, prescription information monographs, free samples, mountings, and reminder gifts. The scientific activities influence is second; therefore, companies should allocate separate budgets to scientific activities, such as round table discussions, medical group meetings, wards presentations, chamber presentations, and local & foreign speaker programs. Human resources are a vital element for every industry, and especially in pharmaceutical industry, where one-to-one selling takes place; the medical representatives’ competency plays a significant role. Thus, the companies should initiate periodic technical and selling skills training programs to enhance the efficacy of MRs effectiveness. The concept of DTCA has been very popular and effective with the advancement of technology; hence, the pharmaceutical companies should also hire a separate team to promote their brands through Internet channels. The undertaken study also concluded that the corporate image and customer relationship are significant moderators that enhance the numbers of prescriptions; therefore, companies should also focus the CSR activities that can increase their corporate image. Moreover, there should be a customized approach to promote their products to every individual physician.

30. Managerial Policy Implications

The outcomes of this research study provide the foundations to the brand/marketing/medical managers of the pharmaceutical industry for how they should respond to physicians’ prescription practices. Medical managers should cater the needs of medical literature, current studies, products monographs, and medical journal advertising, which are essentially required by the medical practitioners. The results clearly demonstrated that the medical literature and journal advertising play a vital role in reshaping the symmetry of prescription behavior of physicians; thus, special emphasis should be given while making and producing this literature for physicians. The most important managerial implication of this study is to devise rational and effective marketing strategies according to brand and marketing managers. They should be more vigilant and responsive while making strategies in terms of promotional material, scientific activities, training and development of MRs, personal obligations, and the use of online media for DTCA communication. Since the results have shown these channels have a direct and significant influence on the symmetry of prescription business, marketers should utilize their marketing resources in an effective and efficient manner to gain a competitive advantage. Finally, marketers and medical managers should also devise a program for corporate image building and CRM programs to retain and enhance existing and potential customers.

31. Limitations and Delimitations of the Research

The outcomes of this research have demonstrated the effectiveness of medical, marketing, and moderating variables on how to get the maximum prescription business from physicians. However, nothing could be generalized for every culture and society; factors can be varied for developed and developing economies. Thus, there is a need to examine other marketing and medical factors, which are pertinent to diverse cultures and medical specialties on a regular basis to device effective marketing strategies. Moreover, there are certain mediating and moderating variables that can influence the symmetry of physicians’ prescription behavior. So, it is recommended for the future research studies that those factors be incorporated for more robust results. The geographic scope is also very limited; thus, it is also recommended that regional countries replicate this research for a better understanding of physicians’ attitude towards the prescription business. We have employed an SEM-based multivariate approach that ignores the causality description; therefore, it is also recommended that future researchers employ causal modeling approaches to measure the influential and causal effects to comprehend the behavioral and psychological intentions of physicians’ symmetrical prescription trends.

Author Contributions

Conceptualization, D.S. and R.A.; methodology, J.V., Z.C.; software, Z.C. and R.S.; validation, R.A. and V.P.; formal validation, R.S. and J.V.; writing, R.A. and V.P.; visualization, R.S. and Z.C.; supervision, D.S. and R.A.; project administration, D.S. and Z.C.

Funding

This research received no external funding.

Conflicts of Interest

The authors declare no conflicts of interest.

Disclosure Statement

Evidently, researchers have not reported any impending conflict of interest.

References

  1. Ahmed, R.R.; Vveinhardt, J.; Štreimikienė, D.; Ashraf, M.; Channar, Z.A. Modified SERVQUAL Model and Effects of Customer Attitude and Technology on Customer Satisfaction in Banking Industry: Mediation, Moderation and Conditional Process Analysis. J. Bus. Econ. Manag. 2017, 18, 974–1004. [Google Scholar] [CrossRef]
  2. Ahmed, R.R.; Vveinhardt, J.; Štreimikienė, D.; Awais, M. Mediating and Marketing factors influence the prescription behavior of Physicians: An Empirical Investigation. Amfiteatru Econ. 2016, 18, 153–167. [Google Scholar]
  3. Ahmed, R.R.; Vveinhardt, J.; Štreimikienė, D. The direct and indirect impact of Pharmaceutical industry in Economic expansion and Job creation: Evidence from Bootstrapping and Normal theory methods. Amfiteatru 2018, 20, 454–469. [Google Scholar] [CrossRef]
  4. Aikin, K.J.; Swasy, J.L.; Braman, A.C. Patient and Physician Attitudes and Behaviors Associated with DTC Promotion of Prescription Drugs; U.S. Department of Health and Human Services Food and Drug Administration: Silver Spring, MD, USA, 2004.
  5. Alosaimi, F.D.; Al Kaabba, A.; Qadi, M.; Albahlal, A.; Alabdulkarim, Y.; Alabduljabbar, M.; Alqahtani, F. Physicians’ attitudes towards interaction with the pharmaceutical industry/Attitudes des médecins par rapport á l’interaction avec l’industrie pharmaceutique. East. Med. Health J. 2014, 20, 812–819. [Google Scholar] [CrossRef]
  6. Anderson, E.W.; Sullivan, M.W. The Antecedents and Consequences of Customer Satisfaction for Firms. Mark. Sci. 2003, 12, 125–143. [Google Scholar] [CrossRef]
  7. Anderson, J.C.; Gerbing, D.W. Structural equation modeling in practice: A review and recommended two-step approach. Psychol. Bull. 1988, 103, 411–423. [Google Scholar] [CrossRef]
  8. Anon. Study finds problems in M.D.-sales rep relationship. Pharm Representative, 6 August 2003. [Google Scholar]
  9. Arora, U.; Taneja, G. An Analytical Study of Physicians Behavior towards Marketing of Pharmaceutical Products. Indian J. Mark. 2006, 36, 10–13. [Google Scholar]
  10. Avlonitis, G.J.; Panagopoulos, N.G. Antecedents and Consequences of CRM Technology Acceptance in the Sales Force. Ind. Mark. Manag. 2004, 33, 475–489. [Google Scholar] [CrossRef]
  11. Bala, R.; Bhardwaj, P. Detailing vs. Direct-to-Consumer Advertising in the Prescription Pharmaceutical Industry. Manag. Sci. 2010, 56, 148–160. [Google Scholar] [CrossRef] [Green Version]
  12. Balmer, J.M.T.; Greyser, S.A. Managing the multiple identities of the corporation. Calif. Mana. Rev. 2002, 44, 72–86. [Google Scholar] [CrossRef]
  13. Birkhahn, R.H.; Jauch, E.; Kramer, D.A.; Nowak, R.M.; Raja, A.S.; Summers, R.L.; Weber, J.E.; Diercks, D.B. A review of the federal guidelines that inform and influence relationships between physicians and industry. Acad. Emerg. Med. 2009, 16, 776–781. [Google Scholar] [CrossRef] [PubMed]
  14. Bolin, J.H. Hayes, Andrew, F. (2013). Introduction to Mediation, Moderation, and Conditional Process Analysis: A Regression-Based Approach. New York, NY: The Guilford Press. J. Educ. Meas. 2014, 51, 335–337. [Google Scholar] [CrossRef]
  15. Boltri, J.M.; Gordon, E.R.; Vogel, R.L. Effect of antihypertensive samples on physician prescribing patterns. Fam. Med. 2002, 34, 729–731. [Google Scholar] [PubMed]
  16. Bowman, M.A.; Pearle, D.L. Changes in drug prescribing patterns related to commercial company funding of continuing medical education. J. Contin. Educ. Health Prof. 1988, 8, 13–20. [Google Scholar] [CrossRef] [PubMed]
  17. Brown, S.R.; Evans, D.V.; Fugh-Berman, A. Pharmaceutical industry interactions in family medicine residencies decreased between 2008 and 2013: A CERA study. Fam. Med. 2015, 47, 279–282. [Google Scholar]
  18. Byrne, B.M. Structural Equation Modeling with AMOS, Basic Concepts, Application and Programming, 2nd ed.; La Erlbaum Associates: Hillsdale, NJ, USA, 2009. [Google Scholar]
  19. Campbell, E.G.; Gruen, R.L.; Mountford, J.; Miller, L.G.; Cleary, P.D.; Blumenthal, D. A national survey of Physicians-Industry relationships. N. Engl. J. Med. 2007, 356, 1742–1750. [Google Scholar] [CrossRef]
  20. Carroll, A.; Barnes, S.J.; Scornavacca, E.; Fletcher, K. Consumer perceptions and attitudes towards SMS advertising: Recent evidence from New Zealand. Int. J. Advert. 2007, 26, 79–98. [Google Scholar] [CrossRef]
  21. Caudill, T.S.; Johnson, M.S.; Rich, E.C.; McKinney, W.P. Physicians, pharmaceutical representatives, and the cost of prescribing. Arch. Fam. Med. 1996, 5, 201–206. [Google Scholar] [CrossRef]
  22. Chetley, A. Problem Drugs; Health Action International: Amsterdam, The Netherlands, 1995. [Google Scholar]
  23. Chew, L.D.; O’Young, T.S.; Hazlet, T.K.; Bradley, K.A.; Maynard, C.; Lessler, D.S. A physician survey of the effect of drug sample availability on physicians’ behavior. J. Gen. Intern. Med. 2000, 15, 478–483. [Google Scholar] [CrossRef] [Green Version]
  24. Chimonas, S.; Brennan, T.A.; Rothman, D.J. Physicians and Drug Representatives: Exploring the Dynamics of The Relationship. Soc. Gen. Intern. Med. 2007, 22, 184–190. [Google Scholar] [CrossRef] [PubMed]
  25. Chren, M.M.; Landefeld, C.S. Physicians’ behavior and their interactions with drug companies. A controlled study of physicians who requested additions to a hospital drug formulary. JAMA 1994, 271, 684–689. [Google Scholar] [CrossRef] [PubMed]
  26. Cialdini, R.B. Influence: Science and Practice, 3rd ed.; HarperCollins College Publishers: New York, NY, USA, 1993. [Google Scholar]
  27. Clark, M.M.; Gong, M.; Schork, M.; Evans, D.; Roloff, D.; Hurwitz, M.; Maiman, L.; Mellins, R. Impact of Education for Physicians on Patient Outcomes. Am. J. Pediatr. 1998, 101, 831–836. [Google Scholar] [CrossRef]
  28. Corckburn, J.; Pit, S. Prescribing behaviour in clinical practice: Patients’ expectations and doctors’ perceptions of patients’expectations—A questionnaire study. BMJ 1997, 315, 520–523. [Google Scholar] [CrossRef]
  29. Couturier, C.; Zaleski, I.; Jolly, D.; Durieux, P. Effects of financial incentives on medical practice: Results from a systematic review of the literature and methodological issues. Int. J. Qual. Health Care 2000, 12, 133–142. [Google Scholar] [CrossRef]
  30. Davies, G.; Chun, R.; da Silva, R.V.; Roper, S. Corporate Reputation and Competitiveness; Routledge: London, UK, 2003. [Google Scholar]
  31. De Ferrari, A.; Gentille, C.; Davalos, L.; Huayanay, L.; Malaga, G. Attitudes and relationship between physicians and the pharmaceutical industry in a public general hospital in Lima, Peru. PLoS ONE 2014, 9, e100114. [Google Scholar] [CrossRef]
  32. De Laat, E.; Windmeijer, F.; Douven, R. How Does Pharmaceutical Marketing Influence Doctors’ Prescription Behaviour? CPB Netherlands’ Bureau for Economic Policy Analysis: The Hague, The Netherlands, 2002.
  33. DeJong, C.; Aguilar, T.; Tseng, C.W.; Lin, G.A.; Boscardin, W.J.; Dudley, R.A. Pharmaceutical Industry Sponsored Meals and Physician Prescribing Patterns for Medicare Beneficiaries. JAMA Intern. Med. 2016, 176, 1114–1122. [Google Scholar] [CrossRef]
  34. Dixon, D.; Takhar, J.; Macnab, J.; Eadie, J.; Lockyer, J.; Stenerson, H.; François, J.; Bell, M. Controlling quality in CME/ CPD by measuring and illuminating bias. J. Contin. Educ. Health Prof. 2011, 31, 109–116. [Google Scholar] [CrossRef]
  35. Dolovich, L.; Levine, M.; Tarajos, R.; Duku, E. Promoting optimal antibiotic therapy for otitis media using commercially sponsored evidence-based detailing: A prospective controlled trial. Drug Inf. J. 1999, 33, 1067–1077. [Google Scholar] [CrossRef]
  36. Dowling, G.R. Corporate Reputations. Strategies for Developing the Corporate Brand; Kogan Page: London, UK, 1994. [Google Scholar]
  37. Dowling, G.R. Creating Corporate Reputations. Identity, Image and Performance; Oxford University Press: Oxford, UK, 2001. [Google Scholar]
  38. Dowling, G.R. Corporate reputations: Should you compete on yours? Calif. Manag. Rev. 2004, 46, 19–36. [Google Scholar] [CrossRef]
  39. Elling, M.E.; Fogle, H.J.; McKhann, C.S.; Simon, C. (2002). Making more of pharma’s sales force. McKinsey Q. 2002, 3, 86–95. [Google Scholar]
  40. Emory, C.W.; Cooper, D.R. Business Research Methods, 4th ed.; Irvin: Boston, MA, USA, 1991. [Google Scholar]
  41. Ettenson, R.; Knowles, J. Merging the brands and branding the merger. Sloan Manag. Rev. 2006, 47, 39–49. [Google Scholar]
  42. Findlay, S. Prescription Drugs and Mass Media Advertising; National Institute for Health Care Management: Washington, DC, USA, 2000. [Google Scholar]
  43. Flavian, C.; Torres, E.; Guinaliu, M. Corporate image measurement. A further problem for the tangibilization of Internet banking services. Int. J. Bank Mark. 2004, 22, 366–384. [Google Scholar] [CrossRef]
  44. Fornell, C.; Larcker, D.F. Evaluating structural equation models with unobservable variables and measurement error. J. Mark. Res. 1981, 18, 39–50. [Google Scholar] [CrossRef]
  45. Francer, J.; Izquierdo, J.Z.; Music, T.; Narsai, K.; Nikidis, C.; Simmonds, H.; Woods, P. Ethical pharmaceutical promotion and communications worldwide: Codes and regulations. Philos. Ethics Humanit. Med. 2014, 9, 7. [Google Scholar] [CrossRef]
  46. Gagnon, M.A.; Lexchin, J. The cost of pushing pills: A new estimate of pharmaceutical promotion expenditures in the United States. PLoS Med. 2008, 5, e1. [Google Scholar] [CrossRef]
  47. Gonül, F.F.; Carter, F.; Petrova, E.; Srinivasan, K. Promotion of Prescription Drugs and its Impact on Physicians’ Choice Behavior. J. Mark. 2001, 65, 79–90. [Google Scholar] [CrossRef]
  48. Gotsi, M.; Wilson, A.M. Corporate reputation: Seeking a definition. Corp. Commun. Int. J. 2001, 6, 24–30. [Google Scholar] [CrossRef]
  49. Greene, J. Drug Reps. In Targeting Non-Physicians; American Medical Association: Chicago, IL, USA, 2000. [Google Scholar]
  50. Greyser, S.A. Advancing and enhancing corporate reputation. Corp. Commun. J. 1999, 4, 177–181. [Google Scholar] [CrossRef]
  51. Groves, K.E.M.; Sketris, I.; Tett, S.E. Prescription drug samples–Does this marketing strategy counteract policies for quality use of medicines? J. Clin. Pharm. Ther. 2003, 28, 259–271. [Google Scholar] [CrossRef]
  52. Grundy, Q.; Bero, L.; Malone, R. Interactions between non-physician clinicians and industry: A systematic review. PLoS Med. 2013, 10, e1001561. [Google Scholar] [CrossRef] [PubMed]
  53. Gupta, S.K.; Nayak, R.P.; Sivaranjani, R. A study on the interactions of doctors with medical representatives of pharmaceutical companies in a Tertiary Care Teaching Hospital of South India. J. Pharm. Bioallied Sci. 2016, 8, 47–51. [Google Scholar] [CrossRef] [PubMed]
  54. Haddad, J.K. The Pharmaceutical Industry’s Influence on Physician Behavior and Health Care Costs. 2002. Available online: https://www.sfms.org/sfm/sfm602a.htm (accessed on 29 May 2003).
  55. Hair, J.F.; Black, W.C.; Babin, B.J.; Anderson, R.E. Multivariate Data Analysis, 7th ed.; Prentice Hall: Upper Saddle River, NJ, USA, 2010. [Google Scholar]
  56. Hall, R. The strategic analysis of intangible resorces. Strateg. Manag. J. 1992, 13, 135–144. [Google Scholar] [CrossRef]
  57. Halperin, E.C.; Hutchison, P.; Barrier, R., Jr. A population-based study of the prevalence and influence of gifts to radiation oncologists from pharmaceutical companies and medical equipment manufacturers. Int. J. Radiat. Oncol. Biol. Phys. 2004, 59, 1477–1483. [Google Scholar] [CrossRef] [PubMed]
  58. Hayes, A.F. Introduction to Mediation, Moderation, and Conditional Process Analysis: A Regression-Based Approach; The Guilford Press: New York, NY, USA, 2013. [Google Scholar]
  59. Hersh, W.R.; Crabtree, K.M.; Hickam, D.H.; Sacherek, Y.; Friedman, C.P.; Tidmarch, P.; Mosbaek, C.; Kramier, D. Factors associated with success in searching MEDLINE and applying evidence to answer clinical questions. J. Am. Med. Informat. Assoc. 2002, 9, 283–293. [Google Scholar] [CrossRef]
  60. Herzenstein, M.; Misra, S.; Posavac, S.S. How consumers’ attitudes toward direct-to-consumer advertising of prescription drugs influence ad effectiveness, and consumer and physician behavior. Mark. Lett. 2004, 15, 201–212. [Google Scholar] [CrossRef]
  61. Holmer, A.F. Industry strongly supports continuing medical education. JAMA 2001, 285, 2012–2014. [Google Scholar] [CrossRef] [PubMed]
  62. Huang, J.H.; Lee, B.C.Y.; Ho, S.H. Consumer attitude toward grey market goods. Int. Mark. Rev. 2004, 21, 598–614. [Google Scholar] [CrossRef]
  63. Hurley, M.P.; Stafford, R.S.; Lane, A.T. Characterizing the relationship between free drug samples and prescription patterns for acne vulgaris and rosacea. JAMA Dermatol. 2014, 150, 487–493. [Google Scholar] [CrossRef]
  64. Jaffe, E.D.; Nebenzahl, I.D. National Image & Competitive Advantage, the Theory and Practice of Place Branding, 2nd ed.; Copenhagen Business School Press: Frederiksberg, Denmark, 2006. [Google Scholar]
  65. Kaiser, H.F. An index of factorial simplicity. Psychometrika 1974, 39, 31–36. [Google Scholar] [CrossRef]
  66. Kamal, S.; Holmberg, C.; Russell, J.; Bochenek, T.; Tobiasz-Adamczyk, B.; Fischer, C.; Tinnemann, P. Perceptions and Attitudes of Egyptian Health Professionals and Policy-Makers towards Pharmaceutical Sales Representatives and Other Promotional Activities. PLoS ONE 2015, 10, e0140457. [Google Scholar] [CrossRef] [PubMed]
  67. Katz, D.; Caplan, A.L.; Merz, J.F. All gifts large and small. Am. J. Bioethics 2003, 2, 39–46. [Google Scholar] [CrossRef] [PubMed]
  68. Kesselheim, A.S.; Mello, M.M.; Studdert, D.M. Strategies and practices in off label marketing of pharmaceuticals: A retrospective analysis of whistleblower complaints. PLoS Med. 2011, 8, e1000431. [Google Scholar] [CrossRef] [PubMed]
  69. Khan, N.; Naqvi, A.; Ahmad, R.; Ahmed, F.; McGarry, K.; Fazlani, R.; Ahsan, M. Perceptions and Attitudes of Medical Sales Representatives (MSRs) and Prescribers Regarding Pharmaceutical Sales Promotion and Prescribing Practices in Pakistan. J. Young Pharm. 2016, 8, 244–250. [Google Scholar] [CrossRef] [Green Version]
  70. Leeflang, P.S.H.; Wieringa, J.E. Modeling the effects of pharmaceutical marketing. Mark. Lett. 2010, 21, 121–133. [Google Scholar] [CrossRef]
  71. Leffler, K.B. Persuasion or Information? The Economics of Prescription Drug Advertising. J. Law Econ. 1981, 24, 45–74. [Google Scholar] [CrossRef]
  72. Lexchin, J. Interactions between physicians and the pharmaceutical industry: What does the literature say? Can. Med. Assoc. J. 1993, 14, 1401–1407. [Google Scholar]
  73. Lieb, K.; Koch, C. Medical students’ attitudes to and contact with the pharmaceutical industry: A survey at eight German university hospitals. Dtsch. Arztebl. Int. 2013, 110, 584–590. [Google Scholar]
  74. Lieb, K.; Scheurich, A. Contact between Doctors and the Pharmaceutical Industry, Their Perceptions, and the Effects on Prescribing Habits. PLoS ONE 2014, 9, e110130. [Google Scholar] [CrossRef] [PubMed]
  75. Liebman, M. Rethinking sampling strategies. Med. Mark. Media 1997, 32, 36–43. [Google Scholar]
  76. Liu, Q.; Gupta, S. The impact of direct-to-consumer advertising of prescription drugs on physician visits and drug request: Empirical findings and public policy implications. Int. J. Res. Mark. 2011, 28, 205–217. [Google Scholar] [CrossRef]
  77. Loden, D.J.; Liebman, M. High Compression Marketing Supercharges Drug Revenues. 2000. Available online: https://www.mmm-online.com/mmm-magazine/ (accessed on 21 March 2001).
  78. Lotfi, T.; Morsi, R.Z.; Rajabbik, M.H.; Alkhaled, L.; Kahale, L.; Hala, N.; Brax, H.; Fadiallah, R.; Aki, E.A. Knowledge, beliefs and attitudes of physicians in low and middle-income countries regarding interacting with pharmaceutical companies: A systematic review. BMC Health Serv. Res. 2016, 16, 57. [Google Scholar] [CrossRef] [PubMed]
  79. Lurie, N.; Rich, E.C.; Simpson, D.E.; Meyer, J.; Schiedermayer, D.L.; Goodman, J.L.; McKinney, W.P. Pharmaceutical representatives in academic medical centers. J. Gen. Intern. Med. 1990, 5, 240–243. [Google Scholar] [CrossRef] [PubMed]
  80. MacCallum, R.C.; Widaman, K.; Zhang, S.; Hong, S. Sample size in Factor Analysis. Psychol. Methods 1999, 4, 84–99. [Google Scholar] [CrossRef]
  81. Makowska, M. Interactions between doctors and pharmaceutical sales representatives in a former communist country, the ethical issues. Camb. Q. Healthc. Ethics 2014, 23, 349–355. [Google Scholar] [CrossRef]
  82. Manchanda, P.; Phil, M.; Honka, E. The Effects and Role of Direct-to-Physician Marketing in the Pharmaceutical Industry: An Integrative Review. Yale J. Health Policy Law Ethics 2005, 5, 785–822. [Google Scholar]
  83. Marco, C.A.; Moskop, J.C.; Solomon, R.C.; Geiderman, J.M.; Larkin, G.L. Gifts to Physicians from the Pharmaceutical Industry: An Ethical Analysis. Ann. Emerg. Med. 2006, 48, 513–521. [Google Scholar] [CrossRef] [PubMed]
  84. Markwick, N.; Fill, C. Towards a framework for managing corporate identity. Eur. J. Mark. 1997, 31, 396–410. [Google Scholar] [CrossRef]
  85. Masood, I.; Ibrahim, M.; Hassali, M.; Ahmad, M. Evolution of marketing techniques, Adoption in Pharmaceutical Industry and related issues: A review. J. Clin. Diagn. Res. 2009, 7, 1942–1952. [Google Scholar]
  86. Mehta, P.N. Drug makers and continuing medical education. Indian Pediatr. 2000, 37, 626–630. [Google Scholar]
  87. Mizik, N.; Jacobson, R. Are physicians “easy marks”? Quantifying the effects of detailing and sampling on new prescriptions. Manag. Sci. 2004, 50, 1704–1715. [Google Scholar] [CrossRef]
  88. Montastruc, F.; Moulis, G.; Palmaro, A.; Gardette, V.; Durrieu, G.; Montastruc, J.-L. Interactions between medical residents and drug companies: A national survey after the Mediator® affair. PLoS ONE 2014, 9, e104828. [Google Scholar] [CrossRef] [PubMed]
  89. Mukherji, P. Estimating the effects of direct-to-consumer advertising for prescription medicines: A natural experiment. In Proceedings of the Marketing Science Conference, Rotterdam, NL, USA, 24–26 June 2004. [Google Scholar]
  90. Mulinari, S. Unhealthy marketing of pharmaceutical products: An international public health concern. J. Public Health Policy 2016, 37, 149–159. [Google Scholar] [CrossRef] [PubMed]
  91. Nair, H.S.; Manchanda, P.; Bhatia, T. Asymmetric social interactions in physician prescription behavior: The role of opinion leaders. J. Mark. Res. 2010, 47, 883–895. [Google Scholar] [CrossRef]
  92. Narayanan, S.; Desiraju, R.; Chintagunta, P.K. Return on Investment Implications for Pharmaceutical Promotional Expenditures: The Role of Marketing-Mix Interactions. J. Mark. 2004, 68, 90–105. [Google Scholar] [CrossRef]
  93. Newell, S.J.; Goldsmith, R.E. The development of a scale to measure perceived corporate credibility. J. Bus. Res. 2001, 52, 235–247. [Google Scholar] [CrossRef]
  94. Orlowski, J.P.; Wateska, L. The effects of pharmaceutical firm enticements on physician prescribing patterns. There’s no such thing as a free lunch. Chest 1992, 102, 270–273. [Google Scholar] [CrossRef]
  95. Osinga, E.C.; Leeflang, P.S.; Wieringa, J.E. Early Marketing Matters: A Time-Varying Parameter Approach to Persistence. J. Mark. Res. 2010, 47, 173–185. [Google Scholar] [CrossRef]
  96. Othman, N.; Vitry, A.I.; Roughead, E.E.; Ismail, S.B.; Omar, K. Medicines information provided by pharmaceutical representatives: A comparative study in Australia and Malaysia. BMC Public Health 2010, 10, 743. [Google Scholar] [CrossRef]
  97. Parikh, K.; Fleischman, W.; Agrawal, S. Industry relationships with pediatricians: Findings from the open payments sunshine act. Pediatrics 2016, 137, e20154440. [Google Scholar] [CrossRef]
  98. Peppin, J.F. Pharmaceutical sales representatives and physicians: Ethical considerations of a relationship. J. Med. Philos. 1996, 21, 83–99. [Google Scholar] [CrossRef] [PubMed]
  99. Pinto, C.A.S.O.; Green, D.; Baby, A.R.; Ruas, G.W.; Kaneko, T.M.; Marana, S.R.; Velasco, M.V.R. Determination of papain activity in topical dosage forms: Single laboratory validation assay. Lat. Am. J. Pharm. 2007, 26, 771–775. [Google Scholar]
  100. Pirisi, A. Patient-direct drug advertising puts pressure on US doctors. Lancet 1999, 354, 1887. [Google Scholar] [CrossRef]
  101. Rahman, M.H.; Agarwal, S.; Tuddenham, S.; Peto, H.; Iqbal, M.; Bhuiya, A.; Peters, D.H. What do they do? Interactions between village doctors and medical representatives in Chakaria, Bangladesh. Int. Health 2015, 7, 266–271. [Google Scholar] [CrossRef] [PubMed]
  102. Relman, A.S. Separating continuing medical education from pharmaceutical marketing. JAMA 2001, 285, 2009–2012. [Google Scholar] [CrossRef]
  103. Rizzo, J. Advertising and competition in the ethical pharmaceutical industry: The case of antihypertensive drugs. J. Law Econ. 1999, 42, 89–116. [Google Scholar] [CrossRef]
  104. Rogers, E. Diffusion of Innovations; Free Press: New York, NY, USA, 1995. [Google Scholar]
  105. Rutherford, G.S.W.; Hair, J.F.; Anderson, R.E.; Tatham, R.L. Multivariate data analysis. Statistician 1988, 37, 484. [Google Scholar] [CrossRef]
  106. Saito, S.; Mukohara, K.; Bito, S. Japanese practicing physicians’ relationships with pharmaceutical representatives: A national survey. PLoS ONE 2010, 5, e12193. [Google Scholar] [CrossRef]
  107. Scheffer, M.C. Interaction between pharmaceutical companies and physicians who prescribe antiretroviral drugs for treating AIDS. Sao Paulo Med. J. 2014, 132, 55–60. [Google Scholar] [CrossRef] [Green Version]
  108. Schwartzman, D. Innovation in the Pharmaceutical Industry; Johns Hopkins University Press: Baltimore, MD, USA, 1976. [Google Scholar]
  109. Shalowitz, D.I.; Spillman, M.A.; Morgan, M.A. Interactions with industry under the Sunshine Act: An example from gynecologic oncology. Am. J. Obstet. Gynecol. 2016, 214, 703–707. [Google Scholar] [CrossRef]
  110. Siddiqui, U.T.; Shakoor, A.; Kiani, S.; Ali, F.; Sharif, M.; Kumar, A.; Raza, Q.; Khan, N.; Alamzaib, S.M.; Farid-ul-Husnain, S. Attitudes of medical students towards incentives offered by pharmaceutical companies—Perspective from a developing nation—A cross-sectional study. BMC Med. Ethics 2014, 15, 36. [Google Scholar] [CrossRef] [PubMed]
  111. Smith, A.D. Corporate Social Responsibility Practices in the Pharmaceutical Industry. Bus. Strategy Ser. 2008, 9, 306–315. [Google Scholar] [CrossRef]
  112. Spingarn, R.W.; Berlin, J.A.; Strom, B.L. When pharmaceutical manufacturers’ employees present grand rounds, what do residents remember? Acad. Med. 1996, 71, 86–88. [Google Scholar] [CrossRef] [PubMed]
  113. Stafford, R.S.; Furberg, C.D.; Finkelstein, S.N.; Cockburn, I.M.; Alehegn, T. Impact of clinical trial results on national trends in alpha-blocker prescribing, 1996–2002. JAMA 2004, 291, 54–62. [Google Scholar] [CrossRef] [PubMed]
  114. Stros, M.; Hari, J.; Marriott, J. The Relevance of Marketing Activities in The Swiss Prescribing Drugs Market: Two Empirical Studies. Int. J. Pharm. Healthc. Mark. 2009, 3, 323–346. [Google Scholar] [CrossRef]
  115. Taneja, G. Influence of Promotional Tools Offered by Pharmaceutical Industry on Physicians Prescribing Behavior. 2007. Available online: https://ssrn.com/abstract=2049747 (accessed on 22 September 2010).
  116. Van den Bosch, C.; de Jong, M. How corporate visual identity supports reputation. Corp. Commun. Int. J. 2005, 10, 108–116. [Google Scholar] [CrossRef]
  117. Van den Bulte, C.; Lilien, G.L. Medical Innovation Revisited: Social Contagion versus Marketing Effort. Am. J. Sociol. 2001, 106, 1409–1435. [Google Scholar] [CrossRef] [Green Version]
  118. Vicciardo, L.J. The secret weapon in marketing intelligence: Meetings and events analysis is a powerful new tool in researching marketing strategy and success. Med. Mark. Media 1995, 30, 32–36. [Google Scholar]
  119. Watkins, C.; Moore, L.; Harvey, I.; Carthy, P.; Robinson, E.; Brawn, R. Attitudes and Behavior of General Practitioners and Their Prescribing Costs: A National Cross Sectional Survey. Qual. Saf. Health Care 2003, 12, 29–34. [Google Scholar] [CrossRef]
  120. Wazana, A. Doctors and the Pharmaceutical Industry Is A Gift Ever Just A Gift? J. Am. Med. Assoc. 2000, 283, 373–380. [Google Scholar] [CrossRef]
  121. Wilkes, M.S.; Doblin, B.H.; Shapiro, M.F. Pharmaceutical advertisements in leading medical journals: Experts’ assessments. Ann. Intern. Med. 1992, 116, 912–919. [Google Scholar] [CrossRef] [PubMed]
  122. Windmeijer, F.; De Laat, E.; Douven, R.; Mot, E. Pharmaceutical promotion and GP prescription behaviour. Health Econ. 2005, 15, 5–18. [Google Scholar] [CrossRef] [PubMed]
  123. Worcester, R. Corporate Image. In Consumer Market Research Handbook; Worcester, R., Downham, J., Eds.; McGraw Hill: London, UK, 1986; pp. 601–606. [Google Scholar]
  124. Yeh, J.S.; Austad, K.E.; Franklin, J.M.; Chimonas, S.; Campbell, E.G.; Avorn, J.; Kesselheim, A.S. Association of medical students’ reports of interactions with the pharmaceutical and medical device industries and medical school policies and characteristics: A cross-sectional study. PLoS Med. 2014, 11, e1001743. [Google Scholar] [CrossRef]
  125. Yeh, J.S.; Franklin, J.M.; Avorn, J.; Landon, J.; Kesselheim, A.S. Association of Industry Payments to Physicians With the Prescribing of Brand name Statins in Massachusetts. JAMA Intern. Med. 2016, 176, 763–768. [Google Scholar] [CrossRef] [PubMed]
  126. Ziegler, M.G. The Accuracy of Drug Information from Pharmaceutical Sales Representatives. J. Am. Med. Assoc. 1995, 273, 1296–1298. [Google Scholar] [CrossRef]
Figure 1. Conceptual Model of the Study based on previous literature.
Symmetry 10 00721 g001
Figure 2. The visualizing conditional effect of moderators. Source: Authors’ estimation.
Symmetry 10 00721 g002
Table 1. Profile of Respondents.
DemographicsFrequencyPercent
Male42857.8%
Female31242.2%
Marital StatusSingle29539.9%
Married42657.6%
Divorced192.6%
Age (In Years)20–3026635.9%
30–4016422.2%
40–509613.0%
50–6012416.8%
More than 609012.2%
EducationGraduation32644.1%
Post-Graduation (Local)22730.7%
Post Graduation (Foreign)12316.6%
PhD degree648.6%
Experience (In Years)1–520127.2%
5–1021829.5%
10–159913.4%
15–2010313.9%
More than 2011916.1%
Income (In PKR 000)30–6012116.4%
60–9033244.9%
90–12015420.8%
120–1508010.8%
More than 150537.2%
Total–N740
Source: Authors’ estimation.
Table 2. Descriptive Statistics.
StatisticsPPBMLJSACMREPMTPOBDTCACIMCRP
NValid740740740740740740740740740
Missing000000000
Mean3.80273.97573.93113.96623.93243.87974.02703.93114.0608
Std. Deviation1.08321.12271.10081.11821.10141.07260.95171.01371.0249
Skewness−0.928−1.010−0.986−1.004−0.987−0.973−1.083−0.940−1.105
Std. Error of Skewness0.0900.0900.0900.0900.0900.0900.0900.0900.090
Kurtosis0.3590.3760.4500.3890.4470.5751.4720.6640.923
Std. Error of Kurtosis0.1790.1790.1790.1790.1790.1790.1790.1790.179
PPB = Physicians’ prescription behavior; MLJ = Medical literature & Journal advertising; SAC = Scientific activities; MRE = Medical representatives’ effectiveness; PMT = Promotional material; POB = Personal obligations; DTC = Direct-to-consumer advertising; CIM = Corporate image; CRP = Customer relationship. Source: Authors’ estimation.
Table 3. Reliabilities and Average Variance Extracted.
FactorsItemsFLCACRAVE
Physicians’ prescription behaviourPPB10.8040.8370.8760.702
PPB20.897
PPB30.81
Medical literature & Journal advertisingMLJ10.9240.8700.9280.766
MLJ20.88
MLJ30.959
MLJ40.718
Scientific activitiesSAC10.8070.8840.9360.786
SAC20.92
SAC30.822
SAC40.986
Medical representative effectivenessMRE10.8540.8420.8800.709
MRE20.835
MRE30.838
Promotional materialPMT10.7800.8240.8640.680
PMT20.884
PMT30.807
Personal obligationsPOB10.8310.8260.8670.684
POB20.872
POB30.776
Direct-to-consumer-advertising (DTCA)DTC10.8450.8380.8770.703
DTC20.874
DTC30.795
Corporate ImageCIM10.7660.8430.8820.714
CIM20.841
CIM30.921
Customer RelationshipCRP10.7680.8270.8680.687
CRP20.819
CRP30.894
PPB = Physicians’ prescription behavior; MLJ = Medical literature & Journal advertising; SAC = Scientific activities; MRE = Medical representatives’ effectiveness; PMT = Promotional material; POB = Personal obligations; DTC = Direct-to-consumer advertising; CIM = Corporate image; CRP = Customer relationship; Source: Authors’ estimation.
Table 4. Rotated Component Matrix a.
FactorsItemsFactor Loadings of Components
PPBMLJSACMREPMTPOBDTCCIMCRP
Physicians’ prescription behaviorPPB10.804
PPB20.897
PPB30.81
Medical literature & Journal advertisingMLJ1 0.924
MLJ2 0.88
MLJ3 0.959
MLJ4 0.718
Scientific activitiesSAC1 0.807
SAC2 0.92
SAC3 0.822
SAC4 0.986
Medical representatives’ effectivenessMRE1 0.854
MRE2 0.835
MRE3 0.838
Promotional materialPMT1 0.780
PMT2 0.884
PMT3 0.807
Personal obligationsPOB1 0.831
POB2 0.872
POB3 0.776
Direct-to-consumer advertising (DTCA)DTC1 0.845
DTC2 0.874
DTC3 0.795
Corporate ImageCIM1 0.766
CIM2 0.841
CIM3 0.921
Customer RelationshipCRP1 0.768
CRP2 0.819
CRP3 0.894
Extraction Method: Principal Component Analysis. Rotation Method: Varimax with Kaiser Normalization. a Rotation converged in 6 iterations. PPB = Physicians’ prescription behavior; MLJ = Medical literature & Journal advertising; SAC = Scientific activities; MRE = Medical representatives’ effectiveness; PMT = Promotional material; POB = Personal obligations; DTC = Direct-to-consumer advertising; CIM = Corporate image; CRP = Customer relationship. Source: Authors’ estimation.
Table 5. KMO and Bartlett’s Test.
Kaiser-Meyer-Olkin Measure of Sampling Adequacy.0.772
Bartlett’s Test of SphericityApprox. Chi-Square24,266.468
Df703
Sig.0.000
Source: Authors’ estimation.
Table 6. Total Variance Explained.
FactorsInitial EigenvaluesExtraction Sums of Squared LoadingsRotation Sums of Squared Loadings
Total% of VarianceCumulative %Total% of VarianceCumulative %Total% of VarianceCumulative %
16.74817.75917.7596.74817.75917.7596.57717.30917.309
23.7269.80627.5653.7269.80627.5652.6386.94224.251
32.9657.80435.3682.9657.80435.3682.6366.93831.189
42.7087.12742.4952.7087.12742.4952.6296.91938.108
52.6246.90649.4012.6246.90649.4012.6256.90945.017
62.5646.74956.1502.5646.74956.1502.6116.87251.889
72.4256.38362.5332.4256.38362.5332.6016.84558.734
82.2936.03468.5672.2936.03468.5672.5706.76265.496
92.0935.50874.0752.0935.50874.0752.5176.62572.120
Extraction Method: Principal Component Analysis. Source: Authors’ estimation.
Table 7. Anti-image Matrices.
FactorsPPBMLJSACMREPMTPOBDTCACIMCRP
Anti-image CorrelationPPB0.909 a−0.093−0.245−0.078−0.561−0.0560.084−0.015−0.044
MLJ−0.0930.946 a0.039−0.276−0.070−0.2720.078−0.1820.034
SAC−0.2450.0390.877 a−0.684−0.109−0.135−0.055−0.0430.049
MLJ effectiveness−0.078−0.276−0.6840.870 a0.095−0.058−0.0240.128−0.080
PMT−0.561−0.070−0.1090.0950.890 a−0.356−0.0970.0560.037
POB obligations−0.056−0.272−0.135−0.058−0.3560.944 a0.036−0.0290.021
DTCA0.0840.078−0.055−0.024−0.0970.0360.706 a−0.394−0.662
CIM−0.015−0.182−0.0430.1280.056−0.029−0.3940.826 a−0.259
CRP−0.0440.0340.049−0.0800.0370.021−0.662−0.2590.732 a
a Measures of Sampling Adequacy (MSA). PPB = Physicians’ prescription behavior; MLJ = Medical literature & Journal advertising; SAC = Scientific activities; MRE = Medical representatives’ effectiveness; PMT = Promotional material; POB = Personal obligations; DTC = Direct-to-consumer advertising; CIM = Corporate image; CRP = Customer relationship. Source: Authors’ estimation.
Table 8. Models Fit Statistics.
Goodness of Fit MeasuresAbsolute Fit IndicesRelative Fit IndicesNon-Centrality-Based IndicesParsimonious Fit Indices
χ2/dfProbabilityGFINFIIFITLICFIRMSEARNIPCFIPNFI
Measurement Model3.110.00430.960.910.970.960.970.0030.960.840.86
Structural Model3.250.00480.970.930.990.980.990.0040.970.870.88
Criterion
(Threshold values)
<5.0<0.05>0.95>0.90>0.95>0.95>0.95<0.05>0.95>0.75>0.75
Note: TLI = Tucker-Lewis Index; χ2/d = Relative Chi square; GFI = Goodness of Fit Index; RMSEA = Root mean squared error of approximation; CFI = Comparative fit index; NFI = Normed fixed index; IFI = Incremental fixed index; RNI = Relative Non-centrality Index; PNFI = Parsimony-adjusted normed fit index; PCFI = Parsimonious-adjusted fit index. Source: Authors’ estimation.
Table 9. Hypothesized Direct Relationship.
HypothesisVariablesRegression PathsStandardized Regression Weights (β)SETPDecision
H1Med Lit & Journal advertisingMLJ † → PPB0.8110.01554.090.000Supported
H2Scientific activitiesSAC † → PPB0.8970.01274.550.000Supported
H3Medical Rep effectivenessMRE † → PPB0.8530.01364.370.000Supported
H4Promotional materialPMT † → PPB0.9150.01181.460.000Supported
H5Personal obligationsPOB † → PPB0.8880.01363.970.000Supported
H6Direct-to-consumer advertisingDTC † → PPB0.7910.01444.110.000Supported
Note: † = Predictor; DV = PPB = Physicians’ prescription behavior; MLJ = Medical literature & Journal advertising; SAC = Scientific activities; MRE = Medical representatives’ effectiveness; PMT = Promotional material; POB = Personal obligations; DTC = Direct-to-consumer advertising; CIM = Corporate image; CRP = Customer relationship. Source: Authors’ estimation.
Table 10. Moderating Effect of CIM and Customer Relationship (CRP).
HypothesesModeratorsModerationCoefficientSETP *LLCIULCI
Moderating Effect of the CIM and CRP b/w MLJ and PPB
H7A:CIMMLJ × CIM−0.03430.0122−2.830.0049−0.0582−0.0105
H8A:CRPMLJ × CRP−0.02080.0120−1.740.0831−0.04430.0027
Moderating Effect of the CIM and CRP b/w SAC and PPB
H7BCIMSAC ×CIM−0.02630.0089−2.940.0034−0.0439−0.0087
H8BCRPSAC × CRP−0.03430.0090−3.800.0002−0.0521−0.0166
Moderating Effect of the CIM and CRP b/w MRE and PPB
H7C:CIMMRE × CIM−0.02010.0104−1.930.0540−0.04050.0003
H8C:CRPMRE × CRP−0.03490.0103−3.400.0007−0.0551−0.0147
Moderating Effect of the CIM and CRP b/w PMT and PPB
H7D:CIMPMT × CIM−0.01310.0090−1.450.1476−0.03080.0046
H8D:CRPPMT × CRP−0.01430.0089−1.600.1090−0.03190.0032
Moderating Effect of the CIM and CRP b/w POB and PB
H7E:CIMPOB × CIM−0.02240.0112−1.990.0469−0.0444−0.0003
H8E:CRPPOB × CRP−0.01360.0108−1.250.2116−0.03480.0077
Moderating Effect of the CIM and CRP b/w DTC and PPB
H7F:CIMDTC × CIM−0.05520.0157−3.520.0005−0.0859−0.0244
H8F:CRPDTC × CRP−0.00290.0376−0.760.9392−0.07660.0709
Note: ‘x’ is known as the multiplicative sign; * denotes rejection of the hypotheses at 0.05 level (p < 0.05); DV = PPB = Physicians’ prescription behavior; MLJ = Medical literature & Journal advertising; SA = Scientific activities; MRE = Medical representatives’ effectiveness; PMT = Promotional material; POB = Personal obligations; DTC = Direct-to-consumer advertising; CIM = Corporate image; CRP = Customer relationship. Source: Authors’ estimation.
Table 11. Increment In R-Square.
ModerationR2-ChangedFdf1df2P *
MLJ × CIM0.00187.981017360.0049
MLJ × CRP0.00063.011317360.0831
SAC × CIM0.00108.649017360.0034
SAC × CRP0.001714.427217360.0002
MRE × CIM0.00063.723317360.0540
MRE × CRP0.001811.531217360.0007
PMT × CIM0.00022.101617360.1476
PMT × CRP0.00032.575517360.1090
POB × CIM0.00073.963717360.0469
POB × CRP0.00031.563517360.2116
DTC × CIM0.004212.401917360.0005
DTC × CRP0.00000.005817360.9392
Note: ‘x’ is known as the multiplicative sign; * denotes rejection of the hypothesis at 0.05 level (p < 0.05). Source: Authors’ estimation.
Table 12. Conditional Effects.
Conditional effect of MLJ on PPB on different values of the CIM
CIMEffectSETP *LLCIULCI
2.91730.83980.018445.550.00000.80360.8760
3.93110.80500.015751.220.00000.77420.8359
4.94480.77020.021436.000.00000.72820.8122
Conditional effect of MLJ on PPB on different values of the CRP
CRPEffectSETP *LLCIULCI
3.03590.82230.017148.210.00000.78880.8558
4.06080.80100.015551.690.00000.77060.8314
5.00000.78150.021436.520.00000.73950.8235
Conditional effect of SAC on PPB on different values of the CIM
CIMEffectSETP *LLCIULCI
2.91730.91950.013369.070.00000.89340.9456
3.93110.89280.012670.720.00000.86810.9176
4.94480.86620.017549.530.00000.83190.9005
Conditional effect of SAC on PPB on different values of the CRP
CRPEffectSETP *LLCIULCI
3.03590.92790.013170.660.00000.90210.9537
4.06080.89270.012571.310.00000.86810.9173
5.00000.86050.017150.280.00000.82690.8941
Conditional effect of MRE on PPB on different values of the CIM
CIMEffectSETP *LLCIULCI
2.91730.86770.015257.210.00000.83790.8975
3.93110.84740.013861.230.00000.82020.8745
4.94480.82700.019442.670.00000.78900.8650
Conditional effect of MRE on PPB on different values of the CRP
CRPEffectSETP *LLCIULCI
3.03590.88530.015357.810.00000.85520.9154
4.06080.84950.013762.220.00000.82270.8763
5.00000.81680.018444.490.00000.78070.8528
Conditional effect of PMT on PPB on different values of the CIM
CIMEffectSETP *LLCIULCI
2.91730.92590.012772.650.00000.90090.9509
3.93110.91260.011778.180.00000.88970.9356
4.94480.89940.016753.950.00000.86660.9321
Conditional effect of PMT on PPB on different values of the CRP
CRPEffectSETP *LLCIULCI
3.03590.92710.012673.530.00000.90230.9518
4.06080.91240.011678.500.00000.88960.9352
5.00000.89890.016155.700.00000.86720.9306
Conditional effect of POB on PPB on different values of the CIM
CIMEffectSETP *LLCIULCI
2.91730.90650.015458.830.00000.87630.9368
3.93110.88390.014859.860.00000.85490.9129
4.94480.86120.021440.260.00000.81920.9032
Conditional effect of POB on PPB on different values of the CRP
CRPEffectSETP *LLCIULCI
3.03590.89850.015060.050.00000.86920.9279
4.06080.88460.014760.330.00000.85580.9134
5.00000.87190.020642.360.00000.83150.9123
Conditional effect of DTC on PPB on different values of the CIM
CIMEffectSETP *LLCIULCI
2.91730.86520.024834.830.00000.81640.9140
3.93110.80540.019641.140.00000.76690.8438
4.94480.74550.027027.650.00000.69260.7984
Conditional effect of DTC on PPB on different values of the CRP
CRPEffectSETP *LLCIULCI
3.03590.13140.09751.350.1784−0.06010.3228
4.06080.12840.09291.380.1674−0.05400.3109
5.00000.12570.10221.230.2189−0.07480.3263
* denotes rejection of the hypotheses at 0.05 level (p < 0.05); Quantitative values for moderators are mean and ±1 SD from the mean; Level of confidence for all confidence intervals in output: 95.00. Source: Authors’ estimation.

