Article

A Computational Study of a Spatiotemporal Mean Field Model Capturing the Emergence of Alpha and Gamma Rhythmic Activity in the Neocortex

School of Aerospace Engineering, Georgia Institute of Technology, Atlanta, GA 30332-0150, USA
Symmetry 2018, 10(11), 568; https://doi.org/10.3390/sym10110568
Submission received: 17 September 2018 / Revised: 20 October 2018 / Accepted: 24 October 2018 / Published: 1 November 2018

Abstract

:
In this paper, we analyze the spatiotemporal mean field model developed by Liley et al. in order to advance our understanding of the wide effects of pharmacological agents and anesthetics. Specifically, we use the spatiotemporal mean field model for capturing the electrical activity in the neocortex to computationally study the emergence of α - and γ -band rhythmic activity in the brain. We show that α oscillations in the solutions of the model appear globally across the neocortex, whereas γ oscillations can emerge locally as a result of a bifurcation in the dynamics of the model. We solve the dynamic equations of the model using a finite element solver package and show that our results verify the predictions made by bifurcation analysis.

1. Introduction

A key open question in neuroscience is how information is represented and transmitted in the brain by a network of neurons. Neurons involve dynamical elements that are excitable, and can generate a pulse or spike whenever the electrochemical potential across the cell membrane of the neuron exceeds a certain threshold. The Hodgkin-Huxley model [1] is the prominent model for characterizing nerve pulse propagation and relies on ion currents through ion channels (resistors) and the lipid membrane (capacitor). This model is a purely electrical model and assumes that proteins alone enable nerve cells to propagate signals due to the ability of various ion channel proteins to transport sodium and potassium ions.
An important application of dynamical systems theory to the neurosciences is to study phenomena of the central nervous system that exhibit nearly discontinuous transitions between macroscopic states. A clinically challenging problem exhibiting this phenomenon is the induction of general anesthesia. For any given patient, this problem involves a very sharp transition from a conscious state to an unconscious state as the anesthetic drug concentration increases; this transition resembles a thermodynamic critical phase transition.
The most plausible explanation for the mechanisms of action of anesthetics lies in the network properties of the brain [2,3]. It is well known that there are two general types of neurons in the central nervous system—excitatory and inhibitory—interconnected via a complex dynamical network. The action potential of a spiking neuron is propagated along the axon to synapses, where chemical neurotransmitters are released and generate a postsynaptic potential on the dendrites of the connected neurons. There exists considerable evidence that anesthetic drugs alter postsynaptic potentials [4,5]. Specifically, Steyn-Ross et al. [6] show how changes in the postsynaptic potential may be applied to the analysis of the induction of anesthesia by viewing general anesthesia as a phase transition.
While the analysis in [6] is enlightening, a dynamical systems theory framework in terms of neuronal firing rates of a large number of interacting neurons or mean field models describing electrical potentials as continuous functions in space and time can provide a theoretical foundation for explaining the underlying neural mechanisms of action for anesthesia and unconsciousness [6,7,8]. Furthermore, using computational analysis the synaptic drive and electrical potential dynamics, generated by excitatory and inhibitory neuron populations, can be used to predict network system changes due to changes in the dynamical system model parameters to understand how the complex neuronal network qualitatively changes with the induction of anesthesia. In that regard, firing rate spiking neuron models used for neocortex modeling must involve sufficient generality that include parameters that can account for key physiological changes at the single neuronal level. The synaptic drive firing model, introduced in [9,10,11,12,13], and the mean field spatially continuous model introduced in [8,14,15,16,17], are key mean field neurocortical models that can be used in computational studies to further understand the anesthetic cascade mechanism.
In [7,13], we used a synaptic drive characterization of the neuronal activity to develop a mechanistic model to andvance our understanding of the effects of anesthetic agents on neuronal firing rates. The idea behind the spatially discrete synaptic drive model developed in [13] was to understand how anesthetic agents at sufficiently high concentrations can cause a decrease in neuronal activity as well as the interruption of the flow of “information” through the brain.
Given that the neocortex contains on the order of 100 billion neurons with up to 100 trillion connections, in [13] we used a mean field assumption to develop a simplified reduced-order model for the neocortex dynamics. Specifically, we assume that within the populations of excitatory and inhibitory neurons, second-order terms that are the product of variances of synaptic connection strengths and variances of synaptic drives (from the mean) can be ignored. Then, we showed that this simplified two-state mean field model exhibits a rich behavior capturing several anesthetic cascade effects. In particular, for a range of the model parameters, the mean excitatory synaptic drive is shown to have an asymptotically stable equilibrium state. In addition, as the time constant of the inhibitory postsynaptic potential is increased—an effect generated by several anesthetic agents on the single neuron—this equilibrium state becomes unstable, giving rise to a stable limit cycle. Further increasing the inhibitory time constant, the limit cycle collapses leading to an asymptotically stable equilibrium state corresponding to a decreased mean excitatory synaptic drive level.
Even though spatially discrete neuronal network models can capture an arbitrary level of cellular, synaptic, and topological detail of neuronal dynamics, they generally do not relate the resulting dynamics to clinically measurable macroscopic effects (i.e., electroencephalographic activity). To link the well-known microscopic (cellular and subcellular) targets of general anesthesia action with their macroscopic effects, in this paper we analyze the spatially continuous neural population model of [8,14,15,16,17]. Continuum theories describing the spatiotemporal evolution of time-averaged mean firing rates for a subpopulation of excitatory and inhibitory neurons have been shown to account for the observed electroencephalographic (EEG) spectral features of anesthetized patients [8,14,17]. In [18], a rigorous analysis of the well-posedness, existence, uniqueness, nonnegativity, and regularity of solutions, as well as the existence, stability, and nature of attractors of the electrocortical mean field model developed in [14] was addressed. In this paper, we establish the relevance of this spatially continuum mean field model [14] in predicting some of its qualitative characteristics involving the emergence of α - and γ -rhythmic activities in the neocortex to better understand the anesthetic transition. Figure 1 gives a visualization of the theme of our research encompassing [7,13,18] and the present paper.

2. A Continuum Mean Field Model of Electrocortical Activity

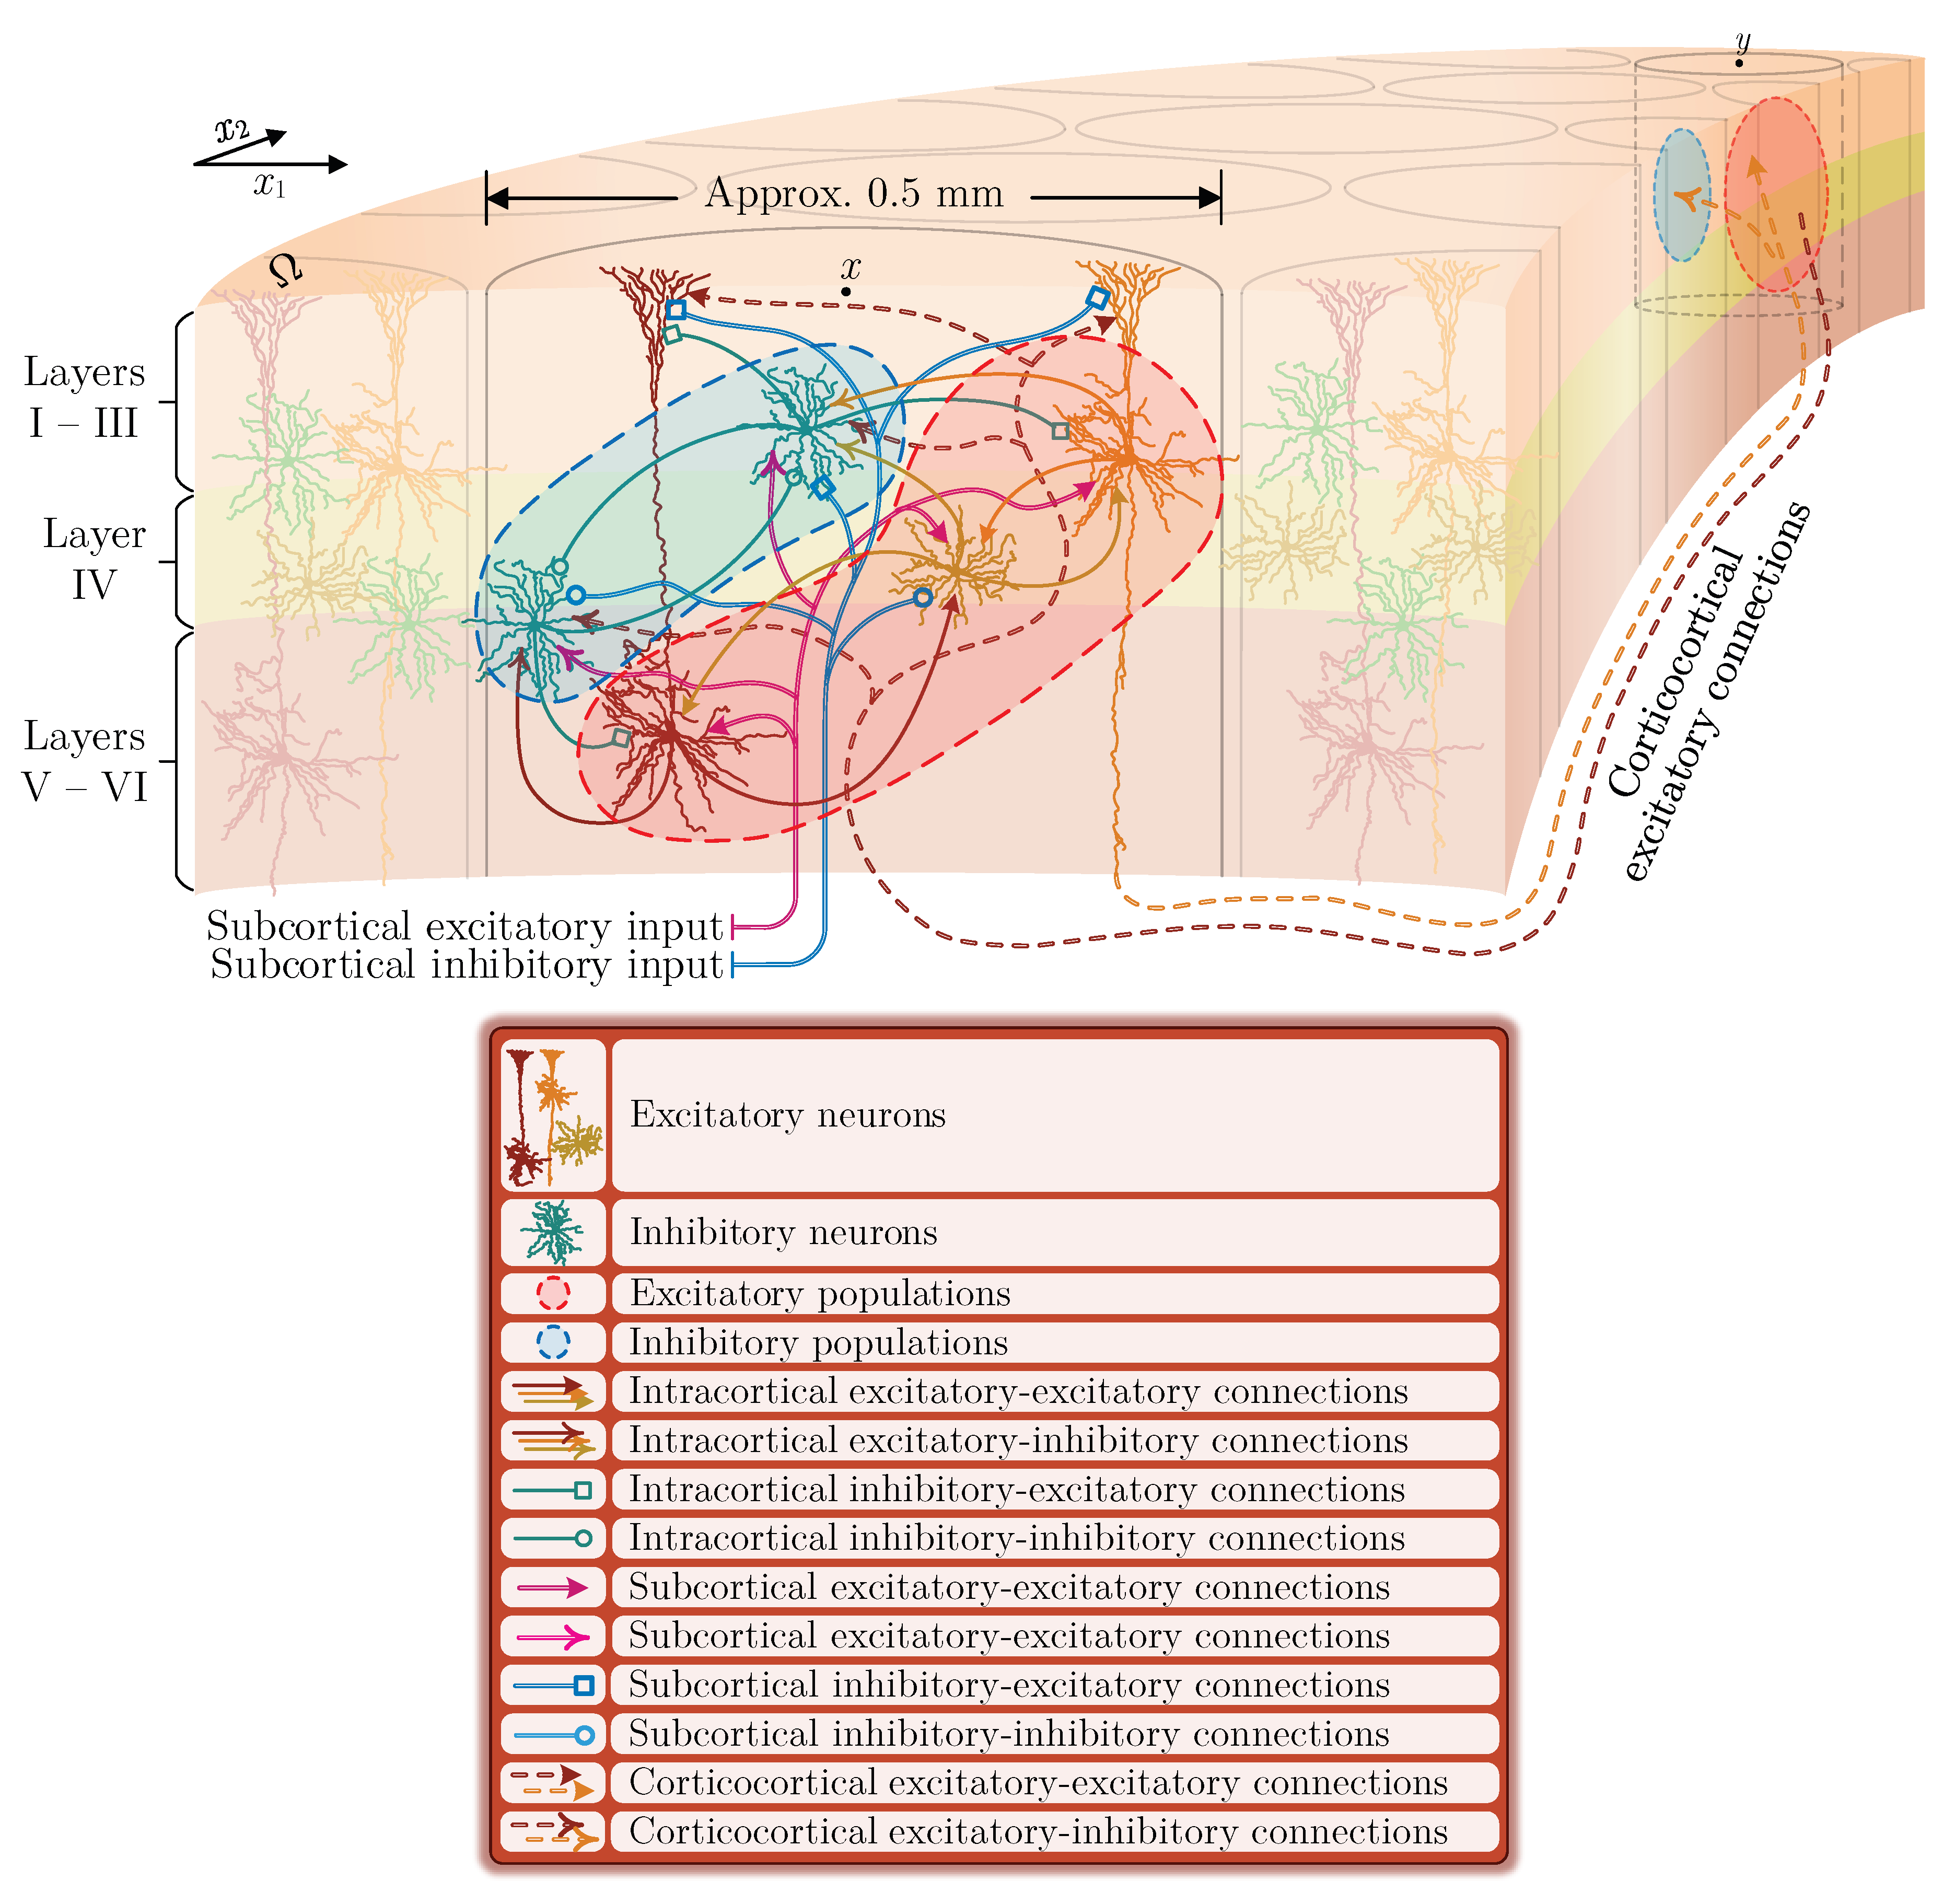
As discussed in [18], the neocortex can be modeled as a layered columnar structure consisting of six distinctive layers. Specifically, the neurons in the neocortex are organized in vertical columns, known as cortical columns or macrocolumns, which are a fraction of a millimeter wide and span all the layers of the neocortex from the white matter to the pial surface [19,20,21]. As noted in the introduction, neurons are mainly classified as excitatory or inhibitory wherein this distinction depends on whether they increase or decrease (i.e., suppress) the firing rate in the coupling neurons they are communicating with. Inhibitory neurons are located in all the cortical column layers and contain axons that remain within the same regions, wherein their cell body resides. Hence, they have a local range of action. Layers III, V, and VI contain pyramidal excitatory neurons that contain axons that can evoke a long range communication (projection) throughout the neocortex. Layer IV contains primarily star shaped excitatory interneurons that receive sensory inputs from the thalamus. Figure 2 shows a schematic of the structure of the neocortex, including the intracortical and corticocortical neuronal connections; see ([19], chapter 15) for further details.
On the local level, within a cortical column, neurons are densely coupled and involve feedforward and feedback intracortical connections. This dense and relatively homogeneous local structure of the neocortex postulates modeling a local population of functionally similar neurons as a single space-averaged neuron. This can preserve enough physiological information in order to capture the temporal patterns detected in spatially smoothed (i.e., averaged) EEG signals without leading to excessive theoretical complexities in the mathematical analysis of the model. On the global level, which exclusively involves excitatory corticocortical communication throughout the neocortex, two major patterns of connectivity are observed. Namely, a homogeneous, symmetrical, and translation invariant pattern of connections, and a heterogeneous, irregular, and asymmetrical distribution of connections. For modeling simplicity, as well as due to the unavailability of detailed anatomical data, the corticocortical connectivity is assumed to be isotropic, homogeneous, symmetric, and translation invariant [14].
To present the spatiotemporal mean field model, here we use the notation that we developed in [18]. Specifically, let Ω = ( 0 , ω ) × ( 0 , ω ) , ω > 0 , be an open rectangle in 2 that defines the domain of the neocortex. Each point x = ( x 1 , x 2 ) Ω denotes the location of a local network—possibly representing a cortical column—modeled by a space-averaged excitatory neuron and a space-averaged inhibitory neuron. Furthermore, let E denote a population of excitatory neurons and I denote a population of inhibitory neurons. For x Ω , t [ 0 , T ] , T > 0 , and X , Y { E , I } , v X ( x , t ) , measured in mV, denotes the spatially mean soma membrane potential of a population of type X centered at x. Moreover, i X Y ( x , t ) , measured in mV, denotes the spatially mean postsynaptic activation of synapses of a population of type X centered at x, onto a population of type Y centered at the same point x. In addition, w E X ( x , t ) , measured in s 1 , denotes the mean rate of corticocortical excitatory input pulses from the entire domain of the neocortex to a population of type X centered at x. Finally, g X Y ( x , t ) , measured in s 1 , denotes the mean rate of subcortical input pulses of type X to a population of type Y centered at x. Note that, by definition, i X Y ( x , t ) , w E X ( x , t ) , and g X Y ( x , t ) are nonnegative quantities.
A spatiotemporal mean field model for electrocortical activity in the neocortex is developed in [14] and involves a system of coupled ordinary differential equations (ODEs) and partial differential equations (PDEs) given by
( τ E t + 1 ) v E ( x , t ) = V E E v E ( x , t ) | V E E | i E E ( x , t ) + V I E v E ( x , t ) | V I E | i I E ( x , t ) ,
( τ I t + 1 ) v I ( x , t ) = V E I v I ( x , t ) | V E I | i E I ( x , t ) + V I I v I ( x , t ) | V I I | i I I ( x , t ) ,
( t + γ E E ) 2 i E E ( x , t ) = e Υ E E γ E E N E E f E v E ( x , t ) + w E E ( x , t ) + g E E ( x , t ) ,
( t + γ E I ) 2 i E I ( x , t ) = e Υ E I γ E I N E I f E v E ( x , t ) + w E I ( x , t ) + g E I ( x , t ) ,
( t + γ I E ) 2 i I E ( x , t ) = e Υ I E γ I E N I E f I v I ( x , t ) + g I E ( x , t ) ,
( t + γ I I ) 2 i I I ( x , t ) = e Υ I I γ I I N I I f I v I ( x , t ) + g I I ( x , t ) ,
( t + ν Λ E E ) 2 3 2 ν 2 Δ w E E ( x , t ) = ν 2 Λ E E 2 M E E f E v E ( x , t ) ,
( t + ν Λ E I ) 2 3 2 ν 2 Δ w E I ( x , t ) = ν 2 Λ E I 2 M E I f E v E ( x , t ) , ( x , t ) Ω × ( 0 , T ] ,
with periodic boundary conditions. Here, e is the Napier constant, t denotes the partial derivative with respect to t, Δ 2 x 1 2 + 2 x 2 2 is the Laplace operator, and f X ( · ) is the mean firing rate function of a population of type X and is given by
f X v X ( x , t ) F X 1 + exp 2 v X ( x , t ) μ X σ X , X { E , I } .
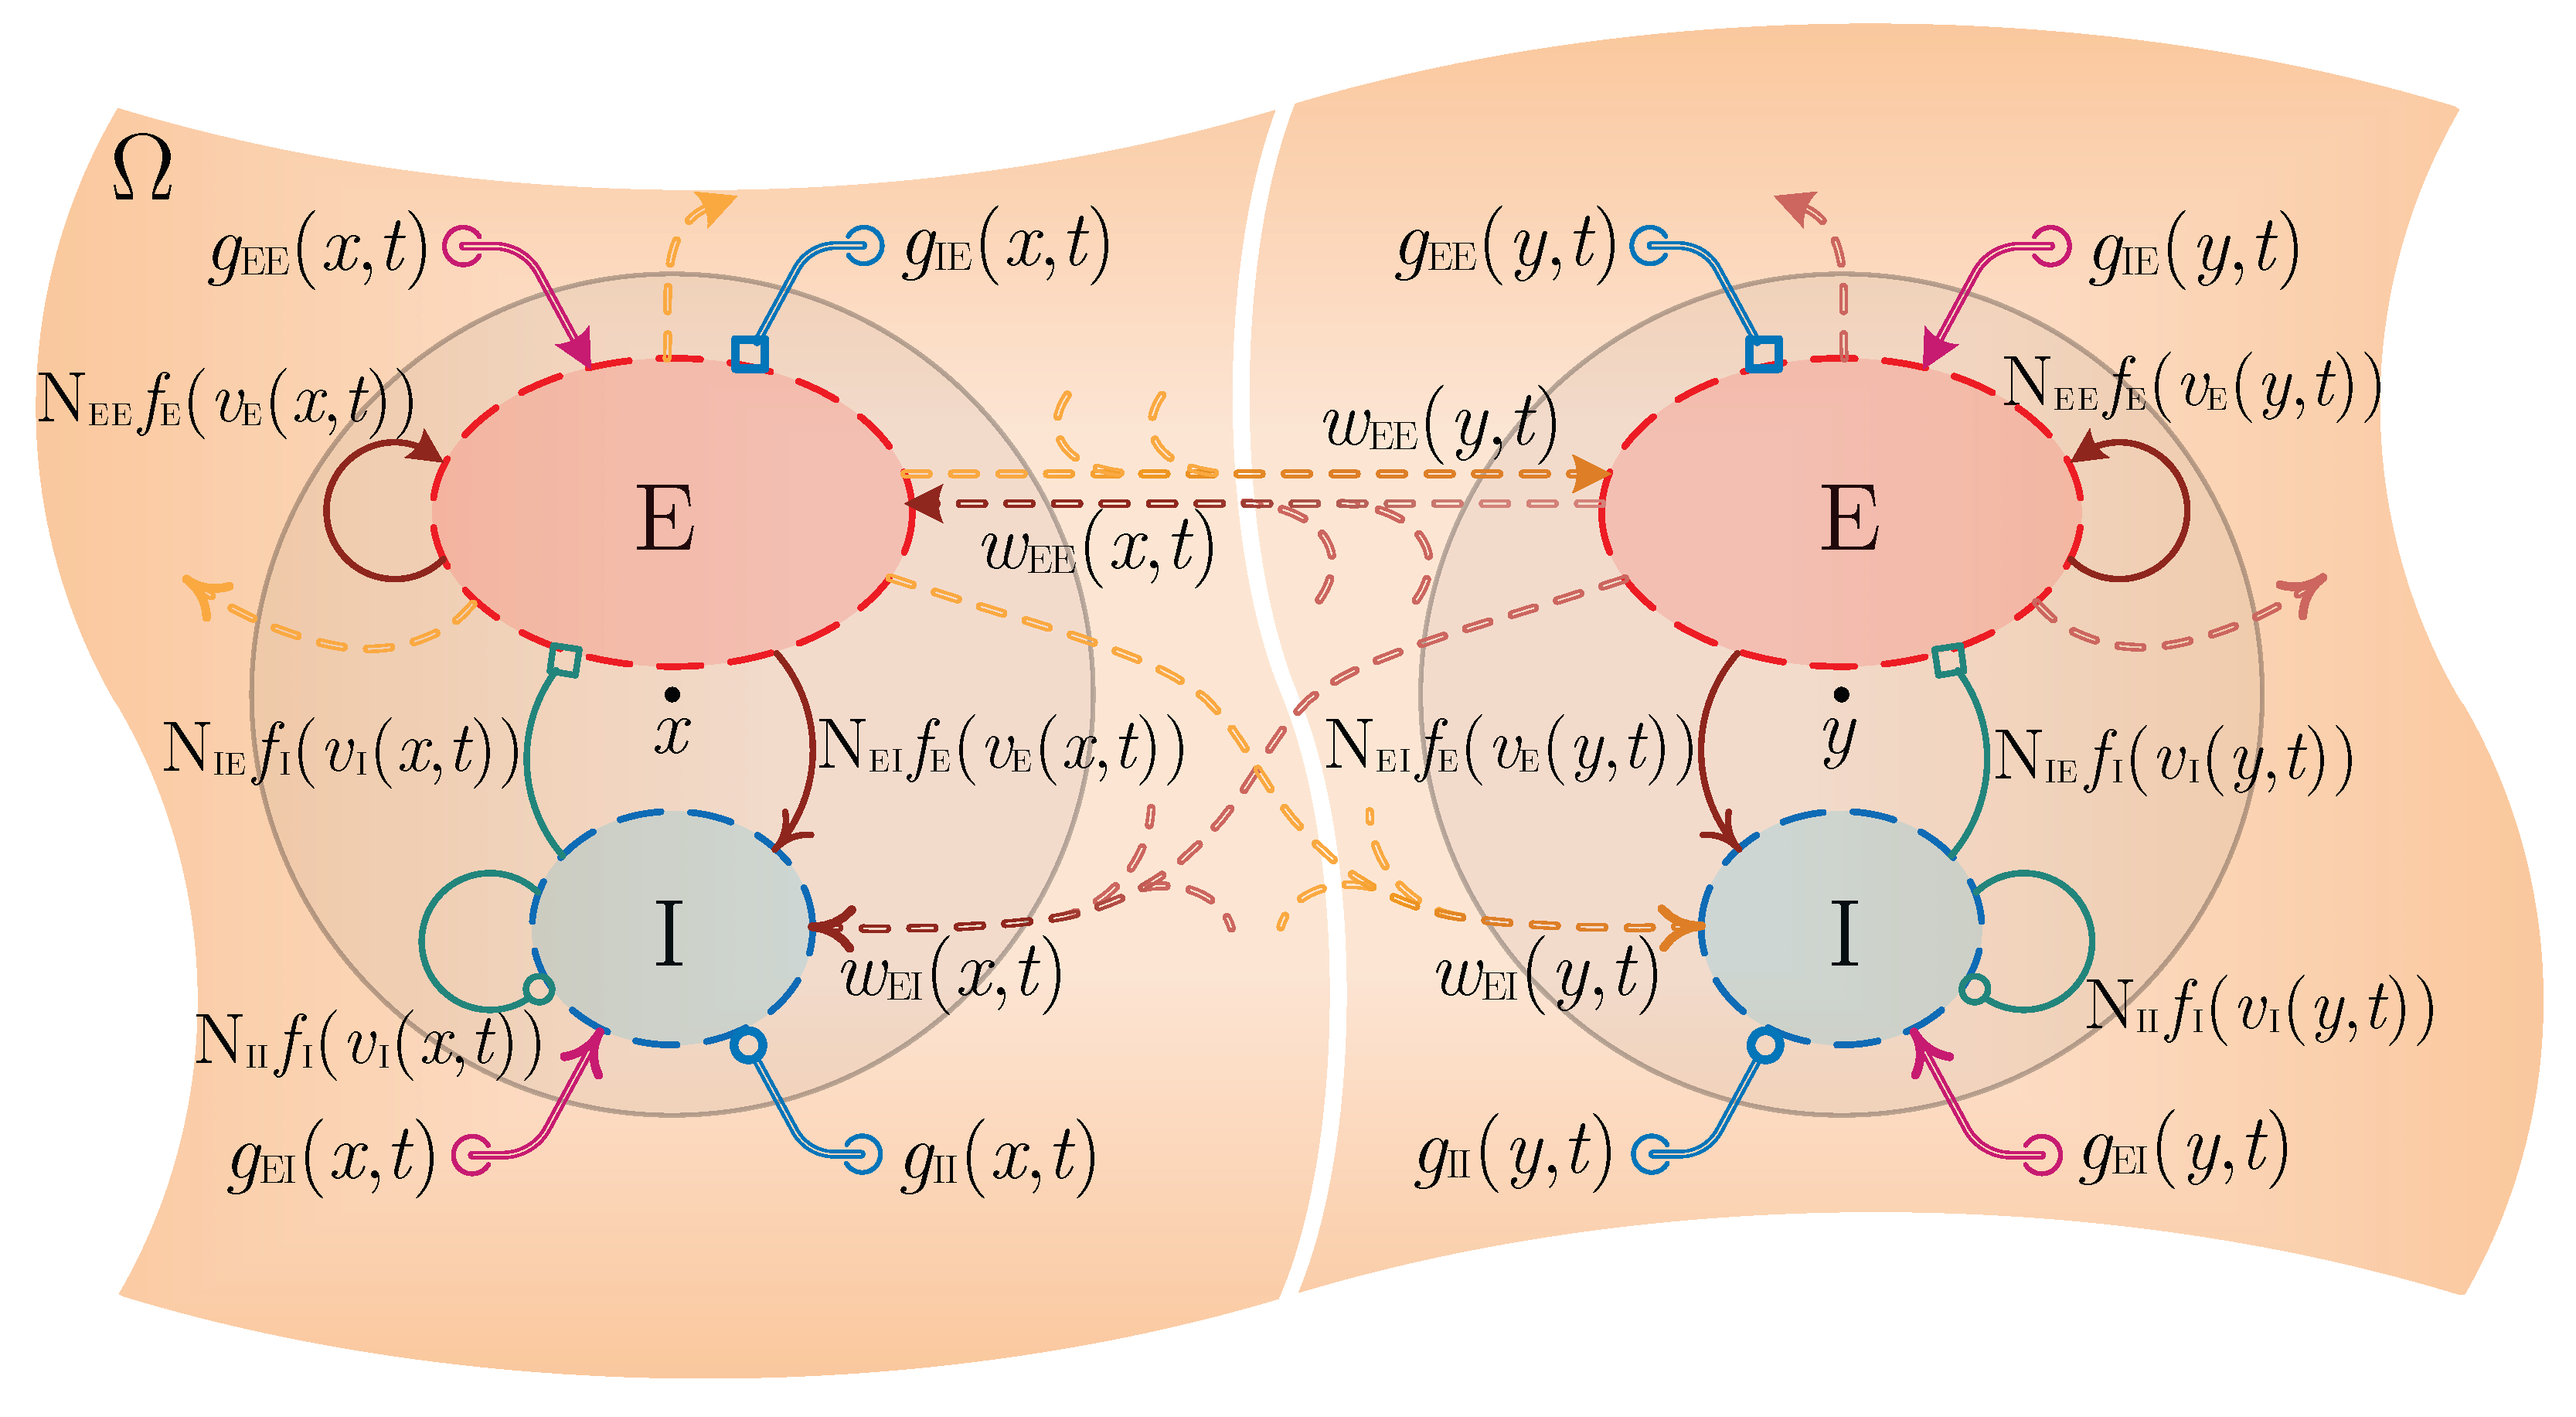
The definition of the biophysical parameters of the model as well as the range of their values is given in Table 1. For the range of values given in Table 1, | V E E | = V E E , | V E I | = V E I , | V I E | = V I E , and | V I I | = V I I . Figure 3 shows a schematic of the intracortical, corticocortical, and subcortical inputs to two local networks located at points x and y in Ω , along with their contribution to the global corticocortical activation as modeled by (1)–(8).
As discussed in [18], (1) and (2) model the dynamics of the resistive-capacitive membrane of the space averaged neurons located at x. In the absence of postsynaptic inputs i X Y ( x , t ) , the mean membrane potential exponentially decays to the resting potential. The fractions appearing in (1) and (2) weigh the postsynaptic inputs to include the effect of transmembrane diffusive ion flows into the model. In particular, the depolarizing effect of excitatory inputs on the membrane is linearly decreased by the weights as the membrane potential rises to the Nernst (reversal) potential. When the membrane potential exceeds the Nernst potential, the effect is reversed and further excitation hyperpolarizes the membrane. The weights associated with the inhibitory postsynaptic inputs have opposite signs at the resting potential, and hence, they have an opposite effect.
The critically damped second-order dynamics in (3)–(6) generate a synaptic α -function—analogous to classical dendritic cable theory—in response to an impulse. As shown in Figure 3, these second-order dynamical systems are driven by three different sources of presynaptic spikes; namely, the inputs N X Y f X ( v X ) generated by local neuronal populations, the excitatory inputs w E X generated by corticocortical fibers, and the inputs g X Y generated by subcortical regions. Hence, (3)–(6) generate the postsynaptic responses modulating the polarization of the cell membranes through (1) and (2).
Unlike conduction through short range intracortical fibers, conduction through long range corticocortical fibers is not instantaneous. To account for this delay, (7) and (8) form a system of telegraph equations that effectively model the propagation of the excitatory axonal pulses through corticocortical fibers. These equations are derived by assuming that the strength of corticocortical connections onto a local population exponentially decays with distance and with a characteristic scale of Λ E X [14]. In addition, it is assumed that the spatial connectivity distribution is isotropic and homogeneous over the neocortex. The key variable in the model given by (1)–(8) is the mean membrane potential of excitatory populations v E ( x , t ) and is assumed to be linearly proportional to the EEG recordings from the scalp [14,22]. For further details of the model see [14,22,23,24].
This model has several advantages over the model proposed in [7,13] in developing a macroscopic analysis of the cortical activity in the brain [18]. Specifically, the neurophysiological basis of this model has been fairly well established [14] and the definitions as well as the ranges of the values of the parameters appearing in the model are given in [14]. Furthermore, the model is derived using the well-established columnar topology of the neocortex [14,19]. In addition, the mean membrane potential directly appears in the model, which facilitates prediction and understanding of the dynamics associated with the EEG signals available from experimental data on the brain [25,26,27]. Finally, the model is a spatiotemporal model, and hence, can be used to study dynamic EEG pattern formations in the cortex.
Preliminary numerical investigations of the proposed model have revealed that it can predict the key macroscopic electrocortical activities of the cortex. Recent patient data [28] reveal that the anesthetic propofol gives rise to a frontal α -rhythm in the EEG at drug levels sufficient to induce loss of consciousness, which shows that the proposed continuum model can capture the electrorythmogenesis in the EEG of an anesthetized patient. The model shows that a synchronized γ activity emerges in the excitatory membrane potential when the amplitude of the inhibitory post synaptic potential is gradually decreased [17]; also an experimentally verified effect [28]. Furthermore, this model has been used to model the anesthetic cascade in the cortex [6], as well as investigate the effects of anesthesia on EEG signals [8].
Moreover, it is the only model that has numerically demonstrated the drug biphasic response [6,29] wherein the administration of increasing anesthetic dose can lead to a paradoxical state of excitement prior to decreases in the level of consciousness (see Figure 4). Specifically, the model predicts the phase transition and burst suppression in cortical neurons during general anesthesia [6,22,23]. Furthermore, the model predicts the effect of anesthetic drugs on the EEG [30,31] as well as the generation of epileptic seizures [32,33,34]. In [35], the authors have used open source computational tools to analyze the underlying PDEs of the model and solve for the model equilibria and time periodic solutions. A rigorous analysis of the existence, uniqueness, nonnegativity, and regularity of solutions, as well as the existence, stability, and nature of absorbing sets and attractors of the model is presented in [18].
In the remainder of the paper, we use appropriate finite element-based software to analyze the spatiotemporal behavior of this model. The attractor(s) of the model can be characterized to identify periodic, pseudo-periodic, chaotic, and stationary solutions. Establishing the existence or nonexistence of periodic solutions can clarify all the underlying mechanisms of the α - and γ -band rhythms observed in the electrocortical activity and whether they are stochastic or deterministic oscillations.
The rhythmic patterns of variations in the electroencephalographic recordings from the scalp (EEG), or the electrocorticographic (ECoG) recordings from the surface of the neocortex demonstrate a salient feature of mesoscopic electrical activity in the neocortex. These brain rhythms correlate with the numerous states of healthy operation of the brain, and their possible distortion or disruption can be a signature of a certain disease or a transition from a conscious state to an unconscious state. However, the physiological mechanism of generating the brain rhythms is still not well understood.
The rhythmicity in the electrocortical activity is a dynamic phenomenon that can occur, possibly heterogeneously, in a wide area of the neocortex. Hence, a mathematical model of the brain rhythms should capture both spatial and temporal dynamics of the neocortex. Such mesoscopic spatiotemporal models can effectively be developed by constructing approximate models for interconnected populations of neurons in the neocortex using mean field theory. Thus, we use the spatiotemporal mean field model to study the α - and γ -band rhythmic activity in the cortex. As noted above, this model has been widely used in the literature to study brain rhythms, general anesthesia, and epileptic seizures [6,17,22,23,30,32,33,34,36]. Some of the complex behaviors of this model are addressed in [24,37,38,39,40].
In the remainder of the paper, we extend the computational results in [17] and analyze the spatiotemporal model in more detail. Our results show that the model can generate α -band oscillations (8–13 Hz) at the resting state, and γ -band oscillations (30–80 Hz) as a result of a subcritical Hopf bifurcation in its dynamics. We use MatCont [41] to perform the numerical bifurcation analysis, and we solve the equations of the model using COMSOL Multiphysics® (Stockholm, Sweden).

3. Computational Framework

For the computational analysis of the next sections, we consider (1)–(8) with a rectangular domain Ω = ( 0 , 500 ) × ( 0 , 500 ) [mm 2 ] and with the set of parameter values given in Table 2. The space homogeneous equilibrium of the model is
( v E , v I ) Re = ( 12.6326 , 13.319 ) ,
( i E E , i E I , i I E , i I I ) Re = ( 49.0506 , 28.3164 , 11.4371 , 4.1846 ) ,
( w E E , w E I ) Re = ( 2245.7 , 2057.1 ) ,
where the numbers are regarded as constant functions over the domain Ω . We set the time horizon of the numerical computations at T = 500 ms, and use COMSOL Multiphysics® to solve (1)–(8) with periodic boundary conditions and with the initial values and input variables as specified in the following sections.
To draw quantitative observations on the transitions of the computed solutions in time, we extract samples from the solution data at different locations over Ω . To approximately simulate the averaging effect of an EEG probe, we extract solution data over squares of size 10 × 10 [mm 2 ], which we refer to as probes. We then consider the measurement of a probe as the average value of the solution over the square domain of the probe, which gives a scalar-valued signal over the time interval [ 0 , T ] .

4. Alpha Rhythms in the Resting State

To observe α -band oscillations, we consider the resting state with the nominal parameter values as given in Table 2. We drive the model by an input g E E , which varies randomly in space and time about the mean value g ¯ E E given in Table 2. A snapshot of g E E that depicts a sample of its pattern of variations over Ω is shown in Figure 5a. The remaining inputs g E I , g I E , and g I I take on the constant values g ¯ E I , g ¯ I E , and g ¯ I E given in Table 2. Finally, we set the initial values ( v E , v I , i E E , i E I , i I E , i I I , w E E , w E I ) | t = 0 equal to their equilibrium values given by (10)–(12), and the initial values d t ( i E E , i E I , i I E , i I I , w E E , w E I ) | t = 0 equal to zero.
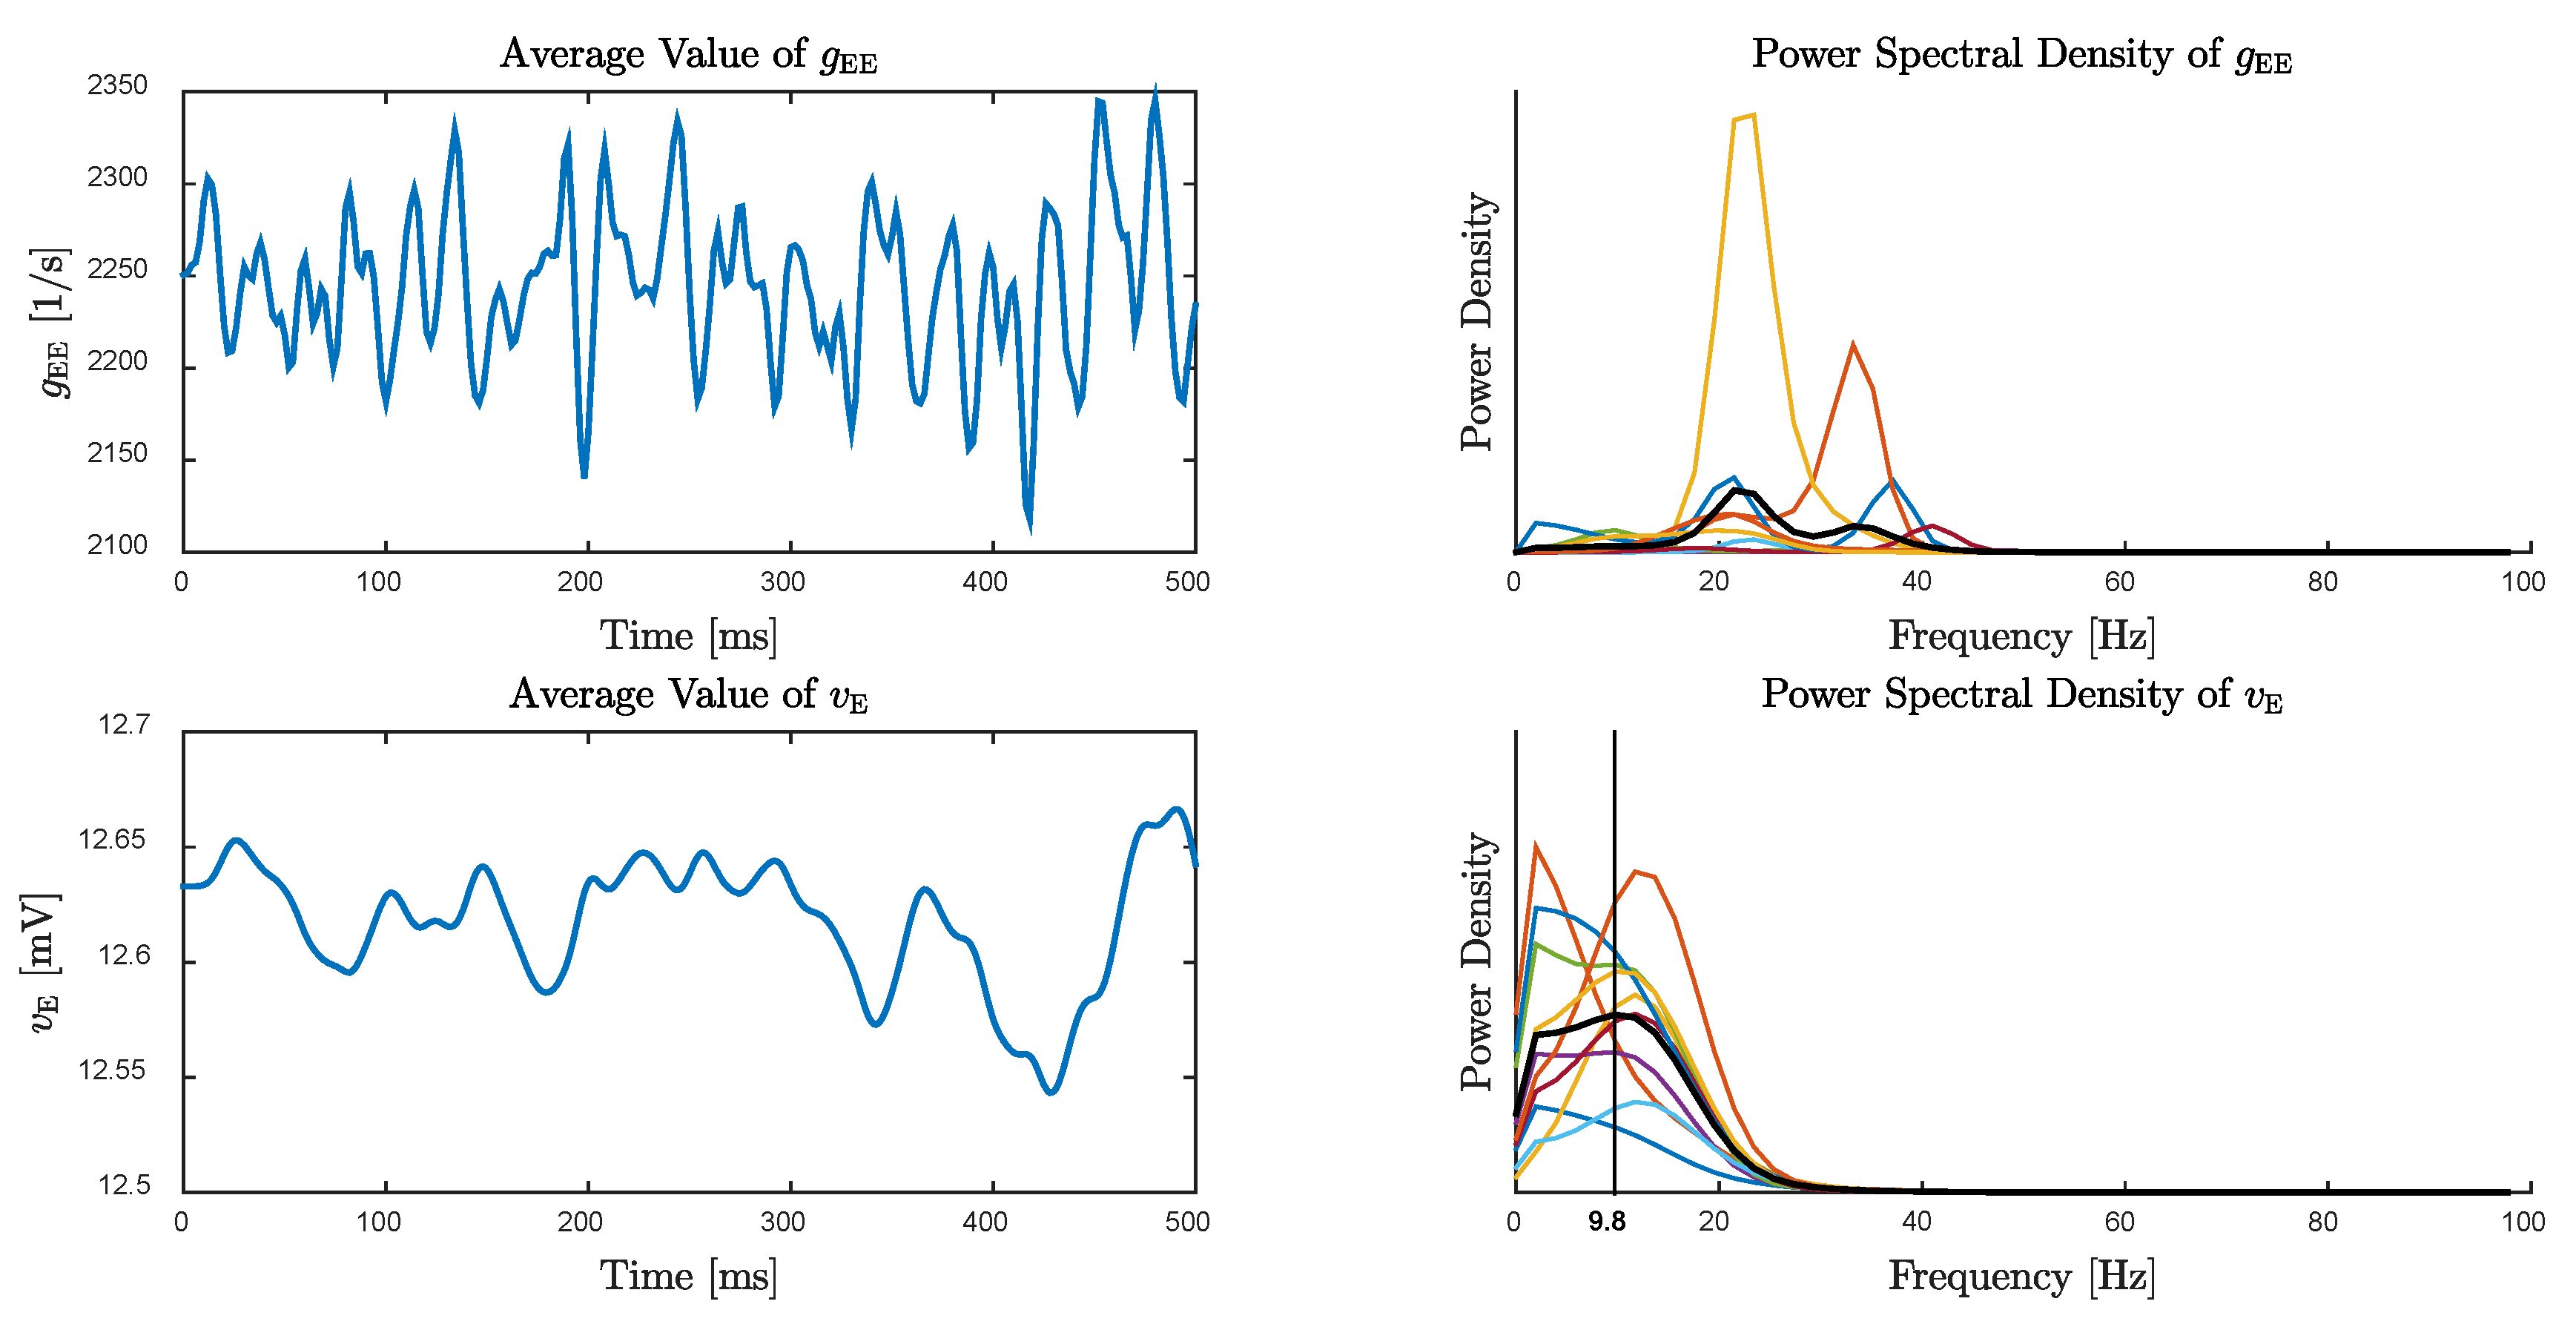
Figure 5b shows the result of the numerical computations for v E at the final time step t = 500 ms. As compared with Figure 5a, we observe that v E does not develop any specific spatial pattern of activity and essentially shows a similar pattern of random variations as observed in the input g E E . However, as shown in Figure 6, oscillations in v E are primarily in the α -band whereas the random input is oscillating at distinctively higher frequencies.

5. Emergence of Gamma Rhythms

In this section, we show that oscillations in the γ -band can emerge in the solutions of the model as a result of a subcritical Hopf bifurcation. In order to effectively use the available numerical bifurcation analysis tools, we consider a space homogeneous version of the model (1)–(8). This corresponds to the solutions of the model with space homogeneous initial values and input variables. As a result, (1)–(8) is transformed to a fourteenth-order system of ODEs by setting − 3 2 ν 2 Δ = 0 in (7) and (8).
Then, as in [17], we consider the bifurcation analysis of the resulting ODE system with respect to variations in the number of inhibitory to inhibitory intracortical connections N I I . The excitation of interneurons in layer IV by thalamic afferents is proposed in [17] as a mechanism for presynaptic facilitation of the inhibitory to inhibitory connections, which can be modeled by increasing N I I . Specifically, we replace N I I by η N I I , where η > 0 adjusts the percentage of the deviation of N I I from its nominal value given in Table.
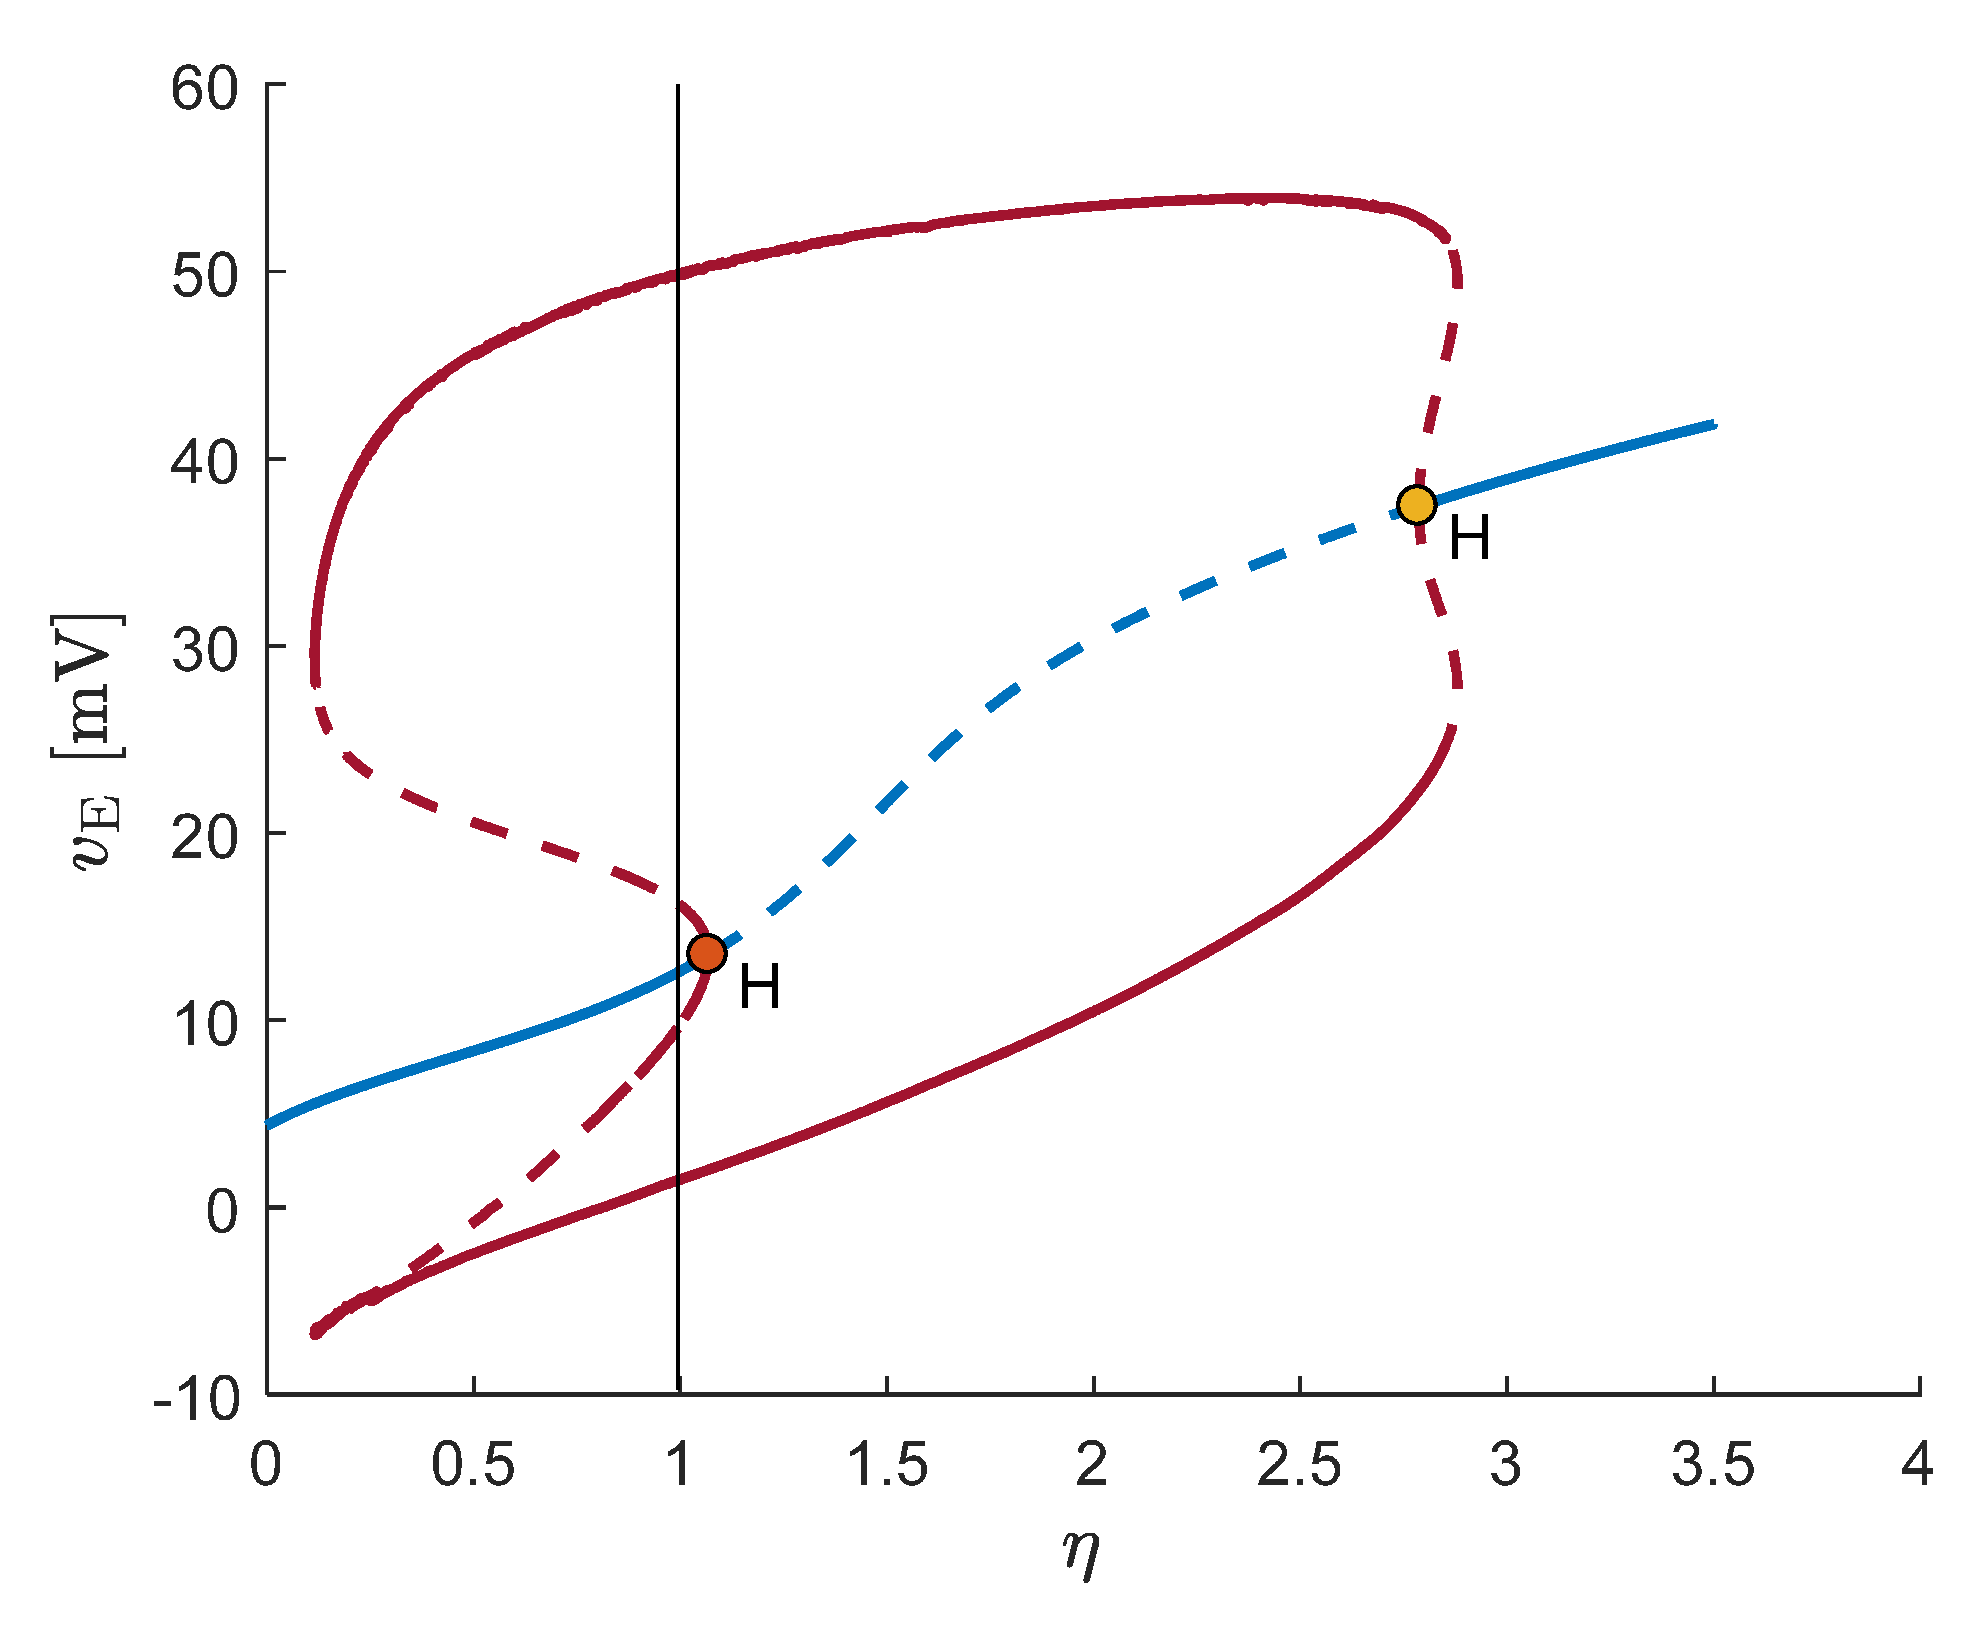
We use MatCont to generate the bifurcation analysis given in [17]. The results are shown in Figure 7. As we see in Figure 7, increasing N I I from its nominal value by a factor of η = 1.0676 results in a subcritical Hopf bifurcation, and the dynamics of the model undergoes a phase transition from damped oscillations about the stable equilibrium to sustained oscillations on a stable limit cycle. These results, which are derived based on the space homogeneous ODE version of the model, predict the emergence of oscillatory patterns of activity in the original model (1)–(8) as a result of an increase in N I I . In the following, we verify this prediction by computing the solutions of (1)–(8), and show that the frequency of these oscillations is in the γ -band.
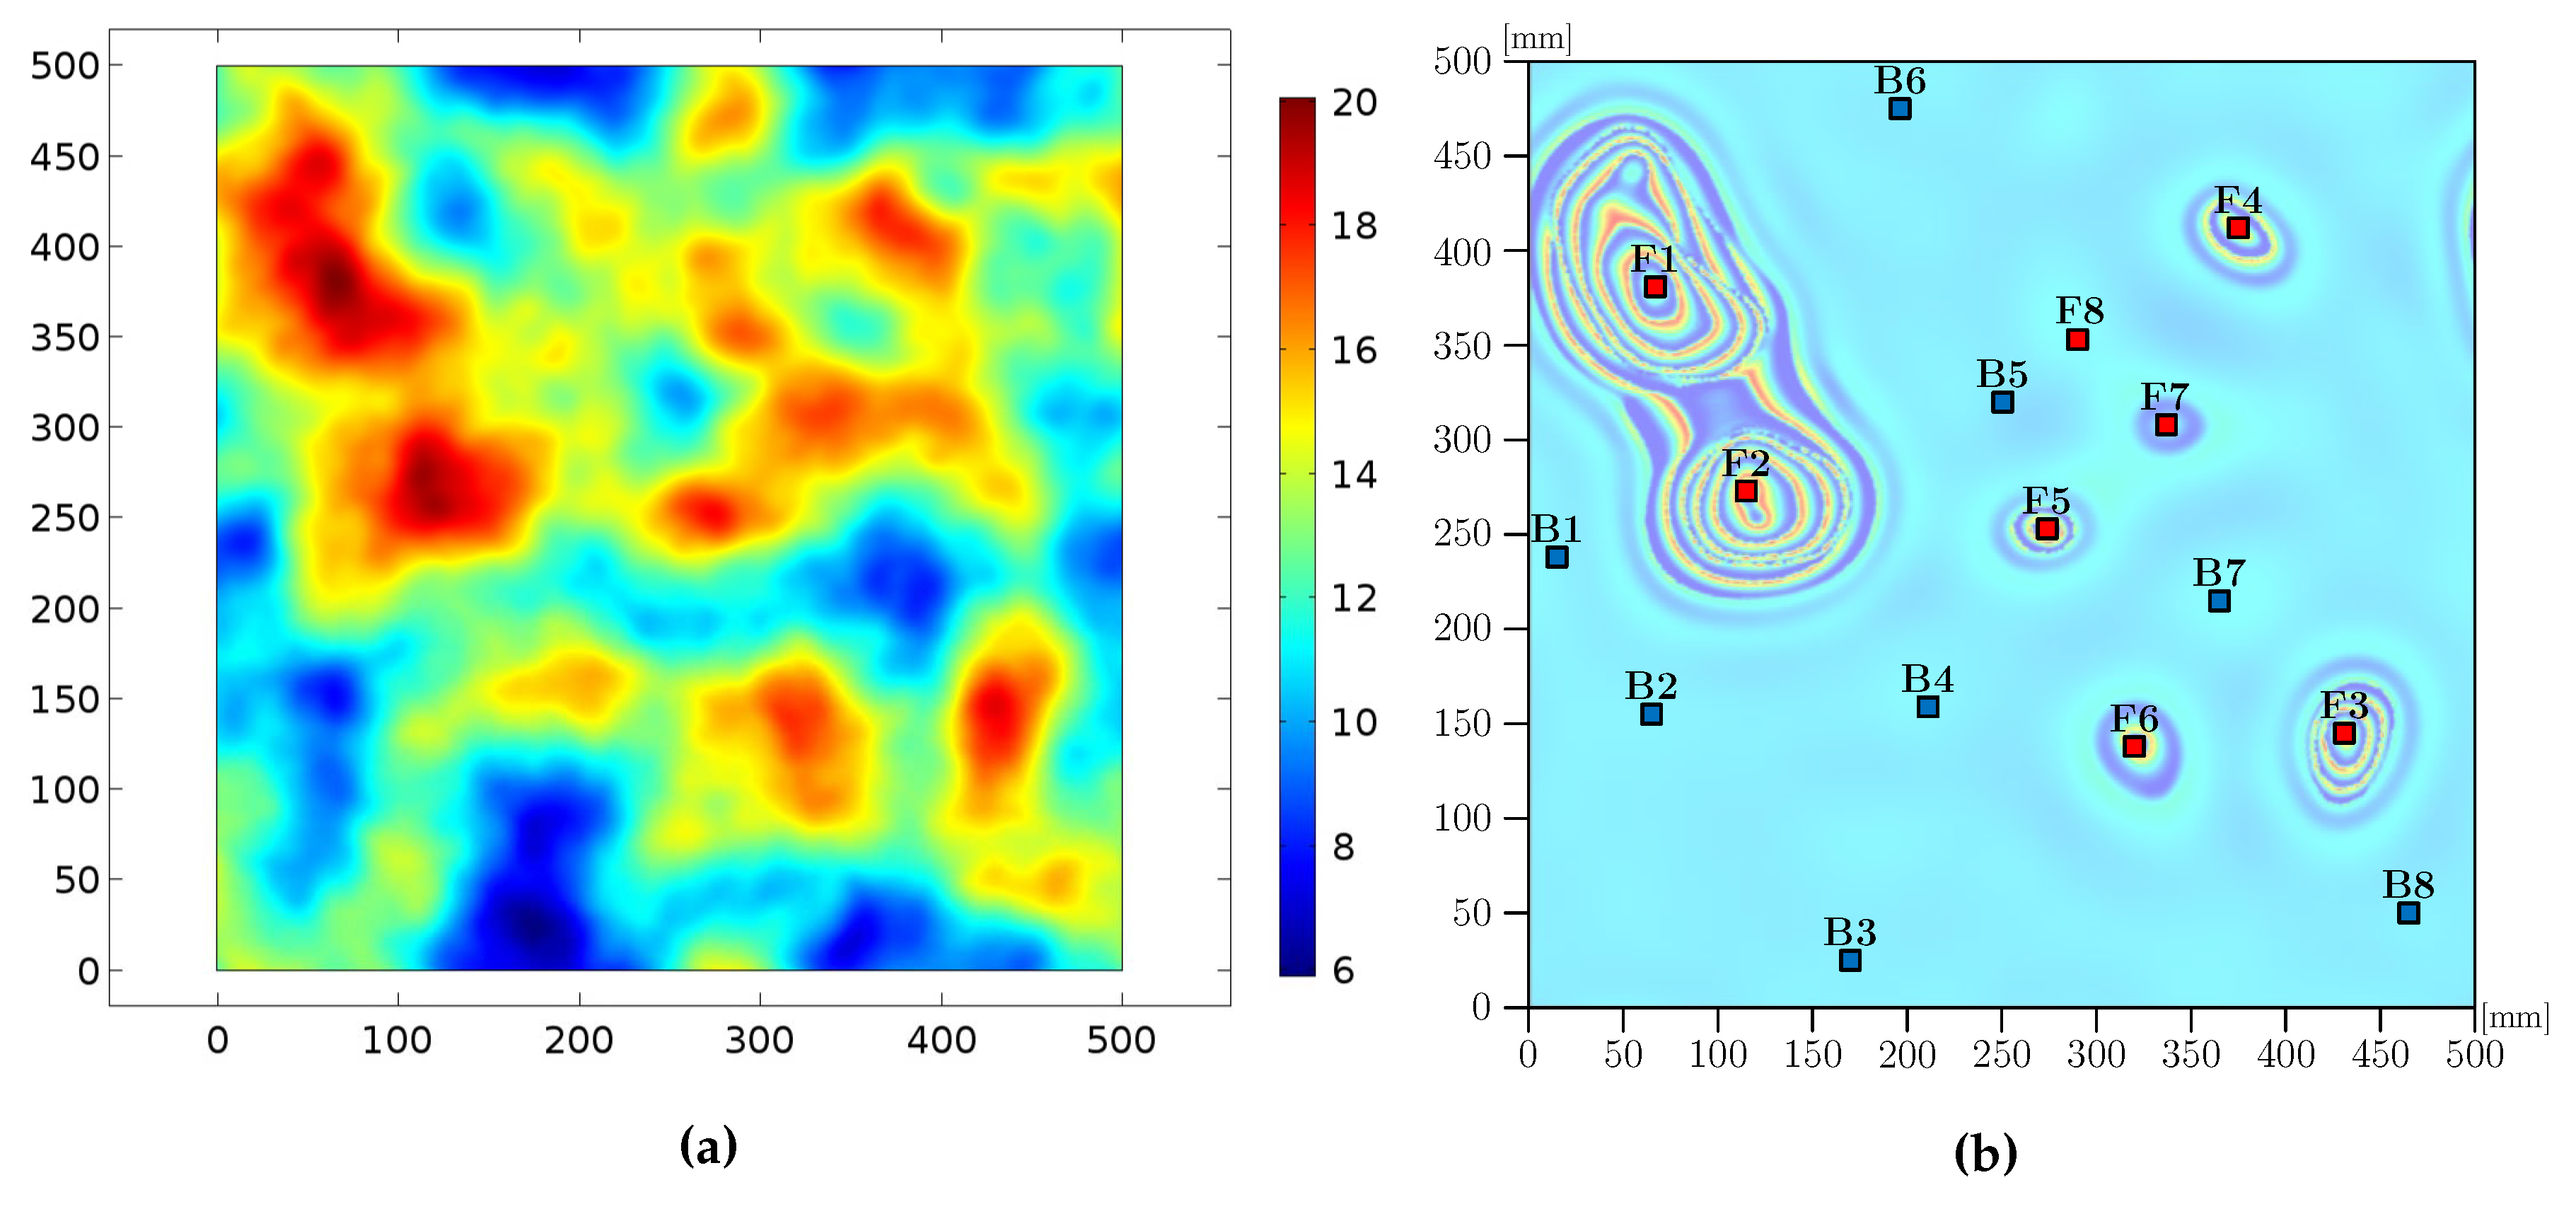
For the numerical computations, we set N I I equal to η = 1.07 times the nominal value given in Table 2. Furthermore, we set ( g E E , g E I , g I E , g I I ) = ( g ¯ E E , g ¯ E I , g ¯ I E , g ¯ I E ) and perform the computations by setting the initial value of v E equal to the function shown in Figure 8a, while setting the other initial values equal to their equilibrium values given by (10)–(12). Figure 9 shows snapshots of v E at different time instances. We observe that specific patterns of oscillations emerge spontaneously and propagate throughout the neocortex.
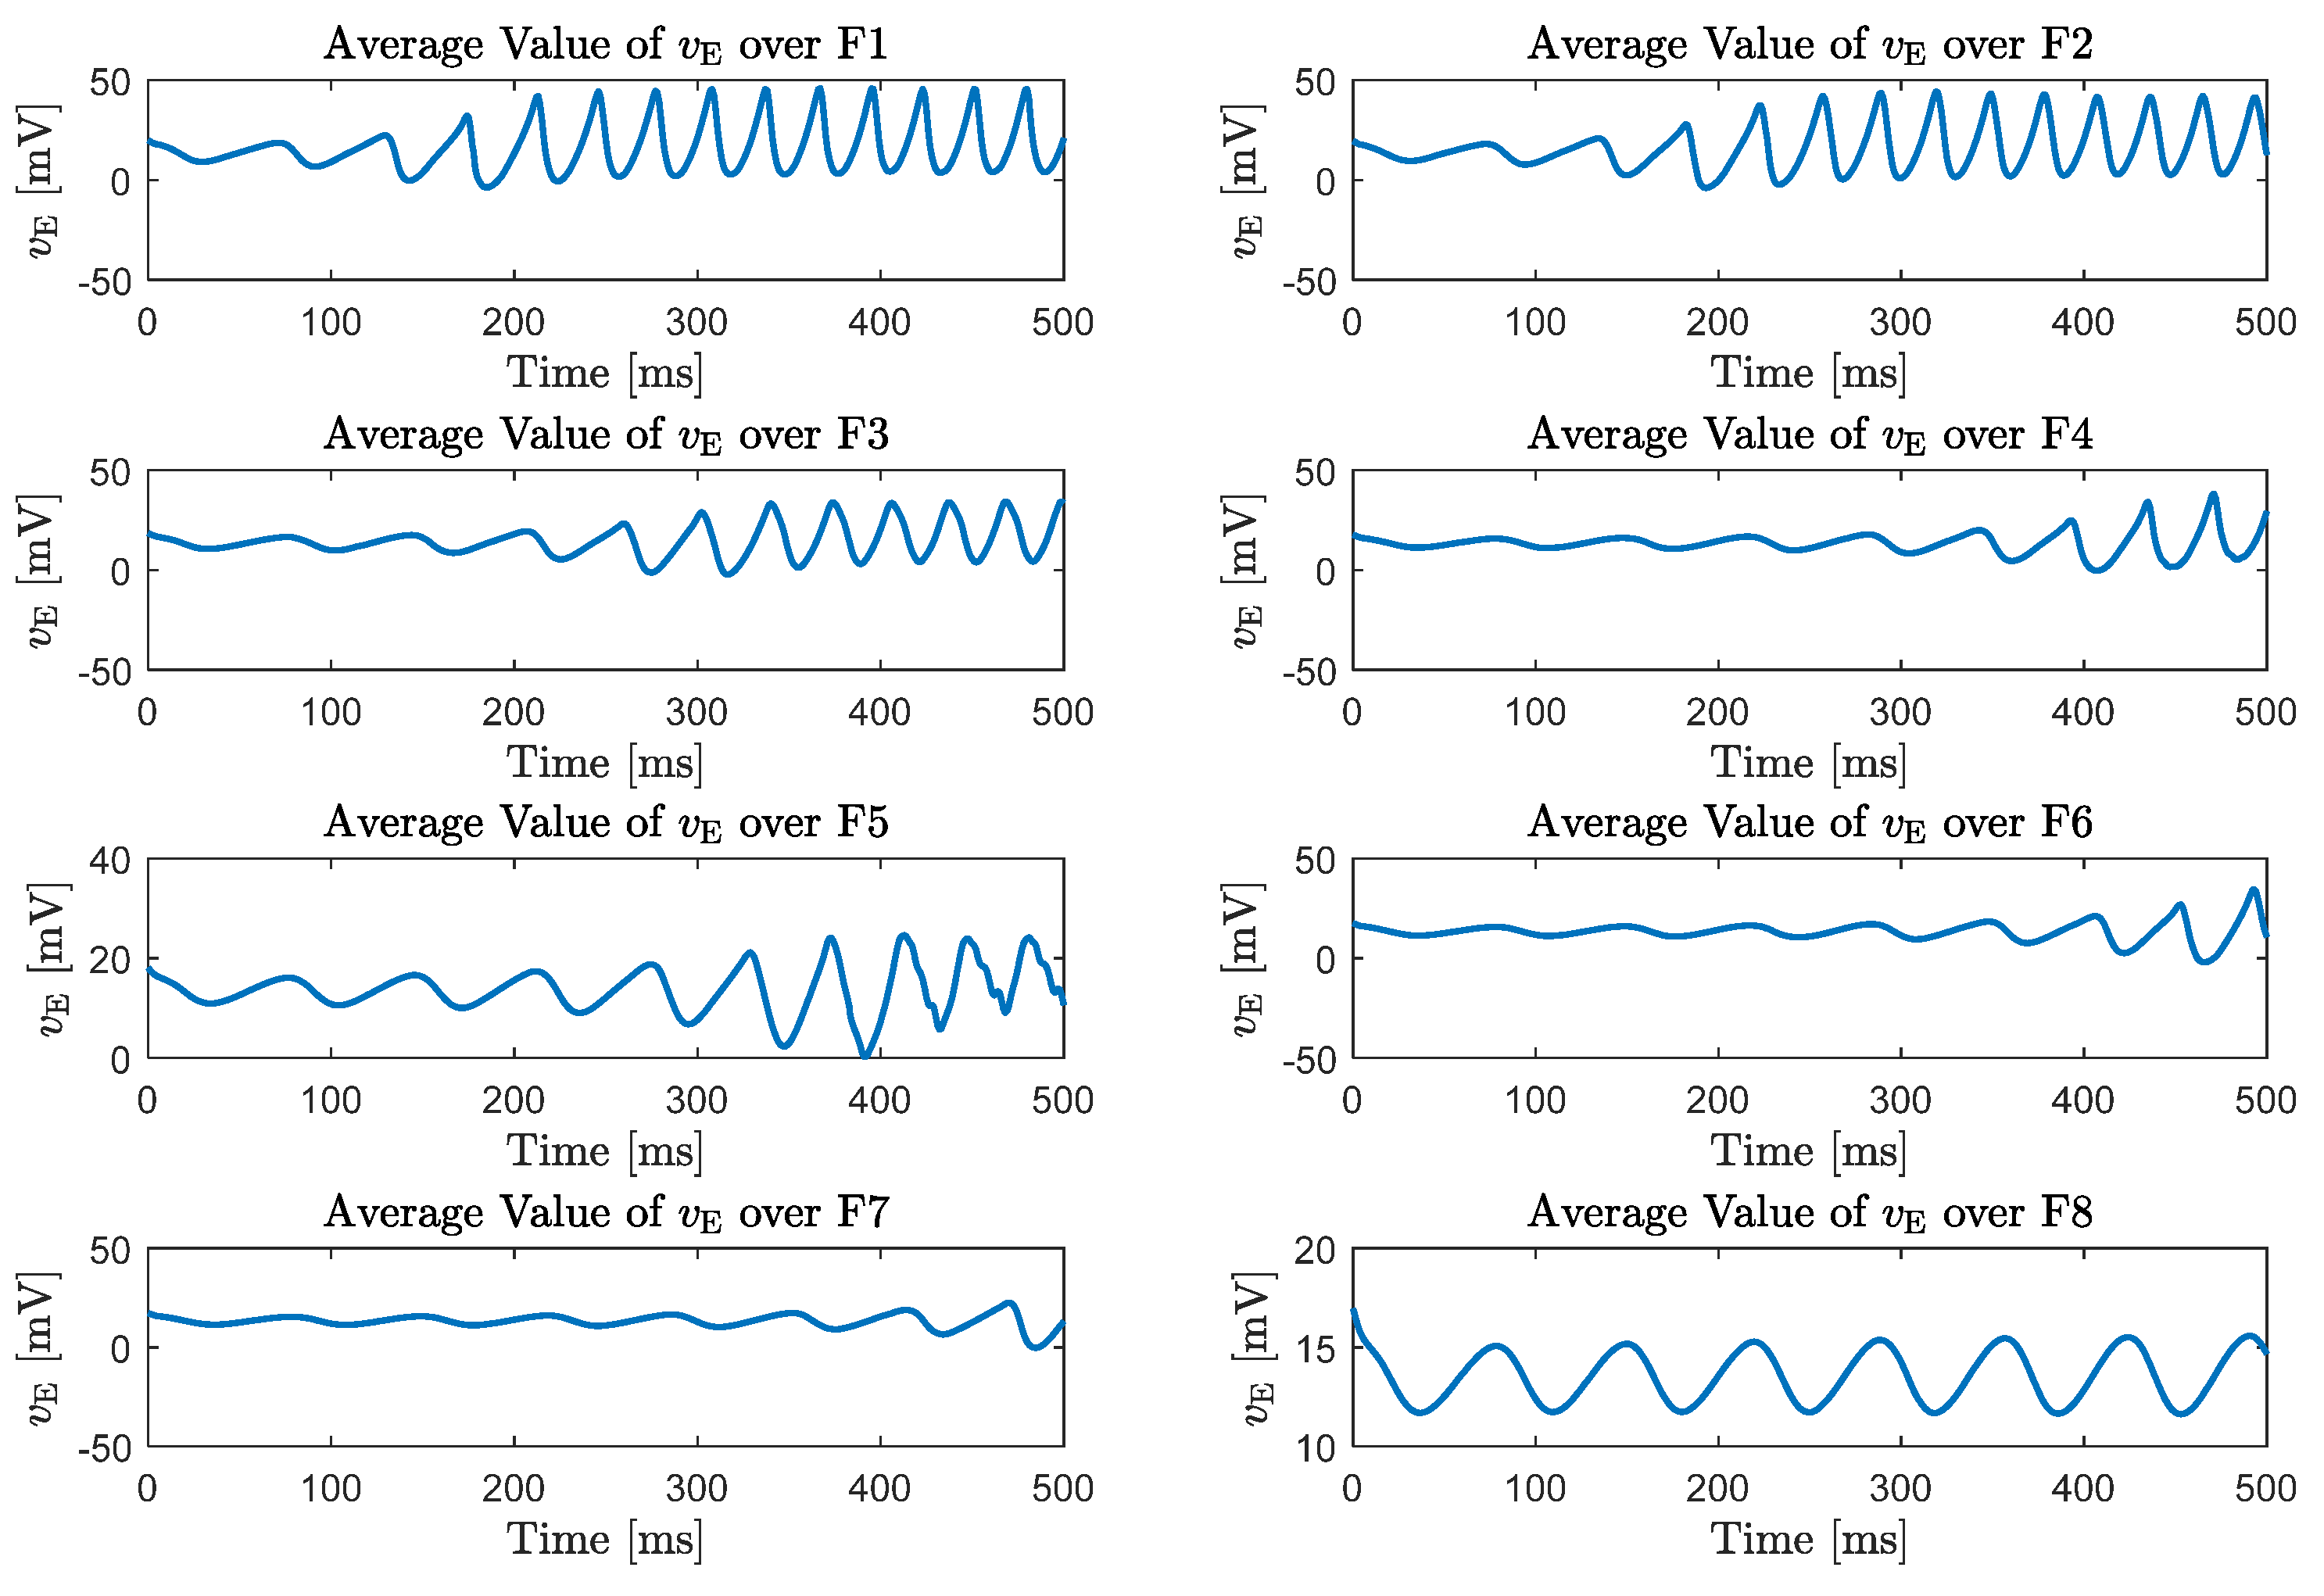
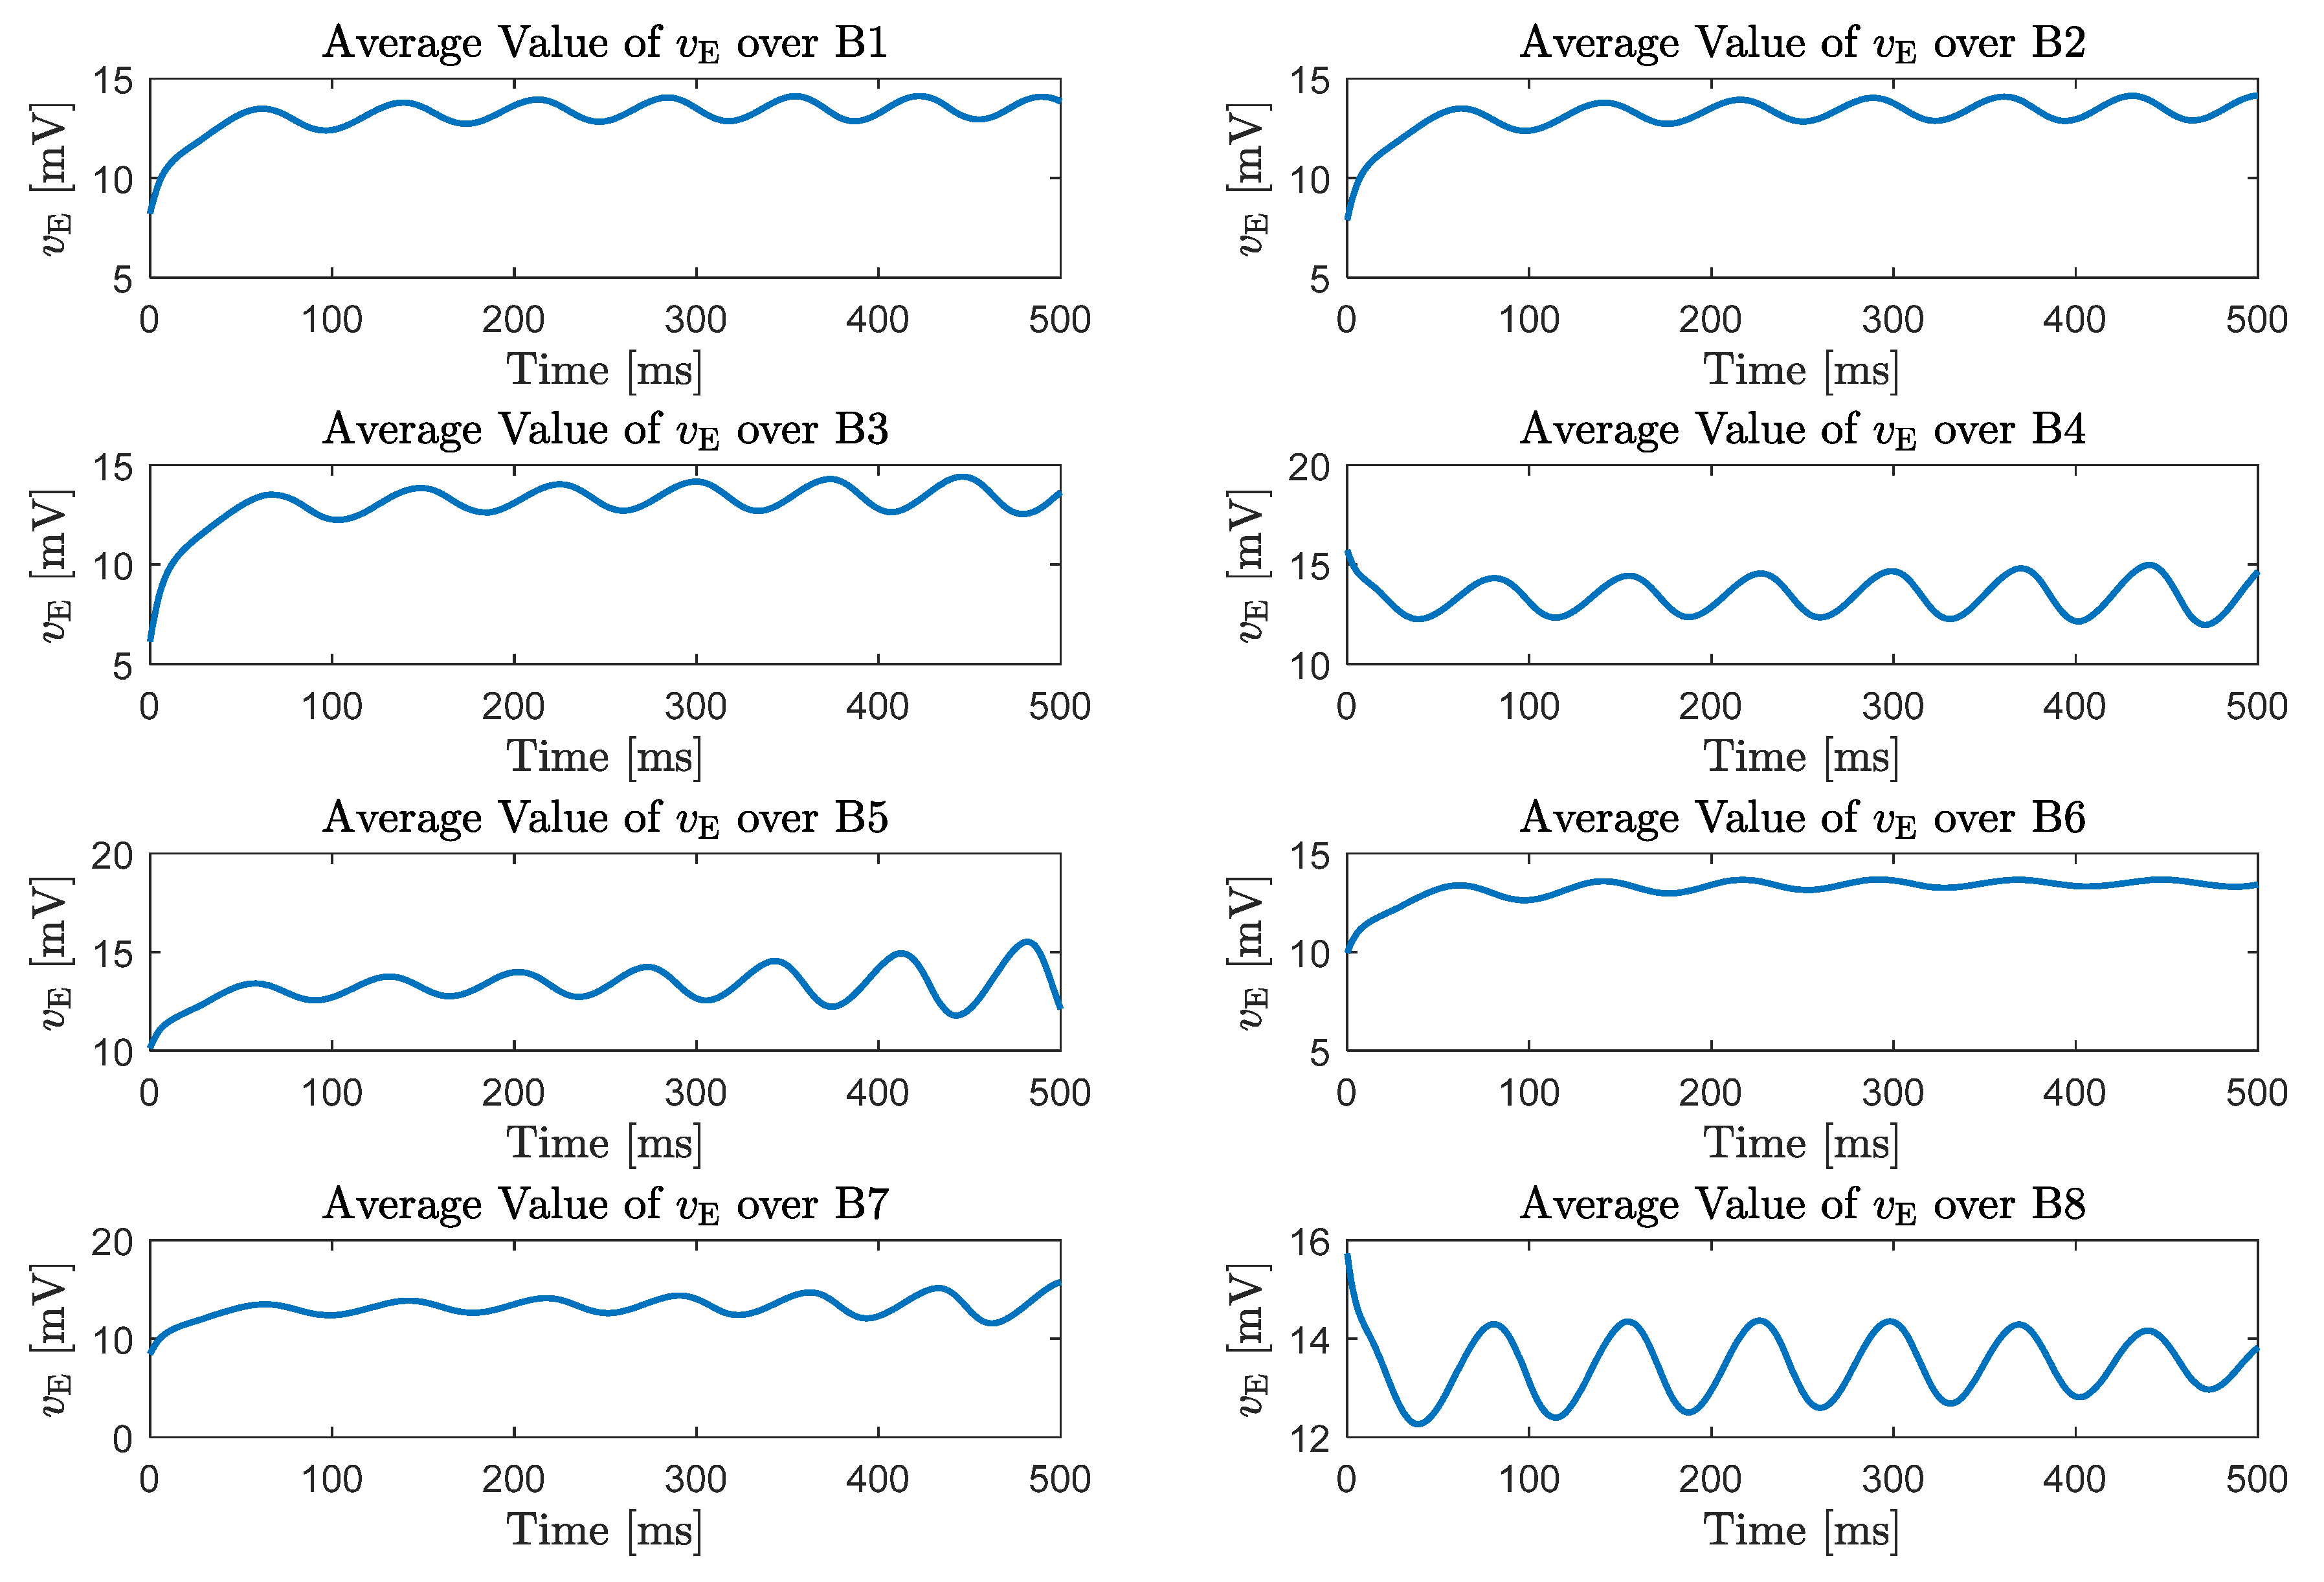
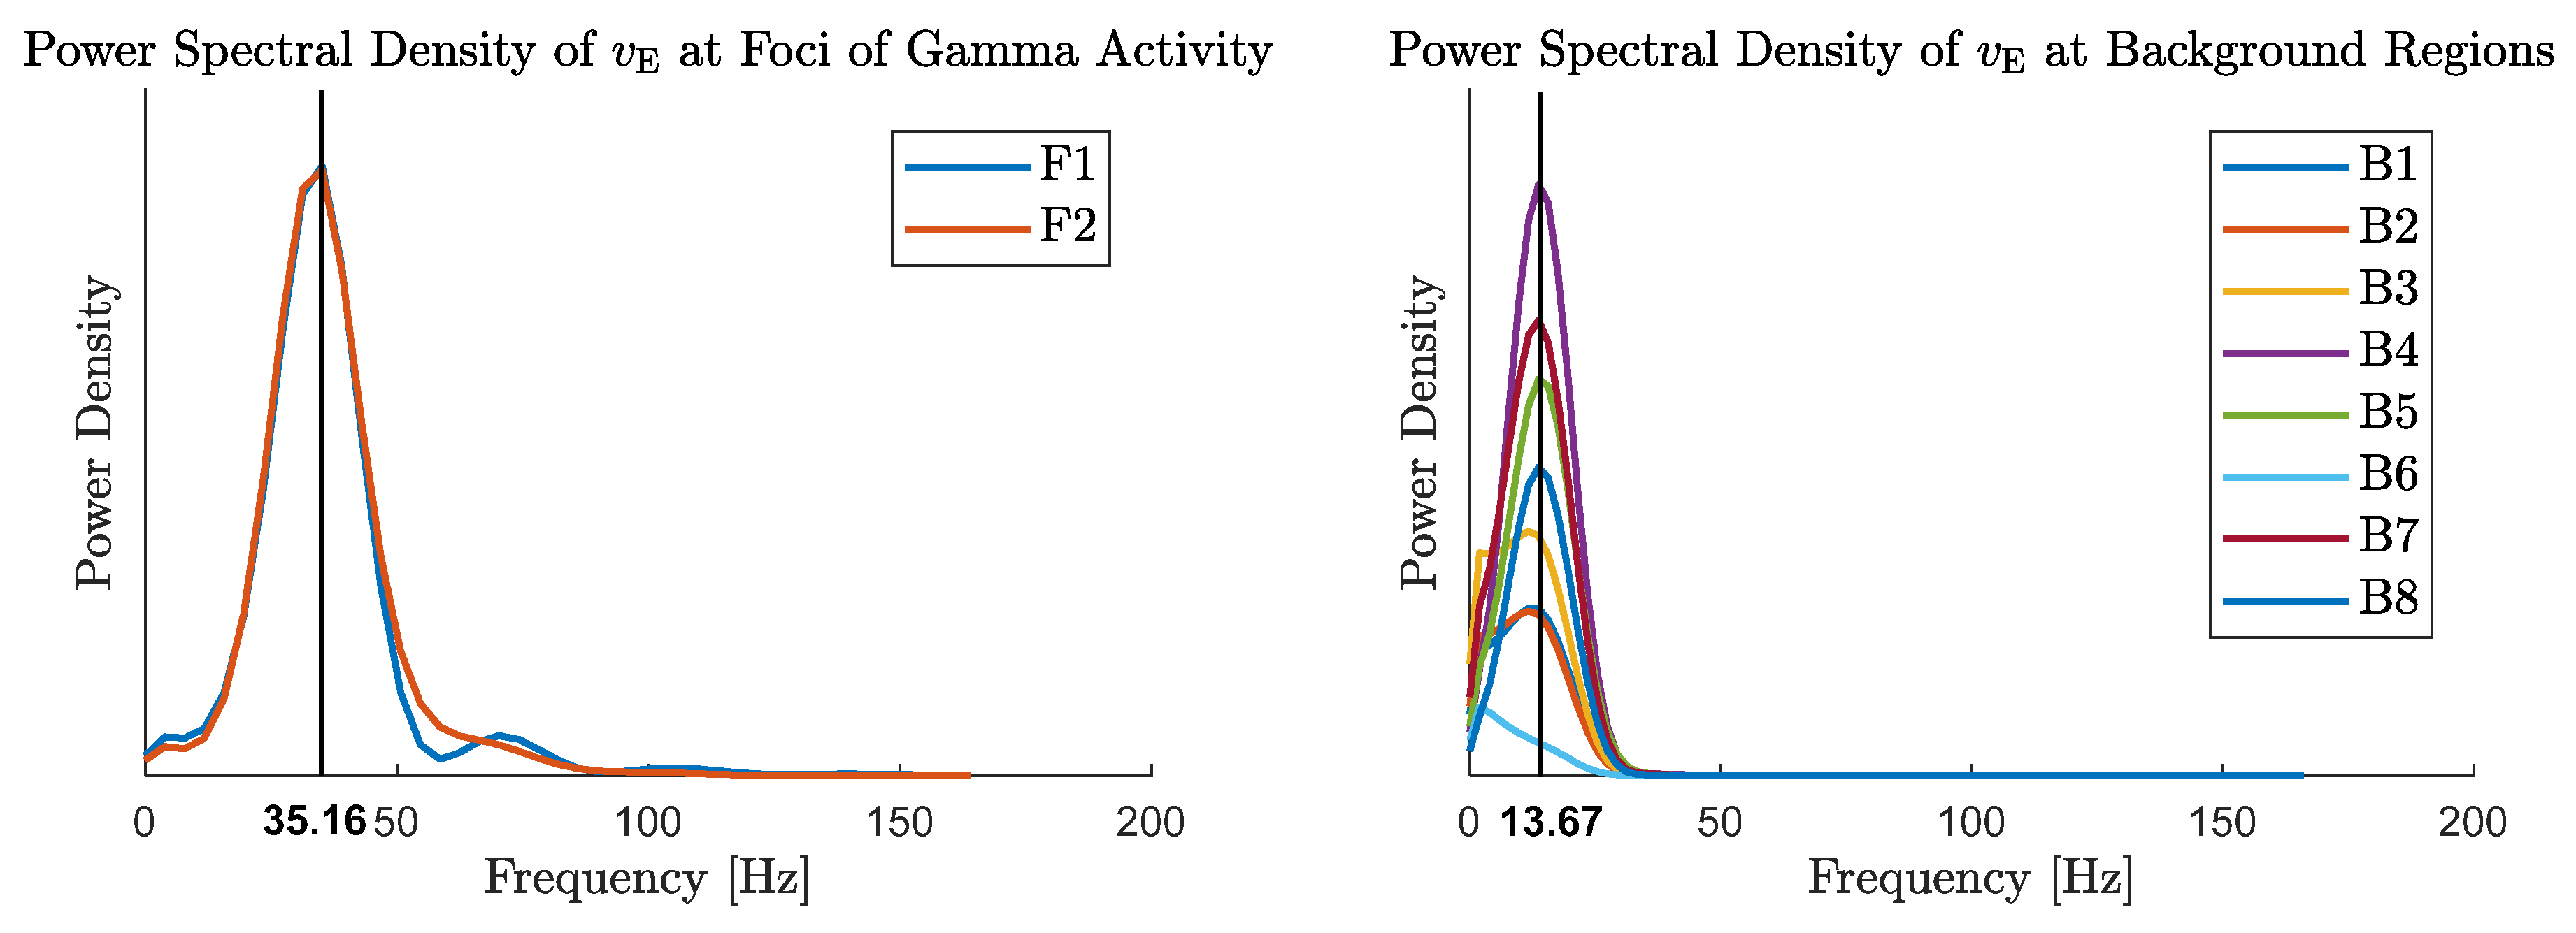
To measure the power spectral density of these oscillations, we set eight measurement probes F1–F8 at the focal points of these spatial patterns, as shown in Figure 8b. Moreover, we set eight measurement probes B1–B8 at other background locations to observe the oscillations in regions of the neocortex that do not develop any salient patterns of activity during the time horizon of the computation. The measurements of the probes are shown in Figure 10 and Figure 11, and their power spectral densities are shown in Figure 12. We observe that the power spectrum of the spatial patterns of oscillations that emerge locally in the neocortex lies essentially in the γ -band whereas oscillations at other areas remain in the α -band. This observation shows that γ oscillation can occur locally in the cortex, possibly in regions that are engaged with certain cognitive tasks.

6. Conclusions and Future Research Directions

In this paper, we used a spatiotemporal mean field model of the electroencephalographic activity in the neocortex to study the rhythmic activity in the brain. Using bifurcation analysis and numerical computations, we showed that this model can generate α - and γ -rhythms. The γ oscillations in the solutions of the model emerged as a result of an increase in the number of inhibitory to inhibitory intracortical connections. Furthermore, we showed that during the time the γ oscillations emerge locally in different regions of the neocortex, oscillations at other regions can still remain in the α -band.
Even though the spatially discrete [7,13] and the continuum mean field model presented in this paper can capture some of the salient features of modern neurophysiology, they are inconsistent with thermodynamic principles [13]. A revised view of the action potential based on the laws of thermodynamics was recently proposed in [42]. This electromechanical model traces its origins to the fundamental work of Tasaki [43] and characterizes the action potential as a propagating density pulse (i.e., a soliton). More specifically, the nerve pulse propagation is nearly adiabatic displaying a near reversible heat release as the nerve membrane undergoes a phase transition from fluid lipid to crystalline lipid with changes in the action potential (i.e., voltage pulse) and the nerve cell dimensions.
Embedding thermodynamic state notions (e.g., entropy, energy, free energy, chemical potential, symmetry) within dynamical neuroscience can allow us to directly address the otherwise mathematically complex and computationally prohibitive large-scale brain dynamical models. More specifically, thermodynamically consistent mathematical neuroscience models can provide the necessary tools involving synaptic drive synchronization (i.e., symmetry across time scales), free energy dispersal, and entropy production for connecting biophysical findings to psychophysical phenomena in problems of great clinical importance [13]. This is a subject of current research.

Funding

This work was supported in part by the National Science Foundation under Grant ECCS 1708792.

Acknowledgments

The author thanks James M. Bailey for several helpful discussions on the anesthetic cascade problem and Farshad Shirani for perfoming the numerical simulations in the paper.

Conflicts of Interest

The author declares no conflict of interest.

References

  1. Hodgkin, A.L.; Huxley, A.F. A quantitative description of membrane current and application to conduction and excitation in nerve. J. Physiol. 1952, 117, 500–544. [Google Scholar] [CrossRef] [PubMed]
  2. Hutt, A.; Griffiths, J.D.; Herrmann, C.S.; Lefebvre, J. Effect of stimulation waveform on the non-linear entrainment of cortical alpha oscillations. Front. Neurosci. 2018, 12, 1–14. [Google Scholar] [CrossRef] [PubMed]
  3. Ching, S.; Brown, E.N. Modeling the dynamical effects of anesthesia on brain circuits. Curr. Opin. Neurobiol. 2014, 25, 116–122. [Google Scholar] [CrossRef] [PubMed] [Green Version]
  4. Kiyamura, A.; Marszalec, W.; Yeh, J.Z.; Narahishi, T. Effects of halothane and propofol on excitatory and inhibitory synaptic transmission in rat cortical neurons. J. Pharmacol. 2002, 304, 162–171. [Google Scholar]
  5. Hutt, A.; Longtin, A. Effects of the anesthetic agent propofol on neural populations. Cogn. Neurodyn. 2009, 4, 37–59. [Google Scholar] [CrossRef] [PubMed] [Green Version]
  6. Steyn-Ross, M.L.; Steyn-Ross, D.A.; Sleigh, J.W. Modelling general anaesthesia as a first-order phase transition in the cortex. Prog. Biophys. Mol. Biol. 2004, 85, 369–385. [Google Scholar] [CrossRef] [PubMed] [Green Version]
  7. Hou, S.P.; Haddad, W.M.; Meskin, N.; Bailey, J.M. A mechanistic neural mean field theory of how anesthesia suppresses consciousness: Synaptic drive dynamics, system stability, attractors, partial synchronization, and the anesthetic cascade. J. Math. Neurosci. 2015, 2015, 1–50. [Google Scholar]
  8. Bojak, I.; Liley, D.T.J. Modeling the effects of anesthesia on the electroencephalogram. Phys. Rev. E 2005, 71, 041902. [Google Scholar] [CrossRef] [PubMed]
  9. Ermentrout, G.B.; Terman, D.H. Mathematical Foundations of Neuroscience; Springer: New York, NY, USA, 2010. [Google Scholar]
  10. Gutkin, B.; Pinto, D.; Ermentrout, G.B. Mathematical neuroscience: From neurons to circuits to systems. J. Physiol. 2003, 97, 209–219. [Google Scholar] [CrossRef] [PubMed]
  11. Hui, Q.; Haddad, W.M.; Bailey, J.M. Multistability, bifurcations, and biological neural networks: A synaptic drive firing model for cerebral cortex transition in the induction of general anesthesia. Nonlinear Anal. Hybrid Syst. 2011, 5, 554–572. [Google Scholar] [CrossRef]
  12. Hui, Q.; Haddad, W.M.; Bailey, J.M.; Hayakawa, T. A stochastic mean field model for an excitatory and inhibitory synaptic drive cortical neuronal network. IEEE Trans. Neural Netw. 2014, 24, 751–763. [Google Scholar]
  13. Haddad, W.M.; Hui, Q.; Bailey, J.M. Human brain networks: Spiking neuron models, multistability, synchronization, thermodynamics, maximum entropy production, and anesthetic cascade mechanisms. Entropy 2014, 16, 3939–4003. [Google Scholar] [CrossRef]
  14. Liley, D.T.J.; Cadusch, P.J.; Dafilis, M.P. A spatially continuous mean field theory of electrocortical dynamics. Netw. Comput. Neural Syst. 2002, 13, 67–113. [Google Scholar] [CrossRef]
  15. Wilson, H.R.; Cowan, J.D. Excitatory and inhibitory interactions in localized populations of model neurons. Biophys. J. 1972, 12, 1–24. [Google Scholar] [CrossRef]
  16. Wilson, H.R.; Cowan, J.D. A mathematical theory of the functional dynamics of cortical and thalamic nervous tissue. Kybernetik 1973, 13, 55–80. [Google Scholar] [CrossRef] [PubMed]
  17. Bojak, I.; Liley, D.T.J. Self-organized 40 Hz synchronization in a physiological theory of EEG. Neurocomputing 2007, 70, 2085–2090. [Google Scholar] [CrossRef]
  18. Shirani, F.; Haddad, W.M.; de la Llave, R. On the global dynamics of an electroencephalographic mean field model of the neocortex. SIAM J. Appl. Dyn. Syst. 2017, 16, 1969–2029. [Google Scholar] [CrossRef]
  19. Kandel, E.R.; Schwartz, J.H.; Jessell, T.M.; Siegelbaum, S.A.; Hudspeth, A.J. Principles of Neural Science, 5th ed.; McGraw-Hill: New York, NY, USA, 2013. [Google Scholar]
  20. Mountcastle, V.B. The columnar organization of the neocortex. Brain 1997, 120, 701–722. [Google Scholar] [CrossRef] [PubMed] [Green Version]
  21. Horton, J.C.; Adams, D.L. The cortical column: A structure without a function. Philos. Trans. R. Soc. B 2005, 360, 837–862. [Google Scholar] [CrossRef] [PubMed]
  22. Liley, D.T.J.; Walsh, M. The mesoscopic modelling of burst suppression during anaesthesia. Front. Comput. Neurosci. 2013, 7, 46. [Google Scholar] [CrossRef] [PubMed]
  23. Bojak, I.; Stoyanov, Z.V.; Liley, D. Emergence of spatially heterogeneous burst suppression in a neural field model of electrocortical activity. Front. Comput. Neurosci. 2015, 9, 18. [Google Scholar] [CrossRef] [PubMed]
  24. Frascoli, F.; van Veen, L.; Bojak, I.; Liley, D.T.J. Metabifurcation analysis of a mean field model of the cortex. Phys. D Nonlinear Phenom. 2011, 240, 949–962. [Google Scholar] [CrossRef] [Green Version]
  25. Mashour, G.A. Consciousness and the 21st Century Operating Room. Anesthesiology 2013, 119, 1003–1005. [Google Scholar] [CrossRef] [PubMed] [Green Version]
  26. Jordan, D.; Ilg, R.; Riedl, V.; Schorer, A.; Grimberg, S.; Neufang, S.; Omerovic, A.; Berger, S.; Untergehrer, G.; Preibisch, C.; et al. Simultaneous electroencephalographic and functional magnetic resonance imaging indicate impaired cortical top-down processing in association with anesthetic-induced unconsciousness. Anesthesiology 2013, 119, 1031–1042. [Google Scholar] [CrossRef] [PubMed]
  27. Lee, H.; Mashour, G.A.; Kim, S.; Lee, U. Reconfiguration of network hub structure after propofol-induced unconsciousness. Anesthesiology 2013, 119, 1347–1359. [Google Scholar] [CrossRef] [PubMed]
  28. Ching, S.; Cimenser, A.; Purdon, P.L.; Brown, E.N.; Kopell, N.J. Thalamocortical model for a propofol-induced α-rhythm associated with loss of consciousness. Proc. Nat. Acad. Sci. USA 2010, 107, 22665–22670. [Google Scholar] [CrossRef] [PubMed] [Green Version]
  29. Kuizenga, K.; Wierda, J.; Kalkman, C. Biphasic EEG changes in relation to loss of consciousness during induction with thiopental, propofol, etomidate, midazolam or sevoflurane. Br. J. Anaesth. 2001, 86, 354–360. [Google Scholar] [CrossRef] [PubMed] [Green Version]
  30. Bojak, I.; Day, H.C.; Liley, D.T.J. Ketamine, Propofol, and the EEG: A neural field analysis of HCN1-mediated interactions. Front. Comput. Neurosci. 2013, 7, 22. [Google Scholar] [CrossRef] [PubMed]
  31. Foster, B.L.; Bojak, I.; Liley, D.T.J. Population based models of cortical drug response: Insights from anaesthesia. Cogn. Neurodyn. 2008, 2, 283–296. [Google Scholar] [CrossRef] [PubMed]
  32. Kramer, M.A.; Kirsch, H.E.; Szeri, A.J. Pathological pattern formation and cortical propagation of epileptic seizures. J. R. Soc. Interface 2005, 2, 113–127. [Google Scholar] [CrossRef] [PubMed] [Green Version]
  33. Kramer, M.A.; Szeri, A.J.; Sleigh, J.W.; Kirsch, H.E. Mechanisms of seizure propagation in a cortical model. J. Comput. Neurosci. 2006, 22, 63–80. [Google Scholar] [CrossRef] [PubMed]
  34. Liley, D.T.J.; Bojak, I. Understanding the transition to seizure by modeling the epileptiform activity of general anesthetic agents. J. Clin. Neurophysiol. 2005, 22, 300–313. [Google Scholar] [PubMed]
  35. Green, K.R.; van Veen, L. Open-source tools for dynamical analysis of Liley’s mean-field cortex model. J. Comput. Sci. 2014, 5, 507–516. [Google Scholar] [CrossRef]
  36. Kramer, M.A.; Truccolo, W.; Eden, U.T.; Lepage, K.Q.; Hochberg, L.R.; Eskandar, E.N.; Madsen, J.R.; Lee, J.W.; Maheshwari, A.; Halgren, E.; et al. Human seizures self-terminate across spatial scales via a critical transition. Proc. Natl. Acad. Sci. USA 2012, 109, 21116–21121. [Google Scholar] [CrossRef] [PubMed] [Green Version]
  37. Dafilis, M.P.; Frascoli, F.; Cadusch, P.J.; Liley, D.T.J. Four dimensional chaos and intermittency in a mesoscopic model of the electroencephalogram. Chaos 2013, 23, 023111. [Google Scholar] [CrossRef] [PubMed]
  38. Dafilis, M.P.; Frascoli, F.; Cadusch, P.J.; Liley, D.T.J. Extensive four-dimensional chaos in a mesoscopic model of the electroencephalogram. J. Math. Neurosci. 2015, 5, 18. [Google Scholar] [CrossRef] [PubMed]
  39. Van Veen, L.; Green, K.R. Periodic solutions to a mean-field model for electrocortical activity. Eur. Phys. J. Spec. Top. 2014, 223, 2979–2988. [Google Scholar] [CrossRef] [Green Version]
  40. Van Veen, L.; Liley, D.T.J. Chaos via Shilnikov’s Saddle-Node Bifurcation in a Theory of the Electroencephalogram. Phys. Rev. Lett. 2006, 97, 208101. [Google Scholar] [CrossRef] [PubMed]
  41. Dhooge, A.; Govaerts, W.; Kuznetsov, Y.A.; Meijer, H.G.E.; Sautois, B. New features of the software MatCont for bifurcation analysis of dynamical systems. Math. Comput. Model. Dyn. Syst. 2008, 14, 147–175. [Google Scholar] [CrossRef]
  42. Heimburg, T.; Jackson, A.D. On soliton propagation in biomembranes and nerves. Proc. Natl. Acad. Sci. USA 2005, 102, 9790–9795. [Google Scholar] [CrossRef] [PubMed] [Green Version]
  43. Tasaki, I. Evidence for phase transitions in nerve fibers, cells and synapses. Ferroelectrics 1999, 220, 305–316. [Google Scholar] [CrossRef]
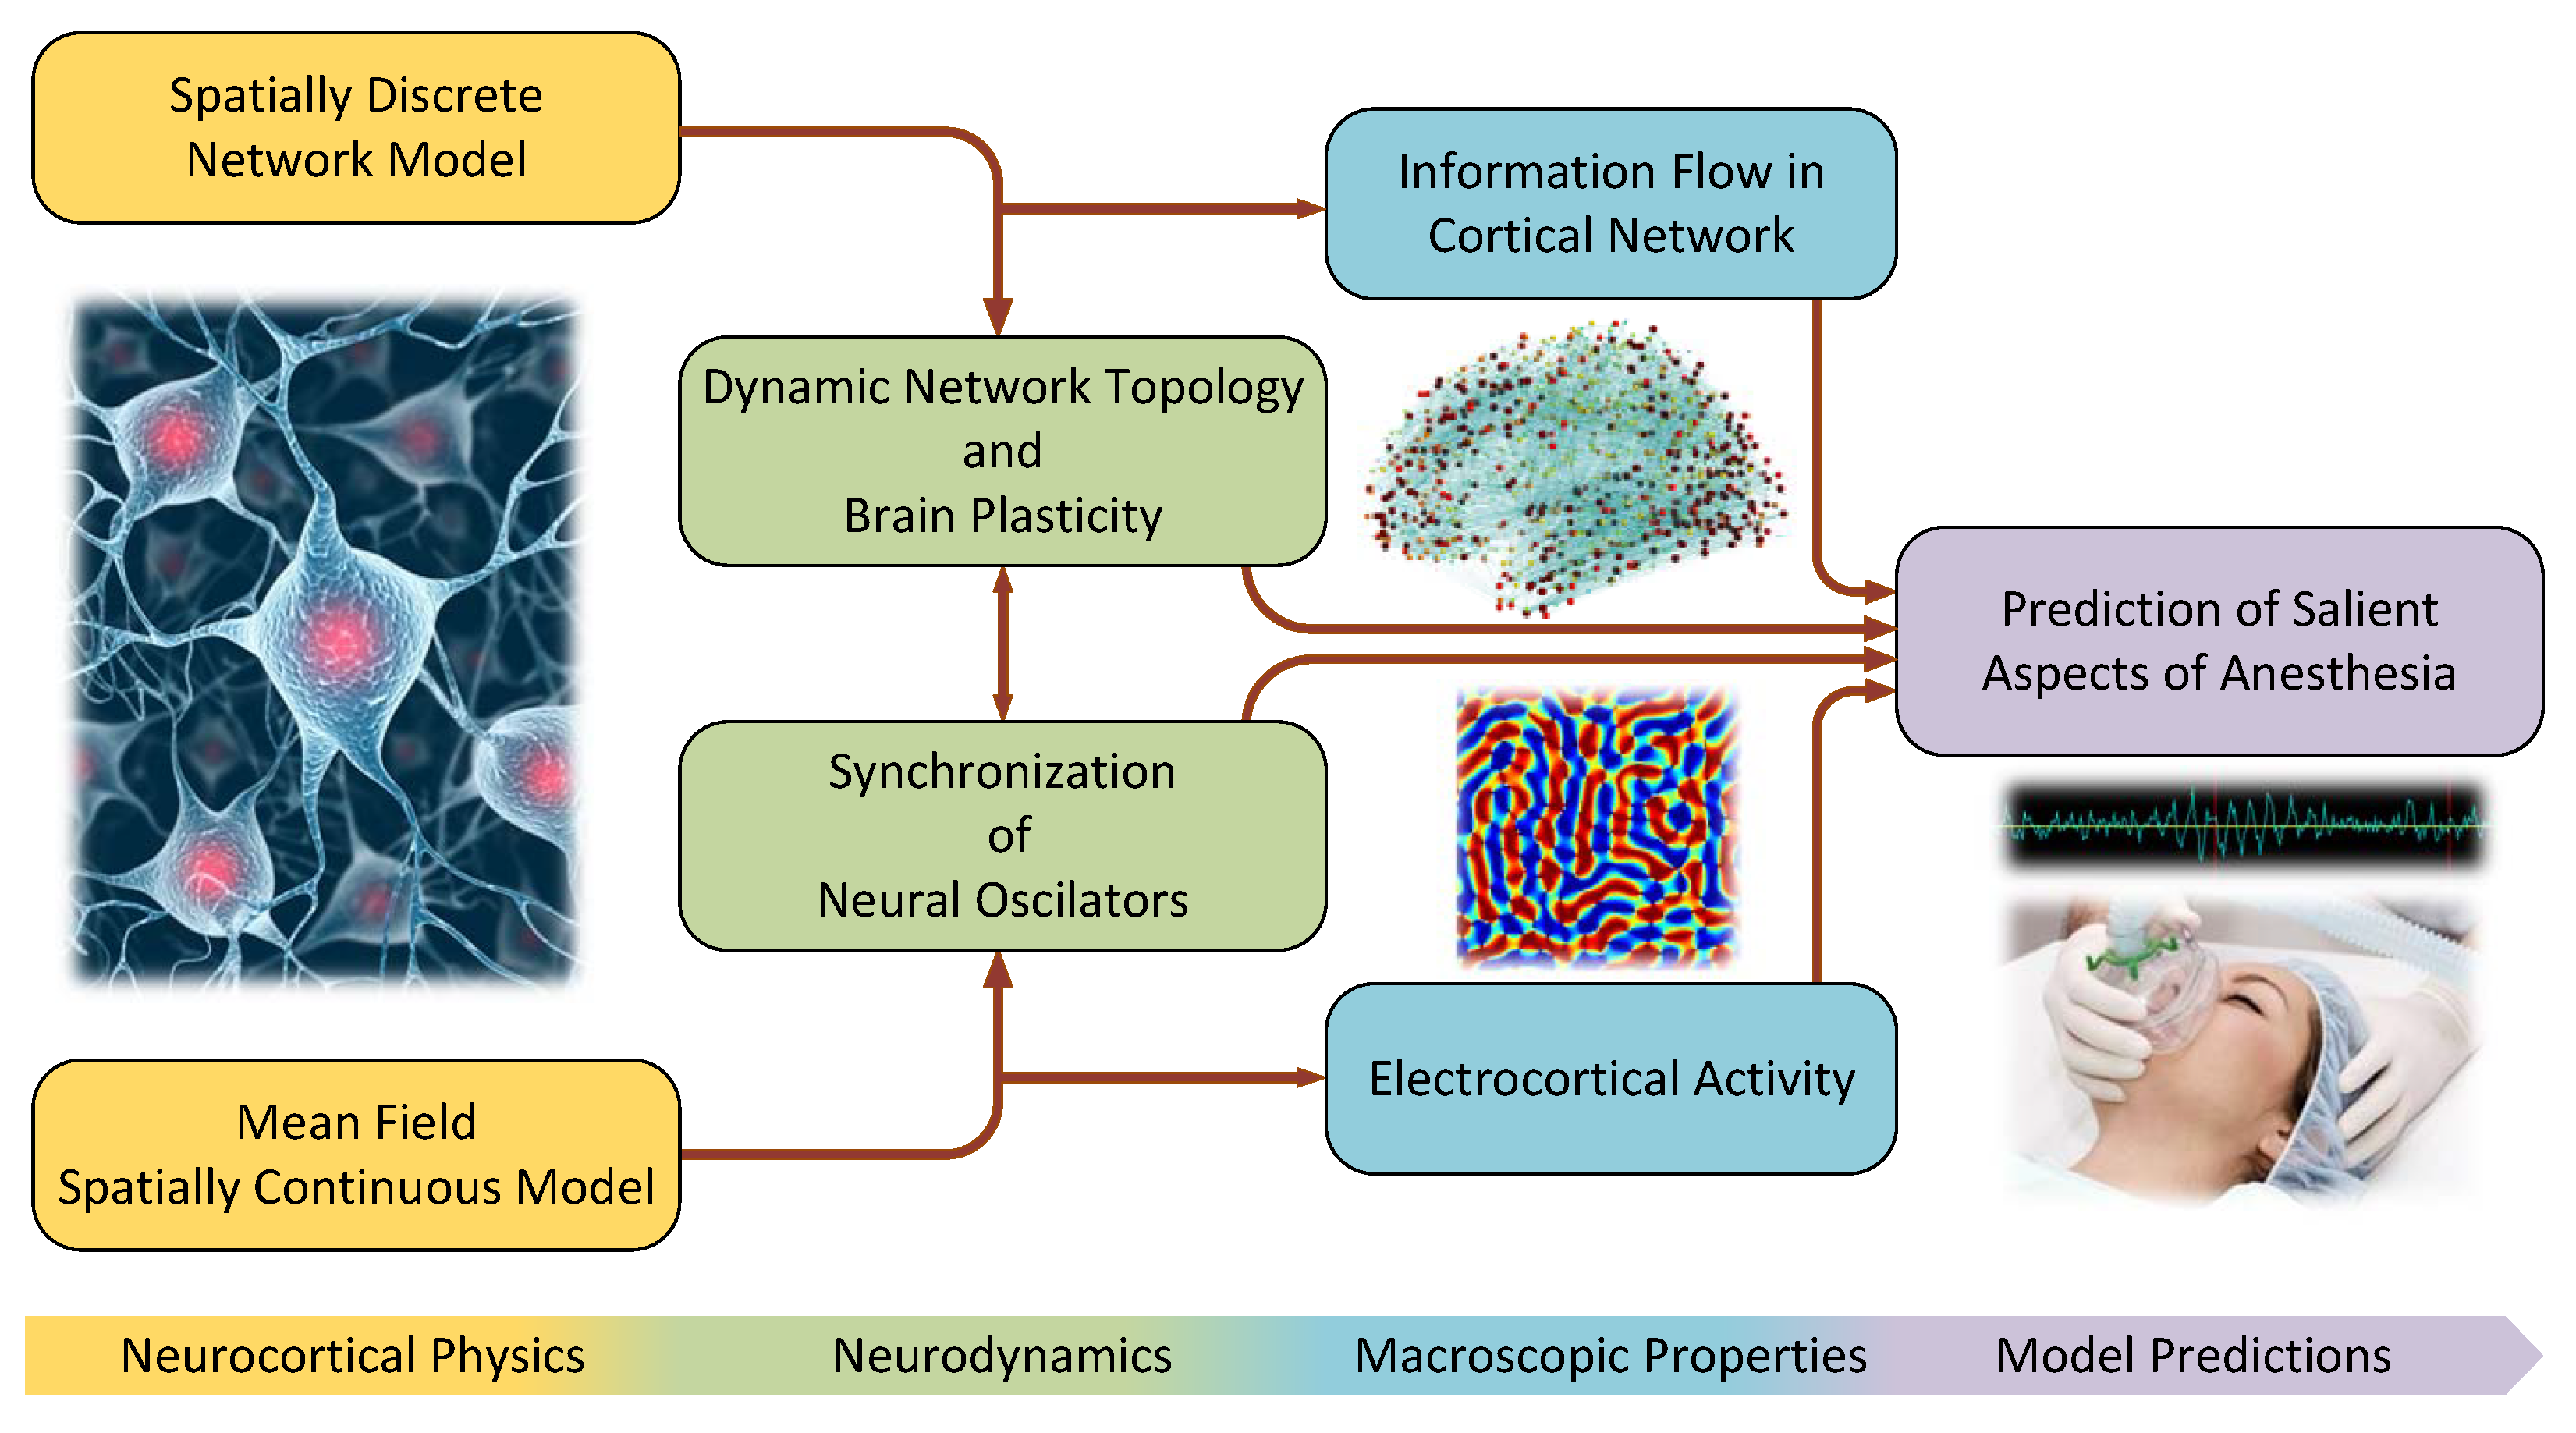
Figure 1. Visualization of research theme.
Symmetry 10 00568 g001
Figure 2. Neocortex structure with intracortical and corticocortical connections [18].
Symmetry 10 00568 g002
Figure 3. Cortical inputs to two local networks located at points x and y as modeled by (1)–(8) [18].
Symmetry 10 00568 g003
Figure 4. Electroencephalographic (EEG) (in mV) versus time (in ms): Transition to unconsciousness.
Symmetry 10 00568 g004
Figure 5. Comparison of the random input g E E and the membrane potential v E at the resting state. (a) The random input g E E at t = 500 ms. (b) The membrane potential v E at t = 500 ms.
Symmetry 10 00568 g005
Figure 6. Time and frequency analysis of the α oscillations. Left: Measurements of the random input g E E and the membrane potential v E at a randomly chosen probe location. Right: Power spectral density of the measurements of ten probes located randomly over the domain of the neocortex Ω . The solid black curve is the average of the power densities of the ten measurements. The zero frequency components (mean value) of all signals are removed.
Symmetry 10 00568 g006
Figure 7. The bifurcation diagram associated with the space homogenous ordinary differential equations (ODE) version of (1)–(8). The bifurcation parameter η indicates the percentage of the deviation of N I I from its nominal value. The curve of equilibria is shown in blue, and the curves of the maximum and minimum values of the limit cycles are shown in red. Solid lines denote stable equilibria and limit cycles, and dashed lines denote unstable equilibrai and limit cycles. The two Hopf bifurcation points are marked by H.
Symmetry 10 00568 g007
Figure 8. (a) The initial value of v E in mV. (b) The locations of the measurement probes used to extract signals for the time and frequency analysis of the γ -rhythms.
Symmetry 10 00568 g008
Figure 9. Emergence of γ -band rhythmic activity. Snapshots are taken from v E at every 50 ms.
Symmetry 10 00568 g009
Figure 10. Measurements of F1–F8 probes at the locations shown in Figure 8b.
Symmetry 10 00568 g010
Figure 11. Measurements of B1–B8 probes at the locations shown in Figure 8b.
Symmetry 10 00568 g011
Figure 12. Power spectral density of the measurements of F1, F2, and B1–B8 probes shown in Figure 10 and Figure 11. The zero frequency components (mean value) of all signals are removed. Power densities are calculated based on the last 256 ms measurements of F1 and F2 probes and the last 400 ms measurements of the B1–B8 probes to remove the effect of the initial period of transitions on the spectrum.
Symmetry 10 00568 g012
Table 1. Definition and range of values for the biophysical parameters of the mean field model (1)–(8). All electric potentials are given with respect to the mean resting soma membrane potential v rest = 70 mV  [8].
ParameterDefinitionRangeUnit
τ E Passive excitatory membrane decay time constant [ 0.005 , 0.15 ] s
τ I Passive inhibitory membrane decay time constant [ 0.005 , 0.15 ] s
V E E , V E I Mean excitatory Nernst potentials [ 50 , 80 ] mV
V I E , V I I Mean inhibitory Nernst potentials[– 20 , 5 ] mV
γ E E , γ E I Excitatory postsynaptic potential rate constants [ 100 , 1000 ] s 1
γ I E , γ I I Inhibitory postsynaptic potential rate constants [ 10 , 500 ] s 1
Υ E E , Υ E I Amplitude of excitatory postsynaptic potentials [ 0.1 , 2.0 ] mV
Υ I E , Υ I I Amplitude of inhibitory postsynaptic potentials [ 0.1 , 2.0 ] mV
N E E , N E I Number of intracortical excitatory connections [ 2000 , 5000 ]
N I E , N I I Number of intracortical inhibitory connections [ 100 , 1000 ]
ν Corticocortical conduction velocity [ 100 , 1000 ] cm/s
Λ E E , Λ E I Decay scale of corticocortical excitatory connectivities [ 0.1 , 1.0 ] cm 1
M E E , M E I Number of corticocortical excitatory connections [ 2000 , 5000 ]
F E Maximum mean excitatory firing rate [ 50 , 500 ] s 1
F I Maximum mean inhibitory firing rate [ 50 , 500 ] s 1
μ E Excitatory firing threshold potential [ 15 , 30 ] mV
μ I Inhibitory firing threshold potential [ 15 , 30 ] mV
σ E Standard deviation of excitatory firing threshold potential [ 2 , 7 ] mV
σ I Standard deviation of inhibitory firing threshold potential [ 2 , 7 ] mV
Table 2. The set of biophysically plausible parameter values used for the computational analysis of the model (1)–(8) ([8], Table V, col. 11). The parameters g ¯ E E , g ¯ E I , g ¯ I E , and g ¯ I I are, respectively, the mean values of the physiologically shaped random inputs g E E , g E I , g I E , and g I I used in [8].
Parameter τ E τ I V E E V E I V I E V I I γ E E γ E I
Value 32.209 × 10 3 92.26 × 10 3 79.551 77.097 8.404 9.413 122.68 982.51
Parameter γ I E γ I I Υ E E Υ E I Υ I E Υ I I N E E N E I
Value 293.1 111.4 0.29835 1.1465 1.2615 0.20143 4202.4 3602.9
Parameter N I E N I I ν Λ E E , Λ E I M E E M E I F E F I
Value 443.71 386.43 116.12 0.6089 3228 2956.9 66.433 393.29
Parameter μ E μ I σ E σ I g ¯ E E g ¯ E I g ¯ I E g ¯ I I
Value 27.771 24.175 4.7068 2.9644 2250.6 4363.4 00