Estimation of Vessel Emissions Inventory in Qingdao Port Based on Big data Analysis


1
College of Engineering, Ocean University of China, Qingdao 266100, China
2
Shandong Maritime Safety Administration, Qingdao 266100, China
3
Department of Electrical, Electronic & Computer Engineering, University of Pretoria, Pretoria 0002, South Africa
4
School of Mechanical, Materials, Mechatronic and Biomedical Engineering, University of Wollongong, Wollongong, NSW 2522, Australia
*
Author to whom correspondence should be addressed.
Symmetry 2018, 10(10), 452; https://doi.org/10.3390/sym10100452
Submission received: 28 August 2018
/
Revised: 25 September 2018
/
Accepted: 26 September 2018
/
Published: 1 October 2018
Abstract
:Exhaust emissions from vessels have increasingly attracted attention in the continuously growing marine transport world trade market. The International Maritime Organization (IMO) has introduced a number of measures designed to reduce exhaust emissions from global shipping. As one of the busiest ports in the world, Qingdao port has been studied to propose possible support to the development of efficient emission reduction. In this study, a large amount data of emissions inventory in Qingdao port was used to predict its annual exhaust emissions, and hence, to help understand maritime pollution in Qingdao port. Bigdata analysis methodology was employed to perform accurate predictions on vessel emissions. The analysis results show that the emissions were dominated by container ships, oil tankers, and bulk cargo ships. The comparison between Qingdao port and other ports in emission control areas demonstrates the necessity of control measures for exhaust emissions. The adoption of shore power and efficient cargo handling seems to be a potential solution to reduce exhaust emissions. The findings of this study are meaningful for maritime safety administration to understand the current emission situation in Qingdao port, propose corresponding control measures, and perform pollution prevention.
1. Introduction
Although shipping has proven to be the most energy efficient mode for mass transport, emissions from ship engines are harmful to the environment at both regional and global scales [1,2]. The International Maritime Organization (IMO) has introduced a number of measures designed to reduce exhaust emissions from global shipping [3]. It is therefore crucial to control and reduce the exhaust emissions from vessels [4].
Quantifying exhaust emissions from marine vessels is a critical step to understand the source and scale of marine pollution [5]. It is also the base to predict future emissions and develop pollution improvement opportunities [4]. Previous studies that estimate emissions from maritime industry can be clarified as international and regional levels [6,7], and the exhaust emissions from ships in maritime transport are estimated by two methodologies, namely, activity-based and fuel-based methods. For fuel-based method, prior to input usage data, the fuel-sale figure is individually introduced by different countries in the emission inventory prediction. The activity-based emission prediction method aims to calculate the emissions from the fleet or various groups of marine vessels operating around ports and coast-lines for a particular area, which involve sailing statistics and technical data for regional ships and national sea transport, and the establishment of new specific fuel consumption (SFC) figures and emission factors for ship engines in general.
Currently, the activity-based method has been applied for emission prediction in vessels [8]. Jalkanen et al. [9] computed the exhaust emissions of marine traffic in the Baltic Sea area based on the relationship of the instantaneous speed to the design speed, and the detailed technical information of the engines of the ships. An in-port ship activity-based methodology was applied by Tzannatos [10] for maneuvering and berthing of coastal passenger ships and cruise ships calling at the passenger port of Piraeus (Greece), in order to estimate the emission of the main ship exhaust pollutants (NOX, SO2, and PM2.5) over a twelve-month period in 2008 and 2009. Shipping emissions in Candarli Gulf, Turkey, were calculated based on the energy consumptions of ships for every different stage which was called operation modes (cruising, maneuvering and hotelling), and detailed real-time activity data were used for calculations of shipping emissions in this study [11]. To estimate the exhaust emission from ocean-going vessels in Hong Kong, Yau et al. [12] collected complete data sets of ship activities, including arrival, departure, and activities during shifts between berths within the Hong Kong territory. The operational modes, including cruising, slow cruising in reduced speed zones, maneuvering and hotelling, were categorized based on the vessel speeds. Another Automatic Identification System (AIS) based emission inventory in Tianjin Port using a bottom-up approach was developed in 2016 [13]. The inter-monthly emission variations and the uncertainties in the estimation were also investigated. Similar activity-based methods were adopted in the ship emission estimation study for the port of Incheon [14] and Thessaloniki [15].
Qingdao port is the seventh largest port in the world. It consists of Dagang, Huangdao, Qianwan, and Dongjiakou port areas. In 2016, the port completed cargo throughput of 500 million tons. The subsequent pollution problems rocks headlines frequently, especially when other air pollution sources, including electric power plant and motor vehicles, are strictly restricted in the seashore Qingdao city. Qingdao has joined the C40 Cities Climate Leadership Group, affirming the commitment of the city to tackling climate change. It could be estimated that the vessel emission may account for a large percentage of the total air pollution in Qingdao. However, relevant studies that aim to predict the vessel emission inventory in Qingdao port have not been found yet. It is worth investigating the exhaust emission calculation in Qingdao port to provide solid support to efficient energy saving and emission reduction.
To address the challenge in emission control and environment protection, a new prediction model for vessel emission inventory of Qingdao port was developed using bigdata analysis in this paper. The link between shipping activities and air pollution emission in Qingdao port were examined, and an emission inventory that takes into account the different types of ships under various operation modes was developed. Furthermore, a quantitative comparison was performed between Chinese emission control area ports and Qingdao port. Finally, the characteristics of the emissions in Qingdao port were analyzed.
The contribution of this study is that, for the first time, a bigdata analysis-based methodology is proposed for vessel emission prediction in Qingdao port. The paper is organized as follows: Section 2 introduces the Qingdao port and Section 3 presents the new methodology for vessel emission prediction. The analysis results are discussed in Section 4. Section 5 contains the conclusions of this paper.
2. Introduction of Qingdao Port
Qingdao port commenced operations in 1892. Located between the Bohai Rim port region and the Yangtze River Delta port region in China, Qingdao Port is one of the most comprehensive and busiest ports in the world. It ranks at seventh over the world and has become an important hub for international trade and transportation in the West Pacific.
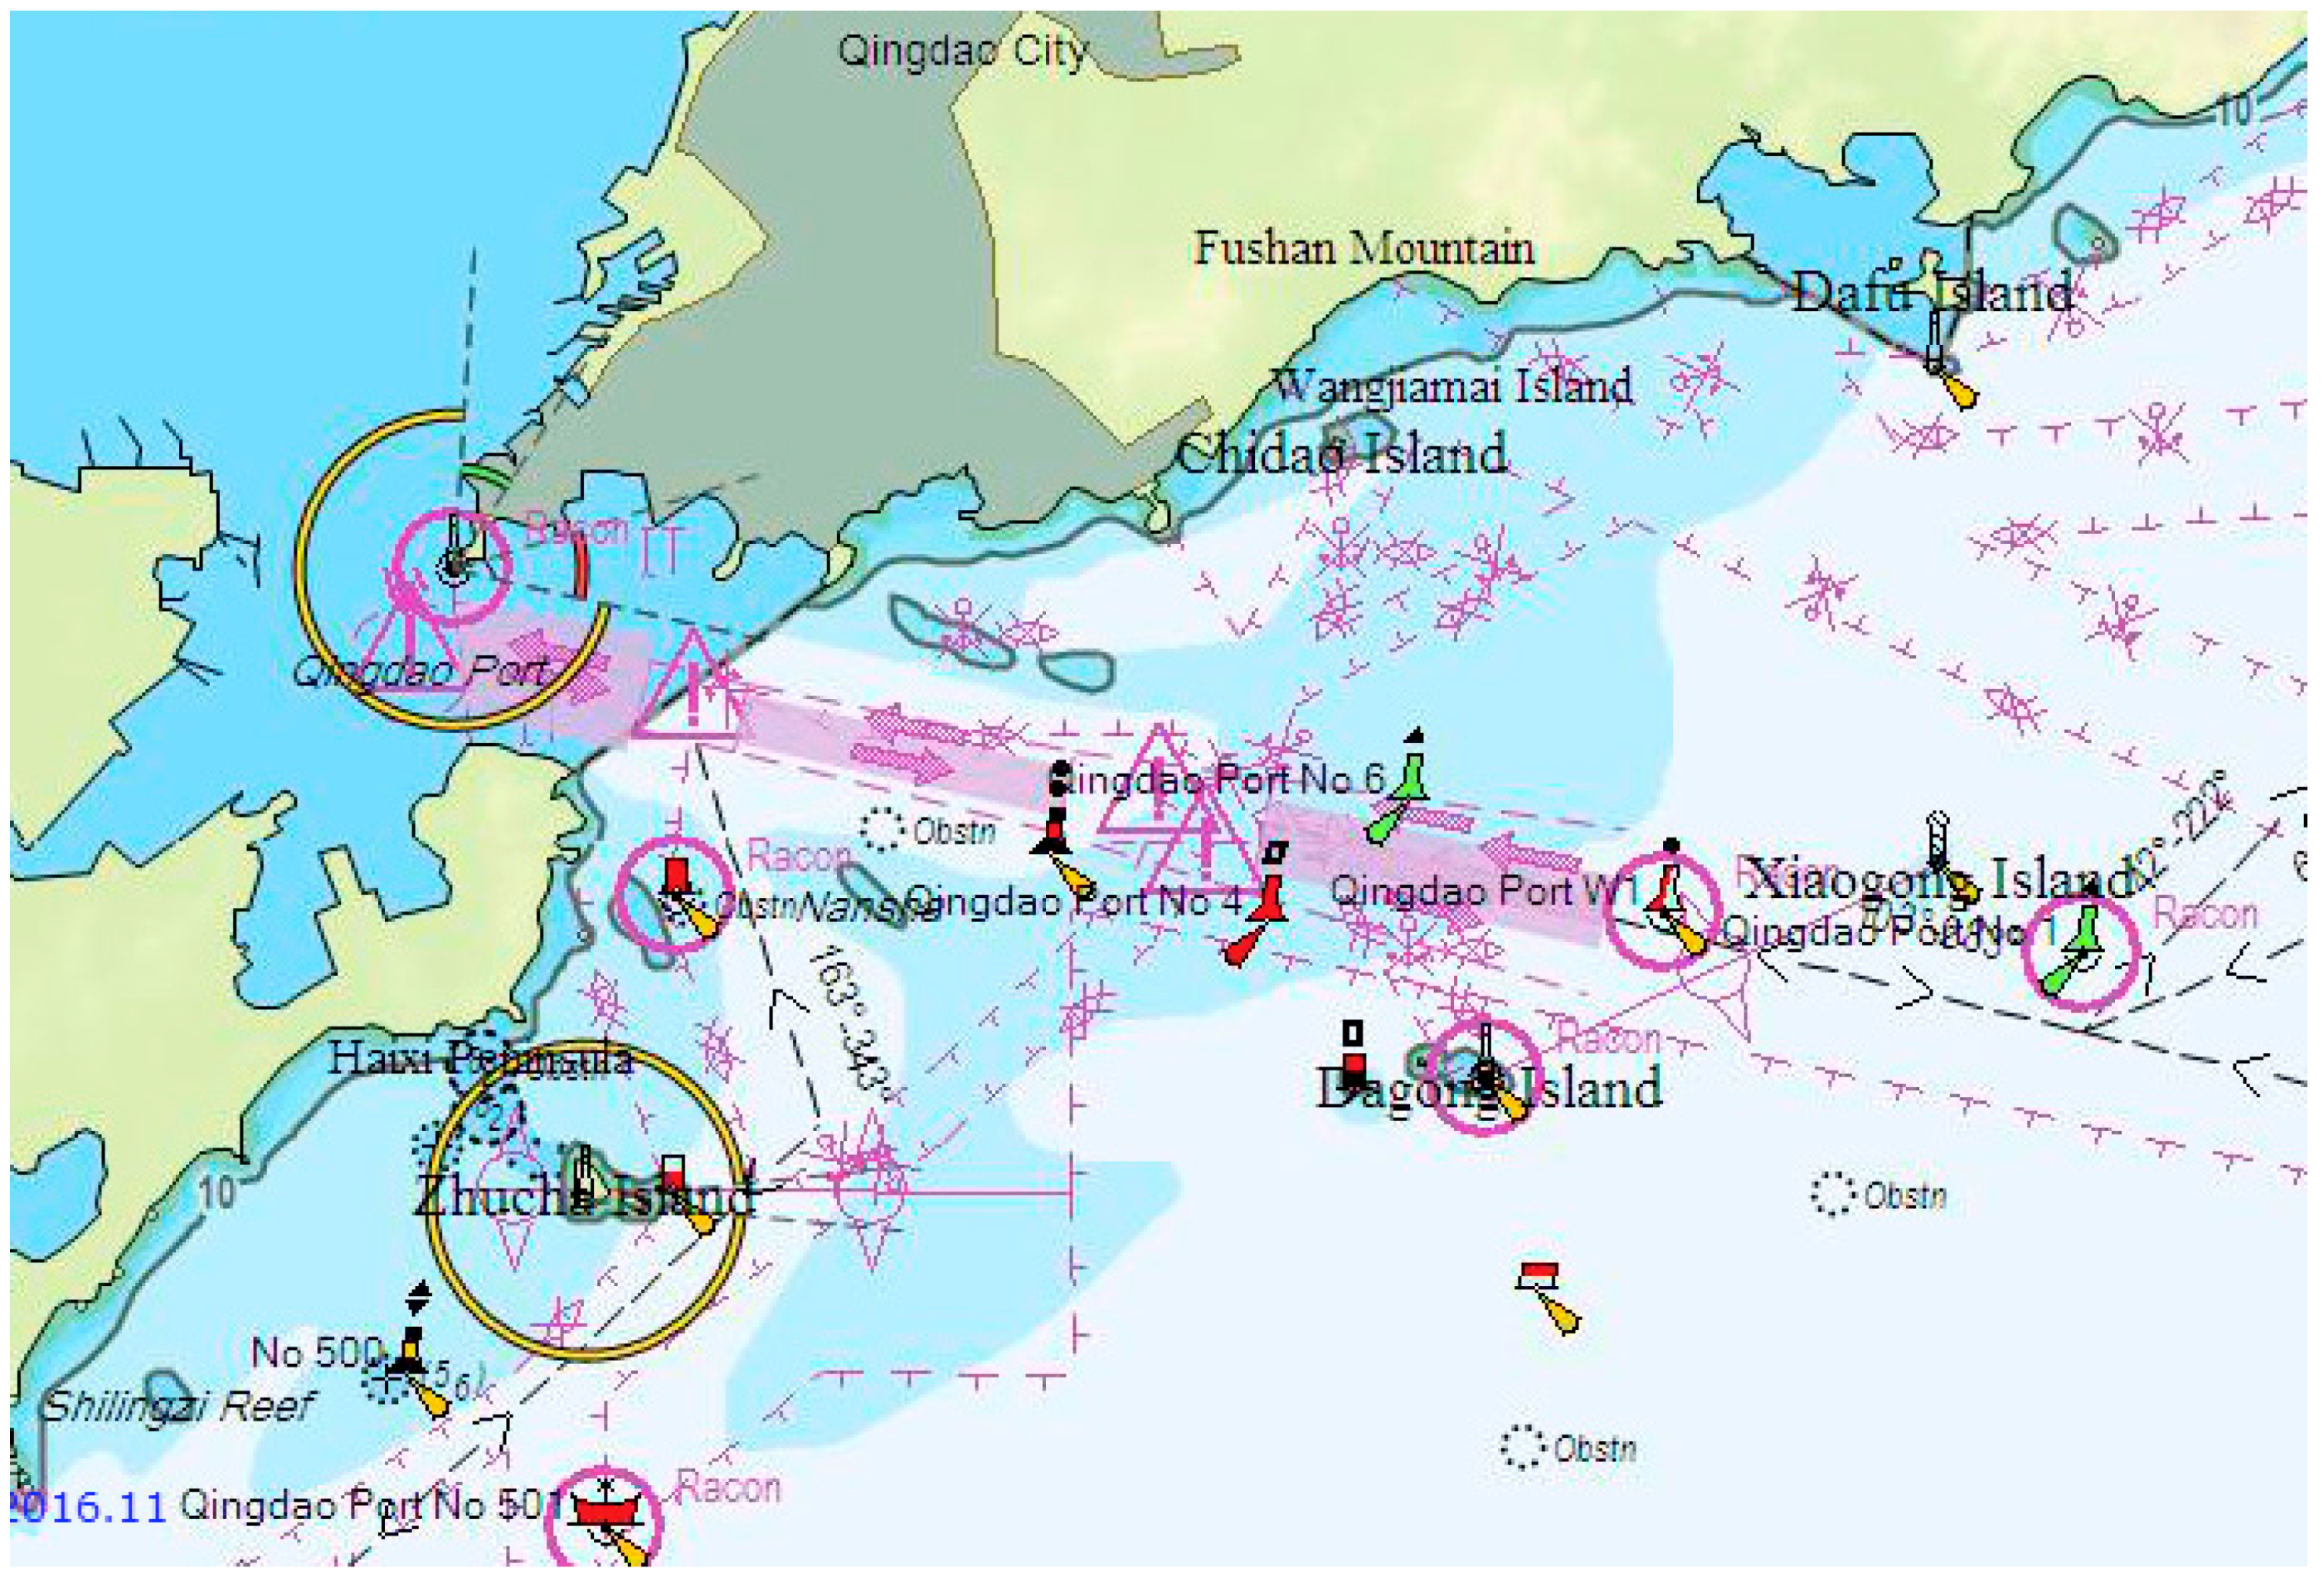
Qingdao port handles a large variety of cargo, including containers, metal ore, coal, petroleum, grains, steel, cars, liquid bulks, dry bulks, and general cargos. Leveraging natural deep-water capacity and industry-leading facilities and equipment, Qingdao port can accommodate the world’s largest container vessels, iron ore vessels, and oil tankers. The waterway of Qingdao port is shown in Figure 1.
3. Bigdata Analysis-Based Methodology
As mentioned in the Introduction section, the annual amount of throughput in the Qingdao port reached up to 500 million tons in 2016, involving 124,880 ships. The data explosion in the stored AIS data poses great difficulty in predicting the vessel emission. Fortunately, the bigdata analysis technology is able to efficiently process huge amounts of datasets [16,17]. The bigdata analysis-based method involves the application of emission factors to a particular ship activity, where an emission factor is a representative value that attempts to relate the emitted quantity with the operational status of the ship’s engines during that activity. The ship activity profile is a breakdown of a ship’s movements into five modes of operation (i.e., cruising, preparing, decelerating, maneuvering, and hotelling).
3.1. The Proposed Emission Prediction Model
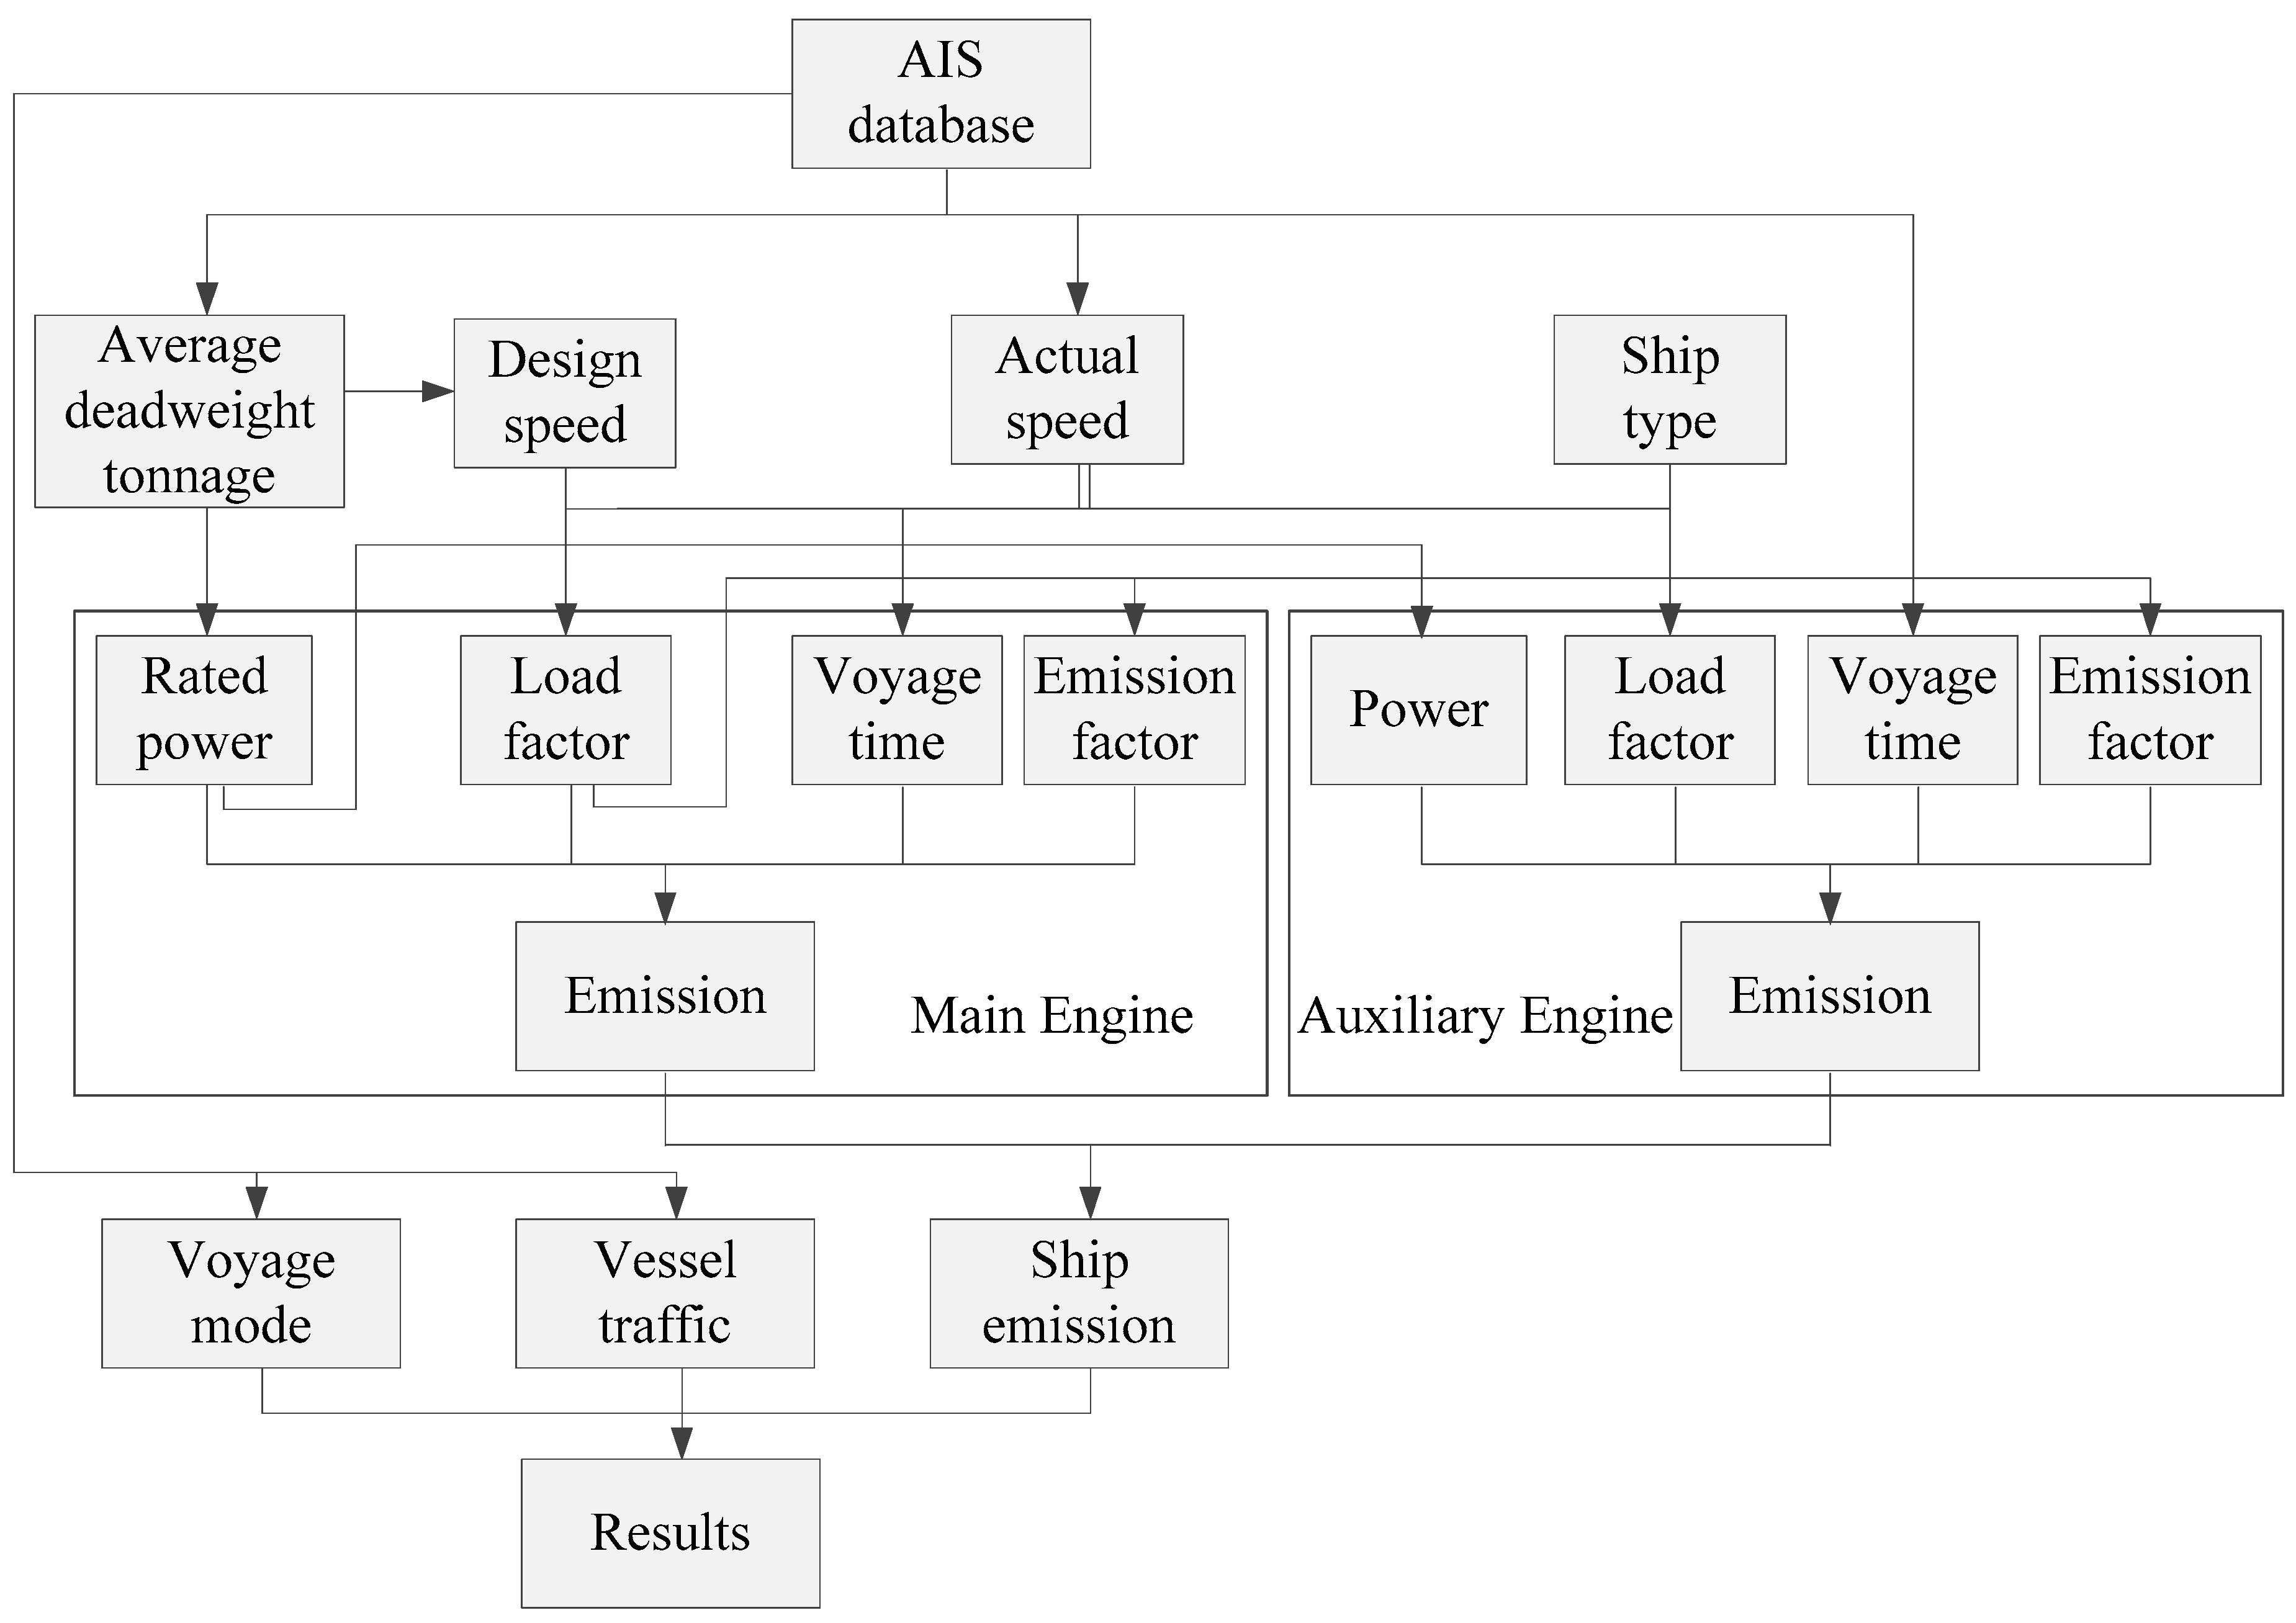
As mentioned before, the exhaust emission amounts generated from vessels can be calculated based on the total amount of bunker fuels during maritime transport, i.e., the shipping activity-based approach. The estimation methodology of ship emissions in the present study is developed using bigdata analysis, which is based on the analysis on a huge amounts of traffic statistics in Qingdao port. The flowchart of the proposed method is shown in Figure 2.
As shown in Figure 2, the operational modes of the vessels in Qingdao port can be categorized into five classes: cruising, preparing, decelerating, maneuvering, and hotelling. The main source of the vessel emissions is from main engine (ME) and generator (auxiliary engine, AE). Neglect the influence of the boiler [12], the emission from vessels in a port can be calculated as
where, Ek is the emission of pollutant specie k; ME denotes main engine and AE denotes auxiliary engine; P is the rated power; LF is the load factor; T is the operational time; EF is the emission factor; i is the ship number; and j is the operation mode.
3.2. Traffic Statistics
According to the 2016 traffic statistics in Qingdao port, the number and average deadweight tonnage (DWT) of cargo ships in different classes (gross tonnage, (GT)) according to vessel type are shown in Table 1. In addition, Table 2 and Table 3 provide the traffic statistics of tugboats and passenger ships, which are counted based on engine power (kW) and passenger capacity, respectively. Thus, the parameters in Equations (1)–(3) can be determined using bigdata analysis using these traffic statistics in Table 1, Table 2 and Table 3.
3.3. Parameter Design
- (a)
- Engine parameter design. More than 98% of sea going ships are equipped with diesel engines as the main power sources [18]. The rated power and design voyage speed are key parameters in the proposed estimation method. Although neither of these two parameters are recorded in AIS information, both of them have close relationships with DWT. Because DWT information is provided by AIS, it is possible to estimate the rated power and design voyage speed through their relationship with DWT. During the building process of a specific ship type, an empirical relationship between the rated power, design voyage speed, and DWT can be obtained based on the basic dimensionalities of the ship. As a result, the empirical relationships of different ship types can be utilized in the proposed model to calculate the estimated rated power and design speed. Xing [19] analyzed the statistics of diesel engine manufactory MAN B&W, the relationship between ME rated power (kW), design voyage speed (Vd/kn), and DWT is shown in Table 4. The liquefied gas and bulk chemical carriers would follow the relationship as oil tanker, while the ro-ro ships would follow the relationship as other cargo ship.
Furthermore, the relationship between ME rated power, design voyage speed, and passenger capacity for passenger ships can only be determined according to the ship configurations. Currently, an empirical formula was used to establish the relationship between these parameters by CCS (China Classification Society), BV (Bureau Veritas), and LR (Lloyd’s Register of Shipping) according to the ship types. Hence, it is very important to determine the types of ships of interest. In order to cluster a huge amount ships into different type groups, the k-Nearest Neighbor clustering was adopted in the bigdata analysis. Then, the LR’s empirical formula [19] was employed to process the grouped ships. It was found that the AE rated power was 24% of ME rated power. Hence, the relationship between AE rated power, design voyage speed, and DWT or passenger capacity can be determined accordingly.
- (b)
- Load factor. The load factor of ME was estimated based on the Propeller Law by Equation (4) [18].where, Va is the actual speed and Vd is the design speed.
For AE, the quantity in use (n) and their load factors (LFAE) for different types of ships under different operation modes are shown in Table 5 [20,21].
- (c)
- Operation time. The operation time is the sailing durations of the ships in different modes. The distances traveled by ships in different modes were defined according to statistics. The actual speed of the ships under a specific operation mode is obtained by averaging the vessel speeds from the route data. The actual speed (Va/kn) and operation time (T/h) in different operation modes are shown in Table 6. The definition of different voyage modes are mainly based on the analysis of AIS data. Currently, when ships enter Qingdao port, they cruise at variable speeds from the open sea area to the berths. The emissions will increase with the increase of speed and with the decrease of load when the engines run at a low load range. The hotelling time is relevant with the port berthing capacity and working efficiency.
- (d)
- Emission factor. In previous studies, the emission factors were assumed as fixed values under different activity modes [13]. This is not realistic in practical application. In order to solve this problem, a more realistic method is developed in this study. Firstly, considering different engine types, different corresponding emission factors are applied. It is assumed that the ship gross tonnage less than 10,000 would employ four-stroke diesel engine as ME, others would employ two-stroke ones. In addition, all of the AE would adopt four-stroke ones. Secondly, the fitting results between emission factors and load factors for both four-stroke engines and two-stroke ones [19] were adopted. As a result, a full range of load factors was considered to produce more accurate emission factors than fixed values.
The ratio of CO2 emission factor to the specific fuel consumption (SFOC) of ME follows the fitting Equations (5) and (6). This equation is derived from the statistics based on the emission testing reports of 54 marine diesel engines from CCS, BV, and LR. All the main engines are tested under four rated load: 25%, 50%, 75%, and 100%, the auxiliary engines are tested under five rated load: 10%, 25%, 50%, 75%, and 100%. The fitting analysis has been conducted based on these testing results, and the fitting formula is shown in Equations (5) and (6).
where a, b, and c are fitting coefficients.
The other emissions for both ME and AE follow the fitting Equation (6).
4. Result and Discussion
Within the framework of the bigdata analysis-based methodology, the emission inventory calculations for Qingdao Port in 2016 were performed. The results of the calculations are presented and the emissions proportions for different ship types are discussed.
4.1. Analysis Results
Table 8 shows the predicted ship emissions inventory in 2016. This is the sum of the emissions in all operation modes. As can be seen in Table 8, the amounts of the ship emissions of NOX, CO, HC, CO2, SO2, and PM2.5 are 30,031.5, 2735.3, 1255.7, 2,347,879.2, 21,711.3, and 1747.1 tons, respectively.
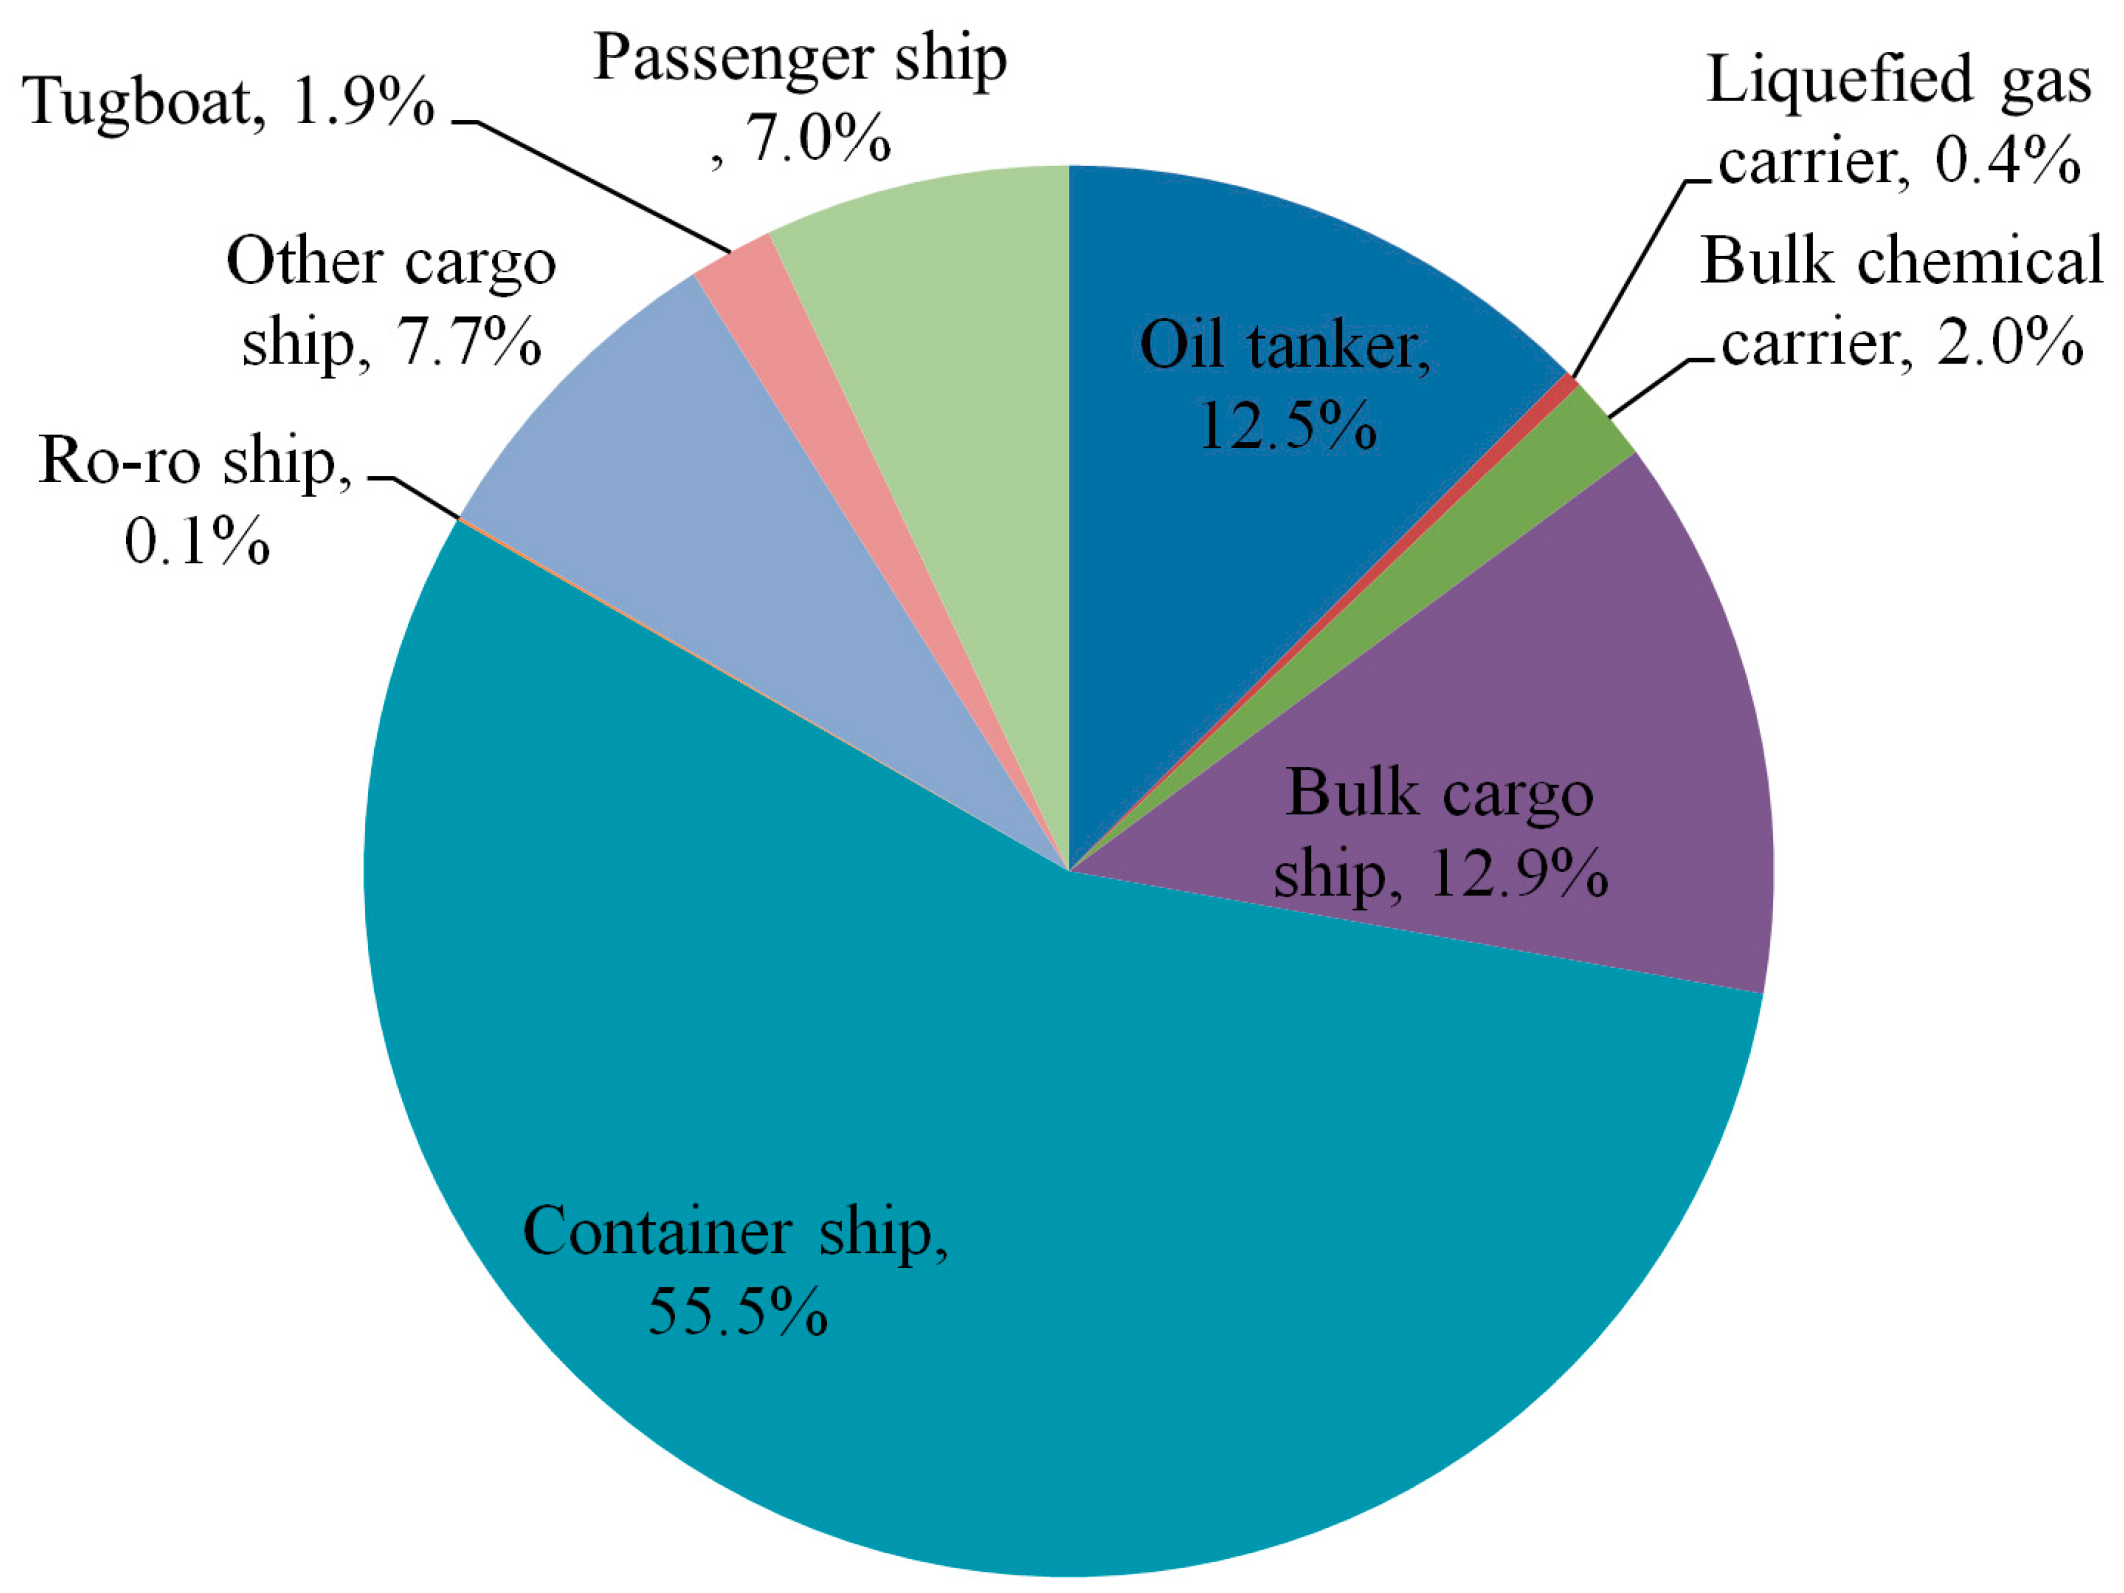
The NOX emission from ships is chosen to discuss the emission share from different type of ships, as shown in Figure 3. Among different ship types, the containers emitted the highest amount of NOX, followed by bulk cargo ships and oil tankers. These three ship types produced more than 80% of the total NOx emissions. This result is consistent with the ship traffic statistics in Table 1.
The Chinese government has announced specific policies to reduce harmful emissions from shipping. Three emission control areas (ECAs) are being established in the Zhujiang (Pearl River), the Yangtze River, and the Bohai Sea [23]. Qingdao port does not belong to any of these three ECAs. The emission inventory was compared between Qingdao ports and other ports in the three ECAs in Table 9.
It can be seen in Table 9 that the calculated emissions in Qingdao port is less than the other three ports. This is probably due to the continuous increase of ships in these three ports. Thanks to the regulation of the sulfur content of fuel oil, the emissions of SO2 and PM2.5 in ECAs are expected to decrease below the current level. Especially, the restriction on the maximum sulfur content, 0.5%of marine fuels, starting from 1 January 2019 in ECAs, will lead to substantial reduction of SO2 and PM2.5 emissions in the near future. It is meaningful for Qingdao port to establish similar control measures.
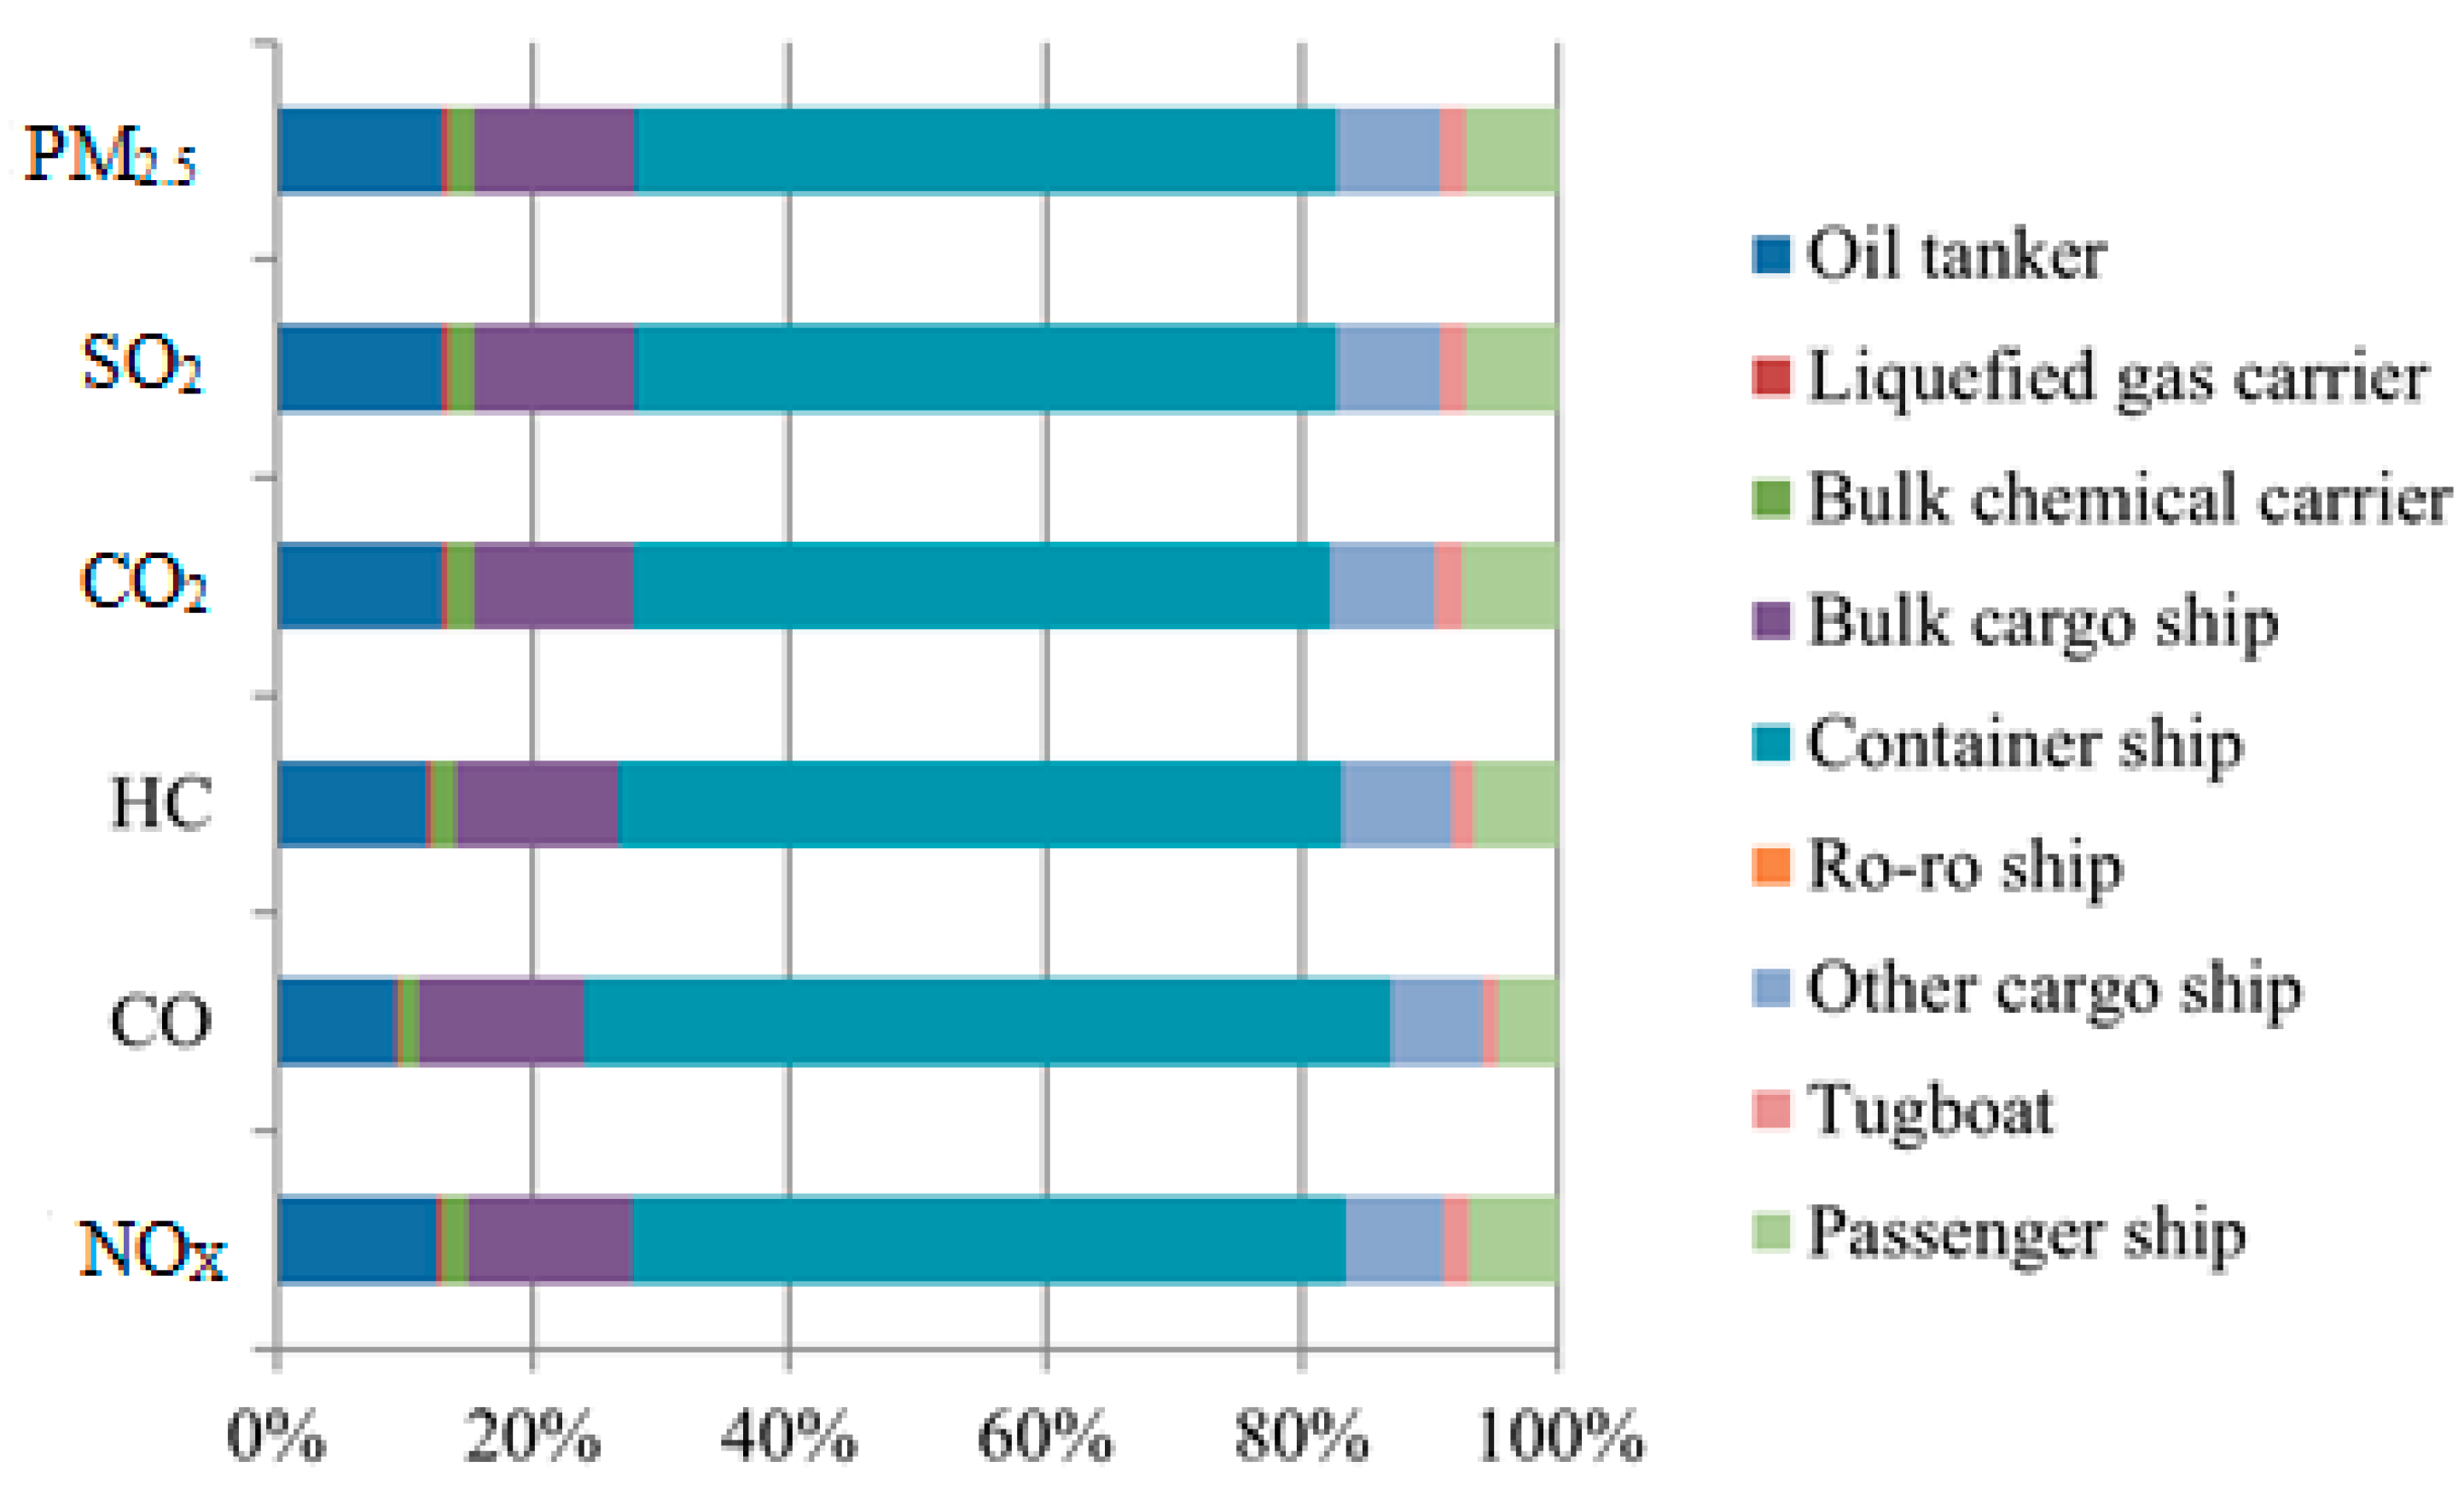
Figure 4 shows the exhaust emissions of different ship types. Emissions from vessels in Qingdao port are dominated by container ships, oil tankers, and bulk cargo ships. Significant emissions from these ships are associated with large total ship capacity and high engine power. The emission characteristics in terms of ship types are slightly different from the other region ports with a higher percentage of container ships. This result is consistent with the factor that Qingdao port is ranked as one top international container ports.
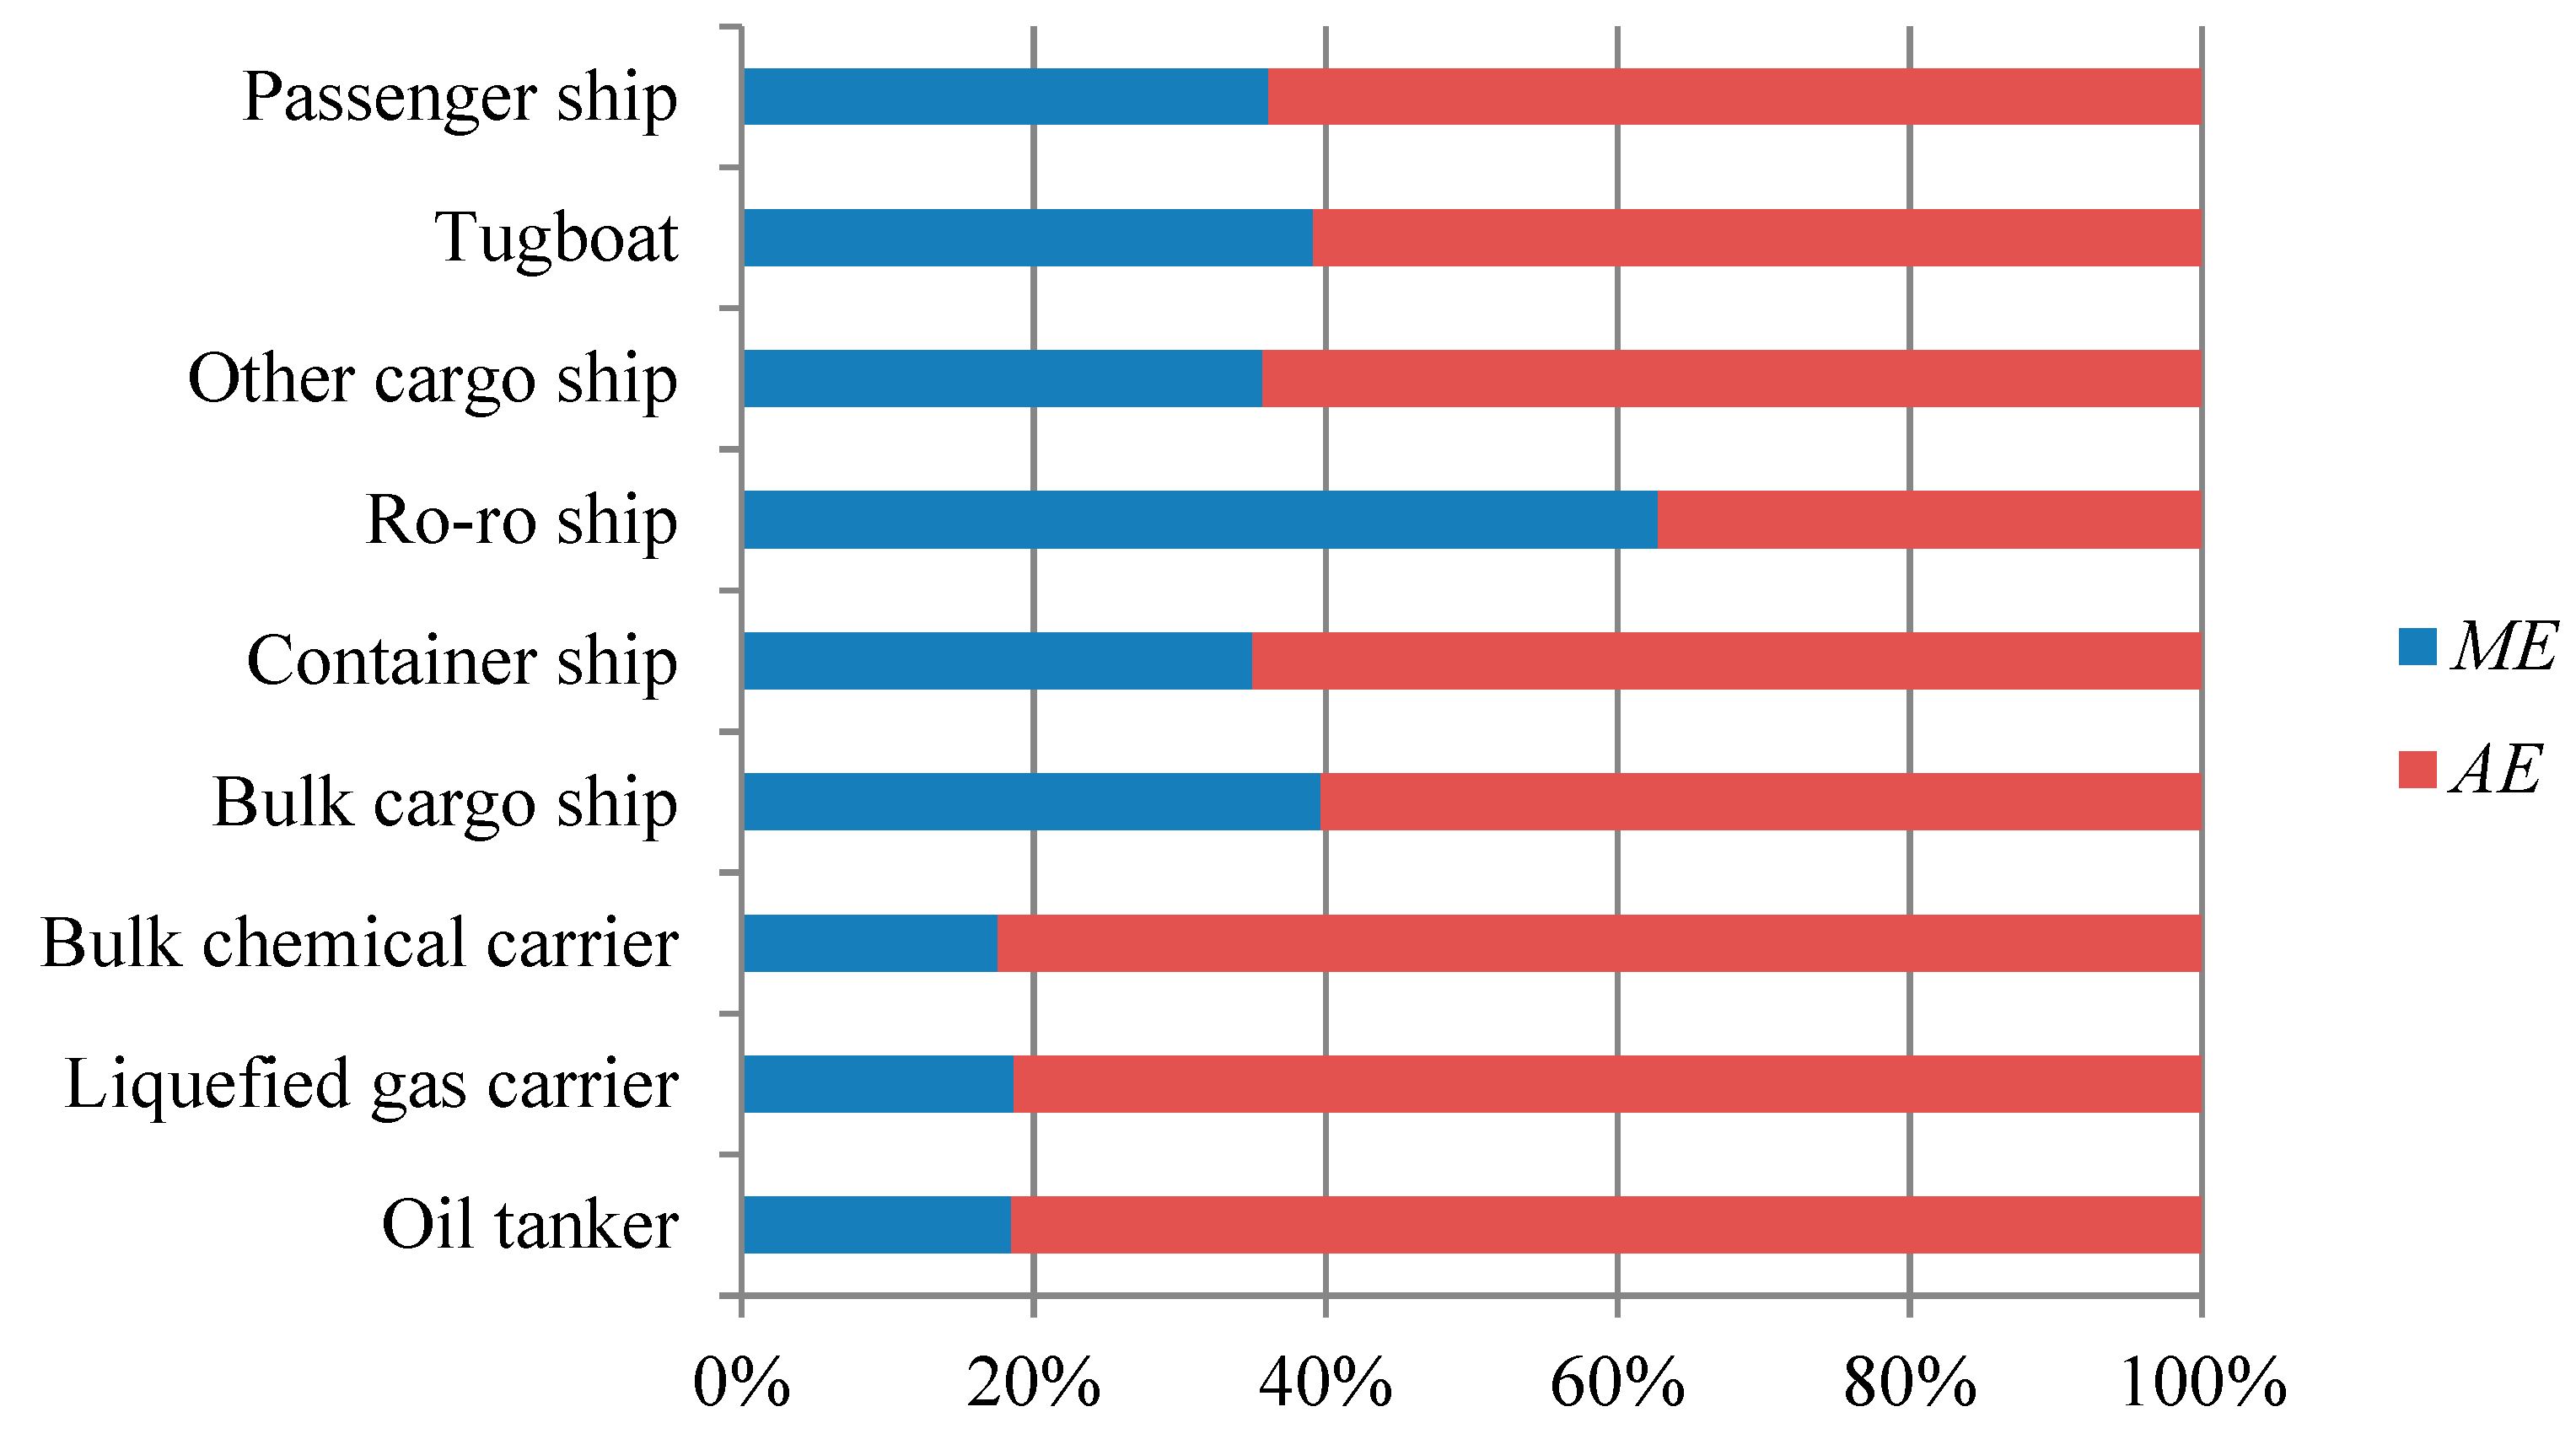
Figure 5 depicts the ship emissions shares of MEs and AEs. In general, the amount of ME emissions is less than that of AE emissions. The ME is turned off when a ship is hotelling at berth during cargo handling, and the AEs are then the dominant contributors in all emissions. The long-time berthing brought about the high portion of AE emissions. The widely adoption of shore power and efficient cargo handling would help reduce AE emissions.
4.2. Uncertainty Analysis
Previous qualitative studies indicated that the uncertainties of ship emissions were mainly introduced by time-in-mode, load factor, and emission factor [26,27]. In this study, the uncertainties of the emission inventory from vessel in Qingdao port in 2016 were mainly from the following aspects.
- (1)
- Traffic statistics. The traffic statistics of 2016 from Qingdao port authorities could only include merchant ships, while the naval vessels and fishing boats were excluded. This would bring the main uncertainty.
- (2)
- Rated power. The rated power estimation of ships was based on the study of MAN diesel engine relationship. The estimation results would be influenced by the representation and volume of sample data.
- (3)
- Load factor and emission factor. Both of the factors in this work were referenced to relevant research results at home and abroad. The difference of ship types, activity characteristics, and fuel types in different studies would incur uncertainty.
5. Conclusions
As one of the busiest container ports of China, Qingdao port produces significant emissions inventory. A bigdata-based method is proposed to predict the exhaust emissions in Qingdao port. Historical data was used to learn and analyze the parameters of the prediction model. The research results demonstrate that the amounts of the ship emissions of NOX, CO, HC, CO2, SO2, and PM2.5 are 30,031.5, 2735.3, 1255.7, 2,347,879.2, 21,711.3, and 1747.1 tons, respectively. And the emissions are dominated by container ships, oil tankers, and bulk cargo ships. The comparison between Qingdao port and three ports in ECAs indicates the necessity to establish effective control measures in Qingdao port. Besides sulfur content control, the adoption of shore power and efficient cargo handling seems to be a feasible strategy to reduce emissions and protect environmental pollution in Qingdao port. Furthermore, because in the present uncertainty analysis, only the feasibility of the proposed method is evaluated, improving the reliability of AIS data and the accuracy of emission factors is our further research plan. In addition, the influence of different policy and technical methods aiming at mitigating marine emissions will be investigated using this newly proposed mode to provide theory basis for maritime management. It is also interesting to use other Machine Learning algorithms and compare the results.
Author Contributions
Z.T. and R.M. conceived and designed the experiments; X.S. performed the experiments; X.S. and Z.T. wrote the paper; X.S., Z.T. and Z.L. analyzed the data.
Acknowledgments
We would also like to show our gratitude to the anonymous reviewers for their insightful comment on reviewing the manuscript. This research is funded by the National Natural Sciences Foundation of China (NSFC) (No. 51709244, 51505474) and UOW VC Fellowship.
Conflicts of Interest
The authors declare no conflict of interest.
References
- Tian, Z.; Liu, F.; Li, Z.; Malekian, R.; Xie, Y. The development of key technologies in applications of vessels connected to the internet. Symmetry 2017, 9, 211. [Google Scholar] [CrossRef]
- He, W.; Li, Z.; Malekian, R.; Liu, X.; Duan, Z. An internet of things approach for extracting featured data using AIS database: An application based on the viewpoint of connected ships. Symmetry 2017, 9, 186. [Google Scholar] [CrossRef]
- Qiao, B.; He, W.; Tian, Y.; Liu, Y.; Cai, O.; Li, Y. Ship emission reduction effect evaluation of air pollution control countermeasures. Transp. Res. Procedia 2017, 25, 3610–3622. [Google Scholar] [CrossRef]
- Huang, L.; Wen, Y.; Geng, X.; Zhou, C.; Xiao, C.; Zhang, F. Estimation and spatio-temporal analysis of ship exhaust emission in a port area. Ocean Eng. 2017, 140, 401–411. [Google Scholar] [CrossRef]
- Glowacz, A. Fault diagnosis of single-phase induction motor based on acoustic signals. Mech. Syst. Signal Process. 2019, 117, 65–80. [Google Scholar] [CrossRef]
- Yuan, Y.; Li, Z.; Malekian, R.; Yan, X. Analysis of the operational ship energy efficiency considering navigation environmental impacts. J. Mar. Eng. Technol. 2017, 16, 150–159. [Google Scholar] [CrossRef]
- Corbett, J.; Koehler, H. Updated emissions from ocean shipping. J. Geophys. Res. Atmos. 2013, 108, D20. [Google Scholar] [CrossRef]
- Glowacz, A.; Witold, G.; Zygfryd, G.; Jaroslaw, K. Early fault diagnosis of bearing and stator faults of the single-phase induction motor using acoustic signals. Measurement 2018, 113, 1–9. [Google Scholar] [CrossRef]
- Jalkanen, J.; Brink, A.; Kalli, J.; Pettersson, H. A modelling system for the exhaust emissions of marine traffic and its application in the baltic sea area. Atmos. Chem. Phys. 2009, 9, 9209–9223. [Google Scholar] [CrossRef]
- Tzannatos, E. Ship emissions and their externalities for the port of Piraeus–Greece. Atmos. Environ. 2010, 44, 400–407. [Google Scholar] [CrossRef]
- Deniz, C.; Kilic, A.; Cıvkaroglu, G. Estimation of shipping emissions in Candarli Gulf, Turkey. Environ. Monit. Assess. 2010, 171, 219. [Google Scholar] [CrossRef] [PubMed]
- Yau, P.; Lee, S.; Corbett, J.; Wang, C.; Cheng, Y.; Ho, K. Estimation of exhaust emission from ocean-going vessels in Hong Kong. Sci. Total Environ. 2012, 431, 299–306. [Google Scholar] [CrossRef] [PubMed]
- Chen, D.; Zhao, Y.; Nelson, P.; Li, Y.; Wang, X.; Zhou, Y.; Lang, J.; Guo, X. Estimating ship emissions based on AIS data for port of Tianjin, China. Atmos. Environ. 2016, 145, 10–18. [Google Scholar] [CrossRef]
- Chang, Y.T.; Kim, E.; Jo, A.; Park, H. Estimating socio-economic impact from ship emissions at the port of Incheon. J. Int. Logist. Trade 2017, 15, 1–7. [Google Scholar] [CrossRef]
- Kontos, S.; Liora, N.; Poupkou, A.; Giannaros, C.; Garane, A.; Melas, D. Air-Quality Impact of Cruise and Passenger Ship Emissions in the Port of Thessaloniki. In Perspectives on Atmospheric Sciences; Karacostas, T., Bais, A., Nastos, P., Eds.; Springer: Thessaloniki, Greece, 2016. [Google Scholar]
- Labrinidis, A.; Jagadish, H. Challenges and opportunities with big data. Proc. VLDB Endow. 2012, 5, 2032–2033. [Google Scholar] [CrossRef] [Green Version]
- Sandryhaila, A.; Moura, J. Big data analysis with signal processing on graphs: Representation and processing of massive data sets with irregular structure. IEEE Signal Process. Mag. 2014, 31, 80–90. [Google Scholar] [CrossRef]
- Li, Z.; Jiang, Y.; Guo, Q.; Hu, C.; Peng, Z. Multi-dimensional variational mode decomposition for bearing-crack detection in wind turbines with large driving-speed variations. Renew. Energy 2018, 116, 55–73. [Google Scholar] [CrossRef]
- Xing, H.; Duan, S.; Huang, L.; Wu, Z. Estimation of exhaust emissions from sea-going vessels in near port areas of Liaoning province. Res. Environ. Sci. 2016, 29, 29–35. [Google Scholar]
- IMO. Second IMO GHG Study; International Maritime Organization: London, UK, 2009. [Google Scholar]
- IMO. Guidelines on the Method of Calculation of the Attained Energy Efficiency Design Index (EEDI) for New Ships. Available online: http://www.imo.org/en/OurWork/Environment/PollutionPrevention/AirPollution/Pages/Technical-and-OOperationa-Measures.aspx (accessed on 27 September 2018).
- US EPA. Regulatory Impact Analysis: Control of Emissions of Air Pollution from Category 3 Marine Diesel Engines; EPA-420-R-09-019; Environmental Protection Agency: California, CA, USA, 2009.
- Qin, Z.; Yin, J.; Cao, Z. Evaluation of effects of ship emissions control areas: Case study of Shanghai Port in China. Trans. Res. Rec. 2017, 2611, 50–55. [Google Scholar] [CrossRef]
- Fu, Q.; Shen, Y.; Zhang, J. On the ship pollutant emission inventory in shanghai port. J. Saf. Environ. 2012, 12, 57–64. [Google Scholar]
- Yang, J.; Yin, P.; Ye, S.; Wang, S.; Zheng, J.; Ou, J. Marine emission inventory and its temporal and spatial characteristics in the city of Shenzhen. Environ. Sci. 2015, 36, 1217–1226. [Google Scholar]
- Yang, D.; Kwan, S.; Lu, T.; Fu, Q.; Cheng, J.; Streets, D.; Wu, Y.; Li, J. An emission inventory of marine vessels in Shanghai in 2003. Environ. Sci. Technol. 2007, 41, 5183–5190. [Google Scholar] [CrossRef] [PubMed]
- Ng, S.; Loh, C.; Lin, C.; Booth, V.; Chan, J.; Yip, A.; Li, Y.; Lau, A. Policy change driven by an AIS-assisted marine emission inventory in Hong Kong and the Pearl River Delta. Atmos. Environ. 2013, 76, 102–112. [Google Scholar] [CrossRef]
Figure 1.
The waterway of Qingdao port.

Figure 2.
The flowchart of the proposed method.

Figure 3.
NOX emissions proportions for different ship types.

Figure 4.
Emissions of different ship types.

Figure 5.
Ship emissions shares of MEs and AEs.


Table 1.
Traffic statistics of cargo ships in Qingdao port, 2016.
| Type | Number of Ships under Specific DWT (t) | ||||||
|---|---|---|---|---|---|---|---|
| <499 | 500–999 | 1000–2999 | 3000–9999 | 10,000–49,999 | >50,000 | ||
| Oil tanker | Number | 1421 | 4 | 3059 | 1158 | 398 | 805 |
| /t | 792 | 1141 | 3286 | 7940 | 42,573 | 238,393 | |
| Liquefied gas carrier | Number | NA | NA | 38 | 80 | 2 | 61 |
| /t | NA | NA | 2555 | 4670 | 16,988 | 89,510 | |
| Bulk chemical carrier | Number | 50 | 13 | 482 | 722 | 178 | 16 |
| /t | 938 | 1519 | 3251 | 7657 | 45,519 | 96,007 | |
| Bulk cargo ship | Number | 26 | NA | 1571 | 1440 | 3599 | 1404 |
| /t | 952 | NA | 4561 | 11,976 | 44,004 | 314,271 | |
| Container ship | Number | NA | 1572 | 958 | 4140 | 5416 | 4515 |
| /t | NA | 1122 | 2591 | 10,635 | 33,629 | 108,619 | |
| Ro-ro ship | Number | NA | NA | NA | 4 | 14 | 80 |
| /t | NA | NA | NA | 13,237 | 12,557 | 21,567 | |
| Other cargo ship | Number | 738 | 40 | 4280 | 3146 | 1289 | 7 |
| /t | 735 | 944 | 4346 | 7618 | 29,891 | 207,254 | |
Table 2.
Traffic statistics of tugboat in Qingdao port, 2016.
| Average Engine Power (KW) | 3418 | 4773 | 5325 | 10,915 |
| Number | 18,523 | 77 | 1839 | 8 |
Table 3.
Traffic statistics of passenger ships in Qingdao port, 2016.
| Passenger Capacity (Person) | <19 | 20–29 | 30–49 | 50–59 | >100 |
| Number | 4 | 8 | 54 | 60,035 | 1777 |
Table 4.
The relationship between the rated power, design speed, and DWT.
| Ship Type | DWT | PME/kW | Vd/kn |
|---|---|---|---|
| Oil tanker | <6 × 10⁴ | ||
| >6 × 10⁴ | 25 | ||
| Bulk cargo ship | <2 × 10⁴ | ||
| >2 × 10⁴ | 15.5 | ||
| Container ship | <3 × 10⁴ | ||
| >3 × 10⁴ | 14.5 | ||
| Other cargo ship | NA |
Table 5.
AE load factors under different operating conditions.
| Type | Cruising | Preparing | Decelerating | Maneuvering | Hotelling | |||||
|---|---|---|---|---|---|---|---|---|---|---|
| n | LFAE | n | LFAE | n | LFAE | n | LFAE | n | LFAE | |
| Oil tanker | 1 | 0.6 | 2 | 0.4 | 2 | 0.4 | 2 | 0.7 | 2 | 0.7 |
| Bulk cargo ship | 1 | 0.6 | 2 | 0.4 | 2 | 0.4 | 2 | 0.7 | 1 | 0.4 |
| Container ship | 1 | 0.6 | 2 | 0.4 | 2 | 0.4 | 2 | 0.7 | 1 | 0.4 |
| Ro-ro/passenger | 2 | 0.8 | 3 | 0.6 | 3 | 0.6 | 3 | 0.8 | 2 | 0.7 |
| Other cargo ship | 1 | 0.6 | 2 | 0.4 | 2 | 0.4 | 2 | 0.7 | 1 | 0.4 |
Table 6.
The actual speed and operation time in different operation modes.
| Type | Cruising | Preparing | Decelerating | Maneuvering | Hotelling | ||||
|---|---|---|---|---|---|---|---|---|---|
| Va | T | Va | T | Va | T | Va | T | T | |
| Oil tanker | Vd | 20/Vd | Vd | 12/Vd | 8 | 1.5 | 4 | 1.0 | 24 |
| Bulk cargo ship | Vd | 20/Vd | Vd | 12/Vd | 6 | 2.0 | 4 | 1.0 | 32 |
| Container ship | Vd | 20/Vd | Vd | 12/Vd | 6 | 2.0 | 4 | 1.0 | 32 |
| Ro-ro/passenger | Vd | 20/Vd | Vd | 12/Vd | 8 | 1.5 | 4 | 0.8 | 6 |
| Other cargo ship | Vd | 20/Vd | Vd | 12/Vd | 6 | 2.0 | 4 | 1.0 | 32 |
| Tugboat | NA | NA | NA | NA | NA | NA | Vd | 1.0 | NA |
Va- actual speed, Vd- design speed, T- operation time.
Table 7.
The fitting coefficients for emission factors.
| Item. | Coefficient | ME | AE | |
|---|---|---|---|---|
| Two Stroke | Four Stroke | Four Stroke | ||
| EFNOx | a | 10.738 | 7.271 | 7.365 |
| b | 0.187 | 0.351 | 0.108 | |
| EFCO | a | 0.359 | 0.391 | 0.347 |
| b | 1.103 | 0.555 | 0.861 | |
| EFHC | a | 0.200 | 0.274 | 0.256 |
| b | 0.201 | 0.169 | 0.639 | |
| EFCO2 | a | 140.284 | 221.780 | 611.927 |
| b | 195.459 | 337.642 | 0.217 | |
| c | 599.301 | 767.041 | NA | |
| SFOC | a | 45.752 | 67.844 | 194.571 |
| b | 64.785 | 130.201 | 0.222 | |
| c | 190.695 | 242.725 | NA | |
Table 8.
Ship emission inventory in Qingdao port, 2016 (ton).
| NOX | CO | HC | CO2 | SO2 | PM2.5 | |
|---|---|---|---|---|---|---|
| Oil tanker | 3751.7 | 256.0 | 147.3 | 304,455.5 | 2824.3 | 227.3 |
| Liquefied gas carrier | 122.0 | 8.4 | 4.8 | 9828.3 | 91.3 | 7.3 |
| Bulk chemical carrier | 591.9 | 39.0 | 23.8 | 49,119.0 | 453.6 | 36.5 |
| Bulk cargo ship | 3878.0 | 352.7 | 159.6 | 290,243.6 | 2698.9 | 217.2 |
| Container ship | 16,672.5 | 1720.7 | 707.7 | 1,275,197.5 | 11,880.8 | 956.0 |
| Ro-ro ship | 22.2 | 2.5 | 0.7 | 1459.9 | 13.6 | 1.1 |
| Other cargo ship | 2308.0 | 193.9 | 106.6 | 192,812.5 | 1755.1 | 141.2 |
| Tugboat | 581.9 | 33.1 | 22.2 | 49,797.4 | 14,258.0 | 418.1 |
| Passenger ship | 2103.3 | 128.9 | 83.0 | 174,965.5 | 1575.6 | 126.8 |
| Sum | 30,031.5 | 2735.3 | 1255.7 | 2,347,879.2 | 21,711.3 | 1747.1 |
Table 9.
A comparison of ship emissions of Qingdao port and other ports in the three emission control areas (ECA).
Table 9.
A comparison of ship emissions of Qingdao port and other ports in the three emission control areas (ECA).
| Port | NOX | CO | HC | CO2 | SO2 | PM2.5 |
|---|---|---|---|---|---|---|
| Qingdao (2016) | 30,032 | 2735 | 1256 | 2,347,879 | 21,711 | 1747 |
| Shanghai (2010) [24] | 57,300 | 4900 | 2100 | 2,885,500 | 35,400 | 3700 |
| Tianjin (2014) [13] | 41,300 | 3570 | 1720 | NA | 29,300 | 3720 |
| Shenzhen (2010) [25] | 23,300 | 2200 | 1100 | NA | 13,600 | 1700 |
© 2018 by the authors. Licensee MDPI, Basel, Switzerland. This article is an open access article distributed under the terms and conditions of the Creative Commons Attribution (CC BY) license (http://creativecommons.org/licenses/by/4.0/).
Share and Cite
MDPI and ACS Style
Sun, X.; Tian, Z.; Malekian, R.; Li, Z. Estimation of Vessel Emissions Inventory in Qingdao Port Based on Big data Analysis. Symmetry 2018, 10, 452. https://doi.org/10.3390/sym10100452
AMA Style
Sun X, Tian Z, Malekian R, Li Z. Estimation of Vessel Emissions Inventory in Qingdao Port Based on Big data Analysis. Symmetry. 2018; 10(10):452. https://doi.org/10.3390/sym10100452
Chicago/Turabian StyleSun, Xing, Zhe Tian, Reza Malekian, and Zhixiong Li. 2018. "Estimation of Vessel Emissions Inventory in Qingdao Port Based on Big data Analysis" Symmetry 10, no. 10: 452. https://doi.org/10.3390/sym10100452
Note that from the first issue of 2016, this journal uses article numbers instead of page numbers. See further details here.