Highly Resolved Rainfall-Runoff Simulation of Retrofitted Green Stormwater Infrastructure at the Micro-Watershed Scale


SEE-URBAN-WATER Research Group, Section of Ecological Engineering, Institute of Applied Geosciences, Technical University of Darmstadt, Schnittspahnstraße 9, 64287 Darmstadt, Germany
*
Author to whom correspondence should be addressed.
Land 2020, 9(9), 339; https://doi.org/10.3390/land9090339
Submission received: 28 August 2020
/
Revised: 11 September 2020
/
Accepted: 21 September 2020
/
Published: 22 September 2020
(This article belongs to the Section Urban Contexts and Urban-Rural Interactions)
Abstract
:Green Stormwater Infrastructure (GSI), a sustainable engineering design approach for managing urban stormwater runoff, has long been recommended as an alternative to conventional conveyance-based stormwater management strategies to mitigate the adverse impact of sprawling urbanization. Hydrological and hydraulic simulations of small-scale GSI measures in densely urbanized micro watersheds require high-resolution spatial databases of urban land use, stormwater structures, and topography. This study presents a highly resolved Storm Water Management Model developed under considerable spatial data constraints. It evaluates the cumulative effect of the implementation of dispersed, retrofitted, small-scale GSI measures in a heavily urbanized micro watershed of Costa Rica. Our methodology includes a high-resolution digital elevation model based on Google Earth information, the accuracy of which was sufficient to determine flow patterns and slopes, as well as to approximate the underground stormwater structures. The model produced satisfactory results in event-based calibration and validation, which ensured the reliability of the data collection procedure. Simulating the implementation of GSI shows that dispersed, retrofitted, small-scale measures could significantly reduce impermeable surface runoff (peak runoff reduction up to 40%) during frequent, less intense storm events and delay peak surface runoff by 5–10 min. The presented approach can benefit stormwater practitioners and modelers conducting small scale hydrological simulation under spatial data constraint.
1. Introduction
Stormwater runoff has traditionally been considered as an undesirable product, managed to be removed as quickly as possible via man-made stormwater runoff conveyance systems to downstream waterbodies or treatment facilities [1,2]. These practices have altered the natural hydrology of urban water bodies and rivers [3]. The increase in impervious surfaces, due to sprawling urbanization, has caused higher stormwater runoff peaks, faster occurrence of runoff peaks and increased total volume of runoff [4,5]. Even for less intense, frequent storm events, streams adjacent or downstream to urban catchments are increasingly becoming vulnerable to urban flooding, soil erosion, and water quality degradation due to the discharge of runoff onto these streams through the stormwater sewer outfalls [6]. The efficient and rapid conveyance of piped stormwater structures has further amplified these adverse impacts on urban streams [4,5,7]. In consequence, new, innovative, and sustainable approaches to handle urban stormwater are needed.
In recent years, urban stormwater management practitioners have increasingly adopted the concept of Green Infrastructure (GI) to mitigate the adverse effects of urbanization [8]. GI refers to an interconnected network of natural areas and other open spaces that provide beneficial ecosystem services for the human population [9]. Green Stormwater Infrastructure (GSI) is a subset of GI, implemented throughout urban areas to slow down, clean, infiltrate and capture urban runoff and precipitation, thus reducing water pollution and flooding of urban rivers as well as replenishing local aquifers.
GSI elements approach urban stormwater management differently in comparison to conventional stormwater conveyance infrastructure such as storm sewers, inlet drains, or manholes. Conventional methods tend to transfer stormwater runoff off-site and into the storm drains as fast as possible, while GSI aims to do just the opposite—keep as much water on-site as possible for infiltration, evaporation, and absorption. Hence, conveyance systems become less important in GSI while porous surfaces and areas to infiltrate, temporarily store and evaporate stormwater are increased.
Although a significant amount of literature documents the effectiveness of GSI elements in urban environments [10,11,12], most of these efforts are reserved to areas in early stages of development and with plenty of available space. Computer modeling and simulation of these elements seems to be the only way to evaluate their efficacy in a larger temporal scale and in already developed urban areas [13]. A variety of computer models and tools are available to simulate GSI elements in urban areas [14,15]. The Storm Water Management Model (SWMM) is one of those models which can be used in any geographic region if particular data are provided [16]. This software was found to be one of the most suitable tools for the simulation of GSI elements by several studies [14,15,17,18] which performed a comparative analysis of most used urban hydrological modeling and simulation tools.
Since GSI elements rely on small-scale hydrological processes to handle urban stormwater runoff, urban hydrology models such as SWMM require highly resolved input data to accurately simulate flow patterns through urban drainage networks [19], including rainfall, topography, soil, land use and land cover data and stormwater network configuration. To account for the spatial variability of these parameters, catchments are divided into smaller areas. This process is called model discretization. Several studies have examined the effect of spatial resolution of input data on SWMM model performance and concluded that the level of resolution has a significant impact on both simulation and parameterization results [20,21,22,23,24,25]. A highly resolved urban drainage model can clearly integrate changes in surface covers at a finer scale allowing for better assessment of the stormwater runoff reduction potential of decentralized small scale GSI elements [21].
Furthermore, such a highly resolved model is required to simulate the performance of retrofitted GSI measures. Retrofitting refers to the installation of GSI elements in developed areas where stormwater infrastructure already exists to a certain degree. To avoid subverting the existing system, the stormwater structures must be accurately represented in the hydrological model. Recent studies related to retrofitted GSI measures in urban developments have recognized the lack of detailed information about the existing drainage system as the main obstacle in modeling and implementation [26,27,28].
Due to the increasing level of urbanization, stormwater managers face many difficulties in finding the necessary space for the installation of appropriate GSI measures [29]. In such consolidated urban watersheds with limited space, small scale distributed GSI measures have proved to be very effective in obtaining the benefits of sustainable stormwater management [29,30]. Moreover, a well distributed placement of GSI measures throughout a whole urban catchment is also beneficial to reduce the total stormwater runoff load onto the urban streams. A highly resolved model is thus necessary to capture the net performance of such small scale distributed GSI measures, since lumped model structure with lower spatial resolution and incomplete drainage network data is simply inadequate to describe surface flow patterns through them [21,25]. In areas where the availability of related databases is inaccessible or non-existent, an advantage of such models is the reduction in the calibration effort [20], which implies a less detailed modelling approach.
Our spatial discretization method is based on the approaches proposed by Lee et al. [20] and Silva et al. [31]. Those studies present a comprehensive and detailed representation of surface runoff patterns and a clear simulation of areas with different degrees of permeability within urban watersheds. Moreover, they consider the spatial variability of the topography and land cover. Lee et al. [20] used high resolution surface topography data and the location of storm sewer inlets to manually delineate the subcatchments. The different types of land cover were identified using high resolution aerial photographs, and subsequently employed them to derive area-weighted parameter values. Similarly, Silva et al. [31] divided the study area into subcatchments depending on the individual land cover type, and ignored the inclusion of small scale features such as the volumetric capacity of the storm sewer inlets and street-side gutters.
In contrast, those aspects were represented in our model by detailed onsite visits and measurement campaigns, as well as free-access data derived from platforms such as Google Earth 7.3, which were validated by the site observations. Therefore, the novelty of this study is the use of detailed data to develop a highly resolved urban drainage model where retrofitted stormwater infrastructure can be represented. It can be easily replicated in areas where data are missing due to the lack of resources needed to generate them. The methodology can be used by stormwater practitioners aiming to evaluate the potential runoff reduction derived from GSI elements.
By developing a highly resolved rainfall-runoff model at micro-watershed scale, this study assesses the hydrological effects of implementing small scale GSI elements. The spatial focus of this research is located in consolidated urban areas with limited open space, aiming to reduce the generation from impervious surfaces of stormwater runoff. A residential neighborhood was selected as a case of study because of its urban characteristics and the geographical location. The site is located in a tropical developing country whose meteorological conditions, especially the rainfall characteristics, challenge the performance of traditional green infrastructure elements. Moreover, the area represents a highly urbanized micro-watershed which belongs to a catchment area where flooding events are reported regularly. Retrofitting those areas with GSI is proposed as an alternative solution due to the degree of urbanization that limits the space available for implementing extensive control-measure elements (e.g., detention ponds). The existence of a reticulated stormwater sewer system in the site allowed to simulate the area by approaching the flow discharge at the outfall.
A description of the study area is initially presented. Then, the methods used to generate and collect data are reported. Subsequently, the hydrological simulation is explained, including the selection of storm events and elements to represent retrofitted stormwater infrastructure. The results include aspects related to data generation, model calibration and validation, and stormwater runoff generation scenarios with and without green infrastructure.
2. Materials and Methods
2.1. Study Area
Our study area is located in an urban neighborhood in the Great Metropolitan Area of Costa Rica, within the Quebrada Seca watershed (23 km2), as shown in Figure 1. The approximately 0.1 km2 neighborhood in which 75% of the area is sealed, is primarily composed of residential single-family houses, streets and sidewalks. The remaining pervious areas correspond to backyards, small public parks, and grass strips parallel to the sidewalks. On average, the elevation in the site is 1003 m a.s.l. with a slope equal to 7.1%. The primary soil type is clay/clayey loam [32]. The region has a tropical climate with a mean annual temperature of 21–24 °C and a mean annual precipitation of 1900 mm, 75–80% of which falls within the wet season (May to October). A quick overview of the site using the historical imagery tool of Google Earth shows that the impervious surfaces have doubled in the last twenty years, which produces higher stormwater runoff during the wet seasons [33]. Stormwater runoff is directly discharged to the river through an underground stormwater conveyance system.
2.2. Data Collection for SWMM Model
2.2.1. Mapping of the Stormwater System
The study area represents an independent stormwater sewer system disconnected from other reticulated networks because of the topography. Due to the lack of information about them, site visits were conducted to measure and locate the different stormwater structures, including location and geometry. An overview of the drainage system is illustrated in Figure 2. Stormwater runoff generated from rooftops, front yards, streets and sidewalks is discharged directly into the street side curb-gutter system. In addition, most of the houses drain their greywater to the streets or directly to the catch basins through underground pipes [34,35]. Stormwater catch basins located at the end of every curb-gutter convey the runoff via manhole junctions to the primary sewer pipe, which finally discharges into the river.
To obtain an accurate representation of the entire watershed, the contributing drainage area of each catch basins was defined on-site. This task was performed by observing and mapping the predominant direction of the overland flow of surface runoff along the curb-gutter system draining to the catch basins. Since all the residential lots and the half of the streets’ area discharge the runoff to their adjoining curb-gutter, following the flow pattern was enough to detect their corresponding drainage areas. Information gathered from the measurement campaign was summarized in a Geographic Information System (GIS) software (ESRI’s ArcMap 10.2) to define the flow paths of stormwater through the stormwater network. Figure 2 depicts all these elements within our study area and contributing drainage areas of each catch basin.
2.2.2. Generation of a High-Resolution Digital Elevation Model
A Digital Elevation Model (DEM) was generated to obtain the invert elevations and slopes of the stormwater structures. Since the spatial resolution of the DEM received from the municipal authority was not fine enough to provide such details, we considered Google Earth elevation data. A number of studies assessed its accuracy, concluding that the results are acceptable compared to other sources [37,38]. Since the spatial resolution of the DEM generated from Google Earth depends upon the density of the points used to capture the elevation, we created these points automatically with a grid space of 1 m using the “Fishnet” tool of ESRI’s ArcMap software. The elevation of each point in the grid was obtained by uploading the x and y coordinates as a comma-separated value (CSV) file onto a global positioning system (GPS) visualizer. That software is an online free utility that can generate maps and profiles from geographic data. Finally, the elevation values at each point was imported into a text file for further processing and generation of the DEM raster using the surface interpolation tool. A 2.3 m × 2.3 m resolution DEM resulted from this procedure. Then, it was used to obtain the invert elevations of all stormwater structures within the study area. The spatial resolution was fine enough to obtain the slope of pipes connecting two catch basins at the opposite sides of streets and the slopes of the street side curb-gutters of each street section. These results were validated by a topographic survey of the surface and depth of the manholes. Slopes obtained from the DEM were validated by using the same topographic survey. Although the accuracy of the method might be used to upscale the results at the watershed level, other areas employing the same methodology should consider the validation of the results.
2.2.3. Hydrological Measurements
High-resolution hydrologic measurements were carried out during the rainy season from the beginning of July 2019 until the end of December 2019. A tipping-bucket rainfall collector (HOBO® RG3), hereinafter referred as OR1, was installed in the surrounding of the study area to provide on-site rainfall measurements with a 0.2 mm precision. Additional precipitation data (July 2016–July 2019) recorded at a 5 min interval were also available from another tipping bucket rain gauge located 2.5 km from the study area (MR1). These data were provided by the Municipality of Belén, Costa Rica.
A flow meter (ultrasonic flow sensor Nivus PCM PRO) was placed into the stormwater sewer pipe, 2 m after the last manhole junction. It provided the water level of the stormwater runoff at 1 min temporal resolution. Due to an unknown device malfunction causing unreliable velocity records, we only used flow depth values to calibrate and validate the model. Records regarding velocity, and thereby calculations for discharge, were omitted after multiple discharge measurements based on the salt-dilution method and volumetric method [39] that showed considerably different results. To ensure constant and correct operation of the sensor, the water table was manually measured each week.
2.3. Setting up the SWMM Model
The PC Storm Water Management Model (PCSWMM Version 7.2.2785), a fully featured urban drainage system modeling package, was used to model the rainfall-runoff response of the existing system and simulate the runoff reduction in some selected GSI. It incorporates US EPA’s Storm Water Management Model (SWMM Version 5.1.013) with GIS for modeling purposes [40,41]. Each subcatchment is treated as a nonlinear reservoir which receives inflow from rainfall, as well as runoff from upstream, generating outflows in the form of infiltration, evaporation, and surface runoff. The capacity of this so-called “reservoir” is the maximum depression storage (Ds), which is dependent upon initial rainfall abstractions. Surface runoff from a subcatchment is only generated when the depth of water stored in the reservoir exceeds the user-defined Ds. It is conveyed through different stormwater structures represented by links and nodes. Flow routing within the stormwater structure network is governed by the conservation of mass and momentum equations which can be solved by any one of the following methods depending on the user’s choice on the level of sophistication and available information: steady flow, kinematic wave and dynamic wave routing method. In this study, the dynamic wave routing method was used as recommended in previous studies related to urban stormwater runoff quantity modeling [20,21,31] and according to the available data. A detailed description of the computational methods can be found in the manual of SWMM [41,42].
2.3.1. Subcatchment Division and Parametrizations
Initially, our study area was divided into 39 subcatchments based on the spatial extent of the contributing drainage areas of the 39 catch basins. Each subcatchment was further divided into two parts—one with one half of a street and the other with the residential lots. Green spaces within the sidewalks were omitted because of their relatively small area, so the half streets were considered 100% impervious. Since the residential lots were defined by only two land cover types (rooftops and backyards/gardens), further discretization was assumed not necessary. This approach resulted in division of our study area into 78 subcatchments. Each residential lot subcatchment parcel was updated with the cadastral GIS shape file obtained from the municipal authority. The spatial location of backyards and gardens were defined in the land cover data, and digitized employing the most recent available Google Earth satellite image which corresponded to the year 2020. The shape file of the updated land cover map thus contained multiple polygons, each one built upon a small urban structure like a house roof top or a single backyard or garden.
The land cover data map was overlaid on the subcatchment shape file to obtain the length and width parameter at each subcatchment. Both parameters were calculated following Equations (1) and (2), where i represents an urban structure or land parcel within a subcatchment. This approach was followed to estimate the maximum overland flow at each structure or parcel, because of the heterogeneous dimensions of rooftops and gardens. This was done by calculating the length of the longer side of every urban structure polygon within the land cover data map using the “Minimum Bounding Geometry” tool of ESRI’s ArcMap software.
Length represents the distance that runoff travels overland before it is conveyed into a concentrated or channeled flow. In the case of rooftops, this length represents the flow path from the roof crest to the downspout pipes, which discharges runoff to the street gutter. For gardens/backyards, this length represents the distance of the overland flow over the grass before it becomes a concentrated flow. Width represents an average value for each area within a specific urban structure.
An area-weighted slope was also calculated for each subcatchment by estimating the average slope of an individual urban structure employing Equation (3), where i represents both urban structure or land parcel polygons. The average slope of each of the urban structure land parcel polygons were obtained from the DEM.
For the subcatchments containing streets, overland flow paths were defined as the width of the half-street with a slope of 3%. Manning’s roughness coefficient (n) and depression storage (Ds) values were defined according to the land cover type (Table 1), derived from a theoretical reference [21]. Initial values were chosen from the SWMM manual while the final values were obtained through model calibration. We used the “Curve Number Method” for the estimation of the infiltration parameters and runoff generation potential of different land cover type. The Curve Number (CN) for the four different types of land cover of our study site (i.e., rooftop, street/sidewalk, backyards, parks/playgrounds) are shown in Table 1 [43]. The hydrological soil group for our area was obtained from Vega [43]. An equivalent CN was assigned using Equation (4), where i represents the individual land cover types within the subcatchment.
2.3.2. Representation of Stormwater Structures in SWMM
All the stormwater structures were modeled in SWMM. These included pipes, manholes, street-side gutters and catch basins. Street curb-gutter systems were represented as a trapezoidal open channel of a fixed cross-section. SWMM allows modeling conveyance channels to receive only a concentrated inflow at their upstream node, so a dummy node was placed at the upstream of every curb-gutter channel to receive the inflow from the adjoining half-street and roof-downspout pipes. The catch basins were represented as storage unit nodes to provide storage volume of the inflow. No inlet capacity restriction was assigned to these nodes, assuming that the catch basins are oversized such that all flows directed towards them from curb-gutter channels will enter the storm sewer system at that location and then will be directed towards the manhole junctions via catch-basin leads. This assumption was based on site observations during a heavy rainfall event. The catch basin leads, and sewer pipes were represented as conduits; manholes as storage junctions. Slopes of all the street-side gutters were extracted from the DEM and invert level of all other stormwater drainage elements (catch basins, manholes and pipes) were obtained from field measurements.
2.3.3. Storm Event Selection
Table 2 presents a summary of the characteristics of the rainfall events recorded from the different rain gauges that were employed in the study. Two storm events were selected for calibration and validation of the SWMM model (S1 and S2) based on the availability of observed flow depth data at the outfall and temporal resolution of the measured rain data. In addition to events S1–S2 from OR1 gauge, 6 storm events recorded by MR1 gauge were also studied. S3 and S4 were two of the top 6 most intense storm events recorded by MR1, whereas S5–S8 were selected randomly from the 50, 75, 90 and 95th percentile storm events during its operating period. Since this rain gauge operated only for 3 years, it was problematic to estimate the return period of S3 and S4 events. Nevertheless, a previous study [43] considering a climate station 5 km away from MR1 estimated that the daily rain amount for a 2-yr and 5-yr return period is around 69 mm and 88 mm, respectively, which is similar to the rain amount for S3 and S4 event. The percentile storm events were determined by tabulating all the storm events and by analyzing their frequency. Storm events were selected from the rainfall time series using the built-in “Auto-Select Events” of PCSWMM with a minimum inter-event of 2 h. Events less than 2.54 mm were excluded from the analysis since they usually do not generate runoff [44]. Events S5–S8 were fed into the model to analyze the performance of the current stormwater system and evaluate the runoff reduction potential of GSI scenarios under different rainfall conditions.
2.3.4. SWMM Model Calibration and Validation
PCSWMM’s built-in Sensitivity-based Radio Tuning Calibration (SRTC) tool was used to calibrate and validate the model. Before starting the tool, the parameters must be assigned an uncertainty as a percentage of the current estimated value. The SRTC tool optimizes model parameters according to the Nash–Sutcliffe Efficiency (NSE) coefficient [45], a mathematical relationship used to evaluate the predictive power of hydrological models, as per the following equation [46]. The NSE formula is stated in Equation (5).
where:
- NSE = Nash–Sutcliffe coefficient (a measure of model efficiency);
- Yavg = mean of observed data for the constituent being evaluated;
- Yi = ith observation for the constituent being evaluated;
- n = number of hydrological parameter values;
- = ith simulated value for the constituent being evaluated.
Since on-site rain and outfall flow depth data were available for a short period of time, the calibration and validation were done to enhance the performance and ensure the reliability of the model. During the calibration procedure within the SRTC tool, three parameters (depression storage of impervious areas, Manning’s roughness coefficient of conduits and impervious areas) were assigned 100% maximum uncertainty and subcatchments width of the residential lots an uncertainty of 50%. James [47] categorized those parameters depending on the degree of certainty in estimating their values in the field, design office, or laboratory. Even after assigning the specified level of uncertainty, following the recommendations of [47], the rest of the parameters did not affect the modeled flow depth at the outfall. The final calibrated values of these three parameters is provided in Table 1. Once the model was calibrated using storm event S1, it was validated using S2 storm event. All of these storm events were within the 75th percentile events of MR1 rain gage. After validation, the model was used to evaluate the runoff reduction potential of different GSI measures.
2.3.5. Modeled GSI Measures
Three GSI measures were simulated to assess flow attenuation and runoff reduction: Retention-Infiltration Basins (RIB), Micro Infiltration Trenches (MT), and Street-Planters (SP). They were modelled using Low Impact Development (LID)-modules of PCSWMM. Their selection is owed to the limited space available within the study area. Since rooftops of the existing residential lots are primarily made of coated iron sheets, retrofitting them with green roofs is assumed to be structurally and economically impractical. A similar assumption was done for the implementation of porous pavement due to the relatively new paved streets. In consequence, we relied on existing public open spaces like public playgrounds, vacant land and sidewalks for the placement of GSI measures. Parameter values for all these three systems were taken from the SWMM manuals [48,49], and are shown in Table 3. The GSI elements are represented as a number of interconnected, mixed layers consisting of the surface, pavement, soil, storage, and underdrain portion. A particular GSI element can be considered as a separate, or a portion of an impervious subcatchment. The presence of a layer type depends on the type of GSI element. Within these layers, only vertical movement of water is allowed [50].
A RIB was simulated at the north side of the study area to capture and infiltrate runoff before draining into the first manhole. A surface of 200 m2 was assumed based on the available space in the public park. This element was represented as a Bio-Retention Cell of the LID-module with a relatively high (750 mm) gravel storage layer. The RIB was simulated without underdrain and clogging issues. The ponded water overflow was directed to the surrounding area of the park if the inflow rate exceeds the infiltration capacity of the underlying soil.
The MT was simulated by retrofitting all the existing street-side curb-gutter systems. 0.5 m deep lined trenches were filled with gravel filter media for temporary storage before downstream conveyance to the SP system via underdrain pipes. They were represented as Infiltration Trenches of the LID-module, with no storage layer’s conductivity to restrict the downward movement of water into the underlying soil. These measures are primarily designed to disconnect the surrounding impervious area from entering the storm sewer system by temporary storage based on the void ratio of filter media and downstream conveyance to the SP system.
The SPs were represented as Bio-Retention Cells of the LID-module. They were placed in front of each catch basin to receive runoff from its upstream MT. Their size was limited to the width of the sidewalks. Overflow was directed to the adjoining catch basins. This coupled MT–SP system is expected to delay the entry of street and rooftop runoff to the existing storm sewer system. Figure 3 depicts runoff pathway through this combined MT–SP system and also the existing stormwater drainage network.
Individual and distributed effects of the simulated measures were evaluated by analyzing the runoff production rate at the catch basin level and at the outfall. The runoff reduction was assessed by calculating the percentage variation of the outfall peak under the current conditions and the GSI scenario. Flow attenuation capability was evaluated by comparing the time of peak flow from the start of rainfall. Since long term continuous rainfall data were not available, the effectiveness of these measures was assessed only for specific storm events of different intensities.
3. Results and Discussion
3.1. Data Gathering
The resulting DEM model based on Google Earth elevation was satisfactory, and with a level of detail enough to define slopes and flow paths. This model was validated by a topographic survey along the surface of the sewer system. There was no negative gradient for any conduits section and upward steps in inert levels of any nodes of the developed sewer model. This confirms the conclusions of Hoffmann et al. [37], Chigbu et al. [51], and Hossain [38] about the accuracy of Google Earth elevation data. The procedure of capturing Google Earth elevation point data of these studies was quite laborious. All of these studies manually created the desired set of points using the “placemarker” function or “add path” tool of Google Earth. For larger study areas, these manual methods can be very time consuming. Instead of using “TCX Converter” which can read files only created by Google Earth, we used “GPS Visualizer”, a web tool for getting elevation information. This tool has the capability to read a variety of file formats created by platforms other than Google Earth.
Although a 2.3 m × 2.3 m DEM resolution was generated, such a fine resolution DEM may not possible for all areas since the resolution of Google Earth data source varies for different parts of the world. Google Earth provides the terrain elevation from a variety of data sets with different resolutions and then interpolates them. While we were able to obtain the correct slope of our street surface from such an interpolated DEM, this may not be the case for streets in hilly urban areas. Similar studies should be aware that the accuracy obtained from Google Earth must be validated by a field topographic survey before they are used in the SWMM model. It is worth mentioning that SWMM only requires the slope of a stormwater conduit or channels. Since our modeling approach includes the representation of the entire stormwater structure, the DEM’s resolution is fine enough to obtain its spatial configuration, thereby the slope of those structures. In our study area the width of the streets varied from 6 m to 8 m, so a 2.3 m × 2.3 m validated DEM was sufficient to represent the slope of the sewer pipes connecting the catch basins of the two sides of a street, as well as the slope of the street side gutter conduits.
A detailed resolution of the geometry and location of stormwater structures is essential to simulate the hydraulic performance of the sewer system. To reduce the effort of extensive field measurements when data are not accessible, automatic close to reality sewer network development methods proposed by Krebs et al. [52] and Coomandre et al. [53] could be employed. Nevertheless, these methods require a high-resolution surface topography data and satellite images whose availability remains limited in certain areas. To create the storm sewer pipe network, Krebs et al. [52] assumed that pipes are placed along the street centerline and the pipe slope is the same as the street ground surface. This assumption may vary depending on local legislation for the design and construction of sewer pipes and streets which are different to the initial slope. Furthermore, these methodologies are capable of generating network data only for the main public stormwater collectors, which makes thorough on-site visits the only way of obtaining information of small-scale stormwater structures such as storm inlets and catch basin leads dimensions.
Regarding the drainage system geometry, accurate information regarding the position and layout of the stormwater structures was needed to simulate its hydrologic response. Although such information can be easily gathered in small areas, this task can be time-consuming for larger study sites, remaining as a challenge if upscaling of the results is planned. The catch basins were observed as a critical feature during the simulation of the system. They were modeled without any inlet capacity restriction, assuming that all of them were oversized. This assumption was found to be valid since none of the catch basins were neither surcharged nor flooded during a 5-yr return period. A simple representation of catch basins may produce erroneous hydrograph patterns if they are not oversized. In such cases, they should be modelled more accurately with orifice, weir, and inlet capacity restriction to reduce uncertainties.
Despite the accuracy of the model to predict the peak flow magnitude and lag time, thereby the simulation of implementing GSI measures, another limitation refers to the data time lengths. Since only two storm events were available for calibration and validation, the predictability of the hydrologic response during intense storm events might differ from real conditions. Consequently, longer monitoring periods are recommended in order to increase the certainty of the model predictions.
The rainfall data provided by local authorities were previously used as part of an alert system during flooding events. The alternative use of such data in this study proves the relevance of counting with local records. The authors highlight, therefore, the importance of collaboration between academia and local authorities to improve access and acquisition of such registers, since this task remains as one of the major constraints. By doing so, local rainfall records can serve a variety of purposes, and act as a bridge to identify alternatives to the existing water-related issues. In our case, the simulation of GSI shows potential benefits in the study area. Implementing such technologies as prototypes can support learning-activities regarding stormwater management.
3.2. Model Calibration and Validation Results
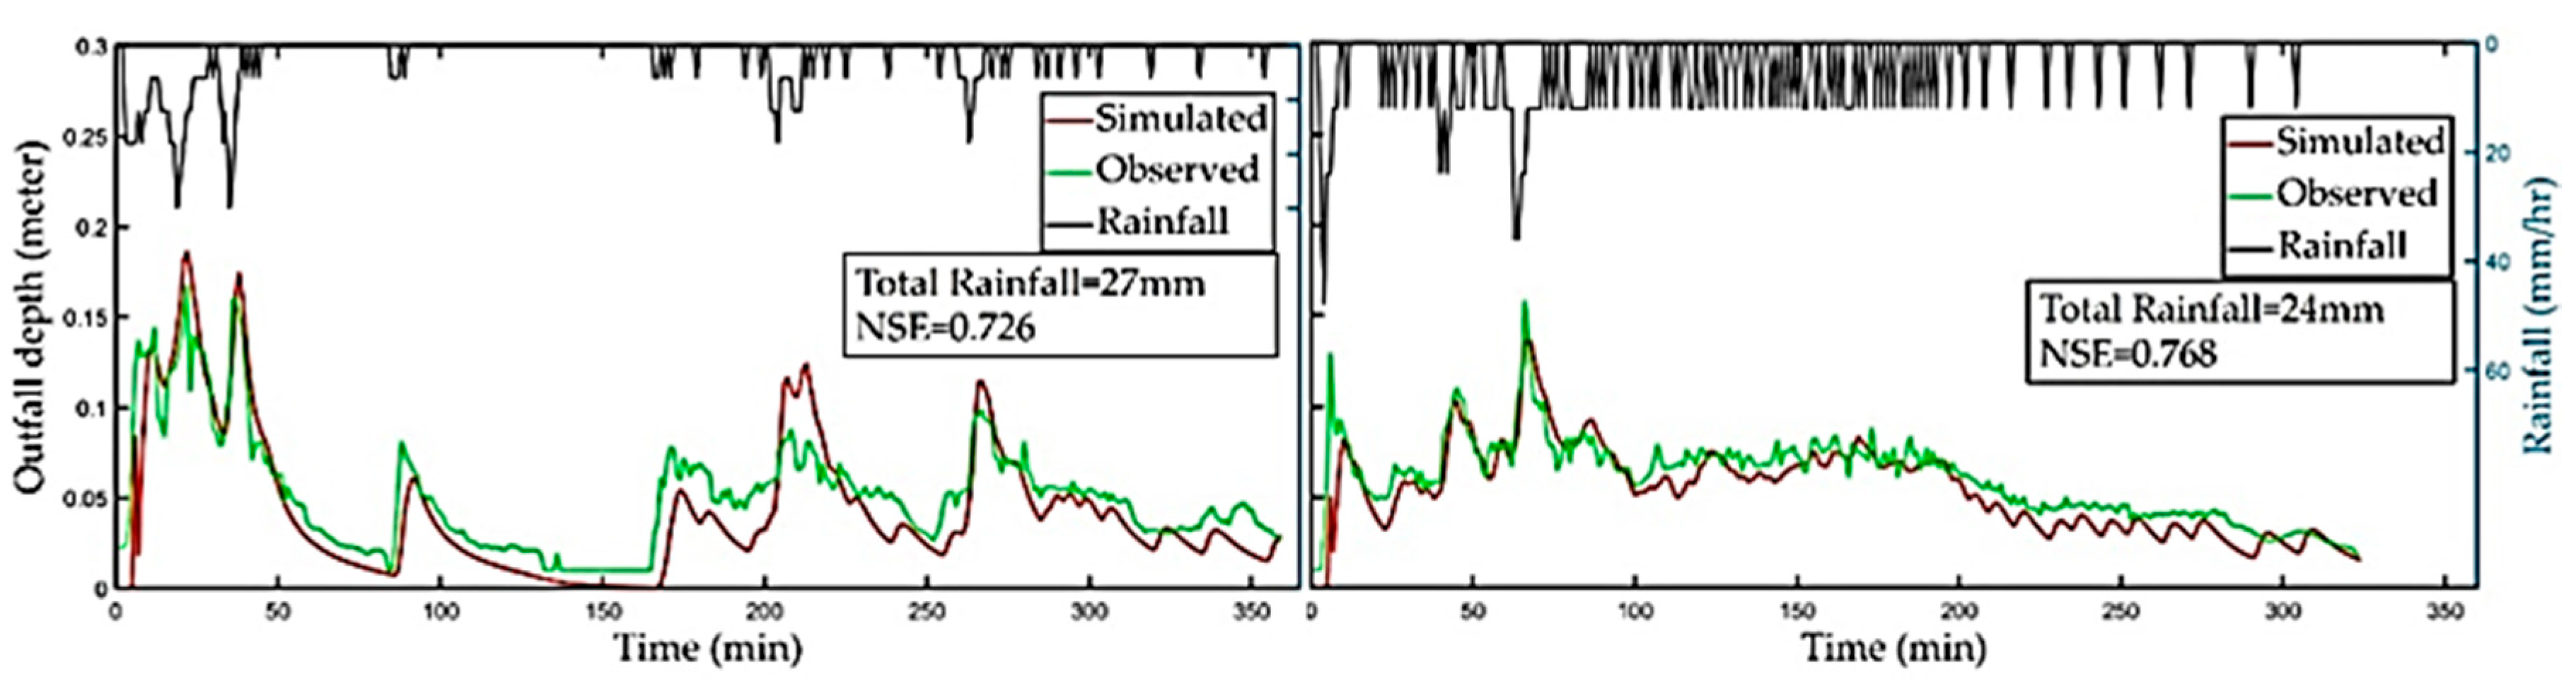
Figure 4 shows the modeled and measured flow depth series at the outfall sewer pipe during the events S1 and S2. These results are also summarized in Table 4, including The Relative Error (RE) values for peak flow depth, and the NSE coefficient efficiency. Both values are well above the acceptable range [46,54], which proves that the model can predict the flow depth at the outfall during storm events. The model validation also showed good performance in predicting the timing of peaks and troughs of the flow depth hydrograph, which ensures the reliability of the model to simulate flow attenuation and runoff reduction potential of GSI measures. The model was not calibrated for the dry weather period because of the scope of this study, despite the existence of greywater in the system. Nevertheless, the maximum dry weather discharge at the outfall was estimated as lower than 0.002 m3/s onsite.
3.3. Current Rainfall-Runoff Response
To analyze the rainfall-runoff response of the existing stormwater system, the already validated model was at first fed with the entire rainfall time series of MR1. During the simulation period, the flow routing and runoff continuity error, metrics which define how well the computed inflows, outflows, and storage values balance out, was 0.1% and 0.2%, respectively. The low error indicates there were no negative gradients for any conduit section and also no upward steps in inert levels of any nodes of the model [42]. Consequently, it confirms the realistic hydraulic performance of the simulation, as well as the accuracy and feasibility of the high-resolution DEM in determining the flow pattern of the stormwater structures. Subsequently, the model was run considering the six storm events (see Table 2) to evaluate the hydrologic response of the system, as shown in Figure 4 for S1–S2, and Figure 5, for S3–S8. It can be inferred that the existing system has a very low runoff retention capacity and a very low lag time.
Under the existing conditions, the system discharges all of its surface runoff to the Quebrada Seca River at the outfall in less than half an hour, even during 2- and 5-year return period rainfall events. This behavior is mainly due to the steep street slope and high directly connected impervious areas (DCIA) observed in the study site. The high DCIA has been reported by Vega [43] as responsible for frequent flooding of the river. During any of those events, none of the catch basins and manholes resulted in the simulation as flooded, while the model reported that the sewer pipes did not exceed their capacity. In consequence, the stormwater structures are hydraulically efficient. The runoff simulation clearly demonstrates the necessity of disconnecting the impervious area from the catch basins if a reduction in the overall surface runoff generation rate of this heavily urbanized catchment is desired.
3.4. Runoff Reduction Potential of GSI Elements
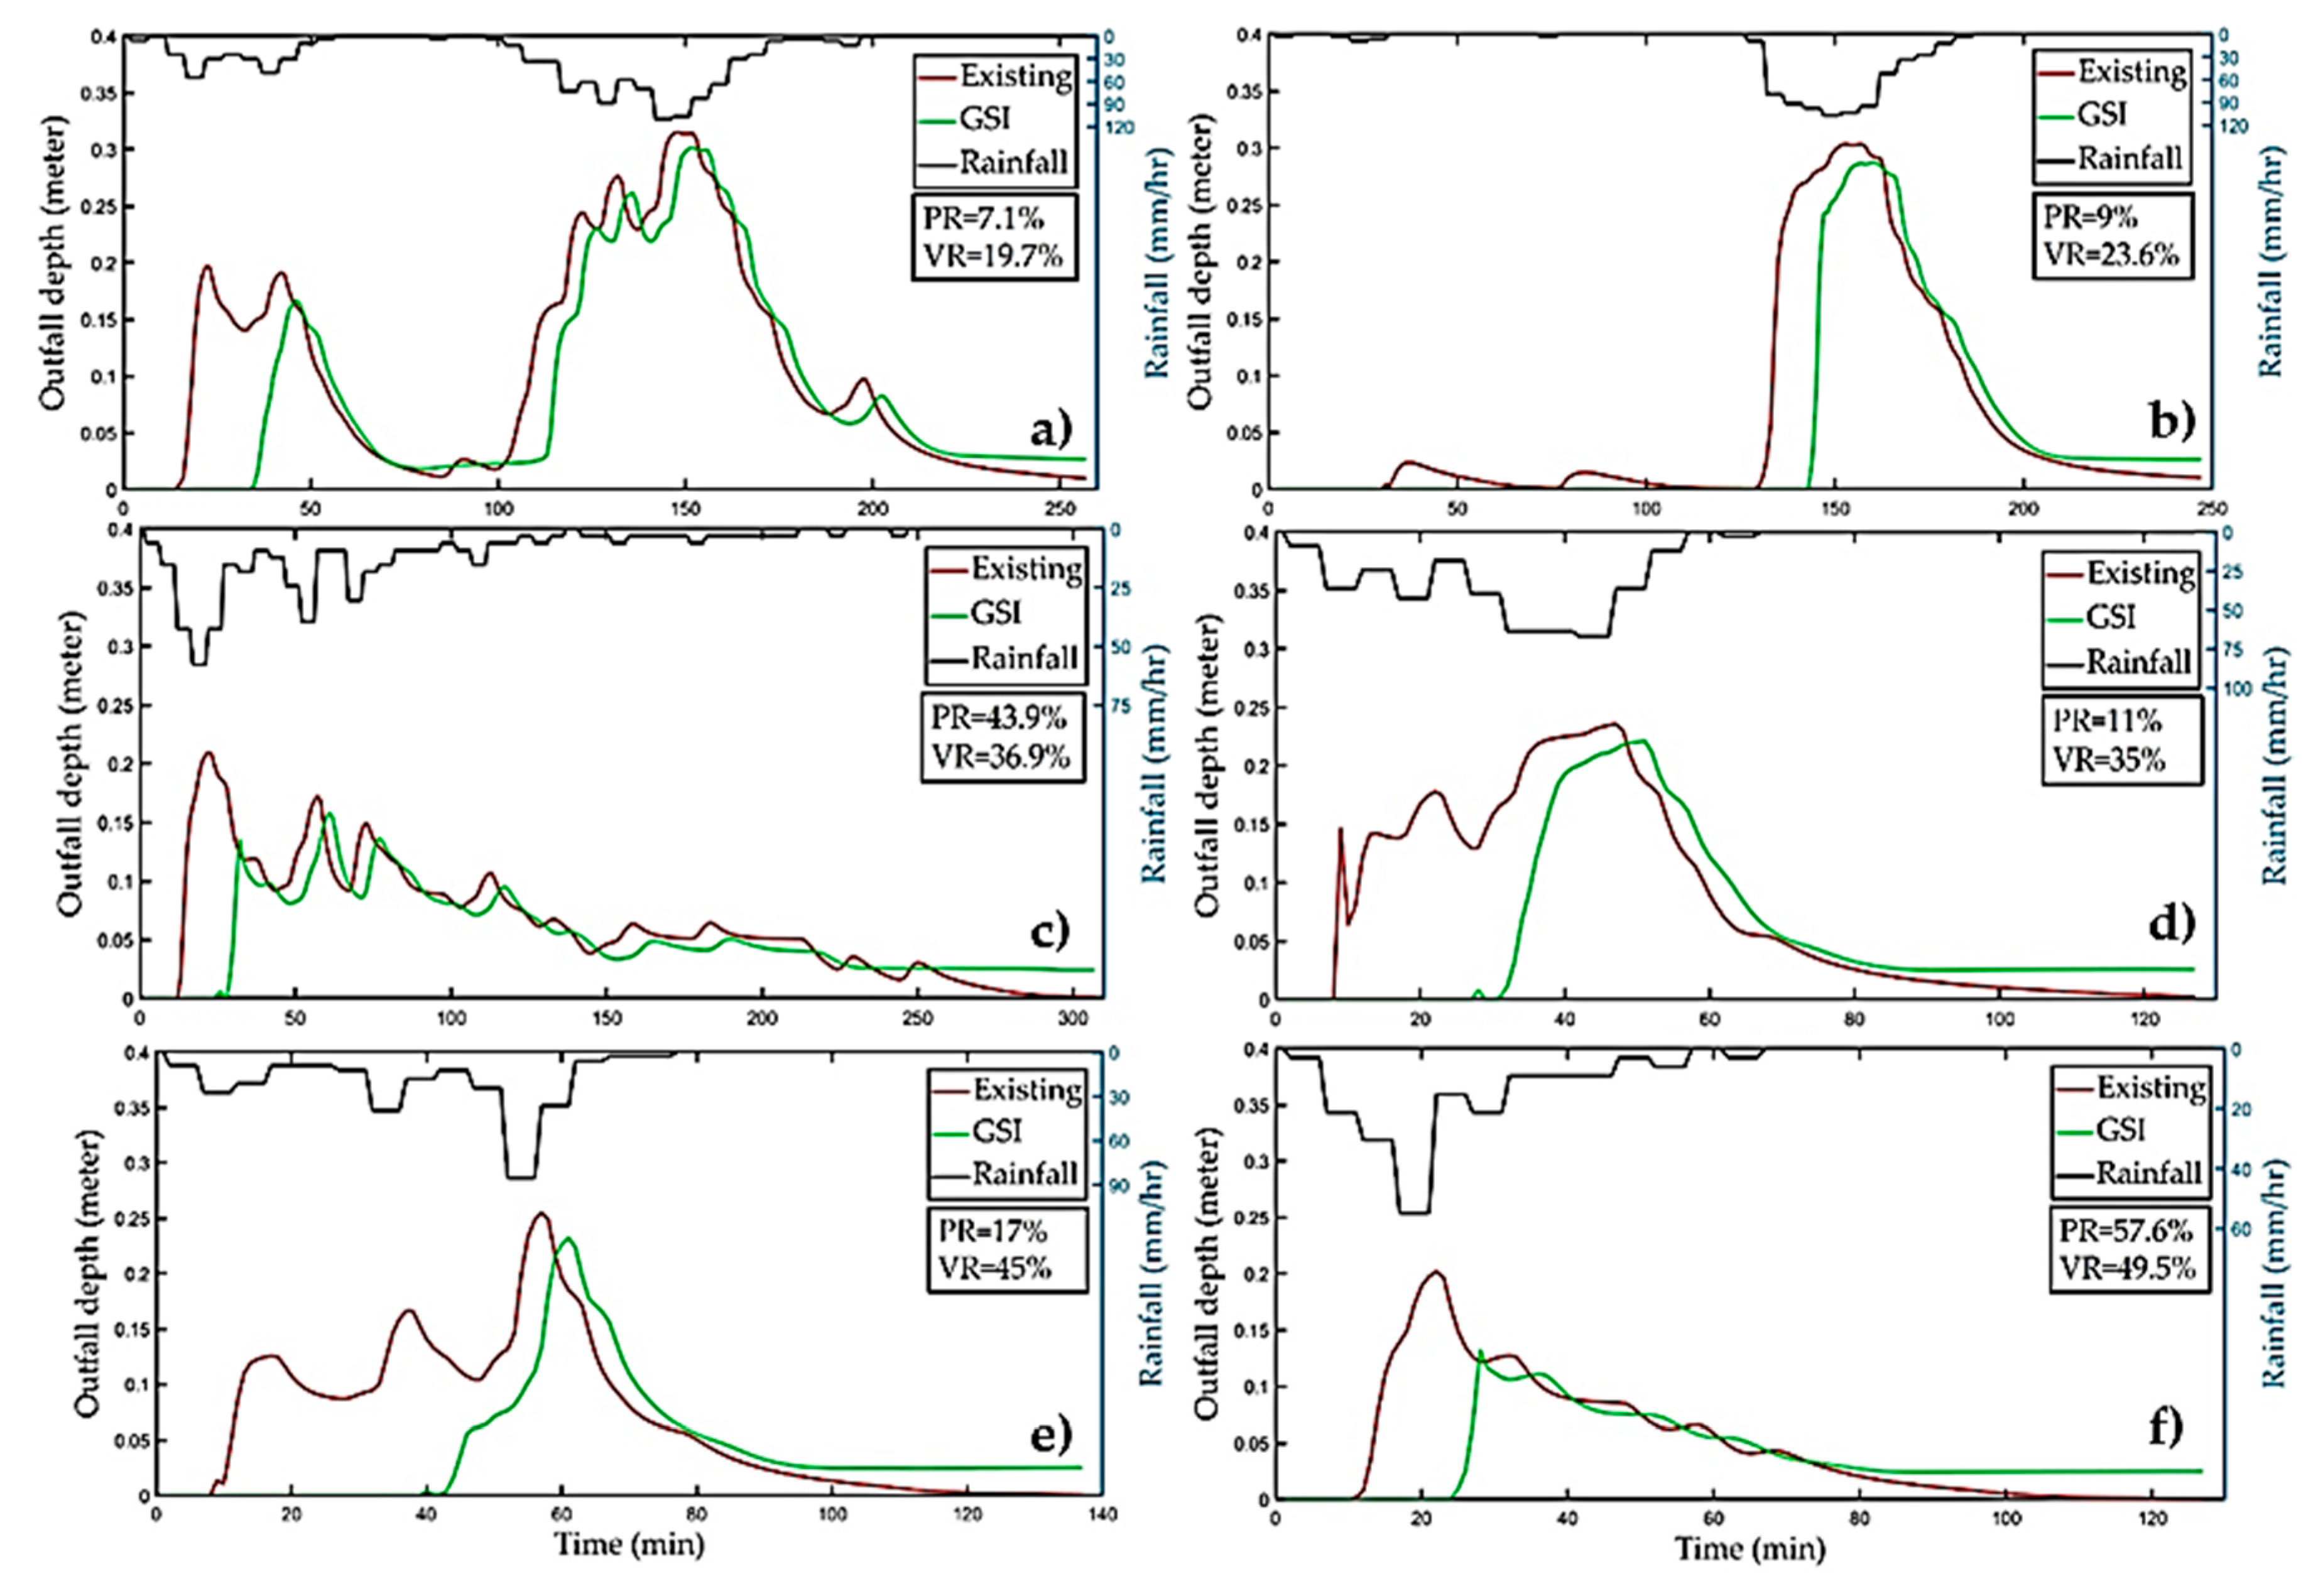
Regardless of the intensity of a rain storm, the distributed GSI elements can fully capture the runoff generated by the first 5–10 mm of rainfall, as observed in Figure 5. This is because of the relatively large gravel storage layer set for the SP system and disconnection of the impervious areas from the storm sewer system. Since clogging of GSI elements is ignored during the simulation, void spaces and soil layers are assumed empty at the start of any rainfall event, ensuring full capture of the incoming runoff to the GSI element. A closer look at the hydrograph also reveals the GSI elements can delay the peak runoff by 5–10 min. The peak runoff and volumetric runoff reduction rates of the dispersed GSI elements are also included in Figure 5 for each storm event.
In coherence with the results of previous studies in reference to the benefits of distributed GSI elements [29,30,33], our results show that GSI elements can capture almost half of the runoff for less intense events but their performance deteriorates drastically for 2- and 5-return period events. If a storm event presents a magnitude higher than 50 mm, the GSI elements could capture roughly 20% of the incoming runoff. As shown in Figure 5c, the peak reduction rate for event S5 is almost 40%, even though the total rainfall depth is relatively high. This is because of the temporal pattern of rainfall for that specific event. Since the most intense flash of rainfall happened relatively at the beginning of the event, the storage layers get full within the 1st half period lowering the peak runoff, but for the latter half the performance of the GSI elements are not satisfactory.
To summarize, the performance of the GSI elements in terms of peak runoff and volumetric runoff reduction rates decreases substantially with the increase in rainfall intensities. The detailed representation of the small-scale stormwater structures allows to describe the flow patterns through the dispersed micro GSI measures and to hydrologically connect them with the existing drainage system. Similar studies regarding high-resolution models in urban areas have overlooked such small scale information since they had plenty of space available for placing large scale GSI measures in public places or within residential lots [20,31]. However, space limitations and unwillingness of local people to place large GSI measures in public space (e.g., at the cost of traffic space) are identified as major barriers for GSI implementation in urban areas of developing and transition countries [30]. The authors highlight that the modeling approach employed in this study can provide useful information regarding the potential runoff reduction in small scale retrofitted GSI placed in a dispersed manner within public places of dense urban neighborhoods.
In previous studies, the existence of small-scale stormwater structures was seen to impact hydrograph patterns especially for less intense storm events [33]. Although obtaining such small-scale information can require additional efforts, their exclusion in micro-scale hydrological modeling may hamper parameter calibration and influence the results. Explicit representation of these structures and flow patterns can be helpful to lessen uncertainties inherent to modeling. Moreover, the different parameter values of GSI elements were obtained from the SWMM manual [16], which are primarily designed for the United States. A major limitation when developing similar studies is, therefore, the access to not only detailed data required to perform the simulation, but also specific hydraulic parameters related to the expected performance of GSI in tropical regions, such as the case of Costa Rica.
4. Conclusions
Modeling constructed urban drainage systems at the micro-watershed scale requires specific data that, in some cases, are missing, access-limited, or whose resolution is not accurate enough for such objective. Simulating the local hydrological effect of green stormwater infrastructure can be an important tool employed by local authorities to improve their understanding of such measures and for local promotion of their benefits. Since data constrains might be a limiting factor, relying on publicly available data platforms like Google Earth, as well as field measurements for land use land cover, topography, and stormwater network data collection was proved in this study as an effective alternative, and might be the unique option in some cases. In limited-data regions, this alternative might be the most efficient in economic and time-investment terms, because the costs involved in this research were related mostly to site visits and hydrological sensors.
The potential for runoff reduction in small-scale dispersed green stormwater infrastructure was investigated using the LID-module of SWMM. The simulation produced satisfactory results considering specific event-based calibration and validation, which ensured the reliability of our data collection procedures. One fundamental set of data is related to the DEM. In our case, its generation showed to be accurate enough to determine the flow patterns and slopes. We recommend, nevertheless, the validation of such measures with onsite surveys. Future studies could investigate how well a less detailed representation of the drainage network in the model, requiring less field work for information gathering, performs compared to our detailed model representation.
The simulation of implementing GSI measures by retrofitting public places and disconnecting impervious areas from the storm sewer system was found to be partially effective in reducing the runoff generation rates. By using small scale bioretention cells and micro trenches in street curb-gutters it was possible to reduce the peak flow from 25% to 75% depending on the intensity of storm. The results clearly show the benefits of GSI measures for sustainable stormwater management in consolidated urban areas with limited space, especially when dealing with stormwater pollution found in the first flush. Due to the hydrological characteristics of the rainfall events in the tropical area, simulating green infrastructure for flooding control of extreme events require additional strategies. Future studies may contribute on identifying more realistic retrofitting strategies for consolidated areas where space availability for management of large rainfall volumes is the main limitation.
This study confirmed the understanding of the rainfall-runoff response of a heavily urbanized micro-catchment and also demonstrated the efficacy of dispersed small-scale GSI measures for sustainable stormwater management. From the presented approach can benefit stormwater practitioners and modelers of developing and transition countries in conducting small scale hydrological simulation under considerable spatial data constraints.
Author Contributions
Conceptualization, S.T.K., F.C. and J.H.; methodology and data curation, S.T.K. and F.C.; software, validation and formal analysis, S.T.K.; investigation, F.C. and S.T.K.; writing—original draft preparation, S.T.K.; writing—review and editing, F.C. and J.H.; visualization, S.T.K.; supervision, F.C. and J.H.; project administration and funding acquisition, J.H. All authors have read and agreed to the published version of the manuscript.
Funding
This research was funded by the German Federal Ministry of Education and research (BMBF), grant number 01UU1704.
Acknowledgments
The authors would like to acknowledge HydroPraxis SARL for providing the Europe university grant to use PCSWMM for this study. We also acknowledge support from the German Research Foundation (DFG) and the Open Access Publishing Fund of Technical University of Darmstadt.
Conflicts of Interest
The authors declare no conflict of interest.
References
- Brown, R.R.; Keath, N.; Wong, T.H.F. Urban water management in cities: Historical, current and future regimes. Water Sci. Technol. 2009, 59, 847–855. [Google Scholar] [CrossRef] [PubMed]
- Echols, S.; Pennypacker, E. The History of Stormwater Management and Background for Artful Rainwater Design. In Artful Rainwater Design; Island Press/Center for Resource Economics: Washington, DC, USA, 2015; pp. 7–22. [Google Scholar]
- Endreny, T.A. Land Use and Land Cover Effects on Runoff Processes: Urban and Suburban Development. In Encyclopedia of Hydrological Sciences; Major Reference Works; John Wiley & Sons, Ltd.: Chichester, UK, 2005; ISBN 9780470848944. [Google Scholar]
- Shuster, W.D.; Bonta, J.; Thurston, H.; Warnemuende, E.; Smith, D.R. Impacts of impervious surface on watershed hydrology: A review. Urban Water J. 2005, 2, 263–275. [Google Scholar] [CrossRef]
- Epps, T.H.; Hathaway, J.M. Establishing a Framework for the Spatial Identification of Effective Impervious Areas in Gauged Basins: Review and Case Study. J. Sustain. Water Built Environ. 2018, 4, 05018001. [Google Scholar] [CrossRef]
- Walsh, C.J.; Roy, A.H.; Feminella, J.W.; Cottingham, P.D.; Groffman, P.M.; Morgan, R.P. The urban stream syndrome: Current knowledge and the search for a cure. J. N. Am. Benthol. Soc. 2005, 24, 706–723. [Google Scholar] [CrossRef]
- Lee, J.G.; Heaney, J.P. Estimation of urban imperviousness and its impacts on storm water systems. J. Water Resour. Plan. Manag. 2003, 129, 419–426. [Google Scholar] [CrossRef]
- Dietz, M.E. Low Impact Development Practices: A Review of Current Research and Recommendations for Future Directions. Water. Air. Soil Pollut. 2007, 186, 351–363. [Google Scholar] [CrossRef]
- Chau, H. Green Infrastructure for Los Angeles: Addressing Urban Runoff and Water Supply Through Low Impact Development. 2009, pp. 1–136. Available online: https://www.adaptationclearinghouse.org/resources/green-infrastructure-for-los-angeles-addressing-urban-runoff-and-water-supply-through-low-impact-development.html (accessed on 19 September 2020).
- Deletic, A.; Fletcher, T.D. Performance of grass filters used for stormwater treatment—A field and modelling study. J. Hydrol. 2006, 317, 261–275. [Google Scholar] [CrossRef]
- Dietz, M.E.; Clausen, J.C. A field evaluation of rain garden flow and pollutant treatment. Water. Air. Soil Pollut. 2005, 167, 123–138. [Google Scholar] [CrossRef]
- Kasmin, H.; Stovin, V.; De Ville, S. An Evaluation of Green Roof Hydrological Performance in a Malaysian Context. In Proceedings of the 13th International Conference on Urban Drainage (ICUD 2014), Kuching, Malaysia, 7–12 September 2014. [Google Scholar]
- Niazi, M.; Nietch, C.; Maghrebi, M.; Asce, A.M.; Jackson, N.; Bennett, B.R.; Tryby, M.; Massoudieh, A.; Asce, M. Storm Water Management Model: Performance Review and Gap Analysis. J. Sustain. Water Built Environ. 2017, 3, 04017002. [Google Scholar] [CrossRef] [Green Version]
- Kaykhosravi, S.; Khan, U.; Jadidi, A. A Comprehensive Review of Low Impact Development Models for Research, Conceptual, Preliminary and Detailed Design Applications. Water 2018, 10, 1541. [Google Scholar] [CrossRef] [Green Version]
- Elliott, A.; Trowsdale, S. A review of models for low impact urban stormwater drainage. Environ. Model. Softw. 2007, 22, 394–405. [Google Scholar] [CrossRef]
- James, W.; Rossman, L.E.; James, W.R.C. User ’s Guide to SWMM5; US Environmental Protection Agency: Cincinnati, OH, USA, 1999; ISBN 9780980885330.
- Jayasooriya, V.M.; Ng, A.W.M. Tools for Modeling of Stormwater Management and Economics of Green Infrastructure Practices: A Review. Water Air Soil Pollut. 2014, 225, 2055. [Google Scholar] [CrossRef] [Green Version]
- Shrivastava, P. Urban water hydrological modelling. Int. J. Latest Trends Eng. Technol. 2016, 7, 489–493. [Google Scholar] [CrossRef]
- Krebs, G.; Kokkonen, T.; Setälä, H.; Koivusalo, H. Parameterization of a hydrological model for a large, ungauged urban catchment. Water 2016, 8, 443. [Google Scholar] [CrossRef]
- Lee, J.G.; Nietch, C.T.; Panguluri, S. Drainage area characterization for evaluating green infrastructure using the Storm Water Management Model. Hydrol. Earth Syst. Sci. 2018, 22, 2615–2635. [Google Scholar] [CrossRef] [Green Version]
- Sun, N.; Hall, M.; Hong, B.; Zhang, L. Impact of SWMM Catchment Discretization: Case Study in Syracuse, New York. J. Hydrol. Eng. 2014, 19, 223–234. [Google Scholar] [CrossRef]
- Chang, Q.; Kazama, S.; Touge, Y.; Aita, S. The effects of spatial discretization on performances and parameters of urban hydrological model. Water Sci. Technol. 2019, 80, 517–528. [Google Scholar] [CrossRef]
- Ghosh, I.; Hellweger, F.L. Effects of Spatial Resolution in Urban Hydrologic Simulations. J. Hydrol. Eng. 2012, 17, 129–137. [Google Scholar] [CrossRef] [Green Version]
- Park, S.Y.; Lee, K.W.; Park, I.H.; Ha, S.R. Effect of the aggregation level of surface runoff fields and sewer network for a SWMM simulation. Desalination 2008, 226, 328–337. [Google Scholar] [CrossRef]
- Krebs, G.; Kokkonen, T.; Valtanen, M.; Setälä, H.; Koivusalo, H. Spatial resolution considerations for urban hydrological modelling. J. Hydrol. 2014, 512, 482–497. [Google Scholar] [CrossRef]
- Houle, J. Performance analysis of two relatively small capacity urban retrofit stormwater controls. J. Water Manag. Modeling 2017, 6, 4013–4021. [Google Scholar] [CrossRef]
- Alves, A.; Sanchez, A.; Vojinovic, Z.; Seyoum, S.; Babel, M.; Brdjanovic, D. Evolutionary and holistic assessment of green-grey infrastructure for CSO reduction. Water (Switzerland) 2016, 8, 402. [Google Scholar] [CrossRef]
- Thiagarajan, M.; Newman, G.; Van Zandt, S. The projected impact of a neighborhood-scaled green-infrastructure retrofit. Sustainability 2018, 10, 3665. [Google Scholar] [CrossRef] [Green Version]
- Morsy, M.M.; Goodall, J.L.; Shatnawi, F.M.; Meadows, M.E. Distributed Stormwater Controls for Flood Mitigation within Urbanized Watersheds: Case Study of Rocky Branch Watershed in Columbia, South Carolina. J. Hydrol. Eng. 2016, 21, 05016025. [Google Scholar] [CrossRef]
- Avila, H.; Avila, L.; Sisa, A. Dispersed storage as stormwater runoff control in consolidated urban watersheds with flash flood risk. J. Water Resour. Plan. Manag. 2016, 142, 1–8. [Google Scholar] [CrossRef]
- de Mello Silva, C.; da Silva, G.B.L. Cumulative effect of the disconnection of impervious areas within residential lots on runoff generation and temporal patterns in a small urban area. J. Environ. Manag. 2020, 253, 109719. [Google Scholar] [CrossRef] [PubMed]
- Oreamuno Vega, R.; Villalobos Herrera, R. Estudios Hidrológicos e Hidráulicos en la Cuenca Quebrada Seca-Río Burío; Universidad de Costa Rica: San José, CA, USA, 2015. [Google Scholar]
- Singh, A.; Sarma, A.K.; Hack, J. Cost-Effective Optimization of Nature-Based Solutions for Reducing Urban Floods Considering Limited Space Availability. Environ. Process. 2020. [Google Scholar] [CrossRef]
- Fluhrer, T.; Hack, J. A methodology for assessing the implementation potential for retrofitted and multifunctional urban green infrastructure in public areas. Preprints 2020. [Google Scholar] [CrossRef]
- Neumann, V.A.; Hack, J. A Methodology of Policy Assessment at the Municipal Level: Costa Rica’s Readiness for the Implementation of Nature-Based-Solutions for Urban Stormwater Management. Sustainability 2019, 12, 230. [Google Scholar] [CrossRef] [Green Version]
- Senior, M.; Scheckenberger, R.; Bishop, B. Modeling catchbasins and inlets in SWMM. J. Water Manag. Model. 2018, 2018, 1–12. [Google Scholar] [CrossRef] [Green Version]
- Hoffmann, E.; Winde, F. Generating high-resolution digital elevation models for wetland research using Google EarthTM imagery—An example from South Africa. Water SA 2010, 36, 53–68. [Google Scholar]
- Hossain, F. Digital Elevation Modeling of Saint Martin Island, Bangladesh: A Method Based on Open Source Google Earth Data. Int. J. Adv. Res. 2018, 6, 379–389. [Google Scholar] [CrossRef] [Green Version]
- Day, T.J. On the precision of salt dilution gauging. J. Hydrol. 1976, 31, 293–306. [Google Scholar] [CrossRef]
- Rossman, L.A. Storm Water Management Model User Manual; Version 5; US Environmental Protection Agency: Washington, DC, USA, 2004.
- EPA Environmental Protection Agency; Rossman, L.A.; Huber, W.C. Storm Water Management Model Reference Manual. Volume I—Hydrology (Revised); US Environmental Protection Agency: Washington, DC, USA, 2016; Volume I, p. 231.
- Rossman, L.A. Storm Water Management Model Reference Manual Volume II—Hydraulics; US Environmental Protection Agency: Washington, DC, USA, 2017; Volume II, p. 190.
- Vega, R.O.; Herrera, R.V. Análisis Comparativo de dos Metodologías de Estimación de Caudales Extremos En Áreas Urbanas. In Congreso Corehisa 2016; San José, CA, USA, 2016; Available online: https://docplayer.es/88262112-Congreso-corehisa-2016-san-jose-costa-rica-del-08-y-09-de-setiembre-2016.html (accessed on 19 September 2020).
- US Environmental Protection Agency. Stormwater Management for Federal Facilities under Section 438 of the Energy Independence and Security Act; Cincinnati, OH, USA, 2009. Available online: https://www.epa.gov/nps/stormwater-management-federal-facilities-under-section-438-energy-independence-and-security-act (accessed on 19 September 2020).
- Nash, J.E.; Sutcliffe, J.V. River flow forecasting through conceptual models part I—A discussion of principles. J. Hydrol. 1970, 10, 282–290. [Google Scholar] [CrossRef]
- Moriasi, D.N.; Arnold, J.G.; Van Liew, M.W.; Bingner, R.L.; Harmel, R.D.; Veith, T.L. Model evaluation guidelines for systematic quantification of accuracy in watershed simulations. Trans. ASABE 2007, 50, 885–900. [Google Scholar] [CrossRef]
- James, W. Rules for Responsible Modeling; US Environmental Protection Agency: Cincinnati, OH, USA, 2005; ISBN 0-9683681-5-8.
- Choi, K.; Ball, J.E. Parameter estimation for urban runoff modelling. Urban Water 2002, 4, 31–41. [Google Scholar] [CrossRef]
- Gironás, J.; Niemann, J.D.; Roesner, L.A.; Rodriguez, F.; Andrieu, H. Evaluation of Methods for Representing Urban Terrain in Storm-Water Modeling. J. Hydrol. Eng. 2010, 15, 1–14. [Google Scholar] [CrossRef] [Green Version]
- Rossman, L.A.; Huber, W.C. Storm Water Management Model Reference Manual Volume III—Water Quality; US Environmental Protection Agency: Washington, DC, USA, 2016; Volume II, p. 161.
- Chigbu, N.; Okezie, M.; Arungwa, I.D. Comparative Analysis of Google Earth Derived Elevation with in-situ Total Station Method for Engineering Constructions. In FIG Working Week 2019—Geospatial Information for a Smarter Life and Environmental Resilience; FIG: Hanoi, Vietnam, 2019. [Google Scholar]
- Blumensaat, F.; Wolfram, M.; Krebs, P. Sewer model development under minimum data requirements. Environ. Earth Sci. 2012, 65, 1427–1437. [Google Scholar] [CrossRef]
- Chahinian, N.; Delenne, C.; Commandré, B.; Derras, M.; Deruelle, L.; Bailly, J.S. Automatic mapping of urban wastewater networks based on manhole cover locations. Comput. Environ. Urban Syst. 2019, 78. [Google Scholar] [CrossRef]
- Titterington, J.; Squibbs, G.; Digman, C.; Allitt, R.; Osborne, M.; Eccleston, P.; Wisdish, A. Code of Practice For The Hydraulic Modelling of Sewer Systems; The Chartered Institution of Water and Environmental Management (CIWEM): London, UK, 2017; Volume 1. [Google Scholar]
Figure 1.
Location and boundaries of the study area (left) in the Great Metropolitan Area in Costa Rica, within the Quebrada Seca watershed.
Figure 1.
Location and boundaries of the study area (left) in the Great Metropolitan Area in Costa Rica, within the Quebrada Seca watershed.
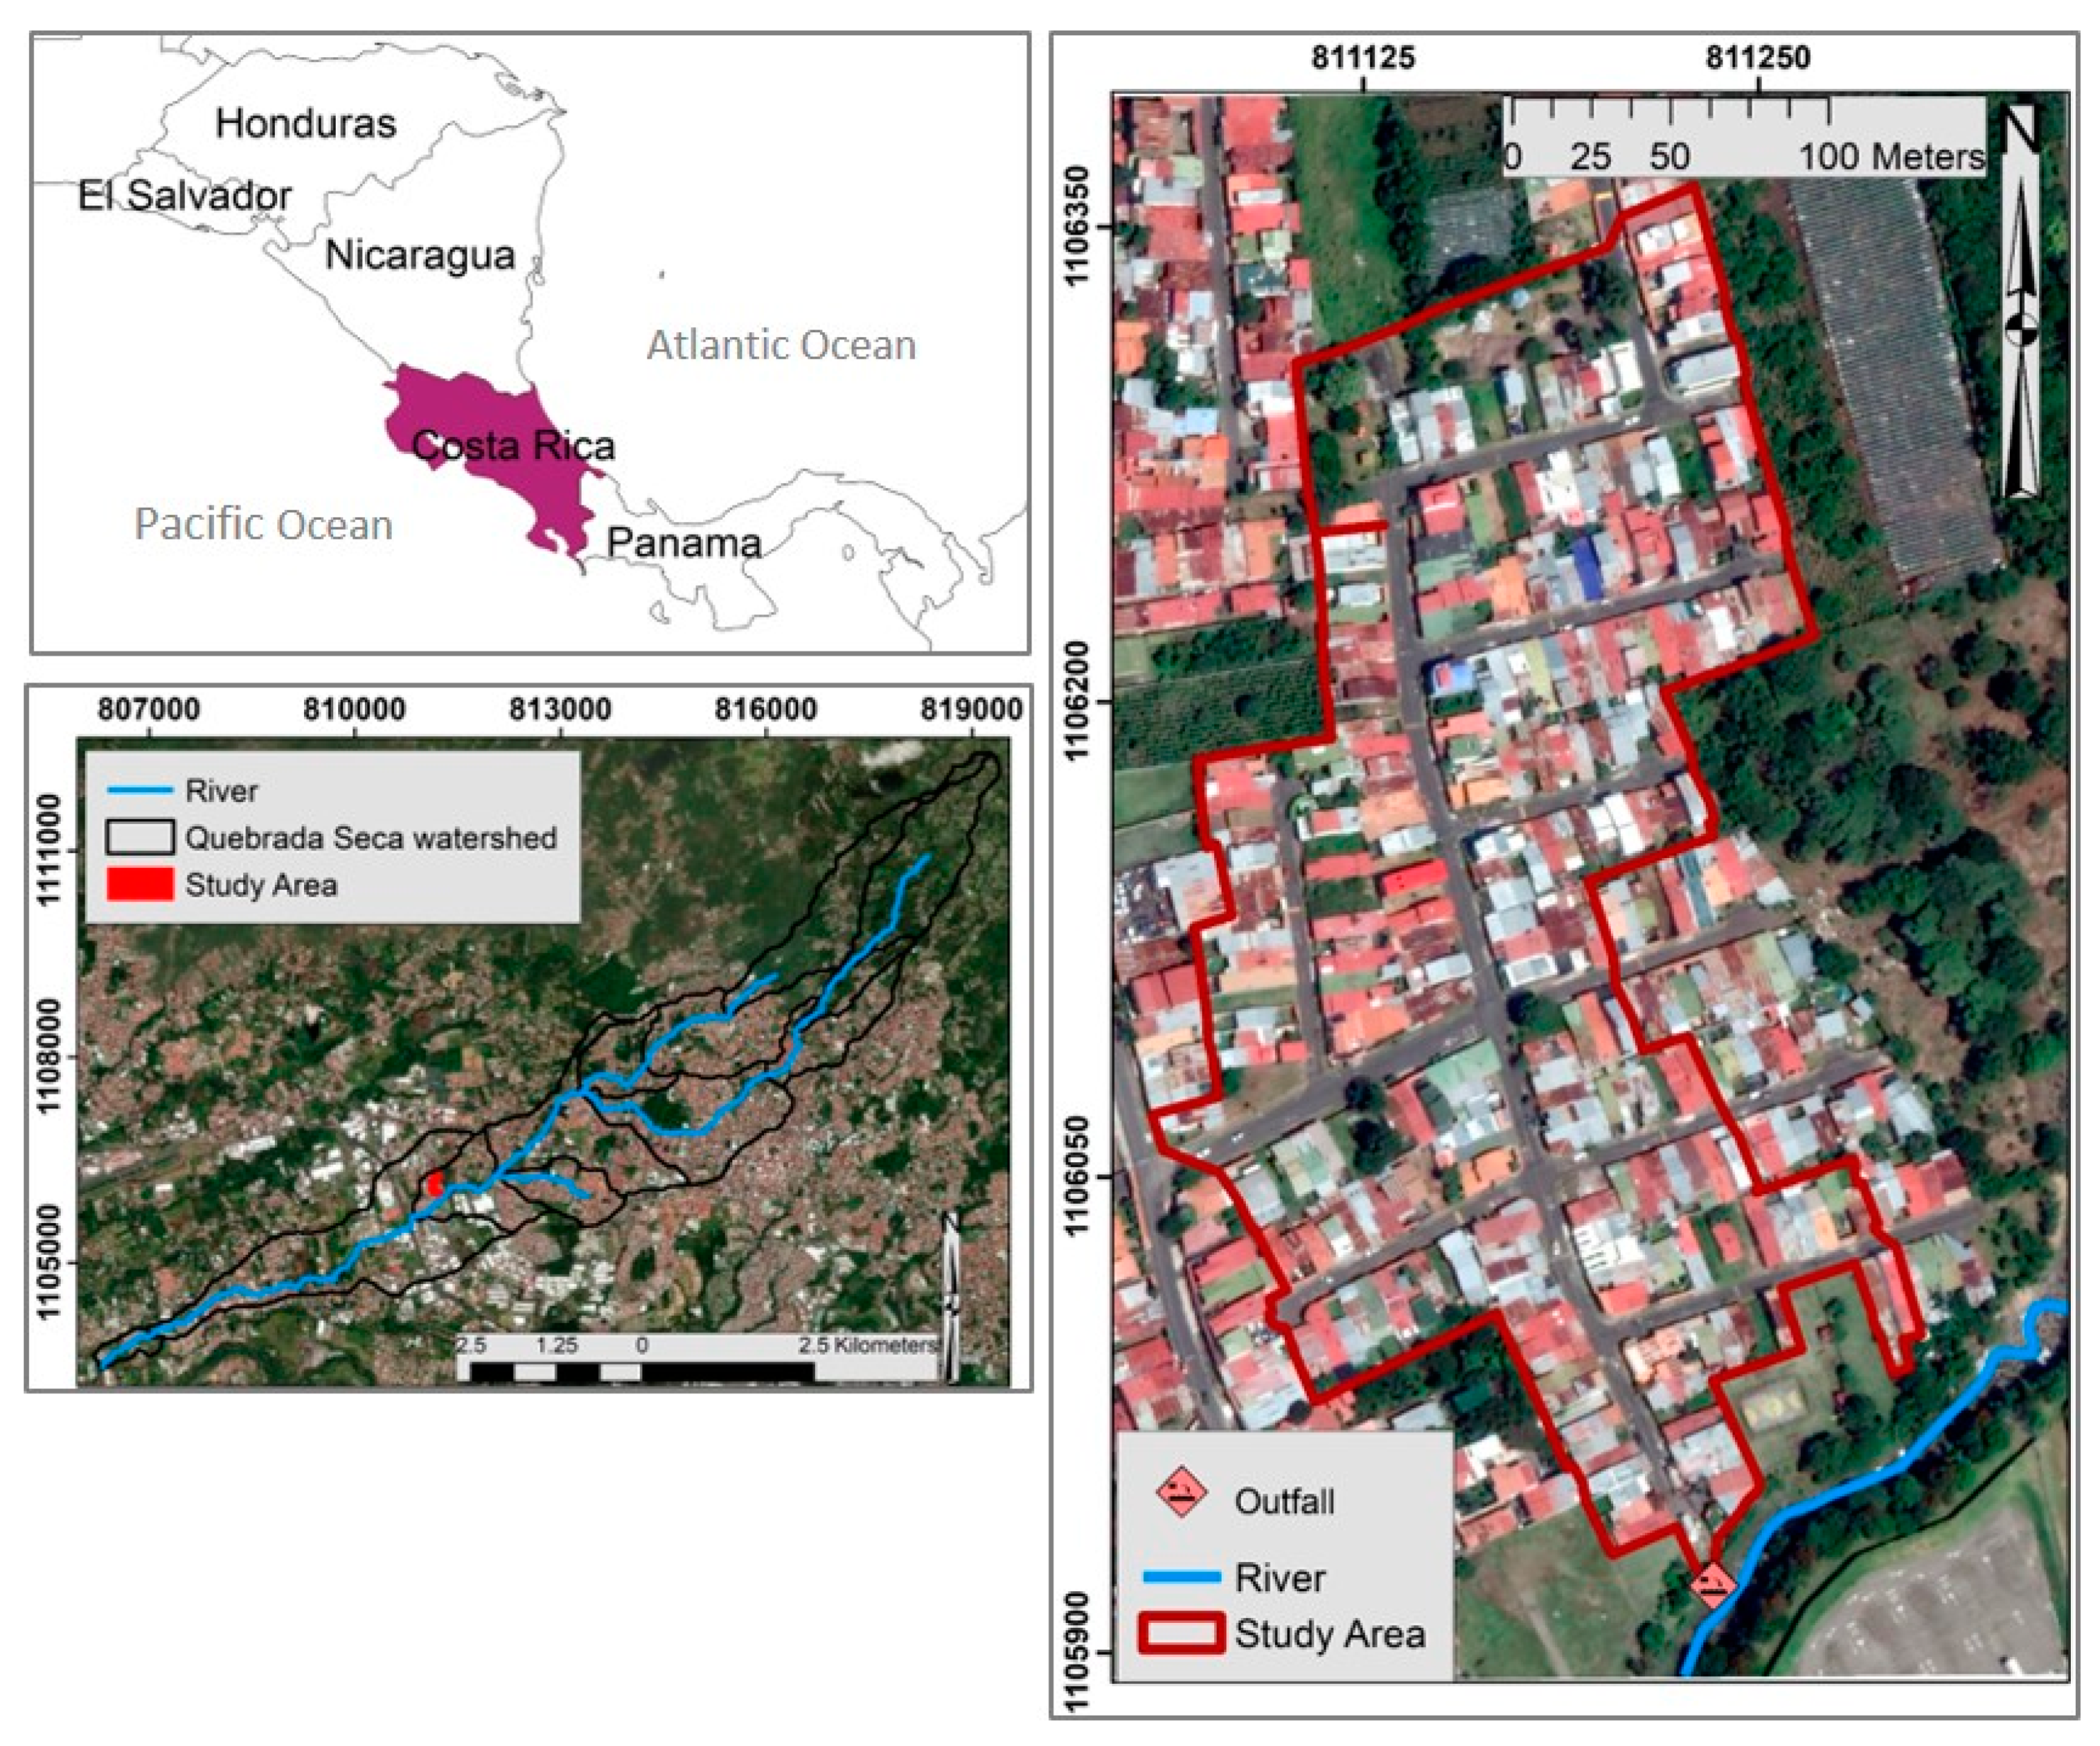
Figure 2.
Overview of the existing storm sewer system in the study area (top) including a schematic representation of the runoff flow pattern through the storm water structures (bottom, adapted from Senior et al. [36]).
Figure 2.
Overview of the existing storm sewer system in the study area (top) including a schematic representation of the runoff flow pattern through the storm water structures (bottom, adapted from Senior et al. [36]).

Figure 3.
Representation of the runoff pathway through the stormwater network for the existing condition (top left) and with simulated Green Stormwater Infrastructure (GSI) elements (top right), including their location on the site (bottom).
Figure 3.
Representation of the runoff pathway through the stormwater network for the existing condition (top left) and with simulated Green Stormwater Infrastructure (GSI) elements (top right), including their location on the site (bottom).

Figure 4.
Observed vs. simulated flow depth during calibration (Left, event S1), and validation (right, event S2).
Figure 4.
Observed vs. simulated flow depth during calibration (Left, event S1), and validation (right, event S2).

Figure 5.
Rainfall-runoff response at the study area’s outfall of the existing condition and after implementation of GSI elements for six different storm events: (a) Storm Event S3; (b) Storm Event S4; (c) Storm Event S5; (d) Storm Event S6; (e) Storm Event S7; (f) Storm Event S8 (PR = Peak Reduction Rate of GSI elements and VR = Volumetric Reduction Rate of GSI elements).

Table 1.
Storm Water Management Model (SWMM) parameter values employed in the model. “Initial” values were obtained from theoretical references. “Final” values are derived from calibration and validation.
Table 1.
Storm Water Management Model (SWMM) parameter values employed in the model. “Initial” values were obtained from theoretical references. “Final” values are derived from calibration and validation.
| Depression Storage, Ds (mm) | Manning’s Coefficient, n (s/m1/3) | Soil Conservation Service (SCS) Curve Number | ||||||||
|---|---|---|---|---|---|---|---|---|---|---|
| Permeable Area | Impermeable Area | Permeable Area | Impermeable Area | Conduit | Street/Roof | Garden | Park | |||
| 2.54 | Initial | Final | 0.3 | Initial | Final | Initial | Final | 98 | 34 | 58 |
| 6.35 | 3.35 | 0.01 | 0.03 | 0.16 | 0.01 | |||||
Table 2.
Summary for the selected storm events.
| Event Code | Date (Month/Day/Year) | Type of Event | Duration (h) | Mean Rainfall (mm/h) | Total Rainfall (mm) |
|---|---|---|---|---|---|
| S1 | 7/8/2019 | Used for Calibration | 6 | 4.5 | 27 |
| S2 | 7/14/2019 | Used for Validation | 5.37 | 4.547 | 24.4 |
| S3 | 4/24/2017 | Extreme Events | 4.25 | 22.5 | 95.5 |
| S4 | 8/29/2016 | 4.08 | 15.0 | 61.22 | |
| S5 | 5/24/2018 | 95 percentile | 5.08 | 8.2 | 41.91 |
| S6 | 11/11/2017 | 90 percentile | 2.08 | 16.7 | 34.8 |
| S7 | 11/9/2018 | 75 percentile | 2.25 | 11.7 | 26.42 |
| S8 | 5/31/2017 | 50 percentile | 1.1 | 13.6 | 15 |
Table 3.
SWMM-LID parameters employed to model GSI elements.
| Layer | Parameters | Retention-Infiltration Basins (RIB) | Micro Infiltration Trenches (MT) | Street Planters (SP) |
|---|---|---|---|---|
| Surface | Berm Height (mm) | 250 | 100 | 200 |
| Vegetation Volume (fraction) | 0.1 | 0.0 | 0.1 | |
| Surface Roughness (Manning n) | 0.01 | 0.01 | 0.01 | |
| Storage | Thickness (mm) | 900 | 500 | 900 |
| Void Ratio (interspace/solid) | 0.75 | 0.75 | 0.75 | |
| Seepage Rate (mm/hour) | 80 | 0 | 80 | |
| Soil | Thickness (mm) | 350 | - | 400 |
| Porosity (Volume fraction) | 0.5 | - | 0.65 | |
| Field Capacity (Volume fraction) | 0.062 | - | 0.25 | |
| Wilting point (Volume fraction) | 0.024 | - | 0.15 | |
| Conductivity (mm/hour) | 140 | - | 140 | |
| Conductivity Slope (-) | 39.3 | - | 39.3 | |
| Suction head (mm) | 1.93 | - | 4.8 |
Table 4.
Calibration and validation results summary. RE: Relative Error; NSE: Nash–Sutcliffe Efficiency.
Table 4.
Calibration and validation results summary. RE: Relative Error; NSE: Nash–Sutcliffe Efficiency.
| Task | Event | Peak Depth | Mean Depth | R2 | NSE | ||||
|---|---|---|---|---|---|---|---|---|---|
| Observed (m) | Simulated (m) | RE (%) | Observed (m) | Simulated (m) | RE (%) | ||||
| Calibration | S1 | 0.168 | 0.1861 | −10 | 0.05033 | 0.0422 | 16 | 0.8 | 0.726 |
| Validation | S2 | 0.158 | 0.1376 | 12.9 | 0.0583 | 0.05219 | 10.4 | 0.8 | 0.768 |
© 2020 by the authors. Licensee MDPI, Basel, Switzerland. This article is an open access article distributed under the terms and conditions of the Creative Commons Attribution (CC BY) license (http://creativecommons.org/licenses/by/4.0/).
Share and Cite
MDPI and ACS Style
Towsif Khan, S.; Chapa, F.; Hack, J. Highly Resolved Rainfall-Runoff Simulation of Retrofitted Green Stormwater Infrastructure at the Micro-Watershed Scale. Land 2020, 9, 339. https://doi.org/10.3390/land9090339
AMA Style
Towsif Khan S, Chapa F, Hack J. Highly Resolved Rainfall-Runoff Simulation of Retrofitted Green Stormwater Infrastructure at the Micro-Watershed Scale. Land. 2020; 9(9):339. https://doi.org/10.3390/land9090339
Chicago/Turabian StyleTowsif Khan, Sami, Fernando Chapa, and Jochen Hack. 2020. "Highly Resolved Rainfall-Runoff Simulation of Retrofitted Green Stormwater Infrastructure at the Micro-Watershed Scale" Land 9, no. 9: 339. https://doi.org/10.3390/land9090339
Note that from the first issue of 2016, this journal uses article numbers instead of page numbers. See further details here.