Article

Highlighting the Sustainability Implications of Urbanisation: A Comparative Analysis of Two Urban Areas in Ghana

Department of Life and Environmental Sciences, Faculty of Science and Technology, Bournemouth University, Fern Barrow, Poole BH12 5BB, UK
*
Author to whom correspondence should be addressed.
Land 2020, 9(9), 300; https://doi.org/10.3390/land9090300
Submission received: 15 July 2020 / Revised: 15 August 2020 / Accepted: 25 August 2020 / Published: 27 August 2020
(This article belongs to the Section Urban Contexts and Urban-Rural Interactions)

Abstract

:
Ghana is urbanising rapidly, and over half of the country’s population have lived in urban areas since 2010. Although research has proliferated to explore Ghana’s urbanisation, there is a dearth of research that holistically explores the wider sustainability implications of urbanisation, offers comparative perspectives in the context of large and smaller urban areas, and provides a perspective of local level urbanisation in the context of resource extraction (mining). This study comparatively assesses two urban areas in Ghana (Kumasi and Obuasi), by conducting a spatio-temporal analysis of land cover change through remote sensing and by analysing demographic change through a synthesis of published population data, in order to highlight the sustainability implications of urbanisation. The results show that urbanisation has been rapid, and has resulted in changes in land cover and demography in Kumasi and Obuasi. The sustainability implications of urbanisation are identified to include limited economic opportunities, socio-spatial segregation, and destruction of natural vegetation. The evidence in this study provides insights into urbanisation in Ghana, and suggests that the positive sustainability impacts of urbanisation may be eroded by how factors such as market forces and land tenure interact at the local level.

1. Introduction

Arguably the most significant socio-economic process in the 20th and 21st centuries, urbanisation, a process which entails the incremental spatial concentration of a country’s population in well-defined urban areas (cities), has led to over half of the global population being classified as urban [1]. Furthermore, with the popularisation of sustainable development (SD) or sustainability, and the clarion call for development processes to proceed in ways consistent with the principles of SD, countries have made efforts to instil an ethos of sustainability into the development agenda in ways that ensure that socio-economic growth is less environmentally-damaging, and to guarantee fairness in access to development benefits both within and across generations [2]. However, with over 90% of future global growth expected to occur in the cities of the global South [3], rapid urbanisation presents extensive challenges to achieving SD in the urban areas of less-developed countries [4,5,6]. These challenges include, but are not limited to, urban sprawl, socio-economic inequalities, natural environment degradation, and climate change impacts. In less-developed countries, the challenges identified could erode the positive benefits of urbanisation, which include opportunities for improved economic growth and improved living standards [7,8]. Essentially, the exigency for sustainable urbanisation in less-developed countries is demonstrated by the reality that the ramifications of the challenges outlined above are exacerbated by pervasive poverty and widespread unemployment [9]. The pervasiveness of poverty and unemployment, in turn, potentially undermines the capacity of less-developed countries to meet the demands and difficulties of rapid urbanisation [9]. However, the impacts of the complex urbanisation process, especially in countries of the global South, are poorly understood. In Africa, this situation is complicated by the paucity of data (e.g., urbanisation-related data) on urban areas [10].
In Ghana, over half of the population live in urban areas as rapid urbanisation has resulted in substantial changes to the country’s landscape and demography [11]. Consistent with global trends, rapid urbanisation poses challenges to urban sustainable development in Ghana, and the capacity of relevant authorities to manage the demographic and landscape transition in an efficient, equitable, and sustainable manner is threatened. This necessitates special attention as it is widely recognised that sustainability in urban areas is central to achieving global sustainability [12,13]. Consequently, scholars, e.g., [14,15,16], have conducted research to help improve understanding of urbanisation in Ghana. However, while previous studies have improved understanding of the ongoing urbanisation process in Ghana, and have helped to characterise trends in urban expansion, there is: (i) a dominant focus on aspects of urbanisation such as natural habitat fragmentation and urban sprawl analysis, e.g., [15,17], at the expense of a wider sustainability focus that provides a holistic perspective of the social, economic, and environmental impacts of urbanisation; (ii) limited comparative context beyond the focus on large urban areas in Ghana (e.g., Kumasi, Accra, Tema, etc.), e.g., [17], at the expense of smaller urban areas; and (iii) a limited focus on urbanisation in mining areas considering the fact that Ghana is a major natural resource commodity exporting country, and mining is reported to contribute to the largest share of foreign direct investment (FDI) in Ghana [18,19,20]. Therefore, the extent to which the extant literature holistically captures the sustainability implications of landscape and demographic urbanisation in Ghana, especially in a comparative context, is limited, possibly due to the specific perspectives and objectives of previous studies.
Considering the identified impacts of rapid urbanisation on sustainability in less-developed countries highlighted earlier, a critical challenge for urban managers and stakeholders in Ghana, is how to effectively guide urbanisation in a manner that promotes sustainability. Therefore, the aim of this paper is to improve understanding of the interactions between the urbanisation and SD processes in Ghana by addressing the research gaps identified previously. As part of a wider PhD research project that aims to provide an African perspective of urban sustainability; a comparative case study that explores how urbanisation undermines or contributes to sustainable development (sustainability) at the local urban level based on two urban areas (Kumasi and Obuasi) in Ghana is designed. In general, the basis for comparatively assessing Kumasi and Obuasi in this paper is mainly underpinned by recognition in the literature about how city size (i.e., absolute population size in an urban area at a particular time) shapes the dynamics and outcomes of urbanisation [21]. In this context, there is mixed evidence about how the urbanisation processes in large (population greater than 500,000) and smaller urban areas (population less than 500,000) unfold. Therefore, while large urban areas are expected to expand faster than smaller ones in an increasingly globalised world [22,23], diverging scenarios have been observed or projected. For instance, it has been argued that urban growth patterns are similar in urban areas of different sizes [23,24]. Nevertheless, it has also been suggested that urban expansion would be slower in smaller urban areas than in large ones during the early stages of urbanisation [24], whereas urban expansion in smaller urban areas is expected to be higher in magnitude than in large areas during the late stages of urbanisation due to overpopulation and overcrowding in large urban areas [25]. Therefore, with the ongoing urban transition in Ghana, the comparative analysis of Kumasi (large urban area) and Obuasi (small urban area) offered in this paper will enable an assessment of the intricacies of urbanisation and the sustainability implications thereof, in large and smaller urban areas of Ghana.

2. Literature Review

2.1. Urbanisation and SD (Sustainability) in the Context of Land Cover Change (LCC)

Following the United Nations Conference on Human Environment in Stockholm, 1972, which highlighted the need to conserve the environment, SD emerged as a leading development paradigm, and was consolidated in mainstream international development discourses through the publication of ‘Our Common Future’ by the Brundtland Commission [26]. The definition of SD was provided by the Brundtland Commission as “development that meets the need of the present generation, without compromising the ability of future generations to meet their own needs” [26] (p. 8). Used alongside, and sometimes in place of SD (as evident in this paper), is the term ‘sustainability’, which has emerged to describe futuristic thinking where there is a focus on balancing economic, social, and environmental issues when making decisions concerning the well-being of society [2].
Consequently, in the context of the present study, spatial relationships are seen as some of the most vital factors that influence the various dimensions of sustainability [27]; and according to [28], appropriate spatial information represents one of the most essential tools used in the analysis of questions of sustainability. Accordingly, remote sensing has gained recognition as an effective tool used in the analysis of spatio-temporal landscape change dynamics at different levels [29,30]. The application of remote sensing techniques in the study of LCC helps to improve the fundamental understanding of the dynamics of urbanisation in the context of sustainability as, for example, it helps to highlight the ecological consequences of urbanisation through analysis of aspects such as natural vegetation destruction, deforestation, and ecosystem services [31].
The literature also highlights the importance of LCC-related data and maps for sustainability analysis [32,33]. Specifically, LCC outputs enable analysis of urban sprawl, which [34] define as “rapid, low-efficient, and disorderly growth of non-agricultural land towards peripheral areas”. Typically, urban sprawl characterises the uncontrolled expansion of urban areas, thereby resulting in urban areas moving beyond administrative boundaries and into adjoining districts [34,35]. Due to urban sprawl, the urban landscape (form) is reshaped and urban areas attain attributes which include low density development (which characterises single or small family neighbourhoods which are far from consolidated city centres where the core of urban services exist), and scattered neighbourhoods [36]. Furthermore, urban sprawl contributes to segregated land-use regimes [36,37], and peri-urbanisation, which is the extension of urban areas beyond administrative boundaries into adjoining rural districts such that there is a clash between urban and rural uses of land [36]. However, some scholars, e.g., [38], call for a cautious interpretation of the significance of density as its perception may be cultural rather than absolute. Critically, the sustainability implications of urban sprawl include, but are not limited to: ecological habitat fragmentation; traffic congestion and the resulting air pollution (through increased greenhouse gas emissions); increase in urban temperature; restricted coverage and access to urban services; and socio-spatial segregation, which leads to a situation where the urban poor are far removed from the urban central district where economic opportunities are concentrated, thereby potentially missing out on jobs and urban services [39].

2.2. Urbanisation in Ghana

Urbanisation has led to changes in Ghana’s landscape and demography [11,17]. The rapid pace of urbanisation in Ghana has outpaced planning provisions, and has created pressure on the availability and access to urban services including housing, education, etc. [40]. Accordingly, research has emerged to document the urbanisation process and patterns in Ghana. For example, from a regional-level perspective, [41] have conducted a classification and assessment of LCC change in southern Ghana using remotely-sensed satellite imagery. Their findings indicate that the increasing urban population in Ghana has resulted in urban expansion, and has led to the reduction in natural land cover. In the southern part of Ghana, where urbanisation is rapid, [41] conclude that current urban expansion has reinforced environmental degradation patterns, which started before the year 2000. Similarly, from a municipal-level perspective, [42] have analysed historical and future land cover change in the New Juaben Municipality in Ghana. Their study provides empirical evidence of rapid urbanisation in Ghana, and they conclude that urbanisation, as characterised by expanded urban physical infrastructure, has led to the decline in natural vegetation cover, which is primarily characterised by rapid loss in hitherto arable lands. Nevertheless, the rapid nature of urbanisation in Ghana means that there is still limited understanding; and with the exception of a few (e.g., [43]) the existing literature has mainly focused on a single city or region as the unit of analysis e.g., [41,42]. This potentially means that differences in urbanisation patterns at different city scales (e.g., between small cities and large cities) are rarely discussed, although variations in factors such as socio-economic conditions or geophysical conditions may shape their respective urbanisation patterns [44]. This suggests that gaining a deeper understanding of the urbanisation process in Ghana will require an appreciation of the patterns in multiple urban areas. Furthermore, natural resource exports, especially through mineral resource extraction, contribute significantly to development in Ghana through taxes, royalties, etc. [18,20]. In this context, given Ghana’s history of mining, several studies have been conducted to explore the relationship between the mining industry and the national economy, its impact on the environment, and the role of corporate social responsibility (CSR), e.g., [45,46,47,48]. However, there is relatively little research on the interactions between mining and urbanisation from a sustainability perspective. As a result, [18,19] have argued that although much has been written about mining in Ghana, and also about urban settlements, the inter-linkages are poor as these studies have been considered independently by the scholars in the respective fields.
Consequently, the literature reviewed shows the limited and highly-nuanced nature of scholarly work on urbanisation in Ghana, especially in the comparative and wider sustainability analysis contexts, and provokes the following questions: what are some of the key factors that mediate the interactions between urbanisation and sustainability in Ghana? What are the patterns of urban spread at the local level in Ghana? What are the possible implications of urbanisation in Ghana in the context of sustainability? In answering these questions, this paper offers an extended literature review of key concepts that moderate urbanisation in Ghana, and also provides a bespoke analysis of the local urbanisation patterns. Following the review of literature in this section, the next section will offer an extended review of concepts such as globalisation and neoliberalism, land tenure, etc., in order to highlight how these concepts potentially mediate the sustainability outcomes of urbanisation in Ghana.

3. Review on Key Concepts or Processes that Potentially Mediate the Sustainability Outcomes of Urbanisation in the Ghanaian Context

The disparate nature of urbanisation and SD makes it difficult to analyse the interrelationships between the two processes. This difficulty is made more complex by the lack of a theoretical framework for analysing SD due to its fuzziness and transdisciplinary nature [49]. More importantly, the lack of urban data (e.g., urbanisation-related data) in Africa [10] means that, more often than not, when national level data exist, disaggregated data on urban areas may be absent. Therefore, the expectation is that pulling together strands of literature on selected important processes will complement the analyses of data generated in the comparative study and enable inferences on the possible outcomes of urbanisation in Ghana in the context of sustainability. As a result, while the concepts or processes that are highlighted in this section are in no way exhaustive, they are considered relevant for adequately capturing the interactions between urbanisation and sustainability in the Ghanaian context, and more importantly, within the scope of the wider PhD research project whose findings are presented in this paper (i.e., research aim; data types and availability; project time frame, etc.).

3.1. Land Tenure

Land plays a strategic, yet complex, role in development. In simple terms, land tenure describes the set of procedures that determine how access is granted for the use, control, and transfer of land in a jurisdiction. According to [50], the livelihoods of many people in less-developed countries fundamentally depend on access to land. This assertion especially holds in places such as Africa where many people engage in subsistence farming, thereby making land tenure security crucial for meeting the development needs of people [51]. For the poor, a lack of access to land resources potentially represents an existential threat as the capacity of poor people to participate in, and exploit social, economic and civic opportunities tends to be undermined. In the context of urbanisation, land tenure and access are critical, as population growth due to urbanisation creates demand for more land to accommodate expanding urban functions. In some cases, demand for land tends to outpace supply within a specific urban boundary, thereby affecting surrounding areas.
In Ghana, where customary land tenure predominates, traditional leaders assume ownership of land for and on behalf of communities [52]. In specific terms, about 80% of land is held under customary ownership, while the rest is primarily owned by the State [52]. With the permission of the owner, land in Ghana may be rented or leased over a period of time (e.g., months, years) for various purposes including agriculture and housing [53]. This means that outright ownership of land in Ghana is limited. Therefore, the land and development needs of most Ghanaians are, sometimes, schematically influenced by the interests of land owners and other stakeholders such as the government, multi-national companies (MNCs), etc. The literature alludes to how land tenure, especially customary ownership, influences land-use and urban planning decisions, and by extension, urbanisation and urban development in Ghana. Essentially, [54] argue that the land tenure system in Ghana has made it possible for traditional leaders, who are the key persons in customary ownership, to usurp formal planning institutions in the areas of land-use determination and management. This is because while national institutions provide plans and policies to guide urban development, it is the traditional leaders who lease and allocate land within the respective jurisdictions. Where this dominance by traditional leaders (in terms of land allocation) is unregulated, as is mostly the case, they tend to assume the role of planning institutions, and, together with their surveyors, make land-use decisions that may not align with the core values of urban planning. It is, however, interesting to note that the suggested interferences on land-use and urban planning-related issues, mostly by customary land owners, are sometimes embraced by a wider section of the Ghanaian society due to reported corruption and bureaucracies encountered when engaging formal planning institutions. This is not surprising as the literature, e.g., [55,56], suggests that defiance of Ghana’s statutory land-use plans instead of adherence by developers is common. This does not suggest that customary land ownership is the cause of the urbanisation and land-use challenges in Ghana, but it demonstrates the key role it plays in (un)sustainable urban development in Ghana.
Furthermore, in Ghana’s mining regions, [53] suggest that with the decreasing value of agricultural land-use due to factors such as unpredictable income, climate stresses, etc., landowners appear to perceive mining leases as more economically-viable options. As a result, the livelihoods of some citizens (especially farmers) in the mining areas of Ghana are possibly threatened as land owners gravitate towards leases for small-scale mining activities. Even in areas where large-scale mining activities conducted by MNCs exist, the land-use interests of general citizenry tend to be subservient to those of MNCs whose interests are usually protected by the central government. Therefore, in most cases, citizens in communities are rendered landless, as land is annexed for large-scale mining operations through the application of legal instruments, because of the mutual economic benefits both the MNCs (e.g., profits) and the government (e.g., taxes and royalties) are likely to accrue. For example, in the development of Newmont Ghana’s Ahafo gold mine, over 9000 people (mostly farmers) were displaced from their lands [57]. While compensation is sometimes paid to communities, and MNCs usually undertake CSR projects to maintain their social licence to operate, these might be insignificant when the livelihoods and long-term development needs of communities are considered. In all, it is evident that land tenure and access, perceived or factual, are critical in the context of SD and urbanisation, especially in cases where people need to sustain their livelihoods or establish themselves as citizens in urban areas.

3.2. Globalisation and Neoliberalism

Globalisation is the collective name that describes complex processes that facilitate the interexchange of people, trade, capital, services, information, etc., across the globe. As a conduit of globalisation, FDI results when investment in an existing or new business in one country is made by an MNC whose headquarters is usually located in another country [58]. In response to Ghana’s economic woes in the 1980s, a situation that had been exacerbated by the oil crises of the 1970s, the country undertook an Economic Recovery Programme in 1983, and acting on the recommendation of Bretton Woods institutions (e.g., World Bank), implemented a structural adjustment programme, in order to stimulate and sustain economic growth in the country. These economic programmes facilitated the mainstreaming of neoliberalism, and according to [59] (p. 89),
“the political precept of neoliberalism is that, while all essential collective decisions need to include the constitutional State, State intervention in the social and economic life should generally be minimal. Rather, the role of the State should be primarily to guarantee and ensure freedom of individual economic agents”.
Therefore, the past four decades of globalisation and structural adjustment of Ghana’s economy has seen the country assume a more liberalised posture, thereby competing for more FDI and exposing all sectors of the economy to market forces. Similar to other less-developed countries, FDI in Ghana is dominated by the natural resource sector, especially the mining and oil sectors [60]; and according to [20], the largest share of FDI in Ghana is expended in the mining sector. Consequently, the literature has highlighted how globalisation through FDI in the mining sector impacts development in Ghana. Ref. [46] highlight how the economic benefits of mining are accrued both within and beyond mining communities in Ghana. They argue that mining supports the wider national economy through tax receipts, the spending of wages and profits within the country, as well as the economic benefits of activities that are established to provide specific services for mining companies. Furthermore, mining MNCs in Ghana provide vital socio-economic infrastructure and services including hospitals, schools, etc., through CSR policies [61]. These CSR projects are sometimes a vital source of development, especially where central government provision is lacking. Notwithstanding the benefits of mining in Ghana, its negative impacts have also been highlighted, for example, Ref. [62] argue that the economic benefits of mining in Ghana, in the form of taxes, royalties etc., are eroded by the attendant health, social, and environmental costs. They suggest that communities are likely to encounter pernicious health impacts of mining such as silicosis and hearing loss, while blasting activities generate noise and dust, which are a nuisance. Furthermore, they argue that advanced technologies used in large-scale mining mean that employment opportunities that are created in the mining communities are minimal, and when this is considered vis-a-vis increased migration into mining areas, then, mining operations are likely to worsen unemployment situations and pressurise existing socio-economic facilities. Critically, in the context of urbanisation, this shows that there is ambivalence as to whether globalisation, through mining-related FDI, creates a positive balance in the trade-off between benefits and negative impacts.
Consistent with the mainstreaming of a neoliberal ethos in Ghana’s policy framework, and in response to the challenges of rapid urbanisation in Ghana, a form of urban governance that could be best described through the concept of urban entrepreneurialism has emerged. In simple terms, urban entrepreneurialism is when market mechanisms are exploited and unleashed in order to achieve public goals in an urban area, but with minimal intervention by the constitutional State [63,64,65]. Urban entrepreneurialism could be a double-edged sword as it may lead to the growth and regeneration of urban areas [66], but at the same time create pernicious effects that deepen existing divisions in urban areas [64]. In some cases, scholars, e.g., [67], have noted that the neoliberal realignment in urban areas (promoted by entrepreneurialism) has never guaranteed social integration, cohesion or the survival of the social groups that its market mechanisms tend to marginalise. Importantly, the liberalisation of Ghana’s economy has also led to increased FDI in the country’s non-mining urban areas. As a result, special economic zones have been created and real estate development has boomed to characterise the emergence of new urban nuclei that are fundamentally shaped by the forces of globalisation. For example, in Accra (Ghana’s capital city), which is reported to receive about 80% of all inward FDI projects in Ghana [16], the following have emerged: (i) special economic zones (e.g., Accra Airport City, which is a public–private partnership project between Ghana Airports Company Limited and private sector investors) which concentrate high-end commercial ventures including hotels, offices, and shopping malls within a mini-enclave; (ii) inner city gated communities (e.g., Lakeside Estate), which provide modern Western-style housing; and (iii) satellite city projects (e.g, Apollonia City) which are characterised by housing, commercial avenues, and other facilities that are being built from scratch [16]. However, it can be argued that despite the benefits of globalisation in Ghana’s urban areas, the possible segregation of citizens in an urban space where disadvantaged groups such as low-income citizens exist at one end, and citizens who are economically, socially, and politically hegemonic also exist at the other end, cannot be underestimated in the context of sustainability.

3.3. Poverty, Employment, and Informality

The overall incidence of poverty in Ghana has reduced substantially since 2000, and Ghana achieved its Millennium Development Goals (MDG) target of halving the proportion of the population living in poverty [68]. Statistical evidence shows that poverty levels had reduced from about 56% in the 1990s to about 24% in 2013. Nevertheless, rapid urbanisation and population growth have resulted in the proportion of urban-poor increasing over time. For example, although the poverty rate in Accra reduced from 23% in 1992 to about 4% in 1999, it increased again to 11% by 2006 [69]. Unemployment, especially in urban areas, is widespread as the burgeoning urban population in Ghana means that the demand for jobs exceeds supply [70,71]. Exploring the links between urbanisation and employment, Ref. [72] (p. 130) notes that “Africa’s pattern of ‘urbanisation without growth’ is in part the result of distorted incentives that encouraged migrants to exploit subsidies rather than in response to opportunities for more productive employment”.
Furthermore, Ref. [73] (p. 261) argues that “migration rates go up when [urban] employment is being generated but are not sustained in the face of strong negative changes in urban economies, incomes and condition; they change in logical ways and according to the basic precepts of standard neo-classical migration theory”.
In the Ghanaian context, most migrants who move from rural to urban areas end up in the informal sector, which describes a multitude of characteristics, including street hawking, slum housing, and unregulated labour markets, which exist outside the regulative ambit of authorities [74], due to various reasons including a lack of social network [70,71]. The dominance of the informal sector in Ghana is attributed to reasons which include, but are not limited to, public sector employment freezes and the effects of globalisation, resulting in local private sector firms folding up due to competition from foreign firms [71]. The contribution of informality to the employment situation in urban Ghana is significant as the informal sector is estimated to constitute about 80% of Ghana’s total labour force [71,75]. The impacts of informality in the Ghanaian urban space have been captured by [76] whose research shows that some migrants and urban citizens in Accra end up in low-class neighbourhoods due to how uneven economic development processes create residential segregation (in terms of class) among urban citizens. Ref. [76] further argue that the residential segregation resulting from a stratified urban economic space in Accra undermines social equity and harmony, thereby creating the need for policy to address urban poverty and unemployment. In a comparative context, Ref. [77] also argue that ethnic residential segregation in Ghana’s two biggest cities (Accra and Kumasi) is mainly influenced by the socio-economic circumstances of migrants and indigenous populations. Ref. [77] further suggest that national security and coherence is threatened when decongestion exercises by urban managers target locations where certain migrant and indigenous populations mainly reside.

4. Materials and Methods

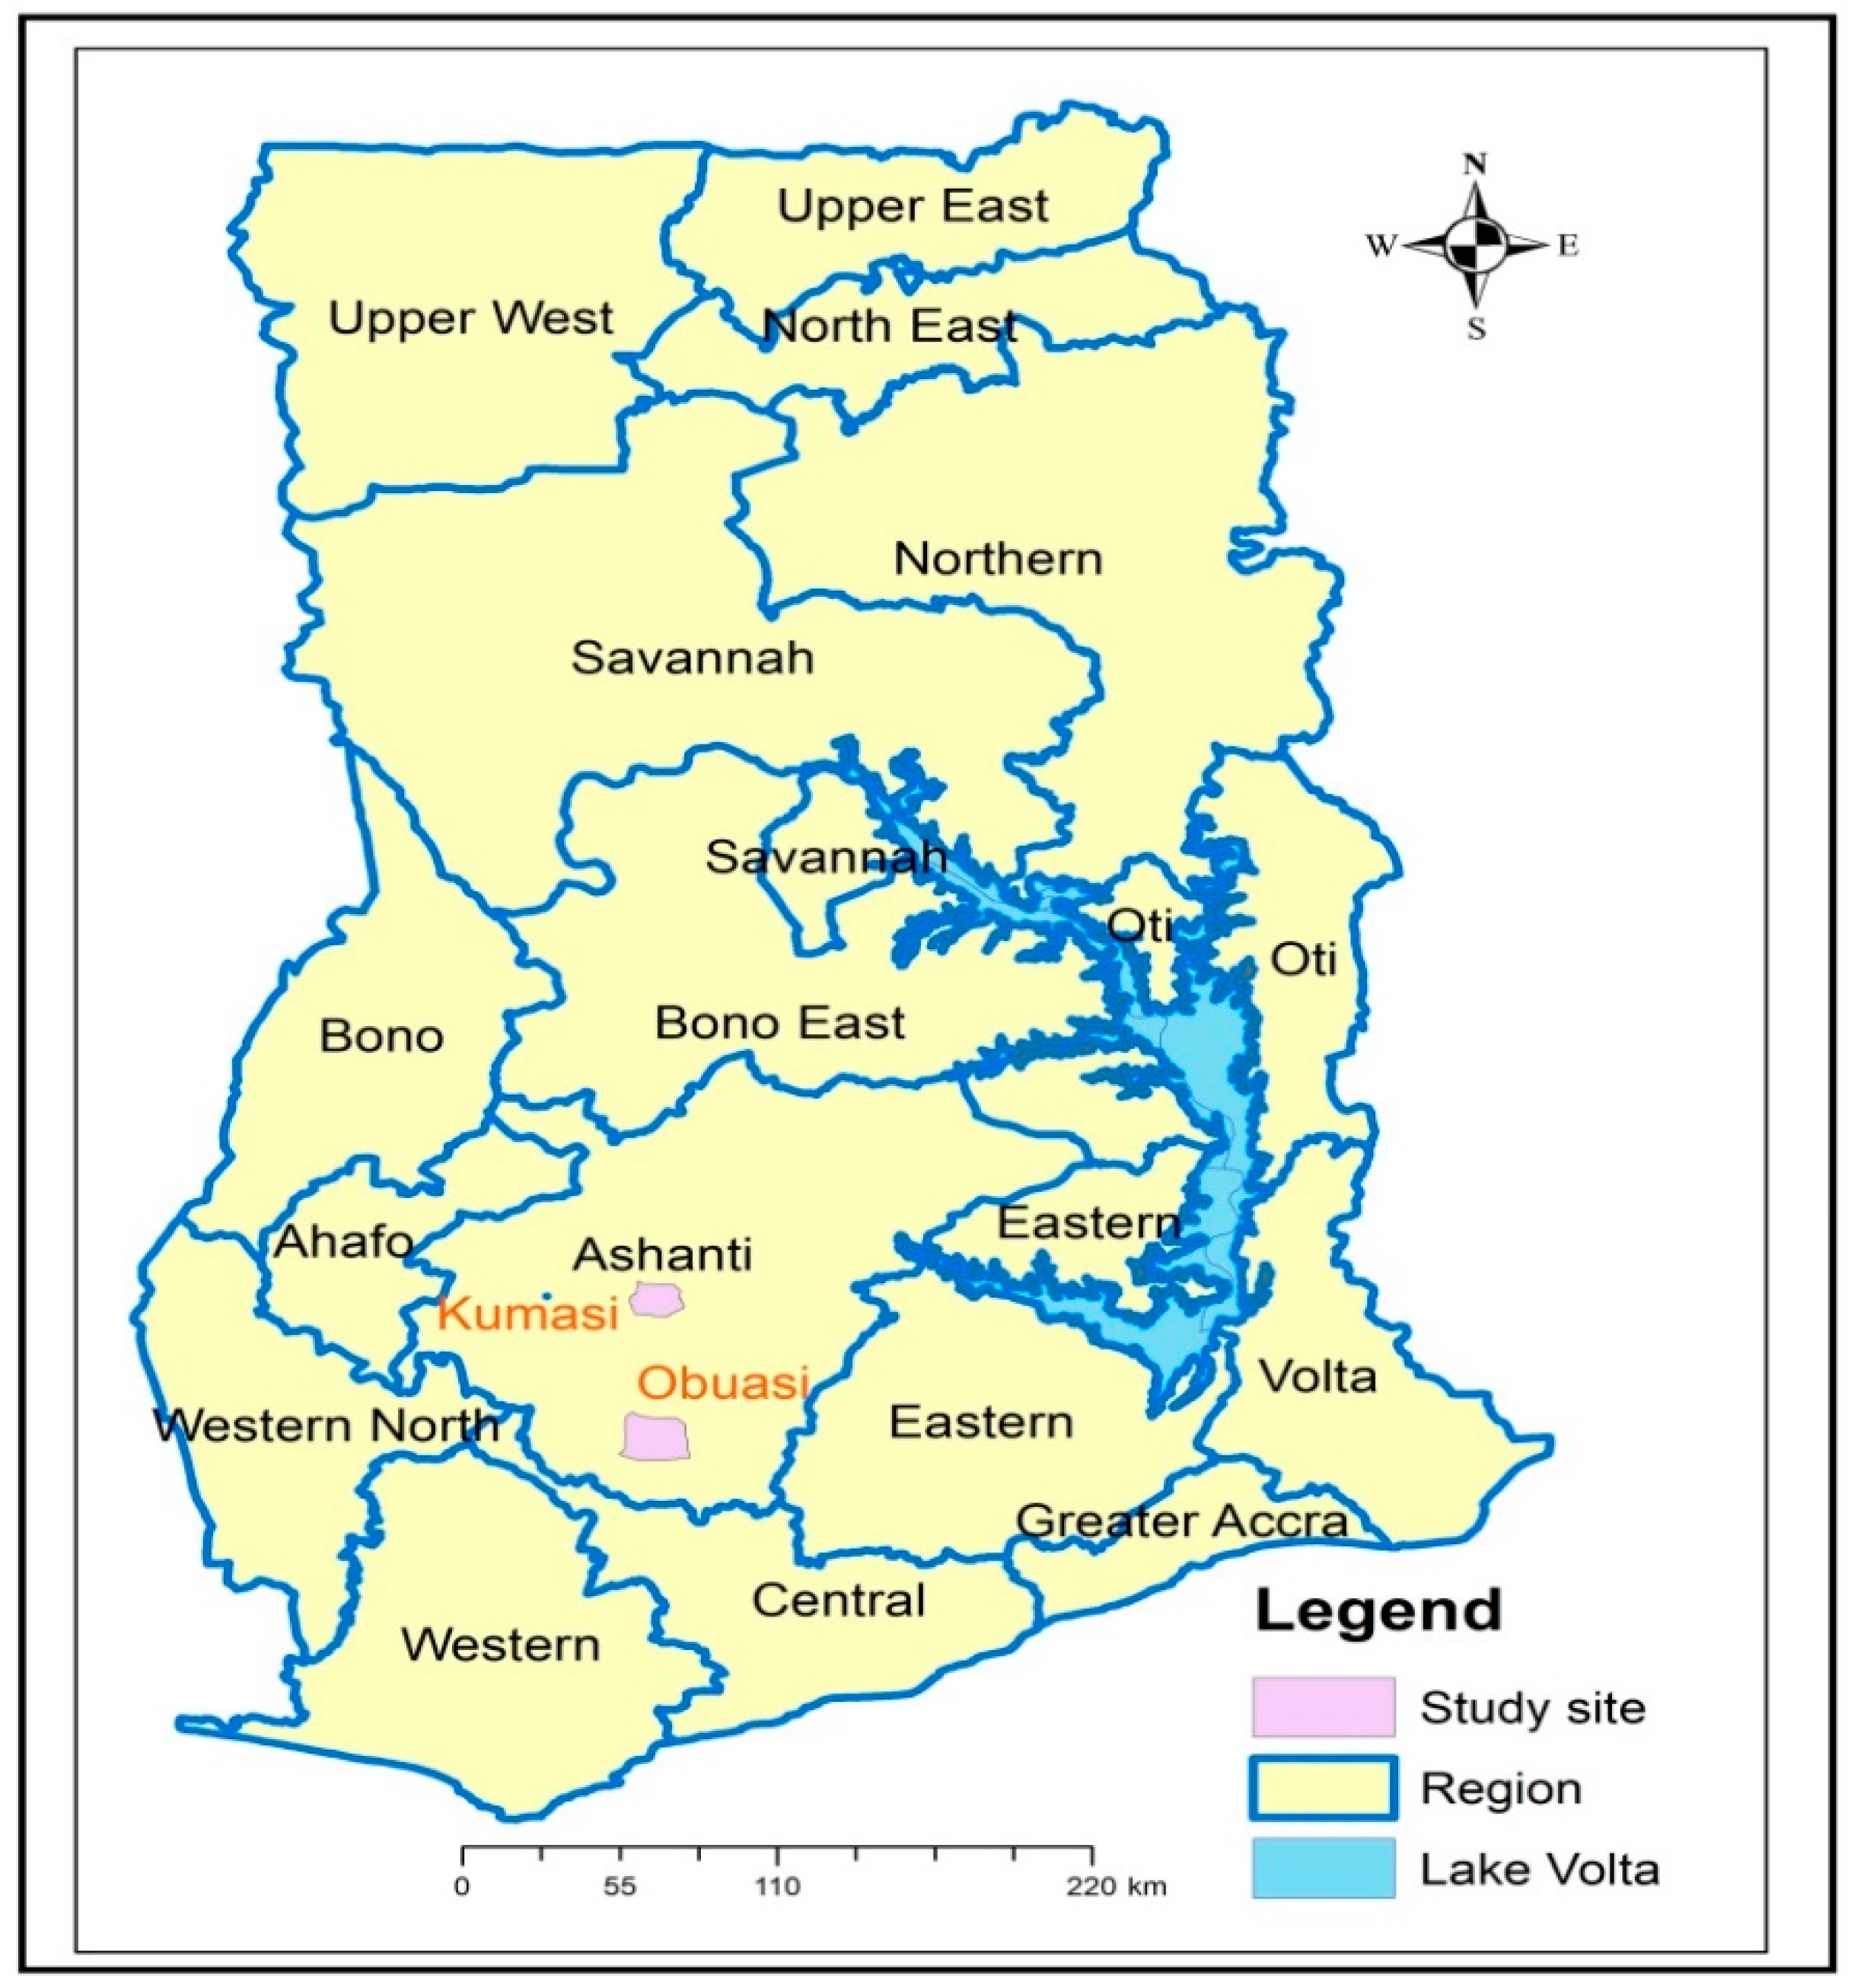
4.1. Description of Case Study Sites

This study provides a comparative analysis of urbanisation in two urban areas (Kumasi and Obuasi), which are both located in the Ashanti region (one of the 16 administrative regions) of Ghana (Figure 1). As noted earlier in this paper, the comparison between Kumasi and Obuasi is premised on how the differences in city size between the two urban areas influence urbanisation patterns (e.g., in terms of how city size influences demand for land, migration patterns, as well as availability and access to opportunities for improved living standards). It is worth noting that the limited decentralisation of administrative powers in Ghana, and a lack of specific local-level urbanisation policies, mean that urbanisation and development in the study sites are mainly guided by national policy. Therefore, through the comparative assessment in this study, the focus is on the specific characteristics of Kumasi and Obuasi, rather than the influence of factors such as national policy. In this context, while Kumasi and Obuasi may be confronted with similar economic, social, and environmental issues, differences may emerge when, for example, the influence of mining in an area such as Obuasi (e.g., the specific impacts of mining that have already been highlighted in Section 3) is taken into account compared with a non-mining area such as Kumasi.

4.1.1. Kumasi

Located in central Ghana (Figure 1), Kumasi is the country’s second biggest city and the administrative capital of the Ashanti region. Kumasi is appropriate as a case study site as justified by the following reasons. Kumasi is the fastest growing big city in Ghana, and between 2000 and 2010, the city recorded an average annual growth rate of about 6% [17]. As the capital of the Ashanti region (the most populous in Ghana), Kumasi is considered a regional primate city, that is, it dominates other urban areas in the region including Obuasi. As a result, Kumasi wields significant administrative and political powers, as well as economic opportunities; which, in turn, stimulate rapid urbanisation in the city as people tend to move to such areas in search of better socio-economic opportunities. Furthermore, Kumasi’s central location makes it a prominent transport hub which facilitates the movement of people, goods, and services due to the extensive road transport links to most parts of Ghana.

4.1.2. Obuasi

Obuasi is also located in the Ashanti region (Figure 1), some 56 km southwest of Kumasi. As a typical resource-based town, Obuasi was once the main gold-mining hub in Ghana as gold has been mined in the area since 1897, and the AngloGold Ashanti (AGA) mine in Obuasi was one of the ten biggest gold mines in the world towards the end of the 20th century. Gold-mining activities have, thus, provided an important impetus for urbanisation and development in Obuasi by facilitating modern-day living (e.g., jobs, infrastructure, etc.) for citizens both within and beyond the town. However, mining activities are also accompanied by issues such as environmental pollution, deforestation, biodiversity loss, human displacement, loss of livelihoods, migration, etc. The factors outlined above make Obuasi an interesting case for understanding the interactions between urbanisation and sustainability. Furthermore, the relevance of Obuasi as a case study site is demonstrated by scholars’ acknowledgement, e.g., [18,19], that research that interlinks mining and urbanisation in Ghana is limited. Furthermore, the downturn in the operations of AngloGold Ashanti between 2014 and 2018 makes Obuasi an interesting choice in a sustainability context.

4.2. Landscape Urbanisation Analysis

LCC classification constitutes an essential basis for urbanisation analysis globally. Therefore, a spatio-temporal analysis of land cover was conducted to enable an examination of the trends in landscape change in the study sites by developing LCC maps from satellite imagery using ERDAS IMAGINE 15.0 software.

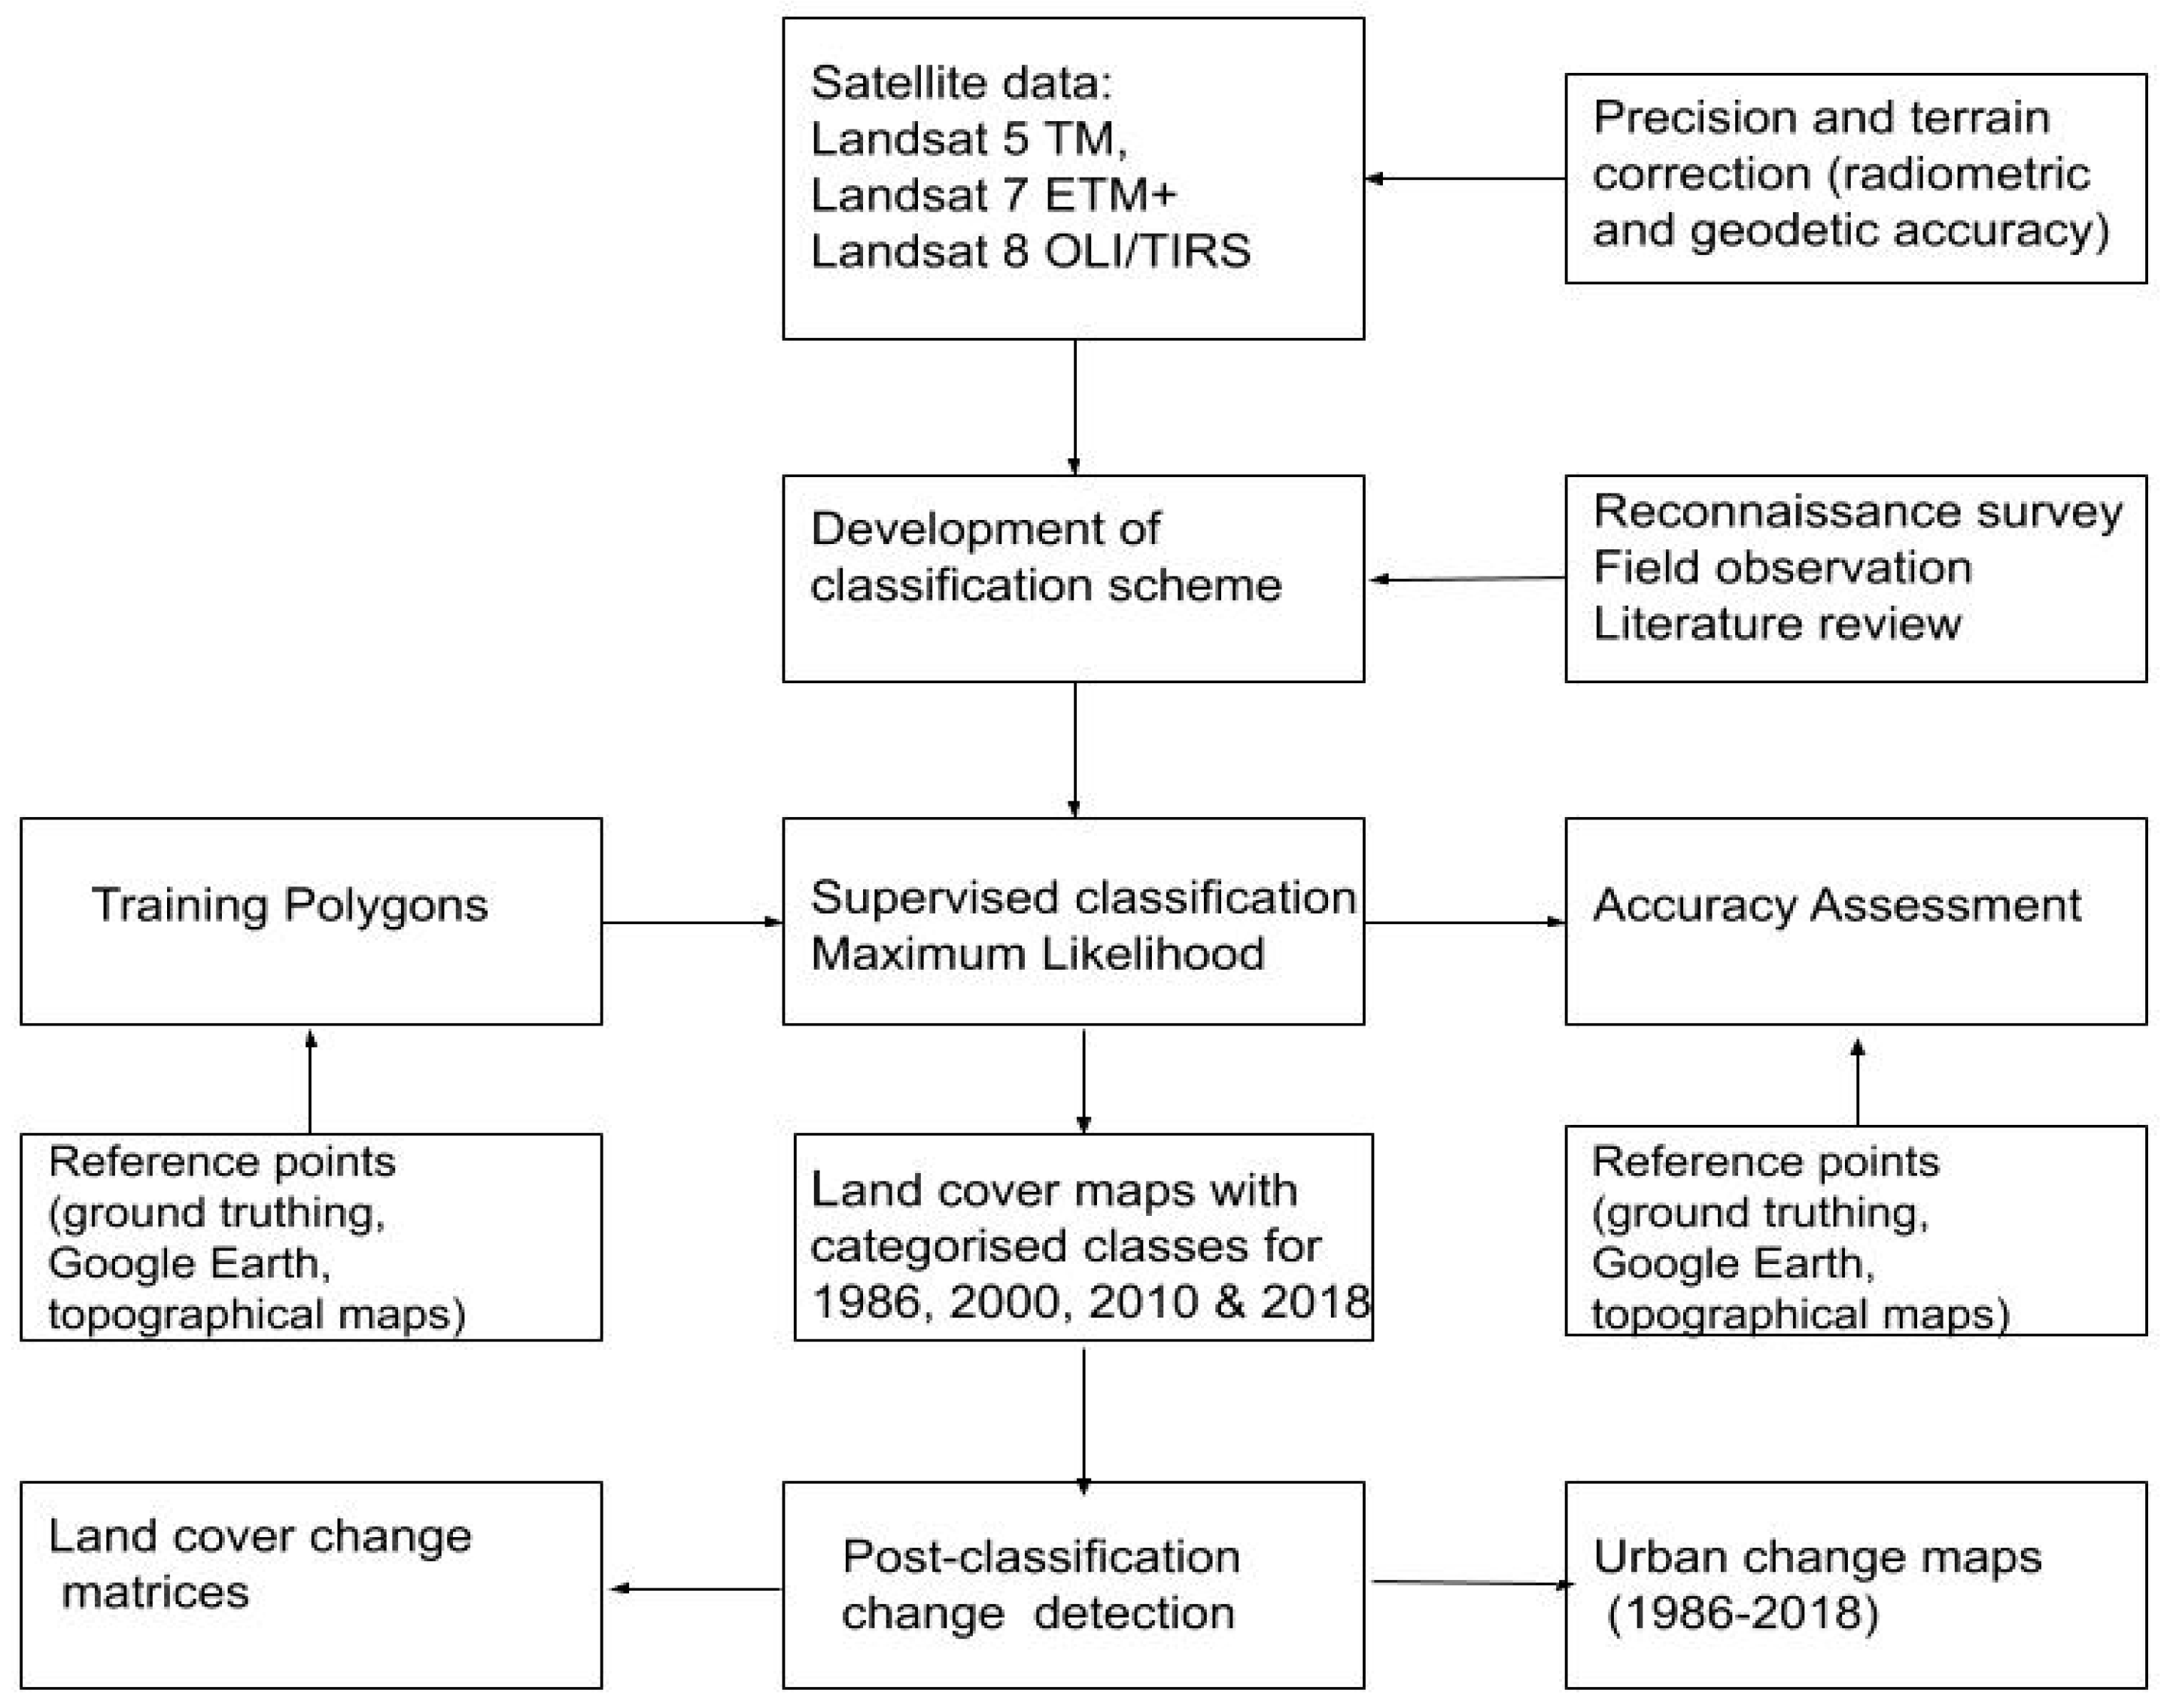
4.2.1. Data Acquisition and Image Pre-Processing

In this study, LCC analysis was conducted using remotely-sensed satellite imagery that cover a period of 32 years (1986–2018). For both Kumasi (row 55, path 194) and Obuasi (row 56, path 194), the data used comprised of Landsat satellite imagery for 1986 (TM), 2000 (ETM+), 2010 (ETM+), and 2018 (OLI/TIRS) acquired from the United States Geological Survey (USGS) website. Specific characteristics of the images and bands used are shown in Table S1 (see Supplementary Materials). Ground truthing for this study was conducted between January and March 2018, and it involved the use of a Garmin Global Position System (GPS) to collect ground reference points for image classification. The satellite imagery used in this study were processed based on the USGS Level 1 Product Generation System, where radiometric and geodetic accuracy are achieved through precision and terrain correction by “incorporating ground control points while employing a Digital Elevation Model for topographic displacement” [78] (para. 3).

4.2.2. Image Classification and Accuracy Assessment

In establishing the exact areas for classification, the spatial extent of Kumasi and Obuasi as reported in the literature, e.g., [14,17,41], was considered. For Kumasi, an arbitrary 8 km extension to the official metropolitan boundary was used to ensure that the full urban extent, both within and outside the official boundaries, was accounted for. However, as Obuasi is relatively smaller and has no rapidly urbanising adjoining districts, the official municipal boundary was used. Based on the satellite imagery acquired, local knowledge and a desk review, five main categories of land cover modified from [79] were identified for both Kumasi and Obuasi and they include: ‘built-up’, ‘agriculture land’, ‘mixed wood vegetation’, ‘forest’ (primary), and ‘water’; while two additional land cover types, ‘bare ground’ and ‘mining’ land, were identified for Obuasi. A description of the land cover types identified is provided in Table S2 (see Supplementary Materials). During the field work, the GPS was used to collect sixty ground reference points for the analysis of the 2018 satellite imagery of both Kumasi (Table S3) and Obuasi (Table S4), as shown in the Supplementary Materials. By using the area of interest tools in ERDAS IMAGINE (version 15.0), half of the ground reference points were used to collect spectral signatures by creating digital training polygons and the remaining half were used for accuracy assessment of the 2018 satellite imagery for Kumasi and Obuasi. For the historical images (1986, 2000, and 2010) of Kumasi and Obuasi, the training sites were digitised based on a careful study of the satellite imagery, Google Earth historical imagery (where available), topographical maps, local knowledge, and previous studies. The random selection of reference points for the historical images (1986, 2000, and 2010) of Kumasi and Obuasi was done for unchanged land cover areas only and juxtaposed with the ground reference points collected during the 2018 field work. In doing so, it was assumed that there is a historical permanence in land cover types such as ‘built-up’, some ‘mine’ sites, and some ‘agriculture land’; therefore, they have not changed over the study period. Consequently, half of the reference points randomly selected for the historical images (1986, 2000, and 2010) for Kumasi and Obuasi were used to create training polygons, and the remaining half were used for accuracy assessment. The details of the reference points used to analyse the 1986, 2000, and 2010 satellite imagery are also shown in Table S3 (Kumasi) and Table S4 (Obuasi) in the accompanying Supplementary Materials. Critically, as shown in Tables S3 and S4, the number of reference points used in classifying the 2018 imagery was lower than the ones used for the 1986, 2000, and 2010 imagery for both Kumasi and Obuasi. This was because the number of GPS ground reference points that could be collected during the field work for the 2018 imagery was limited by logistical and access constraints. However, for the other years (1986, 2000, 2010), what was learnt from the ground reference points collected for 2018, in terms of spectral recognition, was used to train more areas as the authors could not collect field data retrospectively. Following the collection of training sites and signatures, the satellite images were classified by running the maximum likelihood classifier in ERDAS IMAGINE (version 15.0) software, based on a feature-space non-parametric decision rule.

4.2.3. Change Analysis

In this study, land cover change was analysed in two steps. Firstly, the classified image outputs were overlaid and compared on a pixel-by-pixel basis between dates in order to establish the dominant transitions in the classified maps, as well as to enable the characterisation of the transition among the different land cover types. Secondly, the maps were reclassified as ‘urban’ and ‘non-urban’ and stacked to show the extent of urban expansion across the four dates. A summary of the workflow of the land cover change analysis conducted in this study is presented in Figure 2.

4.3. Secondary Data Analysis

Population records published by the Ghana Statistical Service (GSS) in national reports (including census reports) and on the organisation’s website were extracted to enable an analysis of historical and current demographic change in the study sites [80,81,82,83]. Furthermore, based on the population statistics extracted and the built-up (urban) area measured in the LCC classification, population density figures for the study sites were also generated. The closest possible dates that align with the dates for the satellite images analysed were selected due to gaps in published data.

5. Results

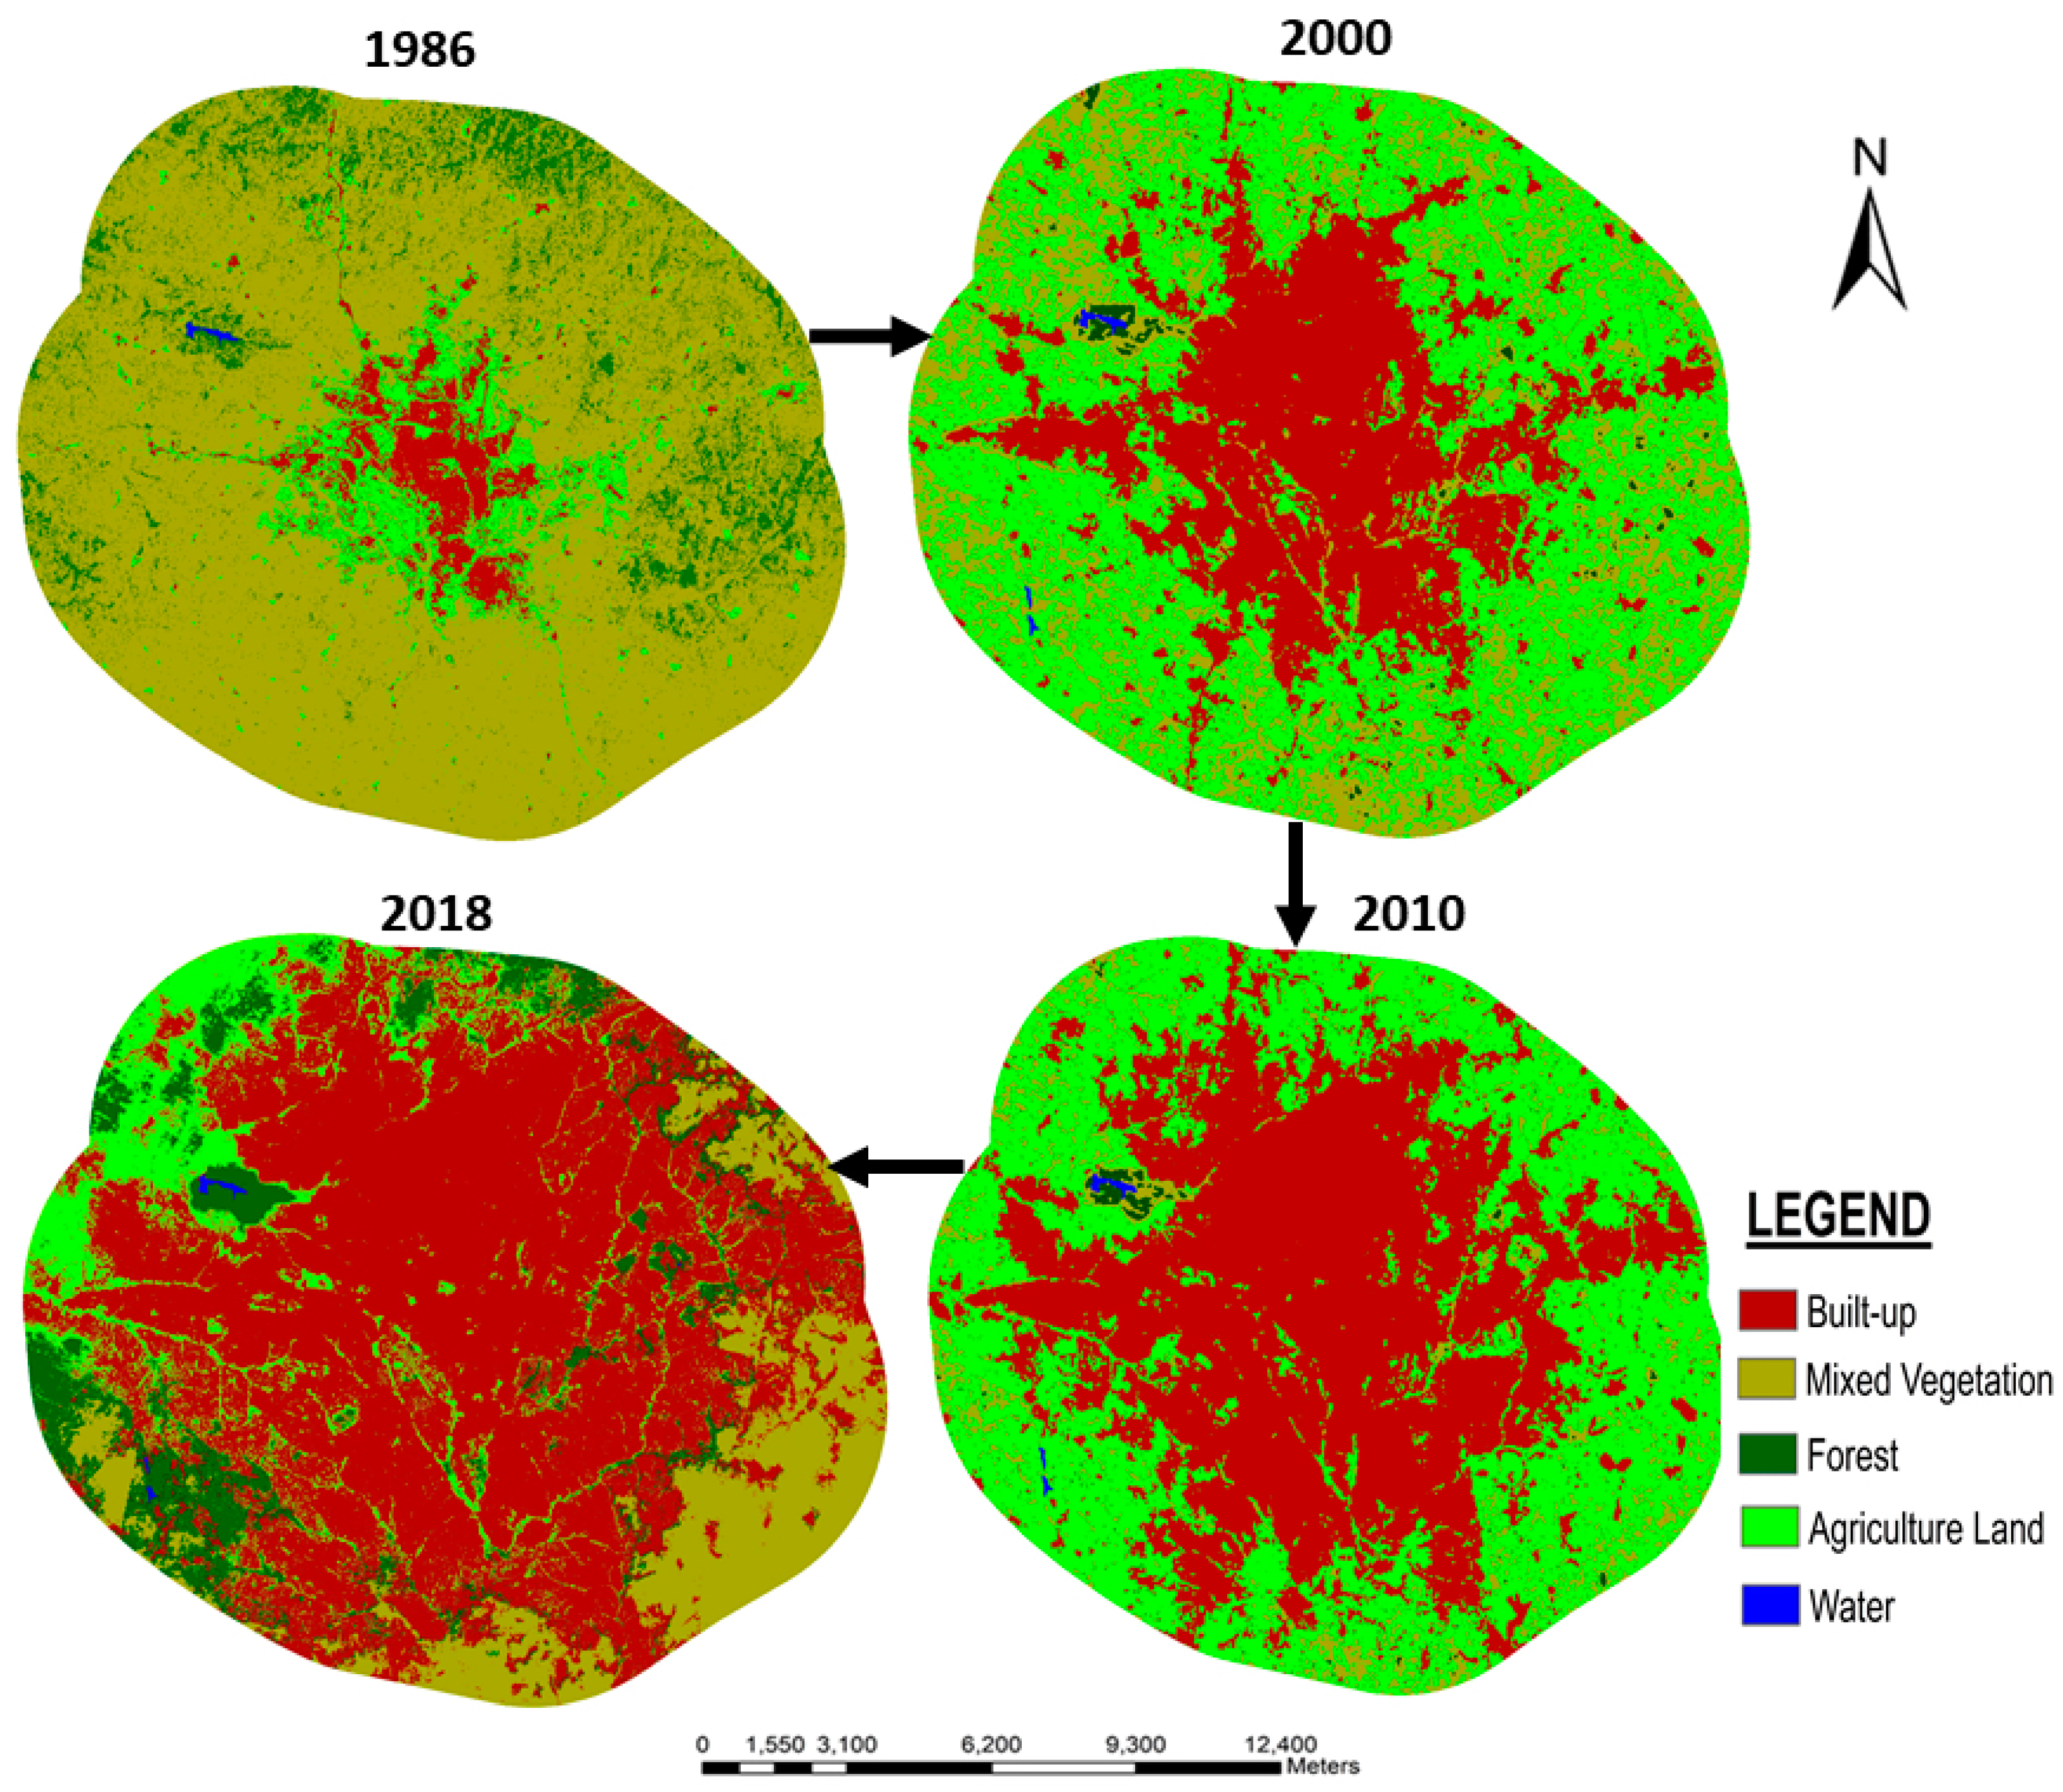
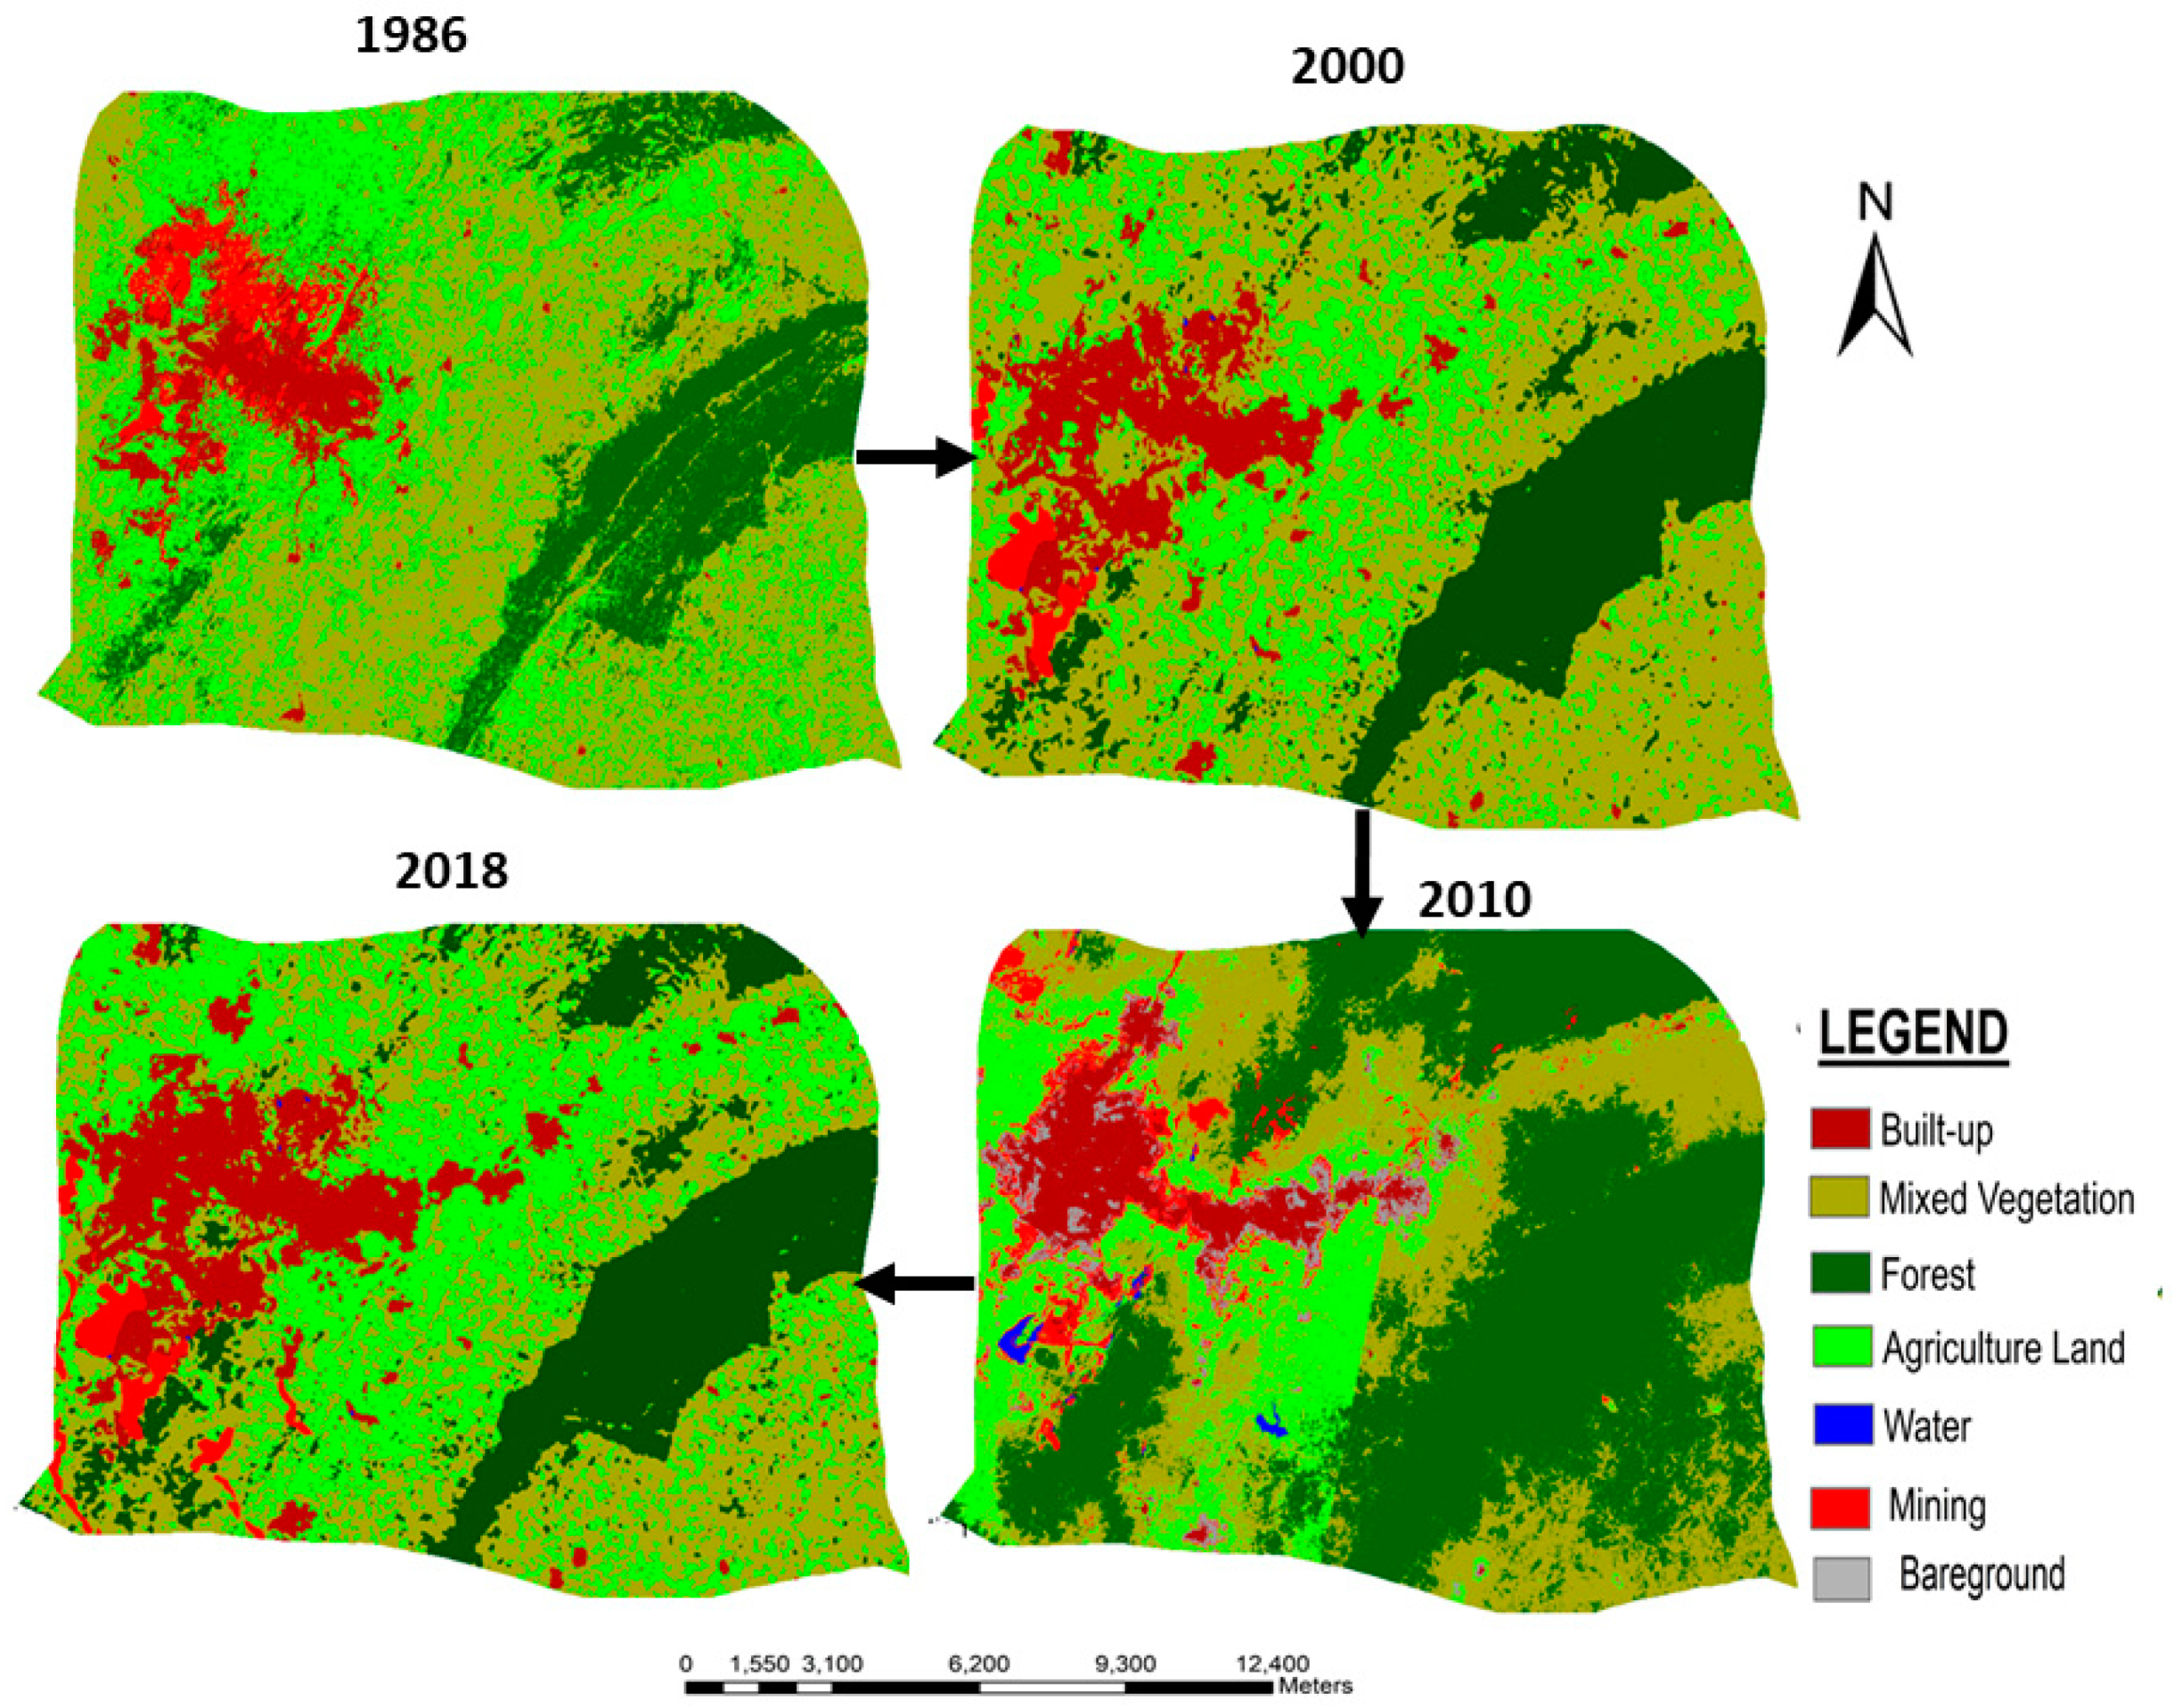
5.1. LCC Characterisation

The overall accuracies of the land cover maps were above 80%, and the Kappa coefficients ranged between 0.76 and 0.86 (see Tables S5–S12, Supplementary Materials) with the exception of Obuasi 2010 (Table S11, Supplementary Materials), which imply that the greater majority of image classifications were of sufficient quality, see [79]. The lower overall accuracy and Kappa coefficient recorded for Obuasi 2010 (Table S11, Supplementary Materials) is attributable to classification error due to possible spectral mixing caused by overlap in land cover types such as ‘mixed woody vegetation’ and ‘forest’, potentially resulting in mixed-pixel problems which undermined separation of these areas in the imagery. Figure 3 provides the classified LCC maps that show the patterns of LCC in Kumasi between 1986 and 2018, while Table 1 shows the corresponding areal distribution (in km2) of the identified land cover classes. Taken together, Figure 3 and Table 1 show that ‘mixed wood vegetation’ (77%) was the dominant land cover type in Kumasi in 1986. However, by 2018, urban expansion had led to the dominance of ‘built-up’ land cover (62.5%), at the expense of the other land cover classes.
In terms of exchanges or transfers between the different land cover types in Kumasi, the land cover change matrices for the classified images of Kumasi are shown in Tables S13–S15 (see Supplementary Materials). The change matrices show that the main transitions were the conversion of ‘mixed woody vegetation’ to ‘agriculture land’, then on to ‘built-up’ land cover. However, between 2010–2018, the conversion of ‘agriculture land’ to ‘mixed woody vegetation’ or ‘forest’, which may possibly be due to sustainability or conservation strategies, is evident.
The maps of land cover types in Obuasi between 1986 and 2018 are shown in Figure 4, and Table 2 provides the statistics of the area (in km2) covered by the different land cover types. From Figure 4 and Table 2, it is evident that land cover in Obuasi was dominated by ‘mixed woody vegetation’ (42.5%) in 1986. However, by 2018, ‘agriculture’ land (33.3%) had moved ahead of ‘mixed woody vegetation’ (30.9%) as the dominant land cover type in Obuasi. Crucially, ‘built-up’ land cover increased from 6.2% in 1986 to 15.2% in 2018. Therefore, while not dominant, ‘built-up’ land cover increased significantly due to urbanisation.
In terms of the transitions between the different land cover types, the land cover change matrices for the classified images of Obuasi are shown in Tables S16–S18 (see Supplementary Materials). From the change matrices, the main exchanges are from ‘mixed woody vegetation’ to ‘agriculture’ and on to ‘built-up’; although not all the transitions in Obuasi are obvious as some other land cover types (e.g., ‘bare’ ground, ‘mixed woody vegetation’ and ‘forest’) fluctuated between the years considered (possibly due to classification error).

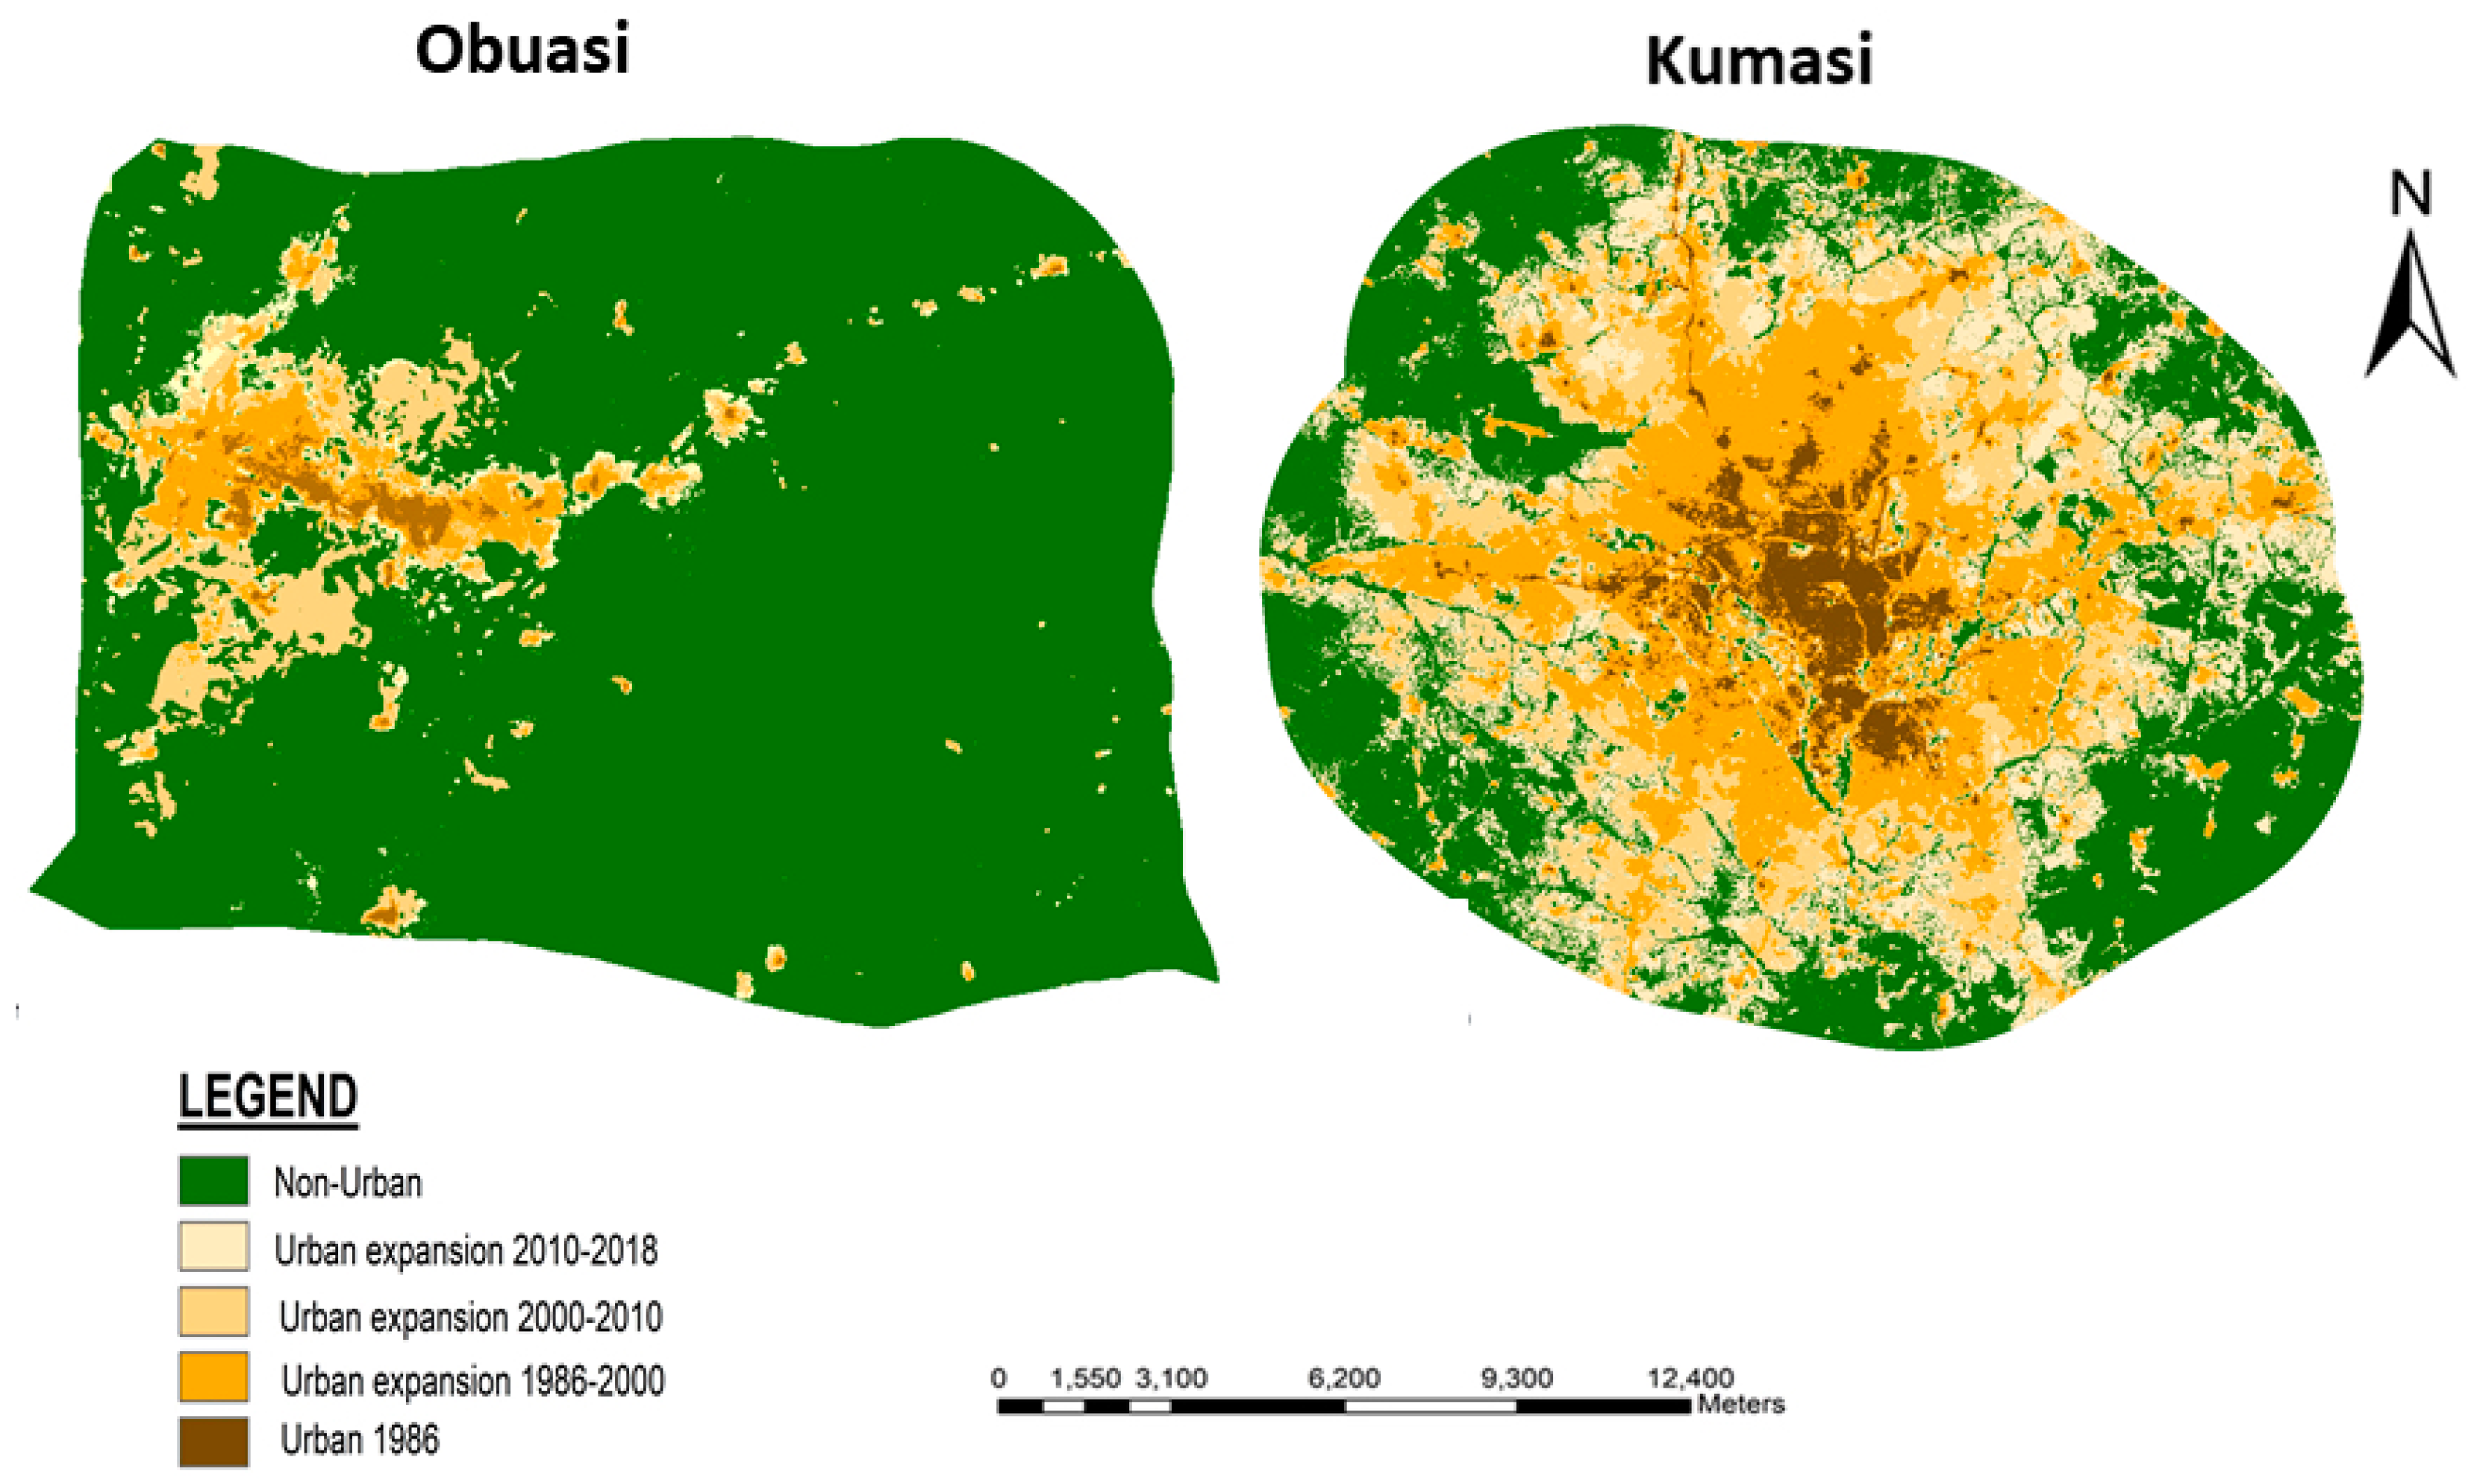
5.2. Urban Expansion in Kumasi and Obuasi

Figure 5 provides maps that show the extent of urban expansion in the study areas between 1986 and 2018. The maps provide clear evidence that suggest how urban development replaced and eroded into surrounding natural vegetation and other non-urban land cover types. Essentially, the results demonstrate how the application of remote-sensing techniques is effective and essential for examining and understanding LCC characteristics and urban expansion in Kumasi and Obuasi.

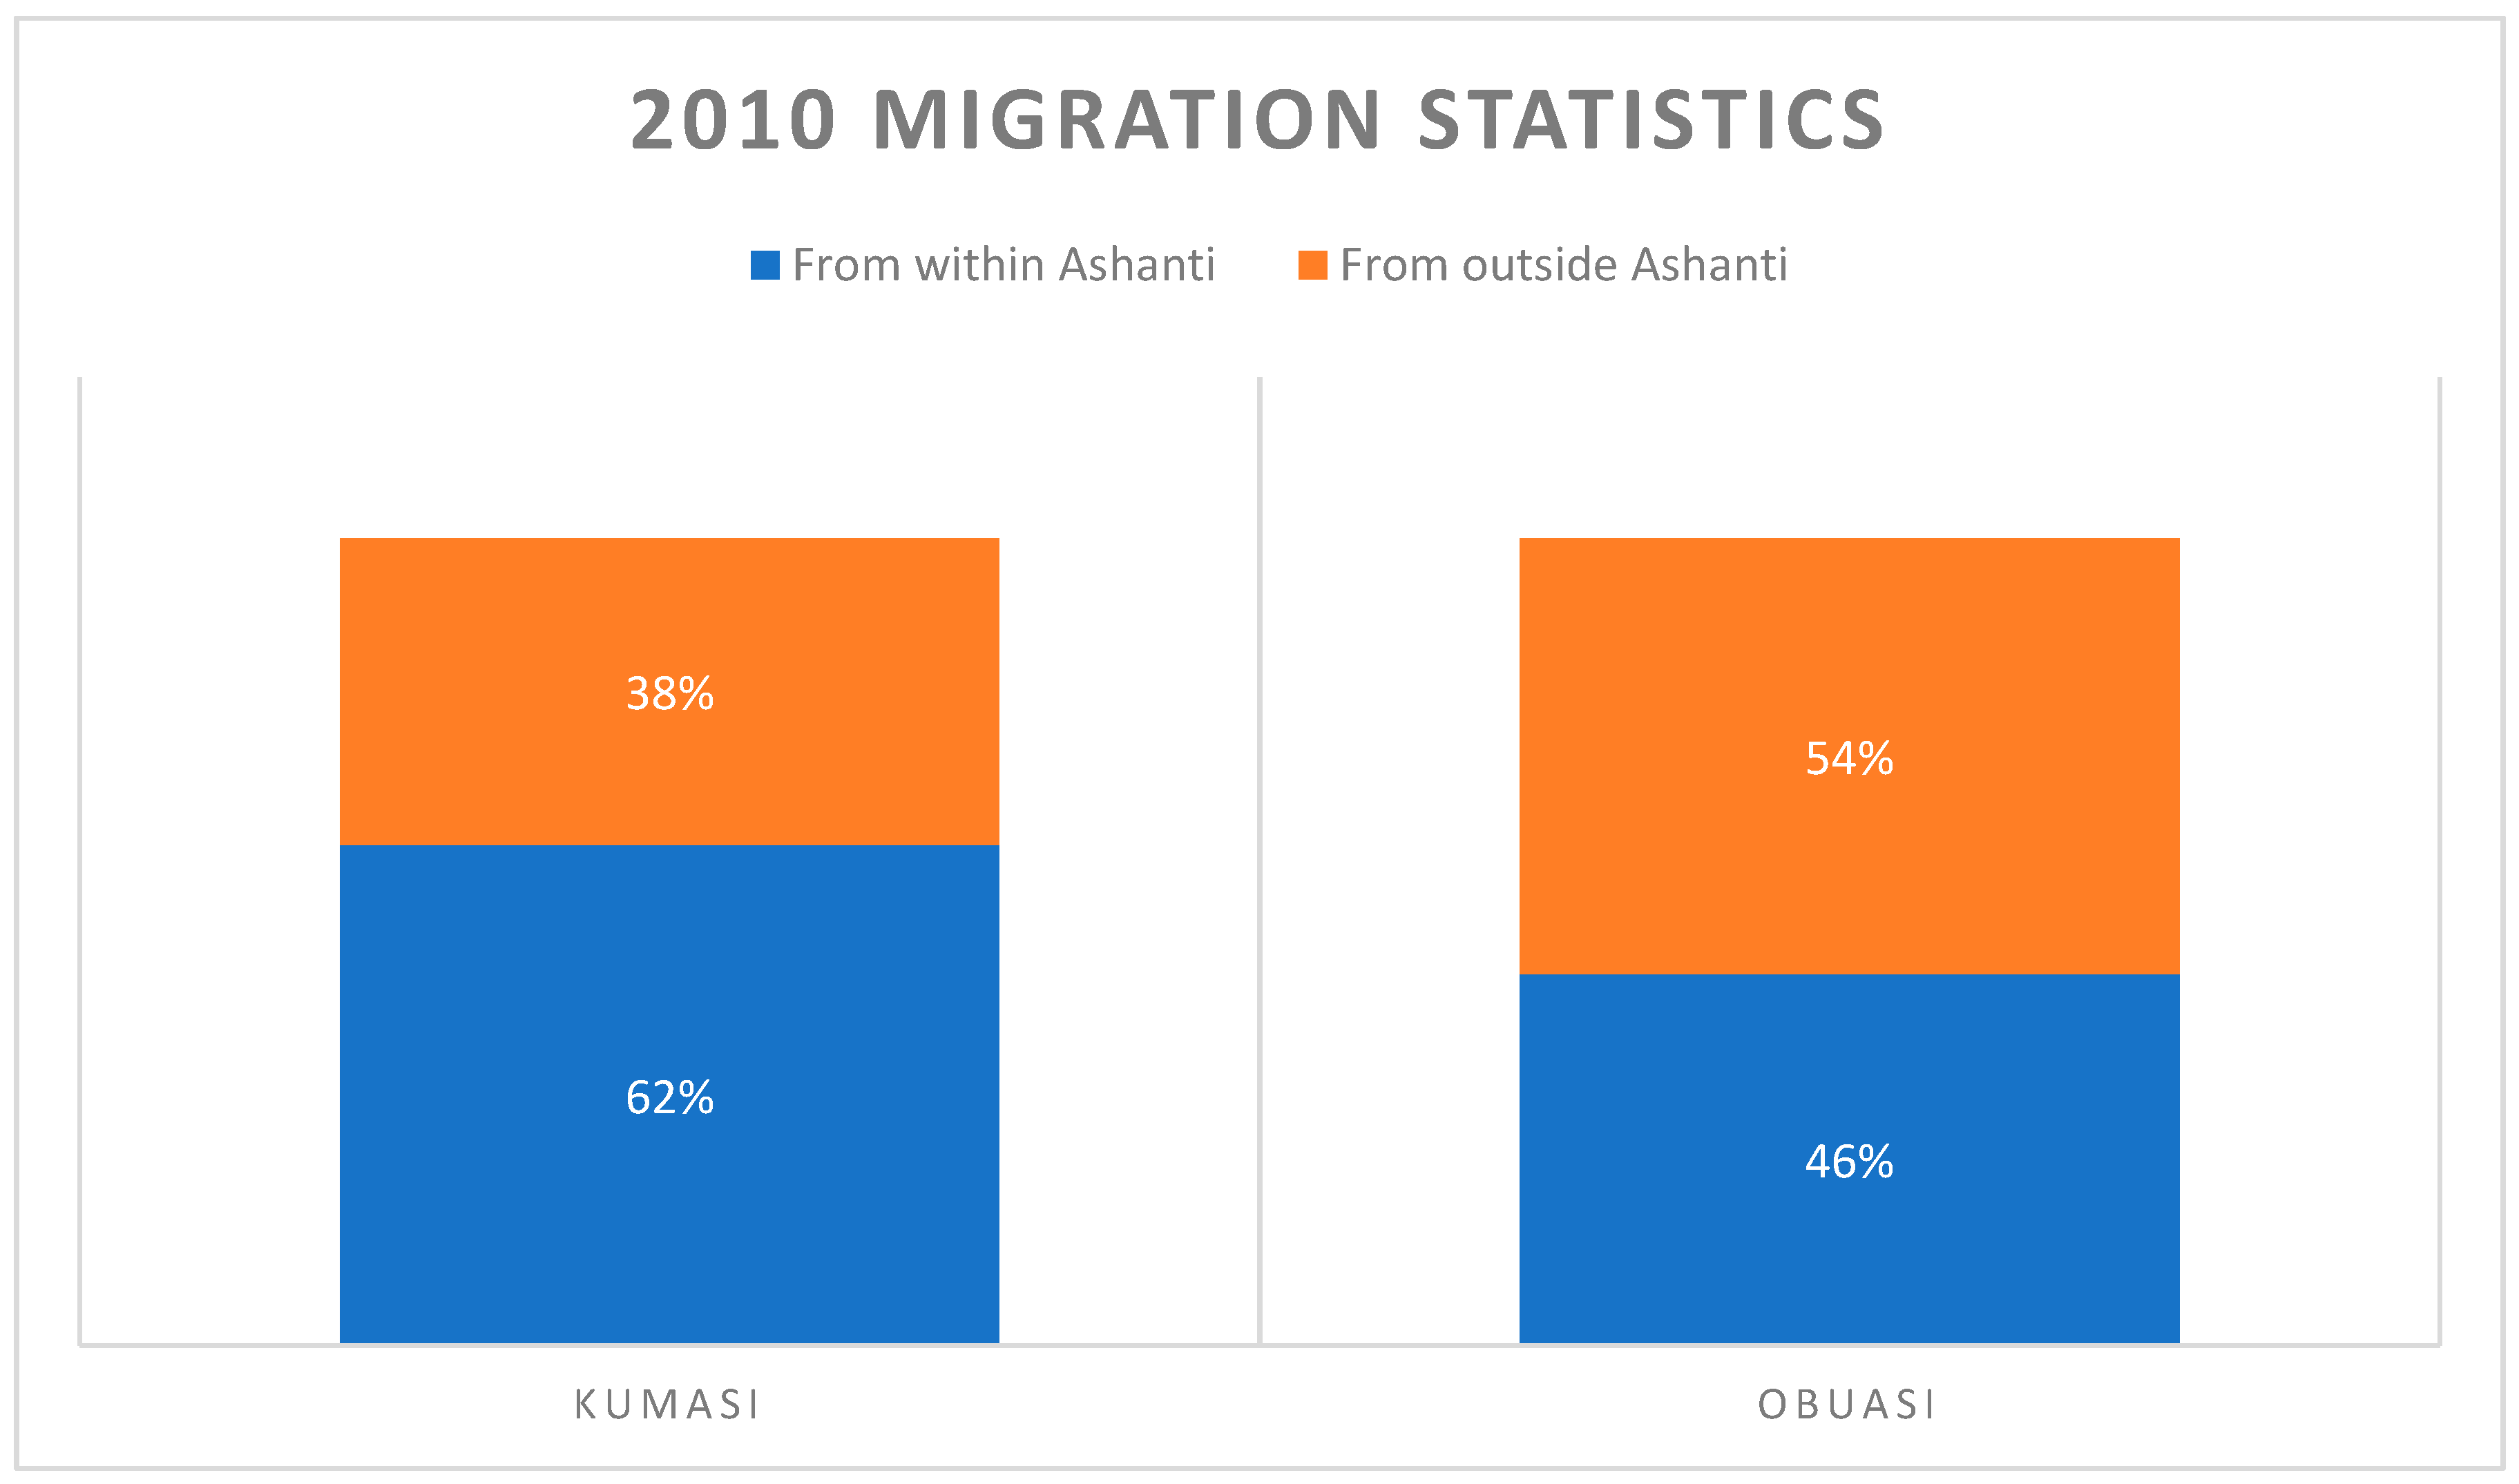
5.3. Demographic Change in Kumasi and Obuasi

Table 3 shows the demographic data for Kumasi and Obuasi between 1984 and 2019. As highlighted in the methods, the closest possible dates that align with the dates for the satellite images analysed are presented due to gaps in published data. The table shows that the populations of both Kumasi and Obuasi expanded at least three times between 1984 and 2019. In terms of the rate of population growth, both Kumasi (14.81%) and Obuasi (11.94%) experienced the highest average annual rate of population change during the 1984–2000 intercensal period. The lowest average annual rate of change in Kumasi (2.41%) was recorded for the period 2010–2019, while Obuasi (2.43%) recorded its lowest annual rate of change between 2000 and 2010.
Evidence from available migration (measured by ‘birthplace of dwellers’) statistics for Kumasi and Obuasi as published in Ghana’s 2010 Population and Housing Census shows that the migrant proportion of Kumasi (54%) is higher than recorded for Obuasi (37%) [80,81,82,83]. However, from Figure 6, the proportion of migrants born outside the Ashanti region in each area is higher in Obuasi (54%) when compared with Kumasi (38%).

5.4. Population Density in Kumasi and Obuasi

Table 4 shows the population density figures for Kumasi and Obuasi within the study period. From the table, it is evident that there has been a consistent downward trend in population density in Kumasi for the period between 1984/1986 (11,491 people per km2) and 2018/2019 (4135 people per km2). However, within the same period, the table shows an overall upward trend in population density in Obuasi, from 2569 people per km2 in 1984/1986 to 3529 people per km2 in 2018/2019.

6. Discussion

6.1. Patterns of Urbanisation in Kumasi and Obuasi

While each study site has charted its own course of urbanisation, the results of this comparative study reflect the trends of rapid urbanisation occurring at the national level in Ghana, and confirm the findings of previous research [14,17,41,42] on how urbanisation is incrementally modifying the state of landscape and demography in Ghana. The results of this study show that Kumasi and Obuasi have undergone significant landscape transformation over the period studied. Although no two urban areas are identical, similarities in the land cover change processes in Kumasi and Obuasi are reported. In this regard, the results suggest that landscape urbanisation in Kumasi and Obuasi is characteristically a two-step process as ‘forest’ and ‘mixed woody vegetation’ land cover types were lost to ‘agriculture’ land cover, which, in turn, was lost to ‘built-up’ land cover (Table 1 and Table 2). However, differences exist between Kumasi and Obuasi when the extent of urban expansion is considered. The results show that LCC change patterns in Kumasi are on a clear trend towards an increase in ‘built-up’ land cover and loss of natural land cover, which has resulted in the ‘built-up’ land cover transcending administrative boundaries to merge with adjoining districts. Conversely, in Obuasi, although ‘built-up’ land cover also increased at the expense of natural land cover types, it was not of the same magnitude as Kumasi, and it occurred within the municipal boundaries. Furthermore, unlike in Kumasi where urban expansion spreads out in all directions from the urban core, the urban land cover in Obuasi seems to be concentrated on the western side of the municipality. Based on the local knowledge and personal observations by the lead researcher, and consistent with observations in Google Earth imagery, the concentration of urban land cover in western Obuasi is explained by: (i) the location of AngloGold Ashanti’s mining operations in the western side of the municipality; (ii) the location of the urban core in the western part of the municipality by mainly surrounding the mining operations; and (iii) the possibility that the prevailing land ownership regime, especially in the context of protected mining concessions, affects acquisition and development of new lands, thereby constraining urban expansion to the western side of the municipality.
In the demographic context, the results reflect and confirm the reported changes that have taken place in Ghana’s demographic landscape, resulting in over half of Ghana’s population living in urban areas [11]. The rate of population growth in Obuasi and Kumasi could be seen as similar as both areas have expanded by at least three times. However, the results suggest that natural population growth may have contributed more to the population growth in Obuasi as the number of people born in the area as of 2010 were higher (63%) than the proportion of migrants (37%). Unlike Obuasi, it is evident from the results that migration (54%) possibly contributes more to population change in Kumasi due to the relatively smaller proportion of birthplace dwellers (46%). The intricacies of migration in an external and internal context, however, shows that the majority of migrants in Obuasi were from outside the Ashanti region, compared with Kumasi where the majority of migrants were from areas within Ashanti. Furthermore, from a general urbanisation perspective, the decreasing trend of population density, as well as the extent of urban expansion in Kumasi, as the results show, suggest that urbanisation has possibly led to low density and scattered urban development. In contrast, the nature of urban expansion and the overall increasing trend of population density in Obuasi could possibly be due to the densification of urban development. The unabated urban expansion in the study areas, especially in Kumasi, corresponds with suggestions in the literature, e.g., [55,56], about how developers flout land-use regulations. Essentially, the results give a fine-grained picture and diachronic analysis of the urbanisation process in both Kumasi and Obuasi.

6.2. Factors Shaping the Dynamics of Urbanisation in Kumasi and Obuasi

The results demonstrate how the interactions among concepts such as land tenure, globalisation and market forces underpin urbanisation in Kumasi and Obuasi. The significance of the reported population explosion in Kumasi and Obuasi between 1984 and 2019 is the possibility that urbanisation creates a high demand for land and drives the market to make land-use decisions in order to accommodate this demand. In the end, the greater proportion of land-use decisions, especially the ones that drive urbanisation, are stimulated by the diverse ways in which landowners respond to the market, e.g., [52]. Therefore, although both Kumasi and Obuasi are exposed to the impacts of globalisation and market forces, and for instance, have a similar land tenure regime in operation (where the majority of lands are held in trust for communities by traditional leaders, see [52]), the land cover pattern and urban expansion in Obuasi could possibly be due to how globalisation and market forces uniquely influence land tenure and land-use in mining areas. On the one hand, the land cover patterns show how FDI investment (globalisation), through the operations of AngloGold Ashanti, has possibly led to the expropriation of some land from Obuasi’s landowners, see [57], and a subsequent conversion of natural land cover into mining land. Where natural land cover has not yet been converted into mining, they are possibly being conserved and protected as part of mining concessions. On the other hand, in terms of urban expansion, the results suggest that mining-related activities (including the operations of AngloGold Ashanti) have given an impetus to population growth in Obuasi which, in turn, has created a market demand for land to meet the needs of the urban population. In Kumasi, the intensive urban expansion and population growth reported in the results could create avenues for globalisation and market forces to influence land tenure and land-use decisions, see [16]. For example, it could be argued that as landowners in Kumasi seek to derive maximum economic benefits from their land assets, they tend to respond to market forces that make investment decisions such as real estate development and acquire land from the land owners. In the end, as evidenced in the results, the interactions between the land owners and the market have possibly influenced land-use decisions and stimulated more urban expansion in Kumasi. Essentially, the results possibly highlight how globalisation, market forces and land tenure regimes diversely shape urbanisation in Obuasi and Kumasi; and based on the rapid nature of urbanisation, the possibility for these factors to, in turn, undermine the enforcement of land-use planning, thereby contributing to uncontrolled conversion of land [55,56].
Furthermore, the results demonstrate how differences in city size and administrative hierarchy between Kumasi and Obuasi potentially shape urbanisation in the two areas. The population statistics reported in the results (Table 3) show that Kumasi is bigger than Obuasi, and as the second biggest city in Ghana and the capital of the Ashanti region, Kumasi is higher in the administrative hierarchy than Obuasi. These differences in population and administrative size mean that there is no horizontal equity in the availability of social, economic, and environmental opportunities between Kumasi and Obuasi. Therefore, it could be argued that the higher proportion of migrants is a function of the quantum of opportunities that exist in Kumasi compared with Obuasi. Critically, the population size and hierarchy of Kumasi make it a net gainer of resources (including institutional and human resources) when compared with Obuasi, which possibly influences the respective patterns of urbanisation.

6.3. Sustainability Implications of Urbanisation in Kumasi and Obuasi

The sustainability implications of urbanisation may depend on multiple aspects, and on the particular local context, but will nonetheless be influenced by a few important factors. Therefore, the results demonstrate how LCC patterns and population growth can possibly affect urban sustainability in Kumasi and Obuasi. Consistent with the paucity of data (e.g., urbanisation-related data) on African urban areas [10], wider formal perspectives of the sustainability implications of urbanisation in Kumasi and Obuasi in this study is limited by a lack of disaggregated urban data. Nevertheless, juxtaposing the results in Section 4 with the literature explicated in Section 2 and Section 3, we infer and discuss possible sustainability implications of urbanisation in Kumasi and Obuasi as follows.

6.3.1. Economic Dimension

From an economic perspective, population growth due to rapid urbanisation will likely complicate the employment situation in Kumasi and Obuasi when considered in the context of the widespread unemployment in Ghana’s urban areas as highlighted in Section 2 [70,71]. In both areas, urbanisation may accrue positive sustainability impacts when urban land-use leads to productivity in terms of job creation through the construction of industries etc. Therefore, while urbanisation in both areas presents opportunities to agglomerate resources to enhance economic growth, the precarious urban employment situation in Ghana [70,71] makes it reasonable to suggest that population growth (due to rapid urbanisation) will likely lead to a higher demand for jobs than are available in Kumasi and Obuasi. In Kumasi, rapid population growth, together with a higher proportion of migrants, may align with suggestions within the literature about how urban areas concentrate higher levels of economic opportunities including jobs [7,8]. Conversely, when considered in the context of pervasive unemployment in urban Ghana [70,71], the higher proportion of migrants in Kumasi resonates with arguments in the literature about how migration in Africa is sometimes stimulated by the quest to exploit subsidies and opportunities, rather than in response to opportunities for more productive employment [72]. Therefore, it could be argued that while rapid urbanisation in Kumasi potentially increases the opportunities for employment and economic growth, it also potentially exacerbates the unemployment situation, as some people may migrate to Kumasi just to take advantage of enhanced levels of urban services rather than engage in productive employment which may, nevertheless, not exist. In Obuasi, one could argue that the lucrativeness of mining activities, which has offered an impetus to migration and urbanisation (see Figure 6), will generate adequate employment and wealth creation. However, consistent with the literature, see [62], it could be suggested that the technological nature of AngloGold Ashanti’s large-scale mining operations in Obuasi means that fewer jobs are likely to be created compared to the demand which the reported rapid population growth in Obuasi (Table 3) could generate. The fragility of the employment situation in Obuasi is further demonstrated by how the downturn in the operations of AngloGold Ashanti between 2014–2018 meant that secondary sources of employment (e.g., entities that generate employment by providing ancillary services for AngloGold Ashanti), which depended on the activities of AngloGold Ashanti, potentially dwindled. Therefore, the differences in migrant proportions between Kumasi and Obuasi (Figure 6) could, in part, be consistent with the suggestion by [73] about how migration rates respond to employment generation but dwindle when there is a negative change in urban economies. Critically, what has been discussed so far highlights the challenge that the population surge and landscape change due to rapid urbanisation puts on the capacities to provide adequate economic opportunities in Kumasi and Obuasi which, one could suggest, affects economic sustainability.

6.3.2. Social Dimension

From a social development perspective, rapid urbanisation in Kumasi and Obuasi (as evidenced in the results) potentially undermines sustainability in both areas when considered in the context of the government’s capacity to provide essential urban infrastructure (see [9]). Generally, in terms of standards of living, both Kumasi and Obuasi are perceived as better off than their rural counterparts in the Ashanti region due to the opportunities they concentrate by virtue of their administrative sizes and local economic contexts (as has already been highlighted in previous sections). However, rapid urbanisation in both Kumasi and Obuasi means that more housing and other facilities will be required to accommodate the needs of the expanding populations. Therefore, it could be suggested that the increasingly urban population in Kumasi and Obuasi will potentially lead to more citizens competing for access to the already inadequate urban infrastructure and services, thereby aggravating pressures on existing urban facilities [40]. In the specific cases where both areas have high proportions of migrants (Figure 6), social cohesion and harmony could be threatened. In Obuasi, the implications of rapid urbanisation for sustainability takes a different dimension when we take cognisance of the role of mining activities. The literature, e.g., [61], considered in this study highlighted how mining companies in Ghana, through their CSR activities, and as part of maintaining their social licence to operate, sometimes exist as quasi governments by significantly augmenting the central government’s provision of basic infrastructure and services in mining communities. The worrying issue, one could argue, is what this means for mining areas such as Obuasi when mining companies are closed or have their profitability reduced. In the case of Obuasi, the operations of AngloGold Ashanti might have stimulated urban growth, nevertheless, its downturn in operations may affect profits and potentially reduce the company’s capacity to contribute to the provision of urban infrastructure and services through its CSR activities. This highlights the quagmire that the interaction between urbanisation and mining brings for social development in mining areas such as Obuasi. Furthermore, in consonance with scholarly views about how neoliberal alignment in urban areas could promote urban regeneration and simultaneously create social divisions [66,67,76,77], and considering how the urban expansion patterns in Kumasi reflect the demand for land to meet the needs of the growing populations, it could be argued that market forces could influence urban socio-spatial structures in these areas. Essentially, the influence of market forces in the context of urbanisation in Kumasi and Obuasi, could potentially lead to situations where the economic advantage held by groups such as high-income citizens combines with restrictions on housing or land ownership choices (due to unaffordability) for low-income citizens to contribute to socio-spatial segregation, e.g., [39,76,77]. Such divisions could likely affect social integration and harmony in Kumasi and Obuasi (see [67,76,77]). Therefore, in alignment with the views of [76,77], it could be argued that the results (e.g., in the context of how migrants in Kumasi and Obuasi could end up being residentially segregated due to urban economic malfunctions that underpin informality) highlight the need for policy to address urban poverty and unemployment in order to mitigate the impacts of socio-spatial segregation that may arise due to urban characteristics such as informality. In sum, the analysis shows how the social development challenges of urbanisation may become inevitable if urbanisation in Kumasi and Obuasi proceeds in its current pace without adequately planned preconditions for social development.

6.3.3. Environmental Dimension

From an environmental development perspective, the results of this study confirm the findings of previous research, e.g., [14,17,41], about how urbanisation leads to the destruction of the natural environment in Ghana, and the results also highlight: (i) how land was lost to urban development; and (ii) how urban development was preceded by a wave of land conversion, typically, from forest to agricultural land-use. The results (Table 1 and Table 2) show that within the study period, urbanisation led to a decrease in natural vegetation cover (consisting of ‘agriculture land’, ‘mixed woody vegetation’, and primary ‘forest’) in Kumasi; although in Obuasi, a significantly lower proportion of natural vegetation was replaced by urban land cover. What this means is that, urban development, by replacing natural vegetation cover, has destroyed the biodiversity contained within the natural vegetation, as well as possibly impaired the wider ecosystem services that operate within the natural vegetation. Important differences exist when the impact of LCC on urban sprawl in Kumasi and Obuasi is considered. In this context, the results (Figure 5) show that urbanisation has resulted in both Kumasi and Obuasi experiencing significant urban expansion, and in effect, urban sprawl. However, when we factor in the reality that the population in both Kumasi and Obuasi expanded by at least three times between 1984 and 2019, then the sprawl in Kumasi appears more significant as it has directed urban expansion beyond the 254 km2 administrative boundary and into adjoining districts, whereas the sprawl in Obuasi is contained with the official administrative boundaries. What this means for sustainability, considering that such sprawls are characterised by less-compact urban forms and low-density development, is the possibility that more land resources have been expended in the pursuit of urban development in Kumasi than might be acceptable. Furthermore, in the context of the possible lower density development that characterises urban expansion in Kumasi compared with Obuasi, citizens who live at the peripheries of the Kumasi area are likely to travel longer distances in order to access core services that may only exist in the city centre. Consistent with suggestions in the literature, e.g., [36,39], the potential resulting effects of such long-distance travel is the increased incidence of air pollution and climate change due to the release and accumulation of greenhouse gases from urban transport. Based on what has been discussed so far, the pernicious implications of urbanisation for the environment in both Kumasi and Obuasi are evident.

7. Recommendation and Limitations

In terms of policy implications, the analysis of urbanisation in this study demonstrates the spatial and temporal ways in which sustainability, as a concept, challenges urban planning policy and practice in Ghana. As the (un)sustainability of Ghanaian urban areas is primarily a matter of cumulative impacts, the adequacy of the prevailing planning regime is critical as it is the arena where strategies to achieve greater sustainability over the long term will be conceived, mobilised, accepted or rejected. Therefore, it is recommended that the capacity and independence of planning authorities in Ghana are enhanced to ensure that land-use and population growth are well-anchored within wider urban plans in ways that lead to just and sustainable urban development.
Some limitations are evident in this study. Firstly, concerning the assessment of landscape urbanisation, the extent of land cover detail was limited as a maximum of seven classes were mapped. For instance, apart from primary ‘forest’, all other forest types were classified as ‘mixed woody vegetation’. Nevertheless, the primary agenda in this study was to highlight the extent of ‘built-up’ (urban) land cover in relation to other land cover types. This was achieved. Future studies could provide a more detailed and comprehensive analysis to include the other land cover types that were not captured in detail in this study. Secondly, wider analysis of the sustainability implications of rapid urbanisation is limited in this study which, consistent with the paucity of urban data (e.g., urbanisation-related data) in Africa [10], is due to the lack of disaggregated urban data on Kumasi and Obuasi. This was mitigated by considering the results within the context of the extant literature. Future research could consider generating more disaggregated local urban data in order to improve understanding of urbanisation in the context of sustainability. More specifically, future research could consider how informal settlements and spatial patterns of population density affect urban sustainability. Furthermore, future research could explore land cover change in the context of the Sustainable Development Goals.

8. Conclusions

This study has provided empirical insights into the dynamics and possible sustainability implications of urbanisation in Ghana. Based on a comparative study of two urban areas (Kumasi and Obuasi) in Ghana, landscape and demographic urbanisation is empirically assessed by analysing LCC and population dynamics. The results show that urbanisation has been rapid in Kumasi and Obuasi, and it has resulted in substantial changes in land cover and demography. The results show that the magnitude of urban expansion and population growth is higher in Kumasi than in Obuasi, thereby confirming suggestions about how large urban areas expand faster than smaller ones in an increasingly globalised world [22,23]. The differences in urbanisation patterns between Kumasi and Obuasi have been shaped by factors such as city size and the interplay among the respective local economy, land tenure regimes and market forces. Essentially, the results not only reflect the precariousness of rapid urbanisation in Kumasi and Obuasi, but also highlight its enormous implications for sustainability, which cut across economic, social, and environmental aspects. Based on the analysis provided in this study, it is concluded that the pace and extent of landscape and demographic change in Ghana possibly undermines sustainability in urban areas as the positive benefits of urbanisation (e.g., improved living standards) are potentially eroded by negative externalities (including urban sprawl, socio-spatial segregation, loss of livelihoods, etc.), which are stimulated by factors such as land tenure regimes and globalisation. Overall, this study facilitates understanding of the intricacies of urbanisation and the impacts for sustainability at the local urban level in Ghana. In doing so, this study makes an original contribution to scholarly literature, as to the best of the authors’ knowledge, it is the first study that simultaneously: provides a comparative empirical analysis of urbanisation between large and smaller urban areas in Ghana; situates local level urbanisation within a mining perspective; and highlights the implications of urbanisation in Ghana across the economic, social, and environmental dimensions of sustainability.

Supplementary Materials

The following are available online at https://www.mdpi.com/2073-445X/9/9/300/s1, Table S1: Characteristics of satellite sensors and images, Table S2: Land cover types analysed, Table S3: Number reference points in the land cover class types used for training and accuracy assessment for Kumasi, 1986–2018, Table S4: Number of reference points in the land cover class types used for training and accuracy assessment for Obuasi, 1986–2018, Table S5: Confusion matrix for land cover classification in Kumasi for 1986, Table S6: Confusion matrix for land cover classification in Kumasi for 2000, Table S7: Confusion matrix for land cover classification in Kumasi for 2010, Table S8: Confusion matrix for land cover classification in Kumasi for 2018, Table S9: Confusion matrix for land cover classification in Obuasi for 1986, Table S10: Confusion matrix for land cover classification in Obuasi for 2000, Table S11: Confusion matrix for land cover classification in Obuasi for 2010, Table S12: Confusion matrix for land cover classification in Obuasi for 2018, Table S13: LCC change matrix for Kumasi 1986–2000, Table S14: LCC change matrix for Kumasi 2000–2010, Table S15: LCC change matrix for Kumasi 2010–2018, Table S16: LCC change matrix for Obuasi 1986–2000, Table S17: LCC change matrix for Obuasi 2000–2010, Table S18: LCC change matrix for Obuasi 2010–2018.

Author Contributions

All authors contributed in the development of the current paper. Investigation, K.A.; Writing—Original Draft Preparation, K.A.; Writing—Review & Editing, R.A.H. & C.S.; Supervision, R.A.H. & C.S. All authors have read and agreed to the published version of the manuscript.

Funding

This research received no external funding, and the APC was funded through the Department of Life and Environmental Sciences (Bournemouth University) QR Fund award.

Acknowledgments

This research was supported by the Bournemouth University Vice Chancellor’s PhD Scholarship awarded in 2016. We would like to thank the anonymous reviewers for their useful comments and suggestions.

Conflicts of Interest

The authors declare no conflict of interest.

References

  1. Dodman, D.; Brown, D.; Francis, K.; Johnson, C.; Satterthwaite, D. Understanding the Nature and Scale of Urban Risk in Low- and Middle-Income Countries and Its Implications for Humanitarian Preparedness, Planning and Response. Available online: https://pubs.iied.org/pdfs/10624IIED.pdf (accessed on 30 February 2020).
  2. Jeronen, E. Sustainability and Sustainable Development. Encycl. Corp. Soc. Responsib. 2013, 2370–2378. [Google Scholar] [CrossRef]
  3. World Urbanization Prospects: The 2014 Revision Highlights; United Nations Department of Economic and Social Affairs, Population Division: New York, NY, USA, 2014; Available online: https://population.un.org/wup/Publications/Files/WUP2014-Report.pdf (accessed on 13 February 2020).
  4. Allen, A. Sustainable Cities or Sustainable Urbanisation? Perspective. UCL’s Journal of Sustainable Cities (Summer Edition). 2009. Available online: https://www.ucl.ac.uk/sustainable-cities/results/gcsc-reports/allen.pdf (accessed on 20 March 2016).
  5. Jaeger, J.A.G.; Bertiller, R.; Schwick, C.; Kienast, F. Suitability criteria for measures of urban sprawl. Ecol. Ind. 2010, 10, 397–406. [Google Scholar] [CrossRef]
  6. Zhou, J.; Shen, L.; Song, Z.; Zhang, X. Selection and modelling sustainable urbanization indicators: A responsibility-based method. Ecol. Ind. 2015, 56, 87–95. [Google Scholar] [CrossRef]
  7. Gong, P.; Liang, S.; Carlton, E.J.; Jiang, Q.; Wu, J.; Wang, L.; Remais, J.V. Urbanisation and health in China. Lancet 2012, 379, 843–852. [Google Scholar] [CrossRef]
  8. Turok, I.; McGranahan, G. Urbanization and economic growth: The arguments and evidence for Africa and Asia. Environ. Urban. 2013, 25, 465–482. [Google Scholar] [CrossRef]
  9. Peter, C.; Swilling, M. Sustainable, Resource Efficient Cities: Making It Happen! United Nations Environment Programme: Paris, France, 2012. [Google Scholar]
  10. Smit, W.; Parnell, S. Urban sustainability and human health: An African perspective. Curr. Opin. Environ. Sustain. 2012, 4, 443–450. [Google Scholar] [CrossRef]
  11. Cobbinah, P.B.; Erdiaw-Kwasie, M.O.; Amoateng, P. Africa’s urbanisation: Implications for sustainable development. Cities 2015, 47, 62–72. [Google Scholar] [CrossRef]
  12. Bugliarello, G. Urban sustainability: Dilemmas, challenges and paradigms. Technol. Soc. 2006, 28, 19–26. [Google Scholar] [CrossRef]
  13. Fang, P.; Chen, J.; John, R. Urbanization and environmental change during the economic transition on the Mongolian Plateau: Hohhot and Ulaanbaatar. Environ. Res. 2016, 144 Pt B, 96–112. [Google Scholar]
  14. Stow, D.A.; Weeks, J.R.; Shih, H.-C.; Coulter, L.L.; Johnson, H.; Tsai, Y.-H.; Kerr, A.; Benza, M.; Mensah, F. Inter-regional pattern of urbanization in southern Ghana in the first decade of the new millennium. Appl. Geogr. 2016, 71, 32–43. [Google Scholar] [CrossRef] [Green Version]
  15. Acheampong, R.A.; Agyemang, F.S.; Abdul-Fatawu, M. Quantifying the spatio- temporal patterns of settlement growth in a metropolitan region of Ghana. GeoJournal 2017, 82, 823–840. [Google Scholar] [CrossRef] [Green Version]
  16. Korah, P.I. Exploring the emergence and governance of new cities in Accra, Ghana. Cities 2020, 99, 102639. [Google Scholar] [CrossRef]
  17. Toure, S.I.; Stow, D.A.; Clarke, K.; Weeks, J. Patterns of land cover and land use change within the two major metropolitan areas of Ghana. Geocarto Int. 2018, 35, 209–223. [Google Scholar] [CrossRef]
  18. Gough, K.V.; Yankson, P.W.K. Exploring the connections: Mining and urbanisation in Ghana. J. Contem. Afr. Stud. 2012, 30, 651–668. [Google Scholar] [CrossRef]
  19. Gough, K.V.; Yankson, P.W.K.; Esson, J. Migration, housing and attachment in urban gold mining settlements. Urban Stud. 2019, 56, 2670–2687. [Google Scholar] [CrossRef]
  20. Adu, G. Impacts of Foreign Direct Investment (FDI) on Rural Poverty in Developing Countries: The Case of Mining FDI in Ghana. Major Papers 19. Available online: https://scholar.uwindsor.ca/major-papers/19/ (accessed on 2 April 2020).
  21. Guérin-Pace, F. Rank-size distribution and the process of urban growth. Urban Stud. 1995, 32, 551–562. [Google Scholar] [CrossRef]
  22. Carlucci, M.; Grigoriadis, E.; Rontos, K.; Salvati, L. Revisiting an Hegemonic Concept: Long-term ‘Mediterranean Urbanization’ in between city re-polarization and metropolitan decline. Appl. Spat. Anal. Policy 2017, 10, 347–362. [Google Scholar] [CrossRef]
  23. Glaeser, E.L.; Shapiro, J.M. Urban growth in the 1990s: Is city living back? J. Reg. Sci. 2003, 43, 139–165. [Google Scholar] [CrossRef]
  24. Jones, G.W. Southeast Asian urbanization and the growth of mega-urban regions. J. Popul. Res. 2002, 19, 119–136. [Google Scholar] [CrossRef]
  25. Martinez-Fernandez, C.; Audirac, I.; Fol, S.; Cunningham-Sabot, E. Shrinking cities: Urban challenges of globalization. Int. J. Urban Reg. Res. 2012, 36, 213–225. [Google Scholar] [CrossRef]
  26. Report of the World Commission on Environment and Development [WCED]: Our Common Future; Oxford University Press: London, UK, 1987.
  27. Sakalauskas, L. Sustainability models and indicators. Technol. Econ. Dev. Econ. 2010, 16, 567–577. [Google Scholar] [CrossRef]
  28. Ward, D.; Phinn, S.R.; Murray, A.T. Monitoring growth in rapidly urbanizing areas using remotely sensed data. Prof. Geogr. 2000, 52, 371–386. [Google Scholar] [CrossRef]
  29. Serra, P.; Pons, X.; Saurì, D. Land-cover and land-use change in a Mediterranean landscape: A spatial analysis of driving forces integrating biophysical and human factors. Appl. Geog. 2008, 28, 189–209. [Google Scholar] [CrossRef]
  30. Geri, F.; Amici, V.; Rocchini, D. Human activity impact on the heterogeneity of a Mediterranean landscape. App.Geog. 2010, 30, 370–379. [Google Scholar] [CrossRef]
  31. Samal, D.; Gedam, S. Monitoring land use changes associated with urbanization: An object-based image analysis approach. Eur. J. R. Sens. 2015, 48, 85–99. [Google Scholar] [CrossRef]
  32. Lambin, E.F.; Turner, B.I.; Geist, H.J. The causes of land use and land cover change: Moving beyond the myths. Glob. Environ. Chang. 2001, 11, 261–269. [Google Scholar] [CrossRef]
  33. Turner, B.L.; Lambin, E.F.; Reenberg, A. The emergence of land change science for global environmental change and sustainability. Proc. Natl. Acad. Sci. USA 2007, 104, 20666–20671. [Google Scholar] [CrossRef] [Green Version]
  34. Wang, X.; Shi, R.; Zhou, Y. Dynamics of urban sprawl and sustainable development in China. Socio-Econ. Plan. Sci. 2020, 70, 100736. [Google Scholar] [CrossRef]
  35. Zeng, H.; Sui, D.Z.; Li, S. Linking Urban Field Theory with GIS and Remote Sensing to Detect Signatures of Rapid Urbanization on the Landscape: Toward a New Approach for Characterizing Urban Sprawl. Urban Geogr. 2005, 26, 410–434. [Google Scholar] [CrossRef]
  36. Aurand, A.G. Is Smart Growth for Low-Income House-holds: A Study of the Impact of Four Smart Growth Principles on the Supply of Affordable Housing. Ph.D. Thesis, University of Pittsburgh, Pittsburgh, PA, USA, 2007; 451p. [Google Scholar]
  37. Abudu, D.; Echina, R.Z.; Andogah, G. Spatial assessment of urban sprawl in Arua Municipality, Uganda. Egypt. J. Remote Sens. Space Sci. 2019, 22, 315–322. [Google Scholar] [CrossRef]
  38. Jenks, M.; Dempsey, N. The language and meaning of density. In Future Forms and Design for Sustainable Cities; Jenks, M., Dempsey, N., Eds.; Architectural Press: Oxford, UK, 2005. [Google Scholar]
  39. Polidoro, M.; Lollo, D.A.L.; Barros, F.V.M. Urban sprawl and the challenges for urban planning. J. Environ. Prot. 2012, 3, 1010–1019. [Google Scholar] [CrossRef] [Green Version]
  40. Yeboah, E.; Obeng-Odoom, F. We are not the only ones to blame’: District Assemblies’ perspectives on the state of planning in Ghana. Commonw. J. Local Gov. 2010, 7, 78–98. [Google Scholar] [CrossRef] [Green Version]
  41. Coulter, L.L.; Stow, D.A.; Tsai, Y.; Ibanez, N.; Shih, H.; Kerr, A.; Benza, M.; Weeks, J.R.; Mensah, F. Classification and assessment of land cover and land use change in southern Ghana using dense stacks of Landsat 7 ETM+ imagery. Remote Sens. Environ. 2016, 184, 396–409. [Google Scholar] [CrossRef]
  42. Attua, E.M.; Fisher, J.B. Historical and Future Land-Cover Change in a Municipality of Ghana. Earth Interact. 2011, 15, 1–26. [Google Scholar] [CrossRef] [Green Version]
  43. Owusu, G.; Afutu-Kotey, R.L. Poor urban communities and municipal interface in Ghana: A case study of Accra and Sekondi-Takoradi metropolis. Afr. Stud. Q. 2010, 12, 1. [Google Scholar]
  44. Abulibdeh, A.; Al-Awadhi, T.; Al-Barwani, M. Comparative analysis of the driving forces and spatiotemporal patterns of urbanisation in Muscat, Doha, and Dubai. Dev. Pract. 2019, 29, 606–618. [Google Scholar] [CrossRef]
  45. Aryee, B.N.A.; Ntibery, B.K.; Atorkui, E. Trends in the small-scale mining of precious minerals in Ghana: A perspective on its environmental impact. J. Clean. Prod. 2003, 11, 131–140. [Google Scholar] [CrossRef]
  46. Bloch, R.; Owusu, G. Linkages in Ghana’s gold mining industry: Challenging the enclave thesis. Resour. Policy 2012, 37, 434–442. [Google Scholar] [CrossRef]
  47. Hilson, G. Corporate social responsibility in the extractive industries: Experiences from developing countries. Resour. Policy 2012, 37, 131–137. [Google Scholar] [CrossRef]
  48. Standing, A. Ghana’s extractive industries and community benefit sharing: The case for cash transfers. Resour. Policy 2014, 40, 74–82. [Google Scholar] [CrossRef]
  49. Jabareen, Y. A new conceptual framework for sustainable Development. Environ. Dev. Sustain. 2008, 10, 179–192. [Google Scholar] [CrossRef]
  50. Owoo, N.S.; Boakye-Yiadom, L. The gender dimension of land tenure security on agricultural productivity: Some evidence from two districts in Kenya. J. Int. Dev. 2015, 27, 917–928. [Google Scholar] [CrossRef]
  51. Lemmen, C. The Social Tenure Domain Model: A Pro-Poor Land Tool; The International Federation of Surveyors: Copenhagen, Denmark, 2010. [Google Scholar]
  52. Aubynn, A.K. Live and let live’: The relationship between artisanal/small-scale and large-scale miners at Abosso Goldfield, Ghana. In Small-Scale Mining, Rural Subsistence and Poverty in West Africa; Hilson, G.M., Ed.; Practical Action Publishing: Rugby, UK, 2006; pp. 237–240. [Google Scholar]
  53. Nyame, F.K.; Blocher, J. Influence of land tenure practices on artisanal mining activity in Ghana. Resour. Policy 2010, 35, 47–53. [Google Scholar] [CrossRef]
  54. Siiba, A.; Adams, E.A.; Cobbinah, P.B. Chieftaincy and sustainable urban land use planning in Yendi, Ghana: Towards congruence. Cities 2018, 73, 96–105. [Google Scholar] [CrossRef]
  55. Boamah, N.A.; Gyimah, C.; Nelson, J.K.B. Challenges to the enforcement of development controls in Wa municipality. Habitat Int. 2012, 36, 136–142. [Google Scholar] [CrossRef]
  56. Ahmed, A.; Dinye, R.D. The impact of land use activities on Subin and Aboabo Rivers in Kumasi Metropolis. Int. J. Water Res. Env. Eng. 2012, 4, 241–251. [Google Scholar]
  57. Jnr, S.D.; Cieem, G.; Ayensu-Ntim, A.; Twumasi-Ankrah, B.; Barimah, P.T. Effects of Loss of Agricultural Land Due to Large-Scale Gold Mining on Agriculture in Ghana: The Case of the Western Region. Br. J. Res. 2016, 2, 196–221. [Google Scholar]
  58. Janz, N. Foreign direct investment and repression: An analysis across industry sectors. J. Hum. Rights 2018, 17, 163–183. [Google Scholar] [CrossRef]
  59. Obeng-Odoom, F. Neoliberalism and the Urban Economy in Ghana: Urban Employment, Inequality, and Poverty. Growth Chang. 2012, 43, 85–109. [Google Scholar] [CrossRef]
  60. Addison, T.; Heshmati, A. The New Global Determinants of FDI Flows to Developing Countries: The Importance of ICT and Democratization (Working Paper No. 2003/45). WIDER Discussion Papers//World Institute for Development Economics (UNU-WIDER). Available online: https://www.econstor.eu/handle/10419/52914 (accessed on 2 April 2020).
  61. Andrews, N. Challenges of corporate social responsibility (CSR) in domestic settings: An exploration of mining regulation vis-à-vis CSR in Ghana. Resour. Policy 2016, 47, 9–17. [Google Scholar] [CrossRef]
  62. Amponsah-Tawiah, K.; Darteh-Baah, K. The mining industry in Ghana; a Blessing or a curse? Int. J. Bus. Soc. Sci. 2011, 2, 62–69. [Google Scholar]
  63. Harvey, D. From Managerialism to Entrepreneurialism: The Transformation in Urban Governance in Late Capitalism. Geogr. Ann. 1989, 71, 3–17. [Google Scholar] [CrossRef]
  64. OECD. Competitive Cities: A New Entrepreneurial Paradigm in Spatial Development. Available online: https://www.oecd.org/cfe/regional-policy/38747575.pdf (accessed on 3 January 2019).
  65. Lauermann, J. Urban Managerialism/Entrepreneurialism. In The Wiley-Blackwell Encyclopedia of Social Theory; Wiley: Hoboken, NJ, USA, 2017. [Google Scholar] [CrossRef]
  66. Wang, X.; Tomaney, J. Zhengzhou—Political economy of an emerging Chinese megacity. Cities 2019, 84, 104–111. [Google Scholar] [CrossRef]
  67. Mishra, R. Globalization and the Welfare State; Edward Elgar: Cheltenham, UK, 1999. [Google Scholar]
  68. World Bank. Rising Through Cities in Ghana: Urbanization Review-Overview Report; World Bank Group: Washington, DC, USA, 2015. [Google Scholar]
  69. UNICEF. Understanding the specifics of urban poverty: A case study from Accra, Ghana. In The State of the World’s Children 2012; UNICEF: New York, NY, USA, 2012. [Google Scholar]
  70. Ofori, E.G. Taxation of the Informal Sector in Ghana: A Critical Examination. Master’s Thesis, Institute of Distance Learning, KNUST, Kumasi, Ghana, May 2009. [Google Scholar]
  71. Osei-Boateng, C.; Ampratwum, E. The Informal Sector in Ghana. Available online: https://library.fes.de/pdf-files/bueros/ghana/10496.pdf (accessed on 29 July 2019).
  72. World Bank Report. World Development Report: Attacking Poverty; Oxford University Press: New York, NY, USA, 2000. [Google Scholar]
  73. Potts, D. Debates about African urbanisation, migration and economic growth. Geogr. J. 2016, 182, 251–264. [Google Scholar] [CrossRef] [Green Version]
  74. Porter, L. Informality, the commons and paradoxes for planning: Concepts and debates for informality and planning. Plann. Theor. Pract. 2011, 12, 112–120. [Google Scholar]
  75. Hormeku, T. The Transformation and Development of the Informal Sector and the Role of Trade Unions. In Proceedings of the OATUU/ILO/ETUF Seminar on “Trade Unions and the Informal Sector”, Cairo, Egypt, 4–6 May 1998. [Google Scholar]
  76. Agyei-Mensah, S.; Owusu, G. Segregated by neighbourhoods? A portrait of ethnic diversity in the neighbourhoods of the Accra Metropolitan Area, Ghana. Popul. Space Place 2010, 16, 499–516. [Google Scholar] [CrossRef]
  77. Owusu, G.; Agyei-Mensah, S. A comparative study of ethnic residential segregation in Ghana’s two larget cities, Accra and Kumasi. Popul. Environ. 2011, 32, 332–352. [Google Scholar] [CrossRef]
  78. Landsat Levels of Processing. Available online: https://www.usgs.gov/land-resources/nli/landsat/landsat-levels-processing (accessed on 25 September 2019).
  79. Anderson, J.R.; Hardy, E.E.; Roach, J.T.; Witmer, W.E. A Land Use and Land Cover Classification System for Use with Earth Observation Data; USGS Professional Paper 964; USGS: Reston, Virginia, 1976.
  80. Ghana Statistical Service. 2010 Population and Housing Report: Urbanisation. Available online: http://www.statsghana.gov.gh/gssmain/fileUpload/pressrelease/Urbanisation%20in%20Ghana.pdf (accessed on 10 January 2017).
  81. Ghana Statistical Service. District Analytical Report: Kumasi Metropolitan. Available online: http://www2.statsghana.gov.gh/docfiles/2010_District_Report/Ashanti/KMA.pdf (accessed on 10 January 2017).
  82. Ghana Statistical Service. District Analytical Report: Obuasi Municipality. Available online: http://www2.statsghana.gov.gh/docfiles/2010_District_Report/Ashanti/OBUASI.pdf (accessed on 10 January 2017).
  83. Ghana Statistical Service. Population Projections. Available online: http://www.statsghana.gov.gh/nationalaccount_macros.php?Stats=MTA1NTY1NjgxLjUwNg==/webstats/s679n2sn87 (accessed on 13 March 2019).
Figure 1. Map of Ghana showing the study sites.
Land 09 00300 g001
Figure 2. Workflow of land cover change analysis.
Land 09 00300 g002
Figure 3. Maps showing land cover change (LCC) characteristics in Kumasi (1986–2018). Note: ‘mixed wood vegetation’ is presented in the legend as ‘mixed vegetation’.
Land 09 00300 g003
Figure 4. Maps showing LCC characteristics in Obuasi (1986–2018). Note: ‘mixed wood vegetation’ is presented in the legend as ‘mixed vegetation’.
Land 09 00300 g004
Figure 5. Urban expansion in Obuasi and Kumasi.
Land 09 00300 g005
Figure 6. Proportion of migrants born within or outside Kumasi and Obuasi in 2010. Source [80,81,82,83].
Land 09 00300 g006
Table 1. Land cover characteristics in Kumasi (1986–2018).
LCC ClassesArea Coverage (km2)Changes in Area (%)
19862000201020181986–20002000–20102010–20181986–2018
Built-Up43.23232.92390.23509.20438.7967.5330.501105.77
Agriculture Land64.75400.71373.96118.55518.85−6.68−68.3083.00
Mixed Woody Vegetation628.76176.3446.57113.35−71.95−73.59143.39−81.97
Water0.500.960.960.6792.000.00−30.2034.00
Forest78.114.423.6373.58−94.34−17.871924.51−5.91
Total815.35815.35815.35815.35
Table 2. Land cover characteristics in Obuasi (1986–2018).
LULC ClassesArea Coverage (km2)Changes in Area (%)
19862000201020181986–20002000–20102010–20181986–2018
Built-Up23.6036.6246.5057.6855.162724144.40
Agriculture Land126.6480.13110.03126.83−36.7237.3115.270.15
Mixed Woody Vegetation161.56189.4176.06117.5217.31−59.8454.51−27.26
Forest58.1670.08119.0471.5520.4969.86−39.8923.02
Water-0.071.200.07-161494.17-
Bare ground--11.15-----
Mining10.554.2016.536.86−60.19293.57−58.5−34.98
Total380.51380.51380.51380.51
Note: ‘-’ is placed where a land cover type is not identified in the imagery for a particular year.
Table 3. Population statistics for Kumasi and Obuasi (1984–2019).
LocationPopulationAverage Annual Change in Population
(%)
19842000201020191984–20002000–20102010–2019
Kumasi496,6281,170,2701,730,2492,105,38214.814.792.41
Obuasi60,617115,564143,644203,55411.942.434.63
Source: [80,81,82,83].
Table 4. Population density (number of people/km2) in Kumasi and Obuasi.
KumasiObuasi
YearBuilt-Up AreaPopulationPop. Density (Mean)Built-Up AreaPopulationPop. Density (Mean)
1984/198643.22496,62811,49123.6060,6172569
2000232.921,170,270502436.60115,5643156
2010390.231,730,249443446.50143,6443089
2018/2019509.202,105,382413557.68203,5543529

