Integrating Ecosystem Services and Disservices in Valuing Smallholder Livestock and Poultry Production in Three Villages in South Africa


Department of Environmental Science, Rhodes University, Grahamstown 6140, South Africa
*
Author to whom correspondence should be addressed.
Land 2020, 9(9), 294; https://doi.org/10.3390/land9090294
Submission received: 13 July 2020
/
Revised: 19 August 2020
/
Accepted: 20 August 2020
/
Published: 26 August 2020
(This article belongs to the Section Landscape Ecology)
Abstract
:This study presents an integrated examination of both the ecosystem services (ES) and ecosystem disservices (EDS) associated with smallholder animal husbandry in rural livelihoods in three villages in southeast South Africa. It recognises the contribution of ES supporting and resulting from smallholder livestock and poultry production, but also details the limiting factors or EDS, such as tick-borne disease, birds of prey or unpalatable rangeland, produced by the same system. Using a mixed-methods approach, including focus group discussions with various Participatory Learning and Action (PLA) activities, key informant interviews, household surveys and land-use change mapping on GIS, we consider the relative value and benefits from ES after the effects of EDS, as well as the management and strategies that households adopt to minimise EDS. The effects of ES and EDS were expressed in economic terms to provide a common framework to assess the magnitude of their contribution or effect. Although animal husbandry made measurable contributions to households, with an average gross value of between R2605–R9753 across villages, EDS undermined the meaningful production of livestock and poultry goods and services. The average EDS-induced economic loss in households was between R8289–R22,426 per annum. Despite active management, often at substantial cost to the household, EDS undermined the health of livestock which resulted in a loss of the animal or potential goods and services produced. We emphasise the need to recognise both the positive and negative contributions of ecosystems to identify the complex feedbacks between ES and EDS which interact to determine local ways of doing things.
1. Introduction
Livestock are a common component of rural livelihoods across the globe, providing multiple goods and services [1,2,3,4] which aid livelihood diversification and hence, resilience [5]. However, smallholder livestock owners often face multiple production constraints, some of which originate from local ecosystems (such as predation by wild animals, bovine disease and lack of nutritional feed resources) and are therefore considered ecosystem disservices (EDS) [6,7]. These reduce the potential yield of consumptive livestock outputs and undermine animal health and herd growth, all of which diminish potential income through sale. At the household level, this may have direct negative implications for household wellbeing, such as increased vulnerability to food insecurity and a reduced ability to mitigate shocks. Yet, within the livelihood framing, a full catalogue of livestock-related EDS and estimates of resulting economic losses, alongside the value of their services, has not been considered. The importance of this paper then lies in providing an integrated analysis of the services from and EDS to livestock in rural livelihoods.
Cattle, small stock and poultry provide multiple cash and non-cash benefits to rural dwellers (and some urban ones too). These include protein-rich food, such as meat, milk and eggs to supplement diets, and other consumptive outputs including hides, manure, and draught power for ploughing which enable crop production and income generation. For example, [8], working in rural communities in West Africa, highlighted that livestock owning households were able to cultivate larger areas more efficiently, giving rise to a higher crop value than households who did not own livestock. In addition, livestock constitute crucial assets for safeguarding livelihoods during periods of food insecurity or unforeseen shocks. Livestock are purchased during higher income years, as a means to store capital, and in lower-income years, or periods of misfortune, are sold to satisfy consumption requirements or cope with shock. Livestock ownership, then, represents an alternative form of insurance. For example, during periods of crop failure in rural Madagascar, income generated through the sale of livestock accounted for more than 56% of the average food expenditures [9]. Similar sentiments are echoed by [10] who highlight livestock trade as a way of coping with food stress during drought in the Zvishavane district, Zimbabwe. In some regions, including the study area for this work, livestock are also central to culture and even identity. In the Eastern Cape of South Africa, cattle are integral to culture and belief systems where ritual slaughter is embedded in worship and communication with ancestors, and protection against malicious spirits [11], and smaller species are used too.
Yet, livestock productivity amongst smallholder livestock owners may be severely constrained by a range of EDS that affect livestock production and potentially undermine meaningful livestock trade. For example, in South Africa, smallholder livestock range freely on communal rangelands. However, many of the communal rangelands are gauged to be in poor condition with low nutritional value [12,13]. Further, diseases, the most serious of which are spread by ticks, are a widely cited EDS and are responsible for significant economic losses. For example, [14] reported that parasitic diseases in rural Uganda, including tick-borne diseases, reduced draft cattle output by one-fifth and potential household income from the use of draft oxen by one-third. Low productivity from draft cattle ultimately affected household income, labour and, consequently, food security. Similar levels of tick-related losses occurred amongst Beninese smallholder cattle farmers resulting in a 20% reduction in meat production, 16% decline in milk production, an 11% increase in mortality rate, and a 5% depreciation of skin value [15].
EDS increase livestock mortality or undermine animal health, affecting the success of small-scale farmers [16]. Thus, EDS raise the cost of production through necessitating preventative or response measures. Regardless of the limitations of the simple dichotomy of ecosystem services (ES) versus EDS [17], thinking about these costs in tandem with the benefits provided by the same ecosystem in a single framework respects the lived realities of local communities [18,19] as those involved in livestock husbandry and poultry ownership actively seek to harness the positive contributions from ES and mitigate the negative effects from EDS. Under some circumstances, EDS may influence peoples’ actions and resulting benefits more than ES do (e.g., [18,19,20,21]). In recognising this, integrated framing and management strategies are likely to deliver better outcomes for human wellbeing at a lower investment than the management of just ES or EDS alone [20].
Within this framing, this research contributes towards building a grounded body of knowledge on the relative balance between ES and EDS in smallholder livestock and poultry ownership and wellbeing. We identify ES and EDS associated with livestock and poultry smallholder production in three different villages along a gradient of agroecological productivity. We provide an integrated view of the role of livestock and poultry-related activities in rural households by quantifying the economic contribution of ES from and the estimated economic losses to EDS, and adaptive responses to manage or limit EDS.
2. Materials and Methods
2.1. Study Area
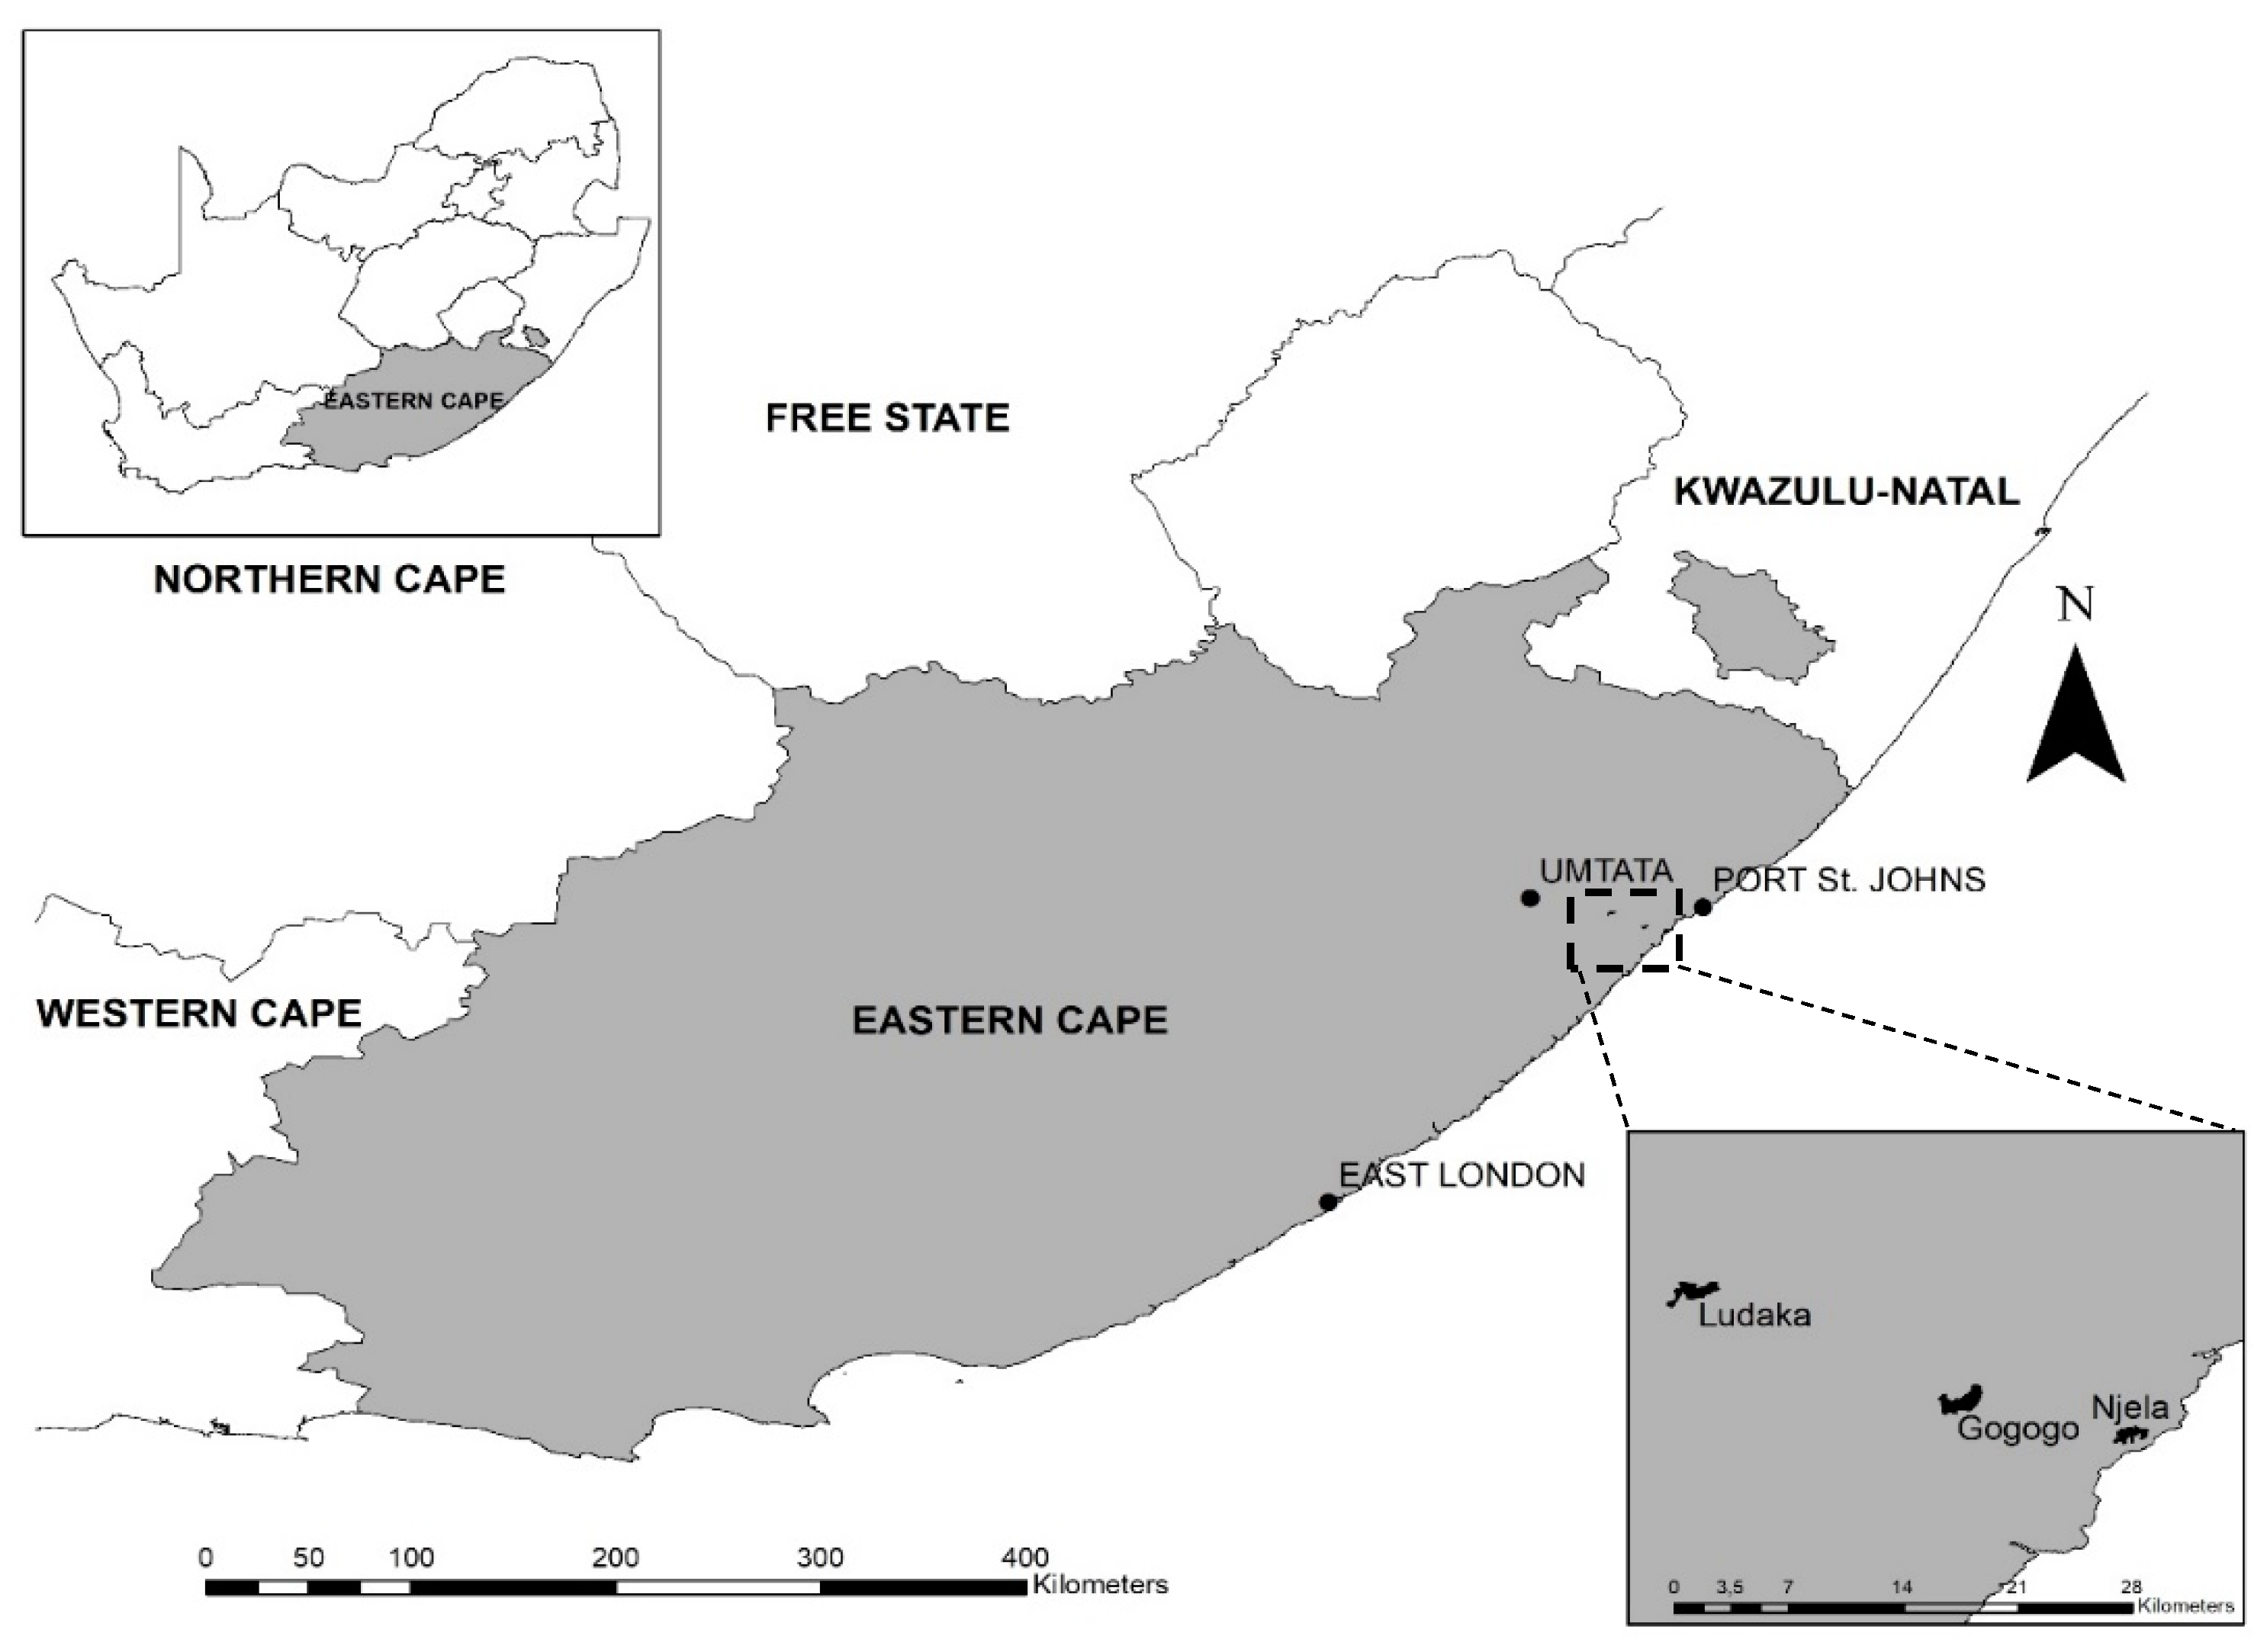
This study was conducted in three rural villages situated along a gradient of decreasing agroecological potential (from the coast inland) in the Transkei region of the Eastern Cape province, South Africa (Figure 1). The coastal village Njela (31°44′16″ S; 29°22′26″ E) lies approximately 18 km from the R61 road that links Mthatha to Port St Johns, the closest urban hub. Gogogo (31°43′11″ S; 29°17′00″ E) and Ludaka (31°39′21″ S; 29°08′09″ E) are situated further inland towards Libode, roughly 15 km and 56 km from Njela, respectively.
Gogogo is the largest village with a population of 951 (206 households), followed by Ludaka with 685 people (144 households) and then Njela with 85 households (460 people) [22]. The youth (age 0–19) make up the largest demographic group, comprising more than 59% of the population in each village, with less than 6% of the population being pensioners (65+ years) [22].
Each village is under communal tenure, where land is categorised into arable land, residential plots with neighbouring home gardens, and communal rangeland which is used for grazing and the extraction of natural resources. While land is state-owned, the authority to allocate land lies with the traditional leadership of chiefs and headmen. Most households have electricity, but none have water reticulation. The entire population in Gogogo and Ludaka rely on river or rainwater, and people in Njela rely on a stagnant, dammed pool for water. Some households harvest rainwater via gutters into storage tanks. Fuelwood is the dominant source of energy for cooking and heating, while lighting is primarily electricity derived.
General economic activity in each village is low. The modal household income bracket in each village is R9601–19,600 per annum, with more than a quarter of households falling within the “no income” bracket [22]. Livelihoods in each village typically combine subsistence activities such as livestock husbandry, cultivation of home gardens and fields, collection of wild, natural resources, together with cash income sources. Cash income sources include mostly government socials grants (>95% of households), small businesses (e.g., thatching, hairdressing, mini-retail stores, sale of locally collected natural resources, etc.) and formal employment (31% of households in Njela, 15% in Gogogo and 8% in Ludaka) [23]. Formal education levels are low, with few advancing beyond primary school.
Biophysically, the landscape consists of rolling hills and valleys, with an altitude ranging from sea level at Njela to 600 m at Ludaka. The mean annual rainfall ranges between 1015 mm at Njela on the coast and 717 mm further inland at Ludaka and is concentrated in summer (October–April), although some rain in winter is common. Mean temperatures range from highs of 30 °C in summer, to lows of 10 °C in winter [24]. Njela falls within a floristic region known as the Transkei Coastal Belt [24]. The vegetation can best be described as a grassland-woodland-forest mosaic. The grasslands generally occur on the hill crests, with forests in the valleys and an uninterrupted belt of coastal dune thicket along the coast. Gogogo falls within the Ngongoni Veld vegetation type. This is characterised by dense, tall, grassland dominated by wiry Aristida junciformis and low species diversity. Wooded patches are present in the valleys [25]. Ludaka is primarily situated in Bisho Thornveld, characterised by grasslands with sparse, small trees, such as Acacia natalitia [25].
2.2. Methods
2.2.1. Data Collection
The research adopted a mixed-methods framework involving a combination of focus group discussions (FGDs), using a range of Participatory Learning and Action (PLA) activities with several groups per village, transect walks, structured household surveys, and key informant interviews. This allowed for triangulation across approaches. Fieldwork was conducted between late 2016 up to mid-2017 assisted by a translator. Interviews and discussions were conducted in the local language, isiXhosa, and interpreted simultaneously. Ethics clearance for the research approach, specific research instruments and informed consent were provided through Rhodes University (ES16/1). In this study, the term ‘livestock’ encompasses four-legged animals (cattle, sheep, goats, pigs) while ‘poultry’ refers to chickens.
A series of FGDs were held with different groups within each village, namely (a) livestock and poultry owners, (b) the elderly, (c) the youth, and (d) a mixed group to determine local indicators of human wellbeing. Participants for each FGD were nominated by the village headman. Within each FGD several PLA activities were conducted to establish the ES and EDS associated with livestock husbandry, and responses to combat common EDS. These included (a) trendlines, (b) seasonal calendars, (c) participatory mapping, (d) ranking exercises, and (e) matrices. Specific details of each are available in [23].
Local wellbeing indicators and perceptions were captured in a matrix. Common wellbeing indicators (e.g., quality of house, ownership of livestock, land ownership, type of job) were recorded in rows in the first column of the matrix and different wellbeing groups identified in the community (e.g., better-off, poor, or very poor) were inserted in the neighbouring columns. Details of the indicators pertaining to each wellbeing group were captured in columns providing insight into how people made a living in the area, how they gauged whether a family had high or low wellbeing, or the way in which ES or EDS affected local livelihoods. It also provided insight into what aspects other than money or material possessions were associated with wellbeing (e.g., education, membership of a specific organisation, participation in local traditional events, etc.).
Transect walks were undertaken with at least two participants from each livestock FGD along a pre-defined transect within the community. This allowed for collection and identification of key tick species mentioned in FGDs, clarification of any uncertainties in a more informal and familiar setting, the location of key features and resource areas depicted during the participatory mapping, and a general opportunity to better understand the spatial layout of the village, surrounding landscapes and their associated access routes.
Semi-structured, key informant interviews were conducted with village headmen, members of each village committee, and key individuals who specialised in the use or harvest of a particular ES. These were used to gain additional understanding of natural resource use and the effects of EDS in the community.
A household survey was completed in each village to obtain data on the types and quantities of livestock, as well as EDS experienced. Forty-one percent of households in Njela, 20% in Gogogo and 28% in Ludaka were randomly selected (after numbering households on an aerial photo). Household heads were the primary source of information but often delegated to another member for specific questions. A household was taken as a person or group of persons who live together and make common provision for food or other essentials for living [26]. The questionnaire had three sections. The first collected data required to calculate the direct-use values of livestock goods and services. This included a checklist of the number of livestock and poultry and the associated goods and services, followed by a section for details of each. Details of goods and services included frequency of collection (number of times a week/month/or annually) over the number of months (to account for seasonality), and the typical volume of collection. Where necessary local units were converted to conventional measures. Local farm gate prices of each resource were noted and used to calculate the direct-use value. Taking into account the production period, the mean annual direct-use value for each resource was calculated by multiplying the annual yield by the average local price. Slaughter or trade was calculated by multiplication of the number of slaughtered or traded animals per annum and the average local value of the livestock type. Mean values were calculated across user households and also all households (i.e., across users and non-users). Family labour costs were not deducted in the context of high unemployment in the area translating into few opportunities for external labour. Thus, all reported values are gross values. The Rand to US dollar value during the time was approximately USD 1 = R15.00.
The second section collected data on EDS, including (a) types of EDS, (b) respondent estimates of the financial cost of EDS-related losses or the magnitude of livestock services lost due to EDS, and (c) the adoption of any coping or adaptive mechanisms and the financial implications in implementing them. The cost of livestock EDS to households was represented by the loss of potential consumptive services, i.e., the average economic value of services that would have accrued per household if not for the EDS. The financial costs of coping or adaptive mechanisms were taken as the annual cost of prevention or treatment. The annual quantity of biochemical treatment used against pests and diseases was multiplied by the price of the biomedical product per user household and then averaged across all user households.
The last section captured details of the socio-economic characteristics of the household. This included local human wellbeing indicators such as type of house, number of appliances, sources of income from the formal, casual or self-employment sectors and social grants, as well as questions such as household size and structure, and age, level of education and number of years spent in the village of the household head.
Bush encroachment and other broad trends in land use and cover, were recorded at three different time periods approximately two decades apart (1974, 1995 and 2013) in each village through the classification, analysis and interpretation of aerial photographs in ArcGIS 10.3. Aerial photographs (1:50,000) of each study site for 1974 and 1995 were obtained from the Chief Directorate of Surveys and Mapping (Department of Land Affairs, Republic of South Africa) and georeferenced to 2013 images. A 30 × 30 m grid was then generated within each village boundary which was drawn by villagers in focus groups on Google Earth. This means the boundaries were based on local people’s spatial knowledge. A random selection of 5% of cells was sampled three times for each time period in each village and then each cell was classified according to the dominant land use or cover [23].
2.2.2. Data Analysis
Data were expressed in descriptive statistics, and in were necessary augmented with analysis in R version 3.4 [27]. After testing for normality, a one-way ANOVA was employed to test the significance of the differences in direct-use value across the three study sites. Regressions were carried out to test the strength of a relationship between human wellbeing and livestock economic value.
3. Results
3.1. Ecosystem Services
3.1.1. Livestock and Poultry Ownership, Numbers and Importance
The proportion of households owning at least one type of livestock varied between villages (Ludaka—70%; Gogogo—53%; Njela—29%) and more than three-quarters of all households owned poultry (Ludaka—75%; Gogogo—74%; Njela—80%) (Table 1). Common livestock included cattle, goats, sheep, and pigs, although not all were present in each village (Table 1).
The mean number of animals per stock-owning household was similar in Gogogo (15 ± 22) and Ludaka (19 ± 15) but lower in Njela (6 ± 6) (Table 1). A few owners with large numbers resulted in large standard deviations. Small stock were most prevalent, with goats dominating in Njela and Gogogo, and sheep in Ludaka (Table 1). Both were kept for similar purposes, i.e., their role in ritual slaughter and for income. In each village, cattle were the second most commonly owned livestock type but were regarded as the preferred type because of the diversity of goods and services obtainable such as trade, bride-wealth payment, draught power, transport, milk, manure and ritual slaughter.
Chickens were considered the most frequently used animals in most villages as they were readily slaughtered when guests visited or for household consumption with little asset loss to the household. The number of chickens per household was considered to be low (7 ± 6–9 ± 8). This was a result of the frequency of disease which killed the entire flock and forced homesteads to regularly rebuild stocks. Household surveys and trendline exercises also depicted a general decline in livestock numbers over time which was attributed to a combination of factors such as the absence of shepherds, the outbreak of disease and non-functional dipping facilities (Table 2).
3.1.2. Livestock Goods and Services and Value
The use of goods and services from livestock and poultry in each village offered a considerable direct-use value to owners. The overall direct-use and trade value amongst households that owned and used outputs was highest in Ludaka at R9753 ± 20,177 per annum and lowest in Njela at R2605 ± 3311 with Gogogo intermediate (R5353 ± 8228), however, no statistical significance was found (F = 2.3; p = 0.1). The higher economic value in Ludaka was probably due to a combination of factors such as (a) a higher proportion of livestock owners (Table 1), (b) a higher proportion of livestock owning households harnessing livestock outputs (Table 5, and (c) a greater capital value of cattle. When scaled across the entire village in Njela, consisting of 85 households (Statistics South Africa, 2011), the estimated total value of livestock and poultry products was approximately R164,475 per annum. Values for Gogogo (206 households) and Ludaka (144 households) were R826,884 and R1,152,288, respectively.
In general, livestock and poultry owning households frequently made use of at least one output in the preceding 12 months. Overall, the consumptive and trade value differed across villages, with different livestock and different goods and services contributing the most to the net gross direct-use and trade value. The most widely used goods and services amongst owning households were cattle manure, as floor sealant and manure, and chicken eggs (Table 3, Table 4 and Table 5). Cattle manure was also used in large quantities by more than two-thirds of non-livestock owning homesteads in each village. However, both of these outputs were associated with low economic values as manure represented between R300–R400 per owner, user household per annum, and chicken eggs R1100–R1400.
The primary reasons for livestock ownership were for slaughter and cash generation through trade. These activities were the highest contributors to the gross, direct-use and trade values across stock-owning households. For example, the mean value from goat trade amongst owner, user households in Gogogo was R9333 ± 6110 or R15,000 ± 6000 for cattle trade in Ludaka. The slaughter of livestock, for household consumption or as a ritual activity, was also high such as R3136 ± 1951 for sheep slaughter in Ludaka or R3500 ± 3000 goat slaughter in Gogogo.
However, other than the high proportion of sheep slaughter (100%) by owner households in Gogogo, less than half of stock-owning households in each village had engaged in the cash sale or slaughter of other livestock in the previous 12 months. This may be because owners valued the potential for sales or slaughter in the face of shock or to satisfy an immediate household need and it was this option value that was important, rather than the actual number of sales or slaughtering events. This logic was supported by households involved in livestock slaughter or sale who emphasised that each activity was carried out to meet a specific need. For example, in Ludaka one homestead sold 41 sheep to pay for a child’s university fees, while in Gogogo a household slaughtered five cattle to contribute to the funeral costs of a family member.
Household wellbeing, which was locally defined in each village through participatory processes, had a significant—albeit weak—positive relationship to the consumptive economic value of livestock in each village (Njela: r2 = 0.11, F = 4.2, p < 0.05; Gogogo: r2 = 0.21, F = 10.4, p < 0.001; Ludaka: r2 = 0.20, F = 8.0, p < 0.001).
3.2. Ecosystem Disservices
In many instances, the loss of livestock and poultry, as a result of EDS, had significant effects on the household as they were no longer able to harness the goods and services that livestock offer and were more vulnerable due to the loss of significant assets used to cope in the event of a shock or stress. For example, in some households children were no longer able to attend school because the sale of goats, which once facilitated the purchase of school uniforms, could no longer occur.
3.2.1. Frequency, Ability to Cope and Associated Economic Impact
Identified EDS occurred at different frequencies and were perceived to cause differing levels of damage, with some easier to cope with than others.
Livestock Related EDS
• Ticks
Ticks and associated tick-borne diseases were considered to be the most severe EDS. Three types of ticks were locally identified (a) Umkhanzi for pepper tick (Rhipicephalus sp.), (b) Qhizani for engorged pepper tick and (c) Qwelagibe for South African Bont tick (Amblyomma hebraeum). The clustering of the bont tick often resulted in open sores that would not heal and heavy infestations around the mammary gland meant livestock often stopped producing milk and consequently affected the health and mortality rates of calves. Bont ticks were also regarded as vectors of disease which diminished herd growth. Dominant tick-borne diseases such as gallsickness (anaplasmosis) (inyongo), redwater (babesiosis) (manzabomvu), as well as heartwater (ehrliosis) were identified and affected all ruminants. The greatest financial losses, as a result of tick-borne diseases, were amongst cattle, being related to their higher asset value per animal. Overall, more than half of cattle owning households in Njela and Ludaka experienced the effects of tick-borne diseases which averaged R27,000 ± 12,728 and R50,400 ± 47,598 per household per annum, in Njela and Ludaka, respectively (Table 6).
In each village, residents perceived there to be an increase in livestock deaths. This was associated with multiple factors such as: recent introductions of bont ticks into each village, pervasive neglect of livestock and dysfunctional state dipping systems. Residents highlighted the need for more consistent dipping systems that operated weekly and were run by state officials who would ensure consistent operation. Elderly residents added that dipping systems would only be effective if the strength of the dip increased to what it used to be during the previous government era.
• Unpalatable rangeland
Hardy, thick tufted, and relatively unpalatable grasses dominated the communal rangelands in each village and represented the primary source of forage for livestock. In Njela and Ludaka, residents perceived the rangelands to possess little nutrient value and palatability, particularly during the dry season, which directly affected the health of their livestock. In Gogogo, poor quality rangeland was not considered an EDS, probably due to access to the large size of rangelands in the village. A key species mentioned in each village was Aristida junciformis, locally referred to as isilevu in Gogogo and Ludaka and iqunde in Njela; it is especially tough and can cause livestock teeth to fall out. Residents highlighted that A. junciformis has spread over time, which they attributed to annual burning of the rangelands which occurred in the past but no longer. The rapid spread of the species was also perceived to replace thatch grass species such as Cymbopogan plurinodis (Umqungu) and Miscanthus capensis (Umtala). The youth in Ludaka believe that the dominance of A. junciformis will affect the future of livestock ownership in the village as only those who can afford to purchase lucerne feed will own healthy livestock. No economic figures were ascribed to the effect of unpalatable grassland.
• Invasive species
Invasive alien species in Njela and Gogogo were identified as an EDS. These included Lantana camara (Ubuqholo) in both villages and Solanum chrysostichum (Umtuma) and Plectranthus comosus (Uqombo) in Gogogo only. Each of these was perceived to be increasing in density and extent, invading rangelands and abandoned fields which reduced available grazing land and the potential of reactivation of old field fields for cultivation in the future. They were also perceived to invade within the village settlement closing footpaths, hindering the movement of people and harbouring snakes and criminals. Despite being the most desired fuelwood species in each village, similar concerns were raised in Njela and Gogogo about the rapid establishment of the expansive pioneer species Vachellia karroo in disturbed sites or old arable fields.
The perceived increase in the invasion of V. karroo was corroborated by the GIS analysis. Bush encroachment in Njela expanded 160%, from 146 ± 24 ha in 1974 to 234 ± 14 ha in 2013. A significant change occurred during the 1974–2013 (p < 0.05) and 1995–2013 (p < 0.05) time steps. In Gogogo bush encroachment increased 500%, from 43 ± 4 ha in 1974 to 215 ± 8 ha in 2015. A significant change occurred during the 1974–2013 (p < 0.001) and 1995–2013 (p < 0.001) time steps.
Poultry-Related EDS
Overall, birds of prey were the poultry-related EDS which occurred the most frequently but were also perceived to be the easiest to prevent and cope with financially. More than two-thirds of chicken owning households in each village identified birds of prey as an issue (Table 6). However, predation was most acute in Njela where chicken owning households lost an average of 163 ± 202 chicks annually which amounted to approximately R5727 ± 7093 per annum (Table 6). This was supported by a young female respondent who noted “last month I had 60 chicks, but this month I have 7. This is big problem as I was going to eat or sell these chicks when they became chickens. Now I am wasting my maize fattening these chicks for birds of prey”. Greater damage by birds of prey in Njela may be the result of greater habitat suitability as the village borders both dense indigenous forests and coastal cliffs.
Chicken disease was considered a dominant cause of premature death amongst adult birds and, in turn, reduced the number and the productivity of birds. More than half of chicken-owning households in each village reported having experienced diseased birds in the previous 12 months (Table 6). The close proximity of homesteads within the villages facilitated the rapid spread of disease. Losses to disease represented significant economic loss (R1115–R1500 per annum) and forced households to purchase poultry-related goods and services at local shops. The general feeling amongst poultry owners was the spread of disease was getting worse and some households had even given up rearing poultry as a result of the perceived increase in disease outbreaks. At the onset of disease, mature birds were slaughtered and frozen to prevent anticipated financial loss as, after death by disease, chickens were not even considered suitable for consumption by dogs.
3.2.2. Pre-Emptive and Coping Strategies
In response to the prevalence of livestock and poultry-related EDS, residents actively engaged in multiple pre-emptive or reactive strategies to minimise losses (Table 7). Some strategies have disappeared over time as they were proven ineffective, such as attaching papers or plastic bottles to wires which were hung between buildings to deter birds of prey. Others have developed as a response to changing local institutions such as the dearth of regular state dipping and resultant responsibility of households to purchase biomedical solutions, averaging approximately R1000 per livestock owning household per annum (Table 8). In low-income households, methods were inventive such as planting of long-leafed plants to allow chicks to safely forage out of sight from birds of prey or the collection of medicinal plants for acaricidal preparations used to treat both poultry or livestock disease. Cash-strapped residents also relied on a local institution, locally known as Inqoma, to replace stock lost to disease. This involved borrowing a breeding pair of animals from members of the community, and once the pair had reproduced, returning the breeding pair to the original owners and keeping the young. This practice did not only occur amongst households who lost animals to disease but also amongst financially constrained households as a means to build wealth.
3.2.3. Financial Cost of Selected EDS to Households
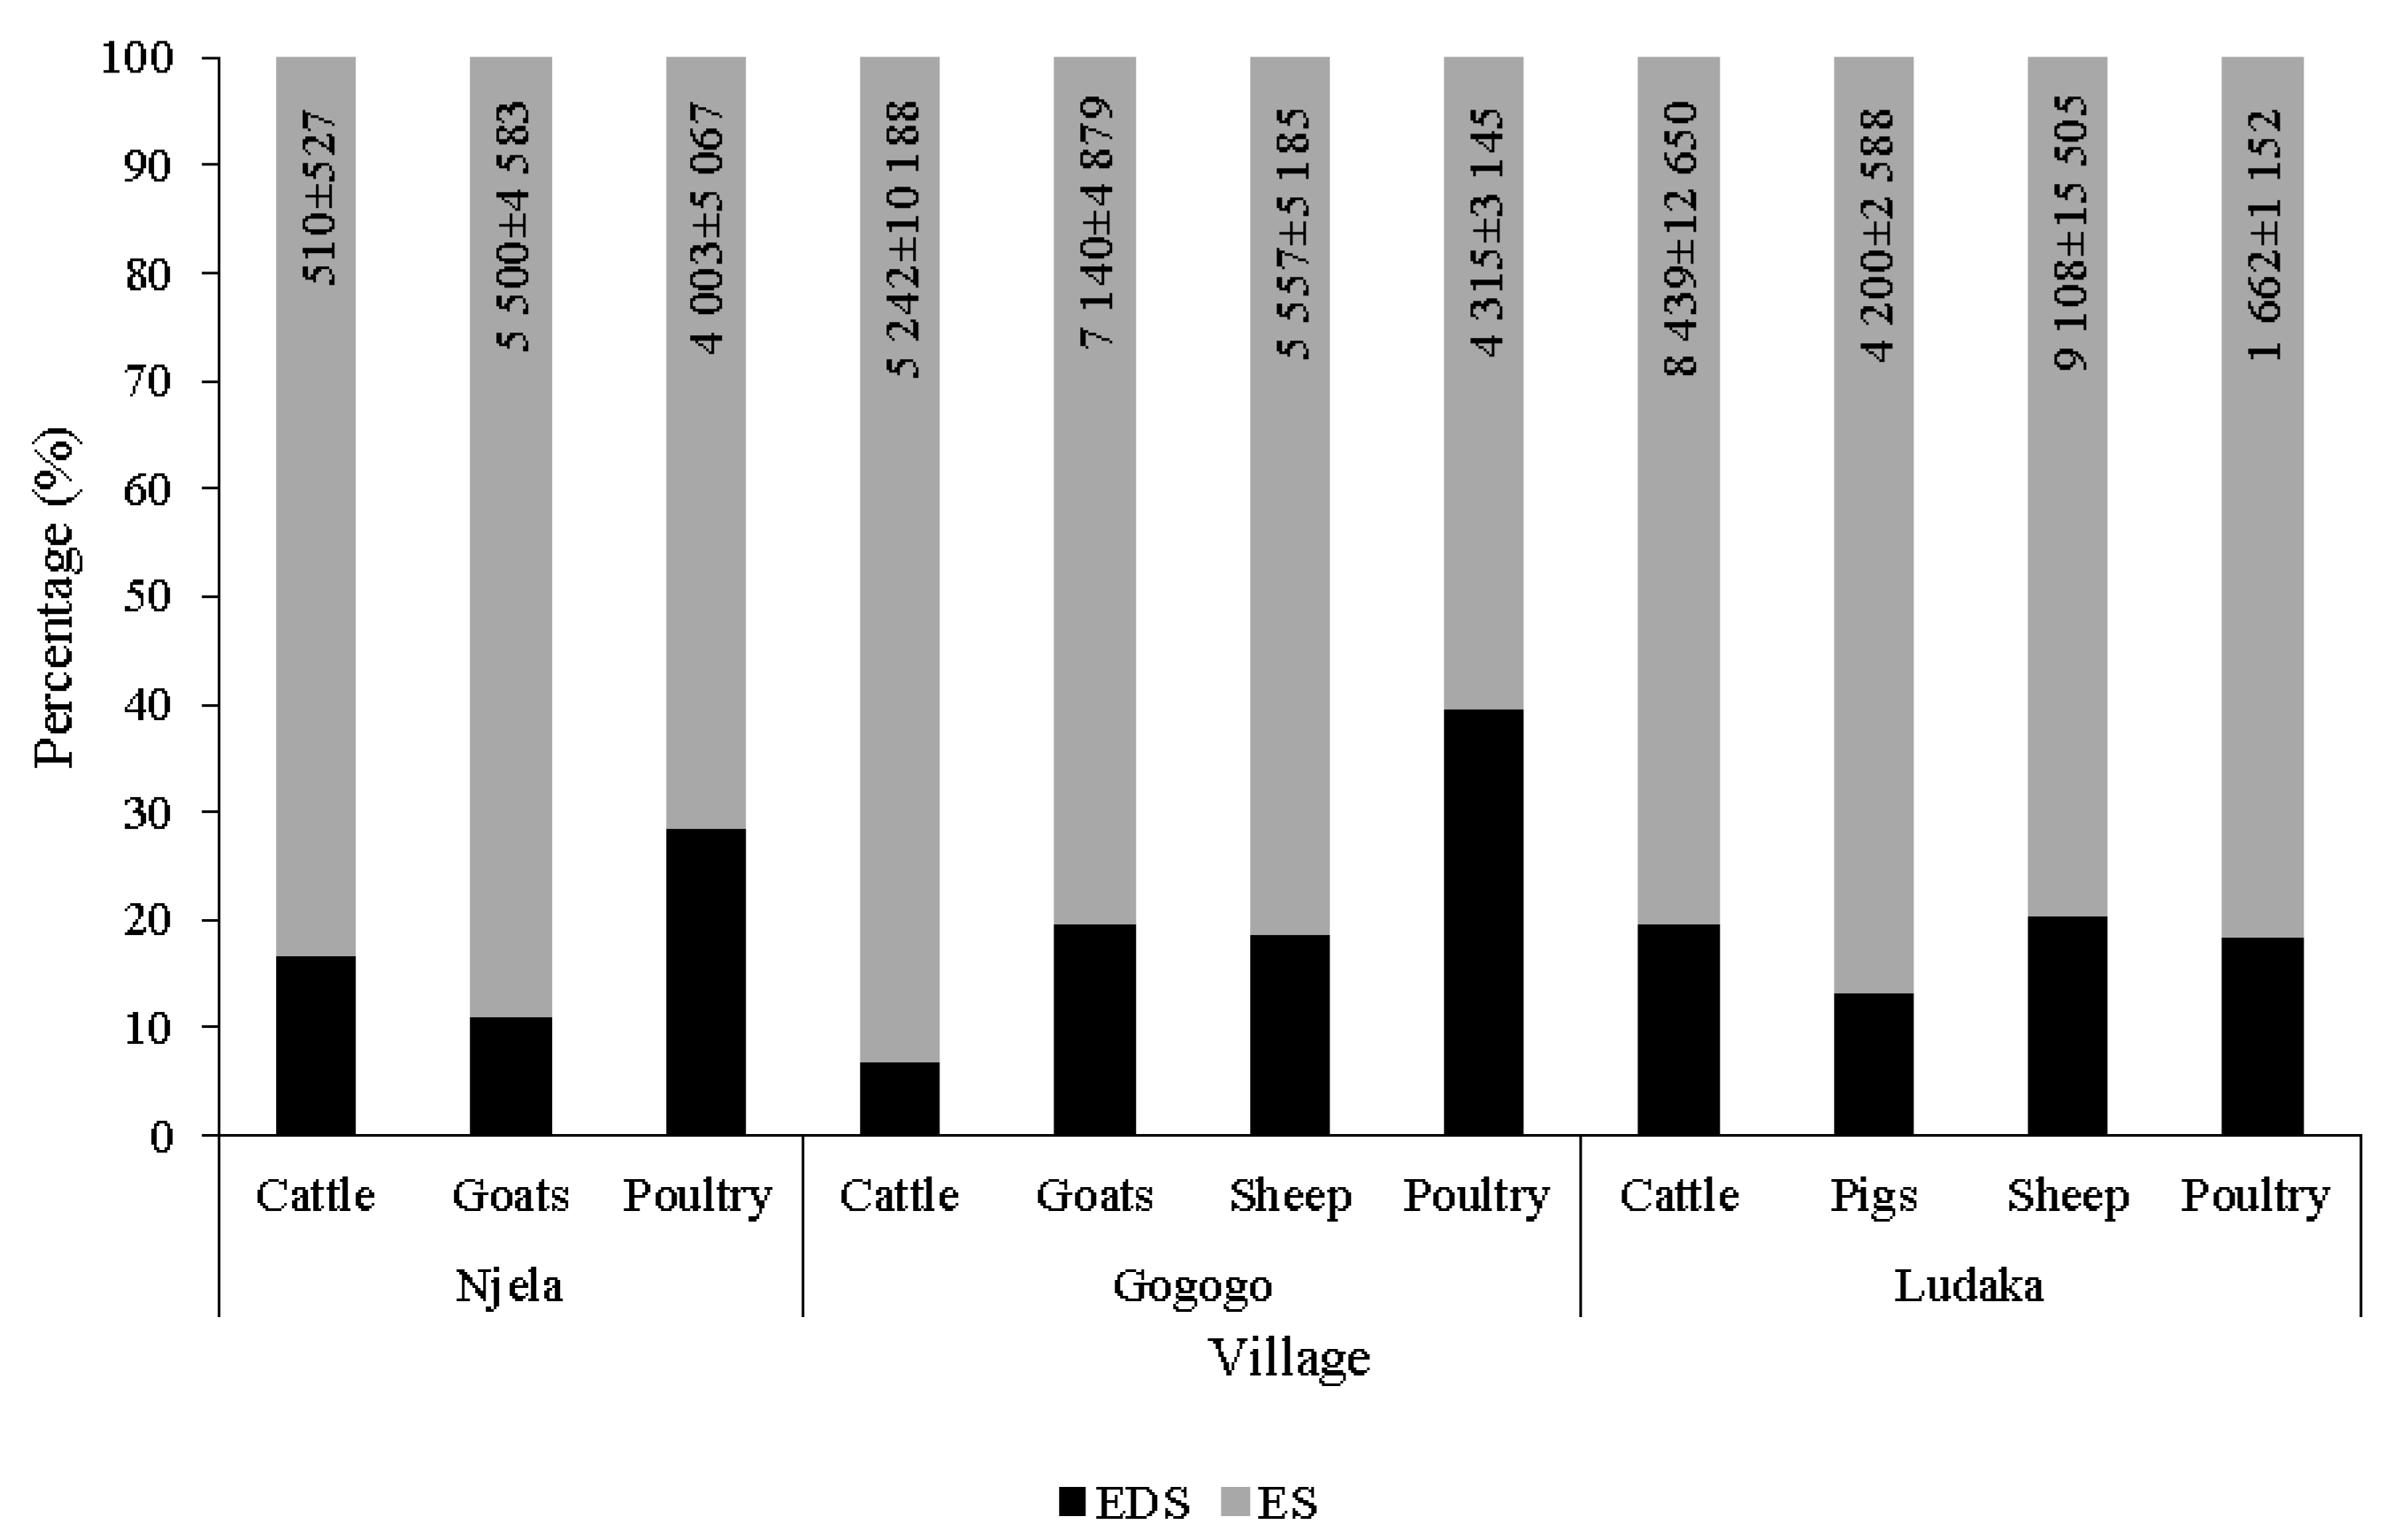
The potential consumptive services, i.e., the average economic value of services that would have accrued per household if not for EDS, were calculated as the sum of the direct-use and traded value per household and the potential consumptive services lost as a result of EDS. Figure 2 reflects ES and EDS as an average percentage of the potential economic value of consumptive services per livestock type and poultry in each village. The low average proportion of EDS across villages can be attributed to a high variation in EDS-related losses across owner households. For example, EDS-related losses ranged from no losses in some households to 96% in others.
The greatest proportional loss was amongst poultry which ranged from 19 ± 16% in Ludaka to 40 ± 32% in Gogogo. This was related to the regular death of a large number of chickens caused by chicken disease and meant that households were no longer able to trade or slaughter chickens and collect eggs. It represented the loss of consumptive outputs equating to R2013 ± 4207 in Njela, R2324 ± 2863 in Gogogo and R346 ± 454 in Ludaka. No other consistent trend was noted across villages, however significant economic losses occurred in goats in Gogogo R1140 ± 1838 (20 ± 24%) and sheep in Ludaka R1413 ± 2350 (21 ± 25%).
4. Discussion
This study considered the balance between ES and EDS associated with animal husbandry in three small rural villages. It supports the wealth of literature which emphasises the noteworthy contribution of livestock and poultry in rural livelihoods, but also details the limiting factors or EDS which undermine livestock productivity or raise the cost of production through necessitating the implementation of prevention measures. It notes the changes in human actions and wellbeing catalysed by EDS, and consequently, land use and management decisions.
Low-input, small-scale animal husbandry was actively pursued by more than half of the households in each village. Although the annual economic value of livestock-related goods and services varied between villages (lowest in Njela—R2605 ± 3311 and highest in Ludaka—R9753 ± 20,177 they were an important means of subsistence or financial buffering during unfavourable times. Previous studies have not reported the composite consumptive and trade value across all livestock types in a household, but a few studies offer figures for specific livestock types (such as cattle) and are comparable to this study (e.g., [2,28]). The majority of respondents kept a mixture of livestock species, a common feature in many communal production systems in southern Africa [12,13,29,30], as a means to maximise consumable products and services, increase income and savings and as means to spread risk [5]. Although small stock (sheep and goats) dominated both in terms of the proportion of households involved in ownership and according to herd size [2,31], cattle ownership was preferred because of their role as long-term investments or savings [1] and their link to cultural tradition which connect residents to their ancestors and symbolises a ‘proper’ African homestead [10,32].
The cultural values are also accessed to some degree by non-owning households, who attend cultural functions where livestock are slaughtered. Additionally, non-owning households benefited from the collection of dung from grazing lands or livestock kraals of owners, for use as a floor sealant or manure on their vegetable gardens. [2] also revealed a range of benefits to non-owning households including dung, free or cheap milk, some employment as herders, and free meat during ceremonies. The importance of livestock and poultry to household wellbeing in each village was also emphasised by the significant correlation between the consumptive and trade economic value of livestock and poultry and the local measures of human wellbeing. This is supported by [33] and [34] who recognise that livestock deliver critical micronutrients required to enhance the nutritional status of rural dwellers as a pre-condition for alleviating poverty. However, the economic value of livestock and poultry outputs represented a fraction of the potential yield due to EDS.
The economic value of goods and services rendered by each livestock type or poultry, represented between 60-93% of the potential economic value. Almost all of the identified EDS occurred in each village, although each occurred at different frequencies (across both households and villages) and were perceived to cause differing levels of damage, with some easier to cope with than others.
Ticks, primarily the South African Bont tick, were perceived to pose the greatest threat to animal husbandry, particularly amongst cattle. Ticks were perceived to increase mortality rates and undermine animal health through disease transmission [35], and impact reproduction as heavy tick-loads damaged urinary tracts, udders and teats which constrain milk production and limit the colostrum necessary for calf immunity [36]. The impact of ticks on smallholder animal husbandry has been widely reported across southern Africa [37,38] and other parts of South Africa [13,31,36,39], with the Eastern Cape in particular where it is the most common cause of death in livestock after malnutrition [40]. The high temperature and humidity prevalent in the Eastern Cape are favourable for the growth of ticks, especially during the wet season [41,42]. The effects of the tick-borne diseases were of economic significance. This was not reflected in the potential economic value of goods and services lost, but rather in the value of loss of the beast. For example, cattle owners in Gogogo and Ludaka lost between four and five cattle between 2015 and 2016, respectively, totaling approximately R50,000—the value of approximately half of the current cattle herd size in each household and as a result undermined the important savings function that cattle provide. Similar levels of loss catalysed by EDS were observed amongst poultry, with more than two-thirds of poultry-owning households affected by birds of prey amounting to as much R5727 ± 7093 per household, per annum. This is supported by [43] who note the ubiquity of birds of prey affecting poultry in southern Brazilian Amazonia.
The recognition of EDS in the ecosystem services framework extends beyond economic figures to paint a fuller picture of the functioning of rural livelihoods. For example, the poor quality rangelands in Njela and Ludaka, which have commonly been identified as a primary constraint to livestock production in other parts of the Eastern Cape (e.g., [12,44]), were perceived to be the consequence of pervasive rangeland burning by livestock owners in the past. This institution, also noted by [45] in an area close to this study, was implemented to maintain young and palatable swards and to remove ticks. In this sense, burning was a tick management tool and a means to promote nutritious grass shoots but was also perceived to promote the spread of an unwanted grassland species, which according to the youth in Ludaka, will be a primary reason for the lack of cattle ownership in the future. In this way, the inclusion of EDS into the ecosystem and livelihoods analysis provided deeper insight into the direct causalities and complexities associated with ecosystem management which could not be attained through one-sided analysis [21].
An inclusive view also highlights how resources are allocated, as in almost all cases, large amounts of time or money were allocated to activities to prevent or cope with the loss of livestock or poultry. This involved multiple strategies, which mainly targeted specific EDS, such as the treatment of chicken disease through ethno-veterinary controls such as Aloe sp. [46] or biomedical products for tick control [36,47,48]. Other coping mechanisms include local institutions, such as the livestock sharing institution inqoma, which provided a platform to maintain or even grow livestock numbers in the face of EDS-induced losses.
Yet, in other cases, the effects of livestock-related EDS were linked to or exacerbated by the breakdown or change in institutional arrangements at varying scales—for example, the disintegration of the state dipping system which was initiated in the early 20th century after the spread of East Coast fever and saw the construction of many dip tanks and the implementation of a large-scale compulsory dipping system. However, since the change in government in 1994, provincial governments have been responsible for overseeing veterinary services, who, faced with budgetary constraints, deprioritised tick control and devolved the husbandry of livestock and disease management to owners [47,48,49]. Other institutional changes include the breakdown of cattle committees responsible for burning the grass to control ticks, and households no longer retrieving livestock at night, which makes it difficult for smallholder livestock owners to appraise their cattle more frequently. Further, a change in cultivation patterns and an increase in field abandonment has given rise to the rapid spread of woody plant species, limiting the areas that livestock are able to graze. In this sense, incorporating EDS into an ecosystem services framework provides insight into the complex feedbacks between ES and EDS which interact to shape local ways of doing things.
Although ecosystem functions and attributes are derived from ecological processes, whether they are perceived as ES or EDS is a matter of subjectivity and is dependent on the group or individual and space and time [20]. Vachellia karroo, for example, was considered an EDS by livestock owners in Njela and Gogogo as it rapidly established on fields and rangelands, reducing grazing potential and ensnaring livestock. The increasing encroachment of woody plants into grasslands has been mirrored across South Africa, showing a 20% increase in the extent of woodland over a 23-year period [50], with several studies showing this in the Eastern Cape [51,52]. However, V. karroo is also considered an ES because it is a preferred fuelwood species [23]. This illustrates the potential dual character of the same ecosystem function and the possibility for it to be perceived as an ES or an EDS depending on the context and individual [20,53,54]. In this way, the management of ES should be cognisant of the interchangeability of ecosystem outputs between ES and EDS in the local context, and in cases where the management action is to reduce the EDS, it may simultaneously reduce an ES [20].
5. Conclusions
Low-input, small-scale livestock husbandry and poultry ownership was a common feature across the study sites, actively pursued by the majority of households in each village as a means of subsistence or financial buffering during unfavourable times. The annual value of livestock and poultry goods and services per owner household was substantial, at approximately R2257 in Njela, R4866 in Gogogo, and R9457 in Ludaka. Although the role and value of livestock in rural livelihoods have been widely cited, there is notably little recognition and valuation of livestock-related EDS in parallel to their value. The results highlight that each livestock type was affected by at least one EDS, undermining herd growth and limiting the production of goods and services. These EDS represent losses of between 7% and 40% of the potential economic value of consumptive outputs of livestock. Significant amounts of time and money were invested in preventing EDS-induced losses and in some instances, the effect of EDS on ES was aided or supported by institutions. This study provides an integrated appraisal as it details the factors which limit livestock production, and the economic value of the resulting incurred losses, alongside estimations of the goods and services that livestock generate.
Author Contributions
Conceptualization, S.C.H.-H. and C.M.S.; methodology, S.C.H.-H.; formal analysis, S.C.H.-H.; investigation, S.C.H.-H.; data curation, S.C.H.-H.; writing—original draft preparation, S.C.H.-H.; writing—review and editing, S.C.H.-H.; supervision, C.M.S.; funding acquisition, C.M.S. All authors have read and agreed to the published version of the manuscript.
Funding
This work was funded by the South African Research Chairs Initiative of the Department of Science and Technology and the National Research Foundation of South Africa (grant no. 84379). Any opinion, finding, conclusion or recommendation expressed in this material is that of the authors and the NRF does not accept any liability in this regard.
Acknowledgments
We sincerely thank the residents of the three study villages for their sharing their hospitality time and knowledge with us.
Conflicts of Interest
The authors declare no conflict of interest. The funders had no role in the design of the study; in the collection, analyses, or interpretation of data; in the writing of the manuscript, or in the decision to publish the results.
References
- Dovie, D.; Shackleton, C.; Witkowski, E. Valuation of communal area livestock benefits, rural livelihoods and related policy issues. Land Use Policy 2006, 26, 260–271. [Google Scholar] [CrossRef]
- Shackleton, C.; Shackleton, S.; Netshiluvhi, T.; Mathabela, F. The contribution and direct-use value of livestock to rural households in the Sand River catchment, South Africa. Afr. J. Range Forage Sci. 2005, 22, 127–140. [Google Scholar] [CrossRef]
- Priyanti, A.; Cramb, R.; Hanifah, V.; Mahendri, I. Small-scale cattle raising in East Java: A pathway out of poverty? Asia Pac. Viewp. 2015, 56, 335–350. [Google Scholar] [CrossRef]
- Hauck, M.; Artykbaeva, G.; Zozulua, T.; Dulamsuren, C. Pastoral livestock husbandry and rural livelihoods in the forest-steppe of east Kazakhstan. J. Arid Environ. 2016, 133, 102–111. [Google Scholar] [CrossRef]
- Vetter, S. Development and sustainable management of rangeland commons: Aligning policy with the realities of South Africa’s rural landscape. Afr. J. Range Forage Sci. 2013, 30, 1–9. [Google Scholar] [CrossRef]
- Altaye, S.; Kassa, B.; Agza, B.; Alemu, F.; Muleta, G. Smallholder cattle production systems in Metekel zone, northwest Ethiopia. Res. J. Agric. Environ. Manag. 2014, 3, 151–157. [Google Scholar]
- Chatikobo, P.; Choga, T.; Ncube, C.; Mutambara, J. Participatory diagnosis and prioritization of constraints to cattle production in some smallholder farming areas of Zimbabwe. Prev. Vet. Med. 2013, 109, 327–333. [Google Scholar] [CrossRef]
- Mburu, S.; Zaibet, L.; Fall, A.; Ndiwa, N. The role of working animals in the livelihoods of rural communities in West Africa. Livest. Res. Rural Dev. 2012, 24, 1–10. [Google Scholar]
- Hanke, H.; Barkmann, J. Insurance function of livestock, farmers coping capacity with crop failure in south western Madagascar. World Dev. 2017, 96, 264–275. [Google Scholar] [CrossRef]
- Ncube, A.; Mangwaya, P.; Ogundeji, A. Assessing vulnerability and coping capacities of rural women to drought: A case study of Zvishavane district, Zimbabwe. Int. J. Disaster Risk Manag. 2018, 28, 69–79. [Google Scholar] [CrossRef]
- Mtembu, N. Exploring Characteristics of Farming Systems in Former Labour Tenant Communities: The Case of Ncunjane and Nkaseni in Msinga. Master’s Thesis, University of the Western Cape, Cape Town, South Africa, 2013. [Google Scholar]
- Beyene, S.; Mlisa, L.; Gxasheka, M. Local perceptions of livestock husbandry and rangeland degradation in the highlands of South Africa: Implications for development interventions. J. Hum. Ecol. 2014, 47, 257–268. [Google Scholar] [CrossRef]
- Nqeno, N.; Chimonyo, M.; Mapiye, C. Farmers’ perceptions of the causes of low reproductive performance in cows kept uner low-input communal production systems in South Africa. Trop. Anim. Health Prod. 2011, 43, 315–321. [Google Scholar] [CrossRef] [PubMed]
- Okello, W.O.; Muhanguzi, D.; MacLeod, E.T.; Welburn, S.C.; Waiswa, C.; Shaw, A.P. Contribution of draft cattle to rural livelihoods in a district of southeastern Uganda endemic for bovine parasitic diseases: An economic evaluation. Parasites Vectors 2015, 8, 571. [Google Scholar] [CrossRef] [PubMed] [Green Version]
- Adehan, S.; Adakal, H.; Gbinwoua, D.; Yokossi, D.; Zoungrana, S.; Toe, P.; Ouedraogo, M.; Gbaguidi, M.; Adoligbe, C.; Fandohan, B.; et al. West African cattle farmers’ perception of tick-borne disease. Ecohealth Alliance 2018, 15, 437–449. [Google Scholar] [CrossRef] [PubMed]
- Adesehinwa, A.; Okunola, J.; Adewumi, M. Socio-economic characteristics of ruminant livestock farmers and their production constraints in some parts of south-western Nigeria. Livest. Res. Rural Dev. 2004, 16, 838–842. [Google Scholar]
- Saunders, M.; Luck, G. Limitations of the ecosystem service versus disservices dichotomy. Conserv. Biol. 2016, 60, 1363–1365. [Google Scholar] [CrossRef]
- O’Farrell, P.; Donaldson, J.; Hoffman, M. The influence of ecosystem goods and services on livestock management practices on the Bokkeveld plateau, South Africa. Agric. Ecosyst. Environ. 2007, 122, 312–324. [Google Scholar] [CrossRef]
- Friess, D. Ecosystem services and disservices of mangrove forests: Insights from historical colonial observations. Forests 2016, 7, 183. [Google Scholar] [CrossRef] [Green Version]
- Shackleton, C.; Ruwanza, S.; Sinasson Sani, G.; Bennett, S.; De Lacy, P.; Modipa, R.; Mtati, N.; Sachikonye, M.; Thondhlana, G. Unpacking pandora’s box: Understanding and categorizing ecosystem disservices for environmental management and human wellbeing. Ecosystems 2016, 19, 587–600. [Google Scholar] [CrossRef]
- Blanco, J.; Sourdril, A.; Deconchat, M.; Ladet, S.; Andrieu, E. Social drivers of rural forest dynamics: A multi-scale approach combining ethnography, geomatic and mental model analysis. Landsc. Urban Plan. 2018, 188, 132–142. [Google Scholar] [CrossRef] [Green Version]
- Statistics South Africa. Njela/Gogogo/Ludaka. Available online: www.statssa.gov.za/?page_id=4286&id=4467 (accessed on 6 July 2016).
- Herd-Hoare, S. The Relative Roles of Ecosystem Services and Disservices in Rural Livelihoods in the Eastern Cape, South Africa. Master’s Thesis, Rhodes University, Grahamstown, South Africa, 2018. [Google Scholar]
- Mucina, L.; Scott-Shaw, R.; Rutherford, M.; Camp, K.; Matthews, W.; Powrie, L.; Hoare, D. Indian Ocean Coastal Belt. In The Vegetation of South Africa, Lesotho and Swaziland; Macina, L., Rutherford, M., Eds.; South African Biodiversity Institute: Pretoria, South Africa, 2006; pp. 568–583. [Google Scholar]
- Rutherford, M.; Mucina, L.; Powrie, L. Biomes and Bioregions of Southern Africa. In The Vegetation of South Africa, Lesotho and Swaziland; Macina, L., Rutherford, M., Eds.; South African National Biodiversity Institute: Pretoria, South Africa, 2006; pp. 31–50. [Google Scholar]
- United Nations. Principles and Recommendations for Population and Housing Censuses, Revision 2; United Nations: New York, NY, USA, 2008. [Google Scholar]
- R Core Team. R: A Language and Environment for Statistical Computing; R Foundation for Statistical Computing: Vienna, Austria, 2013. [Google Scholar]
- Chaminuka, P.; Udo, H.; Eilers, K.; van der Zijpp, A. Livelihood roles of cattle and prospects for alternative land uses at the wildlife/livestock interface in South Africa. Land Use Policy 2014, 38, 80–90. [Google Scholar] [CrossRef]
- Gwelo, A. Farmers’ perceptions of Nguni Cattle Feeding Behaviour and Behaviour and Vegetation Nutrient Dynamics in Two Communal Rangeland, Eastern Cape. Master’s Thesis, University of Fort Hare, Fort Hare, South Africa, 2012. [Google Scholar]
- Tavirimirwa, B.; Mwembe, R.; Ngulube, B.; Banana, N.; Nyamushamba, G.; Ncube, S.; Nkomboni, D. Communal cattle production in Zimbabwe: A review. Livest. Res. Rural Dev. 2013, 25, 1–10. [Google Scholar]
- Mapiliyao, L.; Pepe, D.; Chiruka, R.; Marume, U.; Muchenje, V. Production practices and constraints to sheep productivity in two ecologically different and resource-poor communal farming systems in South Africa. Sci. Res. Essays 2012, 7, 3209–3217. [Google Scholar] [CrossRef]
- Ainslie, A. The sociocultural contexts and meanings associated with livestock keeping in rural South Africa. Afr. J. Range Forage Sci. 2013, 30, 35–38. [Google Scholar] [CrossRef]
- Randolph, T.; Schelling, E.; Grace, D.; Nicholson, C.; Leroy, J.; Cole, D.; Demment, M.; Omore, A.; Zinsstag, J.; Ruel, M. Invited Review: Role of livestock in human nutrition and health for poverty reduction in developing countries. J. Anim. Sci. 2007, 85, 2788–2800. [Google Scholar] [CrossRef] [Green Version]
- Smith, J.; Sones, K.; Grace, D.; McMillan, S.; Tarawali, S.; Herrero, M. Beyond milk, meat and eggs: Role of livestock in food and nutrition security. Anim. Front. 2013, 3, 6–13. [Google Scholar] [CrossRef] [Green Version]
- Minjauw, B.; McLeod, A. Tick-Borne Diseases and Poverty: The Impact of Ticks and Tick-Borne Diseases on Livelihoods of Small-Scale and Marginal Livestock Owners in India and Eastern and Southern Africa Edinburgh; DFID Animal Health Programme, Centre for Tropical Veterinary Medicine: Edinburgh, UK, 2003. [Google Scholar]
- Moyo, B.; Masika, P. Tick control methods used by resource-limited farmers and the effect of ticks on cattle in rural areas of the Eastern Cape province, South Africa. Trop. Anim. Health Prod. 2009, 41, 517–523. [Google Scholar] [CrossRef]
- Sungirai, M.; Moyo, D.; De Clercq, P.; Madder, M. Communal farmers’ perceptions of tick-borne diseases affecting cattle and investigation of tick control methods practiced in Zimbabwe. Ticks Tick-Borne Dis. 2016, 7, 1–9. [Google Scholar]
- Wesonga, F.; Kitala, P.; Gathuma, J.; Njenga, M.; Ngumi, P. An assessment of tick-borne diseases constraints to livestock production in a smallholder livestock production system in Machakos District, Kenya. Livest. Res. Rural Dev. 2010, 22, 1–17. [Google Scholar]
- Mapiye, C.; Chimonyo, M.; Dzama, K. Seasonal dynamics, production potential and efficiency of cattle in the sweet and sour communal rangelands in South Africa. J. Arid Environ. 2009, 73, 529–536. [Google Scholar] [CrossRef]
- Masika, P.; Sonandi, A.; van Averbeke, W. Perceived causes, diagnosis and treatment of babeiosis and anaplasmosis in cattle by livestock farmers in communal areas of the central Eastern Cape Province, South Africa. J. S. Afr. Vet. Assoc. 1997, 68, 40–44. [Google Scholar]
- Marufu, M.; Chimonyo, M.; Dzama, K.; Mapiye, C. Seroprevalence of tick-borne diseases in communal cattle reared on sweet and sour rangelands in semi-arid area of South Africa. Vet. J. 2010, 184, 71–76. [Google Scholar] [CrossRef] [PubMed]
- Muchenje, V.; Dzama, K.; Chimonyo, M.; Strydom, P.; Raats, J. Tick susceptibility and its effects on growth performance and carcass characteristics of Nguni, Bonsmara and Angus steers raised on natural pasture. Animal 2008, 2, 298–304. [Google Scholar] [CrossRef] [PubMed] [Green Version]
- Trinca, C.; Ferrari, S.; Lees, A. Curiosity killed the bird: Arbitrary hunting of Harpy Eagles Harpia harpyja on an agricultural frontier in southern Brazilian Amazonia. Contiga 2008, 30, 5–12. [Google Scholar]
- Sigwela, A.; Elbakidze, M.; Powell, M.; Angelstam, P. Defining core areas of ecological infrastructure to secure rural livelihoods in South Africa. Ecosyst. Serv. 2017, 27, 272–280. [Google Scholar] [CrossRef]
- Kepe, T. Grassland ablaze: Vegetation burning by rural people in Pondoland, South Africa. S. Afr. Geogr. J. 2005, 87, 10–17. [Google Scholar] [CrossRef]
- Mwale, M.; Masika, P. Ethno-veterinary control of parasites, management and role of village chickens in rural households of Centane district in the Eastern Cape, South Africa. Trop. Anim. Health Prod. 2009, 41, 1685–1693. [Google Scholar] [CrossRef]
- Brown, K.; Ainslie, A.; Beinart, W. Animal disease and the limits of local knowledge: Dealing with ticks and tick-borne diseases in South Africa. J. R. Anthropol. Inst. 2013, 19, 319–337. [Google Scholar] [CrossRef]
- Hlatshwayo, M.; Mbati, P. A survey of tick control methods used by resource-poor farmers in the Qwa-Qwa area of the eastern Free State province, South Africa. Onderstepoort J. Vet. Res. 2005, 72, 245–249. [Google Scholar] [CrossRef]
- Hesterberg, U.; Bagnall, R.; Perret, K.; Horner, R.; Gummow, B. A questionaire survey of perceptions and preventive measures related to animal health amongst cattle owners of rural communities in KwaZulu-Natal, South Africa. J. S. Afr. Vet. Assoc. 2007, 78, 205–208. [Google Scholar] [CrossRef] [Green Version]
- Skowno, A.; Thompson, M.; Hiestermann, J.; Ripley, B.; West, A.; Bond, W. Woodland expansion in South African grassy biomes based on satellite observations (1990-2013): General patterns and potential drivers. Glob. Chang. Biol. 2017, 23, 2358–2369. [Google Scholar] [CrossRef]
- Blair, D.; Shackleton, C.; Mograbi, P. Cropland abandonment in South African smallholder communal lands: Land cover change (1950–2010) and farmer perceptions of contributing factors. Land 2018, 7, 121. [Google Scholar] [CrossRef] [Green Version]
- Chalmers, N.; Fabricius, C. Expert and generalist local knowledge about land-cover change on South Africa’s Wild Coast: Can local ecological knowledge add value to science? Ecol. Soc. 2007, 12, 1–15. [Google Scholar] [CrossRef] [Green Version]
- Lele, S.; Springate-Baginski, O.; Lakerveld, R.; Deb, D.; Dash, P. Ecosystem services: Origins, contributions, pitfalls, and alternatives. Conserv. Soc. 2013, 11, 343–358. [Google Scholar] [CrossRef] [Green Version]
- Vang Rasmussen, L.; Christensen, A.; Danielsen, F.; Dawson, N.; Martin, A.; Mertz, O.; Sikor, T.; Thongmanivong, S.; Xaydongvanh, P. From food to pest: Conversion factors determine switches between ecosystem services and disservices. Ambio 2017, 46, 173–183. [Google Scholar] [CrossRef] [PubMed] [Green Version]
Figure 1.
Location of Njela, Gogogo and Ludaka.

Figure 2.
Ecosystem services (ES) and EDS reflected as a percentage of the average potential household value of livestock consumptive outputs amongst owner households, economic values at the top of the graph represent total potential values if not for disservices.
Figure 2.
Ecosystem services (ES) and EDS reflected as a percentage of the average potential household value of livestock consumptive outputs amongst owner households, economic values at the top of the graph represent total potential values if not for disservices.


Table 1.
Livestock and poultry ownership in each village.
| Category | Cattle | Poultry | Goats | Pigs | Sheep |
|---|---|---|---|---|---|
| Njela | |||||
| All HH (%) | 11 | 80 | 26 | - | - |
| LS 1 owning HH (%) | 40 | NA 2 | 90 | - | - |
| Mean no. per owning HH | 4 ± 2 | 7 ± 6 | 5 ± 3 | - | - |
| Range | 2–7 | 2–30 | 2–12 | - | - |
| Gogogo | |||||
| All HH (%) | 28 | 74 | 33 | 10 | 8 |
| LS owning HH (%) | 52 | NA 2 | 62 | 19 | 14 |
| Mean no. per owning HH | 6 ± 6 | 9 ± 7 | 15 ± 20 | 1 ± 0 | 12 ± 12 |
| Range | 2–12 | 1–30 | 1–70 | 1–1 | 5–26 |
| Ludaka | |||||
| All HH (%) | 48 | 75 | 8 | 25 | 55 |
| LS owning HH (%) | 68 | NA 2 | 11 | 36 | 79 |
| Mean no. per owning HH | 6 ± 5 | 9 ± 8 | 7 ± 2 | 4 ± 3 | 16 ± 12 |
| Range | 1–15 | 1–30 | 5–8 | 1–8 | 5–58 |
1 LS = livestock owning. 2 Poultry and livestock are considered in different categories and therefore do not fall within “livestock owning households”.
Table 2.
Change in the average number of animals per household between 2015 and 2016 1.
| Cattle | Poultry | Goats | Pigs | Sheep | |
|---|---|---|---|---|---|
| Njela | |||||
| Av. no. 2015 | 6 ± 1 | 16 ± 11 | 7 ± 7 | - | - |
| Av. no. 2016 | 4 ± 2 | 7 ± 6 | 6 ± 3 | - | - |
| Av. change | −2 ± 4 | −6 ± 11 | −3 ± 4 | - | - |
| % change 2 | −35 ± 25 | −39 ± 59 | −31 ± 32 3 | - | - |
| Gogogo | |||||
| Av. no. 2015 | 6 ± 6 | 8 ± 6 | 20 ± 23 | 0 ± 0 | 20 ± 21 |
| Av. no. 2016 | 6 ± 6 | 6 ± 6 | 15 ± 20 | 1 ± 0 | 12 ± 12 |
| Av. change | 0.2 ± 3 | −0.5 ± 4 | −4 ± 6 | 1 ± 0 | −8 ± 10 |
| % change 2 | +3 ± 34 | −72 ± 24 | −13 ± 46 | +100 ± 0 | −35 ± 9 |
| Ludaka | |||||
| Av. no. 2015 | 8 ± 5 | 20 ± 11 | 11 ± 1 | 3 ± 4 | 23 ± 20 |
| Av. no. 2016 | 6 ± 4 | 9 ± 8 | 7 ± 2 | 4 ± 3 | 16 ± 12 |
| Av. change | −2 ± 4 | −10 ± 13 | −4 ± 1 | 1 ± 3 | −6 ± 13 |
| % change 2 | −21 ± 46 | −33 ± 92 | −38 ± 11 | 73 ± 129 | −13 ± 50 |
| Av. % change | −16 ± 42 | −48 ± 66 | −12 ± 60 | +81 ± 10 | −16 ± 47 |
1 These calculations of averages only include households that had holdings in both 2016 and the previous year. 2 The average percentage change reflected in the table will not equate to additions of average number of livestock in each year because it is derived from the empirical data per household. 3 An outlier of 200% herd growth in a goat owning household in Njela was excluded from this figure.
Table 3.
Gross direct-use and traded values of livestock and poultry benefits to households in Njela 1,2.
Table 3.
Gross direct-use and traded values of livestock and poultry benefits to households in Njela 1,2.
| Benefit Status | Goods and Services | Proportion (%) of | Average Value (R/year) per | |||
|---|---|---|---|---|---|---|
| All HH | Owner HH | Owner User HH | Owner HH | |||
| Cattle | Direct-use value | Milk | 0 | 0 | 0 | 0 |
| Manure (fertiliser + sealant) | 71 | 75 | 324 ± 213 | 244 ± 238 | ||
| Plough | 0 | 0 | 0 | 0 | ||
| Trade value | Cash sales | 0 | 0 | 0 | 0 | |
| Other | Slaughter (ritual + consumption) | 0 | 0 | 0 | 0 | |
| Total (R/year) | (a) owner user HH: 324 ± 213; (b) owner HH: 244 ± 238; (c) all HH: 28 ± 106 | |||||
| Chickens | Direct-use value | Eggs | 74 | 93 | 1362 ± 1564 | 1073 ± 1494 |
| Trade value | Cash sales | 3 | 4 | 413 (n = 1) | 15 ± 78 | |
| Other | Slaughter (ritual + HH consumption) | 51 | 64 | 884 ± 797 | 568 ± 766 | |
| Total (R/year) | (a) owner user HH: 1990 ± 1886; (b) owner HH: 1848 ± 1888; (c) all HH: 1478 ± 1842 | |||||
| Goats | Trade value | Cash sales | 3 | 11 | 9000 (n = 1) | 1000 ± 3000 |
| Other | Slaughter (ritual + HH consumption) | 9 | 33 | 2000 ± 866 | 667 ± 1090 | |
| Total (R/year) | (a) owner user HH: 5000 ± 4822; (b) owner HH: 1666 ± 3473; (c) all HH: 429 ± 1840 | |||||
| Pigs | Trade value | Cash sales | 0 | 0 | 0 | 0 |
| Other | Slaughter (ritual + HH consumption) | 0 | 0 | 0 | 0 | |
| Total (R/year) | (a) owner user HH: 0; (b) owner HH: 0; (c) all HH: 0 | |||||
| Sheep | Trade value | Cash sales | 0 | 0 | 0 | 0 |
| Other | Slaughter (ritual + HH consumption) | 0 | 0 | 0 | 0 | |
| Total (R/year) | (a) owner user HH: 0; (b) owner HH: 0; (c) all HH: 0 | |||||
| Av. Gross Total (R/year): (a) owner user HH: 2605 ± 3311; (b) owner HH: 2257 ± 3203; (c) all HH: 1935 ± 3065 | ||||||
Table 4.
Gross direct-use and traded values of livestock and poultry benefits to households in Gogogo.
Table 4.
Gross direct-use and traded values of livestock and poultry benefits to households in Gogogo.
| Benefit Status | Goods and Services | Proportion (%) of | Average Value (R/year) per | |||
|---|---|---|---|---|---|---|
| All HH | Owner HH | Owner User HH | Owner HH | |||
| Cattle | Direct-use value | Milk | 3 | 9 | 1792 (n = 1) | 162 ± 540 |
| Manure (fertiliser + sealant) | 78 | 82 | 462 ± 229 | 378 ± 261 | ||
| Plough | 13 | 45 | 440 ± 313 | 275 ± 303 | ||
| Trade value | Cash sales | 0 | 0 | 0 | 0 | |
| Other | Slaughter (ritual + consumption) | 5 | 18 | 20,000 ± 14,142 | 3636 ± 9244 | |
| Total (R/year) | (a) owner user HH: 5352 ± 10,797; (b) owner HH: 4379 ± 9897; (c) all HH: 1204 ± 5389 | |||||
| Chickens | Direct-use value | Eggs | 60 | 92 | 1497 ± 1568 | 1239 ± 1534 |
| Trade value | Cash sales | 3 | 4 | 640 (n = 1) | 25 ± 126 | |
| Other | Slaughter (ritual + HH consumption) | 48 | 73 | 1044 ± 676 | 709 ± 743 | |
| Total (R/year) | (a) owner user HH: 2169 ± 1750; (b) owner HH: 2016 ± 1777; (c) all HH: 1410 ± 1750 | |||||
| Goats | Trade value | Cash sales | 8 | 21 | 9333 ± 6110 | 2000 ± 4641 |
| Other | Slaughter (ritual + HH consumption) | 10 | 29 | 3500 ± 3000 | 1000 ± 2184 | |
| Total (R/year) | (a) owner user HH: 6000 ± 5164; (b) owner HH: 3000 ± 4690; (c) all HH: 1050 ± 3071 | |||||
| Pigs | Trade value | Cash sales | 0 | 0 | 0 | 0 |
| Other | Slaughter (ritual + HH consumption) | 0 | 0 | 0 | 0 | |
| Total (R/year) | (a) owner user HH: 0; (b) owner HH: 0; (c) all HH: 0 | |||||
| Sheep | Trade value | Cash sales | 3 | 33 | 12,000 (n = 1) | 4000 ± 6928 |
| Other | Slaughter (ritual + HH consumption) | 8 | 100 | 4667 ± 4618 | 4667 ± 4618 | |
| Total (R/year) | (a) owner user HH: 4667 ± 4616; (b) owner HH: 4667 ± 4616; (c) all HH: 350 ± 1626 | |||||
| Av. Gross Total (R/year): (a) owner user HH: 5353 ± 8228; (b) owner HH: 4866 ± 7987; (c) all HH: 4014 ± 7473 | ||||||
Table 5.
Gross direct-use and traded values of livestock and poultry benefits to households in Ludaka.
Table 5.
Gross direct-use and traded values of livestock and poultry benefits to households in Ludaka.
| Benefit Status | Goods and Services | Proportion (%) of | Average Value (R/year) per | |||
|---|---|---|---|---|---|---|
| All HH | Owner HH | Owner User HH | Owner HH | |||
| Cattle | Direct-use value | Milk | 3 | 5 | 1792 (n = 1) | 94 ± 411 |
| Manure (fertiliser + sealant) | 93 | 100 | 472 ± 291 | 447 ± 303 | ||
| Plough | 15 | 32 | 600 ± 310 | 200 ± 336 | ||
| Trade value | Cash sales | 8 | 16 | 20,000 ± 6928 | 3158 ± 7841 | |
| Other | Slaughter (ritual + consumption) | 10 | 21 | 15,000 ± 6000 | 3333 ± 6894 | |
| Total (R/year) | (a) owner user HH: 7438 ± 12,168; (b) owner HH: 7046 ± 11,959; (c) all HH: 3347 ± 8962 | |||||
| Chickens | Direct-use value | Eggs | 43 | 57 | 1184 ± 574 | 606 ± 701 |
| Trade value | Cash sales | 13 | 17 | 976 ± 891 | 232 ± 571 | |
| Other | Slaughter (ritual + HH consumption) | 60 | 80 | 508 ± 271 | 407 ± 318 | |
| Total (R/year) | (a) owner user HH: 1328 ± 958; (b) owner HH: 1240 ± 984; (c) all HH: 954 ± 1009 | |||||
| Goats | Trade value | Cash sales | 0 | 0 | 0 | 0 |
| Other | Slaughter (ritual and HH consumption) | 3 | 33 | 8000 (n = 1) | 2667 ± 4619 | |
| Total (R/year) | (a) owner user HH: 8000 (n = 1); (b) owner HH: 2667 ± 4619; (c) all HH: 200 ± 1265 | |||||
| Pigs | Trade value | Cash sales | 8 | 30 | 3333 ± 1155 | 1000 ± 1155 |
| Other | Slaughter (ritual and HH consumption) | 13 | 50 | 1800 ± 1304 | 900 ± 1287 | |
| Total (R/year) | (a) owner user HH: 3800 ± 2950; (b) owner HH: 1900 ± 2807; (c) all HH: 475 ± 1585 | |||||
| Sheep | Trade value | Cash sales | 13 | 23 | 15,900 ± 25,601 | 3614 ± 13,090 |
| Other | Slaughter (ritual and HH consumption) | 28 | 50 | 3136 ± 1951 | 1568 ± 2095 | |
| Total (R/year) | (a) owner user HH: 8142 ± 15,991; (b) owner HH: 5182 ± 13,205; (c) all HH: 2850 ± 10,035 | |||||
| Av. Gross Total (R/year): (a) owner user HH: 9753 ± 20,177; (b) owner HH: 9457 ± 19,931; (c) all HH: 8002 ± 18,614 | ||||||
Table 6.
Scope of the average economic loss per annum amongst owner households as a result of ecosystem disservices (EDS) 1.
Table 6.
Scope of the average economic loss per annum amongst owner households as a result of ecosystem disservices (EDS) 1.
| EDS | Njela | Gogogo | Ludaka | |||||||
|---|---|---|---|---|---|---|---|---|---|---|
| % Owner HH | Av. Unit Lost p.a | Av. econ. Loss per HH (R/year) | % Owner HH | Av. Unit Lost p.a | Av. econ. Loss per HH (R/year) | % Owner HH | Av. Unit Lost p.a | Av. econ. Loss per HH (R/year) | ||
| Cattle | Tick-borne disease | 50 | 3 ± 1 | 27,000 ± 12,728 | 18 | 5 ± 4 | 50,000 ± 42,426 | 53 | 4 ± 4 | 50,400 ± 47,598 |
| Chickens/ Chicks | Birds of prey | 68 | 163 ± 202 | 5727 ± 7093 | 100 | 86 ± 63 | 3014 ± 2203 | 77 | 9 ± 6 | 329 ± 236 |
| Forest cats | 18 | 11 ± 16 | 1136 ± 1725 | 23 | 4 ± 2 | 409 ± 196 | 3 | 1 (n = 1) | 84 (n = 1) | |
| Monkeys | 14 | 36 ± 24 | 1242 ± 852 | - | - | - | - | - | - | |
| Chicken disease | 50 | 14 ± 15 | 1439 ± 1615 | 96 | 11 ± 8 | 1115 ± 824 | 63 | 18 ± 23 | 1500 ± 1930 | |
| Goats | Disease | 44 | 4 ± 4 | 6000 ± 6363 | 50 | 4 ± 4 | 8286 ± 7251 | 33 | 3 (n = 1) | 6000 (n = 1) |
| Pigs | Disease | - | - | - | - | - | - | 20 | 2 ± 0 | 4000 ± 0 |
| Sheep | Disease | - | - | - | 100 | 2 ± 2 | 4667 ± 3055 | 68 | 7 ± 7 | 11,000 ± 11,405 |
| Average economic loss amongst owner HHs (R/year): Njela: 8326 ± 9657; (b) Gogogo: 8289 ± 15,073; (c) Ludaka: 22,426 ± 38,208 | ||||||||||
1 The final averages will not equate to being added up on the table because they are derived from the empirical data per household across livestock types.
Table 7.
Pre-emptive and reactive strategies to reduce crop loss across all three villages.
| EDS | Pre-Emptive | Reactive |
|---|---|---|
| Birds of prey | -In past: papers or plastic bottle attached to overhead wires -Current: Plant long-leafed plants which provide safe space for chicks to hide -Construction of small structures -Shouting and waving arms | -None identified |
| Chicken disease | -Biomedical solution or Aloe sp. added to water trough | -Slaughter entire flock before one infected chicken spreads disease |
| Ticks and tick-borne disease | -Biomedical treatment at mean R1000 per annum for treatment and prevention -Medicinal plants, especially amongst poorer resident | -None identified |
Table 8.
Price (R/year) of the biomedical treatment or prevention for livestock and poultry-related EDS.
Table 8.
Price (R/year) of the biomedical treatment or prevention for livestock and poultry-related EDS.
| Njela | Gogogo | Ludaka | |||||||
|---|---|---|---|---|---|---|---|---|---|
| % of Owners | Av. Cost (R/year) | Range (R/year) | % of Owners | Av. Price (R/year) | Range (R/year) | % of Owners | Av. Price (R/year) | Range (R/year) | |
| Cattle | 50 | 550 ± 212 | 400–700 | 73 | 1075 ± 685 | 250–2000 | 84 | 913 ± 818 | 250–3000 |
| Chickens | 18 | 149 ± 127 | 13–350 | 46 | 112 ± 141 | 7–500 | 51 | 167 ± 158 | 30–500 |
| Goats | 89 | 350 ± 303 | 52–1000 | 86 | 986 ± 1662 | 12–1000 | 100 | 900 ± 557 | 300–1400 |
| Pigs | - | - | - | 0 | 0 | 0 | 0 | 0 | 0 |
| Sheep | - | - | - | 66 | 1105 ± 1265 | 200–2000 | 91 | 958 ± 690 | 100–3000 |
© 2020 by the authors. Licensee MDPI, Basel, Switzerland. This article is an open access article distributed under the terms and conditions of the Creative Commons Attribution (CC BY) license (http://creativecommons.org/licenses/by/4.0/).
Share and Cite
MDPI and ACS Style
Herd-Hoare, S.C.; Shackleton, C.M. Integrating Ecosystem Services and Disservices in Valuing Smallholder Livestock and Poultry Production in Three Villages in South Africa. Land 2020, 9, 294. https://doi.org/10.3390/land9090294
AMA Style
Herd-Hoare SC, Shackleton CM. Integrating Ecosystem Services and Disservices in Valuing Smallholder Livestock and Poultry Production in Three Villages in South Africa. Land. 2020; 9(9):294. https://doi.org/10.3390/land9090294
Chicago/Turabian StyleHerd-Hoare, Shannon C., and Charlie M. Shackleton. 2020. "Integrating Ecosystem Services and Disservices in Valuing Smallholder Livestock and Poultry Production in Three Villages in South Africa" Land 9, no. 9: 294. https://doi.org/10.3390/land9090294
Note that from the first issue of 2016, this journal uses article numbers instead of page numbers. See further details here.