Diversification of Livestock-Keeping Smallholders in Mountainous Rural Regions of Azerbaijan and Georgia
by

Regina Neudert
1,*, 
Naiba Allahverdiyeva
2,3,
Niyaz Mammadov
3,
Alexandre Didebulidze
4 and
Volker Beckmann
1 1
Faculty of Law and Economics and Institute of Botany and Landscape Ecology, Greifswald University, 17489 Greifswald, Germany
2
Department of Farm Management, University of Kassel, 37213 Witzenhausen, Germany
3
Department of Finance and Economic Theory, Azerbaijan State Agricultural University, 2000 Ganja, Azerbaijan
4
Faculty of Agricultural and Natural Sciences, Agricultural University of Georgia, 0159 Tbilisi, Georgia
*
Author to whom correspondence should be addressed.
Land 2020, 9(8), 267; https://doi.org/10.3390/land9080267
Submission received: 18 June 2020
/
Revised: 4 August 2020
/
Accepted: 6 August 2020
/
Published: 10 August 2020
Abstract
:Diversified livelihoods combining farming, livestock keeping and non-farm income are characteristic of many rural households worldwide. For the Central Asian and Caucasian region, livestock keeping is especially important in terms of land use and socio-cultural heritage. We contribute to the literature with data from the under-researched Caucasus region and investigate: (i) the extent of diversification in smallholder households; (ii) the role of livestock keeping in diversification; (iii) the influence of household-specific and location-specific variables and diversification on household income. Based on a dataset of 303 households, we calculate contribution margins for the main agricultural activities, household income, and diversification indices and analyze the influence of diversification, asset and location variables on household income with a regression model. Household income is generally diversified and a combination of four income sources (crops, livestock, poultry/bees and social benefits) was the most frequent. The econometric analysis shows that higher household incomes are positively correlated with higher household land and livestock assets, the presence of non-farm work and social benefit income sources and with an increasing specialization as measured by the diversification index. For enhancing rural household incomes and slowing down rural-urban migration, the development of non-farm job opportunities is recommended.
1. Introduction
Smallholder livelihoods are followed by a large proportion of rural households in the Caucasian and Central Asian region. Similarly to other parts of the world, smallholders in this region combine arable farming with livestock keeping and non-farm income. Smallholders typically pursue such diversified livelihoods in order to increase income, reduce risks, stabilize income and maintain food security [1,2] by making use of diverse assets and opportunities provided by their environment and the markets accessible to them. Studying diversification is therefore crucial to understanding smallholder livelihoods and to enhancing the food security and wellbeing of rural households worldwide.
Diversified smallholder livelihoods are particularly a phenomenon of rural regions, where households can make use of abundant and varied natural resources [3,4]. However, these regions are also disadvantaged by inadequate infrastructure and the lack of economic possibilities beyond agriculture [4,5] leading to outmigration and demographic change [6,7,8]. Thus, understanding the influence of contextual variables, e.g., an abundance of natural resources or infrastructure, on diversification is crucial in the formulation of context-specific policy recommendations for sustainable rural development.
Smallholders in the Caucasian and Central Asian region differ from households in other world regions with regard to the historical legacies of socialism and the particular prevalence of pastoralism and pastoral livelihoods [9]. Across the region, there are only a few studies on income diversification. Although livestock and farming are typically prevalent forms of land use, their actual importance in household incomes may vary [6,10,11,12]. Often, the share of non-farm incomes is reported to be higher than that of farm activities itself [6,10,11]. The lack of non-farm activities is identified as a reason for particularly low household incomes [5].
In pastoral regions in particular, diversification in other sectors beyond livestock keeping, such as arable farming or non-farm incomes, may involve trade-offs. A combination of livestock keeping with income from other sectors can have the positive effects of risk spreading and increasing incomes [6,13]. On the other hand, arable farming and non-farm occupations often require remaining in one place, which cannot easily be combined with the management of large herds. Thus, specialization in mobile pastoralism, allowing for diversity of livestock species and the use of multiple pastures, may be a more profitable strategy in pastoral regions [14]. While the latter relationships have been described for China, further research into different pastoral societies is needed to better understand the relationship between pastoralism and diversification.
In this paper, we aim to contribute to the literature on the relationship between pastoralism and diversification [6,13,14]. We analyze data from the Caucasus region, where the use of common pastures plays an important socio-cultural and economic role and investigate in depth household incomes and their composition. More specifically, we ask the following research questions:
- To what extent do smallholders in Azerbaijan and Georgia diversify their income sources?
- What role does livestock keeping play in diversification?
- How do diversification and other household-specific and location-specific factors affect household income?
For our investigations, we use a dataset from 303 livestock-keeping households in neighboring regions in Azerbaijan and Georgia. Thus, we are able to investigate the effects on household income composition caused by different socio-economic conditions in a similar ecological environment. Most other studies investigating diversification in the Caucasian and Central Asian region draw on datasets from only one country (e.g., [11,12,15] and many others), while only a few draw on cross-country comparable datasets (e.g., [16,17]). Thus, our study is one of the few providing methodologically sound small-scale cross-country comparisons of income, its composition and determinants.
As an intermediate result, we also comparatively investigate the economic performance of agricultural activities using cost-revenue calculations, which is seldom done for smallholder households due to the diversity and small-scale of smallholder agricultural activities. In combination with information on income from social benefits and non-farm occupations, the cost and revenue data help to explain differences in household income of smallholder households.
2. Literature Review
Rural households often follow a strategy of livelihood diversification by combining different agricultural and non-agricultural activities to buffer the seasonality of income flows, reduce the risk of income failure, and improve their living standards [18]. Livelihood diversification is not synonymous with income diversification since livelihoods also encompass “access to, and benefits derived from, social and public services provided by the state such as education, health services, roads, water supplies and so on” ([18], p. 4). Nevertheless, many diversification studies focus on income as an easy to compare measure.
There is a burgeoning literature on diversification in sub-Saharan Africa, where diversification is claimed to be the norm [19,20,21,22]. However, in other world regions as well, such as in rural regions in Asia [23] or the Americas [24,25] plus settings in developed countries [26], diversification is widespread. In the Caucasian and Central Asian region, diversified smallholder livelihoods were increasingly pursued in the post-socialist transition period with the breakdown of the large collective and state farm structures, though only a few contributions have explicitly studied diversification [4,12,27].
Households diversify their income due to a range of factors, including seasonality, risk and coping strategies, differentiated labor markets as well as savings and investment strategies and credit market imperfections [18]. In this way, diversification has been proven to be associated with higher income levels, greater household wellbeing [26,28] and a greater ability to cope with risks [29]. The literature distinguishes push and pull factors to diversification, where push factors relate to diversification due to necessity often related to previous or anticipated income failure or asset shortages [18,19]. Pull factors characterize diversification out of choice as a response to favorable opportunities or intentions to improve household wellbeing, e.g., by asset accumulation. While the distinction is conceptually useful, in practice a number of factors are involved [19]. In the post-socialist Caucasian and Central Asian region, increased risk and uncertainty in particular, along with credit market imperfections, are likely to be associated with the revival of diversification strategies.
In this study, we focus on the intermediate factors shaping and enabling diversification. The way in which a household diversifies its income sources is largely related to household-specific factors, such as education and wealth, but also to location-specific factors. Studies have shown that households rich in capital assets diversify into high-return sectors requiring capital input, such as cash crop cultivation or livestock keeping, or into profitable non-farm income sources [21,22,28]. In contrast, poorer households often rely on common or open access natural resources found in the vicinity of their residence, such as non-timber forest products [30,31,32]. Using these resources offers low returns but provides the means of maintaining a living in a form of safety net [33]. Households with better-educated members typically have better access to highly remunerative and stable non-farm income sources [25,34]. In contrast, with lower education only less remunerative and partly vulnerable non-farm income sources are accessible [22,35]. Location strongly influences the relative abundance of resources, such as forest, pasture, arable land, water or distance from urban areas, thus partly determining assets and possibilities for diversification. Thus, diversification strategies are adapted to the location-specific relative abundance of resources and market access options [20,22,23,35].
3. Materials and Methods
3.1. Study Area
Rural livelihoods and the agricultural sector in Azerbaijan and Georgia are still influenced by the post-socialist background of both countries. During the Soviet period, agriculture was characterized by the state ownership of nearly all agricultural land and concentration of production in large-scale collective farms called Kolkhoz or Sovkhoz [36,37]. At the end of 1991, following the dissolution of the Soviet Union and restoration of independence, the agricultural systems of both countries collapsed, and the land and livestock of collective farms were quickly distributed to rural households and small farms [10,17,38,39]. In the early years of post-socialist transition, characterized by economic restructuring and the lack of employment options, the agricultural sector served as a fallback option providing a means of survival for a large part of the population.
Agricultural policy in both countries aimed at fast and far-reaching market deregulation and the privatization of livestock, machinery and arable land [40]. Agriculture in Azerbaijan receives incentives from a general economy fueled by the exploitation of oil and gas reserves. In recent years, avoidance of the “Dutch disease” (adverse effects on the economy due to the exploitation of oil reserves) and food security considerations led to a renewed interest in higher agricultural production and modernization [41] although the potential for innovations remains low [42]. In Georgia, agricultural production suffered a comparably large decline in the 1990s with only slow recovery resulting from weak support from frequently changing policy approaches [43]. Tourism and agriculture now constitute a greater share of Gross Domestic Product (GDP) with a general orientation towards the European Union. Agricultural policy is more strongly oriented towards promoting innovation, food self-sufficiency and food safety [44,45]. In both countries, budgetary support for agriculture is largely coupled to production [43].
Even decades after post-socialist transition, small farms and households dominate the agriculture of both countries [46]. In Azerbaijan 88% and in Georgia 96% of the farms operate on less than 5 ha of land [47,48]. While in 2017 agriculture’s contribution to GDP was 7.2% in Georgia and 5.6% in Azerbaijan, it provided employment for 36.4% of the population in Azerbaijan and 43.1% in Georgia [49,50]. These data underline the fact that agriculture is still characterized by small farm sizes, low productivity, low incomes and diversification [40,46].
Livestock keeping is the most important activity. A large share of land resources, 40% in Azerbaijan and more than 60% in Georgia, is used as pastures [49,50]. Also, the share of livestock products in the gross output of agriculture is higher than the share of plant-growing products in both countries [49,50]. Livestock numbers show a decline in the early transition period, but have been growing since around the year 2000. In Azerbaijan, livestock numbers are at an all-time high, partly fueled by the rapid growth of the economy due to oil exploitation [51]. The growth of livestock numbers in Georgia is slower and pre-transition levels have not yet been reached [50,52]. Pastures in both countries show signs of unsustainable use; in Azerbaijan mainly due to overuse and degradation [53], and in Georgia due to underuse occurring alongside degradation [52,54]. Unsustainable use is particularly pronounced on village pastures [55].
Livestock keeping with the use of common pasture areas is a major source of income for local smallholders in the mountain regions of both countries [56]. Besides stationary livestock keeping, the huge altitudinal differences on the slopes of the Greater and Lesser Caucasus allow for a wide array of mobile livestock-keeping systems [57]. Here, we focus on the main users of village pastures, those smallholders active in stationary and semi-mobile livestock keeping and additionally in cropping [58].
3.2. Data Collection and Household Income Calculation
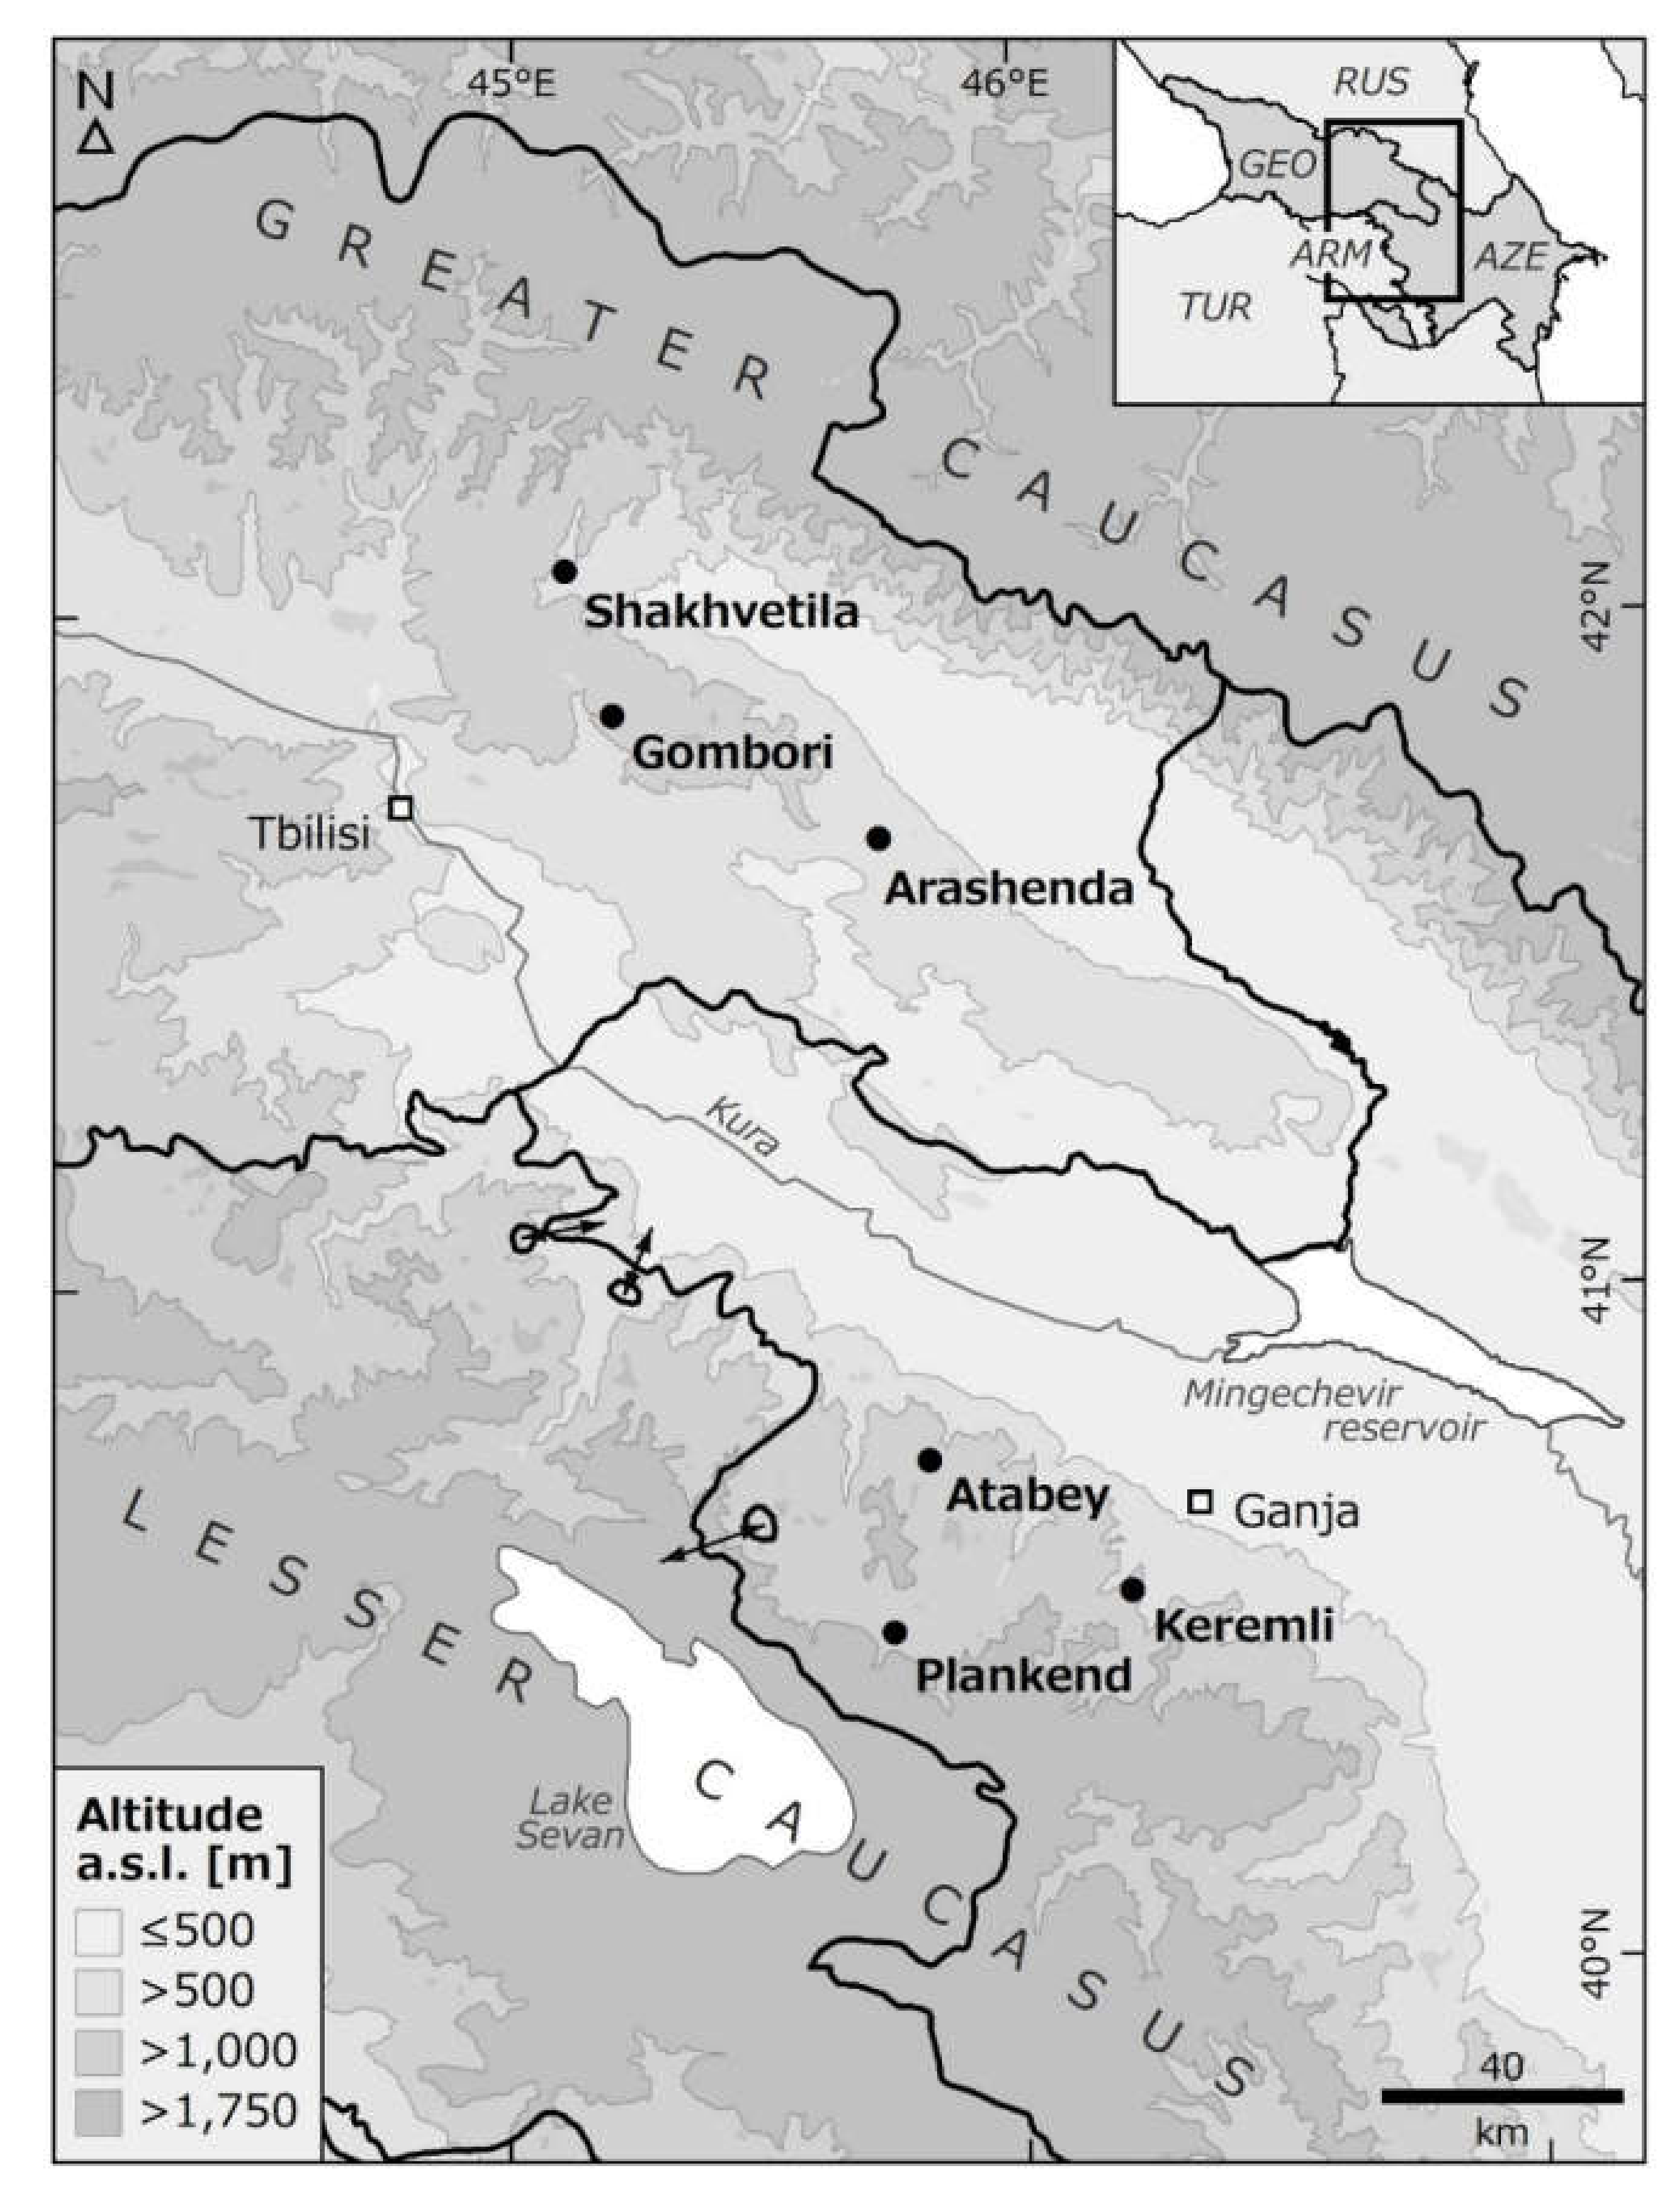
Data were collected in six case study villages, located in mountainous parts of two neighboring regions—three in the Ganja-Gazakh region in Azerbaijan and three in the Kakheti region in Georgia (Figure 1). Both study regions have a similar economic and ecological background and the peculiarity that common pasture plays a substantive role as land use. Villages were selected for representing a gradient of village pasture availability and differ in their remoteness and accessibility (Table 1) [58].
Data were gathered in 2016 in two survey stages. In a first round, socio-economic overview data on household demographics, income earning activities, pasture use and wellbeing were collected using a structured questionnaire and following the approaches of Benedetti et al. [59] and Nuthall [60] (Supplementary Material S1). In total, 303 households were interviewed. The sample was derived from permanently resident households that keep livestock and use the local common village pastures. Households were selected by systematically walking the roads of the village since pre-survey sampling information was not available [61].
In a second step, data were collected from 64 households randomly selected from the respondents from the first survey, using a semi-structured questionnaire to obtain detailed cost and revenue data for income-earning activities. Only a subsample of the first survey respondents was chosen, since more and detailed data collected from each respondent required more time and effort in data collection and analysis.
Information on the amount of income from non-farm activities and social benefits was obtained from statistics, since respondents in the villages were mostly reluctant to disclose information on these activities during the interviews. We thus used data from the statistical yearbooks of Azerbaijan and Georgia for 2016 [62,63]. Combining these data with household survey information on the presence of income categories we calculated household incomes for the non-farm wage categories of public employment, permanent employment in private enterprises, self-employment and salaried work, as well as for categories of social benefits comprising pensions, other state benefits and other private benefits.
For agricultural activities, cost-revenue calculations were set up for the most important livestock-keeping and farming activities for the different villages. In livestock keeping, calculations were performed for the keeping of cattle, sheep, goats, pigs, chicken, geese and bees; in farming in the production of potatoes, wheat, raspberries, grapes and hay (Supplementary Material S2–S15). In farm-economic terms, we calculated the contribution margin (equal to gross margin [64]), which approximates profit since the fixed costs for smallholders can be assumed to be very low. Calculations refer to one year and an appropriate unit (mother animal unit, hectare or bee hive). All production, including that for subsistence, was valued using local market selling prices. Among variable costs positions, replacement for livestock production was calculated using the opportunity costs of selling. Household-external non-permanent labor was accounted for, while household-internal labor was not included [60,65,66]. If data for individual cost positions or an activity were not available for a single village, information was transferred from the most similar village in the same country for which data were available. Based on these contribution margins, household incomes from arable farming, livestock, beekeeping and poultry keeping were calculated.
This information on contribution margins was multiplied by the respective unit value (e.g., mother animal unit or area unit) obtained in the first socio-economic survey to compute household incomes. Details on calculating contribution margins and household income can be found in Supplementary Material S2–S18. Cost-revenue and household income calculations as well as descriptive statistics were compiled in MS Excel© [67].
3.3. Analysis
To assess the economic performance of agricultural activities performed by the household, we display the Contribution Margin Ratio (CMR), which is calculated as
where R indicates the revenue and VC the variable costs [60,64,65]. The higher the CMR the better the economic performance, as it provides a measure for the remaining share of the revenue that is used for covering fixed costs [68].
We assessed diversification of household income using the Herfindahl-Hirschman Index (HHI), originally invented to measure industrial concentration [69], but now also well-established for assessing income diversification [20,27,70]. We used a normalized version of the HHI with the formula:
with k indexing the income category, K = 5 as the total number of income categories used in this study, and s being the share of the respective income category in total income. The index takes the value of 1 in the case where all income is derived from one source, meaning maximum specialization, and a minimum value of 0 in the case where income is derived from all sources equally, meaning maximum diversification.
For assessing the determinants of household income we calculated Ordinary Least Square (OLS) multiple linear regression models with robust standard errors in Stata©(Statacorp, College Station, TX, USA) sequentially introducing variable dimensions [71]. We specified the model as follows [72]:
in which Yi is the household income, X1i, X2i,… Xki are explanatory variables, β0 is the intercept, β1, β2,… βk are the slope coefficients on the respective variables X and ui constitutes the error term.
OLS regression models are a standard procedure in statistical analysis and diversification studies using continuous dependent variables [4,73,74,75,76]. Variables suspected to influence household income based on the literature review are: (i) diversification of income sources (measured by the HHI as described above); (ii) household assets covering the main dimensions land, livestock and labor; (iii) additional activity variables for non-farm income and mobility; (iv) characteristics of the household head (age, gender and education); and (v) location-specific dummy variables for country (Azerbaijan or Georgia), the village with the scarcest pasture resources in each country (Plankend and Arashenda) and the village with the most remote location in each country with no asphalt road (Atabey and Shakhvetila). As we suspected that relationships could differ between the two countries, we repeated regressions with subsets of the data for each country.
In order to correct for left-skewed distributions of dependent variables, which is often the case for wage- or income-related variables, a log-transformation of the dependent variable is common [77]. The dependent variable in our data set, total household income, is slightly left skewed, however, log-transformation yielded a variable that is right-skewed to the same degree. Thus, the non-transformed variable was used, since a transformation would not lead to improved variable characteristics. As the full model thus exhibited evidence of heteroscedasticity, we used a model specification with robust standard errors and apply caution in the interpretation of significance levels [73]. Potential bias from multicollinearity was not present based upon inspection of a correlation matrix of independent variables and the variance inflation factor [73,77].
4. Results
4.1. Demographics
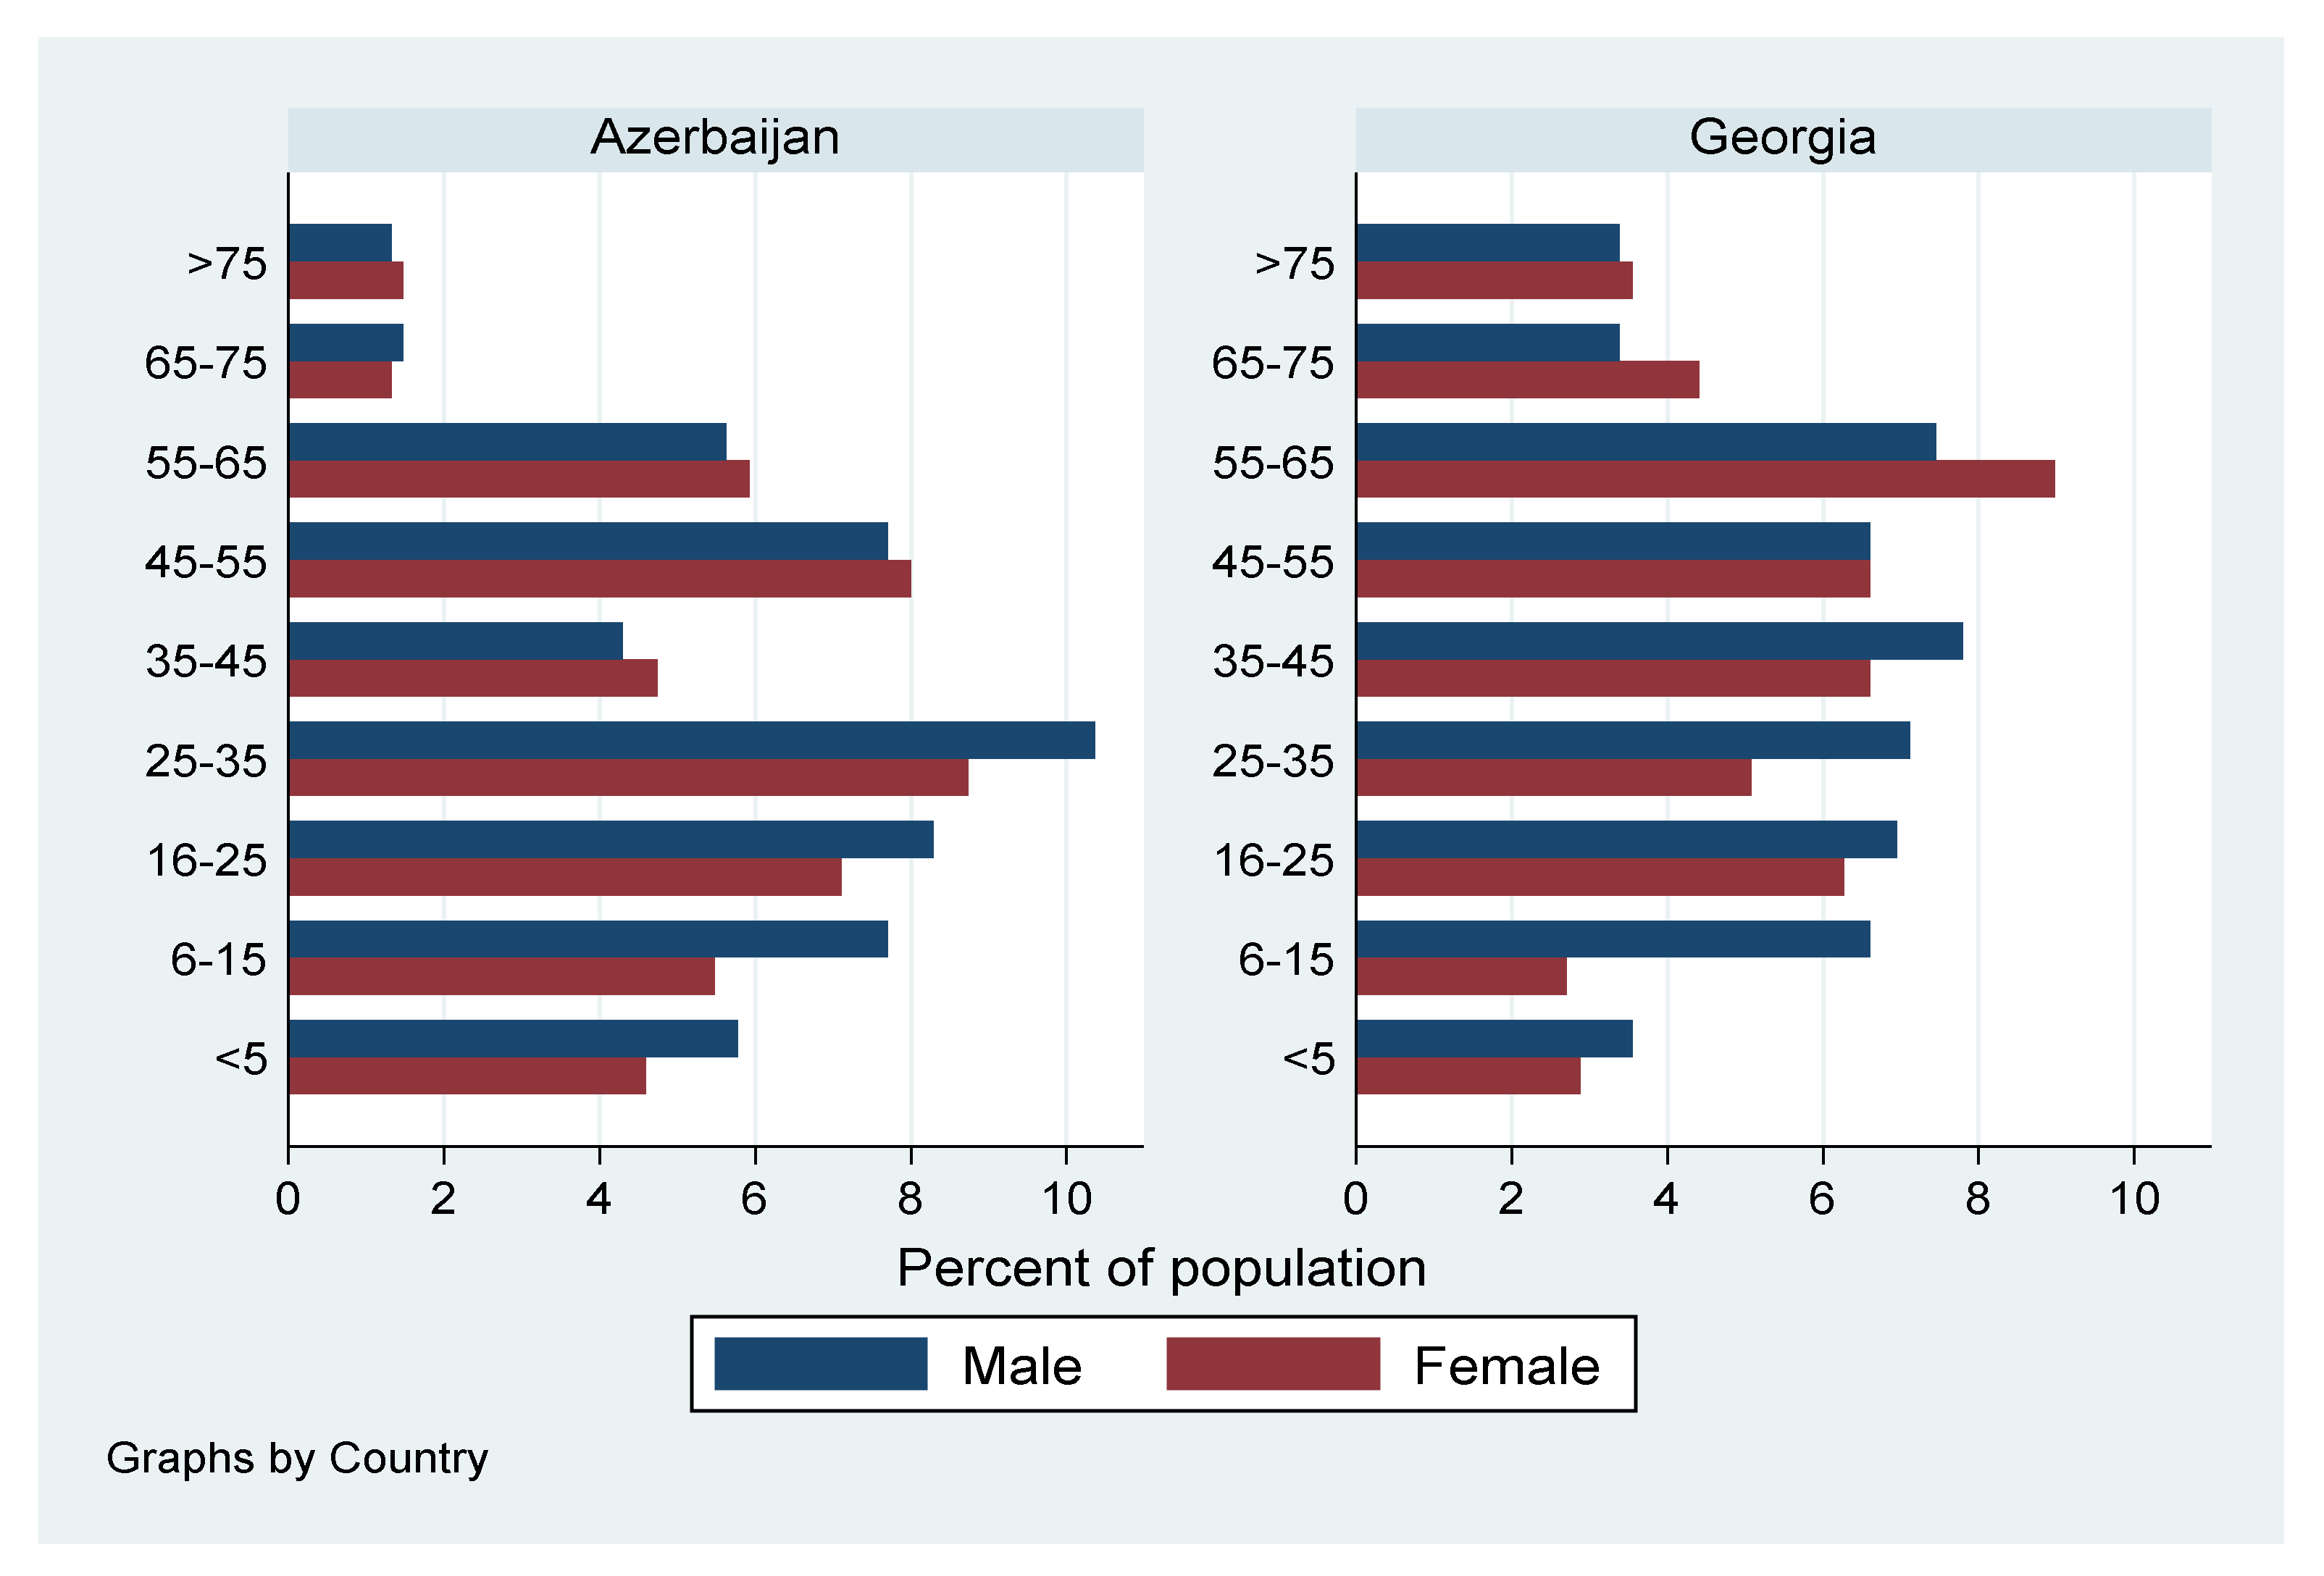
Table 2 depicts basic demographic data on the surveyed population. In Georgian households, members tend to be fewer and generally older compared to the Azerbaijani households. Generally, the surveyed population is aging, as the age tree (Figure 2) shows. The dependency ratio is similar to that of the general population. The data underline the observation that young people and families with children in particular leave the villages to benefit from better education and job opportunities in the cities. The education level is generally satisfactory, with the majority of the population having graduated from school but with no further education. The self-reported occupation shows the importance of agriculture in the study villages since on average more than 60% of the economically active population are engaged in agriculture.
4.2. Overview of Income Sources of Households
The sampled households are mostly smallholders deriving their income from arable farming, livestock, poultry keeping and beekeeping, as well as other farm and non-farm income sources (Table 3, additional details in Supplementary Material S19–S23).
Livestock keeping is done by all surveyed households, which is due to the selection criteria of the sample. The keeping of two to five milk cows, primarily for self-provision with milk products, is most widespread, but sheep keeping is also carried out by more than 50% of the surveyed households, especially in the Azerbaijani case study villages. Only 15% of households keep goats. Livestock mostly grazes on common village pastures and is fed with bought or self-produced hay during winter. Pigs are only kept in the Georgian case study villages.
Regarding arable farming, households farm, on average, a total area of 2.2 ha including their land plot, home garden, hay meadow and vineyards. While home gardens are located in the village around houses, all other farmed areas are located outside the village. Home gardens with an average size of 0.3 ha have a huge importance for growing crops and vegetables. Usually, approximately seven crops are grown by an average household, with potato and wheat being the most important. Vineyards with grapes are found in the Georgian study villages, particularly in Arashenda. While potatoes, wheat and grapes occupy the largest areas and are also sold, other crops such as different vegetables (beans, tomato, cabbage, herbs) are mostly used for self-consumption. Raspberries are a specialty in the Azerbaijani village Keremli, where they are grown for market production by 15 households in the sample.
Besides livestock, between 77 and 97% of households in the different villages keep poultry. While chicken are the most widespread, geese, turkeys and ducks are also kept (mainly in the Azerbaijani study villages). On average, a household has around 19 head of poultry. Beekeeping is less widespread with, on average, 17% of the households in one village keeping between three and five beehives.
A total of 80% of households combine agricultural activities with non-farm income, either from social benefits or from non-farm work. Social benefits comprise pensions, which are the most widespread non-farm income category, and other state and private benefits. Among non-farm work, public employment and salaried work are most widespread. Non-farm income sources are most abundant among the households of Keremli and Arashenda.
On average, households have approximately four income sources, with the combination of Farming-Livestock-Poultry-Social benefits being most frequent at 32% of households. Only a negligible share of 2.6% of households have only one or two income sources.
4.3. Economic Performance of Agricultural Activities of Households
The contribution margin ratios (CMRs) as indicators of economic performance of the agricultural activities undertaken by village households are displayed in Table 4. Most activities show a satisfying economic performance. The CMR is particularly good for beekeeping and potato production as indicated by results higher than 70% in most villages. Potato production in Azerbaijan, especially in Atabey, has very high yields, and contribution margins are two to four times higher than in Georgia and five to ten times higher than those for wheat production (Supplementary Material S12). This is also confirmed by villagers who perceive potato production as very profitable and increasingly convert hay meadows to potato fields. Livestock-keeping activities show a good to satisfying economic performance with a CMR above 50%, as well. In contrast, the economic performance of grape production in Georgia is not satisfactory as indicated by the relatively low CMR of 34%. According to villagers this is due to low grape selling prices. The CMR indicates that hay meadow use is economically hardly profitable in both countries. It is also confirmed by the frequent behavior of villagers abandoning hay meadow use due to low profitability.
4.4. Household Income
Household income amounts to between 67 and 128 EUR/person and month in the Azerbaijani case study villages and between 99 and 133 EUR/person and month in the Georgian villages (Table 5). While the overall household income is higher in the Azerbaijani villages, the per capita income is higher in Georgia due to the effect of smaller household sizes in Georgia. Compared to the national average household income in Azerbaijan of 258 AZN/person and month [49], the household income in the Azerbaijani villages constitutes 76% of this average. In Georgia, compared to the national average of 269 GEL/person and month [50], the households achieve a higher income of 118%. Thus, the income level calculated in our study is higher relative to the national average in the Georgian villages.
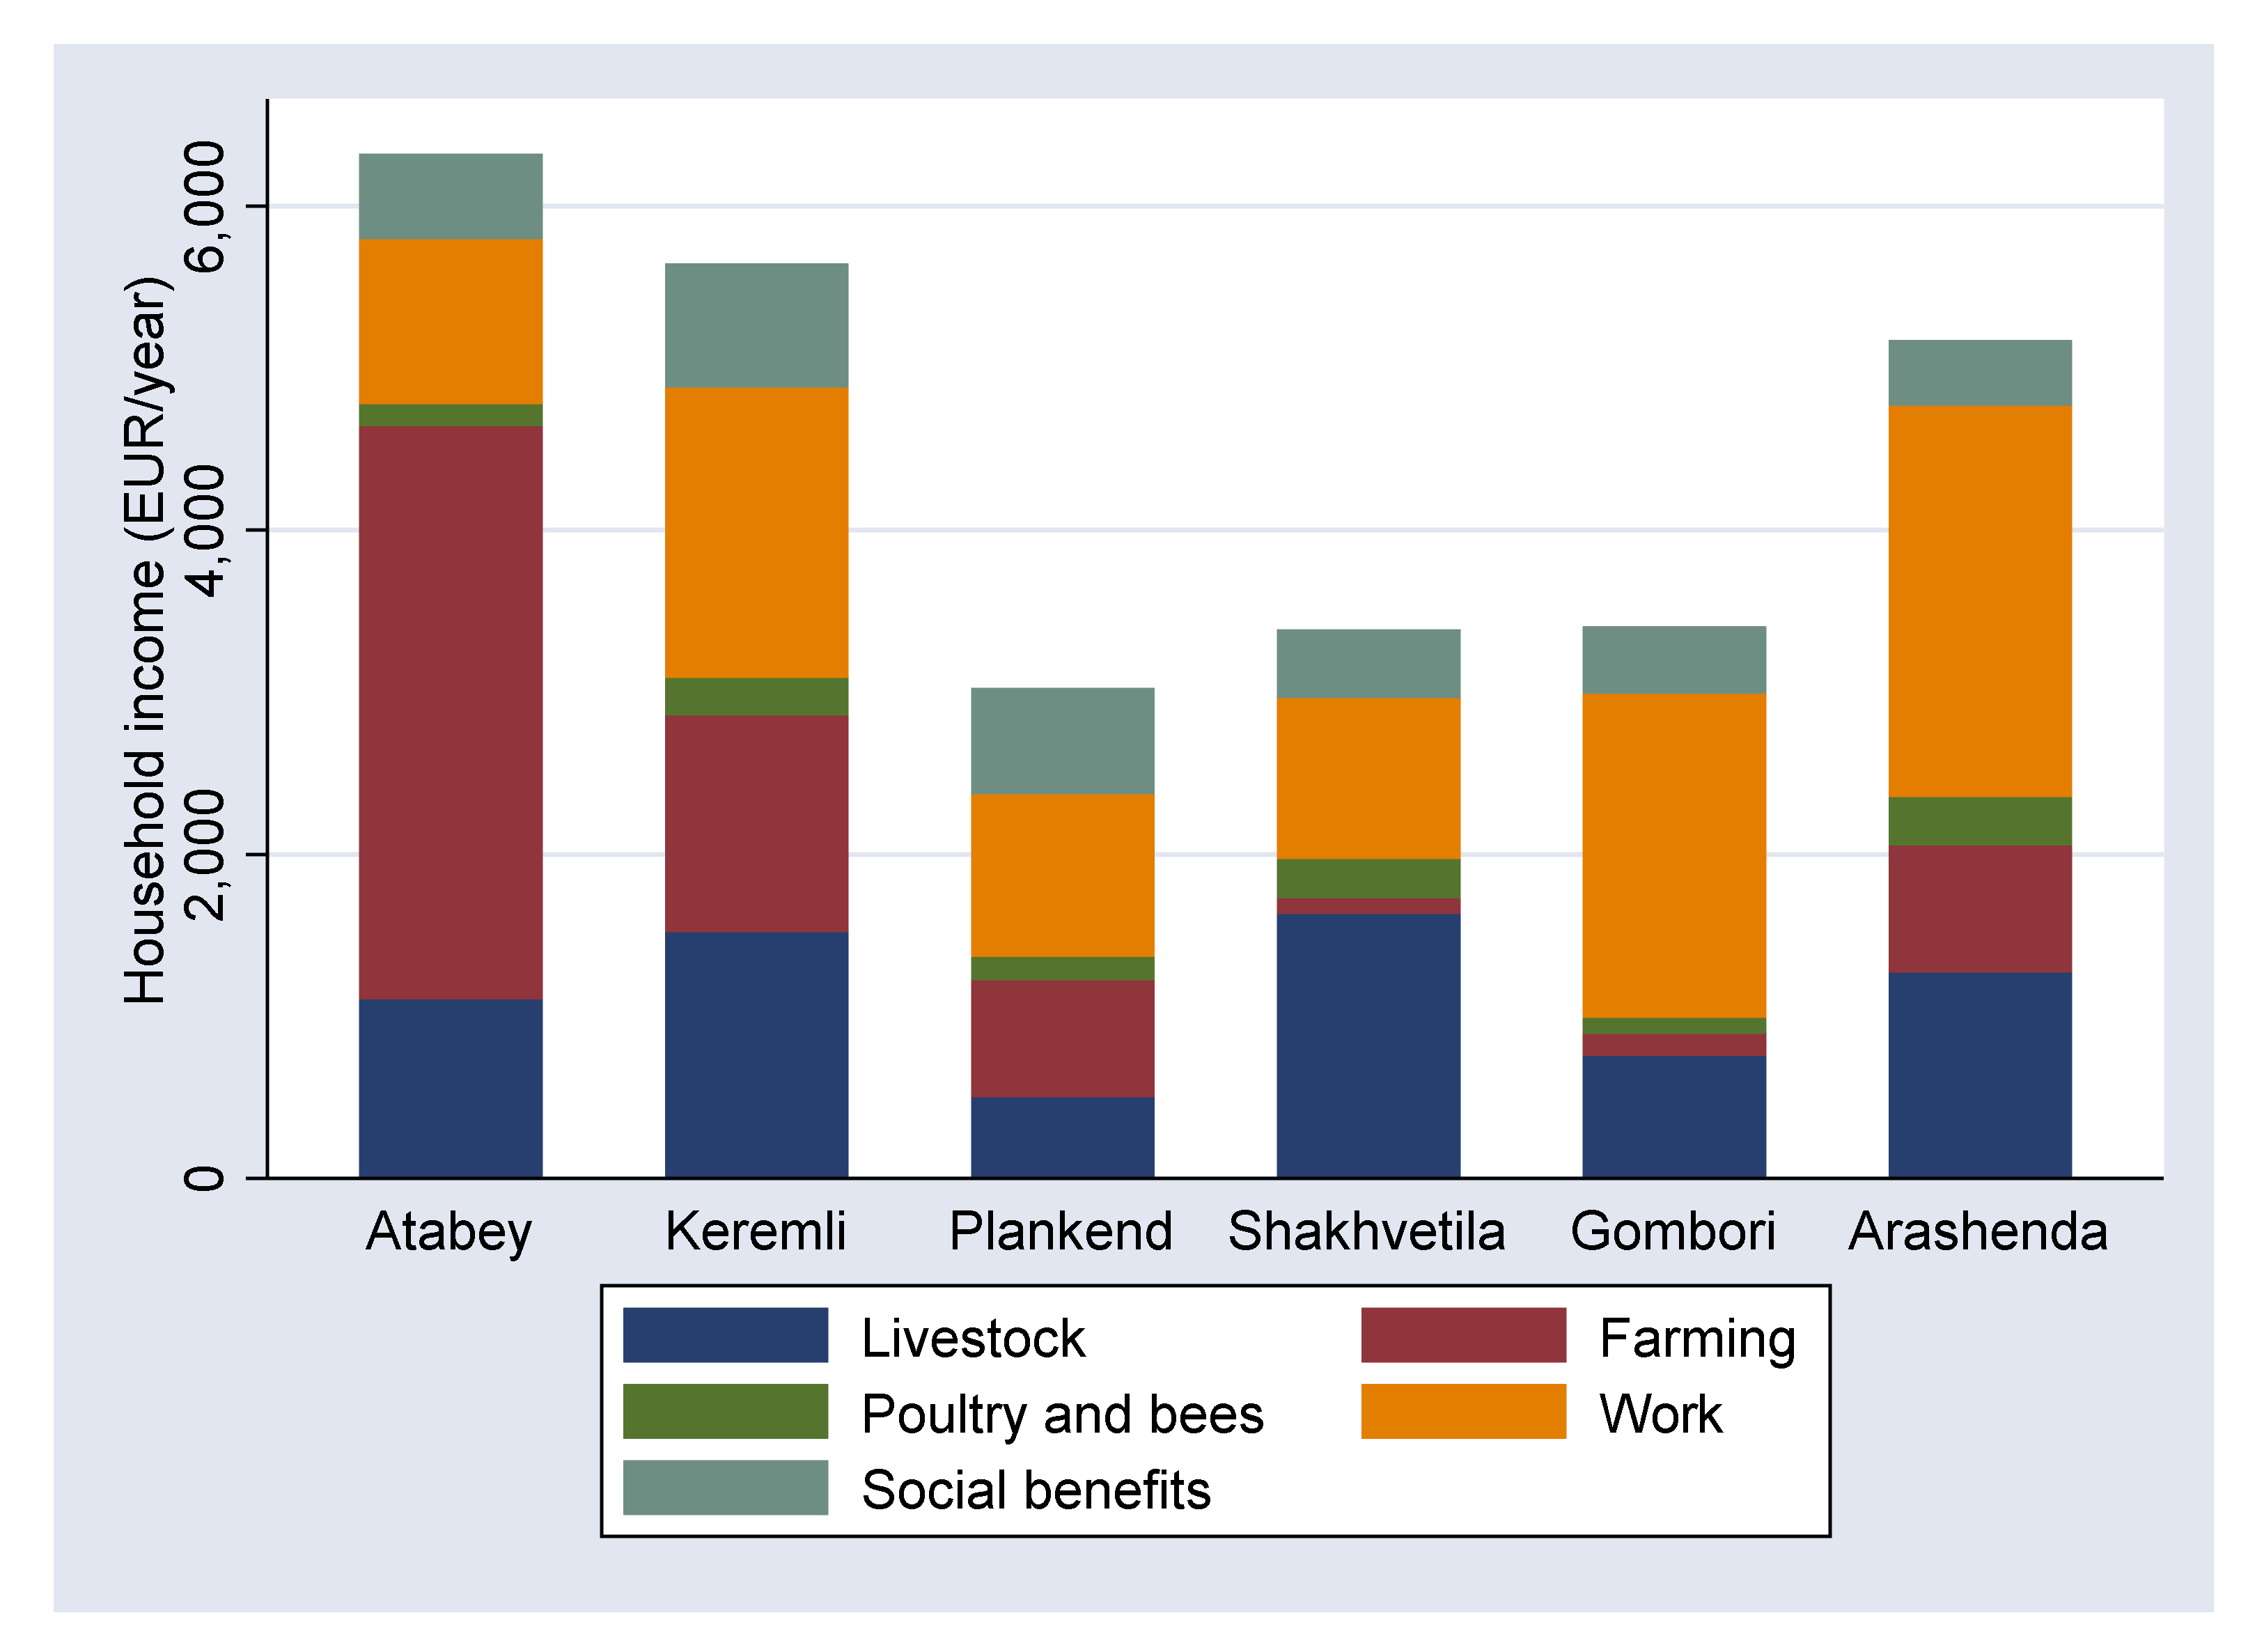
First insights into the composition of income (Figure 3) disclose differences between countries and villages. Non-farm income from work and social benefits contribute the greatest share to household income in all villages except in Atabey and Shakhvetila. Arable farming has a higher relative importance in Azerbaijan due to comparatively higher land holdings and because in Georgia a considerable share of arable land is not cultivated (Supplementary Material S10). Livestock contributes between 17% (Atabey) and 49% (Shakhvetila) to the household income, but generally has a higher importance in the Georgian study villages compared to the Azerbaijani ones. Social benefits as well as potato and beekeeping have similar contributions to household income in all villages. Summing up all agricultural income categories, agriculture contributes more than half of the total income in 3 villages (Atabey, Keremli and Shakhvetila).
A detailed comparison of income level and composition taking into account household assets and profitability of income sources yields further insights into differences between villages: Arable farming contributes the highest income share in Atabey, due to the high profitability of potato production (see Section 3.3) and particularly large holdings of arable land (Table 3). Also in Arashenda, households have higher arable land areas, particularly vineyard areas; however, the contribution to household income is lower due to the low profitability of grape production (Table 4). Particularly small areas of arable land and negligible contributions of arable farming to income are found in Shakhvetila and Gombori, while in Plankend land plots of similar size are nearly constantly cultivated with profitable potatoes, leading to a relatively higher contribution of farming to household income. Income from livestock varies with livestock holdings in the different villages. Livestock contributes the relatively greatest share to household income in Shakhvetila. In this village, we find comparably high livestock holdings alongside little arable land and few income-earning possibilities in non-farm work. Non-farm work has a lower importance in Atabey and Shakhvetila, which are the villages with the least developed infrastructure located at greater distances from district centers (for Atabey) or far from the central roads (for Shakhvetila). Total income is made up of contributions from different sources and reflects household assets and the profitability of these income sources. The high profitability of potato production leads to the high contribution of farming to household income and, in consequence, to the comparably highest income in Atabey, while the relatively high incomes in Arashenda are associated mainly with profitable sources of non-farm income. Constrained assets and possibilities in farming, livestock keeping and non-farm income lead to the relatively lowest household incomes in Plankend.
The HHI as a measure for diversification ranges between 0.25 and 0.49 indicating that, on average, households are closer to diversification than to specialization. Lower values, indicating stronger diversification, are predominantly found for the Azerbaijani study villages. For the Georgian villages, higher HHI values are most likely caused by the higher share of non-farm income relative to the contributions of other income sources.
4.5. Determinants of Household Income and Diversification
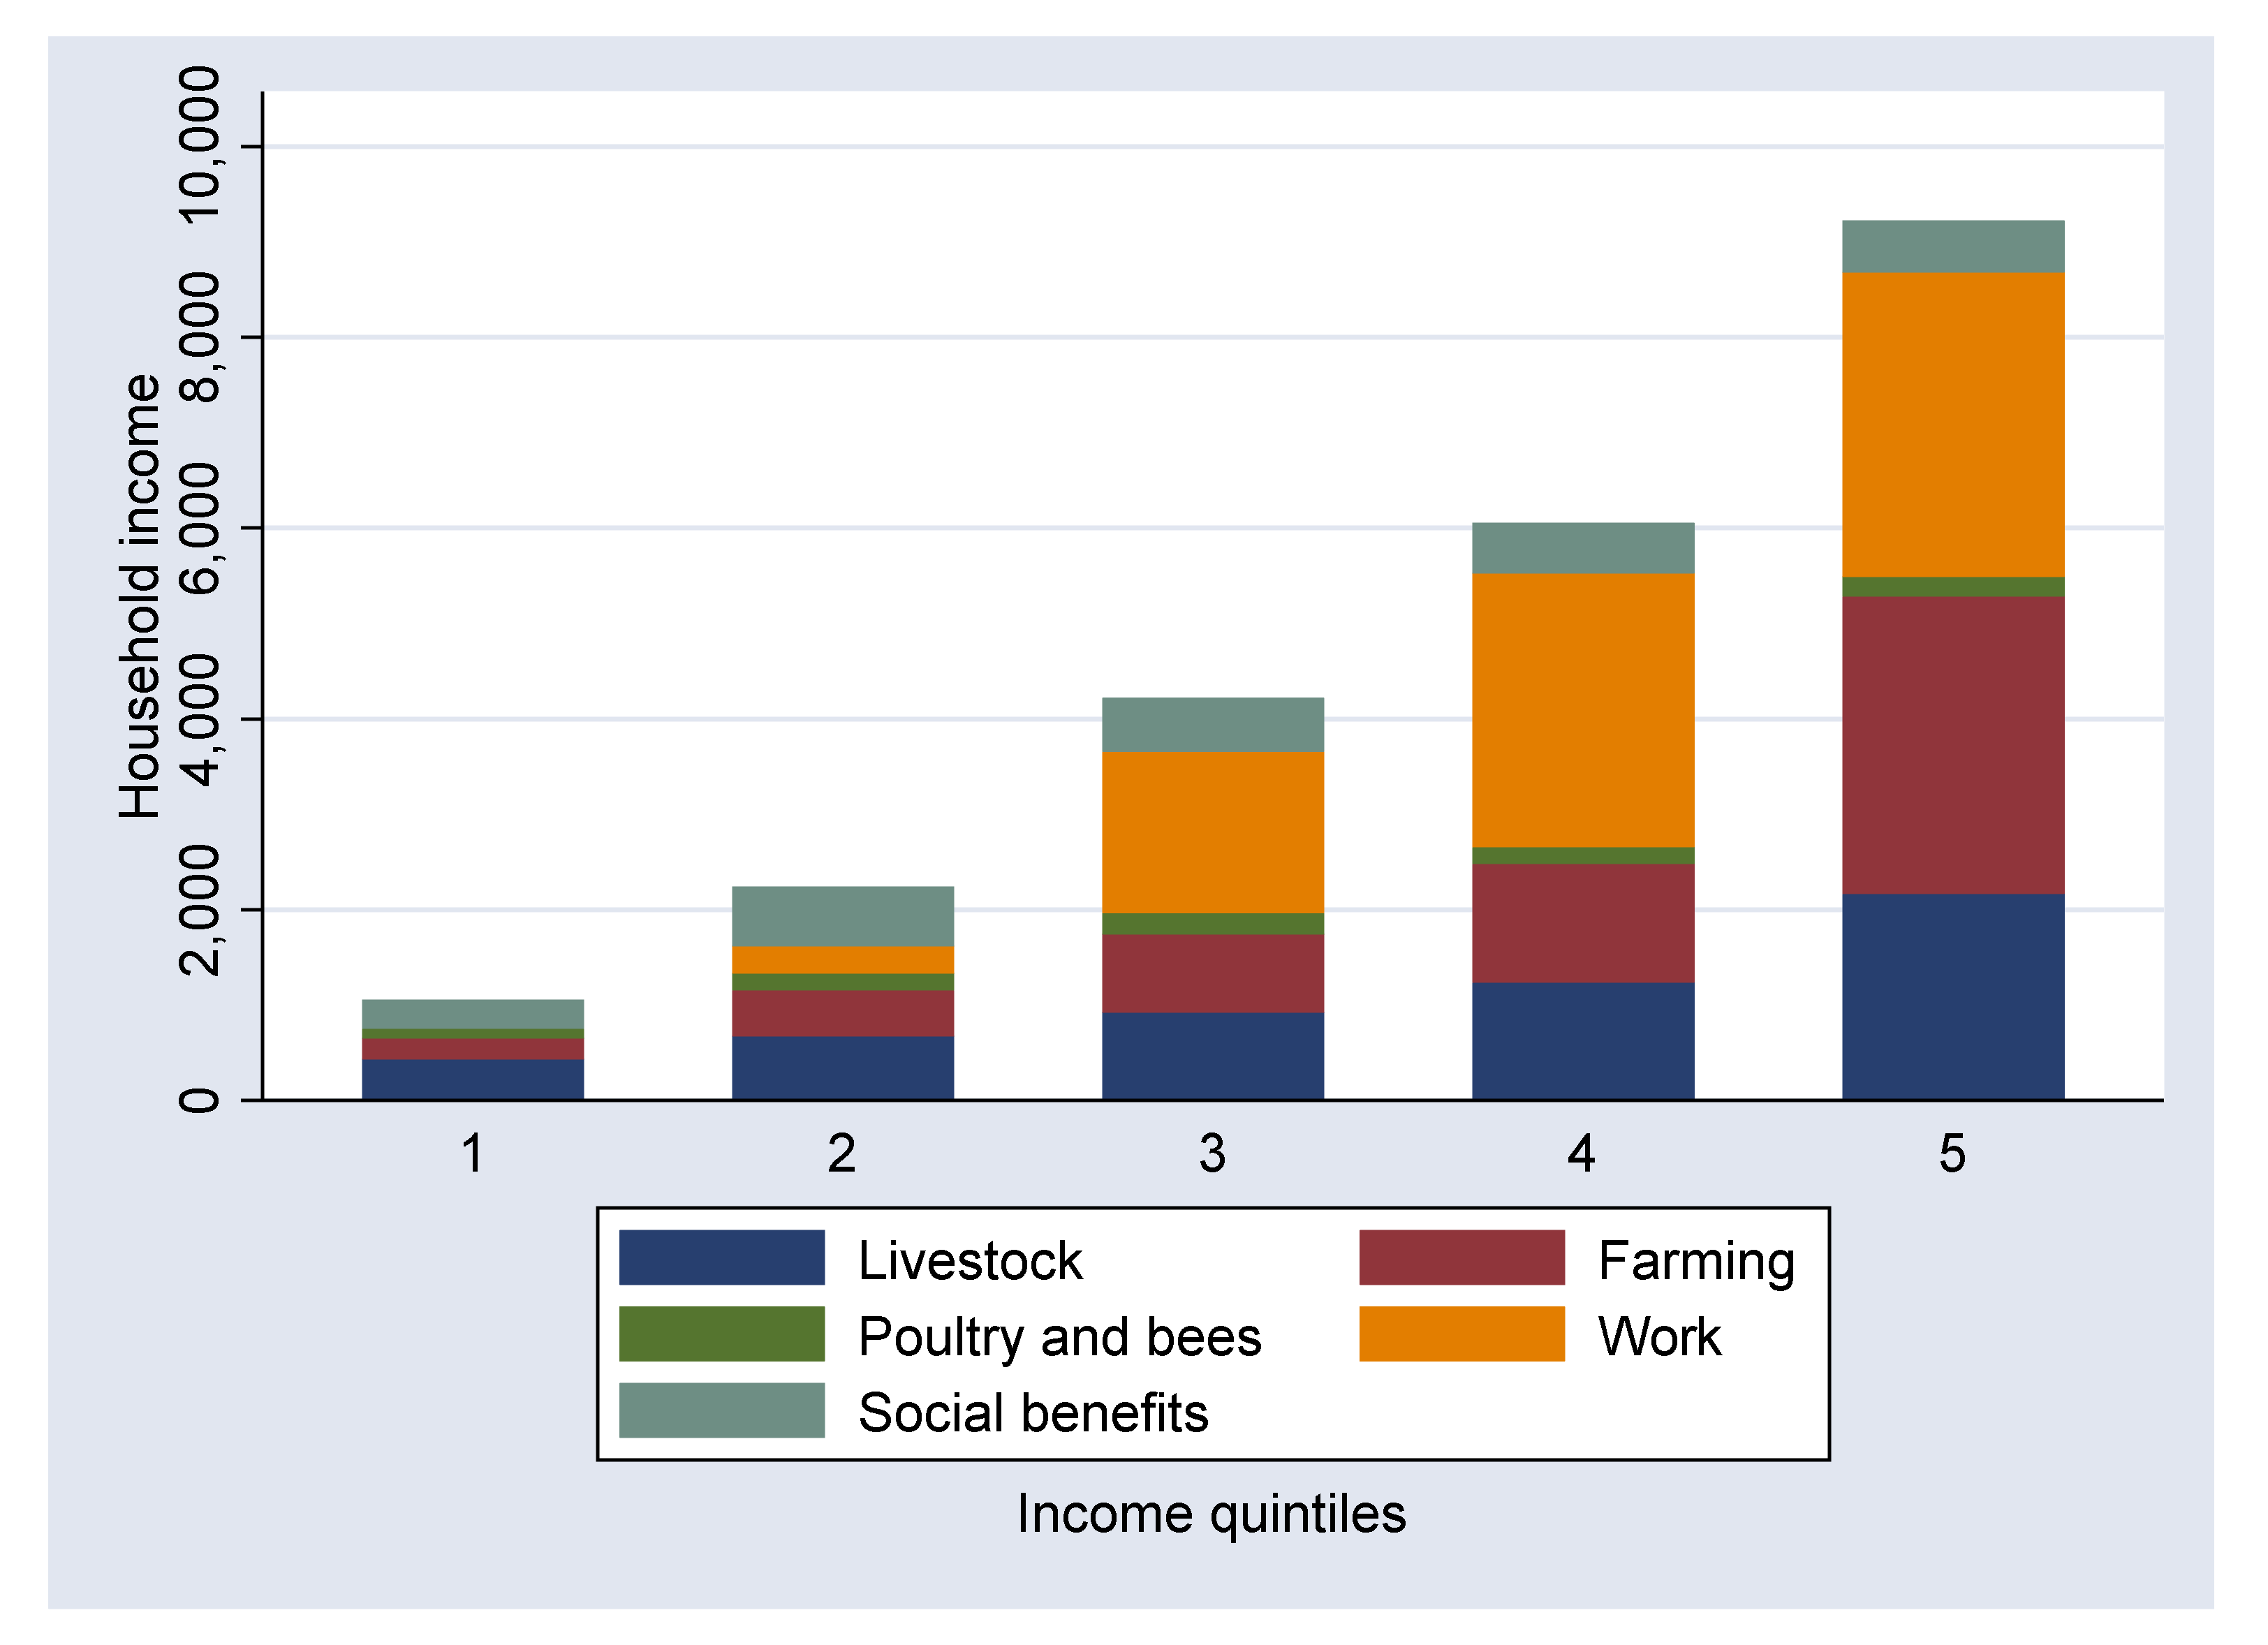
Depicting income composition in income quintiles yields some first insights into the determinants of household income (Figure 4). While the absolute contribution of income from poultry, bees and social benefits remains relatively stable across all income quintiles, income from farming and livestock increases moderately, pointing to higher land and livestock possessions of households with higher income. The strongest relationship is found with non-farm work income. While none of the households in the lowest quintile has income from non-farm work, the share increases strongly in higher income quintiles. For the Azerbaijani study villages, diversification decreases slightly across income quintiles: the HHI is 0.30 for the first quintile and 0.37 (0.34) for the fourth (fifth) quintile. Diversification in the studied Georgian households decreases more strongly from 0.35 in the first quintile to 0.58 (0.51) for the fourth (fifth) quintile. Non-farm work accounts for 64% and 59% of the income in the fourth and fifth quintiles in Georgian households.
We also calculated multiple linear regression models (OLS) with robust standard errors to test for the influence of diversification and other variables on household income (Table 6, Supplementary Material S24). Full models are statistically highly significant and show R-squared indicators between 0.84 and 0.90.
Table 6 verifies that the HHI has a stable and statistically significant effect on household income, indicating that increasing specialization is associated with a higher household income. The effect is of medium strength since a 0.1% increase in the HHI is associated with a 214 EUR/year growth in household income. This effect of the HHI is present in nearly all models for the Azerbaijani case study villages (except Reduced model 1); for the Georgian case study villages the HHI is not significant any more when additional activity variables are introduced (from Reduced model 3) (Supplementary Material S25 and S26).
Household assets, particularly land and livestock ownership, have a stable, statistically significant and positive effect on household income across all models. The effect of land ownership is particularly strong as one additional hectare of land owned is associated with an income growth of 467 EUR/year. One additional livestock unit leads statistically to an increase in income of 181 EUR/year. In contrast, the positive effect of more working age household members on household income is smaller (Table 6) and is not repeated in the country-specific models except Reduced models 3 and 4 for the Georgian case study villages (Supplementary Material S26). The comparison of model fit indicators shows that household asset variables contribute most to explaining variation in household incomes.
Among the additional activity variable dummies, the presence of a non-farm income source or a social benefit income source has a statistically highly significant and stable effect on household income. The presence of a non-farm income source statistically increases household income by 3440 EUR/year in the full model (Table 6). In contrast, in none of the models does semi-mobile livestock keeping have a statistically significant effect on household incomes. The characteristics of the household head are not generally statistically significant for influencing household income.
Among the location variables, the country dummy confirms that households in the Georgian villages receive less income than in the Azerbaijani villages, which is consistent also with the comparison of statistical averages of household income (Table 5). While the dummy for scarce pasture resources is not significant in the full model, a highly significant positive result was obtained for a remote location, indicating that in the villages in remote locations, Atabey and Shakhvetila, a relatively higher income was obtained than in the other villages. The effect of remote location is repeated in the models for the Azerbaijani case study villages but not for the Georgian ones. Thus, a consistent effect of remote location or scarce pasture resources was not confirmed in the models.
5. Discussion
We analyzed household income diversification of livestock-keeping households in the Caucasus region based on a dataset of 303 households. The villages are populated by typical smallholder households [78] farming, on average, 0.5 to 3 ha land, keeping livestock equivalent to 3–10 livestock units, and combining agricultural activities with non-farm income.
The studied villages, especially in Georgia, are characterized partly by difficult access by road and public transport, deficient social infrastructure and few non-farm job opportunities. This leads to strong outmigration [79], which is also visible in the demographic profile of the surveyed population showing an aging population with lower proportions of children and working-age individuals. Strong rural-urban migration and land abandonment is repeatedly reported for rural regions in Georgia [8,80] and Central Asia [6].
We calculated household income based on the contribution margins of farming activities and statistical data on non-farm income sources. The calculation of contribution margins yielded first insights into the economic performance of agricultural activities. While profitability calculations of a wide range of smallholder agricultural activities are the basis of income calculations and diversification analyses (e.g., [11,12], they are seldom presented in detail in the literature (the closest for the Central Asian and Caucasian region is [81]). Compared to estimations based on stated household income [5,6] or calculations based on gross income from agricultural activities [4], in cost-revenue calculations with a methodologically sound and consistent treatment of costs, more precise estimates of household incomes and comparative insights into the profitability of agricultural activities are possible [82]. However, we could not assess all activities of natural resource use contributing to income, e.g., use of fruits, fuelwood collection or duck keeping, while we are sure we have captured the major activities contributing to income [82]. Non-farm income was calculated based on data from statistical offices in Azerbaijan and Georgia using the reported type of occupations. We chose this approach as no consistently reliable data from all respondents on the amount of non-farm income earned could be obtained. Despite the fact that we cross-validated estimations with credible responses from villagers, the chosen approach adds particular uncertainty to the estimations of non-farm income. A comparison with data from the statistical offices showed that our average estimations of household incomes are in Azerbaijan about 24% lower and in Georgia 19% higher than the national averages reported for rural regions in the specific countries [49,50]. While there may also be actual regional differences in household income, the comparison indicates that our estimations are within realistic ranges.
The comparison of agricultural activities based on the contribution margin ratio yielded insights into the relative profitability of agricultural activities. The high profitability of potato production in Atabey and raspberry production in Keremli (Table 4) provides explanations why these activities are pursued increasingly (as reported by locals and seen in the data). The low profitability of hay meadow use explains the increasing abandonment of hay meadows or conversion to potato fields appearing in some study villages [56]. Thus, the analysis of profitability of agricultural activities has provided insights into the production decisions of smallholders which are partly governed by cost-revenue relationships and market prices.
On the first research question about the extent of diversification, we found that most smallholders indeed generate income from multiple sources. Diversification indices of, on average, 0.33 in Azerbaijani study villages and 0.43 in Georgian villages indicate that the majority of households are closer to diversification than to specialization. Most households combine livestock keeping with arable farming, poultry keeping and non-farm income, either from social benefits or from non-farm work, or derive income from all 5 categories. This result is not surprising in a global context since among smallholder households, diversification is the norm rather than the exception [19].
Regarding the role of livestock keeping in diversification (second research question), we find that the relative contribution of livestock to household income increases with higher household incomes (Figure 4). The cost-revenue calculations showed with comparably high CMRs that livestock keeping on village pastures is a profitable activity (Table 4). Thus, an investment in livestock assets is economically understandable from a smallholder point of view and contributes to increasing household income. This is also visible in a positive relationship between livestock holdings and household income in the regression analysis (Table 6).
That a specialization in livestock keeping occurs among the surveyed households is not supported by the dataset. Semi-mobile livestock keeping did not affect household income in the regression analysis. However, the household dataset covers only stationary and semi-mobile livestock keepers using village pastures, while mobile forms of pastoralism also exist in Azerbaijan and Georgia. A specialization in livestock keeping could be more likely among these mobile pastoralist households [14,51,83].
On the third research question “How do diversification and other household-specific and location-specific factors affect household income?” we found multiple relationships. While diversification is the norm, higher household income is mostly associated with higher levels of specialization, especially in non-farm wage income. This is confirmed by a mostly positive relationship between household income and HHI and a statistically significant and strongly positive coefficient for non-farm work in the statistical analysis (Table 6). Thus, our findings confirm a decreasing role of agriculture, especially in Georgia, while non-farm wages, once present, provide opportunities for higher household income. Special potential is seen in tourism and the processing of agricultural products [84].
In contrast to other categories, income from pensions and poultry/bees is relatively stable across all income groups. This indicates that these categories function as “base level activities” present in nearly all households. The stable and important contribution of pensions to household income can also be observed elsewhere in the Central Asian region [6].
Among the household-specific variables, household assets (land and livestock) are associated with higher incomes, which confirms our expectations. In contrast, labor availability has no stable effect on household income, indicating that other factors (most likely availability of assets and non-farm job opportunities) limit income-earning activities. We find no influence of age and education of the household head on incomes, which may be due to the presence of many multi-generational households where, in many cases, the household head is not the main income-earner.
On location-specific variables we found no consistent influence of availability of pasture resources or remote location on household income except country-specific effects. This underlines the repeatedly reported influence of location variables on diversification [35], while theoretically-based influences of individual location characteristics are hard to identify empirically [20].
The influence of country-specific characteristics relating to socio-political factors are apparent in the profitability of activities, income level and composition. As many factors, including cultural, societal, policy and economic variables, can be causally related to the observed differences, we can only speculate on this. It may be that the most direct influences are exerted by framework conditions set by agricultural policy and different transition trajectories. The greater level of land fragmentation, lower agricultural production (as seen in the higher level of abandoned plots) as well as lower income levels in Georgia reported in agricultural policy assessments is also visible in the study villages [43,44]. Negative effects are most felt in mountainous remote locations, as in the study village Shakhvetila, which is characterized by particularly low household incomes, fewer non-farm job opportunities and high outmigration. Several steps have been taken by the Georgian government to improve the situation, e.g., a law to support high mountain regions with a number of benefits for residents, such as higher social allowances and tax exemptions [85], or a legislative framework for agricultural cooperatives [43,86,87]. In contrast, the performance of agriculture in Azerbaijan is strongly connected to the overall economic development related to oil and gas exploitation leading to boom and bust cycles in demand, price levels, investments and agricultural policy making [41]. Agricultural policies mainly aim at productivity improvements to enhance food self-sufficiency [41,42].
In addition, risk considerations may influence the choice of activities by households [18], especially in view of increasing risks from climate change [88]. In this study, we could not assess income risk, since we studied household incomes for one reference year only. Agricultural production is subject to a number of risks deriving from the natural environment (weather, pest infestations) and the market (price and selling risks) [89]. Non-farm wage income opportunities bear risks related to the general economic conditions. Studying risk decisions of the analyzed households might lead to additional insights but is subject to further research.
6. Conclusions
We analyzed household income data from smallholders in rural Azerbaijan and Georgia to investigate the extent of income diversification, the role of livestock keeping in diversification and the influence of household-specific and location-specific variables and diversification on household income.
Our results show that most households diversify their income sources, with the combination of crop and livestock income, with poultry keeping and social benefits being most widespread. Households with higher incomes tend to obtain a greater share of their income from non-farm activities, which leads to slightly decreasing diversification in income.
Besides agriculture, non-farm wage and social benefits, livestock keeping on common village pastures is an important component in the household income portfolio of the studied households. By providing access to pasture resources for every village household, common village pastures also provide poor households with an additional income source, which opens a way to achieve higher household incomes. However, proper management of common pastures is an important precondition for ensuring the further productivity and profitability of livestock keeping for smallholders.
Taking into account the context of often deficient rural infrastructure and services as well as outmigration of the younger section of the population, our results indicate that diversification is still the norm in rural regions in Azerbaijan and Georgia. However, agriculture cannot be the only income source to secure household income in rural regions. This applies in particular to livestock keeping since on limited village pastures, extending livestock cannot be a sustainable option for every livestock-keeping household. For enhancing rural household incomes and slowing down rural-urban migration, efforts to improve the agricultural policy framework according to country specific needs and the development of non-farm job opportunities are recommended. This is also likely to support the sustainable utilization of common village pastures by reducing pressure on their use.
Supplementary Materials
The following are available online at https://www.mdpi.com/2073-445X/9/8/267/s1, Supplementary Material S1: Questionnaire of the structured household survey, Supplementary Material S2–S18: Contribution margin and household income calculations, S19–S23: Household survey data, Supplementary Material S24–26: Supplementary results of regression analyses.
Author Contributions
Conceptualization, R.N., N.A. and V.B.; Data curation, R.N., N.A. and N.M.; Formal analysis, R.N., N.A. and N.M.; Funding acquisition, V.B.; Investigation, N.A. and N.M.; Methodology, N.A. and N.M.; Project administration, R.N., N.A. and A.D.; Resources, N.A., N.M. and A.D.; Software, R.N. and N.A.; Supervision, A.D. and V.B.; Validation, N.A., N.M. and A.D.; Visualization, R.N.; Writing—original draft, R.N. and N.A.; Writing—review & editing, R.N., N.A., N.M., A.D. and V.B. All authors have read and agreed to the published version of the manuscript. Authorship is limited to those who have contributed substantially to the work reported.
Funding
This study was prepared in the project “Collective action and conflict on common village pastures—Comparative case studies in Azerbaijan and Georgia” (Co4). Financial support was provided by Volkswagen Foundation (Grant number 88 504). We acknowledge support for the Article Processing Charge from the DFG (German Research Foundation, 393148499) and the Open Access Publication Fund of the University of Greifswald.
Acknowledgments
The study would not have been possible without the openness, support and hospitality of many people in the case study villages. Besides the authors, more colleagues contributed to the success of the project, particularly the PhD students M. Merabishvili, B. Imnadze, Z. Bregvadze, N. Mammadov and S. Quliev, but also translators and assistants. We also thank the partners at State Agricultural University of Azerbaijan, M. Huseynov and G. Mammadov, and at the Agricultural University of Georgia, T. Urushadze for their constant support of the project team.
Conflicts of Interest
The authors declare no conflict of interest.
References
- Schroth, G.; Ruf, F. Farmer strategies for tree crop diversification in the humid tropics. A review. Agron. Sustain. Dev. 2013, 34, 139–154. [Google Scholar] [CrossRef]
- Bojanic, A.; Ellis, F. Peasant Economics: Farm Households and Agrarian Development. Geogr. J. 1989, 155, 269. [Google Scholar] [CrossRef]
- Ellis, F.; Allison, E. Livelihood Diversification and Natural Resource Access; FAO: Rome, Italy, 2004. [Google Scholar]
- Kemkes, R.J. The role of natural capital in sustaining livelihoods in remote mountainous regions: The case of Upper Svaneti, Republic of Georgia. Ecol. Econ. 2015, 117, 22–31. [Google Scholar] [CrossRef]
- Heiny, J.; Mamniashvili, G.; Leonhaeuser, I.-U. The socioeconomic situation of private households in the Kazbegi region—First insights based on quantitative data. Ann. Agrar. Sci. 2017, 15, 31–39. [Google Scholar] [CrossRef]
- Hauck, M.; Artykbaeva, G.T.; Zozulya, T.N.; Dulamsuren, C. Pastoral livestock husbandry and rural livelihoods in the forest-steppe of east Kazakhstan. J. Arid Environ. 2016, 133, 102–111. [Google Scholar] [CrossRef]
- O’Hara, S.; Gentile, M. Household Incomes in Central Asia: The Case of Post-Soviet Kazakhstan. Eurasian Geogr. Econ. 2009, 50, 327–347. [Google Scholar] [CrossRef]
- Radvanyi, J.; Muduyev, S.S. Challenges Facing the Mountain Peoples of the Caucasus. Eurasian Geogr. Econ. 2007, 48, 157–177. [Google Scholar] [CrossRef]
- Mirzabaev, A.; Ahmed, M.; Werner, J.; Pender, J.; Louhaichi, M. Rangelands of Central Asia: Challenges and opportunities. J. Arid. Land 2015, 8, 93–108. [Google Scholar] [CrossRef] [Green Version]
- Lerman, Z. Agricultural Development in Central Asia: A Survey of Uzbekistan, 2007–2008. Eurasian Geogr. Econ. 2008, 49, 481–505. [Google Scholar] [CrossRef] [Green Version]
- Balcombe, K.; Davis, J.; Fraser, I.M. Livelihoods and farm efficiency in rural Georgia. Appl. Econ. 2005, 37, 1737–1745. [Google Scholar] [CrossRef]
- Atamanov, A.; Berg, M.V.D. Heterogeneous Effects of International Migration and Remittances on Crop Income: Evidence from the Kyrgyz Republic. World Dev. 2012, 40, 620–630. [Google Scholar] [CrossRef]
- Majekodunmi, A.O.; Dongkum, C.; Langs, T.; Shaw, A.; Welburn, S.C. Shifting livelihood strategies in northern Nigeria—Extensified production and livelihood diversification amongst Fulani pastoralists. Pastor. Res. Policy Pract. 2017, 7, 19. [Google Scholar] [CrossRef] [PubMed] [Green Version]
- Liao, C.; Barrett, C.B.; Kassam, K.-A. Does Diversification Improve Livelihoods? Pastoral Households in Xinjiang, China. Dev. Chang. 2015, 46, 1302–1330. [Google Scholar] [CrossRef]
- Gautam, Y.; Andersen, P. Rural livelihood diversification and household well-being: Insights from Humla, Nepal. J. Rural Stud. 2016, 44, 239–249. [Google Scholar] [CrossRef] [Green Version]
- Bobojonov, I.; Aw-Hassan, A. Impacts of climate change on farm income security in Central Asia: An integrated modeling approach. Agric. Ecosyst. Environ. 2014, 188, 245–255. [Google Scholar] [CrossRef]
- Lerman, Z.; Sedik, D. Agricultural Development and Household Incomes in Central Asia: A Survey of Tajikistan, 2003–2008. Eurasian Geogr. Econ. 2009, 50, 301–326. [Google Scholar] [CrossRef] [Green Version]
- Ellis, F. Household strategies and rural livelihood diversification. J. Dev. Stud. 1998, 35, 1–38. [Google Scholar] [CrossRef]
- Barrett, C.B.; Reardon, T.; Webb, P. Nonfarm income diversification and household livelihood strategies in rural Africa: Concepts, dynamics, and policy implications. Food Policy 2001, 26, 315–331. [Google Scholar] [CrossRef]
- Sarah, A.L.; Céline, B. Patterns and determinants of household income diversification in rural Senegal and Kenya. J. Poverty Alleviation Int. Dev. 2017, 8, 93–126. [Google Scholar]
- Gecho, Y. Rural Farm Households’ Income Diversification: The Case of Wolaita Zone, Southern Ethiopia. Soc. Sci. 2017, 6, 45. [Google Scholar] [CrossRef] [Green Version]
- Lazarus, B.N. A Study of Household Income Determinants and Income Inequality in the Tominian and Koutiala Zones of Mali. Master’s Thesis, Michigan State University, East Lansing, MI, USA, 2013. [Google Scholar]
- Wang, C.; Fuyuki, K. Determinants of Livelihood Diversification Strategies in Rural China: A Comparative Analysis. Jpn. J. Agric. Econ. 2020, 22, 83–88. [Google Scholar] [CrossRef]
- Anderzén, J.; Luna, A.G.; Luna-González, D.V.; Merrill, S.C.; Caswell, M.; Méndez, V.E.; Jonapá, R.H.; Cacho, M.M.Y.T.G. Effects of on-farm diversification strategies on smallholder coffee farmer food security and income sufficiency in Chiapas, Mexico. J. Rural Stud. 2020, 77, 33–46. [Google Scholar] [CrossRef]
- Yúnez-Naude, A.; Taylor, J.E. The Determinants of Nonfarm Activities and Incomes of Rural Households in Mexico, with Emphasis on Education. World Dev. 2001, 29, 561–572. [Google Scholar] [CrossRef]
- Salvioni, C.; Henke, R.; Vanni, F. The Impact of Non-Agricultural Diversification on Financial Performance: Evidence from Family Farms in Italy. Sustainability 2020, 12, 486. [Google Scholar] [CrossRef] [Green Version]
- Sabyrbekov, R. Income diversification strategies among pastoralists in Central Asia: Findings from Kyrgyzstan. Pastor. Res. Policy Pract. 2019, 9, 1–13. [Google Scholar] [CrossRef] [Green Version]
- Bigsten, A.; Tengstam, S. Smallholder Diversification and Income Growth in Zambia. J. Afr. Econ. 2011, 20, 781–822. [Google Scholar] [CrossRef]
- Marschke, M.J.; Berkes, F. Exploring Strategies that Build Livelihood Resilience: A Case from Cambodia. Ecol. Soc. 2006, 11, 11. [Google Scholar] [CrossRef] [Green Version]
- Babulo, B.; Muys, B.; Nega, F.; Tollens, E.; Nyssen, J.; Deckers, J.; Mathijs, E.E. Household livelihood strategies and forest dependence in the highlands of Tigray, Northern Ethiopia. Agric. Syst. 2008, 98, 147–155. [Google Scholar] [CrossRef]
- Kamanga, P.; Vedeld, P.; Sjaastad, E. Forest incomes and rural livelihoods in Chiradzulu District, Malawi. Ecol. Econ. 2009, 68, 613–624. [Google Scholar] [CrossRef]
- Tesfay, Y.; Roos, A.; Campbell, B.M.; Bohlin, F. Livelihood strategies and the role of forest income in participatory-managed forests of Dodola area in the bale highlands, southern Ethiopia. For. Policy Econ. 2011, 13, 258–265. [Google Scholar] [CrossRef]
- Shackleton, S.; Shackleton, C.; Shanley, P. Non-Timber Forest Products in the Global Context; Springer: Berlin/Heidelberg, Germany, 2011; p. 285. [Google Scholar]
- Lay, J.; Narloch, U.; Mahmoud, T.O. Shocks, Structural Change, and the Patterns of Income Diversification in Burkina Faso. Afr. Dev. Rev. 2009, 21, 36–58. [Google Scholar] [CrossRef]
- Abdulai, A.; CroleRees, A. Determinants of income diversification amongst rural households in Southern Mali. Food Policy 2001, 26, 437–452. [Google Scholar] [CrossRef]
- Lamers, J.P.; Bayverdiyeva, N.; Guliyeva, Y.; Djafarov, F. From kolchoz systems to fee-based private agricultural extension: Achievements with a client-oriented training and advisory concept as support for private farming in Azerbaijan. J. Appl. Biosci. 2008, 8, 262–271. [Google Scholar]
- Stadelbauer, J. Kolchozmärkte in der Sowjetunion: Geographische Studien zu Struktur, Tradition und Entwicklung des privaten Einzelhandels; Geographisches Institut der Johannes-Gutenberg-Universität: Mainz, Germany, 1991. [Google Scholar]
- Csaki, C.; Lerman, Z. Land reform and farm sector restructuring in the former socialist countries in Europe. Eur. Rev. Agric. Econ. 1994, 21, 553–576. [Google Scholar] [CrossRef]
- Didebulidze, A. Problems of traditional sheep farming in the mountain areas of eastern Georgia. Sci. Works Free Econ. Soc. 2013, 177, 6. [Google Scholar]
- Erjavec, E.; Volk, T.; Rac, I.; Kožar, M.; Pintar, M.; Rednak, M. Agricultural support in selected Eastern European and Eurasian countries. Post-Communist Econ. 2017, 29, 216–231. [Google Scholar] [CrossRef]
- Suleymanov, E.; Rahmanov, F.; Eminov, A. The impact of the oil price fluctuations on the agrarian policy in Azerbaijan. Acad. J. Econ. Stud. 2017, 3, 88–96. [Google Scholar]
- Sadigov, T. Adoption of agricultural innovations in Azerbaijan: No prospects for modernization. Cauc. Surv. 2017, 6, 42–61. [Google Scholar] [CrossRef]
- Echanove, J. The feasibility of averting collapse: The resurgence of Georgia’s agricultural sector. Cauc. Anal. Dig. 2016, 88, 2–5. [Google Scholar]
- Dadiani, L. How to handle food security in the light of agricultural development. A look at Georgia through the southern Caucasus. Cauc. Anal. Dig. 2016, 88, 12–14. [Google Scholar]
- Meskhia, I. Food security problems in post Soviet Georgia. Ann. Agrar. Sci. 2016, 14, 46–51. [Google Scholar] [CrossRef] [Green Version]
- Lerman, Z. The Impact of Land Reform on Rural Household Incomes in Transcaucasia. Eurasian Geogr. Econ. 2006, 47, 112–123. [Google Scholar] [CrossRef]
- Cabinet of Ministers of the Republic Azerbaijan. Strategic Roadmap for the Production and Processing of Agricultural Products in the Republic of Azerbaijan; Decree of the President of the Republic Azerbaijan: Baku, Azerbaijan, 2016; p. 177. [Google Scholar]
- Ministry of Environment Protection and Agriculture of Georgia. Agricultural and Rural Development Strategy (2021–2027); Ministry of Environment Protection and Agriculture of Georgia: Tbilisi, Georgia, 2019; p. 29. (In Georgian)
- State Statistical Committee of Azerbaijan. Statistical Information about Azerbaijan. Available online: https://www.stat.gov.az/?lang=en (accessed on 31 March 2020).
- National Statistics Office of Georgia. Statistical Information about Georgia. Available online: https://www.geostat.ge (accessed on 31 March 2020).
- Neudert, R. Pasture Use of Mobile Pastoralists in Azerbaijan under Institutional Economic, Farm Economic and Ecological Aspects. Available online: https://epub.ub.uni-greifswald.de/frontdoor/deliver/index/docId/1626/file/diss_neudert_regina.pdf (accessed on 10 August 2020).
- Didebulidze, A.; Plachter, H. Nature conservation aspects of pastoral farming in Georgia. In Pasture Landscapes and Nature Conservation; Springer Science and Business Media LLC: Berlin, Germany, 2002; pp. 87–105. [Google Scholar]
- Babayev, A.H. Struggle against desertification in Azerbaijan. South Cauc. Ann. Agrar. Sci. 2007, 5, 57–61. [Google Scholar]
- Didebulidze, A.; Tarkhan-Mouravi, G. Priorities for sustainable development of Georgian highlands. Ann. Agrar. Sci. 2011, 9, 153–157. [Google Scholar]
- Neudert, R.; Salzer, A.; Allahverdiyeva, N.; Etzold, J.; Beckmann, V. Archetypes of common village pasture problems in the South Caucasus: Insights from comparative case studies in Georgia and Azerbaijan. Ecol. Soc. 2019, 24, 24. [Google Scholar] [CrossRef] [Green Version]
- Neudert, R.; Theesfeld, I.; Didebulidze, A.; Allahverdiyeva, N.; Beckmann, V. Understanding causes of conflict over common village pastures—A comparative analysis of property rights in Azerbaijan and Georgia. Soc. Nat. Resour. 2020, 33, 347–367. [Google Scholar] [CrossRef]
- Stadelbauer, J. Bergnomaden und Yaylabauern in Kaukasien. Zur demographischen Entwicklung und zum sozioökonomischen Wandel bei ethnischen Gruppen mit nicht-stationärer Tierhaltung. Paideuma 1984, 30, 201–229. [Google Scholar]
- Allahverdiyeva, N.; Bregvadze, Z.; Didebulidze, A.; Guliev, S.; Imnadze, B.; Mammadov, N.; Merabishvili, M.; Neudert, R.; Rühs, M. Baseline Study of CO4 Project: Final Report; Agricultural University of Georgia: Athens, GA, USA; State Agrarian University of Azerbaijan and Greifswald University: Greifswald, Germany, 2015; p. 123. Available online: https://www.researchgate.net/publication/329269094_Baseline_Study_of_Co4_project_final_report (accessed on 10 August 2020).
- Benedetti, R.; Bee, M.; Espa, G.; Piersimoni, F. Agricultural Survey Methods; Wiley: Chichester, UK, 2010. [Google Scholar]
- Nuthall, P. Analysis of Farming Systems; CABI: Wallingford, CT, USA, 2011. [Google Scholar]
- Bailey, K.D. Methods of Social Research; The Free Press: New York, NY, USA, 1978. [Google Scholar]
- State Statistical Committee of Azerbaijan. Azerbaijan in Figures 2017; State Statistical Committee of Azerbaijan: Baku, Azerbaijan, 2017; p. 286.
- Agriculture of Georgia 2016; National Statistics Office of Georgia: Tbilisi, Georgia, 2017; p. 84.
- Kay, R.D.; Edwards, W.M.; Duffy, P.A. Farm Management; McGraw-Hill: New York, NY, USA, 2012. [Google Scholar]
- Kuhlmann, F. Betriebslehre der Agrar-und Ernährungswirtschaft DLG Verlag Frankfurt (M); DLG-Verlag: Frankfurt (M), Germany, 2003; p. 603. [Google Scholar]
- Mußhoff, O.; Hirschauer, N. Modernes Agrarmanagement; Franz Vahlen: München, Germany, 2011; p. 571. [Google Scholar]
- Schwetz, H. Einführung in das Quantitativ Orientierte Forschen Und Erste Analysen Mit Spss F19facultas; WUV: Wien, Austria, 2013. [Google Scholar]
- Franklin, M.; Graybeal, P.; Cooper, D. Principles of Accounting, Volume 2: Managerial Accounting; OpenStax, Rice University: Houston, TX, USA, 2019. [Google Scholar]
- Hirschman, A.O. The paternity of an index. Am. Econ. Rev. 1964, 54, 761–762. [Google Scholar]
- Chen, M.; Wichmann, B.; Luckert, M.; Winowiecki, L.; Förch, W.; Laderach, P. Diversification and intensification of agricultural adaptation from global to local scales. PLoS ONE 2018, 13, e0196392. [Google Scholar] [CrossRef]
- StataCorp. Stata Statistical Software: Release 15; Stata Corp LP: College Station, TX, USA, 2018. [Google Scholar]
- Dreger, C.; Kosfeld, R.; Eckey, H.-F. Ökonometrie; Springer Science and Business Media LLC: Berlin, Germany, 2014. [Google Scholar]
- StataCorp. Stata Reference Manual: Release 15; Stata Corp LP: College Station, TX, USA, 2018. [Google Scholar]
- Etea, B.G.; Zhou, D.; Abebe, K.A.; Sedebo, D.A. Is income diversification a means of survival or accumulation? Evidence from rural and semi-urban households in Ethiopia. Environ. Dev. Sustain. 2019, 22, 1–19. [Google Scholar] [CrossRef]
- Zhao, J.; Barry, P.J. Income Diversification of Rural Households in China. Can. J. Agric. Econ. Can. d’Agroecon. 2014, 62, 307–324. [Google Scholar] [CrossRef]
- Reardon, T.; Delgado, C.; Matlon, P. Determinants and effects of income diversification amongst farm households in Burkina Faso. J. Dev. Stud. 1992, 28, 264–296. [Google Scholar] [CrossRef] [Green Version]
- Dougherty, C. Introduction to Econometrics; Oxford University Press: New York, NY, USA, 2016; p. 590. [Google Scholar]
- Rapsomanikis, G. The Economic Lives of Smallholder Farmers; Food and Agriculture Organization of the United Nations: Rome, Italy, 2015. [Google Scholar]
- Dragne, G. Implications of land tenure on rural livelihoods—A case study from Shakhvetila, Georgia. Masters’ Thesis, Institute of Botany and Landscape Ecology, University of Greifswald, Greifswald, Germany, 2017. [Google Scholar]
- Radvanyi, J.; Thorez, P. La population et ses activités dans une haute vallée caucasienne: L’exemple du district de Kazbégui. Rev. Géogr. Alp. 1977, 65, 307–324. [Google Scholar] [CrossRef]
- Hardy, K.A.; Thevs, N.; Aliev, K.; Welp, M. Afforestation and Reforestation of Walnut Forests in Southern Kyrgyzstan: An Economic Perspective. Mt. Res. Dev. 2018, 38, 332–342. [Google Scholar] [CrossRef] [Green Version]
- Wollenberg, E.; Nawir, A.S. Estimating the incomes of people who depend on forests. In Incomes from the Forest; Wollenberg, E., Ingles, A., Eds.; CIFOR: Bogor, Indonesia, 1998; pp. 157–187. [Google Scholar]
- Allahverdiyeva, N. Wirtschaftliche Bewertung von Wanderschafhaltungsbetrieben in der Region Gandja-Gasach/Aserbaidschan: Status quo und Ableitung von Verbesserungspotentialen; Universität Kassel: Kassel, Germany, 2017. [Google Scholar]
- Paresishvili, O.; Kvaratskhelia, L.; Mirzaeva, V. Rural tourism as a promising trend of small business in Georgia: Topicality, capabilities, peculiarities. Ann. Agrar. Sci. 2017, 15, 344–348. [Google Scholar] [CrossRef]
- Parliament of Georgia. Law of Georgia on the Development of High Mountainous Regions; Legislative Herald of Georgia: Kutaisi, Georgia, 2013; No: 4036-RS. Available online: https://matsne.gov.ge/en/document/view/2924386?publication=0 (accessed on 10 August 2020).
- Parliament of Georgia. On Agricultural Cooperatives; No. 816-ES; Legislative Herald of Georgia: Kutaisi, Georgia, 2013. Available online: https://matsne.gov.ge/en/document/view/1972742?publication=3 (accessed on 10 August 2020).
- Lerman, Z.; Sedik, D. Cooperatives in the CIS and Georgia: Overview of Legislation; FAO Regional Office for Europe and Central Asia Policy Studies on Rural Transition: Rome, Italy, 2014; Available online: http://www.fao.org/3/CA1813EN/ca1813en.pdf (accessed on 10 August 2020).
- Ahouissoussi, N.; Neumann, J.E.; Srivastava, J.P. Building Resilience to Climate Change in South Caucasus Agriculture; International Bank for Reconstruction and Development/The World Bank: Washington, DC, USA, 2014; p. 167. [Google Scholar]
- Ullah, R.; Shivakoti, G.P.; Zulfiqar, F.; Iqbal, M.N.; Shah, A.A. Disaster risk management in agriculture: Tragedies of the smallholders. Nat. Hazards 2017, 29, 81–1375. [Google Scholar] [CrossRef]
Figure 1.
Map of the study area indicating the study villages in bold. Source: [55].
Figure 1.
Map of the study area indicating the study villages in bold. Source: [55].

Figure 2.
Age tree of the surveyed population in the Azerbaijani and Georgian study villages. Note: N = 1260, the x-axis depicts percentages of the surveyed population.
Figure 2.
Age tree of the surveyed population in the Azerbaijani and Georgian study villages. Note: N = 1260, the x-axis depicts percentages of the surveyed population.

Figure 3.
Household income and its composition in the case study villages (N = 303).

Figure 4.
Income quintiles of the surveyed households (N = 303).


Table 1.
Overview of sampled households in the case study villages.
| Item | Azerbaijani Villages | Georgian Villages | ||||
|---|---|---|---|---|---|---|
| Atabey | Keremli | Plankend | Shakhvetila | Gombori | Arashenda | |
| Total number of households | 186 | 97 | 276 | 89 | 655 1 | 720 1 |
| Permanently resident households | 117 1 | 80 1 | 221 1 | 85 2 | 285 2 | 355 1 |
| Households keeping livestock 3 | 97 | 69 | 168 | 83 | 150 | 78 |
| Sampled households of permanently resident households using common village pasture | 62 | 41 | 39 | 34 | 78 | 49 |
| Households interviewed to obtain cost-revenue data | 11 | 13 | 14 | 6 | 11 | 9 |
1: Data for community (Belediyye in Azerbaijan, Temi in Georgia) comprising several other villages in addition to case study village; 2: Data from district administrations. Some permanently resident households in Arashenda and Gombori do not engage in agriculture; 3: Own data collection.
Table 2.
Demographic information on the surveyed population.
| Item | Unit | Azerbaijani Villages | Georgian Villages | |||||||
|---|---|---|---|---|---|---|---|---|---|---|
| Village | Atabey | Keremli | Plankend | Average | Shakhvetila | Gombori | Arashenda | Average | ||
| Mean age | years | 33.0 (20.88) | 32.9 (21.22) | 34.6 (20.72) | 33.4 (20.93) | 46.7 (21.36) | 39.1 (23.05) | 42.0 (22.48) | 41.3 (22.72) | |
| Gender (Females) | % | 44.6 | 49.5 | 49.7 | 47.4 | 40.9 | 48.5 | 47.9 | 47.1 | |
| Household size | persons | 4.7 (1.88) | 5.2 (1.79) | 4.3 (1.51) | 4.8 (1.78) | 2.7 (1.28) | 3.8 (1.79) | 3.9 (1.67) | 3.6 (1.72) | |
| Economically active population (EAP) per household | persons | 3.4 (1.27) | 3.5 (1.31) | 3.3 (1.15) | 3.4 (1.24) | 2.3 (1.18) | 2.8 (1.29) | 2.7 (1.08) | 2.7 (1.22) | |
| Dependency ratio | % | 40.0 | 46.2 | 33.1 | 40.0 | 45.3 | 43.6 | 47.0 | 45.0 | |
| Education status | In education | % of EAP | 9.0 | 7.6 | 7.9 | 8.3 | 4.7 | 10.9 | 8.3 | 9.1 |
| Graduated from school | % of EAP | 75.2 | 67.6 | 77.2 | 73.4 | 57.8 | 53.1 | 34.1 | 47.7 | |
| Graduated from higher education | % of EAP | 15.7 | 24.8 | 15.0 | 18.3 | 37.5 | 36.0 | 57.6 | 43.2 | |
| Current activity | Agriculture | % of EAP | 62.9 | 48.3 | 65.4 | 59.1 | 76.6 | 65.4 | 63.6 | 66.6 |
| Public job or self-employment | % of EAP | 12.9 | 29.0 | 14.2 | 18.0 | 6.3 | 10.4 | 18.9 | 12.5 | |
| Searching for job | % of EAP | 6.7 | 2.8 | 0.8 | 3.9 | 4.7 | 6.2 | 1.5 | 4.4 | |
| Other | % of EAP | 17.6 | 20.0 | 19.7 | 18.9 | 12.5 | 18.0 | 15.9 | 16.5 | |
Notes: N = 1260; standard deviation in brackets. EAP: Economically active population (aged 15–64 years). Dependency ratio: calculated as the sum of the number of children <15 years and elderly >64 years divided by EAP. In education: school, vocational school, college or university. Higher education: vocational school, college or university. Other: pension, in education, disabled persons, soldiers.
Table 3.
Overview of income sources of surveyed households.
| Item | Unit | Azerbaijani Villages | Georgian Villages | ||||||
|---|---|---|---|---|---|---|---|---|---|
| Atabey | Keremli | Plankend | Average | Shakhvetila | Gombori | Arashenda | Average | ||
| Livestock keeping | % of households | 100 | 100 | 100 | 100 | 100 | 100 | 100 | 100 |
| Livestock units | 5.9 (8.05) | 10.0 (6.30) | 3.3 (4.92) | 6.4 (7.25) | 8.4 (8.24) | 4.3 (3.31) | 7.1 (12.66) | 6.04 (7.86) | |
| Sheep units | 44.8 (71.95) | 69.0 (44.91) | 25.6 (36.47) | 46.5 (58.64) | 40.0 (44.83) | 27.3 (22.90) | 44.3 (76.15) | 35.2 (49.67) | |
| Arable farming | % of households | 100 | 100 | 100 | 100 | 100 | 94 | 100 | 97 |
| Total area (ha) | 3.2 (2.06) | 2.8 (2.70) | 0.7 (0.59) | 2.4 (2.26) | 1.2 (0.65) | 1.5 (1.19) | 3.2 (4.65) | 1.9 (2.85) | |
| Crop area (ha) | 2.4 (1.44) | 1.8 (1.81) | 0.5 (0.54) | 1.7 (1.57) | 0.8 (0.51) | 0.6 (0.81) | 3.0 (4.40) | 1.4 (2.74) | |
| Crop species | 5.5 (3.40) | 7.0 (3.86) | 6.3 (3.72) | 6.2 (3.65) | 8.0 (2.94) | 6.6 (3.56) | 8.8 (3.06) | 7.6 (3.40) | |
| Use of fruits | % of households | 84 | 90 | 95 | 89 | 100 | 94 | 98 | 96 |
| Fruit species | 3.8 (1.65) | 4.9 (2.42) | 4.0 (1.77) | 4.2 (1.98) | 5.9 (2.57) | 4.7 (2.11) | 5.5 (2.43) | 5.2 (2.36) | |
| Poultry keeping | % of households | 95 | 95 | 97 | 96 | 76 | 83 | 96 | 86 |
| Heads | 16.0 (10.90) | 33.5 (27.18) | 14.9 (12.88) | 20.8 (19.31 | 14.4 (32.12) | 9.7 (7.19) | 34.2 (35.64) | 18.2 (23.79) | |
| Beekeeping | % of households | 23 | 27 | 13 | 21 | 29 | 8 | 10 | 13 |
| Beehives | 3.4 (3.61) | 3.3 (2.61) | 2.8 (1.30) | 3.3 (2.91) | 5.1 (3.11) | 3.0 (2.45) | 4.2 (2.39) | 4.3 (2.80) | |
| Social benefits | % of households | 48 | 68 | 62 | 58 | 56 | 60 | 59 | 59 |
| Number of social benefits income sources | 1.0 (0.00) | 1.1 (0.36) | 1.3 (0.46) | 1.1 (0.34) | 1.2 (0.37) | 1.0 (0.20) | 1.0 (0.19) | 1.1 (0.24) | |
| Non-farm work | % of households | 35 | 56 | 31 | 40 | 21 | 47 | 59 | 45 |
| Number of non-farm work income sources | 1.1 (0.35) | 1.3 (0.56) | 1.3 (0.45) | 1.2 (0.46) | 1.4 (0.53) | 1.4 (0.49) | 1.3 (0.47) | 1.4 (0.48) | |
Notes: N = 303; Table displays percentages of households and means. Standard deviation in brackets. Sheep unit (SU): 1 cattle = 6 SU,1 sheep = 1 SU, 1 goat = 0.6 SU,1 horse = 8 SU, 1 donkey = 5 SU [12] and own calculation.
Table 4.
Economic performance (Contribution Margin Ratios, CMRs) for agricultural activities. A higher CMR indicates a better economic performance.
Table 4.
Economic performance (Contribution Margin Ratios, CMRs) for agricultural activities. A higher CMR indicates a better economic performance.
| Activity | Unit | Azerbaijani Villages | Georgian Villages | ||||
|---|---|---|---|---|---|---|---|
| Atabey | Keremli | Plankend | Shakhvetila | Gombori | Arashenda | ||
| Cattle keeping | % | 58 | 51 | 54 | 59 | 65 | 64 |
| Sheep keeping | % | 66 | 62 | 72 | 62 | 62 | 64 |
| Goat keeping | % | 61 | 62 | 73 | 57 | 56 | 60 |
| Pig keeping | % | 44 | 49 | 49 | |||
| Chicken keeping | % | 38 | 43 | 44 | 48 | 48 | 48 |
| Goose keeping | % | 49 | 49 | 49 | |||
| Beekeeping | % | 71 | 73 | 63 | 76 | 75 | 78 |
| Potato production | % | 72 | 59 | 68 | 69 | 71 | 66 |
| Wheat production | % | 49 | 51 | 49 | 49 | 49 | |
| Raspberry production | % | 60 | |||||
| Grape production | % | 34 | 34 | ||||
| Hay meadow use | % | 38 | 20 | 30 | 23 | 23 | 23 |
Table 5.
Household income indicators, income composition and diversification.
| Country | Unit | Azerbaijani Villages | Georgian Villages | ||||||
|---|---|---|---|---|---|---|---|---|---|
| Village | Atabey | Keremli | Plankend | Average | Shakhvetila | Gombori | Arashenda | Average | |
| Household income | EUR/year | 6322.49 (3141.38) | 5644.36 (2907.97) | 3024.54 (1915.17) | 5220.92 (3094.63) | 3385.43 (2896.85) | 3405.98 (2485.19) | 5171.22 (3838.08) | 3938.89 (3129.05) |
| Income per person and month in EUR | EUR/person* month | 127.75 (80.78) | 103.03 (72.75) | 66.56 (56.91) | 103.81 (76.37) | 115.42 (92.09) | 98.95 (108.63) | 132.80 (104.10) | 112.73 (104.39) |
| Income per person and month in local currency | AZN or GEL/person*month | 242.56 (153.37) | 195.62 (138.12) | 126.37 (108.04) | 197.09 (145.01) | 323.90 (258.42) | 277.70 (304.86) | 372.67 (292.14) | 316.36 (292.94) |
| Thereof | |||||||||
| - Livestock | % | 17.02 (15.29) | 29.72 (14.50) | 19.56 (17.27) | 21.38 (16.45) | 48.80 (28.98) | 33.74 (26.69) | 20.20 (18.37) | 32.80 (26.85) |
| - Farming | % | 53.52 (24.03) | 22.84 (19.08) | 29.09 (22.86) | 37.95 (26.24) | 7.24 (17.08) | 7.28 (9.95) | 19.82 (17.86) | 11.09 (15.40) |
| - Poultry and bees | % | 2.47 (2.53) | 5.58 (6.96) | 6.44 (5.06) | 4.46 (5.16) | 10.69 (13.82) | 4.90 (6.95) | 8.58 (9.88) | 7.24 (9.88) |
| - Non-farm employment | % | 16.11 (24.57) | 26.35 (25.90) | 20.61 (32.22) | 20.30 (27.38) | 13.27 (27.71) | 36.15 (39.00) | 38.27 (34.36) | 31.96 (36.60) |
| - Social benefits | % | 10.89 (14.89) | 15.50 (14.27) | 24.30 (25.71) | 15.91 (19.04) | 20.01 (23.64) | 17.93 (21.34) | 13.13 (16.52) | 16.91 (20.57) |
| Diversification index | % | 0.36 (0.15) | 0.25 (0.14) | 0.36 (0.21) | 0.33 (0.17) | 0.44 (0.24) | 0.48 (0.25) | 0.34 (0.22) | 0.43 (0.25) |
Notes: N = 303, displayed are means, standard deviation in brackets.
Table 6.
Multiple linear regression models (OLS) with robust standard errors of influential variables on household income.
Table 6.
Multiple linear regression models (OLS) with robust standard errors of influential variables on household income.
| Item | Reduced Model 1 | Reduced Model 2 | Reduced Model 3 | Reduced Model 4 | Full Model 5 |
|---|---|---|---|---|---|
| Coeff (Robust Std. Err) | Coeff (Robust Std. Err) | Coeff (Robust Std. Err) | Coeff (Robust Std. Err) | Coeff (Robust Std. Err) | |
| Diversification | |||||
| Diversification Index (HHI) | 1953.515 (879.885) ** | 3759.287 (630.830) *** | 1869.966 (490.768) *** | 1826.749 (490.840) *** | 2144.088 (456.087) *** |
| Household assets | |||||
| Land area owned by household | 594.648 (99.429) *** | 510.692 (113.844) *** | 507.344 (116.943) *** | 467.195 (88.442) *** | |
| Livestock owned in livestock units | 165.423 (23.464) *** | 176.210 (21.560) *** | 176.948 (21.897) *** | 181.339 (20.739) *** | |
| Number of working age household members | 185.876 (101.477) * | 203.119 (76.849) *** | 183.953 (82.317) ** | 147.250 (70.745) ** | |
| Additional activity variables | |||||
| Presence of an off-farm income source (Dummy) | 3197.066 (199.724) *** | 3218.747 (205.020) *** | 3440.236 (175.192) *** | ||
| Presence of a social benefit income source (Dummy) | 952.805 (182.485) *** | 892.469 (185.472) *** | 1130.216 (160.907) *** | ||
| Semi-mobile livestock keeping (Dummy) | 395.202 (387.840) | 386.919 (379.029) | 10.414 (357.922) | ||
| Characteristics of household head | |||||
| Age of household head | 0.427 (6.285) | 5.180 (5.680) | |||
| Gender of household head | 459.774 (237.305) * | 227.623 (203.360) | |||
| Education of household head | −60.172 (40.783) | 0.427 (38.774) | |||
| Location variables | |||||
| Country (Dummy; Azerbaijan = 0; Georgia = 1) | −984.690 (192.467) *** | ||||
| Scarce pasture resources (Dummy; Plankend and Arashenda = 1) | 280.503 (187.979) | ||||
| Remote location (Dummy; Atabey and Shakhvetila = 1) | 1296.096 (204.758) *** | ||||
| Constant | 3791.800 (387.260) *** | 292.313 (395.560) | −886.073 (339.783) ** | −868.515 (578.578) | −1407.448 (545.651) ** |
| Model statistics | |||||
| Observations | 303 | 303 | 303 | 303 | 303 |
| Prob > F | 0.0272 | 0.0000 | 0.0000 | 0.0000 | 0.0000 |
| R-squared | 0.0186 | 0.5437 | 0.7761 | 0.7796 | 0.8398 |
Notes: N = 303, displayed are coefficients and robust standard errors. Significance levels: *: p < 0.1; **: p < 0.05; ***: p < 0.01, The HHI takes the value of 1 at maximum specialization and 0 at maximum diversification.
© 2020 by the authors. Licensee MDPI, Basel, Switzerland. This article is an open access article distributed under the terms and conditions of the Creative Commons Attribution (CC BY) license (http://creativecommons.org/licenses/by/4.0/).
Share and Cite
MDPI and ACS Style
Neudert, R.; Allahverdiyeva, N.; Mammadov, N.; Didebulidze, A.; Beckmann, V. Diversification of Livestock-Keeping Smallholders in Mountainous Rural Regions of Azerbaijan and Georgia. Land 2020, 9, 267. https://doi.org/10.3390/land9080267
AMA Style
Neudert R, Allahverdiyeva N, Mammadov N, Didebulidze A, Beckmann V. Diversification of Livestock-Keeping Smallholders in Mountainous Rural Regions of Azerbaijan and Georgia. Land. 2020; 9(8):267. https://doi.org/10.3390/land9080267
Chicago/Turabian StyleNeudert, Regina, Naiba Allahverdiyeva, Niyaz Mammadov, Alexandre Didebulidze, and Volker Beckmann. 2020. "Diversification of Livestock-Keeping Smallholders in Mountainous Rural Regions of Azerbaijan and Georgia" Land 9, no. 8: 267. https://doi.org/10.3390/land9080267
Note that from the first issue of 2016, this journal uses article numbers instead of page numbers. See further details here.