Article

Survey of Community Livelihoods and Landscape Change along the Nzhelele and Levuvhu River Catchments in Limpopo Province, South Africa

1
Future Earth and Ecosystems Services Research Group, Department of Urban and Regional Planning, Doornfontein Campus, University of Johannesburg, Beit Street, Doornfontein, Johannesburg 2028, Gauteng, South Africa
2
Institute of Land Surface System and Sustainable Development, Faculty of Geographical Science, Beijing Normal University, No. 19, XinJieKouWai St, HaiDian District, Beijing 100875, China
3
University of Chinese Academy of Sciences, Beijing 100049, China
4
Department of Urban and Regional Planning, School of Environmental Sciences, University of Venda, P/Bag X5050, Thohoyandou, Limpopo 0950, South Africa
5
Department of Crop Science, Faculty of Natural and Agricultural Sciences, North West University—Mafikeng Campus, Potchefstroom 2745, South Africa
6
State Key Laboratory of Remote Sensing Science, Institute of Remote Sensing and Digital Earth, Chinese Academy of Sciences, Beijing 100101, China
7
Department of Geography and Environmental Studies, Stellenbosch University, Matieland 7600, South Africa
8
Hope International, Harare 0000, Zimbabwe
9
Department of Geography, Environment and Energy Studies, University of Johannesburg, Johannesburg 2092, South Africa
*
Author to whom correspondence should be addressed.
Submission received: 3 January 2020 / Revised: 23 February 2020 / Accepted: 25 February 2020 / Published: 19 March 2020

Abstract

:
Landscape-change studies have attracted increasing interest because of their importance to land management and the sustainable livelihoods of rural communities. However, empirical studies on landscape change and its drivers are often poorly understood, particularly, in small rural communities in developing countries such as South Africa. The present study surveyed local community livelihoods and perceptions of landscape change in the Nzhelele and Levuvhu river catchments in Limpopo Province, South Africa. These areas have experienced land reform and are also characterized by environmental degradation, poverty, inequality and environmental justice concerns among other issues. Land-cover maps derived from Landsat satellite imagery were used for purposes of correlating and validating the survey data findings and results. The survey results showed that education levels, working status and marital status have statistically significant effects on community livelihoods (indicated by levels of income, p < 0.05). Maize, fruits and vegetables are the main cultivated crop varieties in the study area, and these crops are mainly used for subsistence to meet household self-consumption requirements. Moreover, local community members and stakeholders argue that the landscape has changed over the past 20 years mainly as a result of urban expansion, deforestation, agricultural diversification and forestry intensification. These landscape changes were largely confirmed by the land-cover change maps derived from satellite imagery. Soil erosion as a result of landscape changes was identified as a major threat and hazard in the study area. Political, natural, economic and cultural factors have been identified as the major underlying drivers for the observed landscape changes. These results have implications for understanding landscape change, coupled with human–nature relationships as well as informing government policy with respect to advancing land management and further promotion of the sustainable livelihoods of rural communities. Overall, the study proposes a multiple stakeholders’ approach and ecosystem-based approach to promote the sustainable management of landscapes in rural areas.

1. Introduction

Landscape is referred to as the prime sphere where the combined effects of society and nature become visible and the interactions between spatial patterns and ecological process are reflected [1]. Historically, landscapes have been shaped and maintained by human activities over generations including in recent millennia [2,3]. In the context of global environmental change, landscapes worldwide have experienced changes at increased magnitudes over the past decades [4] (partly due to urbanization, agricultural intensification etc.). Studies on the causes, dynamics and consequences of landscape change have attracted increasing interest because of their implications with respect to sustainable development, food security as well as livelihood systems and adaptation options [5].
The concept of drivers–pressures–state–impact–responses (DPSIR) has been widely used as a framework for understanding the causes, dynamics, and consequences of landscape change [3,6]. Among the causes of such changes are socioeconomic, political, technological, natural, and cultural reasons [7,8,9,10]. However, a comprehensive understanding of the drivers of these changes remains challenging, as it is difficult to quantify anthropogenic factors [3,6,11]. Moreover, landscape change often leads to a series of positive or negative feedback effects on both social and ecological systems, thus adding a further layer of complexity in quantifying the drivers of landscape changes in any area [12,13,14,15,16]. However, enhanced knowledge and understanding of the consequences of landscape change is fundamental for land administration and management. This is because such knowledge and understanding acts as a tool in clarifying ecological processes and impacts on socio-ecological systems, thereby providing valuable scientific indicators that can be used in suggesting steering mechanisms in the quest to achieve sustainable developmental goals (SDGs) [17,18].
The landscape sustainability notion and concept refer to the capacity of a landscape to consistently provide long-term, landscape-specific ecosystem services essential for maintaining and improving human well-being. This has recently been subjected to questioning with regards to the adequacy of the concept in fully unpacking the complex nature of landscape changes [19,20]. Therefore, it is at risk as a framework for studying and exploring landscape changes [21,22,23,24,25,26]. In South Africa, the reality of the growing demand for food amidst a background in which there is rapid population growth of approximately 2% per annum has raised the question of landscape changes in respect of food security and livelihoods high on the national agenda. This is because people in rural areas rely mainly on land and natural resources for their livelihoods. Achieving food security and guaranteeing livelihood security in the context of intensive farming, overharvesting, and land reform as factors that are driving landscape changes or even degradation becomes both an opportunity and challenge in land administration and management [27,28,29,30]. These issues collectively become very concerning taking into account that soil erosion is also considered as a pernicious threat to land productivity and water resources in South Africa [31,32,33,34]. However, the paradox is that empirical studies on landscape change, drivers and consequences highlight how these matters are often particularly poorly understood in small rural communities of South Africa. Therefore, this justifies the need to focus on promoting the sustainable management of landscapes in rural areas.
Traditionally, studies on landscape changes usually focus on the change in spatial patterns based on multi-temporal satellite imagery with little consideration of the local community’s perceptions [35,36,37]. This is despite the fact that humans actually respond to landscape changes, which acts, and impact on socio-ecological systems. Consequently, combining cartographic studies and social research methods leads to better comprehension of landscape change [38]. The effects of human behavior on landscapes can be influenced by the community perception of landscape change [39,40]. For example, human beings can modify nature through overharvesting natural resources (e.g., because of agricultural expansion, deforestation, water extraction etc.). These consequences are a manifestation of the need for survival and development by a community. In this livelihoods interplay set-up, it is not uncommon for negative environmental issues and outcomes to emerge that threaten rural livelihoods [41]. This is despite concerted attempts by human beings to promote environmental protection and ecological restoration through behavioral stimuli aimed at rational actions and interventions [42,43]. Hypothetically, in order to unify nature and human interactions, it is important to synthesize local community perceptions of landscape change and its drivers with the broader sustainable environmental planning and management requirements [41,44,45,46,47,48,49]. Therefore, a study that investigates landscape changes and the possible drivers and effects from the perspective of socio-psychological or community perception is particularly desirable in South Africa.
The present study, consequently, surveyed local community livelihoods and perceptions on landscape change in the Nzhelele and Levuvhu river catchments in Limpopo province, South Africa. Our study has the following specific objectives: (1) to survey local community livelihoods; (2) to learn about the perceptions of local communities to landscape change including identifying the drivers for such change and comparing these results with land-cover maps derived from satellite imagery; (3) to understand the ecosystem services provided by nature and (4), to glean the impacts of climate change on landscape, ecosystem services and livelihoods. By this, we aimed to identify knowledge gaps on how local community perceptions contributes to the understanding and management of landscape change for rural land-use planning and administration.

2. Materials and Methods

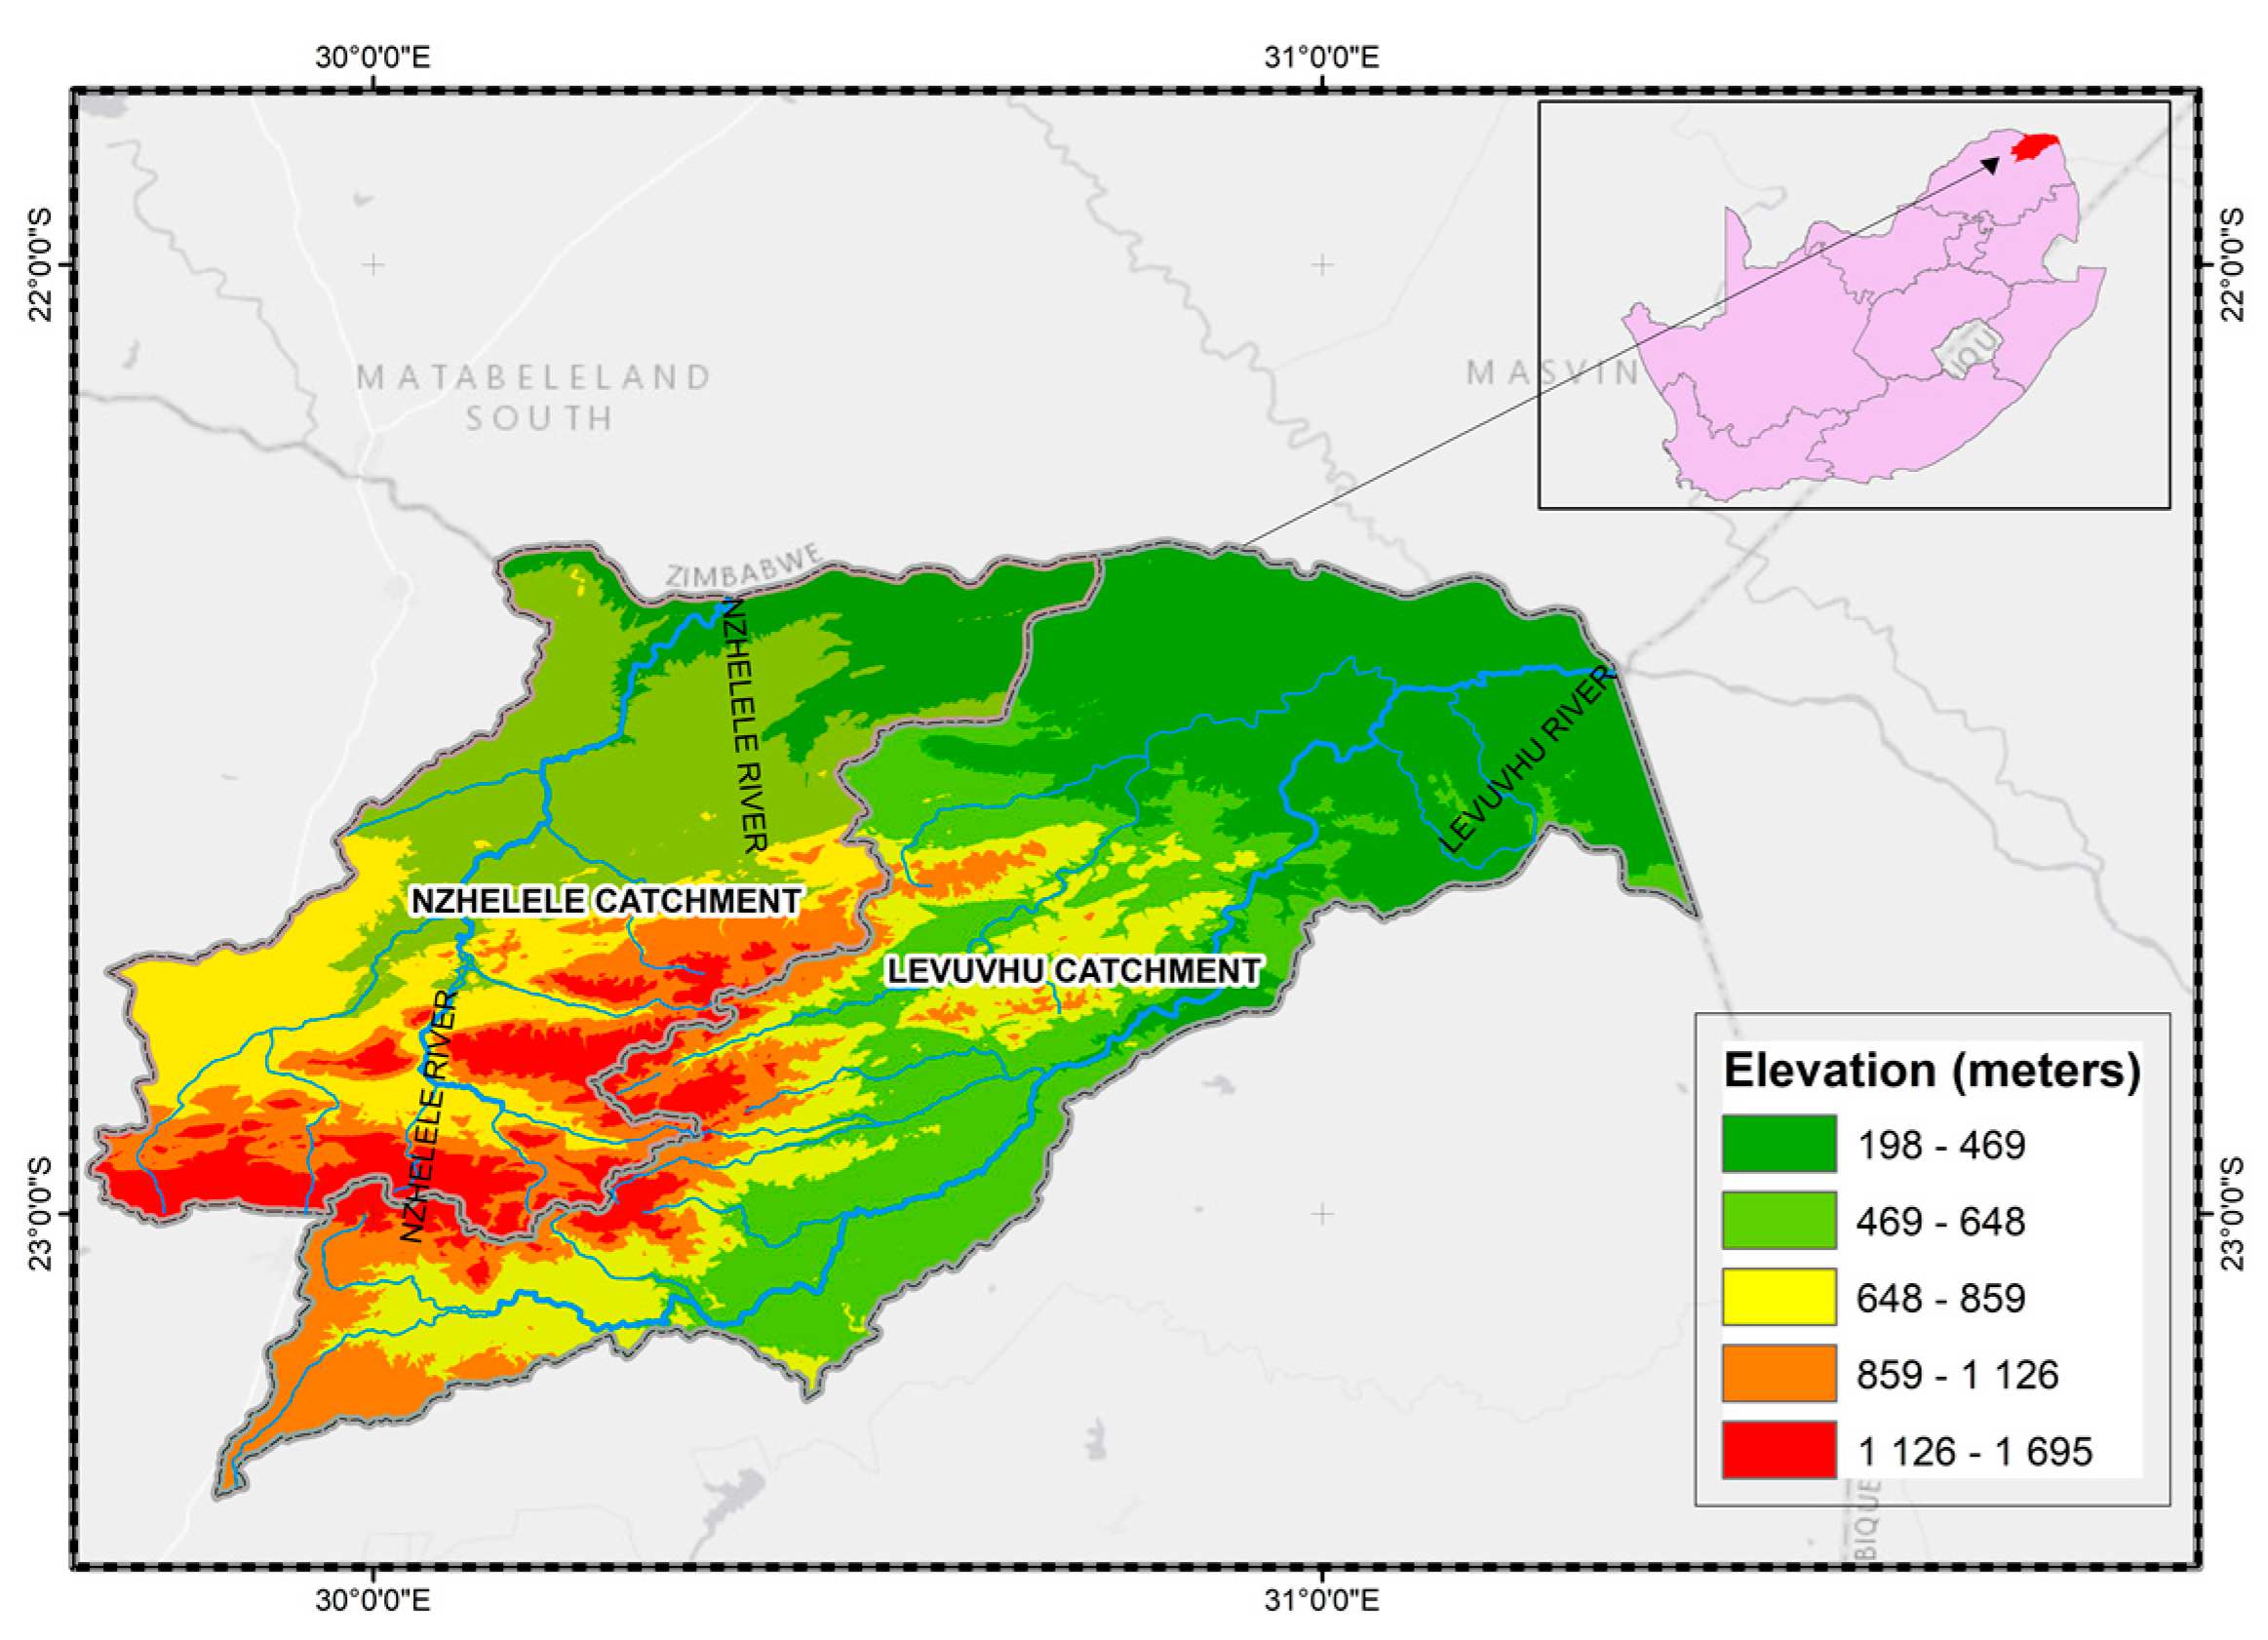
2.1. Site Selection and Sampling Procedures

The data collection was conducted in Nzhelele and Levuvhu river catchments in Limpopo province, which is located in the northern tip of South Africa (refer to Figure 1). The Nzhelele and Levuvhu river catchments were specifically selected because of their significant agricultural and economic importance and because they have experienced land reform and agricultural expansion leading to landscape changes [32,50]. Thus, the study area is a very typical and representative example for investigating landscape change and its drivers in South Africa.
The data was obtained by making use of a household survey. Before this, we consulted with the local chief and headman who gave us approval to conduct the survey in the Nzhelele and Levuvhu catchments. During the data collection, we were always in the company of a local and community stakeholder. The questionnaire was designed and piloted in April 2019, and adjustments were based on feedback from the pilot tests. Face-to-face questionnaire interviews were conducted with 160 randomly selected people during July 2019. Ninety-one females (57%) and 69 males (43%) with ages ranging from 18 years to above 60 years took part in the survey. From the Levuvhu catchment, we selected households in the Mulenzhe, Tshakhuma, Ha-Peitboy and Mutele communities and surrounding areas whereas for the Nzhelele we sampled the Musekwa, Ha-Mandiwana, Ha-Rabali communities and surrounding areas. Ninety respondents were selected from the Levuvhu catchment and 70 from the Nzhelele catchment. In collecting data, we were assisted by a community gatekeeper who would explain the aims and objectives to potential respondents so that we could identify the respondents with knowledge on the four themes of our study namely, livelihoods, landscape change, ecosystem services and climate change in the area. Hence conducting of the interview would only commence when a potential respondent would confirm their knowledge on the themes of the study. Ten local research assistants were recruited and trained, and they assisted in collecting the data since the questions were asked in Venda, the local vernacular language to glean better information. The research assistants would explain what livelihoods, landscape change and its drivers, ecosystem services and climate change are, to foster better comprehension by the respondents. Furthermore, the assistants would give examples when explaining the various themes. Before the survey was carried out, ethical clearance, community approval and informed consent forms were secured from the respondents. In addition, all respondents were informed that the research was an academic project, and that information they gave would be kept confidential and anonymous at all times. The interview questionnaire contained items in which respondents were asked about their demographic and socio-economic characteristics, livelihoods and their perceptions on landscape change and its drivers. They were also questioned about climate change and its impacts, the availability and quality of ecosystem services, their views on soil erosion, and local people’s willingness to participate in initiatives to mitigate and combat negative landscape changes in their areas. Completing the 33 questions in the questionnaire took on average 30 minutes with each respondent.

2.2. Statistical Analysis

All statistical analysis was performed in SPSS 19.0 software. We assumed income as a measure of livelihood. Data were subjected to both analysis of variance (ANOVA) and descriptive statistical analyses. Where ANOVA showed significant differences, means were separated by Tukey’s honestly significant difference (HSD) test at 5% significance level. ANOVA was used to detect significant differences in income between males and females, and amongst different age groups, marital status, working status and educational levels [51,52].

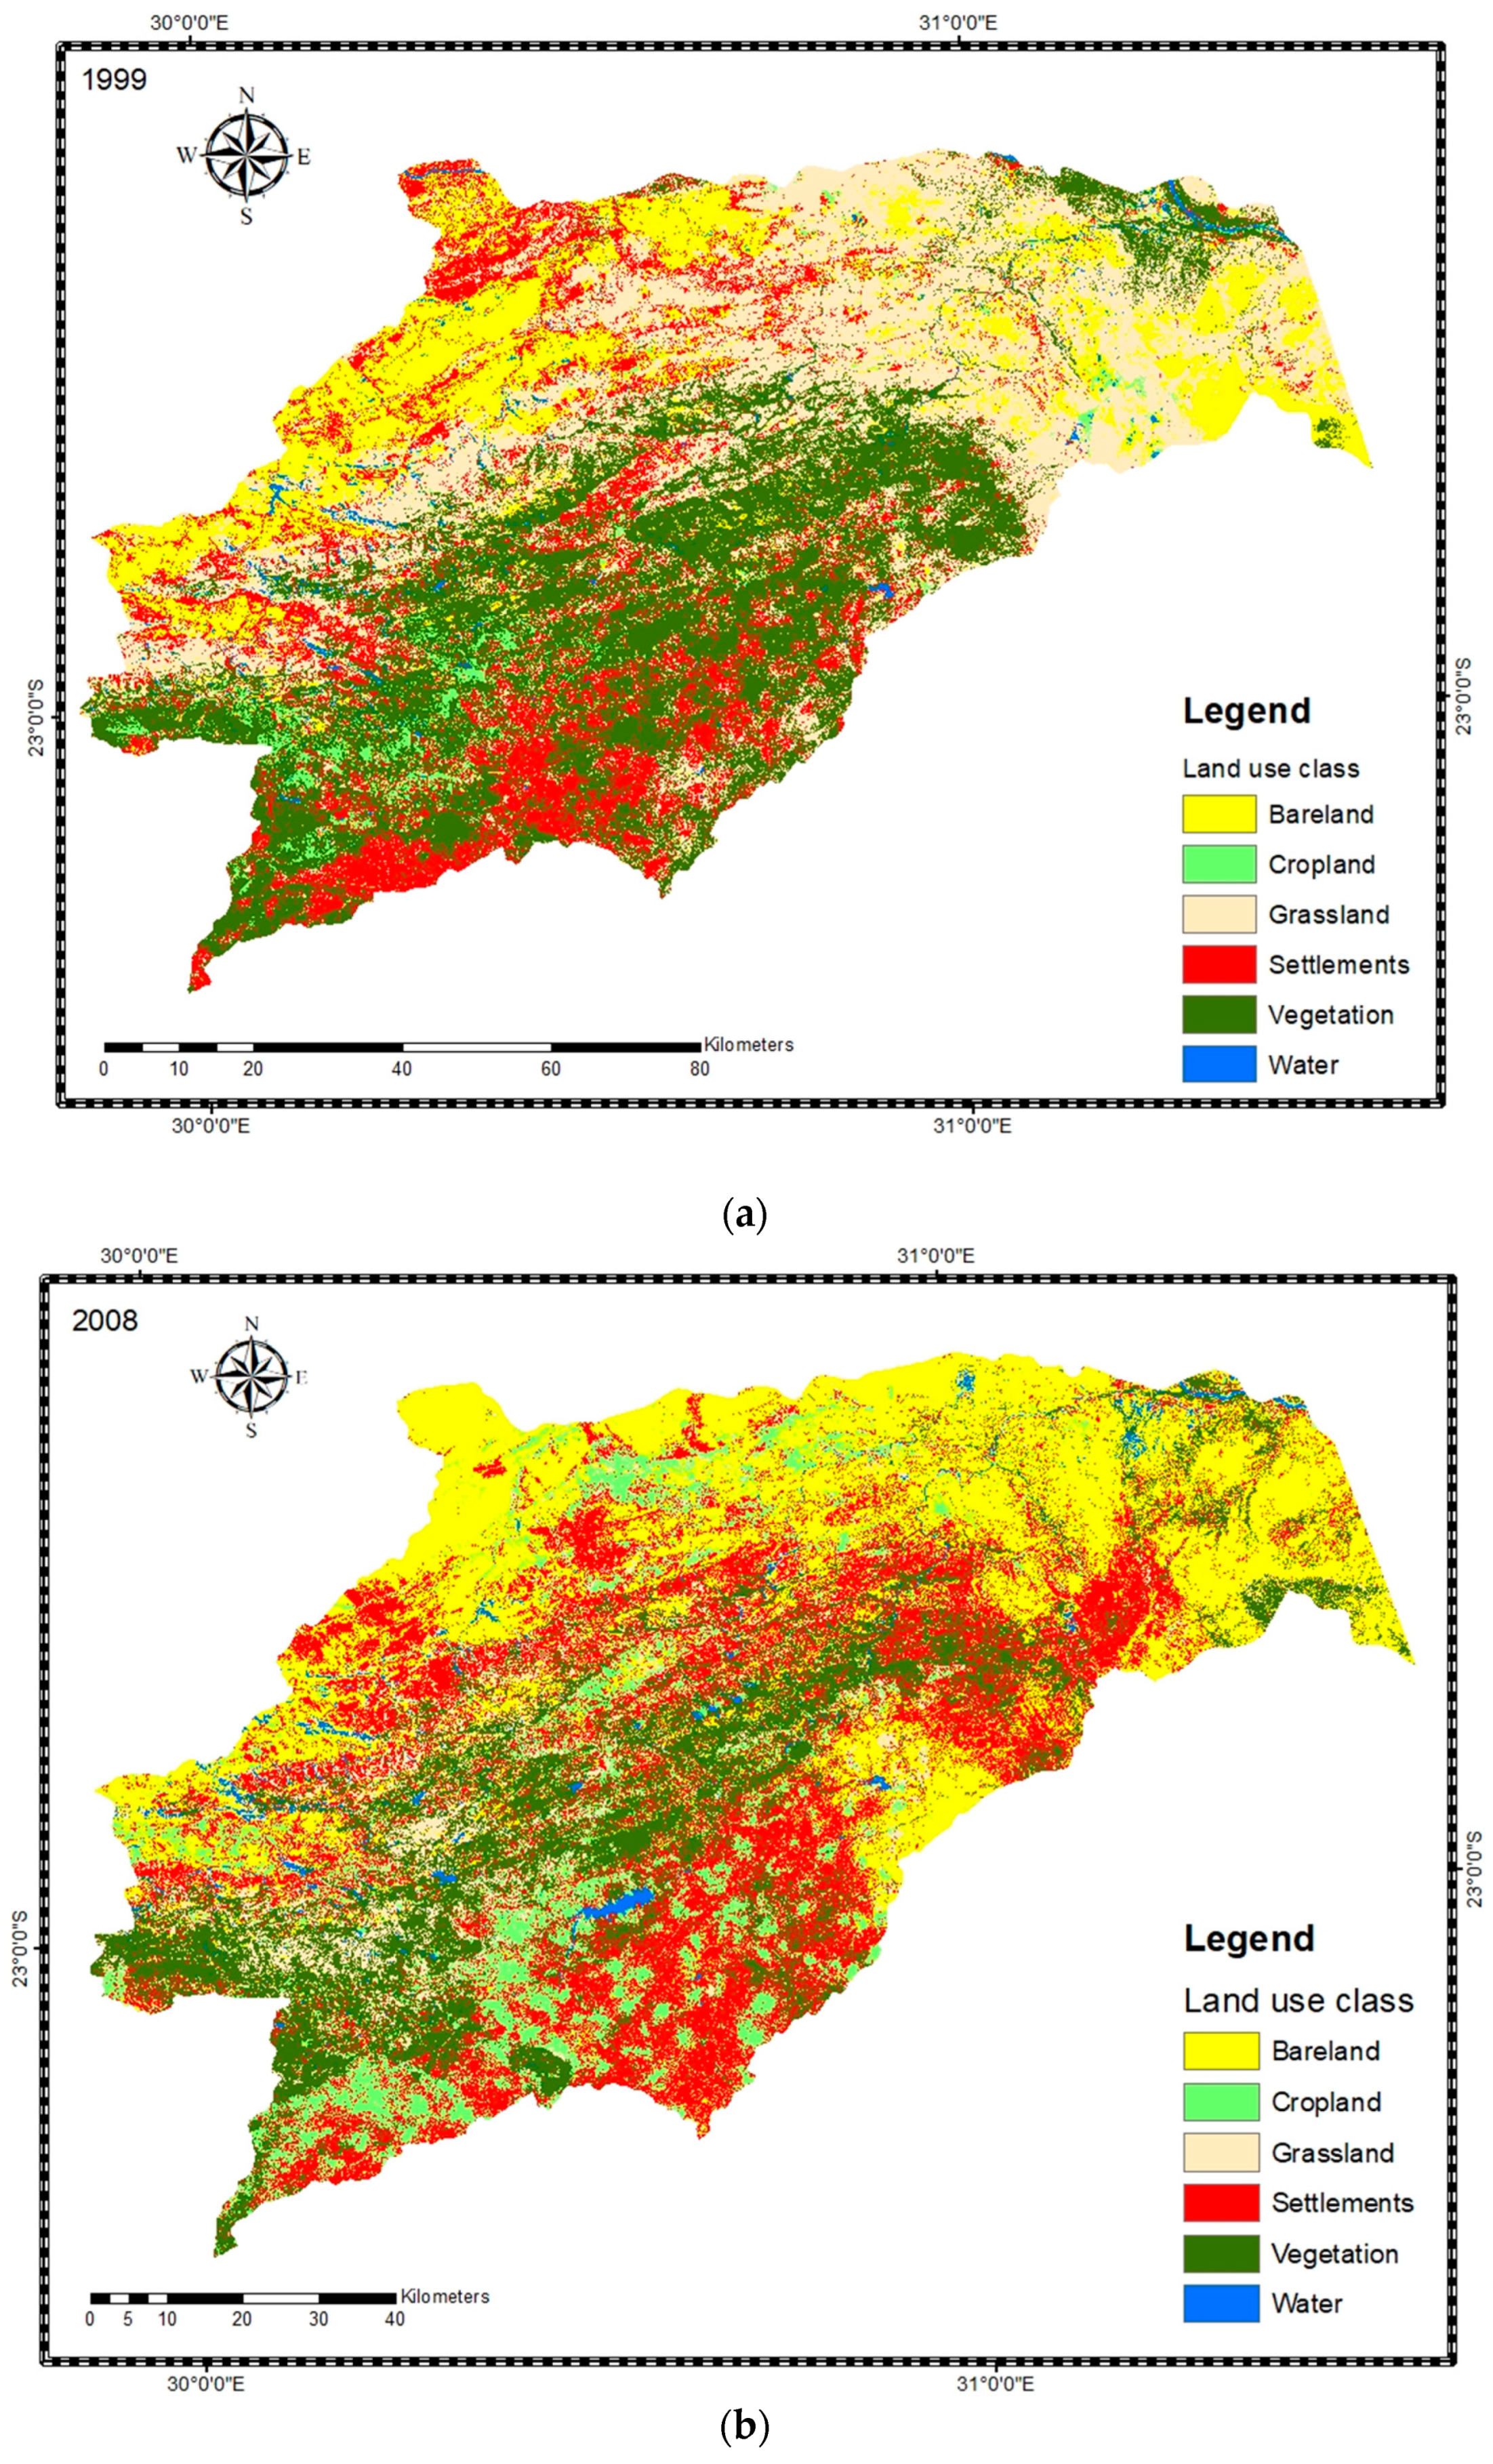
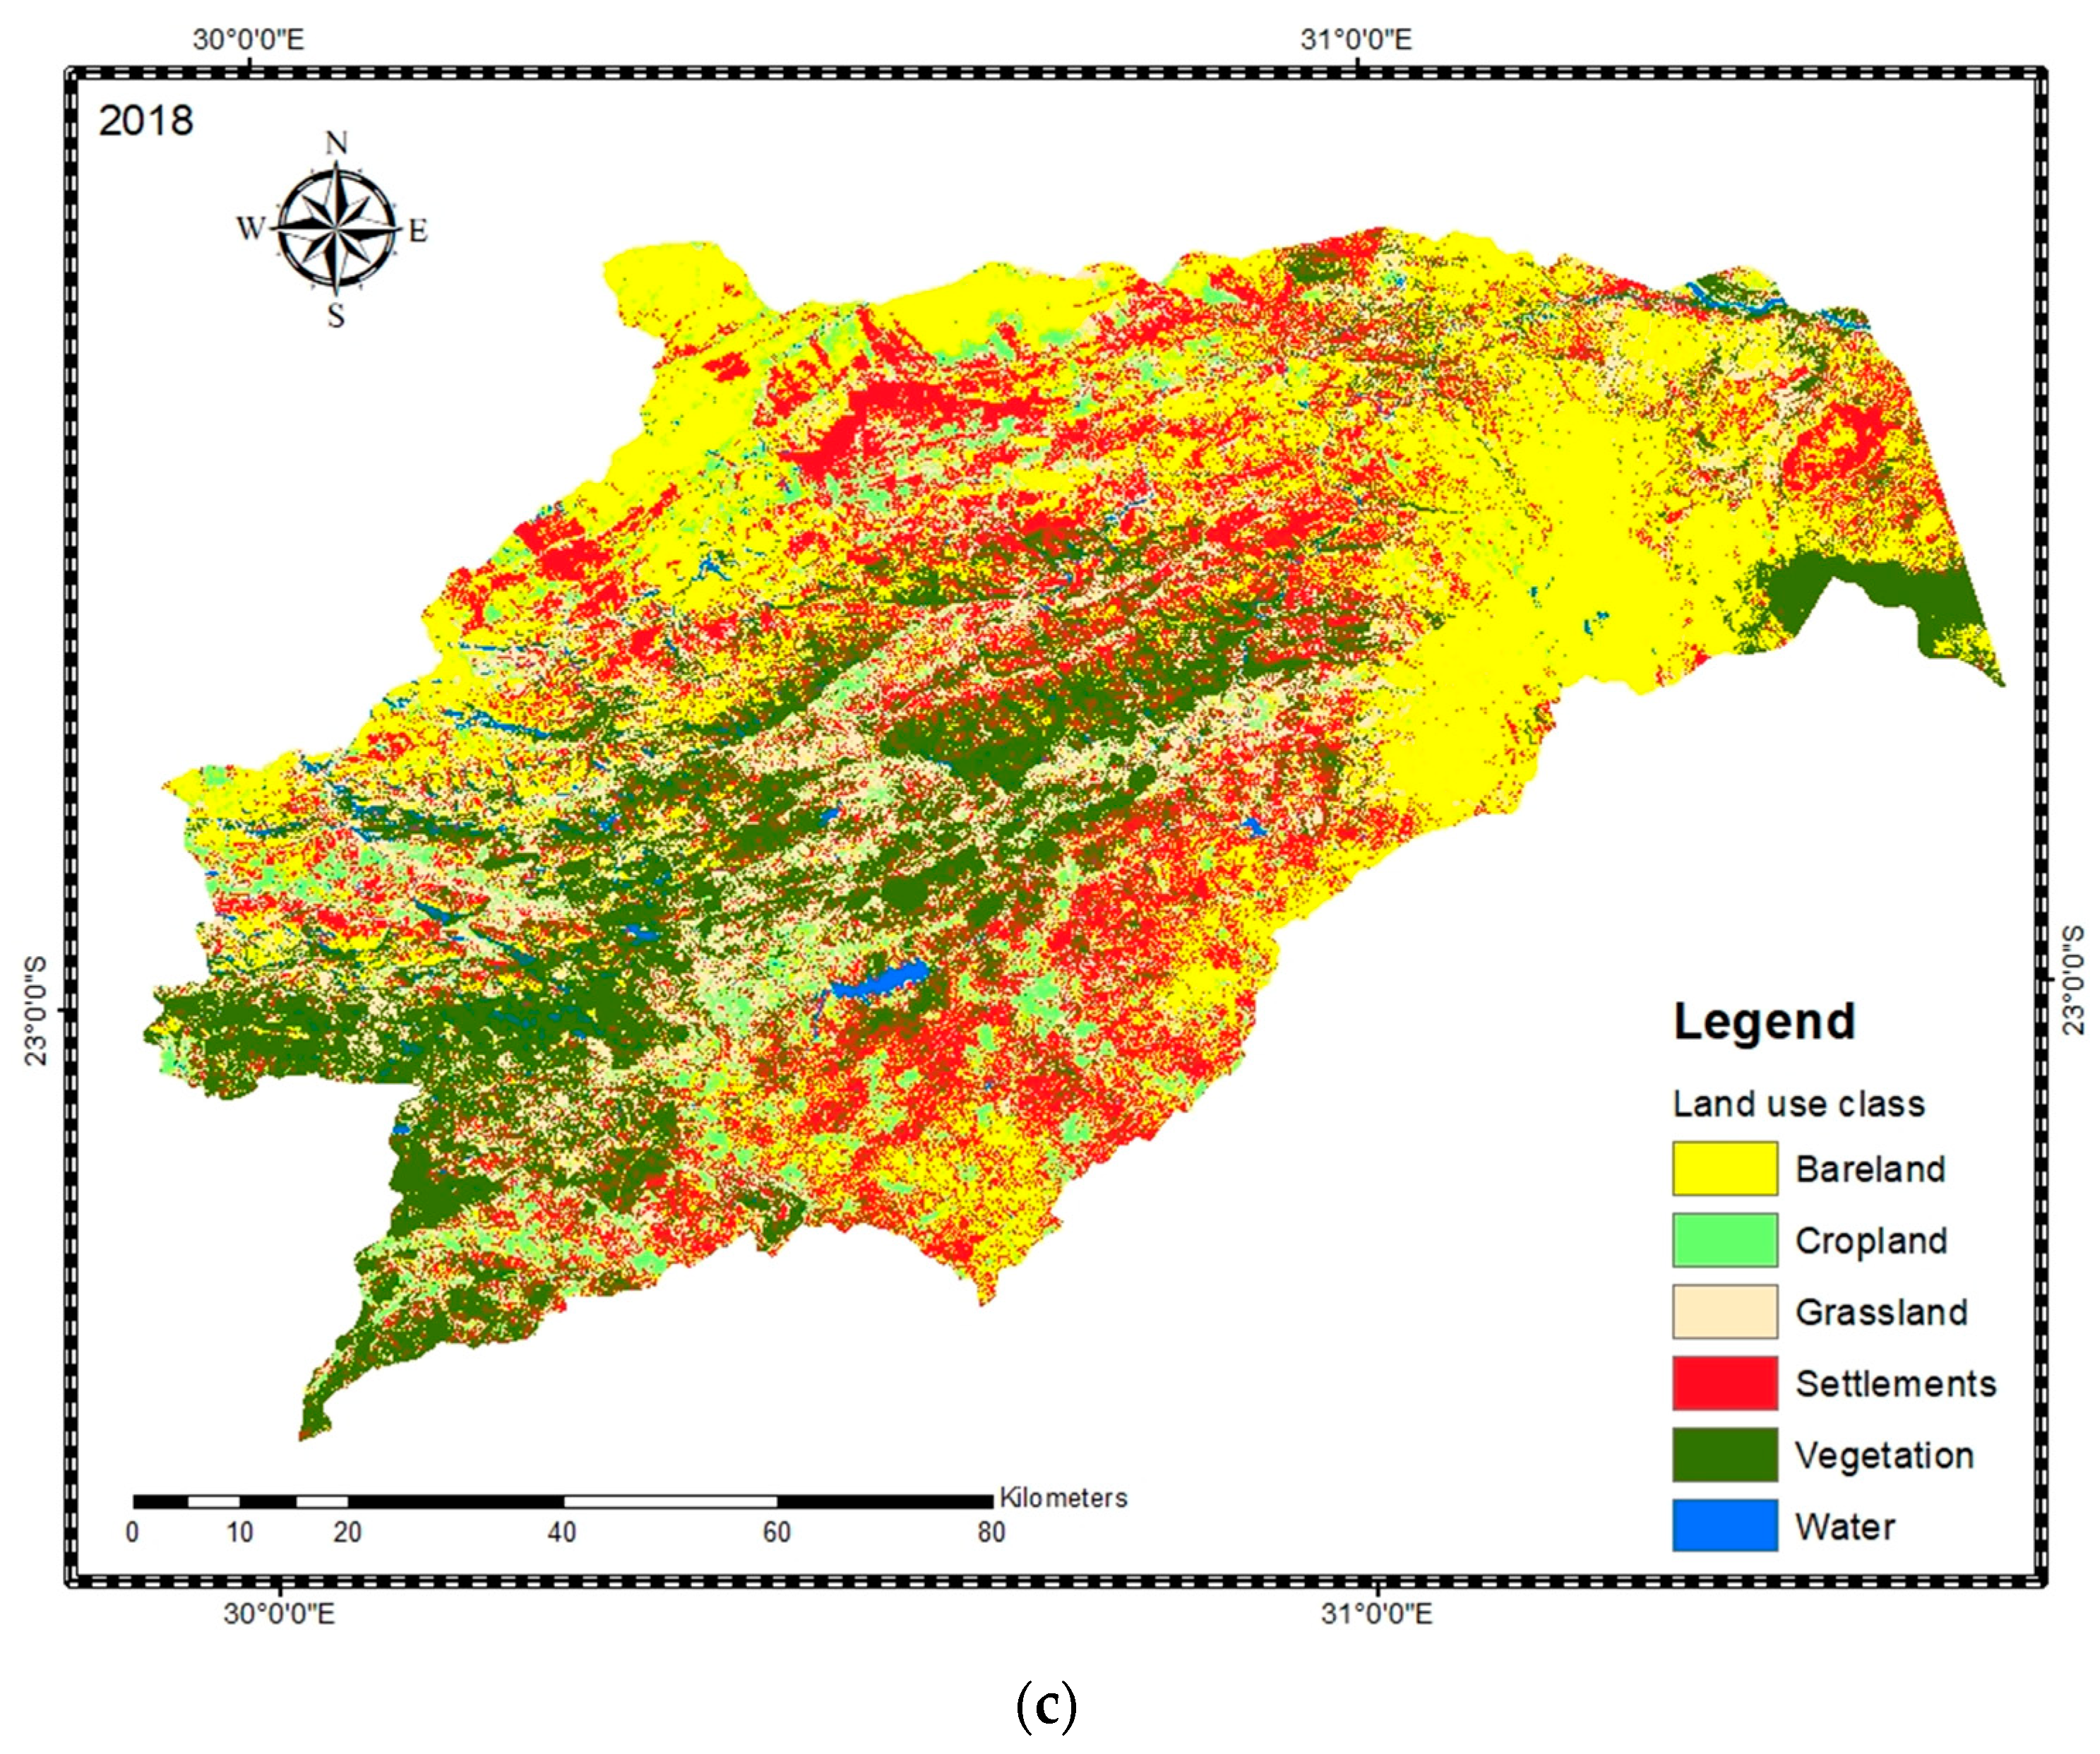
2.3. Land-Cover Mapping and Analysis

Landsat 6 and Landsat 8 satellite imagery for 1999, 2008 and 2018 were obtained from The United States Geological Survey (USGS). Landsat was chosen because it is the satellite with the longest earth observing history. The satellite images were ortho-rectified and subjected to atmospheric and radiometric corrections using ArcGIS 10.5 from the Environmental Systems Research Institute (ESRI), Redlands, California, United States of America (USA) [53,54]. Land cover for both images was classified and quantified using a pixel-based random forest supervised classification in ArcGIS 10.5. Random forest was chosen because it is robust, efficient, and produces better results as demonstrated in other studies [53,54]. Training samples were used to train the images for classification. The images were classified into six land-use types namely: water, bare land, vegetation, settlements, grassland and cropland. The classification was verified by extensive field visits and the use of Google Earth from Google, Alphabet Inc, Mountain View, California, USA [55]. The overall accuracy of the classification was 82%, with a producer accuracy of 84% and a user accuracy of 81%.
After the land-cover mapping, the following step was calculating the landscape change index (LCI) [38,56,57,58]. To do this we had to calculate the transformation of each land-cover type in percentages as shown in Equation (1) below:
CA = 100 × (At+1 − At)/TA
wherein CAi signifies changes in percentage share of areas covered by each land-cover class in relation to the total study area (%); At+1 is the area covered with each type of land cover during the time interval t + 1 (ha); At represents the area covered with each type of land cover during the time interval t (ha); and TA represents the total study area (ha). The CA enabled us to compute the landscape change index for each time-period. The LCI shows the absolute change for each land cover type during separate time intervals [58]. The LCI was calculated by multiplying a factor of one-half by the sum of the absolute values of change in percentage share of areas covered by each land-type cover in relation to the whole analyzed for each period of time. The formula for LCI is given below [38,56,57]:
LCI = 1 2 × i = 1 n | CA i |
wherein LCIt is the landscape change index at a given time period; and |CAi| signifies changes in percentage share of areas covered by each land-cover class in relation to the total area of study area.

3. Results and Discussion

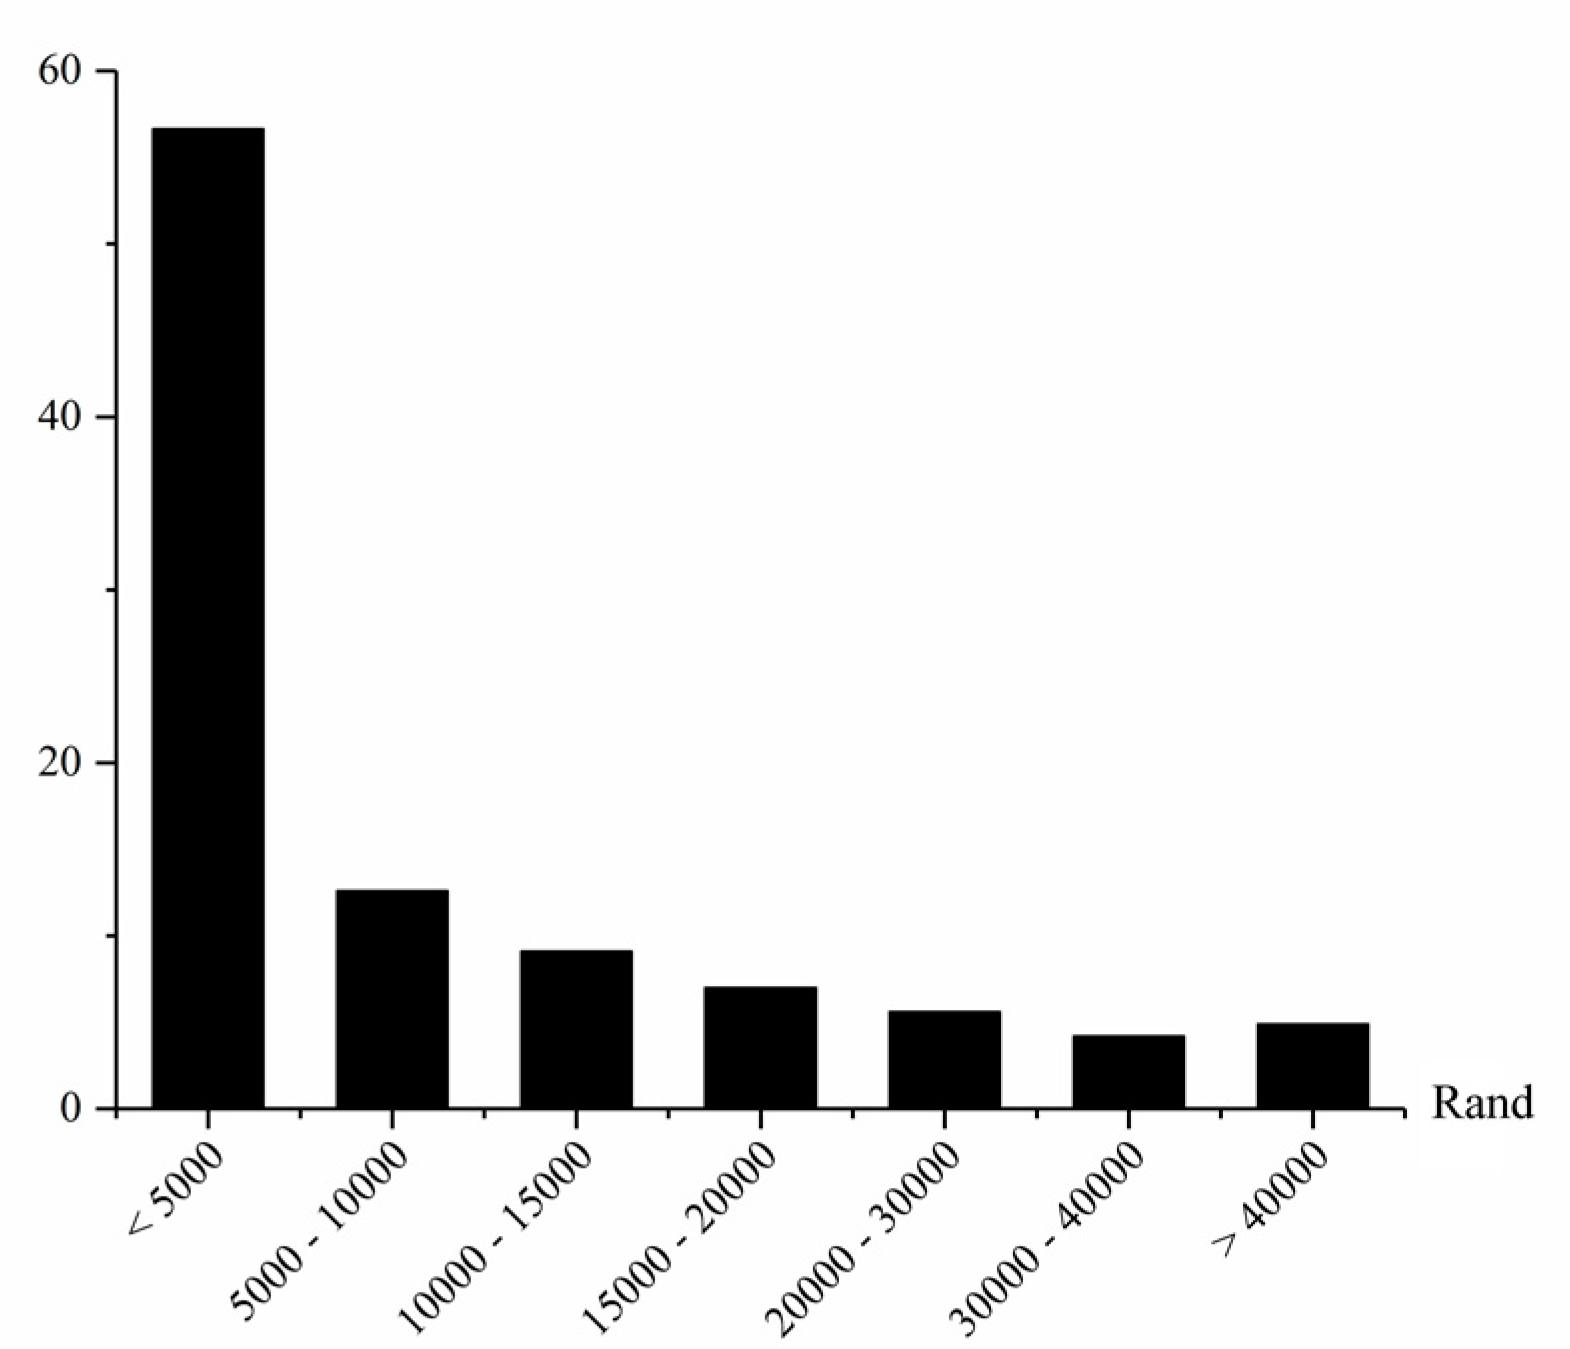
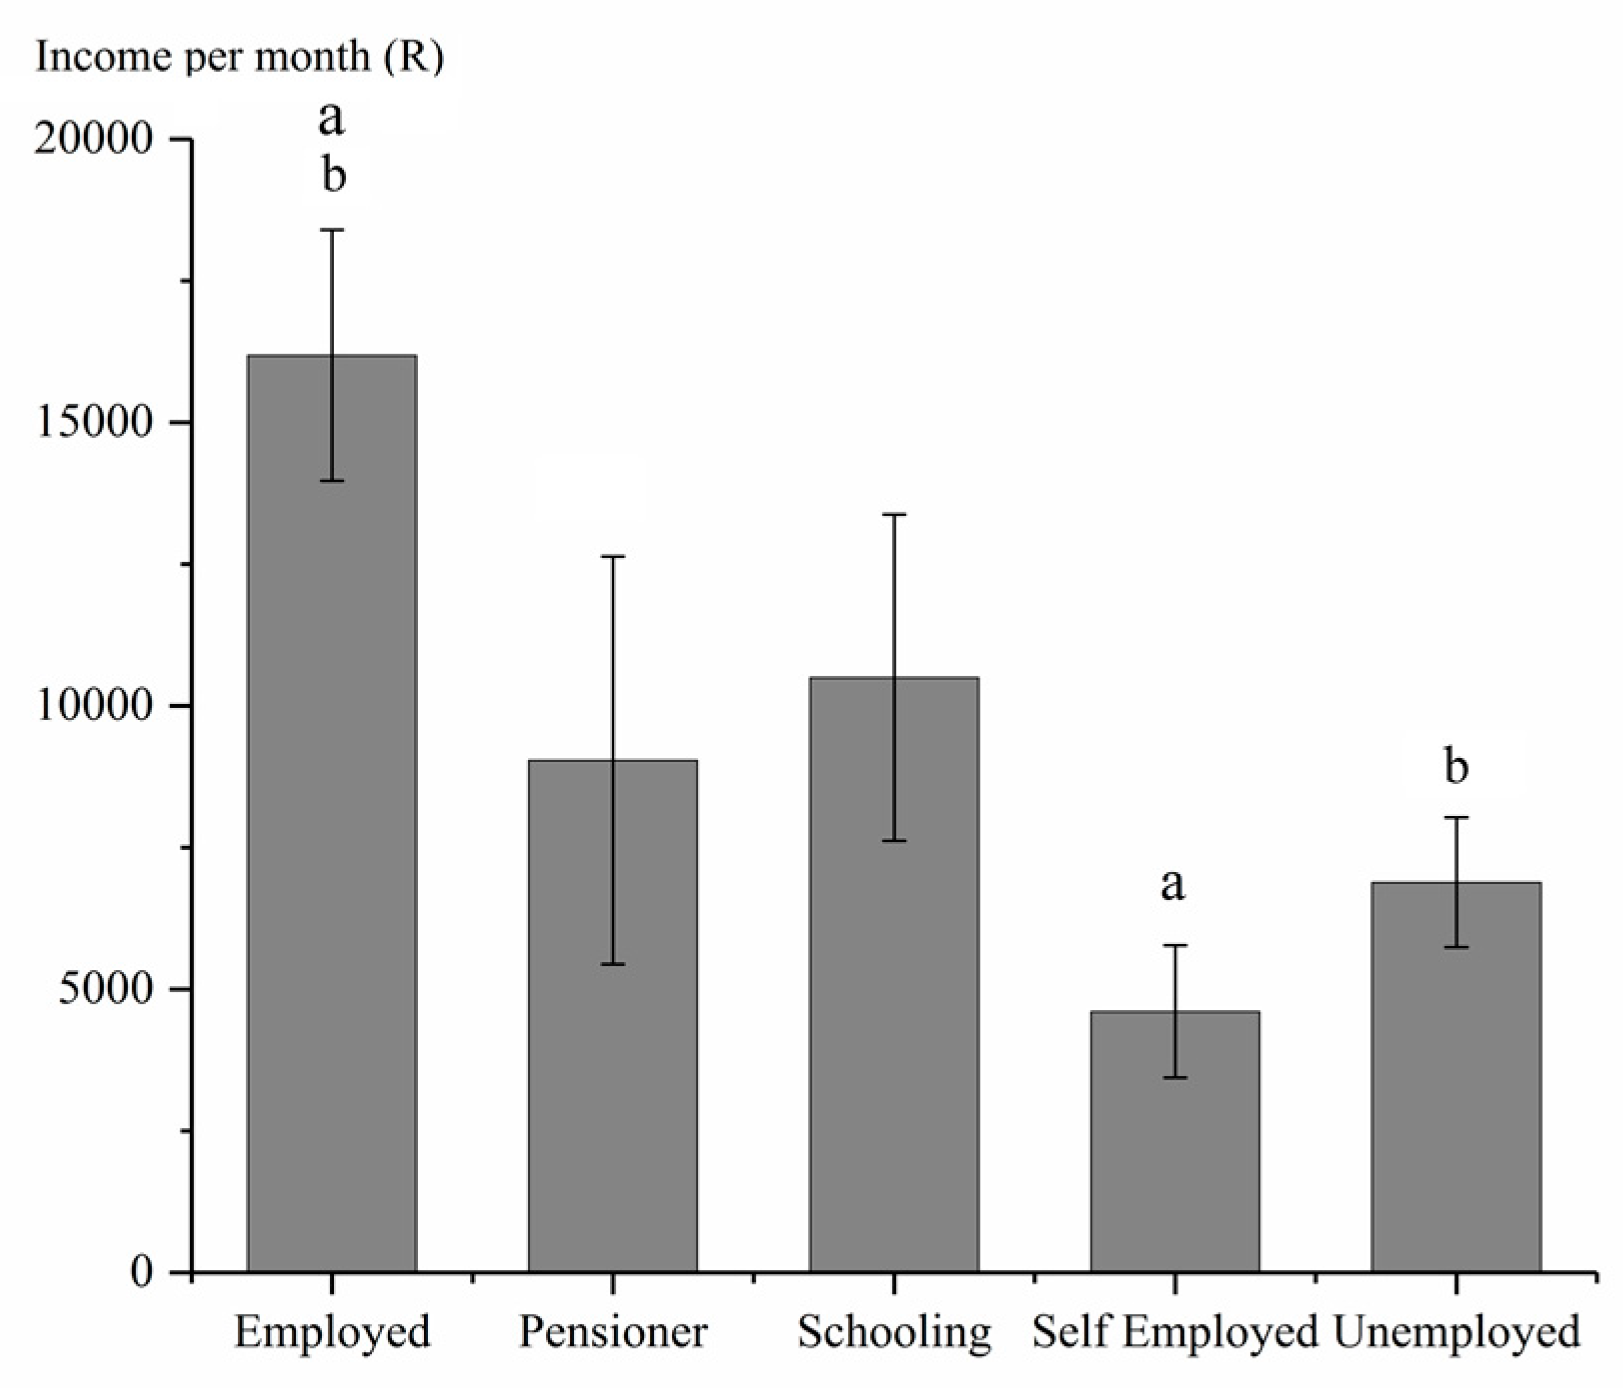
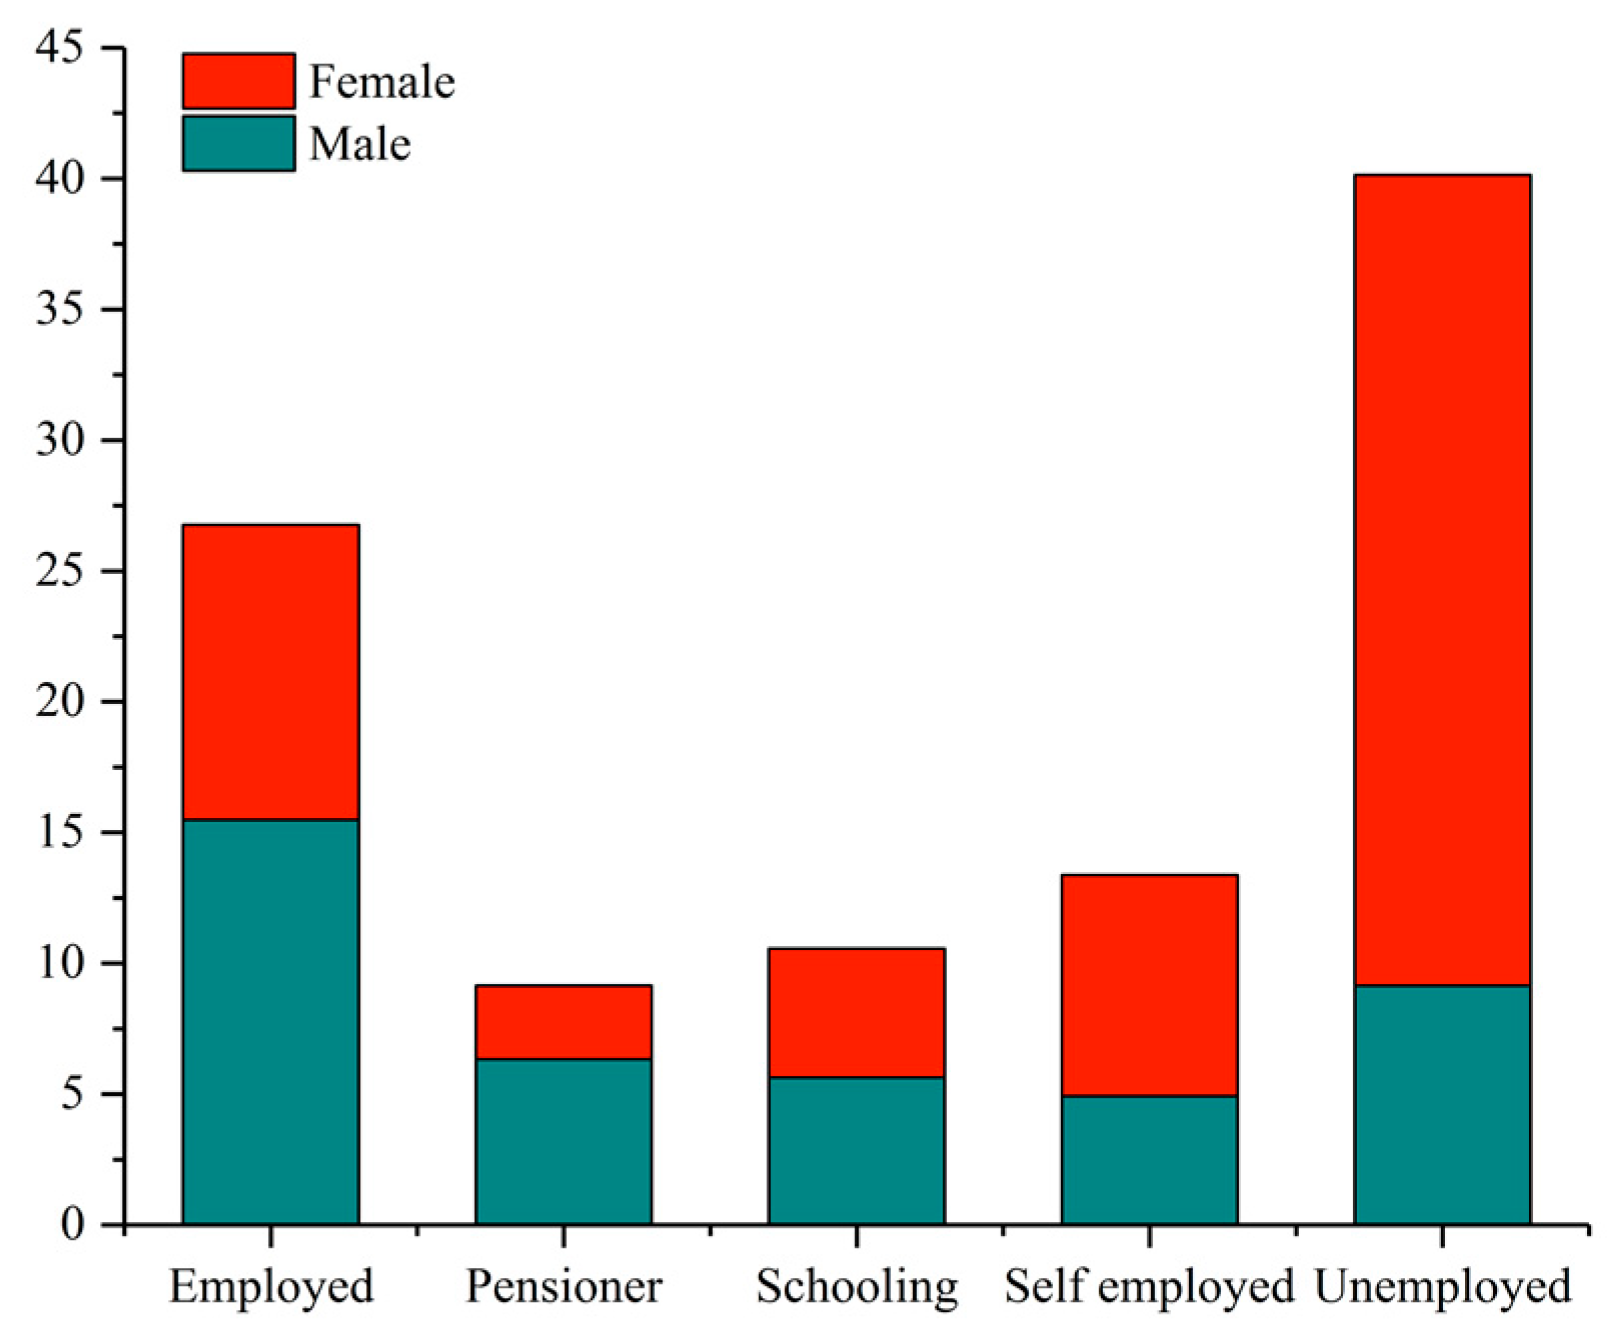
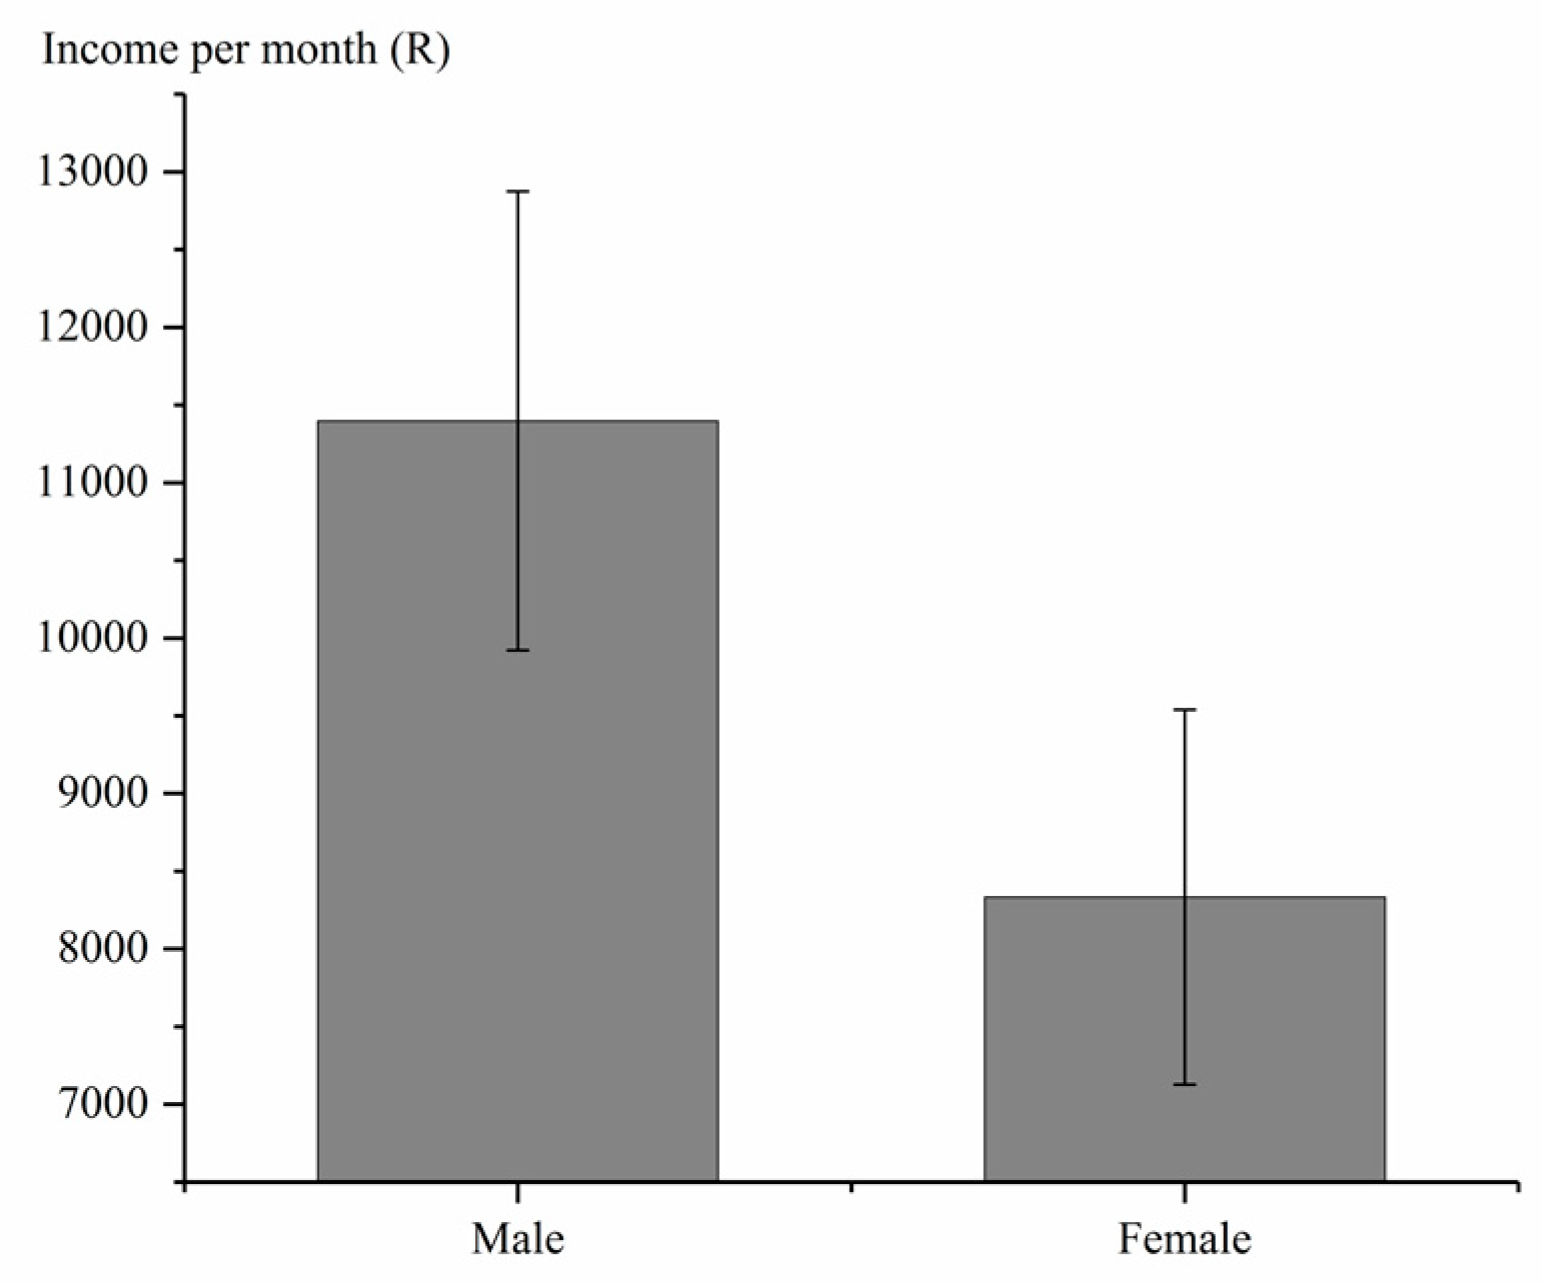
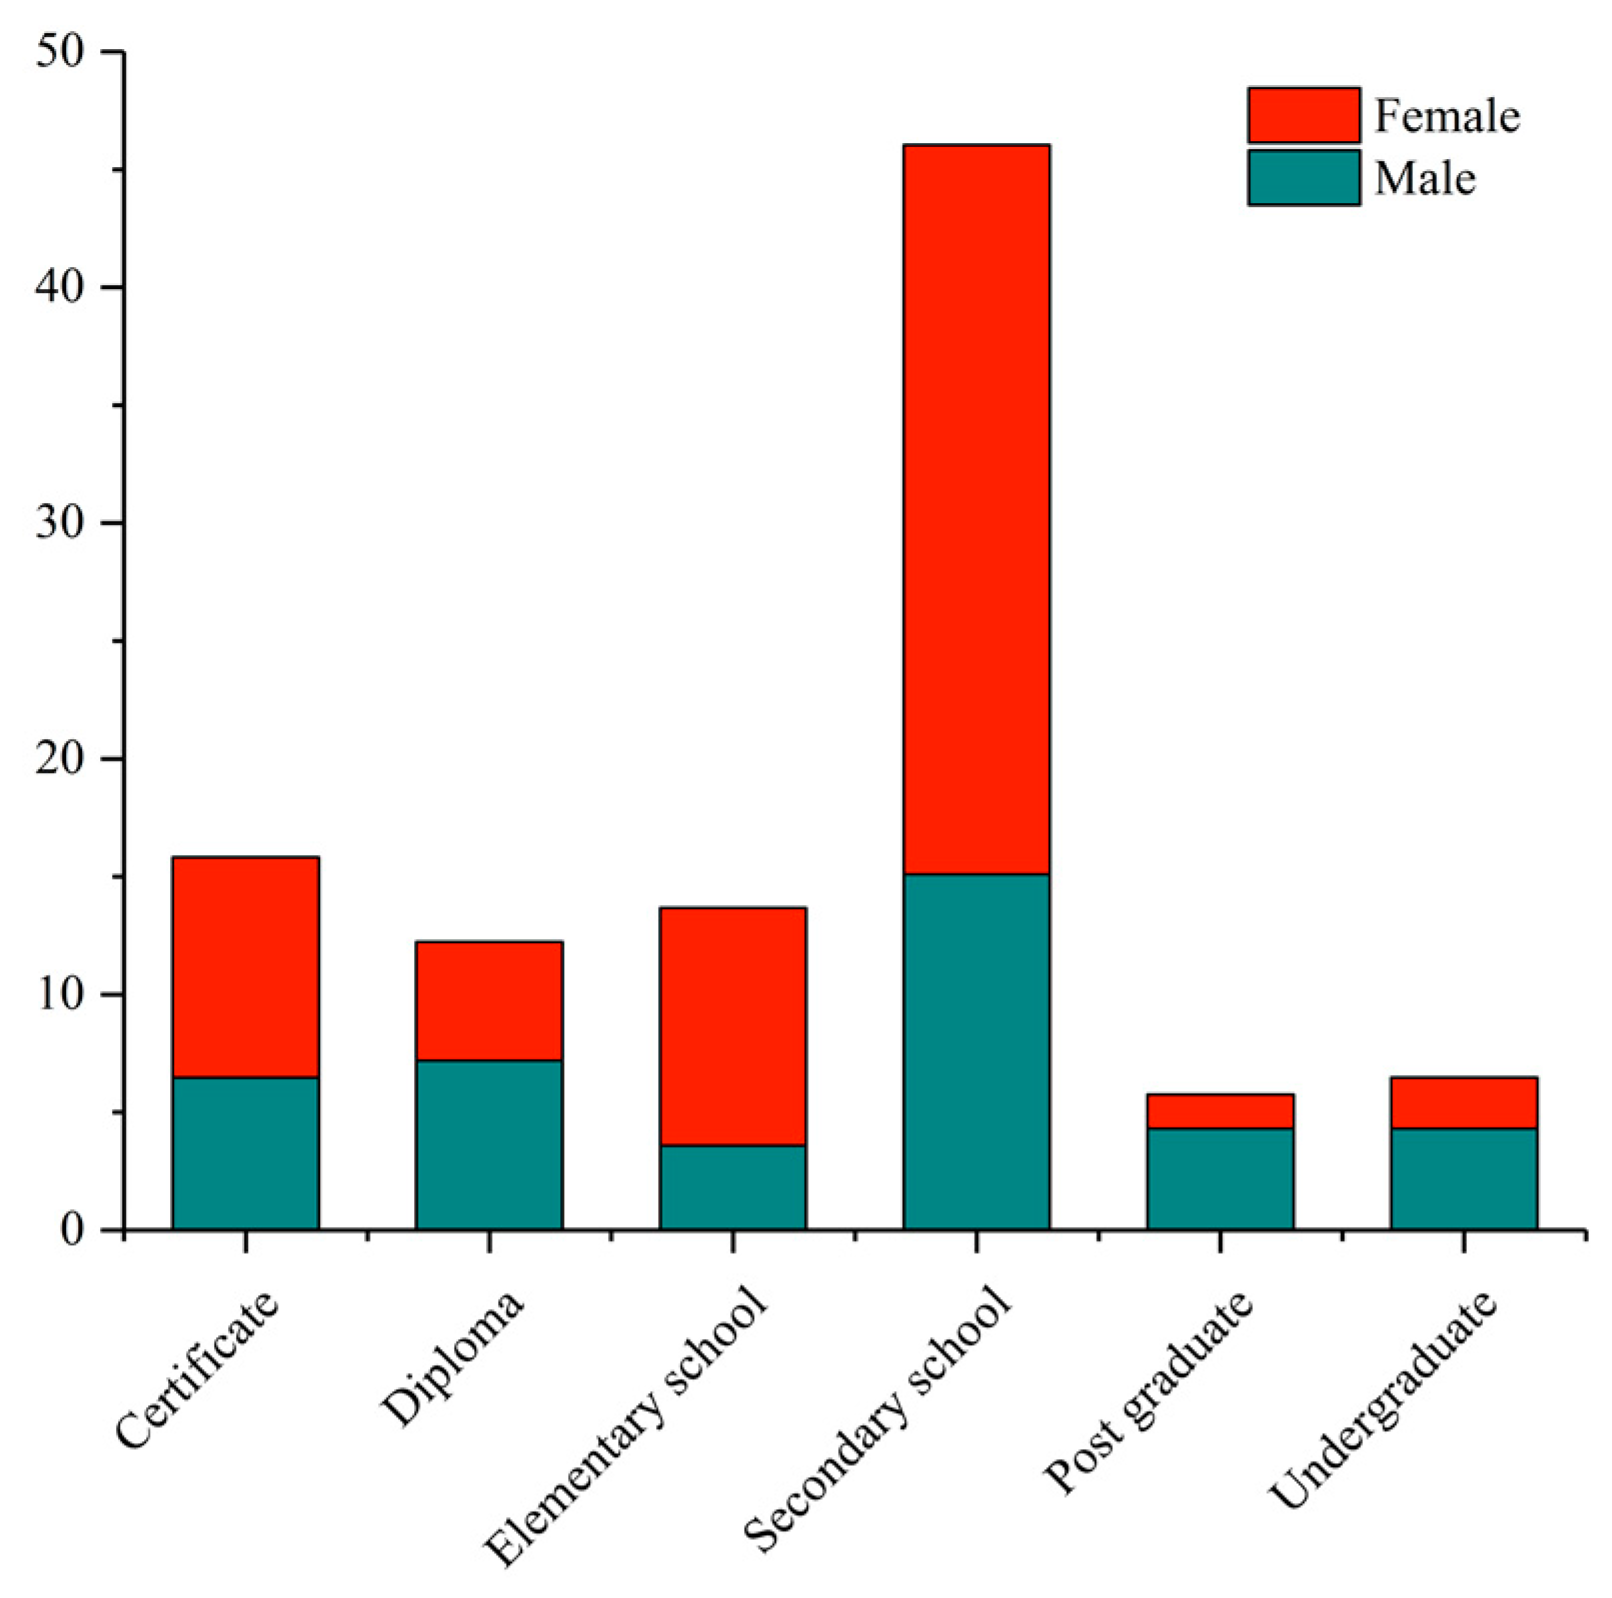
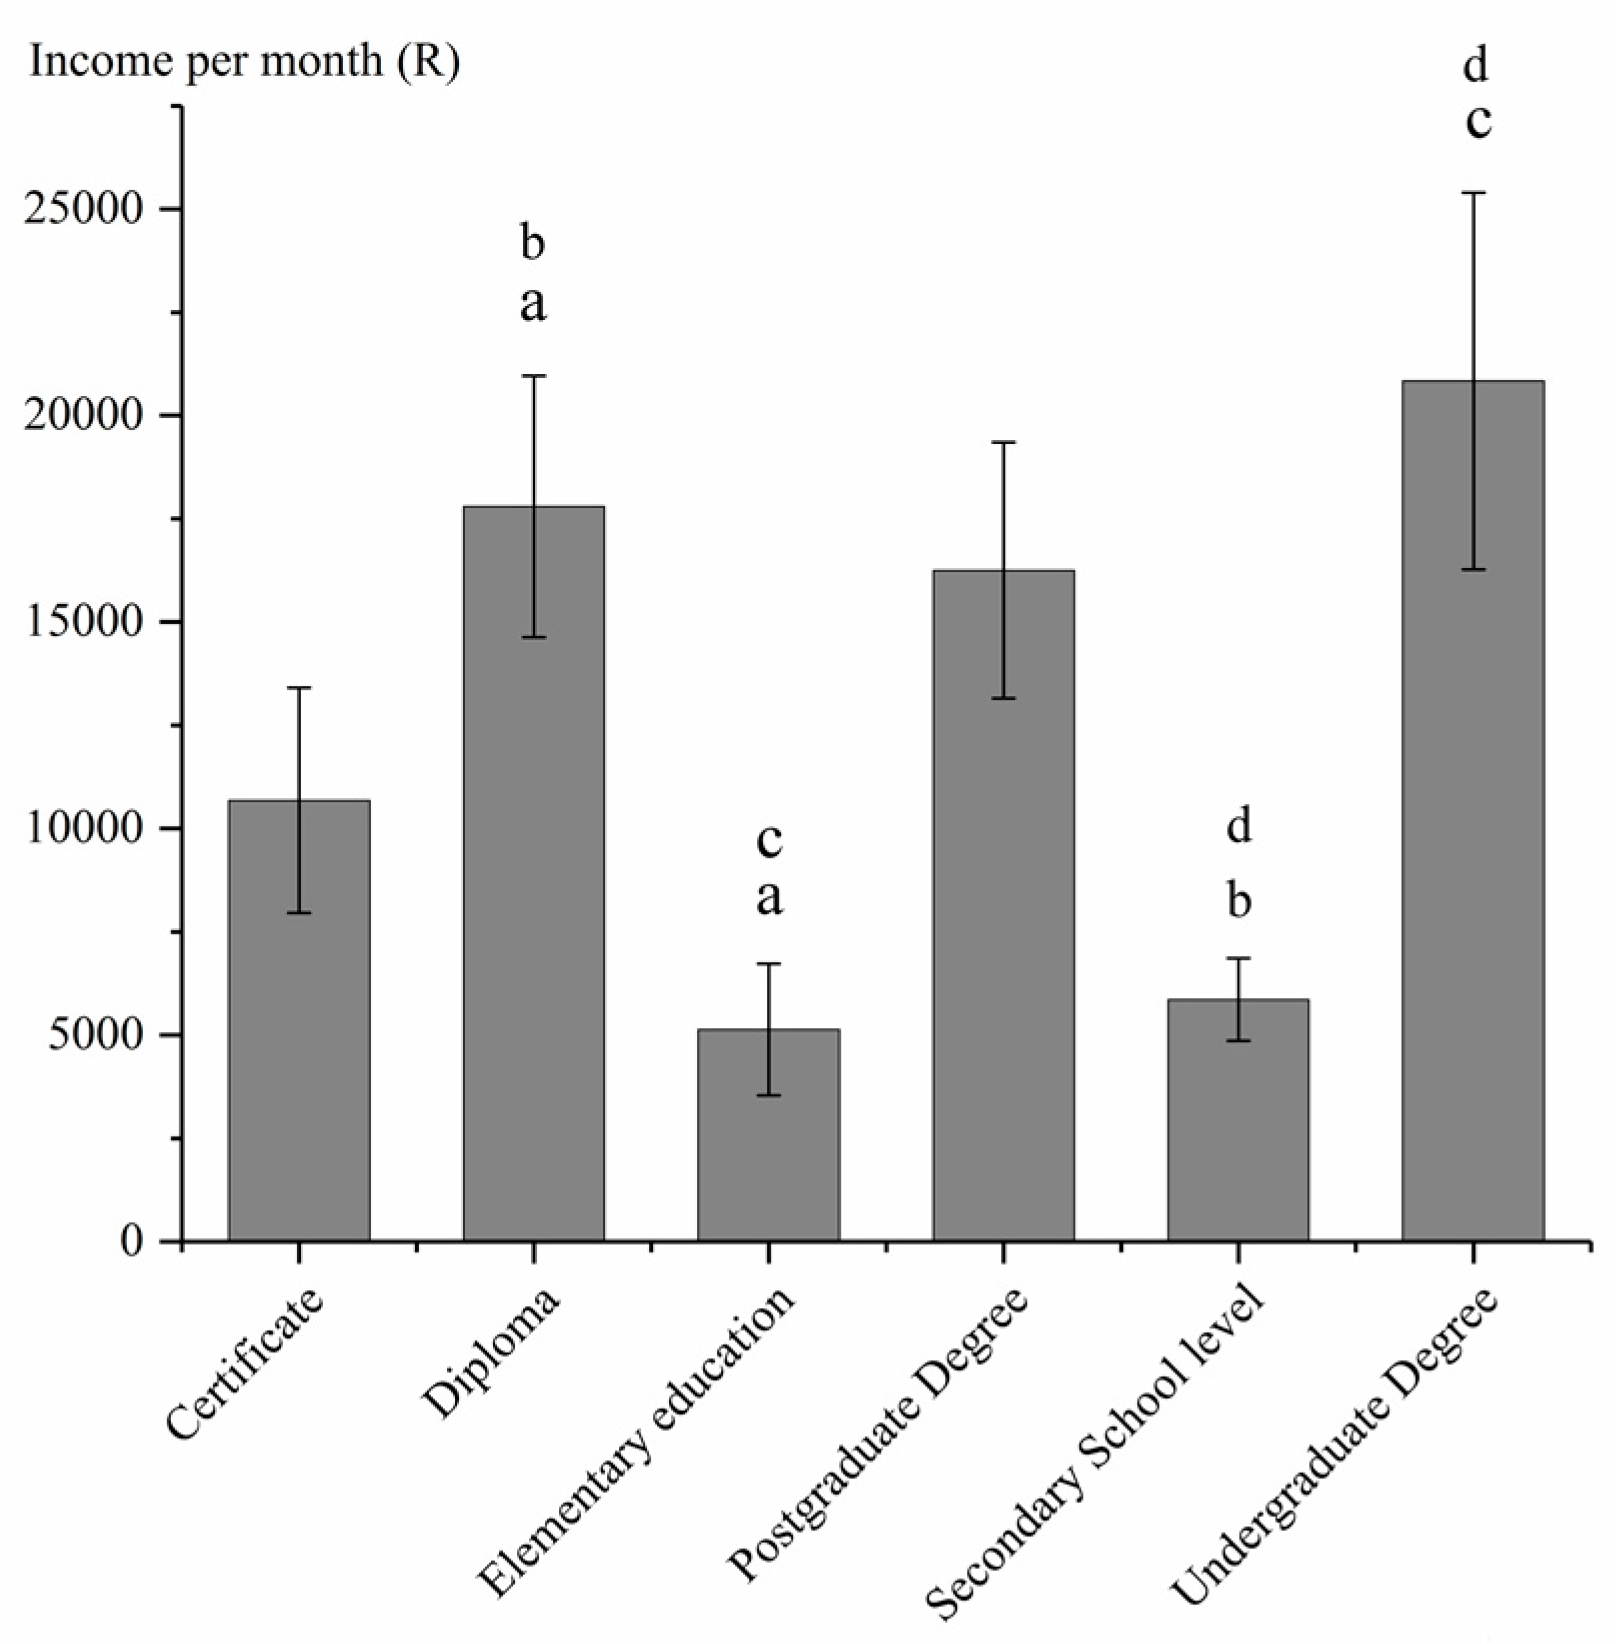
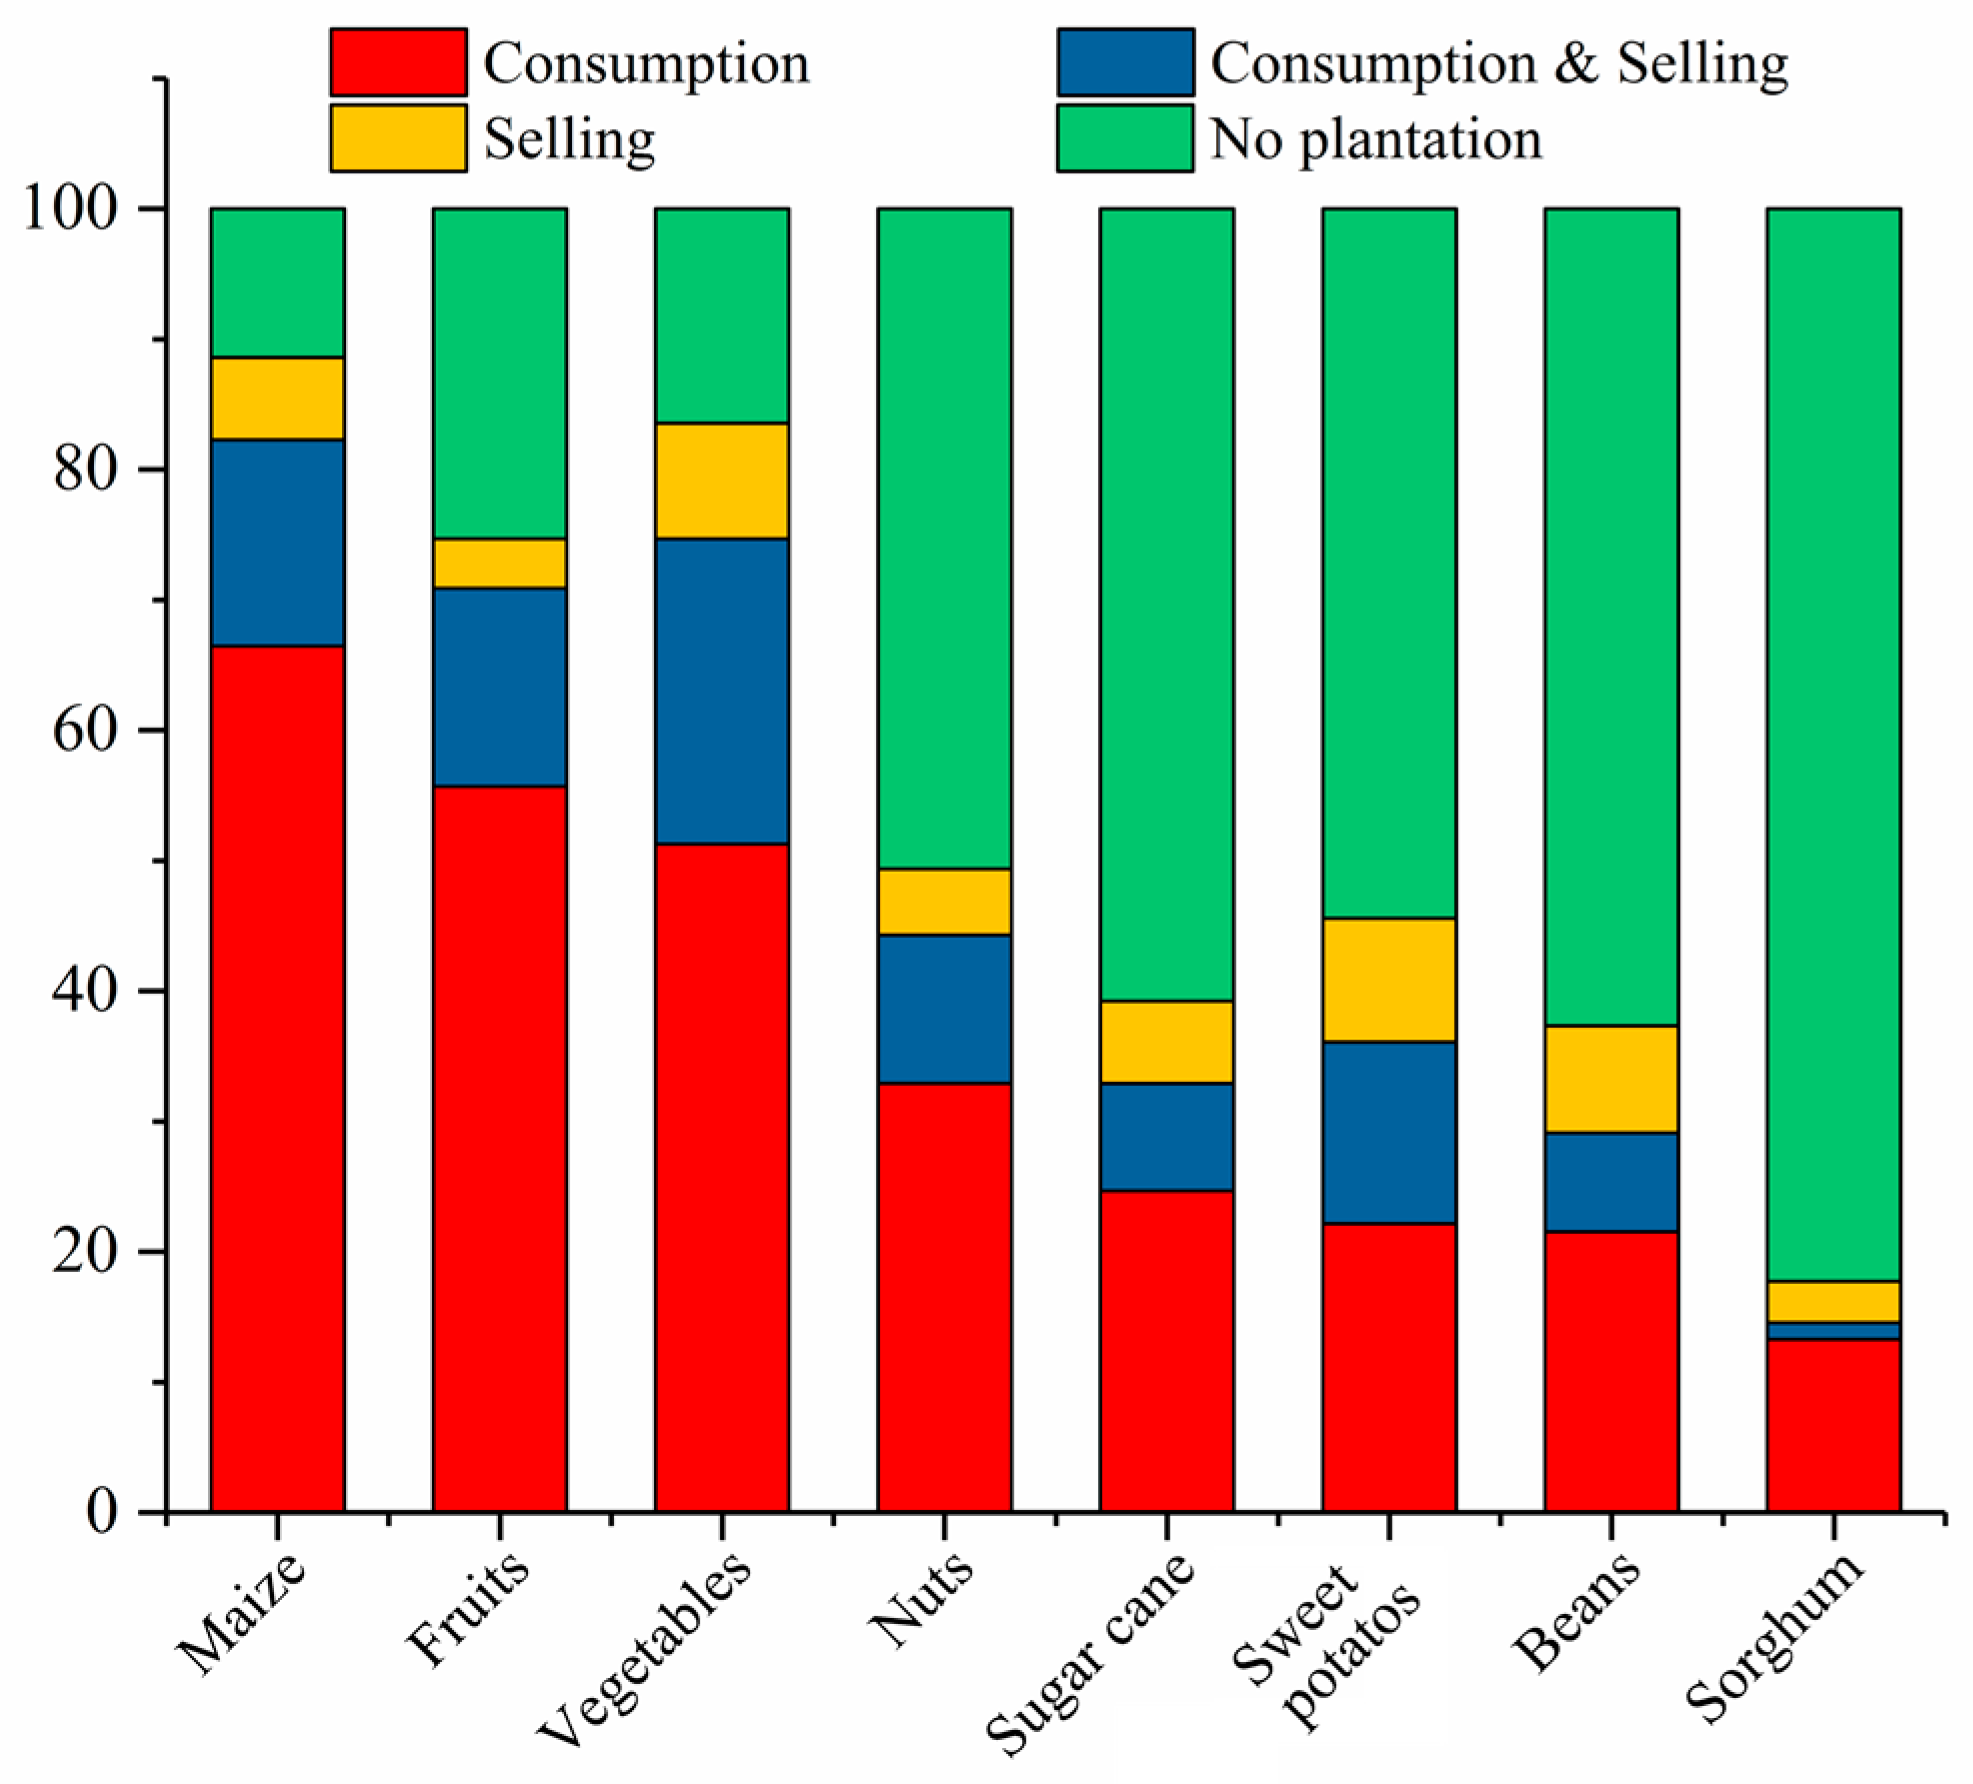
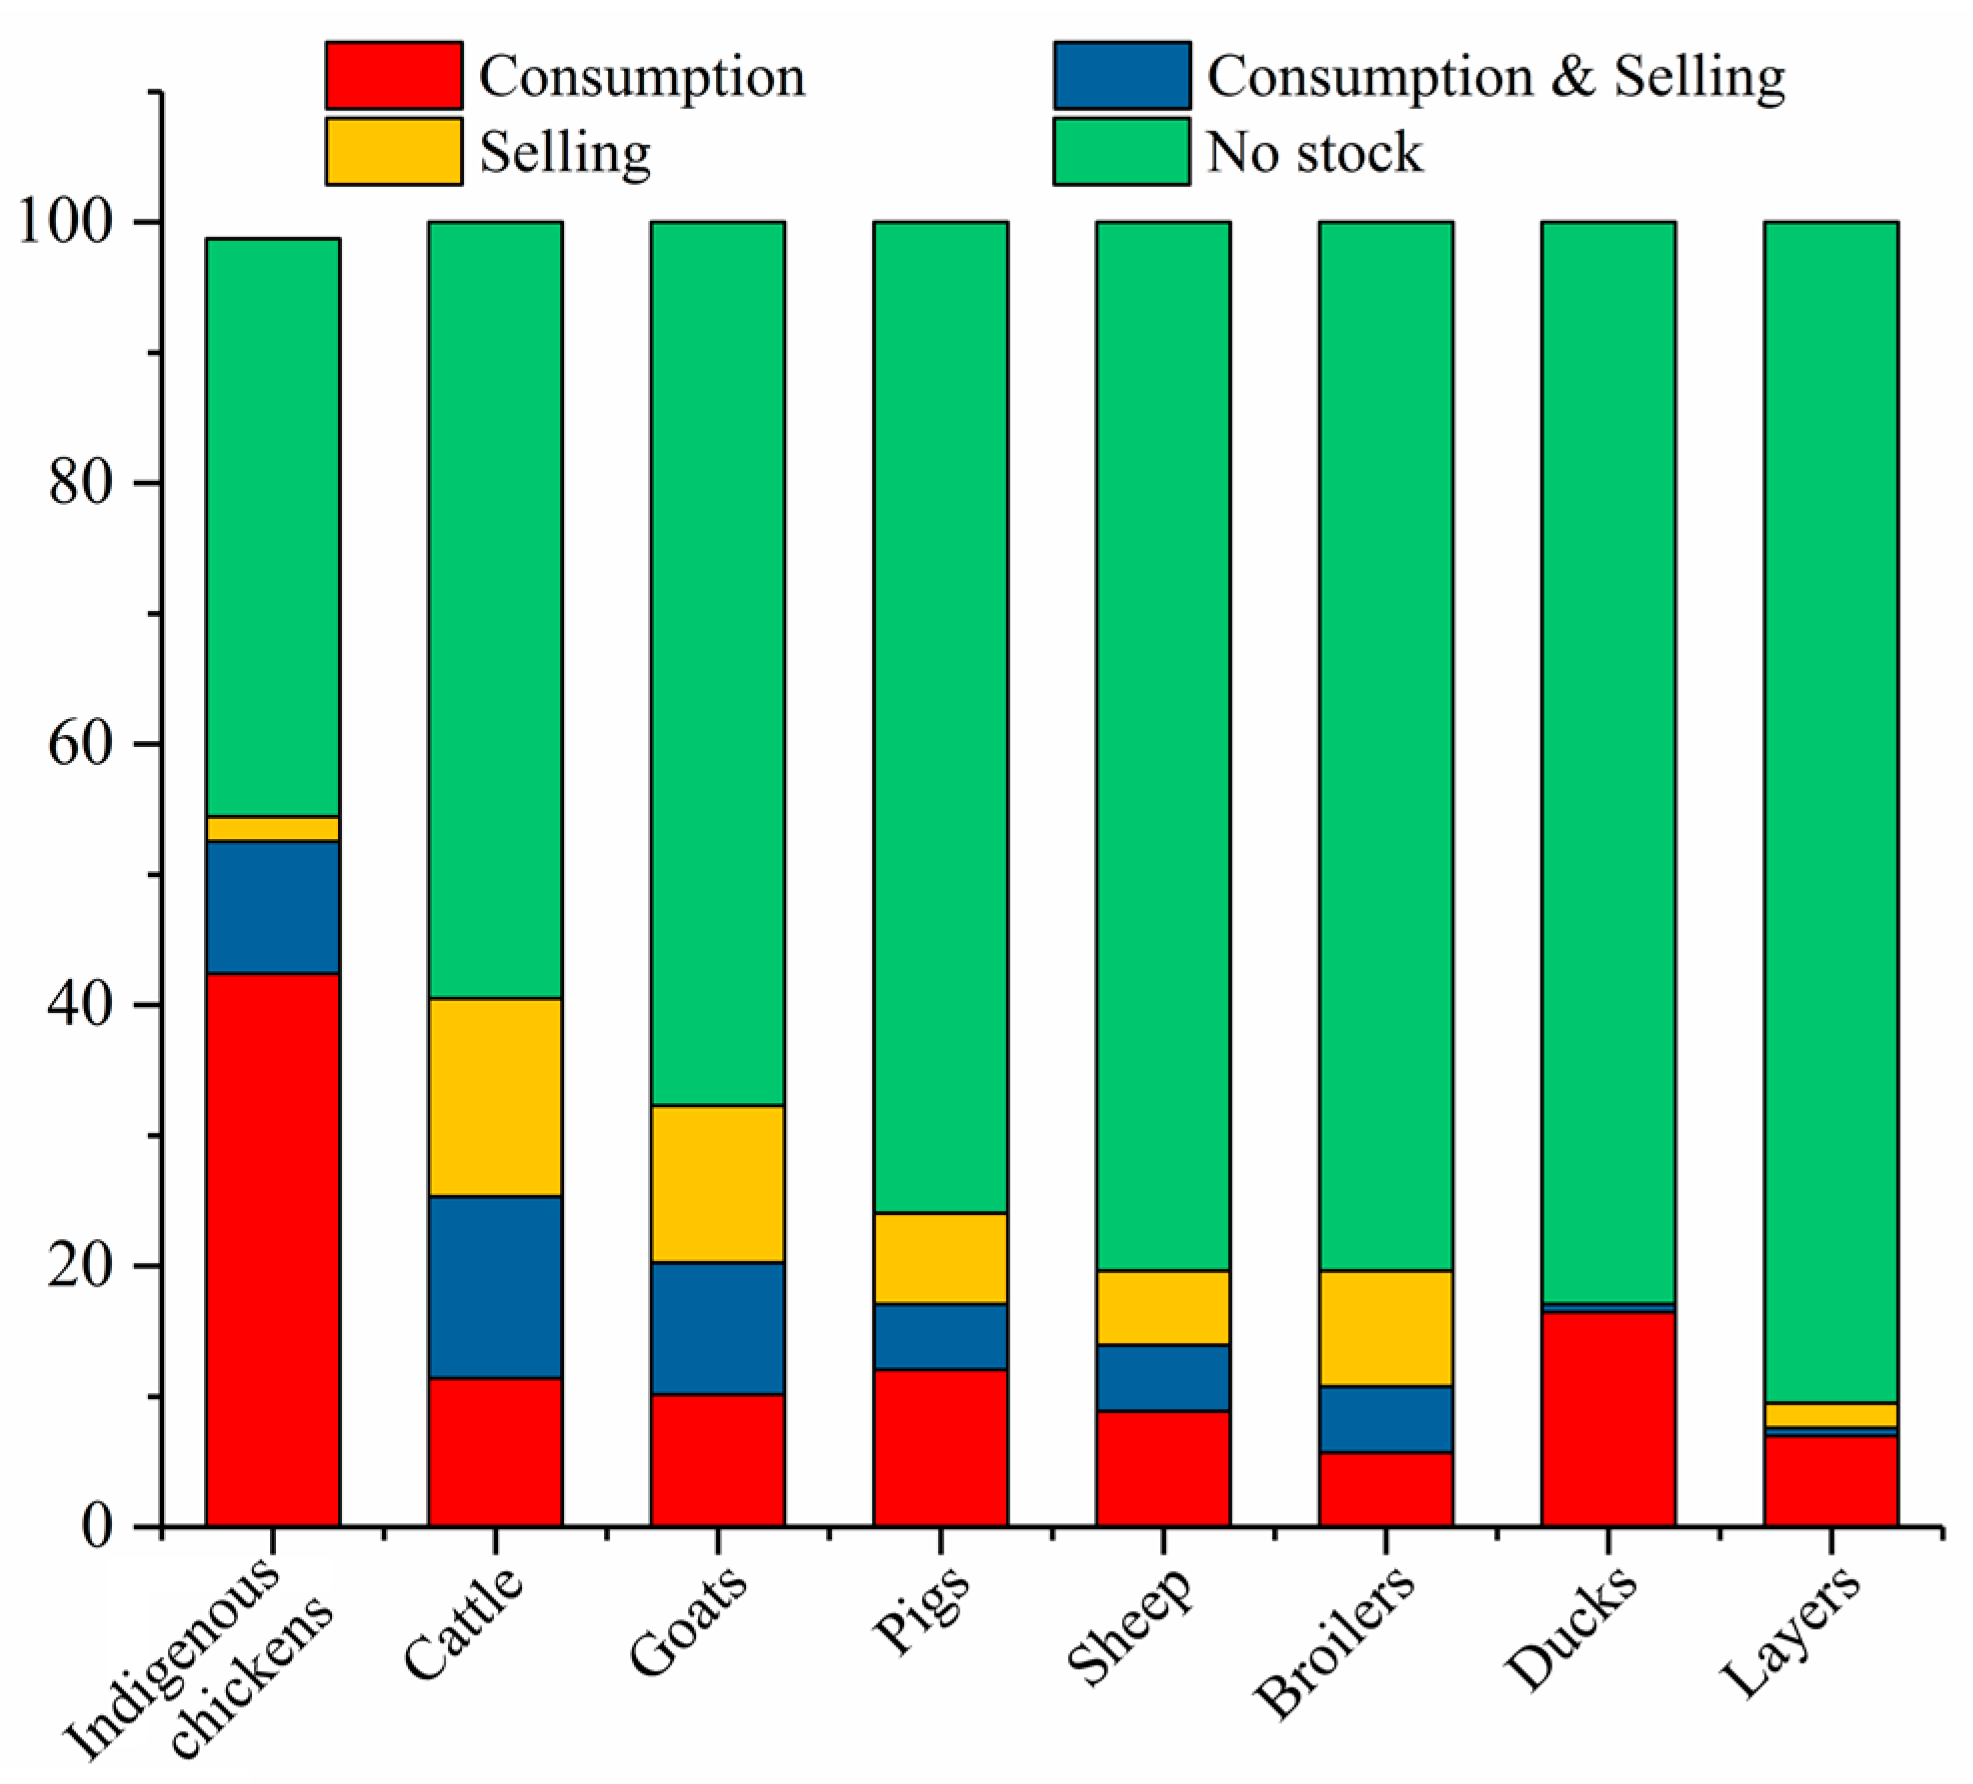
3.1. Socio-Demographic Characteristics and Livelihoods

Figure 2 shows that the Nzhelele and Levuvhu river catchments are characterized by poverty, where the majority of the people earn less than 5000 South African Rand (ZAR) a month (equivalent to United States Dollars $ 350) with an overall household income of ZAR 50,000 per annum [59] which is classified as poor [59]. The low incomes are as a result of unemployment in the study area (Figure 3).
Furthermore, the remaining residents either depend on pensions, are currently in schools or depend on social grants (Figure 3). This points to high poverty levels that still persist in South Africa 25 years into democracy. These high poverty levels are a threat to the attainment of social cohesion and the SDG 1 goal of achieving no poverty by 2030 [29]. The high levels of poverty and lack of meaningful livelihoods often lead to the exploitation of the natural environment as a means of livelihood, and this shows the link between society and nature. For example, overfishing and cutting down of trees for purposes of selling firewood is a common practice in the Nzhelele and Levuvhu river catchments. Overall, employment status has a significant effect on people’s income based on the ANOVA analysis, especially among the employed, self-employed and unemployed (p < 0.05, Figure 3). Poverty in the area also has a gender bias, meaning that gender significantly affects people’s income (Figure 5). There are fewer females who are employed, who are pensioners, who are in schooling and who are more self-employed compared to males (Figure 4). Females also earn less than males (Figure 5). This predicament reinforces the local patriarchal culture prevalent in the area, where males are often afforded education and other opportunities at the expense of females [29,60] (Figure 6).
What is encouraging is that there are more females with secondary education. However, there are more males with a diploma, undergraduate degree and postgraduate degree compared to females. The high gender inequality is a serious threat to the attainment of SDG 4 on quality education as well as SDG 5 on gender equality. The ANOVA analysis also indicates that there are significant differences in people’s income among different educational levels and there is a strong correspondence between better education and higher incomes (p < 0.05, Figure 7). Income levels rise to above ZAR 15,000 if one has a diploma, undergraduate degree or postgraduate degree. Education in South Africa is often cited as a conduit to escape poverty; hence the need to promote quality education in the study area. However, the educational levels in the Nzhelele and Levuvhu catchments are quite low with very few of the respondents having a degree or postgraduate degree.
Pertaining to livelihoods, the respondents mostly depend on subsistence agriculture wherein the main crops cultivated are maize, fruits and vegetables (Figure 8). Most of the agricultural produce is for self-consumption with little for sale. Moreover, residents pointed to a decline in maize crop production due to the erratic rainfall, hence they now resort to indigenous irrigation systems such as canal irrigation or the bucket system for vegetable farming. Residents in the Nzhelele and Levuvhu catchments also keep livestock; mostly indigenous chickens, goats and cattle for subsistence with little finding its way to the market for commercial purposes (Figure 9). However, the majority of the respondents indicated that they do not own livestock.
Agriculture is a major source of livelihood. However, the residents face challenges such as a lack of finance and agricultural knowledge, poor and inadequate infrastructure (roads, irrigation to propel their agriculture to be more productive) (Figure 10). Furthermore, due to a lack of water and challenges in agriculture and the failure of South Africa’s national agricultural initiatives such as Land Redistribution for Agricultural Development, Integrated Sustainable Rural Development Programme, Comprehensive Agricultural Support Programme, and the Comprehensive Rural Development Programme [60,61], it emerges that the respondents, particularly youth, require better employment opportunities more than anything which is a sign that can be attributed to de-agrarianization. Consequently, our study concurs with [60] who argues that the youth are disinterested and disconnected, with a marginal agrarian lifestyle.

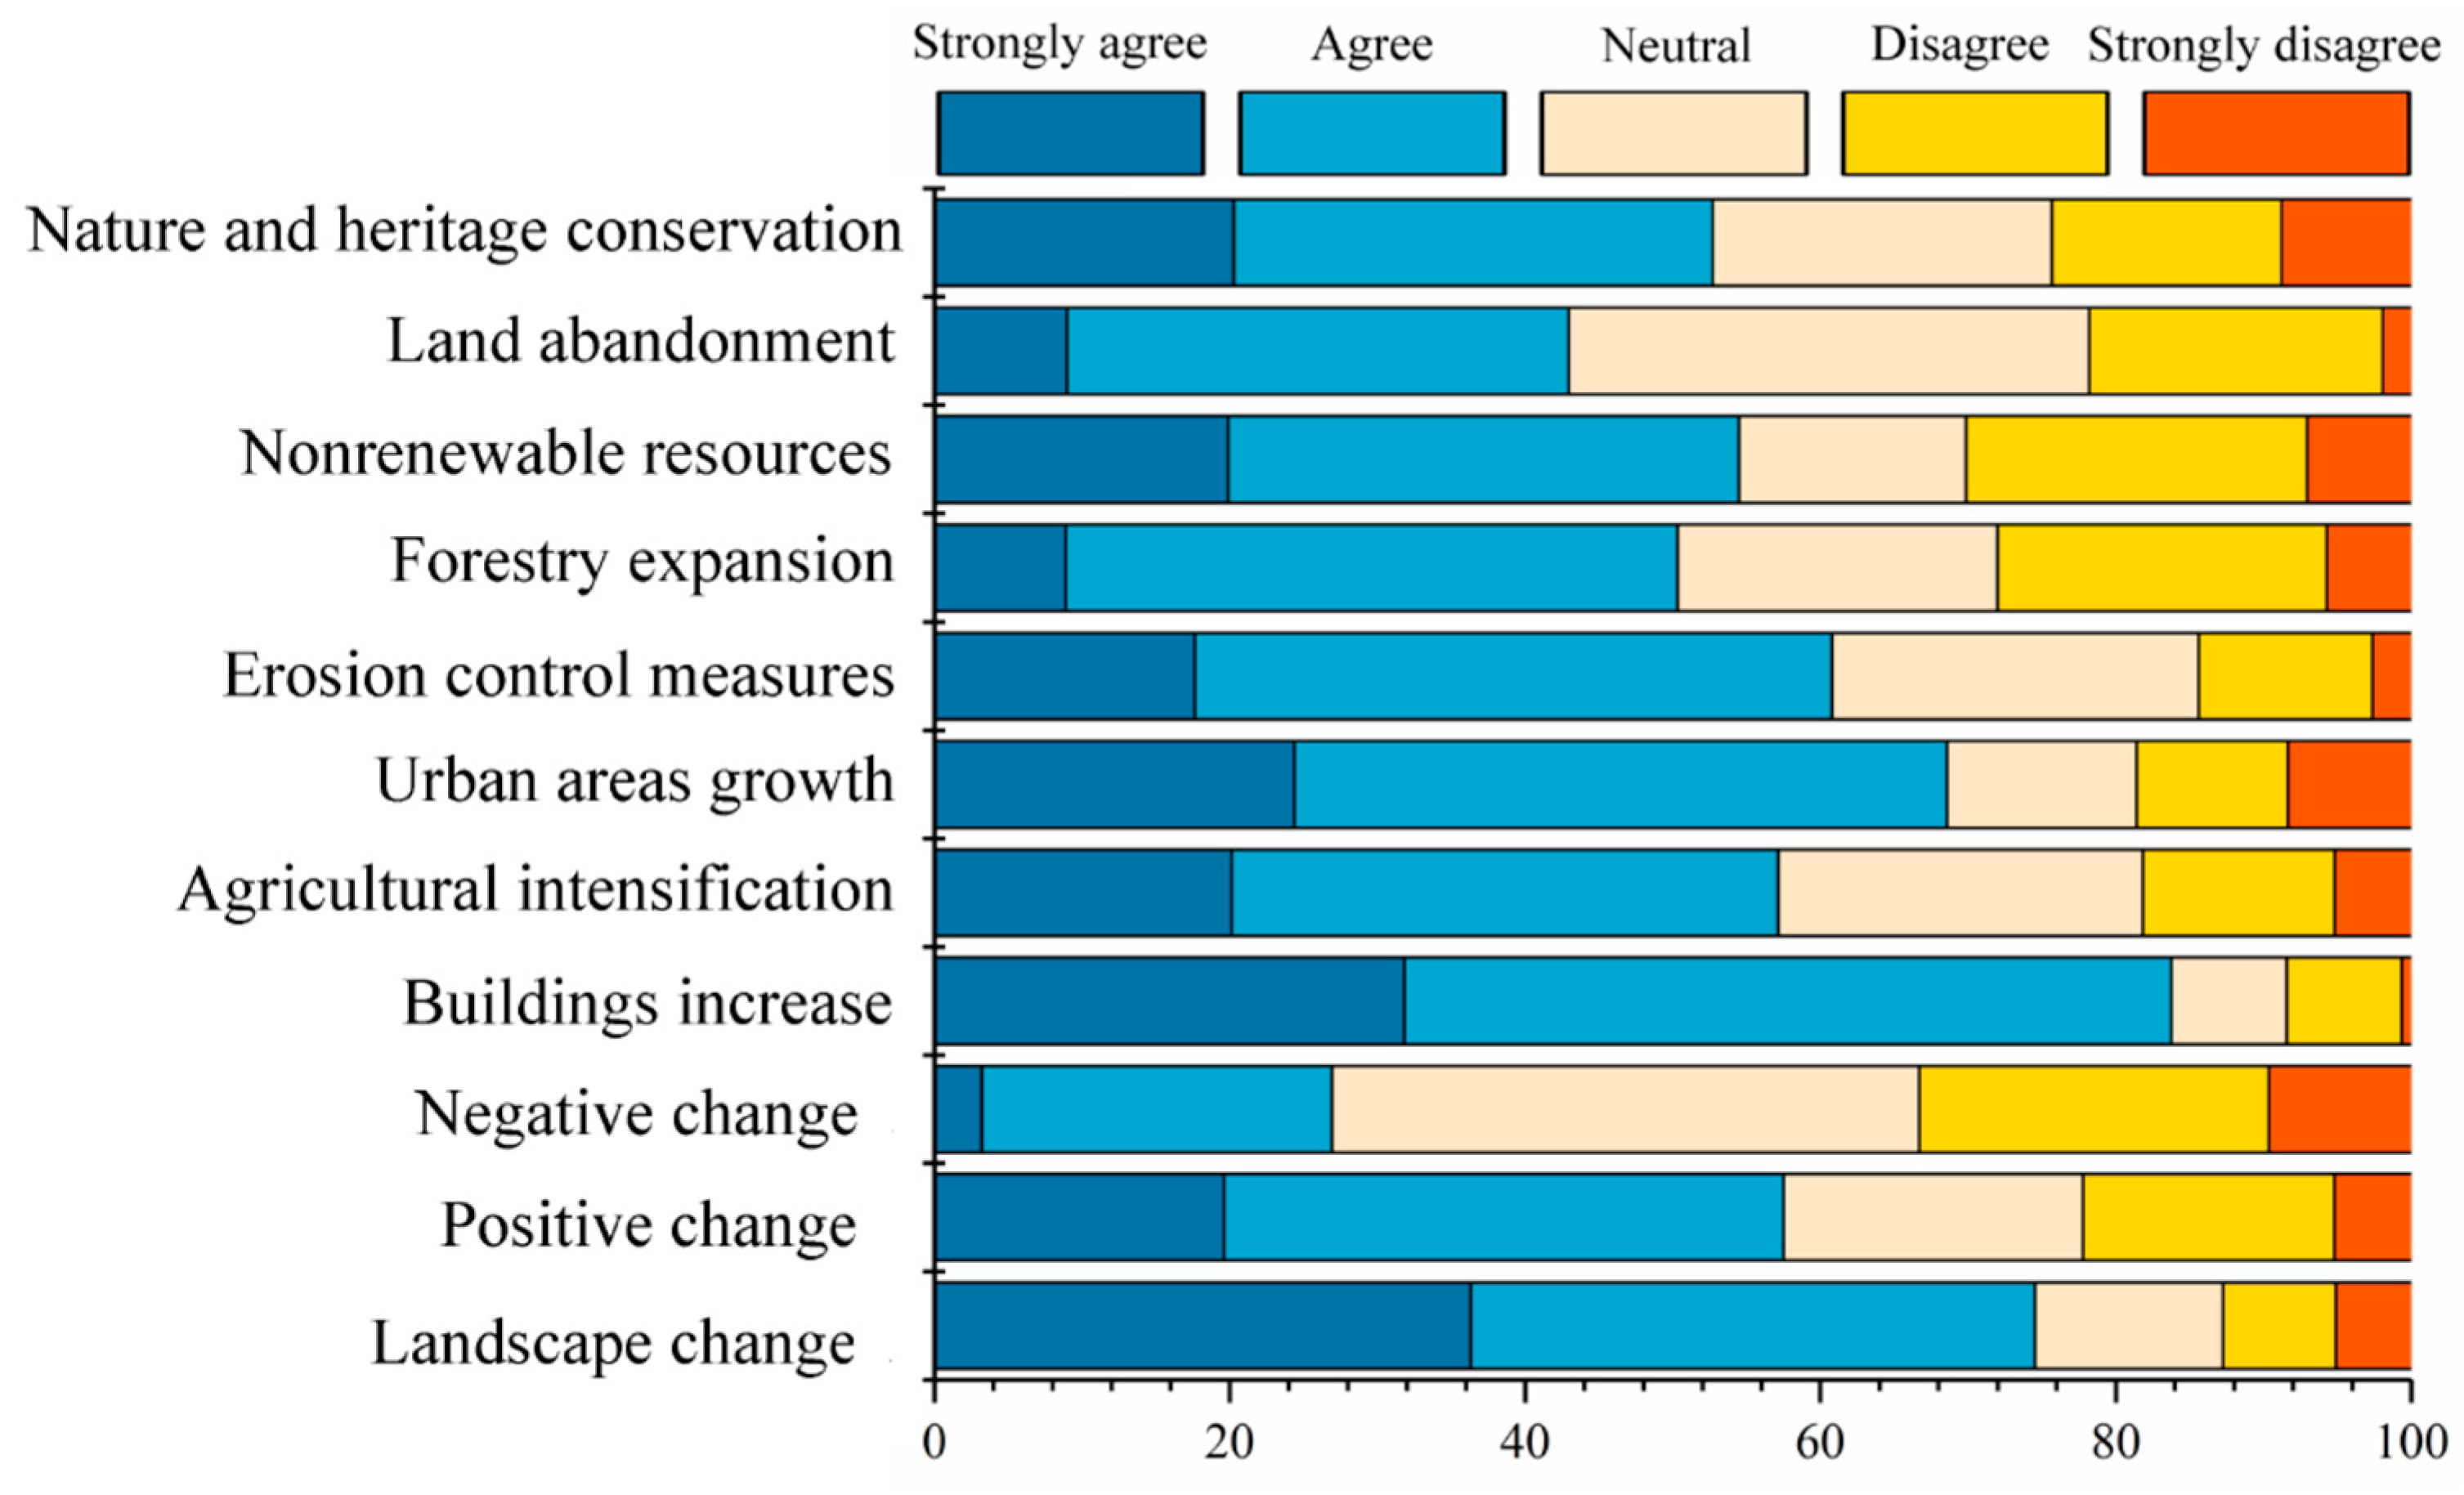
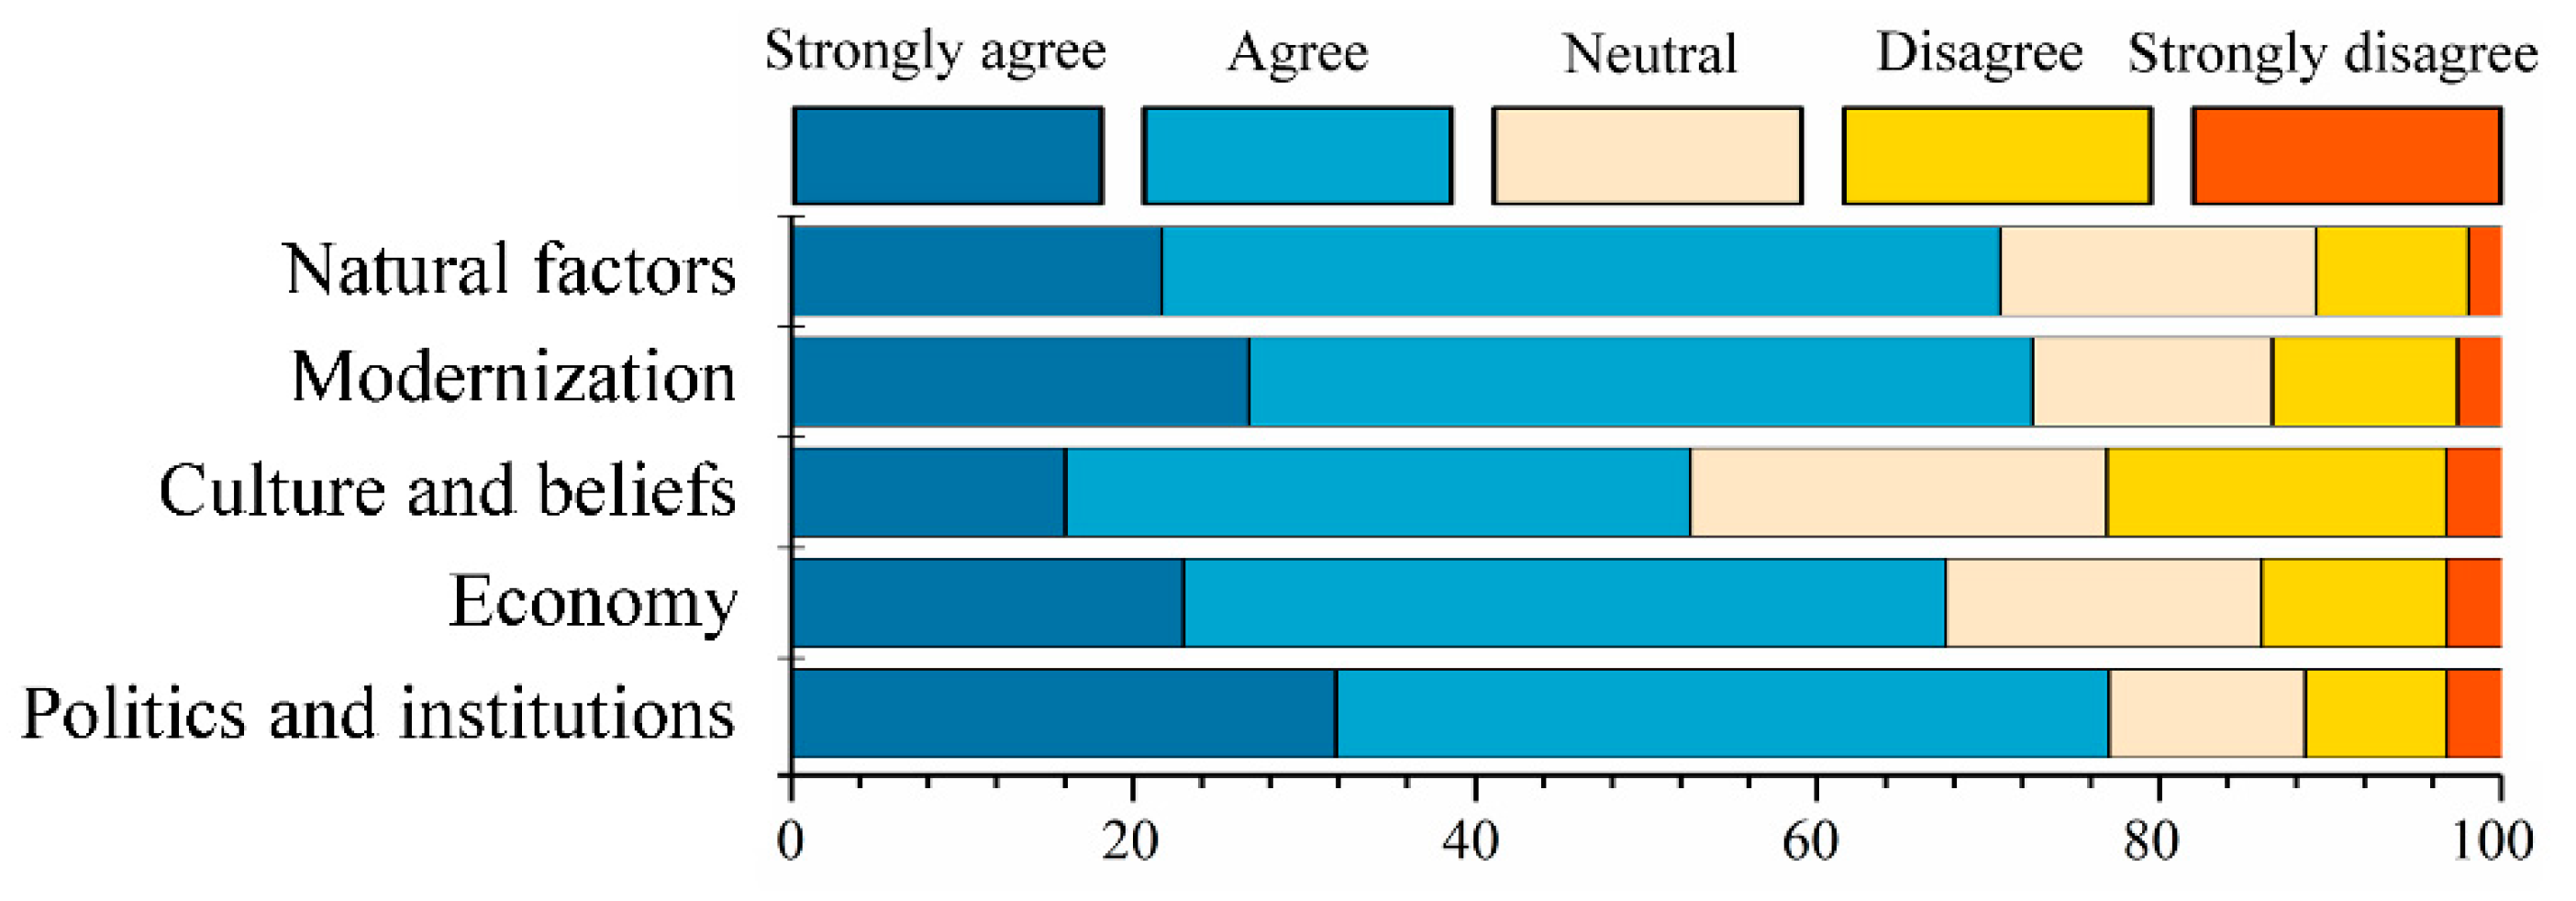
3.2. Landscape Change and Its Drivers

Figure 11 shows that the residents agree that their landscape has changed over the past 20 years (1998–2018). However, the respondents argue that the change is positive. This is despite the results indicating that most of the change has been detrimental to the environmental. For example, the residents agree that there has been urban growth and an increase in buildings constructed. The increase in buildings has led to an increase in western-type houses being built as opposed to traditional rondavel huts [62]. Urban growth and the increase in buildings are often at the expense of pristine natural resources and agricultural land. For example, urban development along the banks of the Nandoni dam is occurring at a rapid rate, leading to soil erosion and destruction of wetlands. Urban growth in Thohoyandou, the major town in the study area, is the fastest in Limpopo province [63].
The other major change in the area is the prevalent soil mining and extraction of stones. Stones and rocks are mined and sold for decorative and construction purposes. Soil is often mined for construction purposes as well as for the lucrative brick-making industry along the Nandoni dam and Levuvhu riverbanks. This has led to massive soil erosion, a decline in soil nutrients, siltation, and destruction of wetlands, which threaten agriculture, and water supply in the study area. Soil erosion is most severe along the riverbanks, wetlands and agricultural plots thus threatening the residents’ water supply and agricultural land use-based livelihood activities. Consequently, the residents in the study area pleaded strongly for the implementation and enforcement of soil erosion-curbing mechanisms in the Nzhelele and Levuvhu river catchments. This is because soil erosion has led to ecosystem disservices such as decline in water quality, and quantity, which negatively affects the agricultural livelihood practices and systems. Residents strongly concur that soil erosion needs to be curbed in order to restore soil fertility and for a return to better crop production in the study area (Figure 12). Consequently, soil is identified as a major ecosystem service that has to be managed well if agricultural livelihood practices and systems are to prosper in the study area. Some of the suggested measures to curb soil erosion include planting more trees, adoption of crop rotation, strong enforcement of laws to discourage soil mining, terracing when planting on steep slopes, destocking of livestock and placing stone barriers along gulley’s to prevent further erosion.
A key change in the agricultural sector has been an increase in agricultural intensification in terms of an increase in agricultural production per unit of inputs [64]. The residents’ favored form of agricultural intensification, which is gaining traction, is ecosystem-based agricultural intensification [29]. This includes water harvesting and irrigation, mulching, nutrient recycling for crop production, intercropping, and crop rotation. Despite attempts at ecosystems-based intensification, forms of crop production that utilize agricultural chemicals such as, fertilizers and pesticides, are still prevalent in the study areas. However, the residents in the Nzhelele and Levuvhu river catchments argue that lack of finance, government support and inadequate farming knowledge hampers their attempts at agricultural intensification.
The abandonment of agricultural land was also identified as a change in the landscape. This points to de-agrarianization and declining crop yields as a result of the effects of climate change (drought, erratic rainfall) and migration of youths to urban areas seeking better opportunities [60]. Commercial forestry expansion is also another major change often at the expense of indigenous natural forests leading to ecosystem disservices such as a decline in soil quality [65]. Remote sensing studies have also confirmed an increase in forest plantations [66]. These are mostly commercial ventures as well as community-owned ventures, producing timber and tea in the Nzhelele and Levuvhu river catchments.
The residents in the Nzhelele and Levuvhu catchments are also engaging in nature and heritage conservation owing to their cultural beliefs so that they ensure that cultural ecosystem services are transferred to future generations. For example, there is the practice of preserving indigenous ‘holy forests’ [67] where the local people communicate with their ancestors. These practices preserve local pristine indigenous forests. Similarly, there have been attempts to promote tourism and heritage conservation along the “holy forest”, sacred sites, and along dams in the river catchments.
Figure 13 shows the land-cover changes in the study area between 1998, 2008 and 2018 whereas Table 1 shows the change in area in land-cover classes according to CA and LCI.
The first step was to calculate the magnitude of change (CA) between 1999–2008 and 2008–2018 for each land-cover type. Between 1999–2008 and 2008–2018, vegetation and grasslands had the highest negative transformation of 4, 3 and –3, 5 and –4, 0 and –3, 8, respectively. These declines correspond with the survey results, where the residents argue that there was an increase in settlements, agricultural intensification and expansion, and extraction of non-renewable resources such as sand and granite for construction. However, pristine forests and grasslands were destroyed in the process. During the time intervals of 1999–2008 and 2008–2018, settlements and bare land show a transformation CA of 0, 7 and 1, 4 whereas bare land was 1, 5 and 1, 1 respectively. The extraction of natural resources such as sand and stones, and brick making along the river catchments are drivers explaining the increase of bare land and settlements as confirmed by the land cover analysis. Furthermore, as highlighted in the survey, the bare land areas are very prone to soil erosion, and the residents in the study area confirmed that soil erosion is a huge problem that needs to be urgently addressed. Croplands experienced major transformation as its CA was 5, 8 and 5, 0 for time intervals of 1999–2008 and 2008–2018. The increase in croplands coincides with a decline in vegetation and grasslands as communities’ clear land to increase agricultural output. The change (CA) of 0, 0 and 0, 1 in water between time periods of 1999–2008 and 2008–2018 was minimal and it was mostly due to the building of the Nandoni dam in 2005. However, discussions with the community during the survey revealed that although dams are present, water reticulation and irrigation water is not readily available for community members. From calculating the magnitude of change for each land-cover type the next stage was computing the landscape change index. The landscape change index was 8, 1 and 7, 4 for the time intervals 1999–2008 and 2008–2018. Therefore, we can argue that most of the land transformation occurred between 1999–2008. Although the land cover analysis is useful in showing the magnitude of landscape change, it is difficult to identify its salient drivers. However, the survey does highlight that for example land abandonment is a critical driving factor explaining landscape change in the study area. Nevertheless, despite this insight, more studies are required to comprehend the drivers of land abandonment in the Nzhelele and Levuvhu river catchments.
The proximate drivers of landscape change in the study area are shown in Figure 14. Firstly, politics and legislation are cited as a major driver of landscape change. For example, the land reform policy has led to ceding of plantations to the local people. However, the current ceded plantations to the community are not being well maintained. Land is also governed traditionally, where the chiefs and headman allocate land parcels and give households ‘permission to occupy land’ certificates without giving full title ownership. It has been argued that such ownership leads to the so called ‘tragedy of the commons’, because when no one owns the land, environmental degradation will be common and difficult to resolve. To some extent, it is true in the study area, as soil erosion due to soil mining, overgrazing and cutting down of trees is common. The existing challenge is that the traditional land governance practices and systems are often in conflict with modern or western-type land-use planning, administration and management [62]. Perhaps issuing ownership and titles to land is often cited as a solution. However, it also has its own challenges such as the fear that title will be given to men, the administrative modalities associated with changes of ownership and it can give rise to market speculation
The economy and markets are also a major driver of landscape change. For example, because of the search for quick profits and higher market prices, residents in the study area are increasingly turning into cash cropping (e.g., market gardening, vegetables and growing of cash crops such as sunflowers, mangoes and avocados). Culture is also cited as a major driver of landscape change through preservation and reverence of ‘holy forests’. Other local practices such as harvesting wild fruits and vegetables (without cultivation) as well as insects (e.g., mopane worms) are strong drivers of landscape change and a serious threat to biodiversity [68]. Modernization in agriculture, in particular by the smallholder farmers, is also a major driver of landscape change in the study area. For example, the use of tilling equipment means that more land is used for agriculture. Furthermore, increased use of fertilizers, pesticides, and irrigation, being adopted by farmers is a threat to the environment. Lastly, natural forces such as recurring droughts and cyclones are also cited as significant drivers of landscape changes. Droughts have led to land degradation, while flooding, for example cyclone Dineo in 2017 [69] led to destruction of property, infrastructure, crops and vegetation.

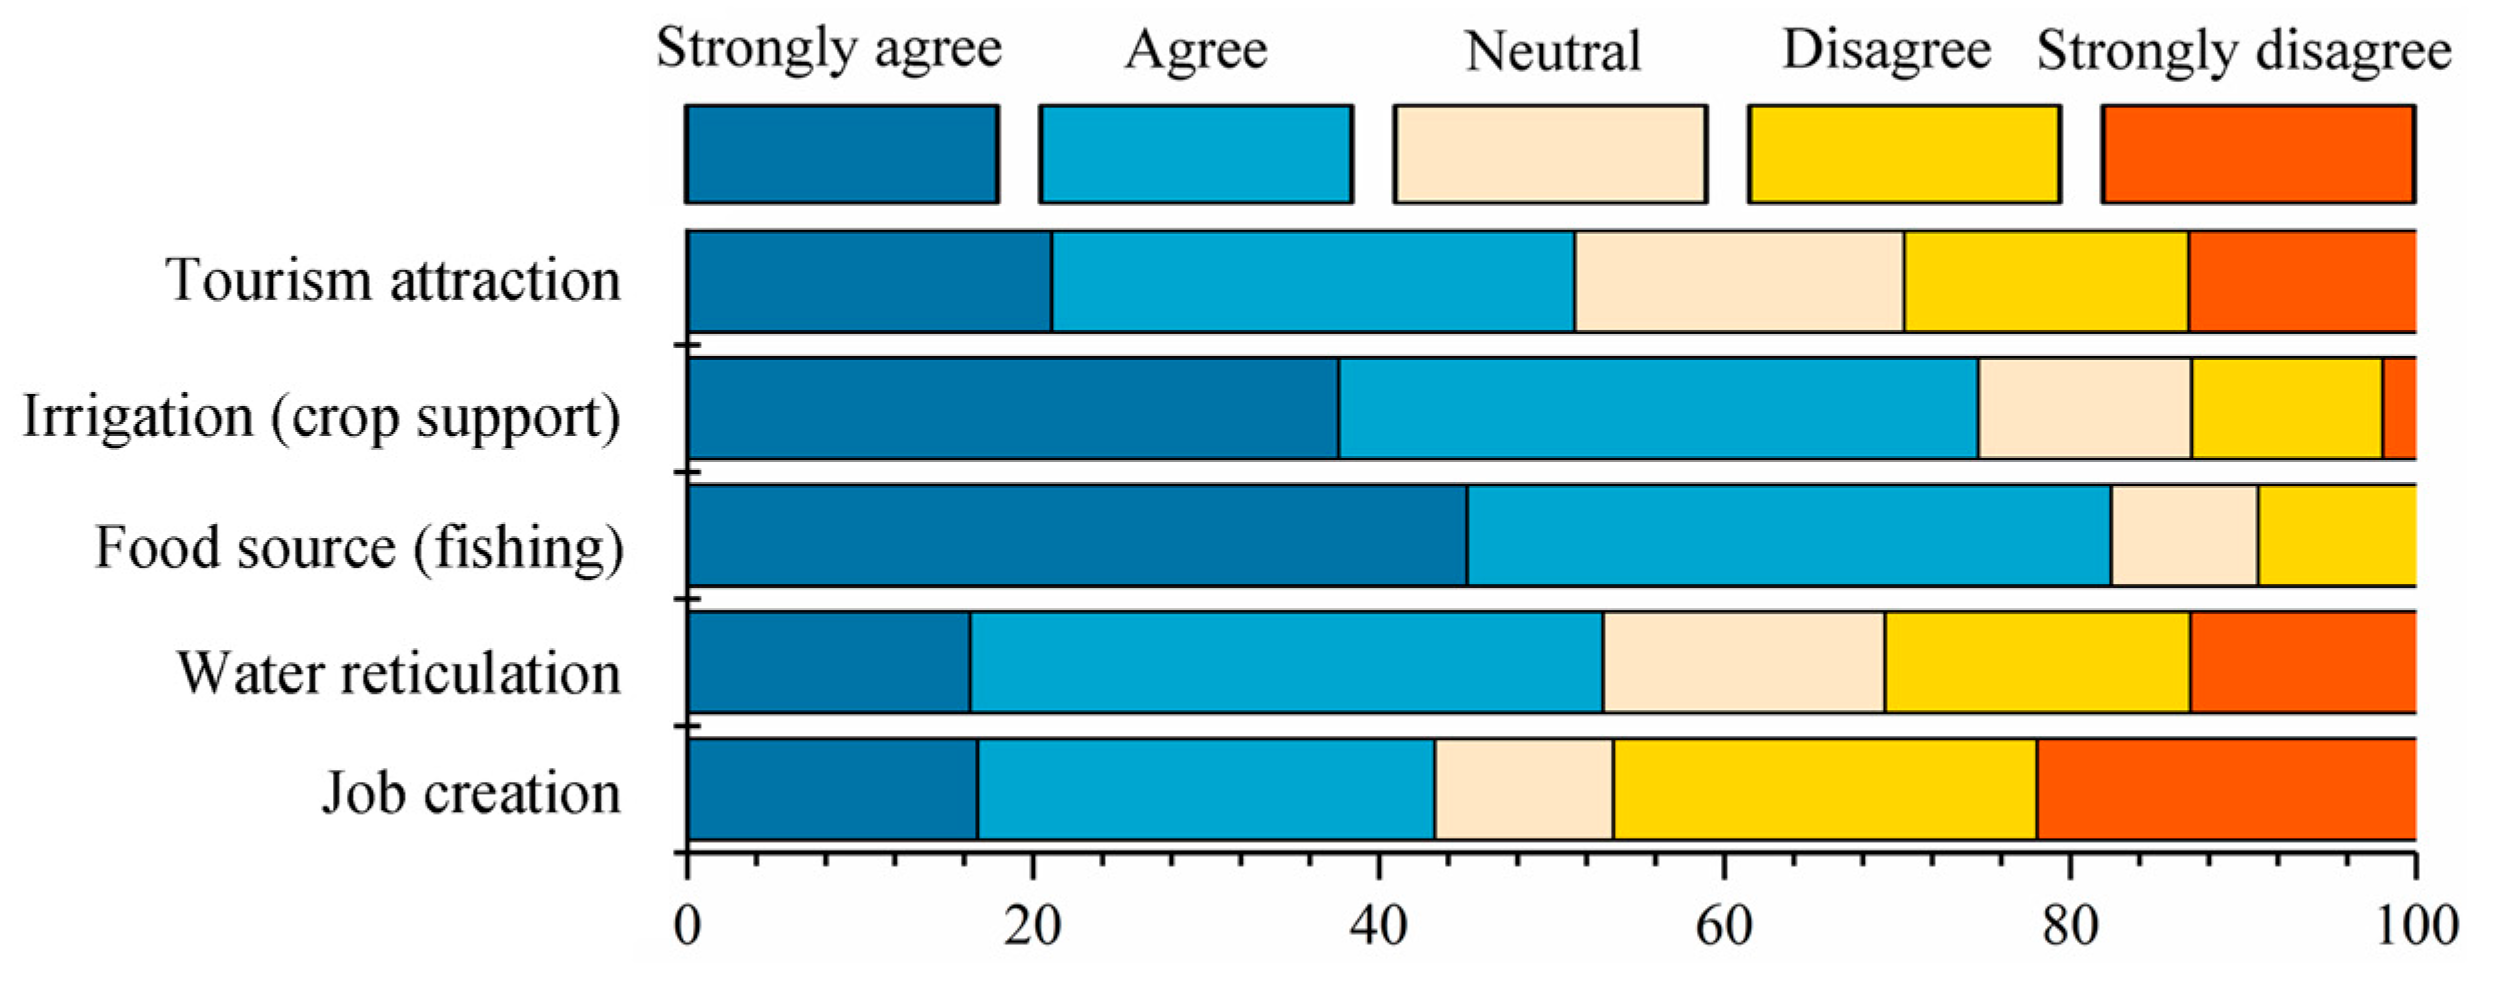
3.3. Ecosystem Services

From an ecosystem services point of view, the residents in the catchment’s areas agree that the river catchments provide fresh water for irrigation purposes (Figure 15). The villagers have turned to traditional methods of irrigation such as using trenches to supplement rain fed agriculture. Villagers have been able to implement vegetable farming and also irrigate their crops despite the erratic rainfall. The two major dams (Nzhelele and Nandoni) are the main sources of irrigation water. Nevertheless, the villagers strongly argue that drinking water from the dams is hardly possible owing to lack of water processing and pumping infrastructure. Furthermore, some villagers in the northern parts of the catchment areas such as Madangani argue that, although the government has drilled boreholes, the water is salty and unsuitable for drinking. As a consequence, some villages in the northern parts of the catchment area still obtain water from rivers, thereby exposing them to water-borne diseases. The unavailability of safe drinking water is a major threat to the attainment of SDG 6 of clean water and sanitation. Likewise, the residents are dissatisfied with the service provision of clean water by the municipality in the river catchments, which is also confirmed by other studies [30,70,71]. Hence, the district municipality, provincial government, and national government need to provide lasting water resilient solutions, especially given the frequency of droughts and erratic rainfall in the study area.
The river catchments are also an important source of food through fishing (Figure 15). However, overfishing which threatens the survival of fish species in the river catchments is a concern in the area. Moreover, if unsustainable fishing continues, the catchments run the risk of having no fish in the future. In addition, there has been reports of safety issues because of overfishing, where villagers venture into deeper waters and several drowning reports have been noted in the areas. Some villagers suggested fish farming as a solution to overfishing. However, this requires training and financial resources that are not readily available.
However, the cultural ecosystem services provided by the river catchments are thriving and have potential (Figure 15). For example, there are various tourist resorts along the Vondo and Nandoni Dams and the river catchments. These support recreational activities (fishing and picnicking) that that are common at various sites in the river catchments and are an important source of employment to the villagers and local economy. The river catchments are also an important source of cultural ecosystem services, as some places are considered sacred (Figure 15). For example, Lake Funduzi is a sacred place, home to the python god. It is a place where local people go to worship their ancestors and chiefs are buried there. Similarly, the sacred Phiphidi falls, Mahovhovho falls and the sacred forests are places where the local people communicate with their ancestors. There are many sacred sites dotted along the Nzhelele and Levuvhu rivers used by the Venda people to practice their traditions. Nevertheless, some of these sacred sites are under threat as a result of tourism, soil erosion, soil mining and agricultural expansion. A major threat to the water system and sacred places is the impending construction of the Makhado Mine which is along the Nzhelele catchment. The new mine threatens to destroy sacred sites as well as deplete water resources, which are already under threat owing to drought. The development of an integrated mining and heritage plan is therefore a critical component in updating the Spatial Development Plan (SDF), Special Economic Zones (SEZ) and Municipal Integrated Development Plans (MIDP) covering the study area catchment areas.

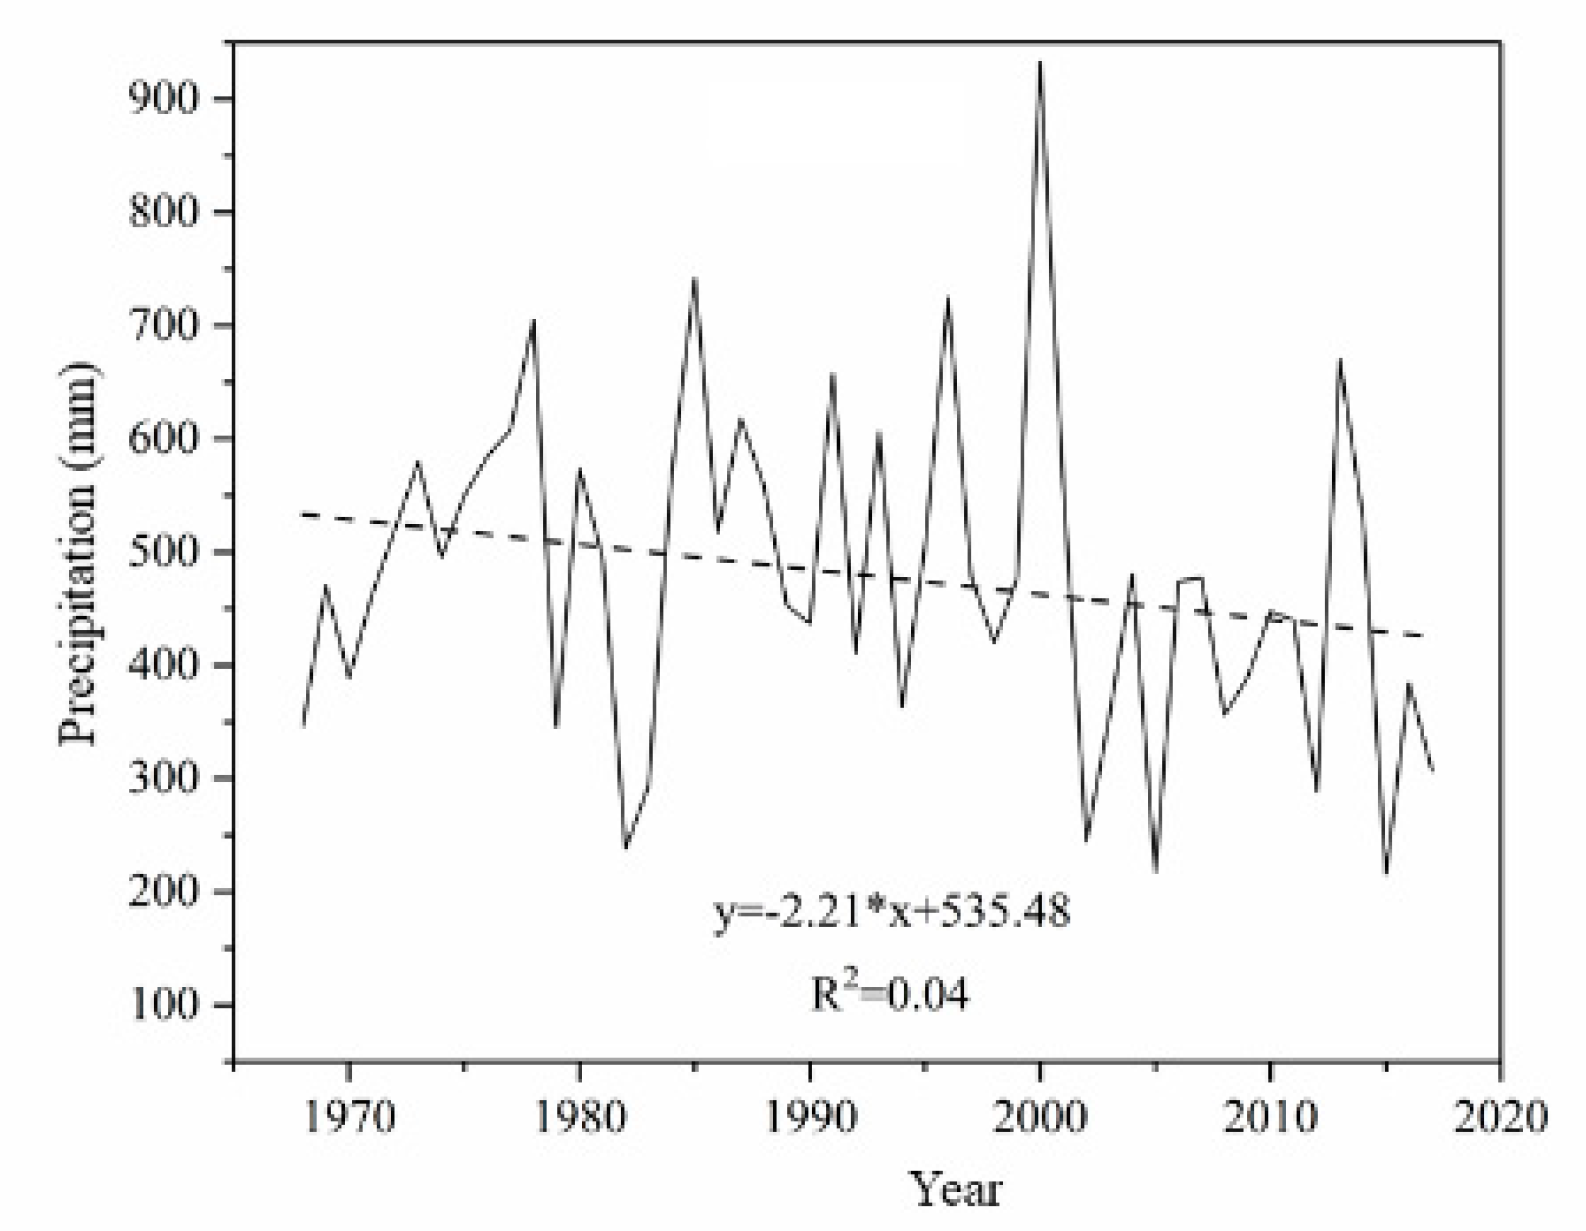
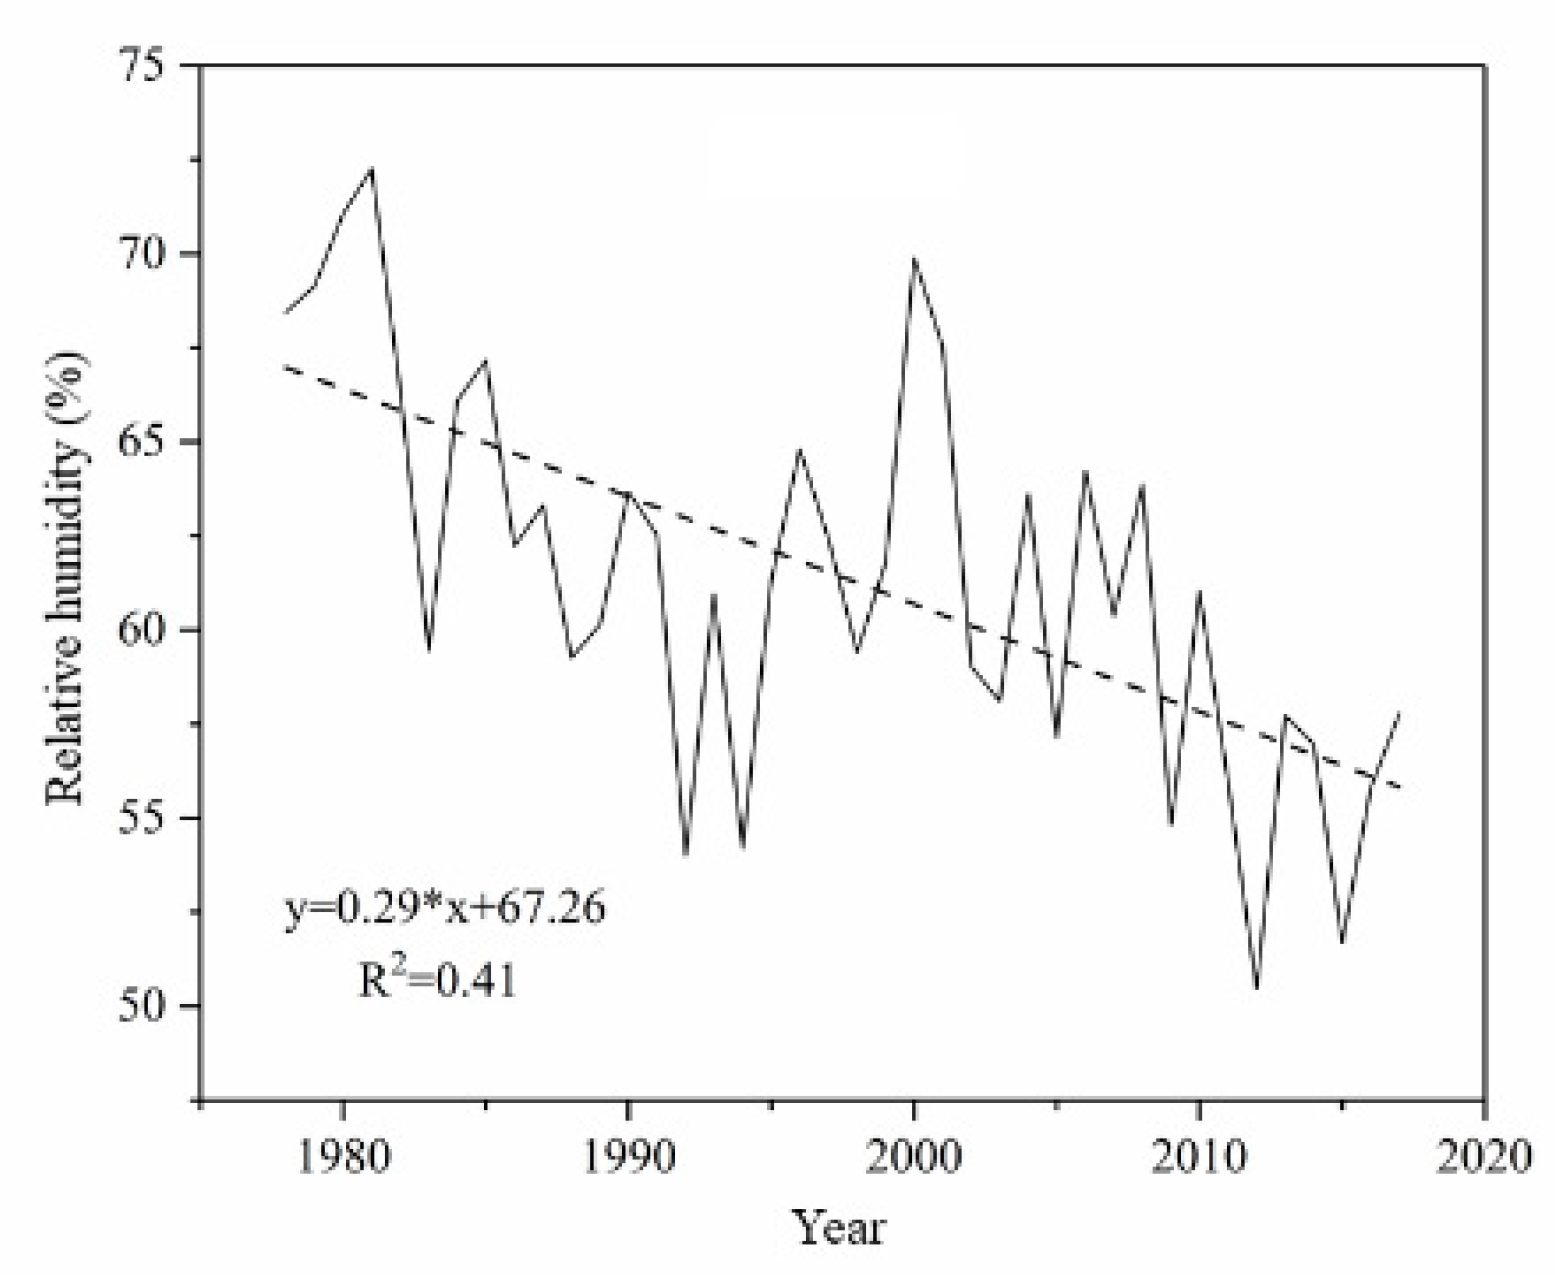
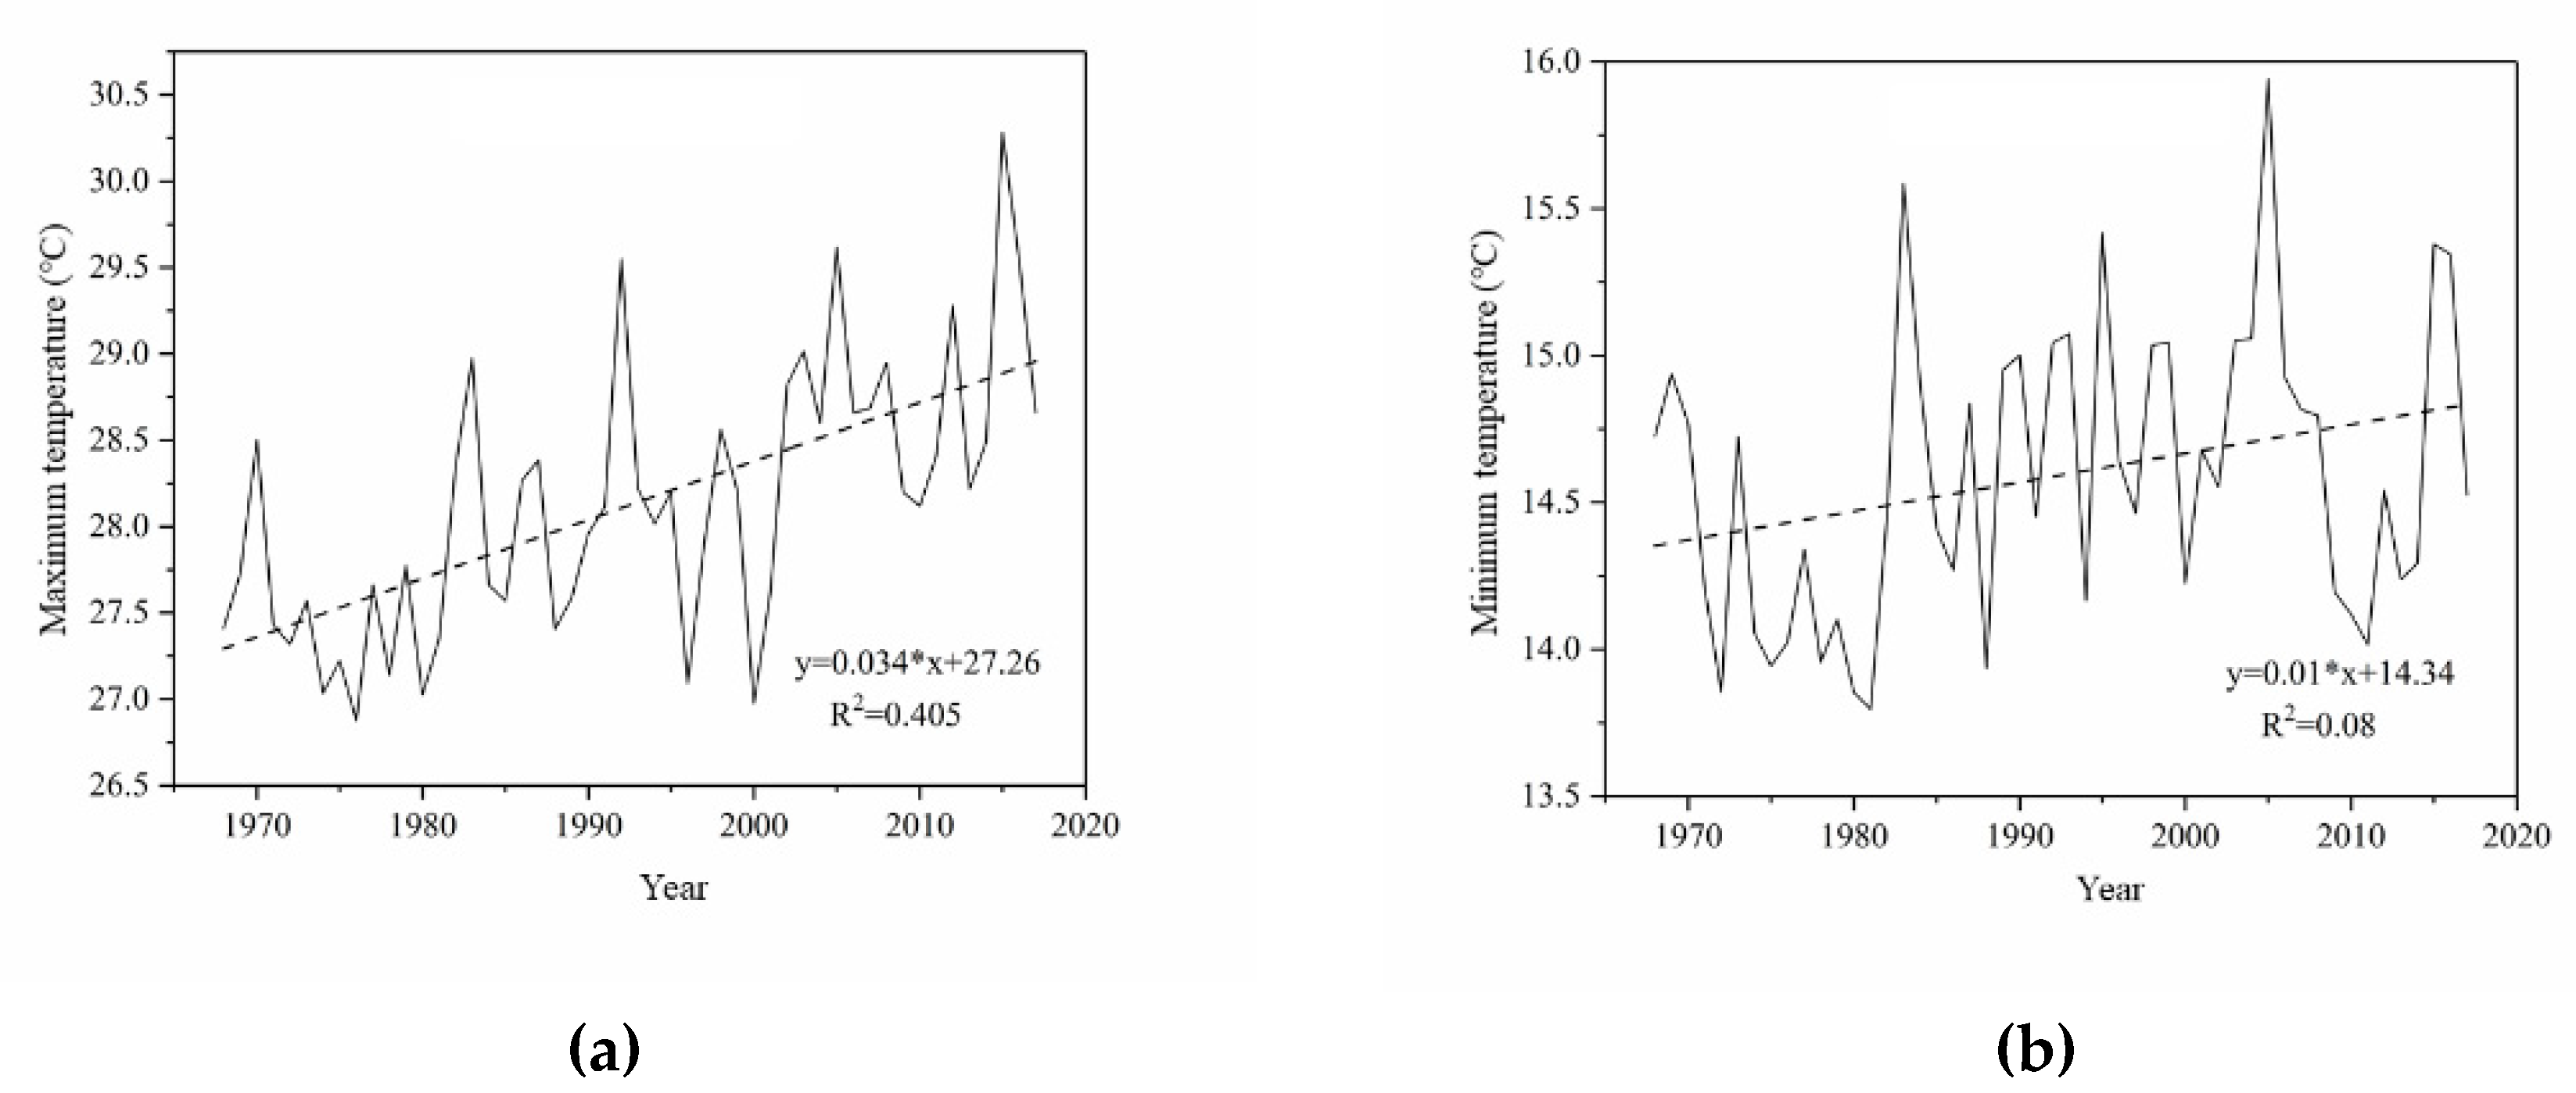
3.4. Climate Change and Its Impacts

From a climate change perspective, since 1968 the overall trend has been a decline in precipitation (Figure 16), and relative humidity in the river catchments (Figure 17). This decline is problematic, because the majority of residents in the river catchments depend on rain-fed agriculture. Of note was the spike in precipitation in 2000 as a result of the extreme weather event Cyclone Leon-Eline [72]. However, despite the decline in overall precipitation, there has been an increase in extreme weather events such as, Cyclone Domonia in 1984 [73], Tropical Storm Irina in 2011–2012 [72] and Cyclone Dineo in 2017 [69]. These cyclones and tropical storms have high-speed winds and precipitate large rain downpours in a short period of time which destroys infrastructure, causes loss of life, displaces people and causes flooding [74]. For example, the cultivation on slopes and the clearing of vegetation exacerbated the flooding in the study area as a result of Cyclone Leon-Eline [72]. Consequently, people, settlements and agricultural plots are vulnerable, and this calls for better disaster preparedness and coping strategies to mitigate the impact of cyclones in the study areas.
The decline in precipitation has also been met with an overall increase in average maximum and minimum temperatures, which has caused droughts in the river catchments (Figure 18). These droughts are normally associated with El Niño events and occurred in the early 1980s, early 1990s, 2004–2005 and in the 2015–2016 seasons [57]. The droughts in the river catchment areas largely affected the agricultural livelihood systems and activities that depend on rain fed agriculture in the study areas. As a result, there has been a decline in crop production leading to families diversifying their livelihood systems and practices. One adaptation strategy is that people migrate to cities in search of better opportunities as a result of declining agricultural yields. They support family members through remittances, among other coping mechanisms.
The erratic rainfall and high temperature have changed the length in seasons. Farmers have adapted to the climate changes through planting varieties that have a short growing season and also by farming drought-resistant crops such as sorghum and millet. However, although the residents can clearly see the decline in maize production as a result of droughts, maize is still their preferred crop as it is an essential constituent of their staple food. Thus, changing to other drought-resistant crops such as sorghum and millet requires a mindset shift and a concerted effort. There is thus a strong drive by the government to change to other rapidly maturing maize crop varieties, as well as to plant cereals such as sorghum and millet. Other impacts of the droughts include loss of livestock (cattle, sheep and goats) because of shrinking grazing land. Consequently, farmers are being urged to destock and sell their livestock to minimize losses during droughts as a result of lack of grazing. Climate change also has increased disease outbreaks such as malaria, since mosquitos thrive in warmer areas. However, scholars argue that an increase in temperature alone is not the only reason that explains an increase in malaria incidence. Drug resistance, inadequate mosquito control programs, inadequate public health facilities, and low living standards are also factors that strongly explain the resurgence in malarial incidences in the northern parts of South Africa [75].

4. Summary and Conclusions

The point of departure for the study was to survey the local community and comprehend their perceptions of landscape change. An objective of the study was to survey community livelihoods. Accordingly, the study results and findings have showed that there is poverty with a gender bias in the Nzhelele and Levuvhu river catchments. Poverty often compels communities to engage in livelihood systems and practices that are detrimental to the environment, such as soil mining and over-harvesting of natural resources. Consequently, if poverty is addressed through agricultural support and value-adding employment opportunities, harm to the environment will be reduced.
The communities in the Nzhelele and Levuvhu river catchment areas face challenges such as lack of finance, lack of stakeholder support and poor government support for agriculture as well as poor comprehension of rural development realities by the government. Consequently, for the government policies and support systems to work better, such actions and measures should integrate the local communities and culture. This will increase the chance of landscape change reversal interventions being a success in the study area, in similar areas in South Africa and elsewhere in developing countries generally.
Another objective of the study was to learn about the perceptions of local communities to landscape change including identifying the drivers for such change and comparing these results with land-cover maps derived from satellite imagery. The perception that the landscape has changed is unanimous in the study area, and this is confirmed by the land-cover change analysis. However, most of the change has been detrimental to the environment. The major drivers are climate change, increased urbanization, agriculture, and forestry. Proximate drivers of changes are politics (land reform and traditional land authorities), the economy (markets) and culture. The study also sought to comprehend the ecosystem services provided by nature and to identify the impacts of climate change on the landscape, ecosystem services and livelihoods. The results also show that the communities in the Nzhelele and Levuvhu river catchments practice subsistence farming that is largely rain-fed dependent. However, due to droughts and erratic rainfall, some farmers have shifted to irrigation-based farming as a coping mechanism. Others have diversified into market gardening and growing fruits, which offer better returns. Despite the decline in rainfall, the communities still find it difficult to shift from farming maize to drought-resistant crops such as sorghum and millet. Similarly, the droughts, overgrazing and lack of pastures has also meant loss of livestock and destocking of animals to guard against future losses. Overall, poverty hinders the community’s response, mitigation and adaptation attempts to climate change. In the study, we gleaned that the changes in the landscape affect the provision in ecosystem services and livelihoods. For example, landscape change has led to ecosystem disservices such as a decline in soil quality as a result of soil erosion, damage to wetlands, overgrazing, inadequate and poor-quality water, deforestation, and over-harvesting of natural resources. As a result, the communities’ livelihood systems and practices are affected negatively. Owing to erratic rainfall and the realization that returns in agriculture are low, there is de-agrarianizataion with most residents arguing that they want better employment opportunities.
The study highlights the nexus between landscape change, climate change ecosystems services and livelihood systems and practices. Climate change impacts landscape change, which is driven by other factors such as agriculture, urbanization and forestry. Besides these direct drivers, other underlying drivers such as politics and culture need to be considered in the study area. In turn, the landscape change affects provision of ecosystem services (water, soils, vegetation, crops) which consequently affects people’s livelihoods. Consequently, when proposing agricultural policies and strategies as well as land management policies in rural areas such as the Nzhelele and Levuvhu river catchments, government and other stakeholders should take cognizance of peoples’ culture and knowledge and propose ecosystem services-based land-management practices.

Author Contributions

Conceptualization, W.M., S.W., O.L.M., M.M.T., S.M., H.Z., B.W., E.F. and N.P.; Data curation, W.M., S.W., F.W., O.L.M., W.Z., N.A.N. and N.P.; Formal analysis, W.M., S.W., F.W., O.L.M., S.M., N.A.N., E.F. and N.P.; Funding acquisition, W.M., S.W., S.M., H.Z., B.W., Z.E.M., T.G., B.M. and N.P.; Investigation, W.M., S.W., F.W., O.L.M., M.M.T., S.M., H.Z., W.Z., N.A.N., Z.E.M., J.C., T.G., B.M., E.F., V.Y.-L. and N.P.; Methodology, W.M., S.W., F.W., O.L.M., M.M.T., S.M., H.Z., N.A.N., Z.E.M., J.C., T.G., B.M., E.F. and N.P.; Project administration, W.M., S.W., O.L.M., M.M.T., H.Z., B.W., W.Z., Z.E.M., J.C., T.C., B.M., V.Y.-L. and N.P.; Resources, W.M., S.W., M.M.T., B.W., W.Z. and N.P.; Software, W.M., S.W. and F.W.; Supervision, W.M., S.W., O.L.M., M.M.T., B.W., Z.E.M. and J.C.; Validation, W.M., S.W., F.W., O.L.M., S.M. and B.M.; Visualization, W.M., S.W. and F.W.; Writing—original draft, W.M. and N.A.N.; Writing—review and editing, W.M., F.W., S.M., J.C., T.G. and F.K. All authors have read and agreed to the published version of the manuscript.

Funding

This work was funded by The National Research Foundation, South Africa (Grant No. 110778), the National Natural Science Foundation of China (Grant No. 4171101213), National Research Foundation, South Africa (Grant No. 119288).

Acknowledgments

We are grateful to the support everyone who participated in the project.

Conflicts of Interest

The authors declare no conflict of interest.

References

  1. Amici, V.; Maccherini, S.; Santi, E.; Torri, D.; Vergari, F.; Del Monte, M. Long-term patterns of change in a vanishing cultural landscape: A GIS-based assessment. Ecol. Inform. 2017, 37, 38–51. [Google Scholar] [CrossRef]
  2. Liu, Y.; Fu, B.; Zhao, W.; Wang, S.; Deng, Y. A solution to the conflicts of multiple planning boundaries: Landscape functional zoning in a resource-based city in China. Habitat Int. 2018, 77, 43–55. [Google Scholar] [CrossRef]
  3. Hersperger, A.M.; Schneeberger, N. Driving forces of landscape change—Current and new directions. Landsc. Ecol. 2005, 19, 857–868. [Google Scholar]
  4. Plieninger, T.; Draux, H.; Fagerholm, N.; Bieling, C.; Bürgi, M.; Kizos, T.; Kuemmerle, T.; Primdahl, J.; Verburg, P. The driving forces of landscape change in Europe: A systematic review of the evidence. Land Use Policy 2016, 57, 204–214. [Google Scholar] [CrossRef] [Green Version]
  5. Schneeberger, N.; Bürgi, M.; Hersperger, A.M.; Ewald, K. Driving forces and rates of landscape change as a promising combination for landscape change research—An application on the northern fringe of the Swiss Alps. Land Use Policy 2007, 24, 349–361. [Google Scholar] [CrossRef]
  6. Bürgi, M.; Russell, E.W. Integrative methods to study landscape changes. Land Use Policy 2001, 18, 9–16. [Google Scholar] [CrossRef]
  7. Hersperger, A.M.; Bürgi, M. Going beyond landscape change description: Quantifying the importance of driving forces of landscape change in a Central Europe case study. Land Use Policy 2009, 26, 640–648. [Google Scholar] [CrossRef]
  8. Musakwa, W.; Wang, S. Landscape change and its drivers: A Southern African perspective. Curr. Opin. Environ. Sustain. 2018, 33, 80–86. [Google Scholar] [CrossRef]
  9. Musakwa, W.; Van Niekerk, A. Implications of land use change for the sustainability of urban areas: A case study of Stellenbosch, South Africa. Cities 2013, 32, 143–156. [Google Scholar] [CrossRef]
  10. Wei, H.; Zhao, W.; Zhang, X.; Wang, X. Regional ecosystem service value evaluation based on land use changes: A case study in Dezhou, Shandong Province, China. Acta Ecol. Sin. 2017, 37, 3830–3839. [Google Scholar]
  11. Calder, I.R. Forests and hydrological services: Reconciling public and science perceptions. Land Use Water Resour. Res. 2002, 2, 1–12. [Google Scholar]
  12. Southworth, J.; Ryan, S.J.; Bunting, E.; Herrero, H.V.; Nagendra, H.; Gibbes, C.; Agarwal, S. Protected Areas, Climate Change, and Ecosystem Sustainability A—Liang, Shunlin, in Comprehensive Remote Sensing. Elsevier: Oxford, UK, 2018; pp. 202–219. [Google Scholar]
  13. Tress, B.; Tress, G. Environmental and landscape change: Addressing an interdisciplinary agenda. J. Environ. Manag. 2009, 90, 2849–2850. [Google Scholar] [CrossRef] [PubMed]
  14. Tress, B.; Tress, G.; Fry, G. Integrative research on environmental and landscape change: PhD students’ motivations and challenges. J. Environ. Manag. 2009, 90, 2921–2929. [Google Scholar] [CrossRef] [PubMed]
  15. Zhang, Q.-J.; Fu, B.; Chen, L.-D.; Zhao, W.; Yang, Q.-K.; Liu, G.-B.; Gulinck, H. Dynamics and driving factors of agricultural landscape in the semiarid hilly area of the Loess Plateau, China. Agric. Ecosyst. Environ. 2004, 103, 535–543. [Google Scholar] [CrossRef]
  16. Xu, L.; Tu, Z.; Zhou, Y.; Yu, G. Profiling human-induced vegetation change in the horqin sandy land of china using time series datasets. Sustain. 2018, 10, 1068. [Google Scholar] [CrossRef] [Green Version]
  17. U.N. Transforming our World: The 2030 Agenda for Sustainable Development; United Nations: New York, NY, USA, 2015. [Google Scholar]
  18. Li, F.; Liu, K.; Tang, H.; Liu, L.; Liu, H. Analyzing trends of dike-ponds between 1978 and 2016 using multi-source remote sensing images in Shunde district of south China. Sustainability 2018, 10, 3504. [Google Scholar] [CrossRef] [Green Version]
  19. Musacchio, L.R. The scientific basis for the design of landscape sustainability: A conceptual framework for translational landscape research and practice of designed landscapes and the six Es of landscape sustainability. Landsc. Ecol. 2009, 24, 993–1013. [Google Scholar] [CrossRef]
  20. Wu, J. Landscape sustainability science: Ecosystem services and human well-being in changing landscapes. Landsc. Ecol. 2013, 28, 999–1023. [Google Scholar] [CrossRef]
  21. Board, M.A. Millennium Ecosystem Assessment; Island Pres: Washington, DC, USA; New Island, Japan, 2005; Volume 13. [Google Scholar]
  22. Lambin, E.F.; Geist, H.J. Land Use and Land Cover Change: Local Processes and Global Impacts; Springer: New York, NY, USA, 2005. [Google Scholar]
  23. Lambin, E.F.; Turner, B.; Geist, H.J.; Agbola, S.B.; Angelsen, A.; Bruce, J.W.; Coomes, O.T.; Dirzo, R.; Fischer, G.; Folke, C.; et al. The causes of land-use and land-cover change: Moving beyond the myths. Glob. Environ. Chang. 2001, 11, 261–269. [Google Scholar] [CrossRef]
  24. Makungo, R.; Odiyo, J.; Ndiritu, J.; Mwaka, B. Rainfall–runoff modelling approach for ungauged catchments: A case study of Nzhelele River sub-quaternary catchment. Phys. Chem. Earth, Parts A B C 2010, 35, 596–607. [Google Scholar] [CrossRef]
  25. De Groot, R.; Alkemade, R.; Braat, L.; Hein, L.; Willemen, L. Challenges in integrating the concept of ecosystem services and values in landscape planning, management and decision making. Ecol. Complex. 2010, 7, 260–272. [Google Scholar] [CrossRef]
  26. Millennium Ecosystem Assessment Ecosystems and Human Well-Being; Island Press: Washington, DC, USA, 2005; Volume 5.
  27. Goldblatt, A. Agriculture: Facts & Trends South. Africa; von Bormann, T., Ed.; World Wildlife Fund (WWF): Grand, Switzerland, 2016. [Google Scholar]
  28. Masunungure, C.; Shackleton, S. Exploring long-term livelihood and landscape change in two semi-arid sites in southern Africa: Drivers and consequences for social—Ecological vulnerability. Land 2018, 7, 50. [Google Scholar] [CrossRef] [Green Version]
  29. Rusere, F.; Mkuhlani, S.; Crespo, O.; Dicks, L. Developing pathways to improve smallholder agricultural productivity through ecological intensification technologies in semi-arid Limpopo, South Africa. Afr. J. Sci. Technol. Innov. Dev. 2019, 11, 543–553. [Google Scholar] [CrossRef]
  30. Mpandeli, S.; Maponya, P. Constraints and challenges facing the small-scale farmers in Limpopo Province, South Africa. J. Agric. Sci. 2014, 6, 135. [Google Scholar] [CrossRef] [Green Version]
  31. Giannecchini, M.; Twine, W.; Vogel, C. Land-cover change and human? Environment interactions in a rural cultural landscape in South Africa. Geogr. J. 2007, 173, 26–42. [Google Scholar] [CrossRef]
  32. Kleynhans, W.; Salmon, B.; Wessels, K.; Olivier, J. Rapid detection of new and expanding human settlements in the Limpopo province of South Africa using a spatio-temporal change detection method. Int. J. Appl. Earth Obs. Geoinf. 2015, 40, 74–80. [Google Scholar] [CrossRef] [Green Version]
  33. Gibson, D.J. Land Degradation in the Limpopo Province, South Africa. Ph.D. Thesis, University of the Witwatersrand Johannesburg, Johannesburg, South Africa, 2006. [Google Scholar]
  34. Zhao, W.; Liu, Y.; Daryanto, S.; Fu, B.; Wang, S.; Liu, Y. Metacoupling supply and demand for soil conservation service. Curr. Opin. Environ. Sustain. 2018, 33, 136–141. [Google Scholar] [CrossRef]
  35. Cushman, S.A.; Wallin, D.O. Rates and patterns of landscape change in the central sikhote-alin mountains, Russian Far East. Landsc. Ecol. 2000, 15, 643–659. [Google Scholar] [CrossRef]
  36. Moseley, R.K. Historical landscape change in northwestern Yunnan, China. Mt. Res. Dev. 2006, 26, 214–219. [Google Scholar] [CrossRef] [Green Version]
  37. Sohl, T.; Dornbierer, J.; Wika, S.; Robison, C. Remote sensing as the foundation for high-resolution United States landscape projections—The Land Change Monitoring, assessment, and projection (LCMAP) initiative. Environ. Model. Softw. 2019, 120, 104495. [Google Scholar] [CrossRef]
  38. Krajewski, P. Monitoring of landscape transformations within landscape parks in Poland in the 21st century. Sustainability 2019, 11, 2410. [Google Scholar] [CrossRef] [Green Version]
  39. Wei, F.; Wang, S.; Fu, B.; Zhang, L.; Fu, C.; Kanga, E.M. Balancing community livelihoods and biodiversity conservation of protected areas in East Africa. Curr. Opin. Environ. Sustain. 2018, 33, 26–33. [Google Scholar] [CrossRef]
  40. Chidumayo, E.N. Changes in miombo woodland structure under different land tenure and use systems in central Zambia. J. Biogeogr. 2002, 29, 1619–1626. [Google Scholar] [CrossRef]
  41. Schulp, N.; Levers, C.; Kuemmerle, T.; Tieskens, K.; Verburg, P. Mapping and modelling past and future land use change in Europe’s cultural landscapes. Land Use Policy 2019, 80, 332–344. [Google Scholar] [CrossRef]
  42. Wang, S.; Fu, B.; Piao, S.; Lü, Y.; Ciais, P.; Feng, X.; Wang, Y. Reduced sediment transport in the Yellow River due to anthropogenic changes. Nat. Geosci. 2015, 9, 38–41. [Google Scholar] [CrossRef]
  43. Fu, B.; Wang, S.; Liu, Y.; Liu, J.; Liang, W.; Miao, C. Hydrogeomorphic ecosystem responses to natural and anthropogenic changes in the loess plateau of China. Annu. Rev. Earth Planet. Sci. 2017, 45, 223–243. [Google Scholar] [CrossRef]
  44. De Almeida, A.S.; Vieira, I.C.G.; Ferraz, S.F. Long-term assessment of oil palm expansion and landscape change in the eastern Brazilian Amazon. Land Use Policy 2020, 90, 104321. [Google Scholar] [CrossRef]
  45. Japelaghi, M.; Gholamalifard, M.; Shayesteh, K. Spatio-temporal analysis and prediction of landscape patterns and change processes in the Central Zagros region, Iran. Remote Sens. Appl. Soc. Environ. 2019, 15, 100244. [Google Scholar] [CrossRef]
  46. Jiang, P.; Li, M.; Lv, J. The causes of farmland landscape structural changes in different geographical environments. Sci. Total Environ. 2019, 685, 667–680. [Google Scholar] [CrossRef]
  47. Konkoly-Gyuró, É.D. Conceptualisation and perception of the landscape and its changes in a transboundary area. A case study of the southern German-French borderland. Land Use Policy 2018, 79, 556–574. [Google Scholar] [CrossRef]
  48. Leite, S.K.; Vendruscolo, G.S.; Renk, A.; Kissmann, C. Perception of farmers on landscape change in southern Brazil: Divergences and convergences related to gender and age. J. Rural. Stud. 2019, 69, 11–18. [Google Scholar] [CrossRef]
  49. Nowosad, J.; Stepinski, T.F.; Netzel, P. Global assessment and mapping of changes in mesoscale landscapes: 1992–2015. Int. J. Appl. Earth Obs. Geoinf. 2019, 78, 332–340. [Google Scholar] [CrossRef] [Green Version]
  50. McNicol, I.; Ryan, C.M.; Williams, M. How resilient are African woodlands to disturbance from shifting cultivation? Ecol. Appl. 2015, 25, 2320–2336. [Google Scholar] [CrossRef] [PubMed]
  51. Tukey, J.W. Comparing individual means in the analysis of variance. Biometrics 1949, 5, 99. [Google Scholar] [CrossRef]
  52. Abdi, H.; Williams, L.J. Tukey’s honestly significant difference (HSD) test. In Encyclopedia of Research Design; Sage: Thousand Oaks, CA, USA, 2010; pp. 1–5. [Google Scholar]
  53. Deng, Z.; Zhu, X.; He, Q.; Tang, L. Land use/land cover classification using time series Landsat 8 images in a heavily urbanized area. Adv. Space Res. 2019, 63, 2144–2154. [Google Scholar] [CrossRef]
  54. Yan, J.; Wang, L.; Song, W.; Chen, Y.; Chen, X.; Deng, Z. A time-series classification approach based on change detection for rapid land cover mapping. ISPRS J. Photogramm. Remote Sens. 2019, 158, 249–262. [Google Scholar] [CrossRef]
  55. Wang, C.; Middel, A.; Myint, S.W.; Kaplan, S.; Brazel, A.J.; Lukasczyk, J. Assessing local climate zones in arid cities: The case of Phoenix, Arizona and Las Vegas, Nevada. ISPRS J. Photogramm. Remote Sens. 2018, 141, 59–71. [Google Scholar] [CrossRef]
  56. Krajewski, P.; Solecka, I.; Mrozik, K. Forest landscape change and preliminary study on its driving forces in Ślęża landscape park (Southwestern Poland) in 1883–2013. Sustainability 2018, 10, 4526. [Google Scholar] [CrossRef] [Green Version]
  57. Krajewski, P. Assessing change in a high-value landscape: Case study of the municipality of Sobotka, Poland. Pol. J. Environ. Stud. 2017, 26, 2603–2610. [Google Scholar] [CrossRef]
  58. Woodward, A.J.W.; Fuhlendorf, S.; Leslie, D.M.; Shackford, J. Influence of landscape composition and change on lesser prairie-chicken (Tympanuchus pallidicinctus) populations. Am. Midl. Nat. 2001, 145, 261–274. [Google Scholar] [CrossRef] [Green Version]
  59. Masemola, M.; Aardt, C.; Coetzee, M. Household Income and Expenditure Patterns in South Africa 2011; Bureau of Market Research: Pretoria, South Africa; UNISA: Adelaide, Australia, 2012. [Google Scholar]
  60. Blair, D.; Shackleton, C.; Mograbi, P. Cropland abandonment in South African smallholder communal lands: Land cover change (1950–2010) and farmer perceptions of contributing factors. Land 2018, 7, 121. [Google Scholar] [CrossRef] [Green Version]
  61. Lahiff, E.; Cousins, B. Smallholder Agriculture and Land Reform in South Africa. IDS Bull. 2005, 36, 127–131. [Google Scholar] [CrossRef] [Green Version]
  62. Munyai, A.S. The tenacity of African traditional religion in Venda Christianity: A missional investigation. Ph.D. Thesis, University of Pretoria, Pretoria, South Africa, 2017. [Google Scholar]
  63. Vermaak, N. The Thohoyandou informal market and integrated development. J. Public Adm. 2014, 49, 1185–1195. [Google Scholar]
  64. Bruinsma, J. World Agriculture: Towards 2015/2030: An FAO Study; Routledge: Abingdon upon Thames, UK, 2017. [Google Scholar]
  65. Ntshuxeko, V.E.; Ruwanza, S. Physical properties of soil in Pine elliottii and Eucalyptus cloeziana plantations in the Vhembe biosphere, Limpopo Province of South Africa. J. For. Res. 2018, 1–11. [Google Scholar] [CrossRef]
  66. Munyati, C.; Kabanda, T.A. Using multitemporal Landsat TM imagery to establish land use pressure induced trends in forest and woodland cover in sections of the Soutpansberg Mountains of Venda region, Limpopo Province, South Africa. Reg. Environ. Chang. 2008, 9, 41–56. [Google Scholar] [CrossRef]
  67. Siebert, S.J.; Mutshinyalo, T. Myth as a biodiversity conservation strategy for the Vhavenda, South Africa. Indilinga Afr. J. Indig. Knowl. Syst. 2010, 9, 2151–2171. [Google Scholar]
  68. Mavengahama, S.; McLachlan, M.; De Clercq, W. The role of wild vegetable species in household food security in maize based subsistence cropping systems. Food Secur. 2013, 5, 227–233. [Google Scholar] [CrossRef] [Green Version]
  69. Moses, O.; Ramotonto, S. Assessing forecasting models on prediction of the tropical cyclone Dineo and the associated rainfall over Botswana. Weather. Clim. Extremes 2018, 21, 102–109. [Google Scholar] [CrossRef]
  70. Alhassan, H.; Kwakwa, P.A. When water is scarce: The perception of water quality and effects on the vulnerable. J. Water Sanit. Hyg. Dev. 2013, 4, 43–50. [Google Scholar] [CrossRef]
  71. Makungo, R.; Odiyo, J.; Tshidzumba, N. Performance of small water treatment plants: The case study of Mutshedzi Water Treatment Plant. Phys. Chem. Earth, Parts A B C 2011, 36, 1151–1158. [Google Scholar] [CrossRef]
  72. Fitchett, J.; Grab, S. A 66-year tropical cyclone record for south-east Africa: Temporal trends in a global context. Int. J. Clim. 2014, 34, 3604–3615. [Google Scholar] [CrossRef]
  73. Manyatsi, A. Application of indigenous knowledge systems in hydrological disaster management in Swaziland. Curr. Res. J. Soc. Sci. 2011, 3, 353–357. [Google Scholar]
  74. Musyoki, A.; Thifhulufhelwi, R.; Murungweni, F.M. The impact of and responses to flooding in Thulamela Municipality, Limpopo Province, South Africa. Jàmbá J. Disaster Risk Stud. 2016, 8, 166. [Google Scholar] [CrossRef] [PubMed]
  75. Nabi, S.; Qader, S. Is Global Warming likely to cause an increased incidence of Malaria? Libyan J. Med. 2009, 4, 18–22. [Google Scholar] [CrossRef] [PubMed]
Figure 1. Location of study area.
Land 09 00091 g001
Figure 2. Income levels in the Nzhelele and Levuvhu river catchments.
Land 09 00091 g002
Figure 3. Relationship between income and employment levels in the Nzhelele and Levuvhu river catchments.
Land 09 00091 g003
Figure 4. Employment levels according to gender levels in the Nzhelele and Levuvhu river catchments.
Land 09 00091 g004
Figure 5. Correspondence between income levels and gender in the Nzhelele and Levuvhu river catchments.
Land 09 00091 g005
Figure 6. Education levels according to gender in the Nzhelele and Levuvhu river catchments.
Land 09 00091 g006
Figure 7. Correspondence between education levels and income in the Nzhelele and Levuvhu river catchments.
Land 09 00091 g007
Figure 8. Common crops cultivated in the Nzhelele and Levuvhu river catchments.
Land 09 00091 g008
Figure 9. Livestock reared in the Nzhelele and Levuvhu river catchments.
Land 09 00091 g009
Figure 10. Common challenges faced by communities in the Nzhelele and Levuvhu river catchments.
Land 09 00091 g010
Figure 11. Landscape change perceptions by communities in the Nzhelele and Levuvhu river catchments.
Land 09 00091 g011
Figure 12. Perceptions on the benefits of controlling soil erosion by communities in the Nzhelele and Levuvhu river catchments.
Land 09 00091 g012
Figure 13. Land-cover maps for the Nzhelele and Levuvhu river catchments for (a)1999, (b) 2008 and (c) 2018.
Land 09 00091 g013aLand 09 00091 g013b
Figure 14. Proximate drivers of landscape change in the Nzhelele and Levuvhu river catchments.
Land 09 00091 g014
Figure 15. Perceptions of ecosystem services in the Nzhelele and Levuvhu river catchments.
Land 09 00091 g015
Figure 16. Trends in rainfall from 1968–2017 in the Nzhelele and Levuvhu river catchments.
Land 09 00091 g016
Figure 17. Trends in humidity from 1968–2017 in the Nzhelele and Levuvhu river catchments.
Land 09 00091 g017
Figure 18. Trends in temperature from 1968–2017 in the Nzhelele and Levuvhu river catchments, (a) maximum temperature and (b) minimum temperature.
Land 09 00091 g018
Table 1. Land-cover change in Nzhelele and Levuvhu river catchments between 1999 and 2018.
Land Cover ClassArea 1999 (ha 1)Area 2008 (ha)Area 2018 (ha)Change in (ha) 1999–2008Change in (ha) 2008–2018Area in % 2 1999Area in % 2008Area in % 2018CA 31999–2008CA 2008–2018
Bare land180,507.1195,890.0207,242.915,382.911,352.917.819.420.41.51.1
Cropland41,211.999,966.0150,637.158,754.150,671.14.19.914.95.85.0
Grassland301,414.2260,409.0221,743.541,005.238,665.529.725.821.9-4.0-3.8
Settlements169,651.5176,452.0190,803.86800.514,351.816.717.518.80.71.4
Vegetation307,255.6263,404.0228,034.243,851.635,369.830.326.122.5-4.3–3.5
Water14,125.414,268.014,962.1142.6694.11.41.41.50.00.1
LCI 48.17.4
1 Hectares; 2 percent; 3 changes in percentage share of areas covered by each land cover class in relation to the total area of study area; 4 landscape change index.

