Identifying Land Use Change Trajectories in Brazil’s Agricultural Frontier


1
National Institute for Space Research (INPE), São José dos Campos, São Paulo 12227-010, Brazil
2
Group on Earth Observations (GEO), CH-1211 Geneva, Switzerland
*
Author to whom correspondence should be addressed.
†
These authors contributed equally to this work.
Land 2020, 9(12), 506; https://doi.org/10.3390/land9120506
Submission received: 28 September 2020
/
Revised: 14 November 2020
/
Accepted: 17 November 2020
/
Published: 10 December 2020
(This article belongs to the Special Issue Monitoring Brazilian Natural and Human-Modified Landscapes)
Abstract
:Many of the world’s agricultural frontiers are located in the tropics. Crop and cattle expansion in these regions has a strong environmental impact. This paper examines land use and land cover transformations in Brazil, where large swaths of natural vegetation are being removed to make way for agricultural production. In Brazil, the land use dynamics are of great interest regarding the country’s sustainable development and climate mitigation actions, leading to the formulation and implantation of public policies and supply chain interventions to reduce deforestation. This paper uses temporal trajectory analysis to discuss the patterns of agricultural practices change in the different biomes of Mato Grosso State, one of Brazil’s agricultural frontiers. Taking yearly land use and cover classified images from 2001 to 2017, we identified, quantified, and spatialized areas of stability, intensification, reduction, interchange, and expansion of single and double cropping. The LUC Calculus was used as a tool to extract information about trajectories and trajectories of change. Over two decades, the land use change trajectories uncover the interplay between forest removal, cattle raising, grain production, and secondary vegetation regrowth. We observed a direct relationship between the conversion of forest areas to pasture and of pasture to agriculture areas in the Amazon portion of the Mato Grosso State in different periods. Our results enable a better understanding of trends in agricultural practices.
1. Introduction
Understanding land use dynamics in Brazil is essential to derive policies for sustainable development and climate mitigation. In recent years, land grabbing, illegal exploitation of natural resources, and speculation of public lands significantly increased Brazil’s deforestation [1,2]. Large areas of Amazonia and Cerrado biomes have either lost their vegetation cover completely or suffered strong degradation [3]. Sound policies that balance forest protection and agricultural production need to consider the long- and medium-term land use conversion trends in the region [4,5].
In Brazil, farmland demand is an essential driver for deforestation, with forest areas being replaced by agriculture and cattle ranching [6,7]. Depending on the area, the land can then be converted to crop production, kept as pasture for cattle, or temporarily abandoned. In a recent study, Picoli et al. [5] described an interlinkage of direct and indirect effects of deforestation in Mato Grosso State, Brazil. For instance, when farmers buy pasture areas to convert to agriculture, they might not realize the natural vegetation loss caused by the pasture expansion. For Brazil to achieve a substantial reduction of deforestation, public policies have to take into account both direct and indirect land use change [5,7,8,9,10,11,12,13,14].
Understanding the trajectories of land use and land cover change is important to provide helpful information to policymakers to understand trends and the impacts, for instance, of the agricultural production on direct and indirect land use change, and how these changes can increase risk and vulnerability at local, regional or global levels. With this motivation, this work uses trajectory analysis to discover trends in land use change from 2001 to 2017 in the state of Mato Grosso, Brazil. This region experiences a dynamic on land use based on processes that occurred in tropical zones in the last decades [13,15,16]. In this work, trajectory analysis is used to quantify and spatialize patterns of change, related to agricultural practices, in Mato Grosso State, using multi-temporal data.
Previous studies using land used trajectories in the Amazon region include McCracken et al. [17], who discussed deforestation trajectories at farm-level, in non-consecutive years, from 1970 to 1996, aimed at studying the patterns of deforestation and the length of time on the farm; Pinheiro et al. [18] studied deforestation trajectories to reveal forest degradation associated with logging frontier expansion along a major roadway, in non-consecutive years. In other regions, Nainggolan et al. [19] used land use trajectories to identify patterns of intensification, agricultural abandonment, and afforestation in the semi-arid Mediterranean agro-ecosystem of Torrealvilla catchment between 1956 and 2008, and Asenso Barnieh et al. [20], wno evaluated the historical land use land cover transitions in the three periods (1970–2000, 2000–2013, and 1975–2013) in West Africa and two sub-regions (humid and arid), to show how deforestation and degradation in West Africa are being driven by human settlements and cropland encroachment. Some other studies focused on the development of tools to work with trajectories. Chen et al. [21] proposed a representation of land use change using Allen’s temporal logic. Azeredo et al. [22] proposed a redefinition of trajectory from the moving object’s domain to the context of land cover change and applied it to reason about forest degradation.
In a previous work, Picoli et al. [5] performed a statistical analysis of the land use maps of Mato Grosso produced by Simoes et al. [23], founding significant evidence that soybean expansion was not directly linked to forest removal, but to the conversion of pasture areas into cropping areas, and pasture expansion was associated with deforestation and the removal of secondary vegetation. These results motivated the authors to investigate the possible indirect effects of soybean production using trajectory analysis. To that, this work is focused on agricultural practice trajectories considering consecutive years, to analyze patterns of changes in Mato Grosso biomes. The Land Use Change Calculus (LUC Calculus) [24], a method that consistently expresses short- and long-term trajectories based on a temporal logic of intervals, is used to extract information trajectories.
The paper is organized as follows: Section 2 presents the materials and methods used in this study; we describe the study area, data set, description about the patterns of agricultural practices change, and review of the formalism for a reason about land use change trajectories. Section 3 details the results and the discussion on land use trajectories in Mato Grosso, and the conclusions are presented in Section 4.
2. Materials and Methods
2.1. Study Area
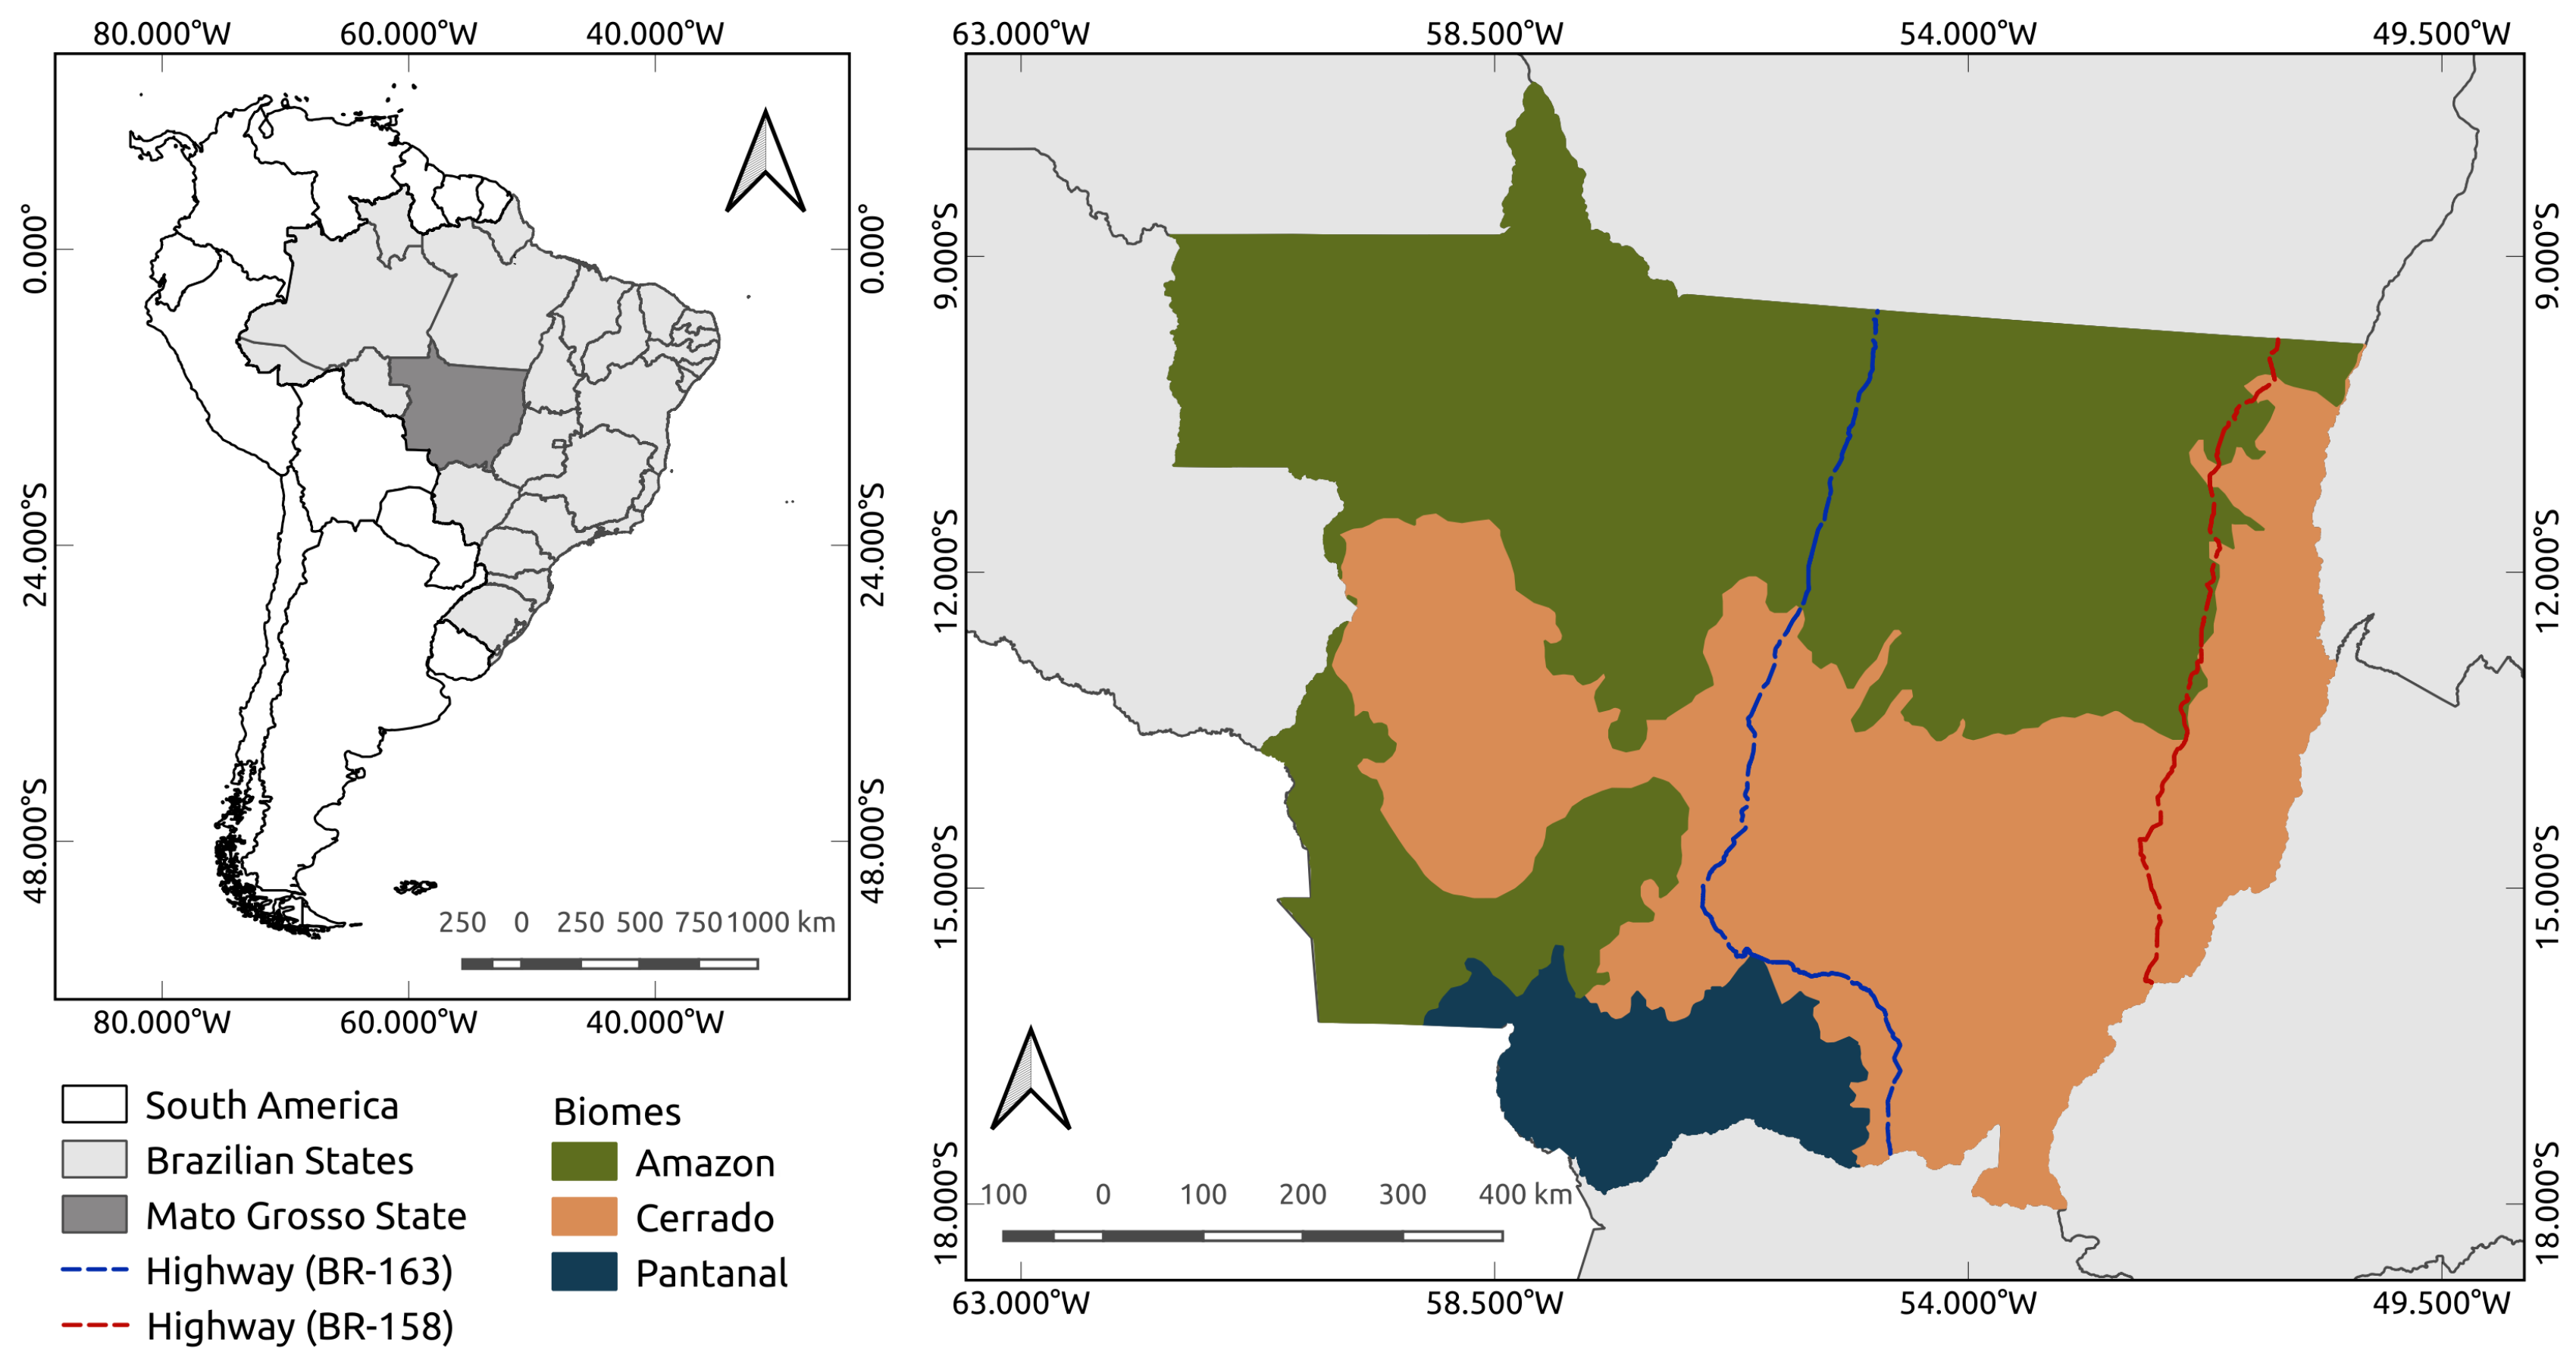
The study area comprises the Mato Grosso State (MT) in Brazil. The state occupation started at the beginning of the 1970s with private and governmental colonization projects, with land concessions for colonists arriving from other states [25], reaching a population of 3 million inhabitants in 2010 [26]. In recent decades, Mato Grosso has become the largest producer of grains and livestock in Brazil. It concentrates the 14 municipalities that historically have been the most important crop production centers, mainly along the Cuiabá-Santarém highway (BR-163) that crosses the center part of the state [16,27,28]. With 903,202 km of extension, Mato Grosso is located in three Brazilian biomes: Amazon, Cerrado (Brazilian tropical savanna), and Pantanal wetlands (see Figure 1).
The Amazonia biome encompasses almost ≈50% of the Brazilian territory; it is covered mainly by rainforests and has the world’s richest biodiversity [29]. Deforestation rates in the Amazon have experienced fluctuations over these decades, since the beginning of the Trans-Amazon highway (BR-230) construction, in 1970, mainly because of macroeconomic shifts [30]. In 2004, deforestation reached its peak (27,772 km/year) since the beginning of monitoring carried out by INPE [31], and the lowest value was observed in 2012 (4571 km/year). The deforestation rate is showing an increasing trend in the last two years, reaching 10,129 km/year in 2019 [32].
The Cerrado biome is the second largest in Brazil, occupying almost of the Brazilian territory. This region experiences an anthropic pressure to convert natural vegetation into agricultural land due to government incentive programs implemented since the 1970s [33]. Studies show that natural vegetation has been replaced by pasture and cropland in the Cerrado and Amazon portions of Mato Grosso [13,27,28,34,35,36].
Despite being the biome with the smallest extension in Brazil (150,355 km), Pantanal is considered one of the largest continuous wet extensions on the planet [29]. However, only 4.6% of its territory is protected by law, and until 2014, 85% of its area was preserved [37]. This shows this biome’s fragility and the urgent need for conservation policies for the Pantanal and its surroundings [38,39,40].
2.2. The Land Use Change Calculus
The Land Use Change Calculus (LUC calculus) [24] takes an interval-based approach to represent land use change trajectories. It extends and improves Allen’s interval temporal logic [41] to create a formalism for reasoning about land use changes. The building blocks of the formalism are:
- A set of non-overlapping spatial locations , part of a region of study;
- A set of land classes ;
- A set of non-overlapping and sequential time intervals ;
- The set of temporal predicates defined by Allen [42];
- The predicate to assert properties of individual locations;
- The predicates , and for multi-interval comparison of land classes. is used to assert that the current class in a location is the same as that of a previous time instance, but there have been other classes assigned to it in intermediate intervals. is used to assert that current class of a location is different from that of a previous time instance, but there are no intermediate intervals with a different class. Moreover, asserts that the current class of a location is different from that of the previous time instance, and there are intermediate intervals with a different class.
The LUC calculus provides a consistent way to express both short-term and long-term trajectories. By contrast, expressing trajectories and change patterns using ad-hoc rules may lead to inconsistent deductions. As argued in Maciel et al. [24], the LUC calculus is complete, insofar as all possible transitions can be expressed by one of its predicates.
To illustrate reasoning using the LUC calculus, consider the location l that has been classified as forest in 2012, forest in 2013, pasture in 2014 and cropping in 2015. If a researcher wants to evaluate if the l was deforested for cropping, she can evaluate the LUC calculus expression: .
2.3. Mato Grosso’s Land Use and Land Cover Data Sets
This work used a set of yearly land use and land cover maps for Mato Grosso from 2001 to 2017 to study the patterns of change in agriculture practices over 17 years. The data set produced by Simoes et al. [23] is used as the source to extract the land use trajectories. This data set was generated by classifying data from the moderate resolution imaging spectroradiometer (MODIS). It considered the MOD13Q1 product, including the normalized difference vegetation index (NDVI) and the enhanced vegetation index (EVI), as well as the near-infrared (NIR) and mid-infrared (MIR) attributes.
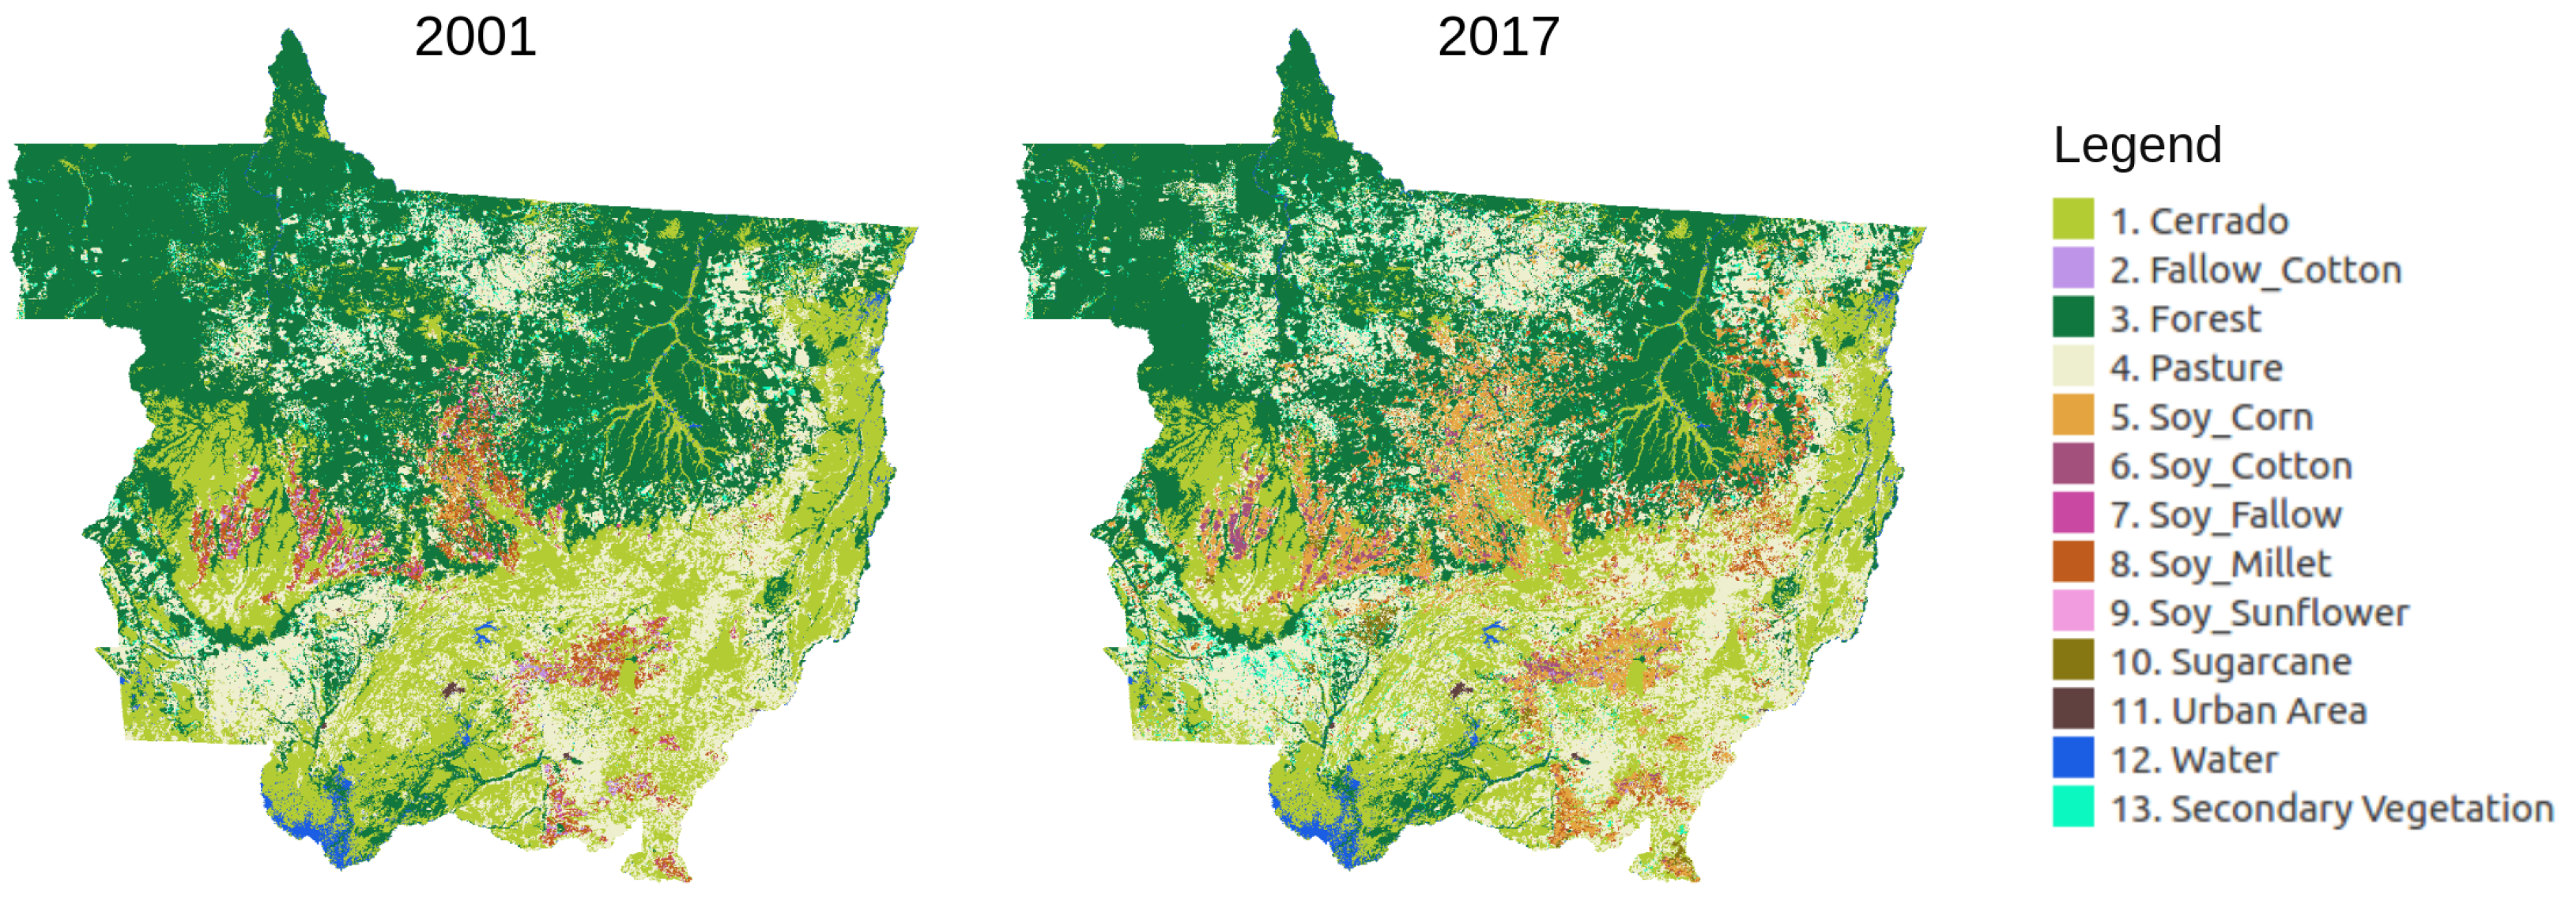
Time series of multidimensional attributes for each pixel was classified using the support vector machine (SVM), a supervised classification method [43]. To train the classification model, the authors used 2115 time series ground samples of natural and human-transformed land use classes. The resulting maps have thirteen classes: Cerrado, Forest, Pasture, Soy-Corn, Soy-Cotton, Soy-Fallow, Soy-Millet, Soy-Sunflower, Fallow-Cotton, Sugarcane, Urban Area, Water, and Secondary Vegetation. The detailed maps for the state of Mato Grosso and the ground samples used as training data are available at the PANGAEA Earth Sciences Data Repository [44]. Figure 2 shows the classified maps used in this study.
2.4. Patterns of Change for Agricultural Practices
The goal of this study is to identify patterns of change in Single Cropping (SC), Double Cropping (DC), and Pasture (PT) agricultural practices and their potential relation to deforestation. To generate the trajectories of agriculture practices for a period of study, a reclassification of the data set described in Section 2.3 was performed. The Single Cropping class corresponds to the original Soy-Fallow and Fallow-Cotton classes, and Double Cropping corresponding to the Soy-Corn, Soy-Cotton, Soy-Millet, and Soy-Sunflower classes.
Table 1 describes the patterns of agricultural practices change in terms of trajectories of practices. Consider a location whose land use and land cover trajectory from 2001 to 2010 is known. From 2001 to 2003, the location was used for pasture (PT), then from 2004 to 2005, it was used to single cropping (SC), and from 2006 to 2010, it was used to double cropping (DC). The location will be associated with the Intensification change pattern.
To formally express and identify the patterns of change described in Table 1, we used the LUC calculus [24]. Table 2 shows how these patterns can be expressed using the LUC calculus predicates. The Stability pattern is expressed using the HOLDS predicate, which asserts that the class SC or DC is true for the time interval from 2001 to 2017. The Intensification pattern is expressed using the predicate CONVERT to assert a conversion from SC to DC class in some period of time. Its inverse, Reduction pattern, asserts a conversion from DC to SC class. The Interchange pattern uses combinations of the predicate CONVERT to assert a conversion from SC to DC and from DC to SC. Finally, the pattern Expansion can be expressed using the predicate RECUR and EVOLVE to assert the changes from SC to DC or its inverse conversion.
3. Results and Discussion
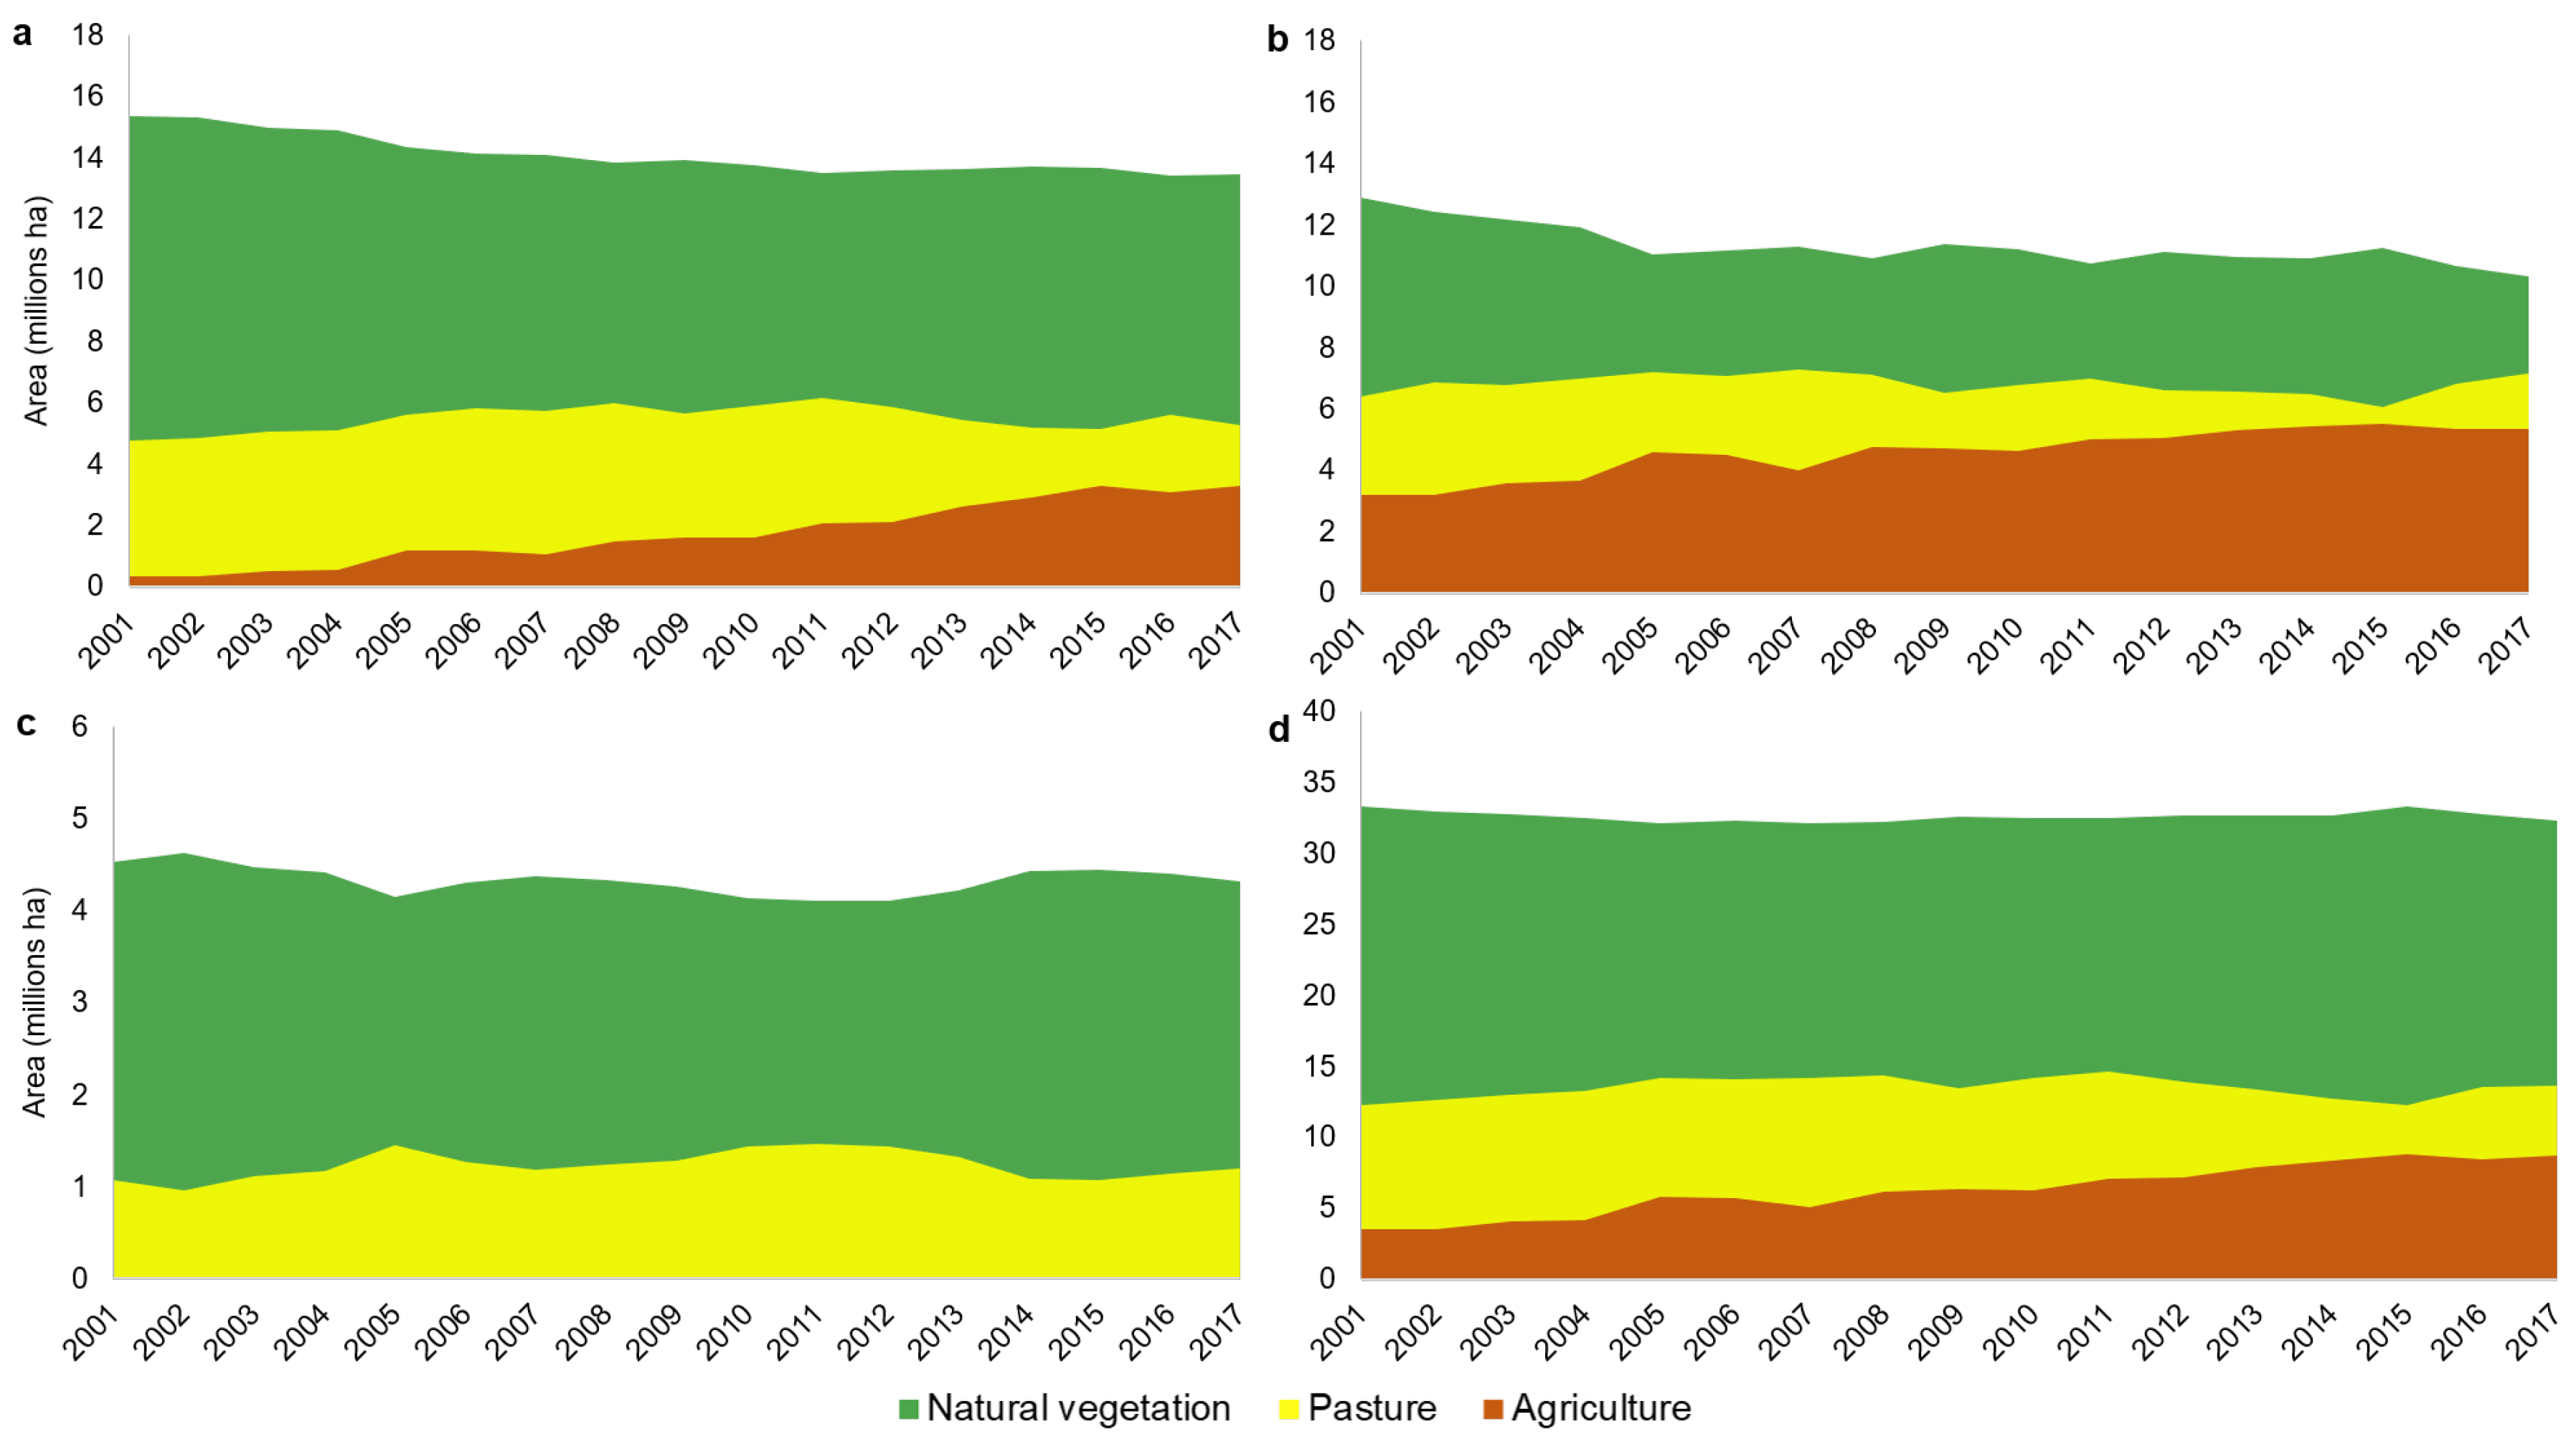
In this section, the results of the analysis of agricultural pattern changes are presented. To facilitate the understanding of the results, at times, the Single Crop and Double crop classes are referred to as Agriculture. The Figure 3 presents the amount of Natural Vegetation, Pasture, and Agriculture areas in the three biomes of the Mato Grosso State, during the analysis (2001 to 2017).
Analyzing the land use and land cover areas (Figure 3), we observed that the Natural Vegetation in the Mato Grosso State had a decrease of ≈ between 2001 and 2017. In the same period, the anthropic areas of Pasture and Agriculture increased ≈ and over 140%, respectively. These patterns of change can be identified from trajectories. The Amazon and Cerrado biomes portions showed a decrease in the Natural Vegetation area consistent with the increase of Agriculture and Pasture areas, indicating that the anthropized class has replaced Natural Vegetation regions. The Pantanal portion does not have a significant extension of Agriculture until 2017.
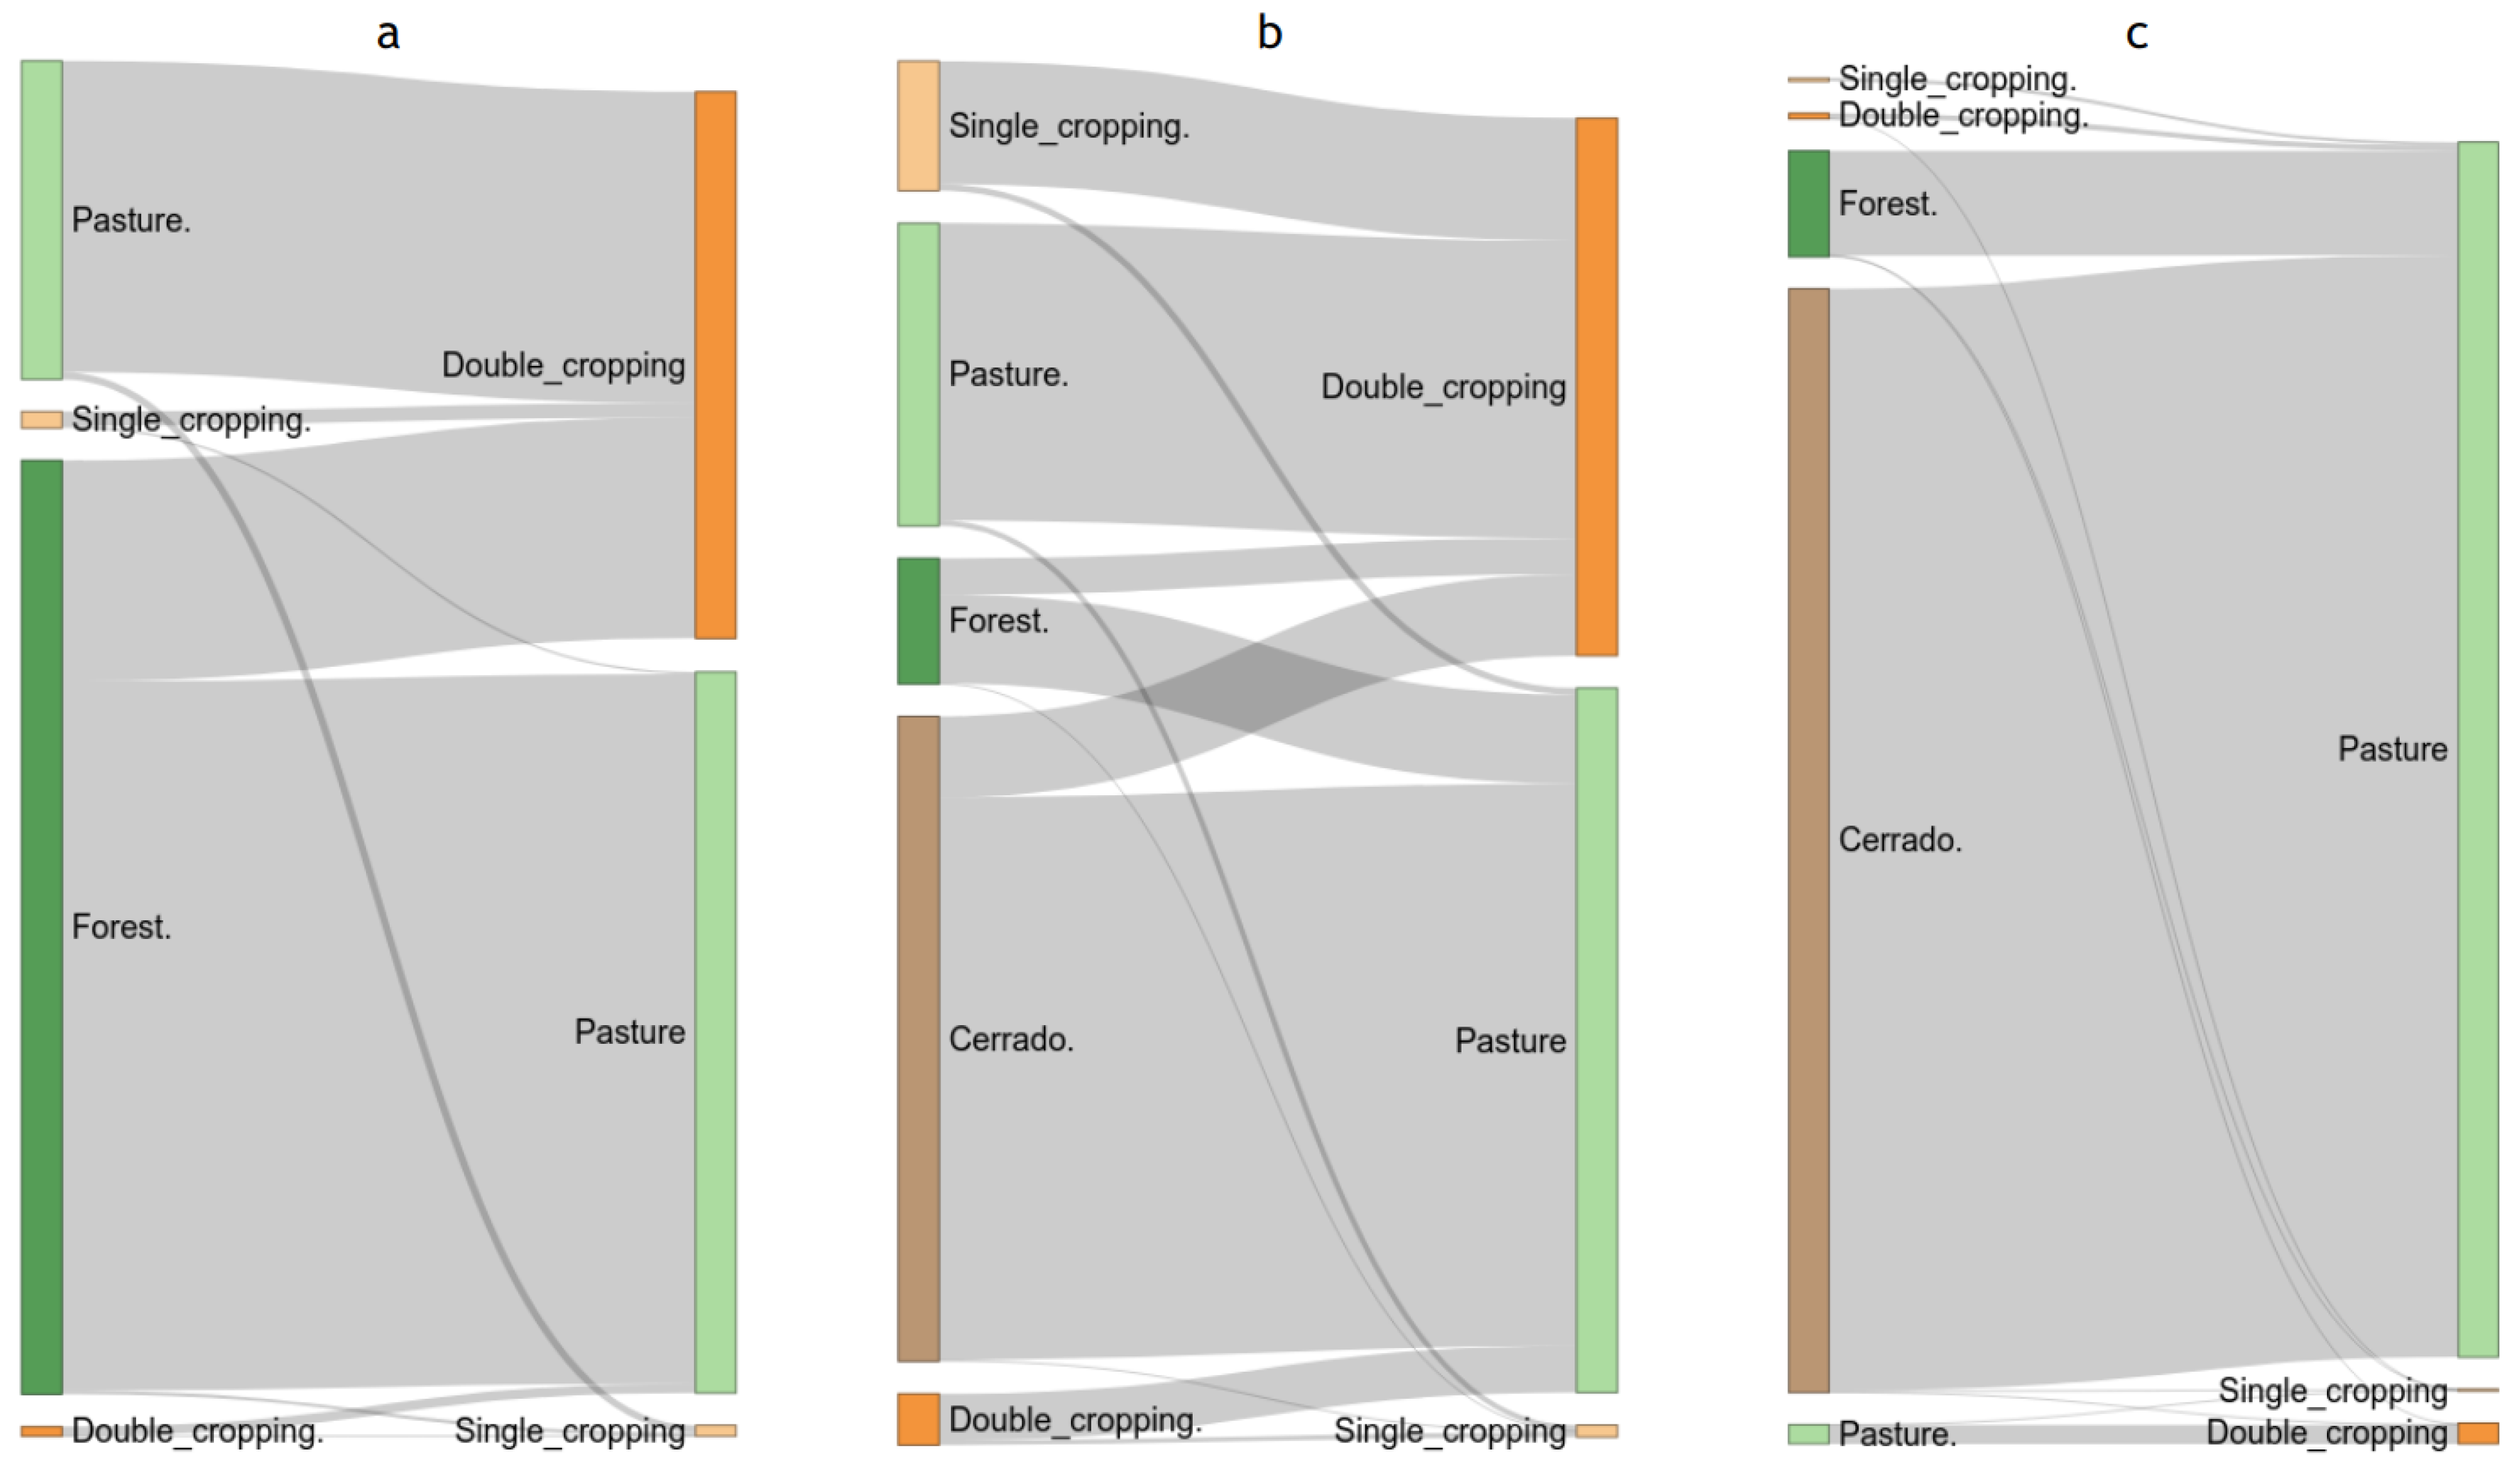
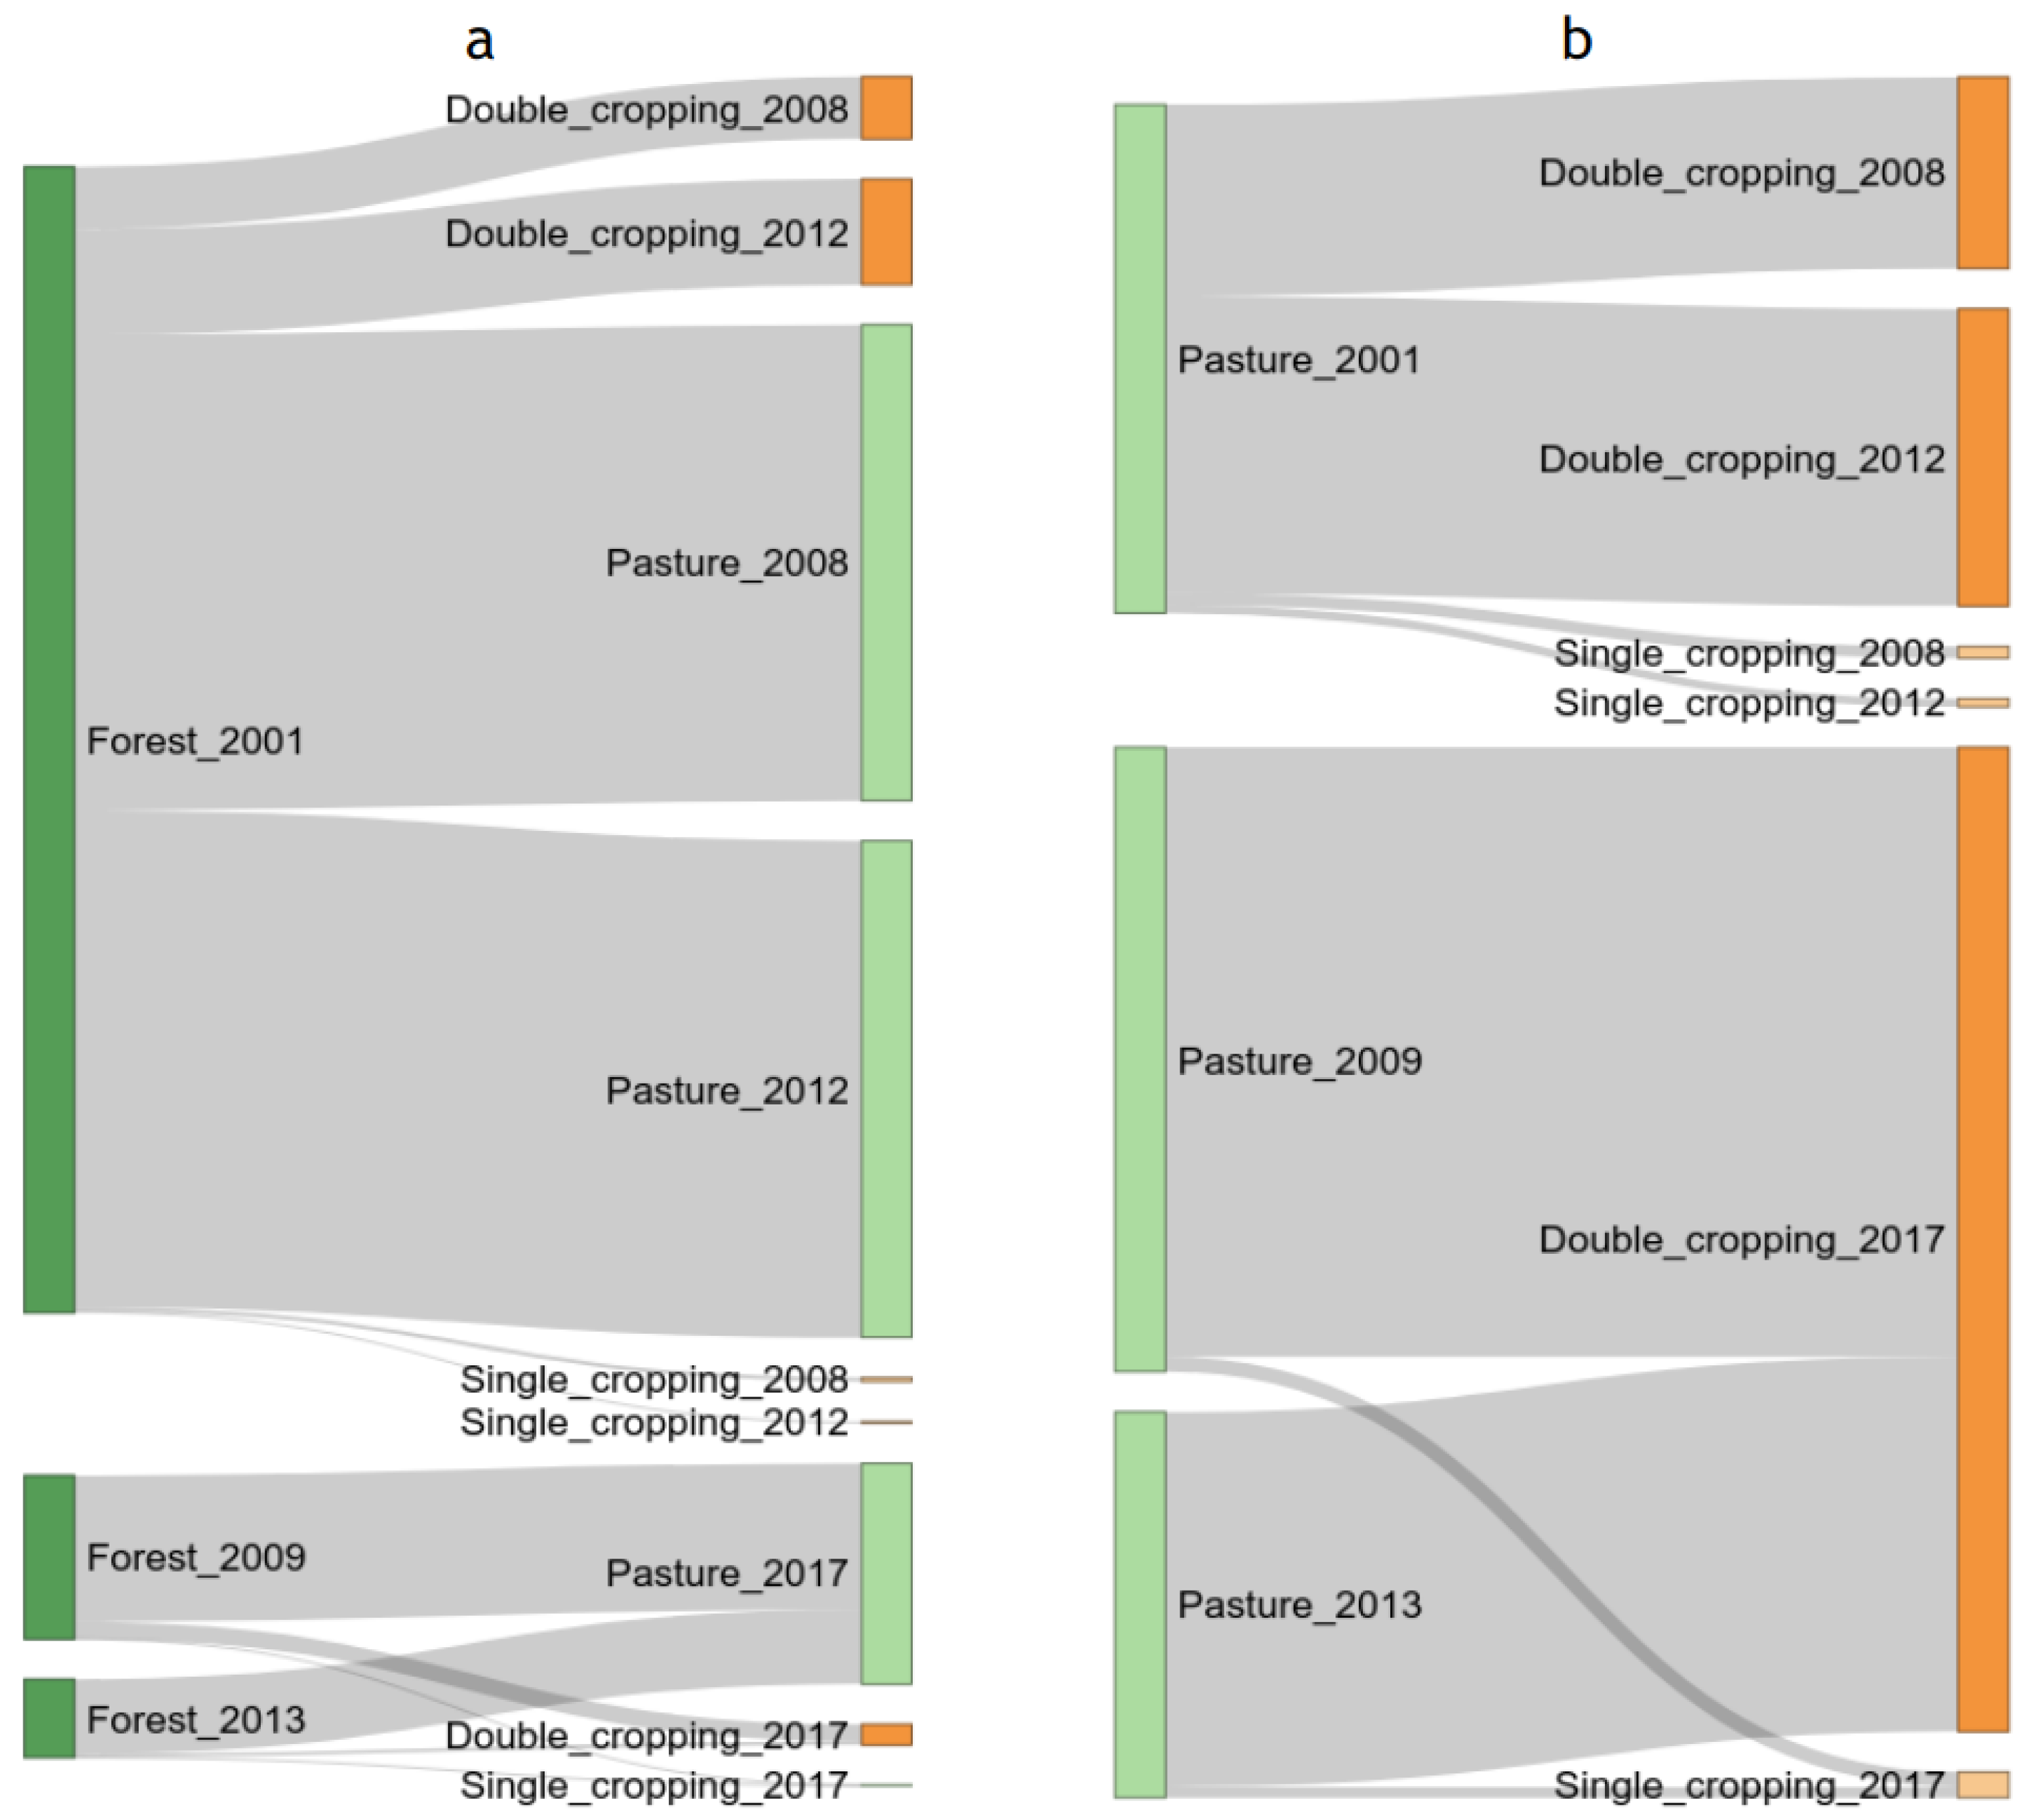
The Sankey diagrams presented in Figure 4 show the existing land use and land cover transitions from 2001 to 2017. The gray areas represent transitions and its proportion regarding all the conversions observed. For example, Figure 4a shows a transition from Pasture to Double Cropping, representing 24.34% of the conversions seen in the Amazon biome portion of the Mato Grosso State (see Table 3). Table 3 shows also that in the Amazon biome portion, ≈ of the Natural Vegetation converted areas were converted to Pasture, ≈3439 thousand hectares, from 2001 to 2017, and ≈ were converted to Agriculture. It can be observed that ≈ of the Pasture areas were converted to Agriculture.
In the Cerrado biome portion, the analysis shows that ≈ of the Natural Vegetation converted areas were converted to Pasture, and ≈ were converted to Agriculture. For the Pasture areas, ≈ were converted to Agriculture. Moreover, ≈ of the Single Crop areas were converted to Double Crop.
In the Pantanal biome, the conversion of the Natural Vegetation areas to Pasture represented more than , ≈410 thousand hectares, from 2001 to 2017 (Figure 4). Moreover, of the Pasture areas were converted to Agriculture.
Five patterns of agricultural practices change were considered in this study, each represented by different trajectory profiles. The results show that in the Mato Grosso State, the most frequent Agriculture pattern in the Amazon and Cerrado biomes was Expansion, which in these two biomes were 6.6 and 8.1 million ha, respectively. As observed in Figure 4a,b, the agriculture expansion occurs mainly by converting Pasture areas, followed by Forest areas, on a smaller scale, in other Agriculture areas (transition from single to double cropping, and vice versa).
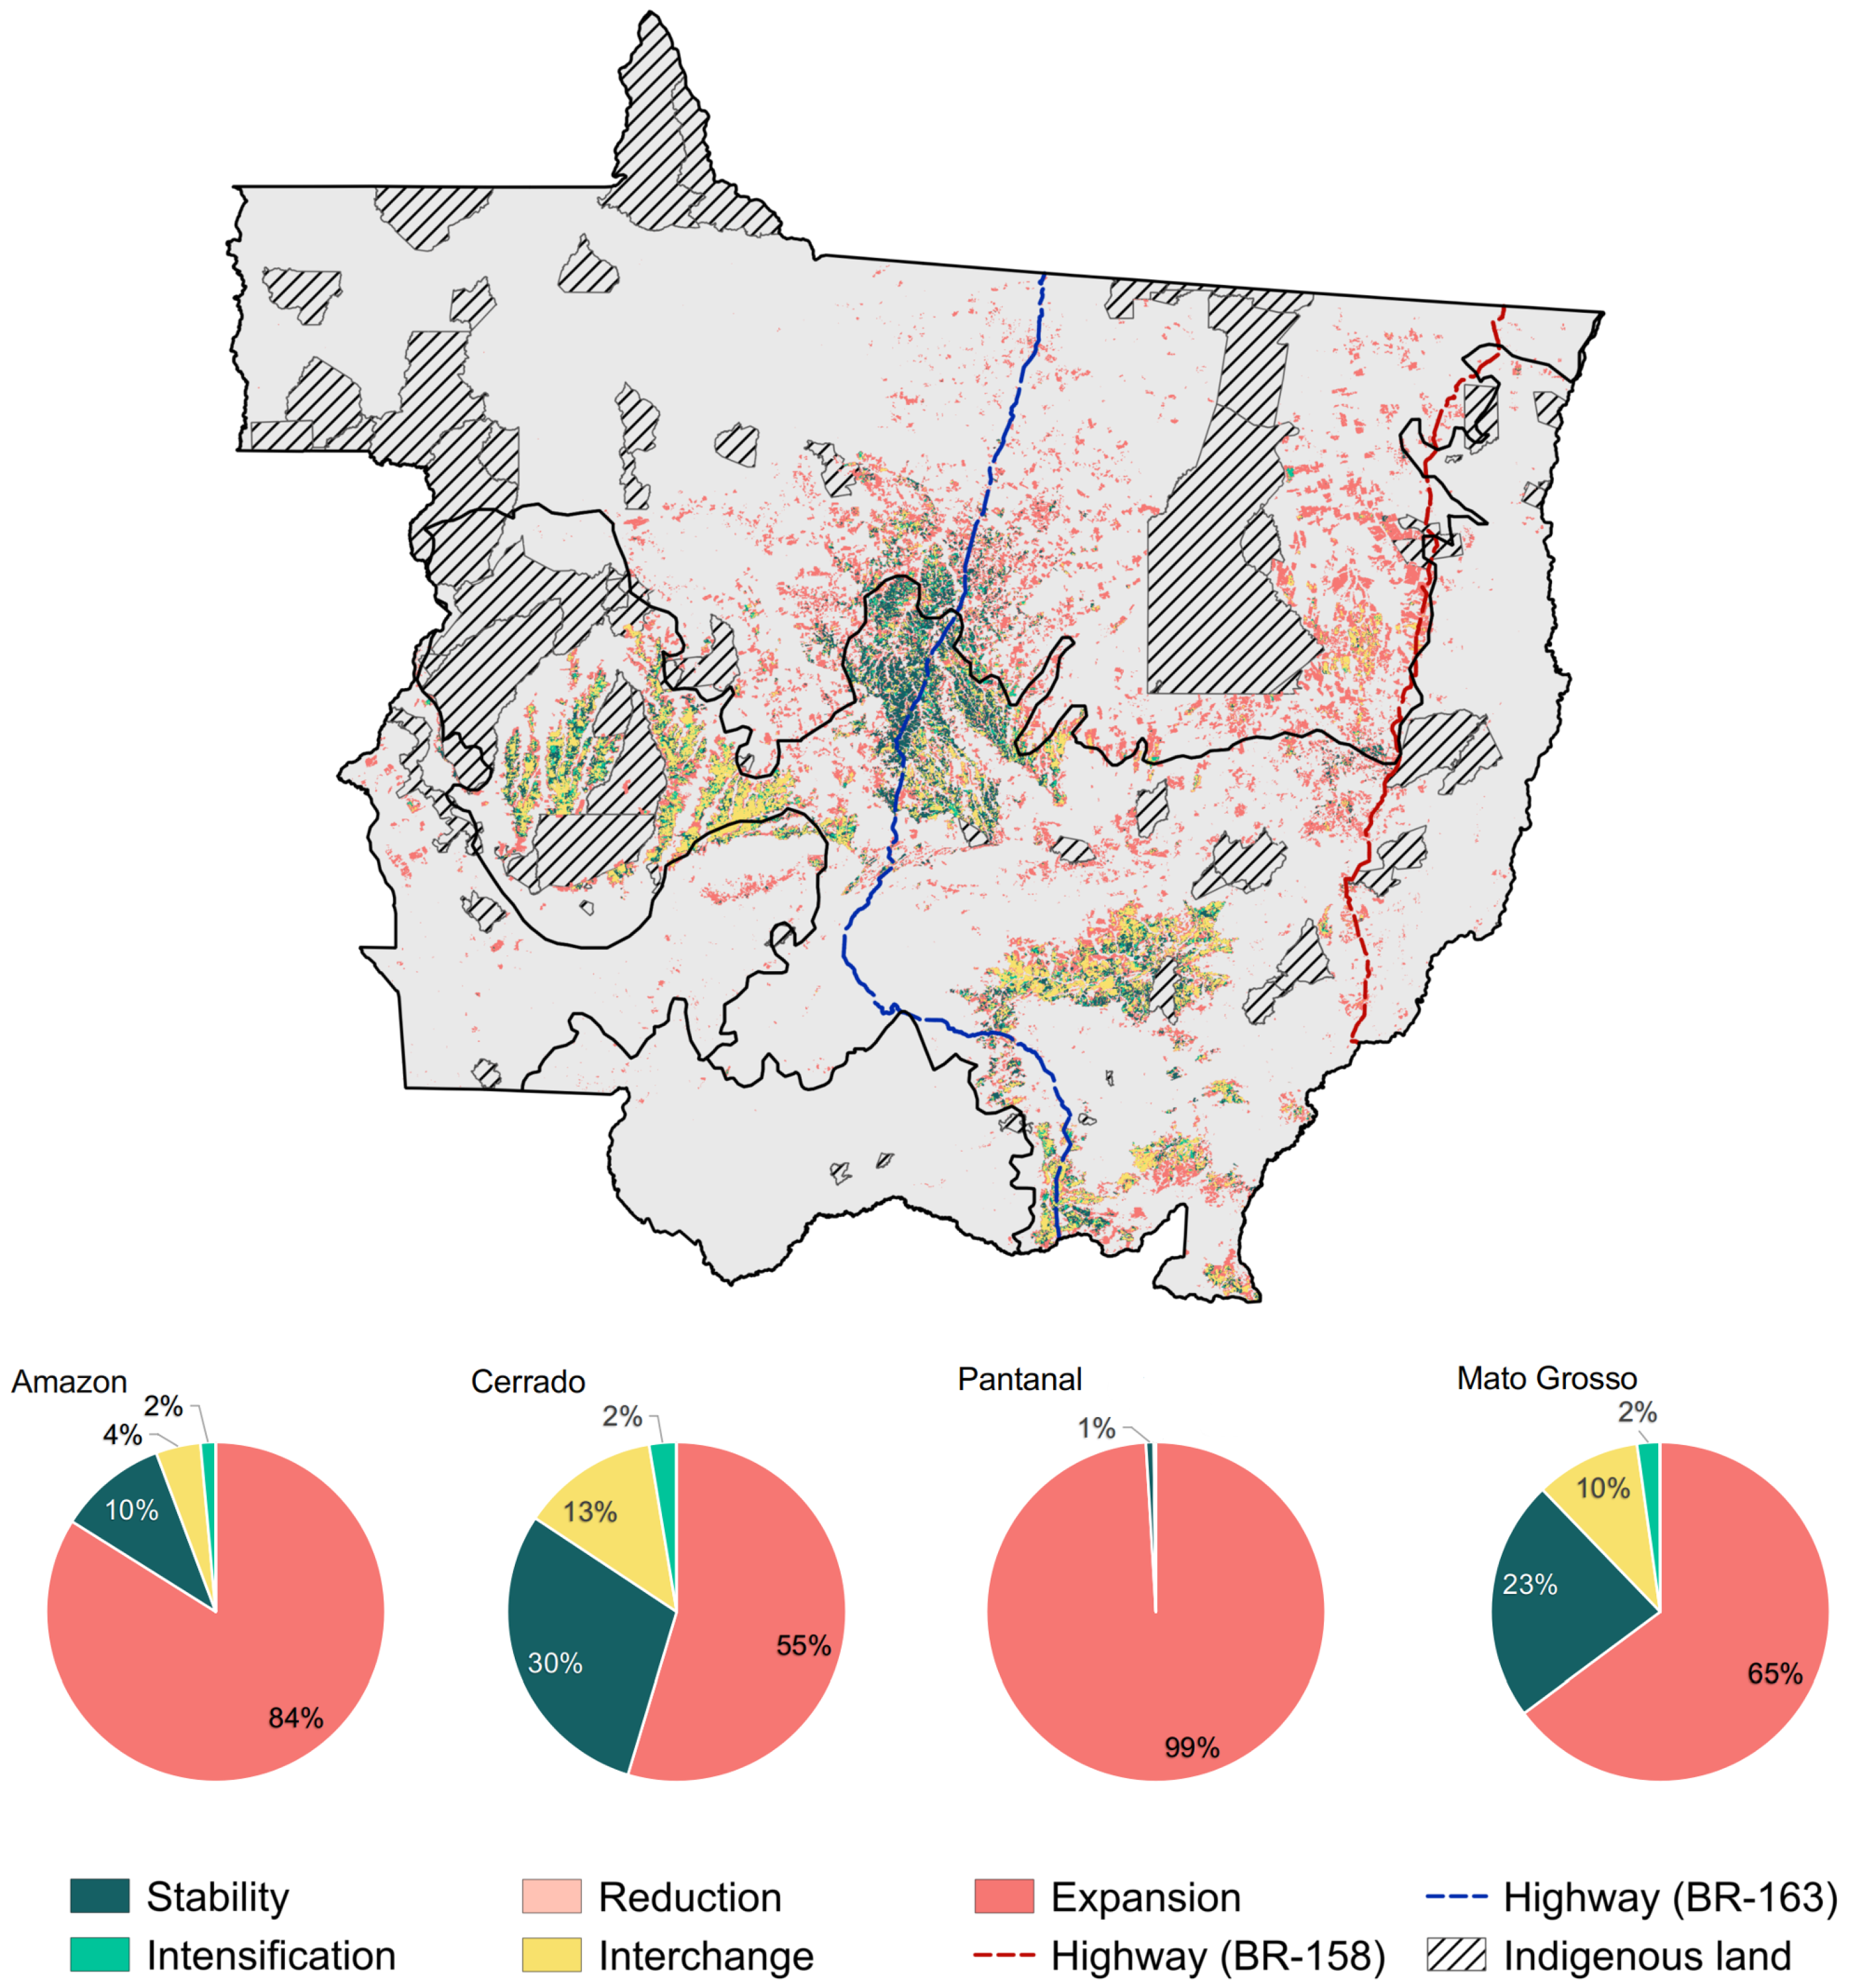
Figure 5 spatializes the patterns of agricultural practices change in Mato Grosso State, from 2001 to 2017, based on the Natural Vegetation, Agriculture, and Pasture classes conversion. Table 4 shows that, for the Amazon biome portion, the agriculture expansion predominated in ≈ of its extension. In ≈ of the Amazon portion, we can observe a stabilization pattern in a single crop or double crop. In ≈ of the area, interchanging, reduction, or intensification in the agriculture practices were found.
In the Cerrado biome portion of the state, ≈ of the area sustained a pattern of expansion, and ≈ maintained a stability pattern in Agriculture (single crop or double crop). The interchange between single crop and double crop occurred in ≈ of the area, and intensification and reduction in ≈ of the area. The Pantanal biome portion presented less than of its area for agriculture from 2001 to 2017.
Figure 6a shows the Agriculture expansion in the Amazon biome that occurred over Forest significantly decreased after 2008. This decrease reflects the effectiveness of the Soy Moratorium (The Soy Moratorium agreement was signed in 2006 by actors from industry, civil society, and the Brazilian federal government, which aim was to curtail the purchase of soybean grown on lands deforested after July 2006 in the Brazilian Amazon by exporters [10].) agreement in the direct conversion of Forest to Agriculture (soybean), corroborating with the study by Rudorff et al. [45].
However, the transition of Forest to Agriculture, despite the efforts of the Soy Moratorium, still occurs (Figure 6a). In their study, Gibbs et al. [10] observed that approximately 12% of deforestation in Mato Grosso State between 2007 and 2014 occurred on soybean properties. Silva and Lima [46] analyzing the deforestation caused by soybean in the Mato Grosso State, between 2009 and 2016, the authors observed that 59,972 ha of the forest had been converted into soy areas. The authors emphasize the Soy Moratorium’s importance in combatting deforestation in Amazonia and reinforce the need to refine this agreement. In the most recent study by Rajao et al. [7], the authors analyzed 53,000 soybean producers in the Amazon and Cerrado biomes. They observed that 20% of these properties were deforested after 2008, about half of them potentially illegally.
Pasture areas are the main driver in the Agriculture trajectory (Figure 4). As also observed by Macedo et al. [47] and Picoli et al. [5], this trajectory can generate an indirect land use and land cover effect. This effect occurs because of the indirect conversion from Agriculture to Pasture, and consequently, Forest to Pasture [1,48,49].
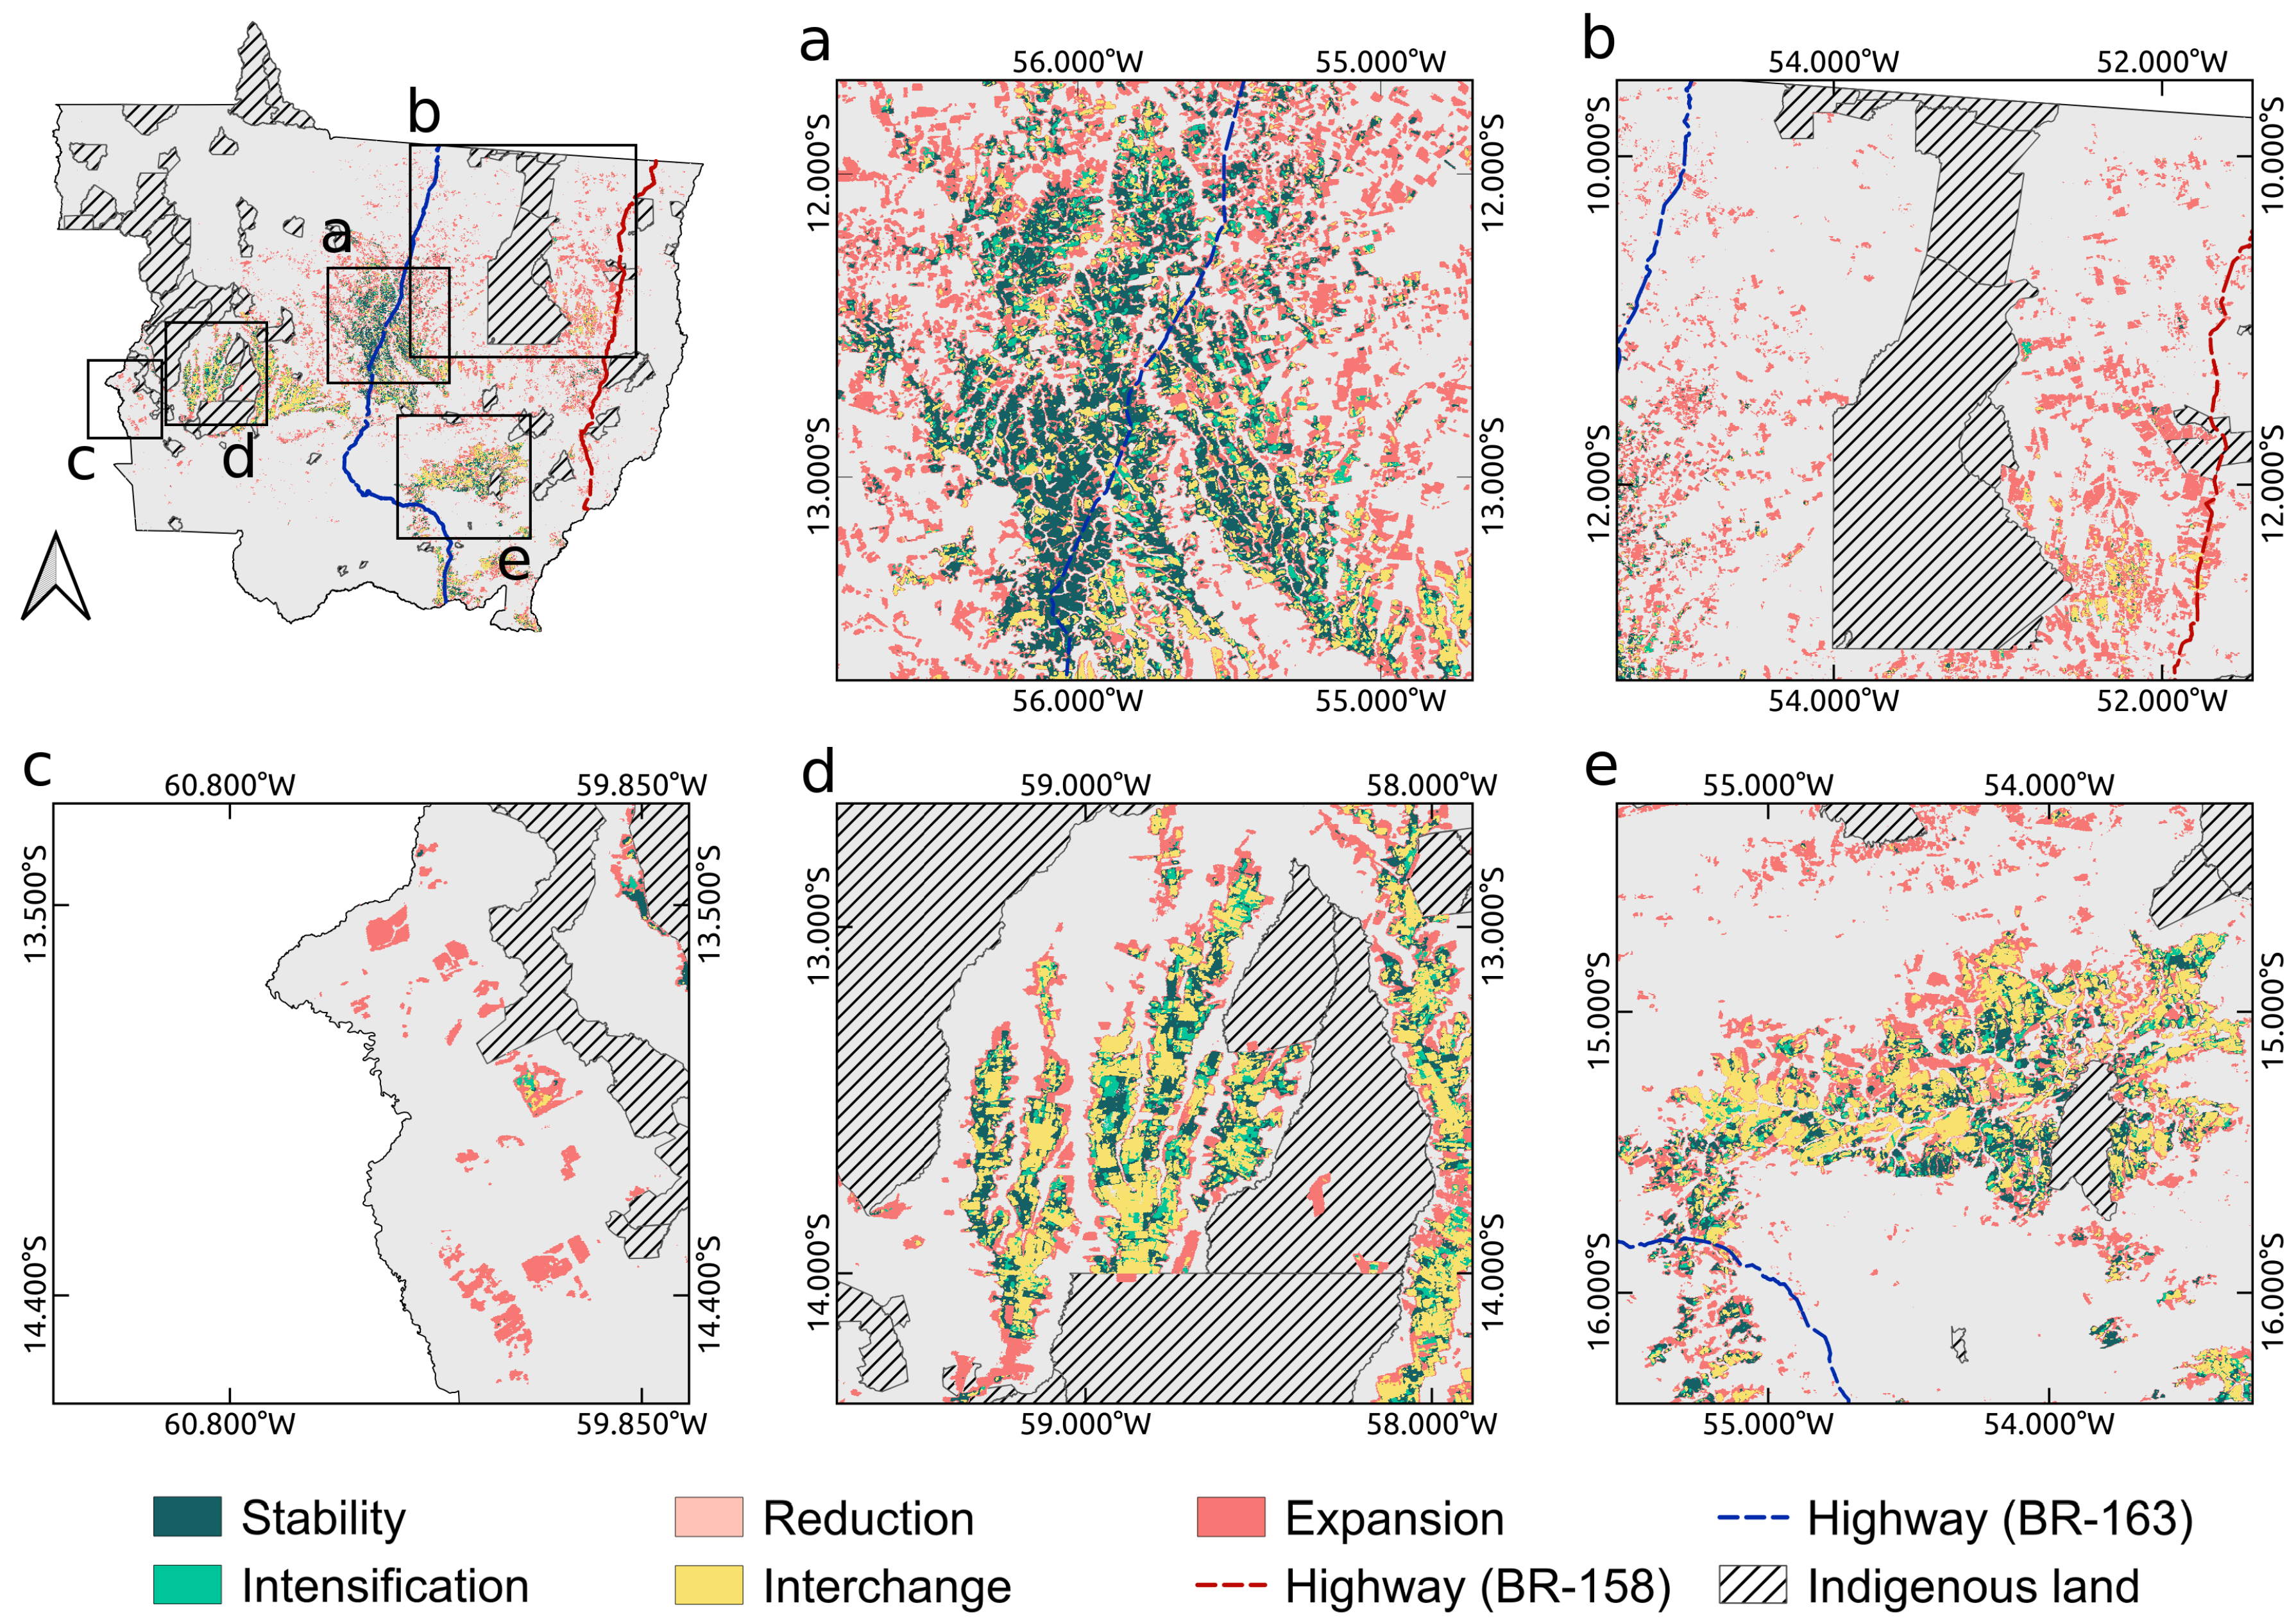
Figure 7 highlights, spatially, some interesting areas and its patterns of agricultural practice change trajectories. In the Cerrado biome, the Expansion pattern occurred near Agriculture consolidated areas, close to the BR-163 and BR-158 (Figure 7a), as observed by Picoli et al. [5] that previous year’s soybean areas are a positive driver in soybean expansion. And, the agriculture expansion areas in the Amazon biome occurred mainly around the Xingu Indigenous Park (Figure 7b), as observed by Arvor et al. [50].
The second most frequent pattern in the Mato Grosso State is Stability. Besides agriculture in Mato Grosso, which has had incentives from the Brazilian Government since the 1970s, the State’s climatic conditions are favorable. The physical factors of the landscape are suitable for large-scale agriculture [51]. Spera et al. [36] investigated the soybean dynamics (expansion, abandonment, and harvest frequency) in Mato Grosso from 2001 to 2011, and they observed that these dynamics were related to the slope, elevation, minimum and maximum temperature, and logistics costs of soybean. The authors still argue about the Ricardian rent theory, which says that agricultural expansion will occur first on the highest quality land and then on the lower quality land. Thus, this theory would explain why so many areas show a Stability pattern, as these areas would have high quality, and therefore agriculture is maintained.
The Interchange pattern occurred mainly in the State’s southern and western regions in the Cerrado biome and the eastern region in the Amazon Biome (Figure 7d,e). This pattern shows that in these regions, Agriculture is dynamic and there is a change between years with single crop planting, where only one crop is planted in a year, and years with double crop planting, where two crops are planted in the same area in the same year in two different periods. This rotation in plantations may be linked to economic and climatic factors [52,53,54].
The Intensification pattern occurred where there was a vertical agricultural intensification. When an area was dedicated to planting single crop and became a double crop, it increased agricultural production [55]. These results corroborate the studies by Kastens et al. [13] and Picoli et al. [5], who observed that in the early 2000s, the single crop practice was generally used in the Mato Grosso State. Still, in recent years, the most common practice adopted by farmers is a double crop. According to the Brazilian Institute of Geography and Statistics [56], the organization responsible for Brazil’s official agricultural statistics, Mato Grosso leads as the largest national grain producer, with a 28.4% share in 2020 of the national total [57]. This indicates an increase in Agriculture’s intensification due to the planting of two crops in the state. The Reduction pattern is almost nonexistent in this study region.
In the Pantanal biome, the Expansion pattern was the most significant, showing an increase of 27 thousand hectares of Agriculture, equivalent to approximately 18% of this biome. Guerra et al. [39] identified that Agriculture commodities are one of the main drivers of vegetation loss in the Pantanal biome and is associated with expanding the road network. The other patterns occur in small proportions in this biome.
4. Conclusions
In this work, the trajectories of agricultural practice in the three biomes of Mato Grosso State, Brazil, from 2001 to 2017 were analyzed using the LUC calculus. The land cover and use were divided into Agriculture (single cropping and double cropping), Pasture, and Natural Vegetation (Forest and Cerrado), and the pattern changes in these biomes were analyzed, leading to the following results:
- During the 17 years of analysis, in the Mato Grosso State, the conversion of Natural Vegetation, including forest or cerrado, to Pasture was predominant. This indicates that Pasture has been an important driver of deforestation in these three distinct biomes of the State. However, the conversion of Pasture areas to Agriculture indicates that agriculture can be considered an indirect driver of deforestation.
- When analyzing the patterns of change in agricultural practices, we conclude that Expansion in the three biomes is the pattern that occurs more frequently than the others (>55%). This means that in Mato Grosso, increasing agricultural production has occurred due to the conversion of other land uses to Agriculture, and the percentage of agricultural areas that have been intensified is still small.
- The LUC calculus application was a valuable tool to analyze spatio-temporal data, formally expressing queries and reason about land use trajectories flexibly. However, this approach depends on a set of classified and validated data for the study area. The LUC calculus depends on land use trajectories, with observations in a regular time interval.
The findings presented in this work help to understand the current state and the dynamics of land use and cover in the Mato Grosso State. The expansion of crop areas occurs over areas of natural vegetation, resulting in deforestation. However, the expansion also occurs in pasture areas that have been deforested previously. In turn, pasture expansion takes place over natural forest area. The paper shows that cropland production is causing a displacement effect, and indirectly contributing to the increase in deforestation. This indirect effect of agriculture expansion needs to be taken into account for the evaluation and revision of public policies such as the Soy Moratorium.
This work shows the importance of considering indirect land use change, especially regarding economic policies aimed at promoting low-carbon agriculture and livestock. It also provides evidence that long-term policies and strategies to reduce deforestation in Brazil should not be restricted to the Amazon biome. Cropland expansion in the Cerrado biome is linked to a displacement of cattle farms to the Amazon biome and thus increasing deforestation. Additionally, the commitment with zero-deforestation could be applied to small and large rural properties, with the federal institutions being responsible for imposing fines or periodic penalty payments due to illegal deforestation.
Author Contributions
Conceptualization, A.M.M., M.C.A.P., and L.V.; Methodology, A.M.M., M.C.A.P., and L.V.; Formal analysis, A.M.M., and M.C.A.P.; Investigation and Data curation, A.M.M., and M.C.A.P.; Writing—original draft preparation, A.M.M., M.C.A.P., L.V. and G.C.; Writing—review and editing, A.M.M., M.C.A.P., and L.V.; Supervision, L.V., and G.C.; Project administration, A.M.M., M.C.A.P., and L.V.; Funding acquisition, L.V., and G.C. All authors have read and agreed to the published version of the manuscript.
Funding
This work is supported by the São Paulo Research Foundation (FAPESP) through an e-Science Program grant 2014/08398-6. We thank the project Development of systems for preventing forest fires and monitoring vegetation cover in the Brazilian Cerrado (World Bank Project #P143185)—Forest Investment Program (FIP) (A.M.M). We thank Brazil Data Cube project, funded by the Amazon Fund through the financial collaboration of the Brazilian Development Bank (BNDES) and the Foundation for Science, Technology and Space Applications (FUNCATE) no. 17.2.0536.1. (M.C.A.P). We thank Rodrigo A. Begotti for useful comments on the previous version of the manuscript.
Conflicts of Interest
The authors declare no conflict of interest.
References
- Miranda, J.; Börner, J.; Kalkuhl, M.; Soares-Filho, B. Land speculation and conservation policy leakage in Brazil. Environ. Res. Lett. 2019, 14, 045006. [Google Scholar] [CrossRef]
- Azevedo-Ramos, C.; Moutinho, P.; da S. Arruda, V.L.; Stabile, M.C.; Alencar, A.; Castro, I.; Ribeiro, J.P. Lawless land in no man’s land: The undesignated public forests in the Brazilian Amazon. Land Use Policy 2020, 99, 104863. [Google Scholar] [CrossRef]
- Gollnow, F.; Lakes, T. Policy change, land use, and agriculture: The case of soy production and cattle ranching in Brazil, 2001–2012. Appl. Geogr. 2014, 55, 203–211. [Google Scholar] [CrossRef]
- Gollnow, F.; de Barros Viana Hissa, L.; Rufin, P.; Lakes, T. Property-level direct and indirect deforestation for soybean production in the Amazon region of Mato Grosso, Brazil. Land Use Policy 2018, 78, 377–385. [Google Scholar] [CrossRef]
- Picoli, M.C.A.; Rorato, A.; Leitão, P.; Camara, G.; Maciel, A.; Hostert, P.; Sanches, I.D. Impacts of Public and Private Sector Policies on Soybean and Pasture Expansion in Mato Grosso - Brazil from 2001 to 2017. Land 2020, 9, 20. [Google Scholar] [CrossRef] [Green Version]
- Barona, E.; Ramankutty, N.; Hyman, G.; Coomes, O.T. The role of pasture and soybean in deforestation of the Brazilian Amazon. Environ. Res. Lett. 2010, 5, 024002. [Google Scholar] [CrossRef]
- Rajão, R.; Soares-Filho, B.; Nunes, F.; Börner, J.; Machado, L.; Assis, D.; Oliveira, A.; Pinto, L.; Ribeiro, V.; Rausch, L.; et al. The rotten apples of Brazil’s agribusiness. Science 2020, 369, 246–248. [Google Scholar]
- Arima, E.Y.; Barreto, P.; Araújo, E.; Soares-Filho, B. Public policies can reduce tropical deforestation: Lessons and challenges from Brazil. Land Use Policy 2014, 41, 465–473. [Google Scholar] [CrossRef]
- Nepstad, D.; McGrath, D.; Stickler, C.; Alencar, A.; Azevedo, A.; Swette, B.; Bezerra, T.; DiGiano, M.; Shimada, J.; Seroa da Motta, R.; et al. Slowing Amazon deforestation through public policy and interventions in beef and soy supply chains. Science 2014, 344, 1118–1123. [Google Scholar] [CrossRef]
- Gibbs, H.K.; Rausch, L.; Munger, J.; Schelly, I.; Morton, D.C.; Noojipady, P.; Soares-Filho, B.; Barreto, P.; Micol, L.; Walker, N.F. Brazil’s Soy Moratorium. Science 2015, 347, 377–378. [Google Scholar] [CrossRef]
- Gibbs, H.K.; Munger, J.; L’Roe, J.; Barreto, P.; Pereira, R.; Christie, M.; Amaral, T.; Walker, N.F. Did Ranchers and Slaughterhouses Respond to Zero-Deforestation Agreements in the Brazilian Amazon? Conserv. Lett. 2016, 9, 32–42. [Google Scholar] [CrossRef]
- Morton, D.C.; Noojipady, P.; Macedo, M.M.; Gibbs, H.; Victoria, D.C.; Bolfe, E.L. Reevaluating suitability estimates based on dynamics of cropland expansion in the Brazilian Amazon. Glob. Environ. Chang. 2016, 37, 92–101. [Google Scholar] [CrossRef] [Green Version]
- Kastens, J.H.; Brown, J.C.; Coutinho, A.C.; Bishop, C.R.; Esquerdo, J.C.D. Soy moratorium impacts on soybean and deforestation dynamics in Mato Grosso, Brazil. PLoS ONE 2017, 12, 1–21. [Google Scholar] [CrossRef] [PubMed]
- West, T.A.; Fearnside, P.M. Brazil’s conservation reform and the reduction of deforestation in Amazonia. Land Use Policy 2021, 100, 105072. [Google Scholar] [CrossRef]
- Geist, H.; McConnell, W.; Lambin, E.F.; Moran, E.; Alves, D.; Rudel, T. Causes and Trajectories of Land-Use/Cover Change. In Land-Use and Land-Cover Change: Local Processes and Global Impacts; Lambin, E.F., Geist, H., Eds.; Springer: Berlin/Heidelberg, Germany, 2006; pp. 41–70. [Google Scholar] [CrossRef]
- Picoli, M.C.A.; Camara, G.; Sanches, I.; Simões, R.; Carvalho, A.; Maciel, A.; Coutinho, A.; Esquerdo, J.; Antunes, J.; Begotti, R.A.; et al. Big earth observation time series analysis for monitoring Brazilian agriculture. ISPRS J. Photogramm. Remote Sens. 2018, 145, 328–339. [Google Scholar] [CrossRef]
- McCracken, S.D.; Boucek, B.; Moran, E.F. Deforestation Trajectories in a Frontier Region of the Brazilian Amazon. In Linking People, Place, and Policy: A GIScience Approach; Springer US: Boston, MA, USA, 2002; pp. 215–234. [Google Scholar] [CrossRef]
- Pinheiro, T.F.; Escada, M.I.S.; Valeriano, D.M.; Hostert, P.; Gollnow, F.; Müller, H. Forest degradation associated with logging frontier expansion in the Amazon: The BR-163 region in Southwestern Pará, Brazil. Earth Interact. 2016, 20, 1–26. [Google Scholar] [CrossRef]
- Nainggolan, D.; de Vente, J.; Boix-Fayos, C.; Termansen, M.; Hubacek, K.; Reed, M.S. Afforestation, agricultural abandonment and intensification: Competing trajectories in semi-arid Mediterranean agro-ecosystems. Agric. Ecosyst. Environ. 2012, 159, 90–104. [Google Scholar] [CrossRef]
- Asenso Barnieh, B.; Jia, L.; Menenti, M.; Zhou, J.; Zeng, Y. Mapping Land Use Land Cover Transitions at Different Spatiotemporal Scales in West Africa. Sustainability 2020, 12, 8565. [Google Scholar] [CrossRef]
- Chen, J.; Wu, H.; Li, S.; Liao, A.; He, C.; Peng, S. Temporal logic and operation relations based knowledge representation for land cover change web services. ISPRS J. Photogramm. Remote Sens. 2013, 83, 140–150. [Google Scholar] [CrossRef]
- Azeredo, M.; Monteiro, A.M.V.; Escada, M.I.S.; Ferreira, K.R.; Vinhas, L.; Pinheiro, T.F. Mineração de trajetórias de mudança de cobertura da terra em estudos de degradação florestal (Land-cover change trajectory mining in forest degradation studies). Rev. Bras. Cartogr. 2016, 68, 717–731. [Google Scholar]
- Simoes, R.; Picoli, M.C.A.; Camara, G.; Maciel, A.; Santos, L.; Andrade, P.R.; Sánchez, A.; Ferreira, K.; Carvalho, A. Land use and cover maps for Mato Grosso State in Brazil from 2001 to 2017. Sci. Data 2020. [Google Scholar] [CrossRef] [PubMed] [Green Version]
- Maciel, A.M.; Camara, G.; Vinhas, L.; Picoli, M.C.A.; Begotti, R.A.; de Assis, L.F.F.G. A spatiotemporal calculus for reasoning about land-use trajectories. Int. J. Geogr. Inf. Sci. 2019, 33, 176–192. [Google Scholar] [CrossRef] [Green Version]
- Soler, L.S.; Verburg, P.H.; Alves, D.S. Evolution of land use in the Brazilian Amazon: From frontier expansion to market chain dynamics. Land 2014, 3, 981–1014. [Google Scholar] [CrossRef]
- Brazilian Institute of Geography and Statistics (IBGE). IBGE-Cities, 2020. Available online: https://cidades.ibge.gov.br/brasil/mt/panorama (accessed on 8 February 2020).
- Morton, D.C.; DeFries, R.S.; Shimabukuro, Y.E.; Anderson, L.O.; Arai, E.; del Bon Espirito-Santo, F.; Freitas, R.; Morisette, J. Cropland expansion changes deforestation dynamics in the southern Brazilian Amazon. Proc. Natl. Acad. Sci. USA 2006, 103, 14637–14641. [Google Scholar] [CrossRef] [PubMed] [Green Version]
- Brown, J.C.; Kastens, J.H.; Coutinho, A.C.; Victoria, D.D.C.; Bishop, C.R. Classifying multiyear agricultural land use data from Mato Grosso using time-series MODIS vegetation index data. Remote Sens. Environ. 2013, 130, 39–50. [Google Scholar] [CrossRef] [Green Version]
- Ministério do Meio Ambiente (MMA). Biomas, 2019. Available online: https://www.mma.gov.br/biomas/ (accessed on 10 November 2019).
- Fearnside, P. Deforestation in Brazilian Amazonia. In Oxford Bibliographies in Environmental Science; Wohl, E., Ed.; Oxford University Press: New York, NY, USA, 2017. [Google Scholar] [CrossRef]
- National Institute for Space Research (INPE). Monitoring Program of the Amazon and Other Biomes. Deforestation—Legal Amazon, 2019. Available online: http://terrabrasilis.dpi.inpe.br/app/dashboard/deforestation/biomes/legal_amazon/increments (accessed on 3 July 2020).
- National Institute for Space Research. TerraBrasilis, 2020. Available online: http://terrabrasilis.dpi.inpe.br (accessed on 3 July 2019).
- Ministério do Meio Ambiente (MMA). Mapeamento do Uso e Cobertura do Cerrado: Projeto Terra Class Cerrado 2013, Brasília, 2015. Available online: http://www.mma.gov.br/images/arquivo/80049/Cerrado/publicacoes/Livro%20EMBRAPA-WEB-1-TerraClass%20Cerrado.pdf (accessed on 10 June 2018).
- Brannstrom, C.; Jepson, W.; Filippi, A.M.; Redo, D.; Xu, Z.; Ganesh, S. Land change in the Brazilian Savanna (Cerrado), 1986–2002: Comparative analysis and implications for land-use policy. Land Use Policy 2008, 25, 579–595. [Google Scholar] [CrossRef]
- Arvor, D.; Jonathan, M.; Meirelles, M.S.P.; Dubreuil, V.; Durieux, L. Classification of MODIS EVI time series for crop mapping in the state of Mato Grosso, Brazil. Int. J. Remote Sens. 2011, 32, 7847–7871. [Google Scholar] [CrossRef]
- Spera, S.A.; Cohn, A.S.; VanWey, L.K.; Mustard, J.F.; Rudorff, B.F.; Risso, J.; Adami, M. Recent cropping frequency, expansion, and abandonment in Mato Grosso, Brazil had selective land characteristics. Environ. Res. Lett. 2014, 9, 064010. [Google Scholar] [CrossRef] [Green Version]
- WWF. Monitoramento das Alterações da Cobertura Vegetal e Uso do Solo na Bacia do Alto Paraguai—Porção Brasileira—Período de Análise: 2012 a 2014; Technical Report; Instituto SOS Pantanal and WWF-Brasil: Brasilia, Brazil, 2015. [Google Scholar]
- Roque, F.O.; Ochoa-Quintero, J.; Ribeiro, D.B.; Sugai, L.S.M.; Costa-Pereira, R.; Lourival, R.; Bino, G. Upland habitat loss as a threat to Pantanal wetlands. Conserv. Biol. 2016, 30, 1131–1134. [Google Scholar] [CrossRef]
- Guerra, A.; de Oliveira Roque, F.; Garcia, L.C.; Ochoa-Quintero, J.M.; de Oliveira, P.T.S.; Guariento, R.D.; Rosa, I.M. Drivers and projections of vegetation loss in the Pantanal and surrounding ecosystems. Land Use Policy 2020, 91, 104388. [Google Scholar] [CrossRef]
- Guerra, A.; de Oliveira, P.T.S.; de Oliveira Roque, F.; Rosa, I.M.; Ochoa-Quintero, J.M.; Guariento, R.D.; Colman, C.B.; Dib, V.; Maioli, V.; Strassburg, B.; et al. The importance of Legal Reserves for protecting the Pantanal biome and preventing agricultural losses. J. Environ. Manag. 2020, 260, 110128. [Google Scholar] [CrossRef] [PubMed]
- Allen, J.F. Towards a General Theory of Action and Time. Artif. Intell. 1984, 23, 123–154. [Google Scholar] [CrossRef]
- Allen, J.F. Maintaining Knowledge About Temporal Intervals. Commun. ACM 1983, 26, 832–843. [Google Scholar] [CrossRef]
- Hurni, K.; Schneider, A.; Heinimann, A.; Nong, D.H.; Fox, J. Mapping the Expansion of Boom Crops in Mainland Southeast Asia Using Dense Time Stacks of Landsat Data. Remote Sens. 2017, 9, 320. [Google Scholar] [CrossRef] [Green Version]
- Câmara, G.; Picoli, M.; Maciel, A.; Simoes, R.; Santos, L.; Andrade, P.R.; Ferreira, K.; Begotti, R.; Sanches, I.; Carvalho, A.X.Y.; et al. Land cover change maps for Mato Grosso State in Brazil: 2001–2017 (version 3). PANGAEA 2019. [Google Scholar] [CrossRef]
- Rudorff, B.F.T.; Adami, M.; Aguiar, D.A.; Moreira, M.A.; Mello, M.P.; Fabiani, L.; Amaral, D.F.; Pires, B.M. The soy moratorium in the Amazon biome monitored by remote sensing images. Remote Sens. 2011, 3, 185–202. [Google Scholar] [CrossRef] [Green Version]
- Silva, C.A.; Lima, M. Soy Moratorium in Mato Grosso: Deforestation undermines the agreement. Land Use Policy 2018, 71, 540–542. [Google Scholar] [CrossRef]
- Macedo, M.N.; DeFries, R.S.; Morton, D.C.; Stickler, C.M.; Galford, G.L.; Shimabukuro, Y.E. Decoupling of deforestation and soy production in the southern Amazon during the late 2000s. Proc. Natl. Acad. Sci. USA 2012, 109, 1341–1346. [Google Scholar] [CrossRef] [Green Version]
- Barretto, A.G.O.P.; Berndes, G.; Sparovek, G.; Wirsenius, S. Agricultural intensification in Brazil and its effects on land-use patterns: An analysis of the 1975–2006 period. Glob. Chang. Biol. 2013, 19, 1804–1815. [Google Scholar] [CrossRef]
- Richards, P. What Drives Indirect Land Use Change? How Brazil’s Agriculture Sector Influences Frontier Deforestation. Ann. Assoc. Am. Geogr. Assoc. Am. Geogr. 2015, 105, 1026–1040. [Google Scholar] [CrossRef] [Green Version]
- Arvor, D.; Meirelles, M.S.P.; Vargas, R.; Skorupa, L.A.; Fidalgo, E.C.C.; Dubreuil, V.; Herlin, I.; Berroir, J. Monitoring land use changes around the indigenous lands of the Xingu basin in Mato Grosso, Brazil. In Proceedings of the 2010 IEEE International Geoscience and Remote Sensing Symposium, Honolulu, HI, USA, 25–30 July 2010; pp. 3190–3193. [Google Scholar]
- Jasinski, E.; Morton, D.; DeFries, R.; Shimabukuro, Y.; Anderson, L.; Hansen, M. Physical landscape correlates of the expansion of mechanized agriculture in Mato Grosso, Brazil. Earth Interact. 2005, 9, 1–18. [Google Scholar] [CrossRef] [Green Version]
- Arvor, D.; Dubreuil, V.; Ronchail, J.; Simões, M.; Funatsu, B.M. Spatial patterns of rainfall regimes related to levels of double cropping agriculture systems in Mato Grosso (Brazil). Int. J. Climatol. 2014, 34, 2622–2633. [Google Scholar] [CrossRef]
- Cohn, A.S.; VanWey, L.K.; Spera, S.A.; Mustard, J.F. Cropping frequency and area response to climate variability can exceed yield response. Nat. Clim. Chang. 2016, 6, 601–604. [Google Scholar] [CrossRef]
- Hampf, A.C.; Stella, T.; Berg-Mohnicke, M.; Kawohl, T.; Kilian, M.; Nendel, C. Future yields of double-cropping systems in the Southern Amazon, Brazil, under climate change and technological development. Agric. Syst. 2020, 177, 102707. [Google Scholar] [CrossRef]
- de Oliveira, J.C.; Trabaquini, K.; Epiphanio, J.C.N.; Formaggio, A.R.; Galvão, L.S.; Adami, M. Analysis of agricultural intensification in a basin with remote sensing data. GISci. Remote Sens. 2014, 51, 253–268. [Google Scholar] [CrossRef]
- Brazilian Institute of Geography and Statistics (IBGE). Statistics of Agricultural Production—LSPA, 2020. Available online: https://www.ibge.gov.br/estatisticas/economicas/agricultura-e-pecuaria/9201-levantamento-sistematico-da-producao-agricola.html?=&t=series-historicas (accessed on 3 August 2020).
- EBC. Empresa Brasil de Comunicação/ Agĉncia Brasil. Estimativa de Junho Prevê Safra Recorde de 247,4 Milhões de Toneladas, 2020. Available online: https://agenciabrasil.ebc.com.br/economia/noticia/2020-07/estimativa-de-junho-preve-safra-recorde-de-2474-milhoes-de-toneladas (accessed on 3 August 2020).
Figure 1.
Mato Grosso State, Brazil. The Amazon biome occupies of state, mostly in the north and some in its west part; the Cerrado covers expanding from east to west through the center of the state; and the Pantanal in the southwest ().
Figure 1.
Mato Grosso State, Brazil. The Amazon biome occupies of state, mostly in the north and some in its west part; the Cerrado covers expanding from east to west through the center of the state; and the Pantanal in the southwest ().

Figure 2.
Land use and land cover maps for the Mato Grosso State in 2001 and 2017. Source: Camara et al. [44].
Figure 2.
Land use and land cover maps for the Mato Grosso State in 2001 and 2017. Source: Camara et al. [44].

Figure 3.
Amount of Natural Vegetation, Agriculture (single and double crop), and Pasture areas, from 2001 to 2017, in Mato Grosso State. (a) Amazon biome, (b) Cerrado biome, (c) Pantanal biome, and (d) Mato Grosso State (Amazon + Cerrado + Pantanal).
Figure 3.
Amount of Natural Vegetation, Agriculture (single and double crop), and Pasture areas, from 2001 to 2017, in Mato Grosso State. (a) Amazon biome, (b) Cerrado biome, (c) Pantanal biome, and (d) Mato Grosso State (Amazon + Cerrado + Pantanal).

Figure 4.
Land use and land cover conversions in the Mato Grosso State. (a) Amazon, (b) Cerrado, and (c) Pantanal biomes, from 2001 to 2017.
Figure 4.
Land use and land cover conversions in the Mato Grosso State. (a) Amazon, (b) Cerrado, and (c) Pantanal biomes, from 2001 to 2017.

Figure 5.
Patterns of agricultural practices changes from 2001 to 2017 in Mato Grosso State.

Figure 6.
Amazon biome: (a) conversion of Forest to Agriculture (single and double crop) and Pasture and (b) conversion from Pasture to Cropping in the three studied period.
Figure 6.
Amazon biome: (a) conversion of Forest to Agriculture (single and double crop) and Pasture and (b) conversion from Pasture to Cropping in the three studied period.

Figure 7.
Patterns of agricultural practice trajectories in Mato Grosso State, from 2001 to 2017. (a) Traditional agricultural area, a region of the Sinop municipality (border between the Amazon and Cerrado biomes); (b) Xingu Indigenous Park region (Amazon biome); (c) agricultural expansion area, west of the Mato Grosso State (Amazon biome); (d) traditional agricultural area (Cerrado biome); (e) traditional agricultural area, south of the Mato Grosso State (Cerrado biome).


Table 1.
Patterns of agricultural practices trajectories during entire study period.
| Change Pattern | Description | Trajectory Example |
|---|---|---|
| Stability | An agricultural practice remains constant during the study period. | …→ SC → SC → SC → SC → SC → … |
| Intensification | There is a conversion from single crop to double crop practice. | …→ SC → SC → SC → DC → DC → … |
| Reduction | There is a conversion from double crop to single crop practice. | …→ DC → DC → SC → SC → SC → … |
| Interchange | Two agricultural practices interchange during entire study period. | …→ SC → DC → SC → DC → DC → … |
| Expansion | An agricultural practice is in expansion during the study period. | …→ PT → SC → SC → PT → SC → … |
Table 2.
LUC calculus predicates to express patterns of agricultural practices trajectories.
| Change Pattern | LUC Calculus Expression |
|---|---|
| Stability | |
| Intensification | |
| Reduction | |
| Interchange | |
| Expansion |
Table 3.
Percentage of land use and land cover conversions in the portions of the Mato Grosso State.
Table 3.
Percentage of land use and land cover conversions in the portions of the Mato Grosso State.
| (a) Amazon | ||
|---|---|---|
| Class in 2001 | Class in 2017 | Conversion (%) |
| Forest | Pasture | 55.50 |
| Pasture | Double cropping | 24.34 |
| Forest | Double cropping | 17.28 |
| Single cropping | Double cropping | 1.13 |
| Double cropping | Pasture | 0.74 |
| Pasture | Single cropping | 0.56 |
| Forest | Single cropping | 0.28 |
| Single cropping | Pasture | 0.17 |
| Double cropping | Single cropping | 0.02 |
| (b) Cerrado | ||
| Class in 2001 | Class in 2017 | Conversion (%) |
| Cerrado | Pasture | 44.84 |
| Pasture | Double cropping | 23.71 |
| Single cropping | Double cropping | 9.80 |
| Forest | Pasture | 7.08 |
| Cerrado | Double cropping | 6.48 |
| Double cropping | Pasture | 3.73 |
| Forest | Double cropping | 2.88 |
| Single cropping | Pasture | 0.53 |
| Double cropping | Single cropping | 0.37 |
| Cerrado | Single cropping | 0.09 |
| Forest | Single cropping | 0.07 |
| (c) Pantanal | ||
| Class in 2001 | Class in 2017 | Conversion (%) |
| Cerrado | Pasture | 89.04 |
| Forest | Pasture | 8.45 |
| Pasture | Double cropping | 1.50 |
| Single cropping | Pasture | 0.27 |
| Double cropping | Pasture | 0.43 |
| Forest | Double cropping | 0.09 |
| Cerrado | Single cropping | 0.09 |
| Cerrado | Double cropping | 0.06 |
| Pasture | Single cropping | 0.04 |
| Forest | Single cropping | 0.02 |
| Double cropping | Single cropping | 0.01 |
Table 4.
Areas (ha) of agricultural practices trajectories in Mato Grosso State, stratified by biomes, considering the period from 2001 to 2017.
Table 4.
Areas (ha) of agricultural practices trajectories in Mato Grosso State, stratified by biomes, considering the period from 2001 to 2017.
| Amazon | Cerrado | Pantanal | |
|---|---|---|---|
| Expansion | 6609.01 (83.9%) | 8104.53 (54.6%) | 27.13 (99.1%) |
| Stability | 816.87 (10.4%) | 4399.61 (29.7%) | 0.20 (0.7%) |
| Interchange | 335.19 (4.3%) | 1940.48 (13.1%) | 0.01 (0.0%) |
| Intensification | 112.52 (1.4%) | 378.62 (2.6%) | 0.04 (0.2%) |
| Reduction | 1.03 (0.0%) | 7.89 (0.1%) | 0.00 (0.0%) |
Publisher’s Note: MDPI stays neutral with regard to jurisdictional claims in published maps and institutional affiliations. |
© 2020 by the authors. Licensee MDPI, Basel, Switzerland. This article is an open access article distributed under the terms and conditions of the Creative Commons Attribution (CC BY) license (http://creativecommons.org/licenses/by/4.0/).
Share and Cite
MDPI and ACS Style
Maciel, A.M.; Picoli, M.C.A.; Vinhas, L.; Camara, G. Identifying Land Use Change Trajectories in Brazil’s Agricultural Frontier. Land 2020, 9, 506. https://doi.org/10.3390/land9120506
AMA Style
Maciel AM, Picoli MCA, Vinhas L, Camara G. Identifying Land Use Change Trajectories in Brazil’s Agricultural Frontier. Land. 2020; 9(12):506. https://doi.org/10.3390/land9120506
Chicago/Turabian StyleMaciel, Adeline M., Michelle C. A. Picoli, Lubia Vinhas, and Gilberto Camara. 2020. "Identifying Land Use Change Trajectories in Brazil’s Agricultural Frontier" Land 9, no. 12: 506. https://doi.org/10.3390/land9120506
Note that from the first issue of 2016, this journal uses article numbers instead of page numbers. See further details here.