Spatial Structure of a Potential Ecological Network in Nanping, China, Based on Ecosystem Service Functions

1
School of Soil and Water Conservation, Beijing Forestry University, Beijing 100083, China
2
College of Tourism Management, Beijing International Studies University, Beijing 100083, China
3
Key Laboratory of Soil and Water Conservation and Desertification Prevention, Beijing Forestry University, Beijing 100083, China
4
Jinyun Forest Ecosystem Research Station, School of Soil and Water Conservation, Beijing Forestry University, Beijing 100083, China
5
Digital Territory Experiment Center, School of Land Resources and Urban & Rural Planning, Hebei GEO University, Shijiazhuang 050031, China
*
Author to whom correspondence should be addressed.
Land 2020, 9(10), 376; https://doi.org/10.3390/land9100376
Submission received: 2 September 2020
/
Revised: 24 September 2020
/
Accepted: 6 October 2020
/
Published: 7 October 2020
(This article belongs to the Special Issue Linking Integrated Valuation of Ecosystem Services and Landscape Management)
Abstract
:The increasing scale of urbanization and human activities has resulted in the fragmentation of natural habitats, leading to the reduction of ecological landscape connectivity and biodiversity. Taking Nanping as the study area, the core areas with good connectivity were extracted as ecological sources using a morphological spatial pattern analysis (MSPA) and landscape connectivity index. Then the ecosystem service functions of the ecological sources were evaluated based on the InVEST model. Finally, we extracted the potential ecological corridor based on the land type, elevation and ecosystem service functions. The results showed that the ecological source with higher landscape connectivity is distributed in the north and there are clear landscape connectivity faults in the northern and southern regions. Moreover, the areas with high habitat quality, soil retention and water production are mainly distributed in the northern ecological source areas. The 15 potential ecological corridors extracted were distributed unevenly. Among them, the important ecological corridors formed a triangle network, while the general ecological corridors were concentrated in the northwest. Therefore, it is suggested that the important core patches in the north be protected, and the effective connection between the north and south be improved. These results can provide a scientific basis for ecological construction and hierarchical management of the ecological networks.

1. Introduction
Rapid urbanization, population growth and high-intensity regional development accompanied by poorly managed land use result in a series of environmental problems, including the fragmentation of natural habitats and the reduction of regional biodiversity [1,2,3]. These environmental problems result in the destruction of the stability and sustainability of ecosystems, which also impact human health and productivity [4,5]. A number of government reports have been released to resolve environmental problems such as ecosystem degradation, ecological habitat fragmentation and destruction of ecological processes, including the “New Urban Agenda (NUA)” and “Transforming our World: The 2030 Agenda for Sustainable Development” [6,7]. In addition, the Nineteenth National Congress of China report pointed out that there is a need to strengthen the major national ecological rehabilitation projects and to optimize ecological barriers through the construction of ecological corridors and biodiversity protection networks. Therefore, the rehabilitation and protection of the ecological environment has become a significant focus globally.
The survival and development of all life depends on the ecological environment [8,9]. However, deterioration of the regional ecological environment is resulting in habitat fragmentation and reduced landscape connectivity, which will hinder natural ecological processes [10,11]. As the basic elements of landscape patterns, ecological corridors have the ability to connect fragmented habitats, thereby strengthening the functional relationships between populations and habitats, protecting ecosystem biodiversity and stability and facilitating the migration of species [12,13,14]. It is therefore clear that the rational establishment of potential ecological corridors is required to improve the ecological environment quality and to guarantee sustainable development [15,16,17,18,19].
Although there have been plenty of studies on the establishment of ecological corridors, the majority are based on the theory of the “patch–corridor–matrix”. Wilson and Willis (1975) concluded that corridors can connect the separated habitat patches to alleviate the threat of habitat fragmentation on biological survival [20]. Dutta et al. (2015) established a comprehensive resistance surface based on certain indicators, including land-use type, population density and traffic infrastructure, following which they constructed potential ecological corridors between 16 tiger reserves in central India [21]. Zhang et al. (2019) constructed potential ecological corridors within vacant land in Detroit based on species migration routes, rainwater management, urban heat islands, air quality and other desired social and cultural benefits [19]. These studies mainly focused on the identification of potential ecological networks based on natural habitat characteristics, such as land-use types, landscape patterns and target species, or on other social and cultural factors, such as traffic infrastructure. However, fewer studies have attempted to identify ecological networks based on ecosystem service functions. Since the spatial distributions of regional ecosystem services can be used as the basis of environmental protection policies [22], there should be more focus on the functions of ecological corridors at the landscape and regional scales [23]. Therefore, an analysis of ecological networks may make landscape management more effective and scientific from a coupled landscape pattern and ecosystem service functions.
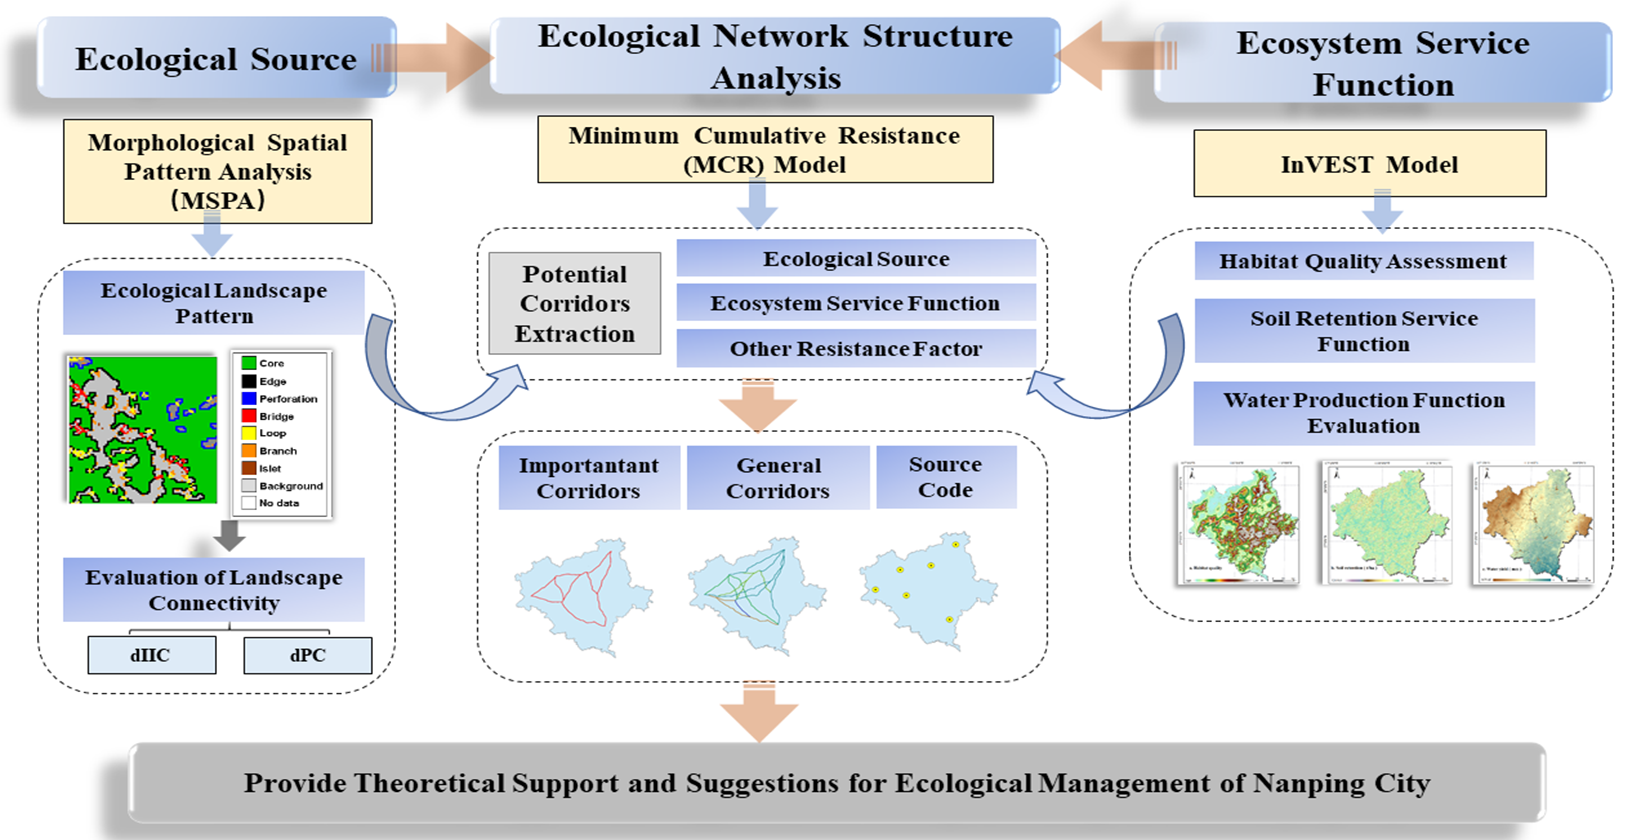
Nanping in China is rich in forest resources, which mainly consist of food as well as providing an environmental security zone and natural ecological reserved zone [24]; it should be reserved for providing ecological functions, such as water conservation, soil and water retention and biodiversity maintenance. However, since Nanping faces increasingly serious environmental problems, the government has put forwarded the ecological bank project to further improve the ecological environment. Given the above background, this study applied a morphological spatial pattern analysis (MSPA) to this region to identify and extract core areas with important ecological significance for the construction of ecological corridors [25]. The landscape connectivity of the core areas was then evaluated based on connectivity landscape indices, such as the integral indices of connectivity (IIC), probability of connectivity (PC) and the percentage of importance (dI). The ecological sources with good landscape connectivity were selected according to the classification of their significances for maintaining landscape connectivity. The InVEST model was then used to evaluate the ecosystem service functions, such as habitat quality, soil retention and water production. Finally, the potential ecological corridors were identified using the minimum cumulative resistance (MCR) minimum path method [25], while comprehensively considering the natural characteristics as well as ecological service functions such as habitat quality, water production and soil retention, following which the ecological network of Nanping was analyzed based on ecosystem service functions. The main purpose of the research is to use the landscape pattern and ecosystem service function to review the potential ecological network, so as to provide theoretical support and suggestions for the ecological management of Nanping City, and also provide references for ecological construction in other regions.
2. Materials and Methods
2.1. Study Area
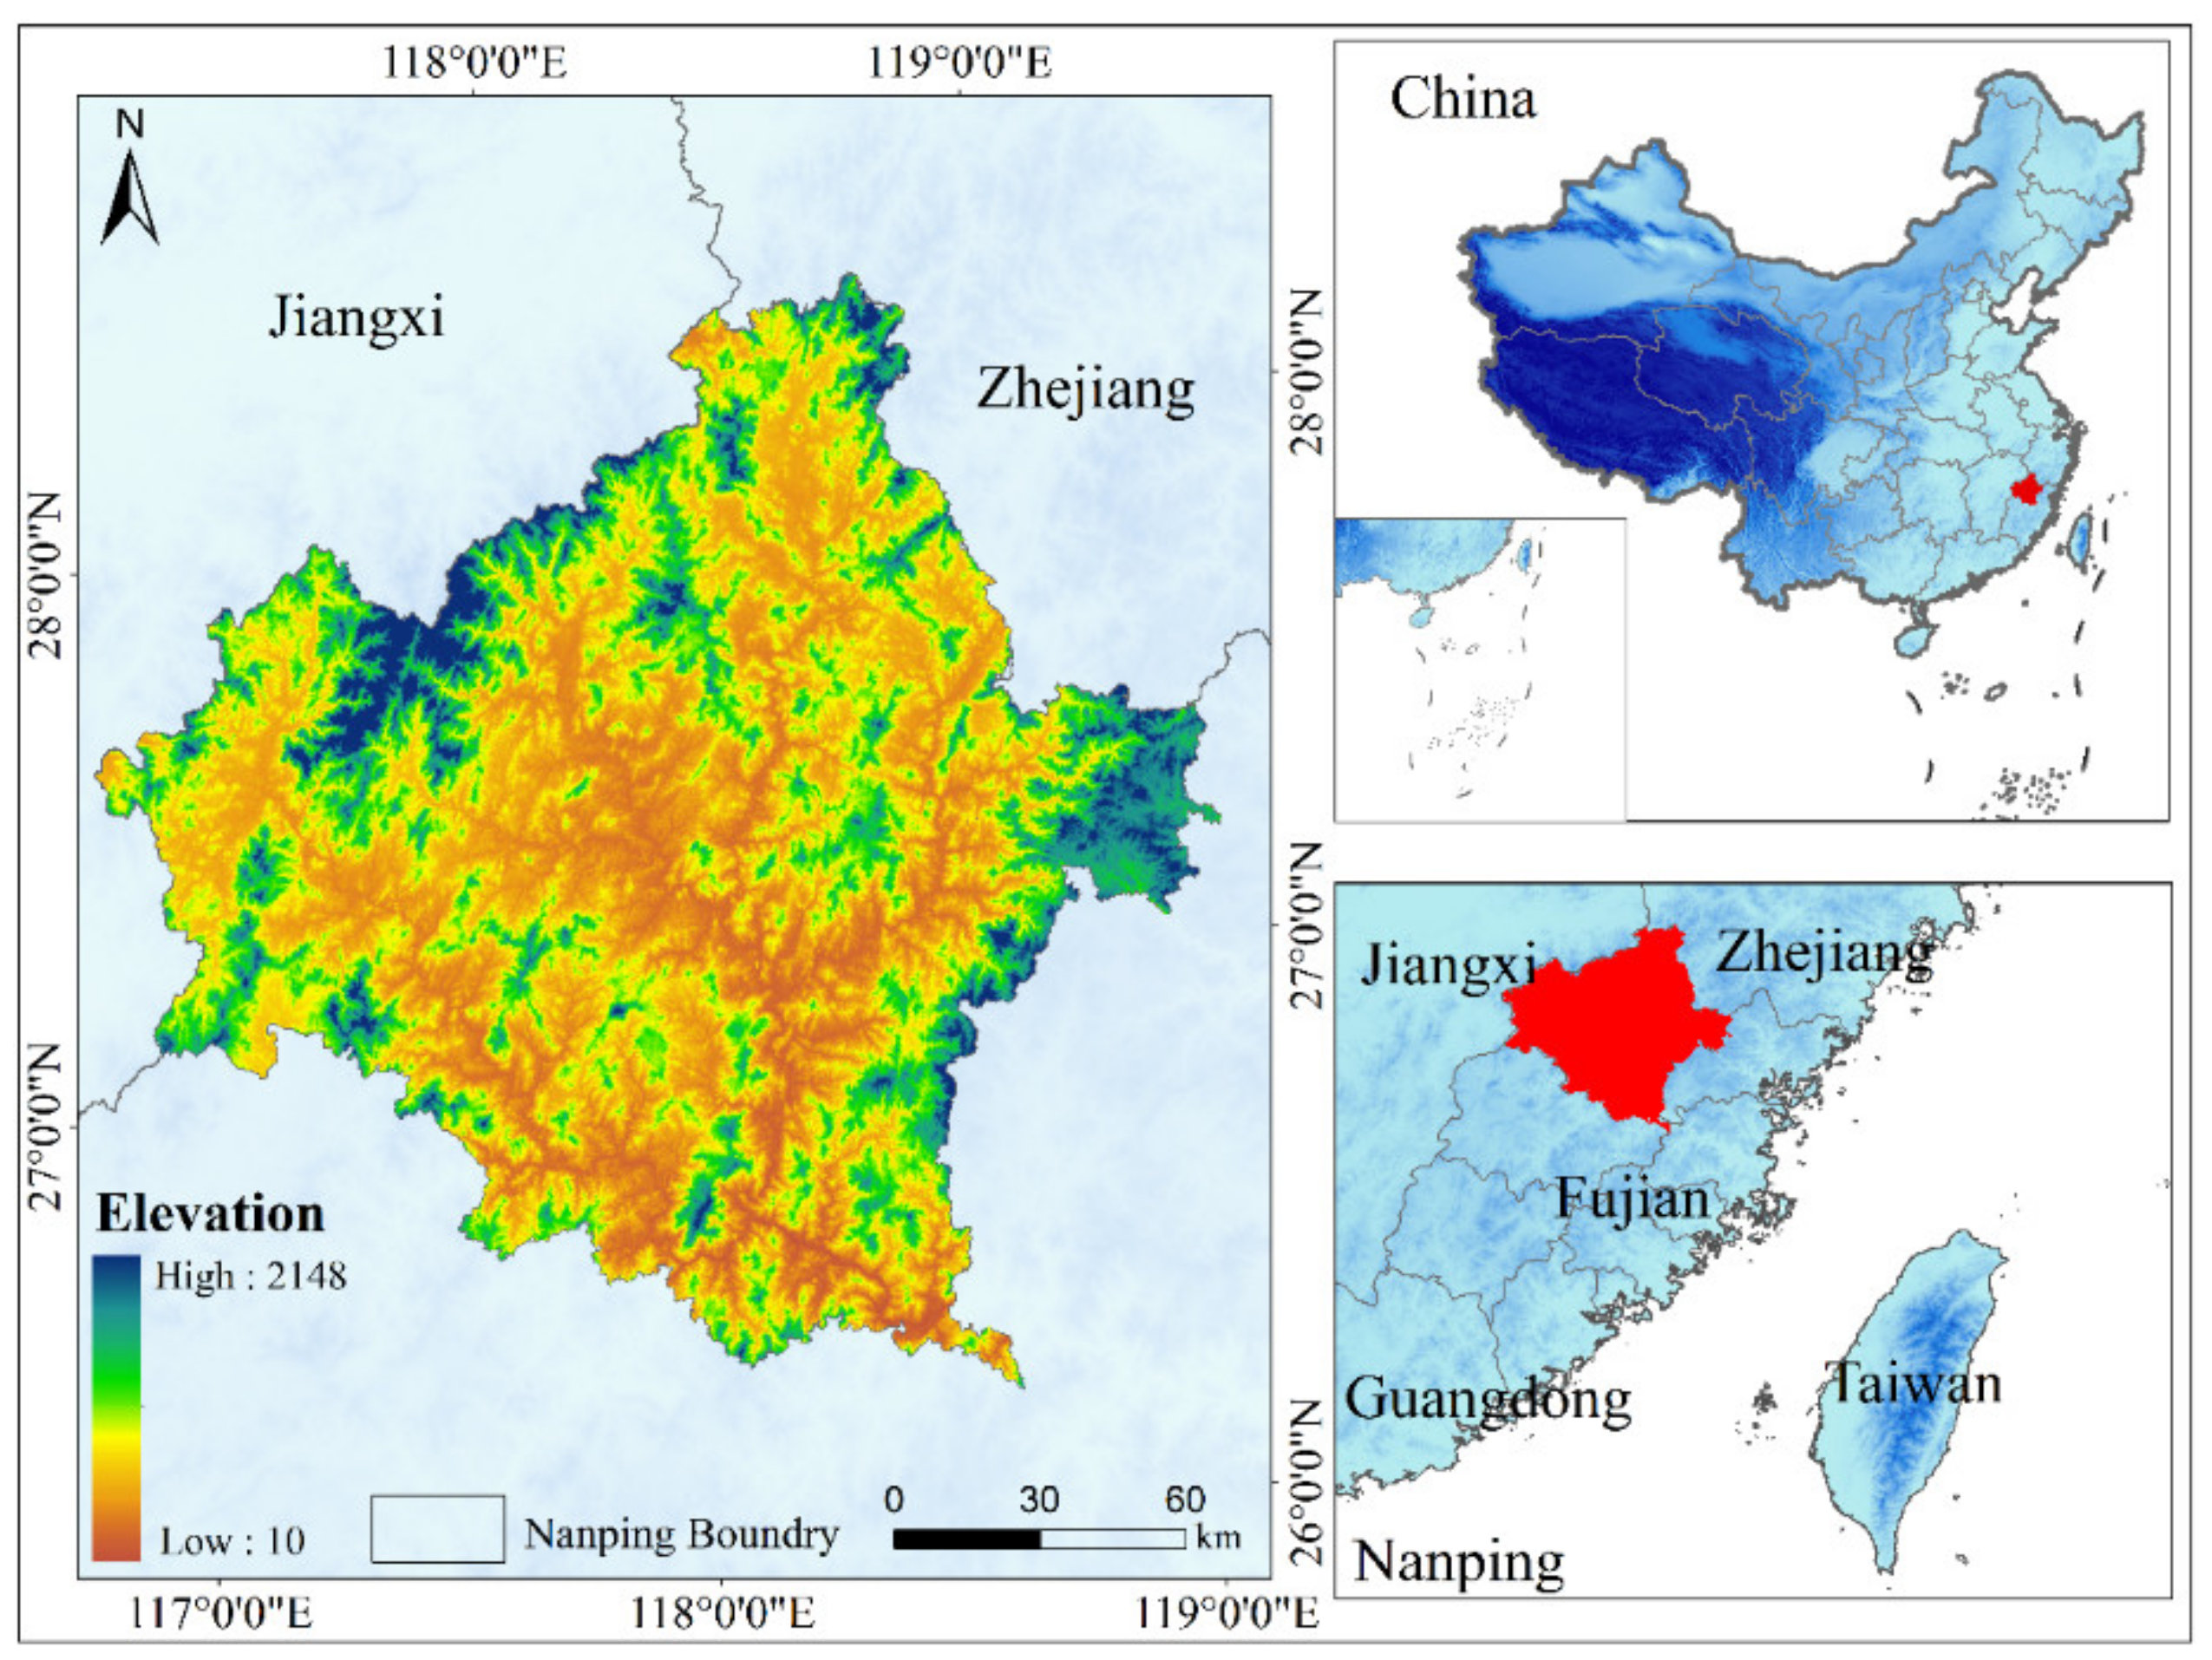
Nanping is located in the northern Fujian Province, China, southeast of the Wuyi Mountains (117°00′–119°25′E and 26°30′–28°20′N) and adjacent to the Zhejiang and Jiangxi provinces in the northeast and northwest, respectively (Figure 1). The study area can be described as hinterland connecting the coastal and inland areas, with a total area of 26,300 km2, accounting for 21.2% of the Fujian Province. The study area experiences a typical subtropical humid monsoon climate, with an average temperature between 17 ℃ and 26 ℃ and annual precipitation between 1430 mm and 2032 mm. Mountainous areas dominate from the northeast to southwest, and the entire study area has a wide distribution of low mountains and hills. The study area contains a total of eight streams and one river system, namely the Minjiang, Jianxi, Futun, Chongyang, Nanpu, Songxi, Maxi, Shaxi and Jinxi rivers. The region contains seven types of soil, namely red, paddy, yellow, coarse bone, purple, yellow-brown and mountain meadow soils. The region contains abundant forest resources, with vegetation types including coniferous forest, evergreen broad-leaf forest and shrubs. Nanping is the most significant ecological refuge and biological gene bank in the Fujian Province and even within the entire southeast region of China. While the economy of Nanping has grown steadily in recent years, rehabilitation of the ecological environment has not occurred in conjunction with economic development.
2.2. Data Source and Processing
This study utilized land-use data, a digital elevation model (DEM), meteorological data and soil data. Among them, the land-use data were provided by the Resource and Environmental Science Data Center of the Chinese Academy of Sciences (http://www.resdc.cn/, last accessed 2 June 2020), obtained through manual interactive interpretation with an accuracy of 95% and spatial resolution of 30 m × 30 m. The land-use categories considered were cultivated land, orchard land, forest, grassland, water area, road networks, built-up area and unused land. DEM data were obtained from the Advanced Spaceborne Thermal Emission and Reflection Radiometer ASTER global digital elevation model (GDEM) dataset with a spatial resolution of 30 m [26], downloaded from the Geospatial Data Cloud website (http:// www.gscloud.cn/, last accessed 2 June 2020).
Meteorological data were obtained from the China Meteorological Administration (http://data.cma.cn/, last accessed 2 June 2020), consisting of monthly precipitation (mm) of 17 meteorological stations in Nanping and surroundings. The precipitation data were interpolated into 30 m × 30 m grid cell data using the Kriging method to analyze precipitation erosion and potential evapotranspiration. Soil data were derived from a 1:1,000,000 soil dataset downloaded from the Scientific Data Center for Cold and Arid Regions (http://westdc.westgis.ac.cn, last accessed 2 June 2020). The soil attribute data were converted to spatial data using the Kriging interpolation method.
2.3. Methodology
2.3.1. Extraction of the Ecological Landscape Pattern
Morphological Spatial Pattern Analysis (MSPA)
Morphological spatial pattern analysis (MSPA) is an image processing method developed by Soille and Vogt (2009), which can be used to measure, identify and disaggregate the spatial pattern of raster images based on four basic operations of mathematical morphology, namely “erode”, “dilate”, “open” and “close”. MSPA is mainly used for the analysis of structural connectivity and can be used to accurately distinguish between landscape types and structures [27]. The MSPA method applies four parameters, namely “connectivity”, “edge width”, “transition” and “intext” to classify landscape data into three input data categories, namely foreground, background and missing data (Table 1).
Evaluation of Landscape Connectivity
Landscape connectivity can be used as a quantitative indicator of how facilitating a source landscape patch is for species migration, as a high degree of connectivity facilitates biodiversity protection and the maintenance of landscape ecological functions [28]. The connectivity of the landscape and the importance of the various landscape patches to landscape connectivity can be reflected under graph theory using the integral index of connectivity (IIC) and the probability of connectivity (PC). These have become effective and important indices for the measurement of landscape patterns and functions [29]. The percentage of importance (dI) is also a widely used landscape connectivity index [30,31]. The landscape connectivity indices were calculated as follows:
In Equations (1)–(3), n is the total number of patches in the landscape; and represent the areas of patch i and patch j, respectively; represents the connection between patch i and patch j; is the total area of the landscape; is the maximum potential for the species to spread directly in patch i and patch j; I is the connectivity index value of a certain landscape, represented as the IIC and the PC in the current study; and is the connectivity index value of the landscape after patch i is removed from the landscape.
2.3.2. Evaluation of Ecosystem Services
This study used the InVEST model to evaluate the ecosystem services in the ecological source area of Nanping from three aspects: (1) habitat quality; (2) soil retention; and (3) water production.
Habitat Quality Assessment
The Habitat Quality Module uses the sensitivity of landscape types and the intensity of external threats to analyze the habitat distribution responses to external threats in different landscape patterns. The habitat quality obtained can reflect regional biodiversity as it represents the richness of regional biodiversity [32,33]. Habitat quality can be estimated as follows:
In Equations (4) and (5), is a measure of habitat degradation of grid x in landscape type j; R is the number of threat factors; is the weight of threat factor r; y refers to all of the grid units of threat factor r; is the total number of grid units of threat factor r; represents the maximum impact distance of threat factor r; is the number of threat factors in grid unit y; is the legal accessibility of grid unit x; is the sensitivity of landscape type y to threat factor r, ranging from 0 to 1; is the habitat quality index of grid x in landscape type j; represents the habitat suitability of landscape type j; k is the semi-saturation constant equal to half of the maximum of ; and z is a constant with a value of 2.5.
Soil Retention Service Function
The soil retention service function includes reduction of erosion and sediment retention, and it can be estimated as follows:
In Equations (6)–(9), and refer to the soil retention and sediment retention of grid x, respectively; is the sediment retention efficiency of grid x; is the potential soil loss of grid x based on the geomorphology and climate conditions; and refer to the Universal Soil Loss Equation (USLE)-calculated actual erosion amounts of grid x and its uphill grid y, respectively (i.e., the amount of soil erosion under a particular vegetation cover and soil and water conservation measures); and , , , and are the rainfall erosivity factor, soil erodibility index, terrain factor, vegetation coverage factor and soil and water conservation measure factor of grid x, respectively.
Water Production Function Evaluation
The water yield module in the InVEST model estimated the water balance in a grid unit. The water yield is the difference between rainfall and evapotranspiration on a grid unit, and considers the surface runoff generation, subsurface flow, canopy retention and water holding capacity of litter [34,35].
In Equations (10)–(14), is the annual water production of grid unit x in landscape type j; is the annual average evapotranspiration of grid unit x on landscape type j; is the annual average precipitation of grid unit x; / is the Zhang coefficient, proposed by Zhang et al. (2001) as an approximation algorithm based on the Budyk curve; is a non-physical parameter representing the climate–soil properties (dimensionless); is the dryness index of grid unit x on landscape type j (dimensionless); is the available water content of plants; is the crop coefficient, calculated as the ratio of evapotranspiration ET to potential evapotranspiration ETo of grid unit x in landscape type j, referred to as the vegetation evapotranspiration coefficient; Z is a seasonal factor coefficient determined by the seasonal distribution of rainfall, with a value ranging from 1 to 10; ETo is the potential evapotranspiration (mm); is the maximum soil depth; and is root depth.
2.3.3. Minimum Cumulative Resistance (MCR) Model
The MCR model calculates the costs to overcome the resistances associated with movement from the sources through different landscape paths, and can reflect the cumulative cost distance from the target patch to the nearest source patch, thereby representing a form of weighted distance. The MCR method was proposed by Knaapen et al. (1992) [36] and it can be calculated as
In Equation (15), MCR is the minimum value of cumulative resistance to movement from the source to any point in the area; represents the positive correlation between the minimum cumulative resistance and the ecological process; is the spatial distance between grid unit i and source j; and represents the resistance coefficient of grid unit i.
3. Results
3.1. Analysis on the Landscape Patterns of Nanping Using MSPA
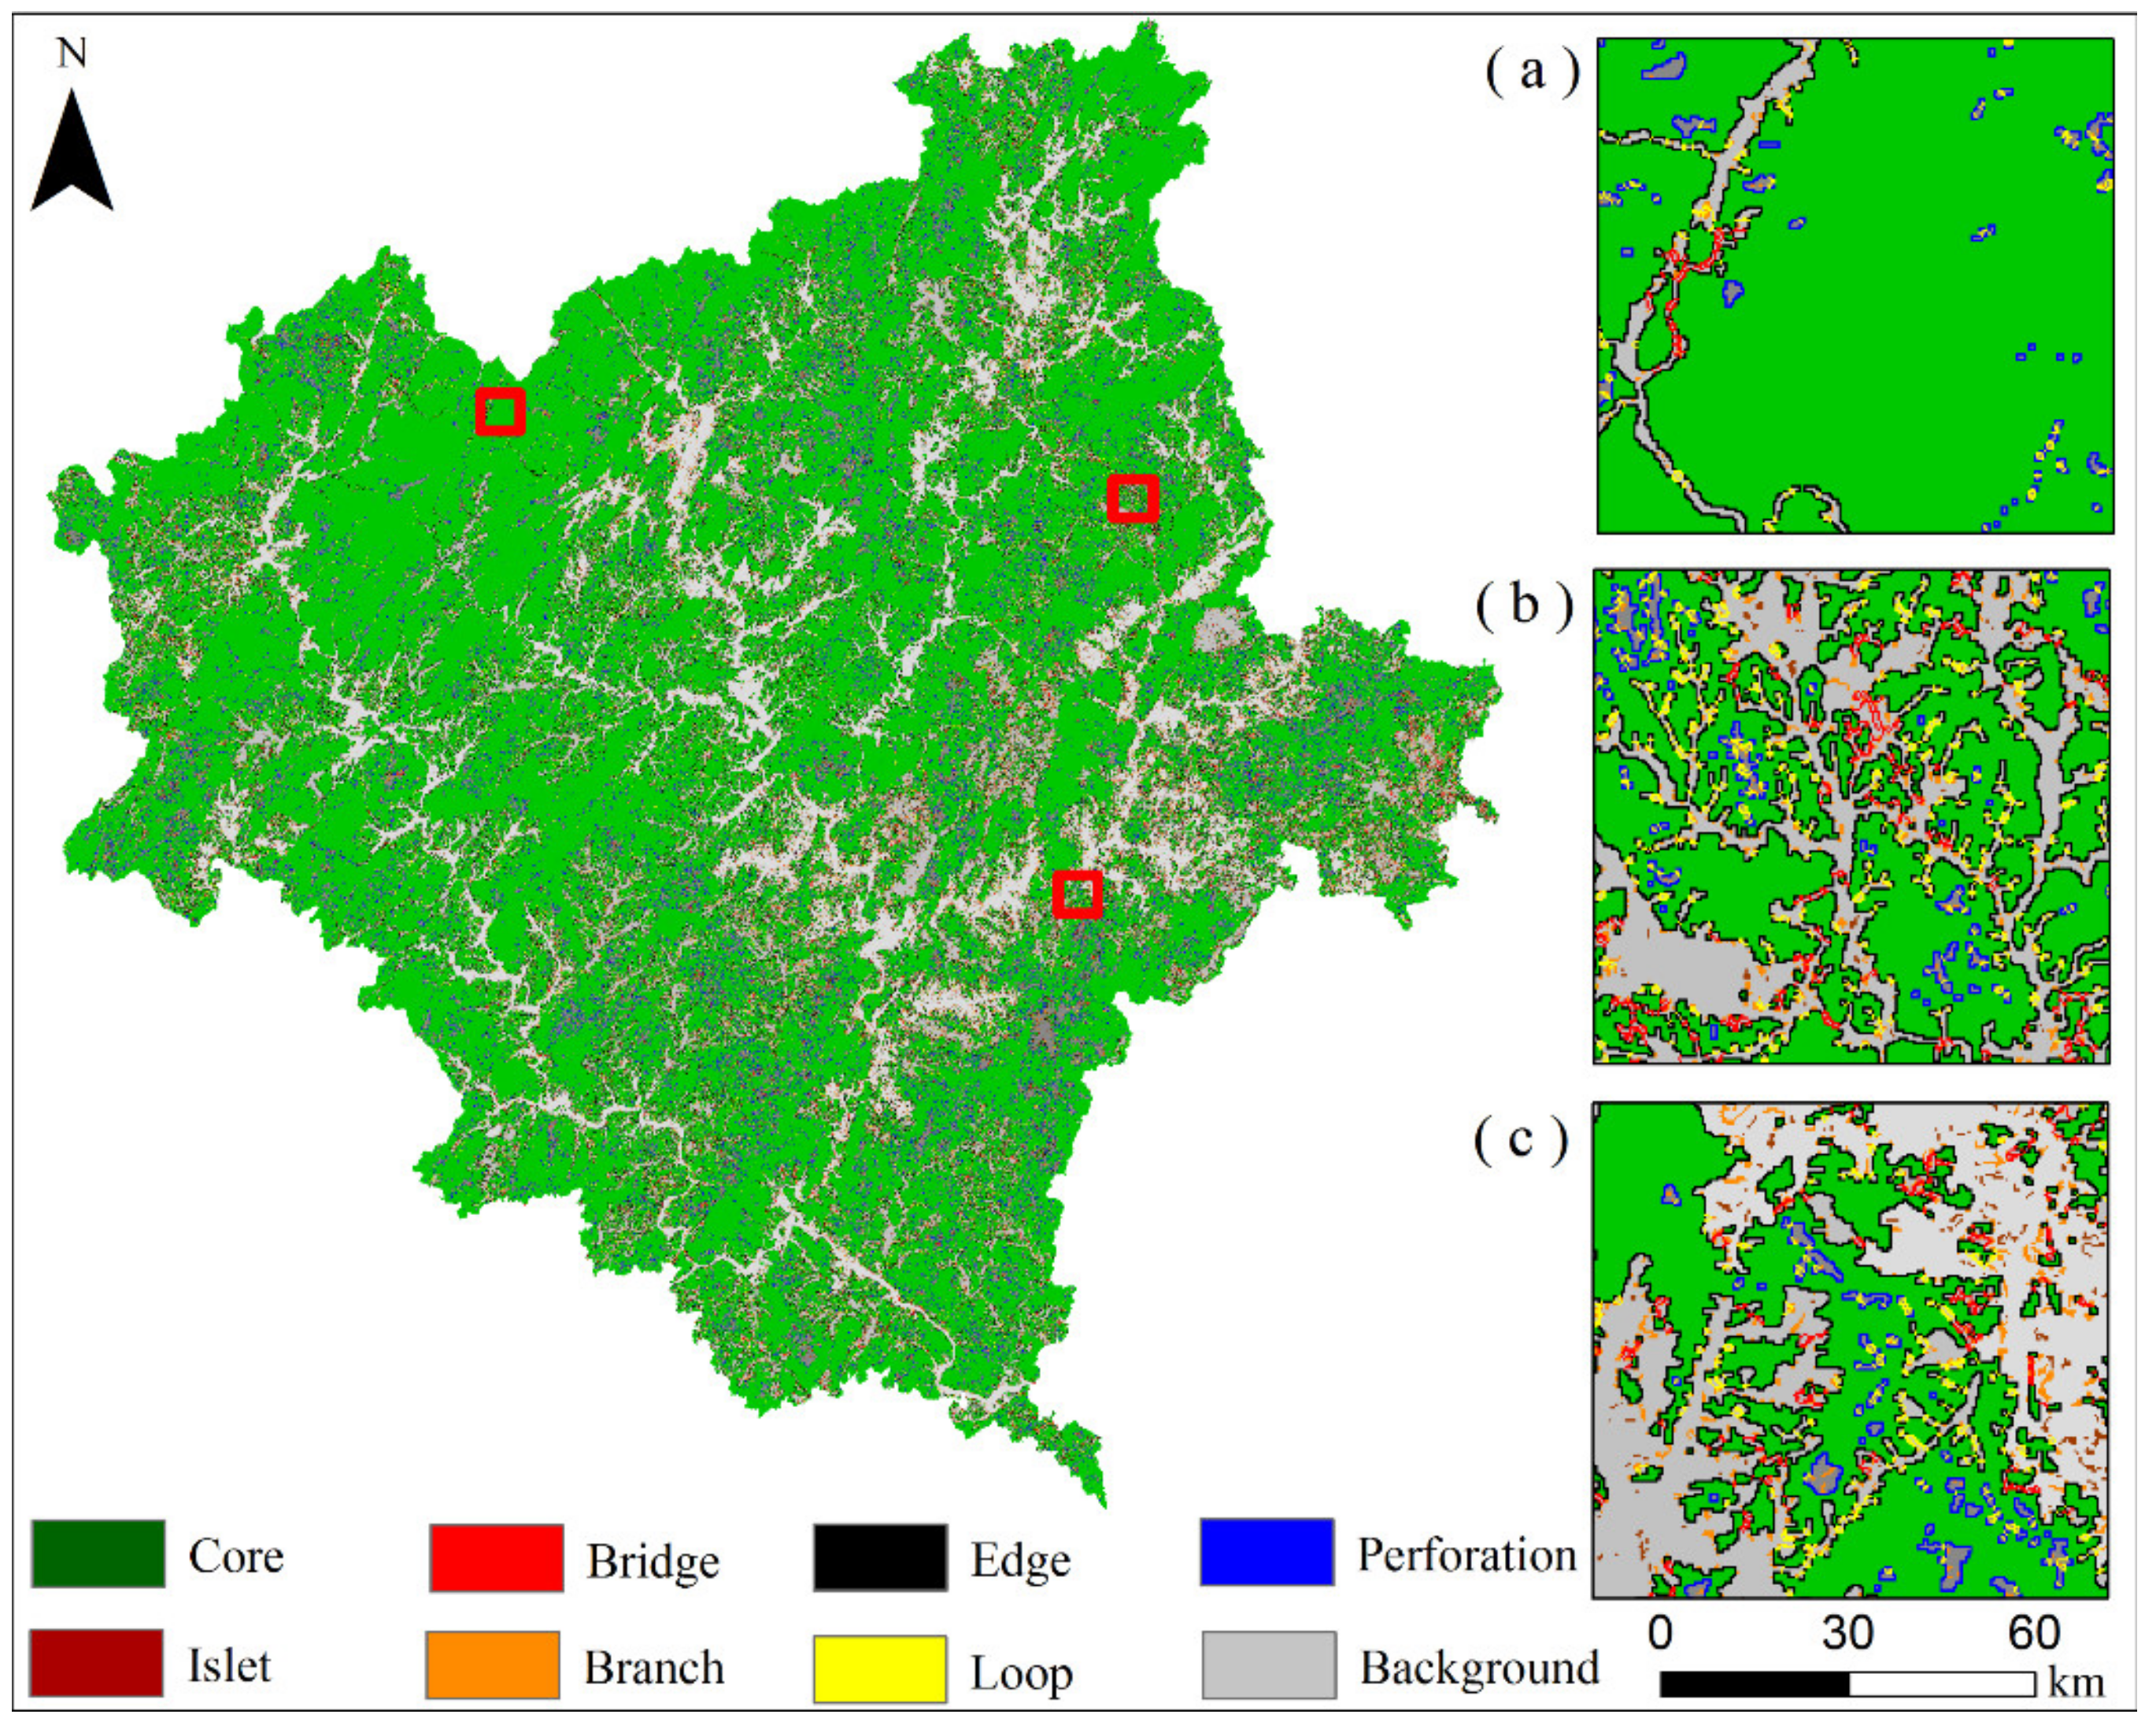
According to the land-use data for Nanping, this study applied forest and other land-cover types as foreground and background data for MSPA, respectively. Since the forestry area in Nanping was large, a grid size of 30 m × 30 m was used to retain the important landscape elements in the study area while also meeting the requirements of research data accuracy. Through running the MSPA with the eight-neighborhood method, the spatial distributions and areas of seven categories of non-overlapping landscapes were obtained, namely, the core, bridge, edge, perforation, islet, branch and loop (Figure 2, Table 2).
The results showed that the core areas of Nanping had a total area of 1377.24 hm2, accounting for 80.85% and 63% of the forestry area and total study area, respectively. The core areas were mainly concentrated in the northern part of the study area with a continuous patchy spatial pattern, indicating good spatial connectivity. There was a more scattered distribution of core areas in the central and southeastern parts of the study area, indicating poor connectivity, which was not conducive to the migration and diffusion of organisms. The bridge area, which acted as a structural corridor in the natural landscape, played an important role in facilitating the migration and diffusion of species in the study area. The bridge area connected two core area patches, accounting for 31.984 hm2, only 0.81% and 0.63% of the total forestry area and total study area, respectively. While the bridge area was mainly distributed between the core areas, the core areas in the southeast part of the study area were relatively fragmented. In addition, the bridge area was scattered, indicating that the connectivity of the structural corridors failed to play a significant role in Nanping, China. The edge area was located along the external edge of the forest land patch and also acted as the transition area between the core area and the non-green landscape area. The inner edges of the forest land patch was termed the perforation area, and this area along with the edge both produced edge effects, accounting for 10.06% and 5.12% of the total forest area, respectively, indicating that the edge area and perforation area can to a certain extent act as a buffer against interference to the core area from outside.
Since only one end of the branch was connected to the edge area, the bridge area, the loop area or the perforation area, the branch interrupted the corridor connection, accounting for 2.04% and 1.59% of the total forestry area and total study area, respectively, greater than that of the bridge area. This result indicated that the corridor connection in the study area was significantly affected by the branch. The islets, as isolated patches not connected with other patches, complemented the core areas as they act as biological stepping stones scattered throughout the study area. The islets accounted for only 0.43% of the total forestry area, indicating that forest land in the study area remained dominated by the construction of ecological corridors. The loops facilitated the migration of species within the same patches and acted as routes of intra-patch energy exchange, accounting for 0.7% of the total forestry area, higher than only that of the islets. This result indicated that migration channels used as energy exchange and material flow within the study area remained small and not conducive to species migration.
3.2. Evaluation of Landscape Connectivity in Nanping
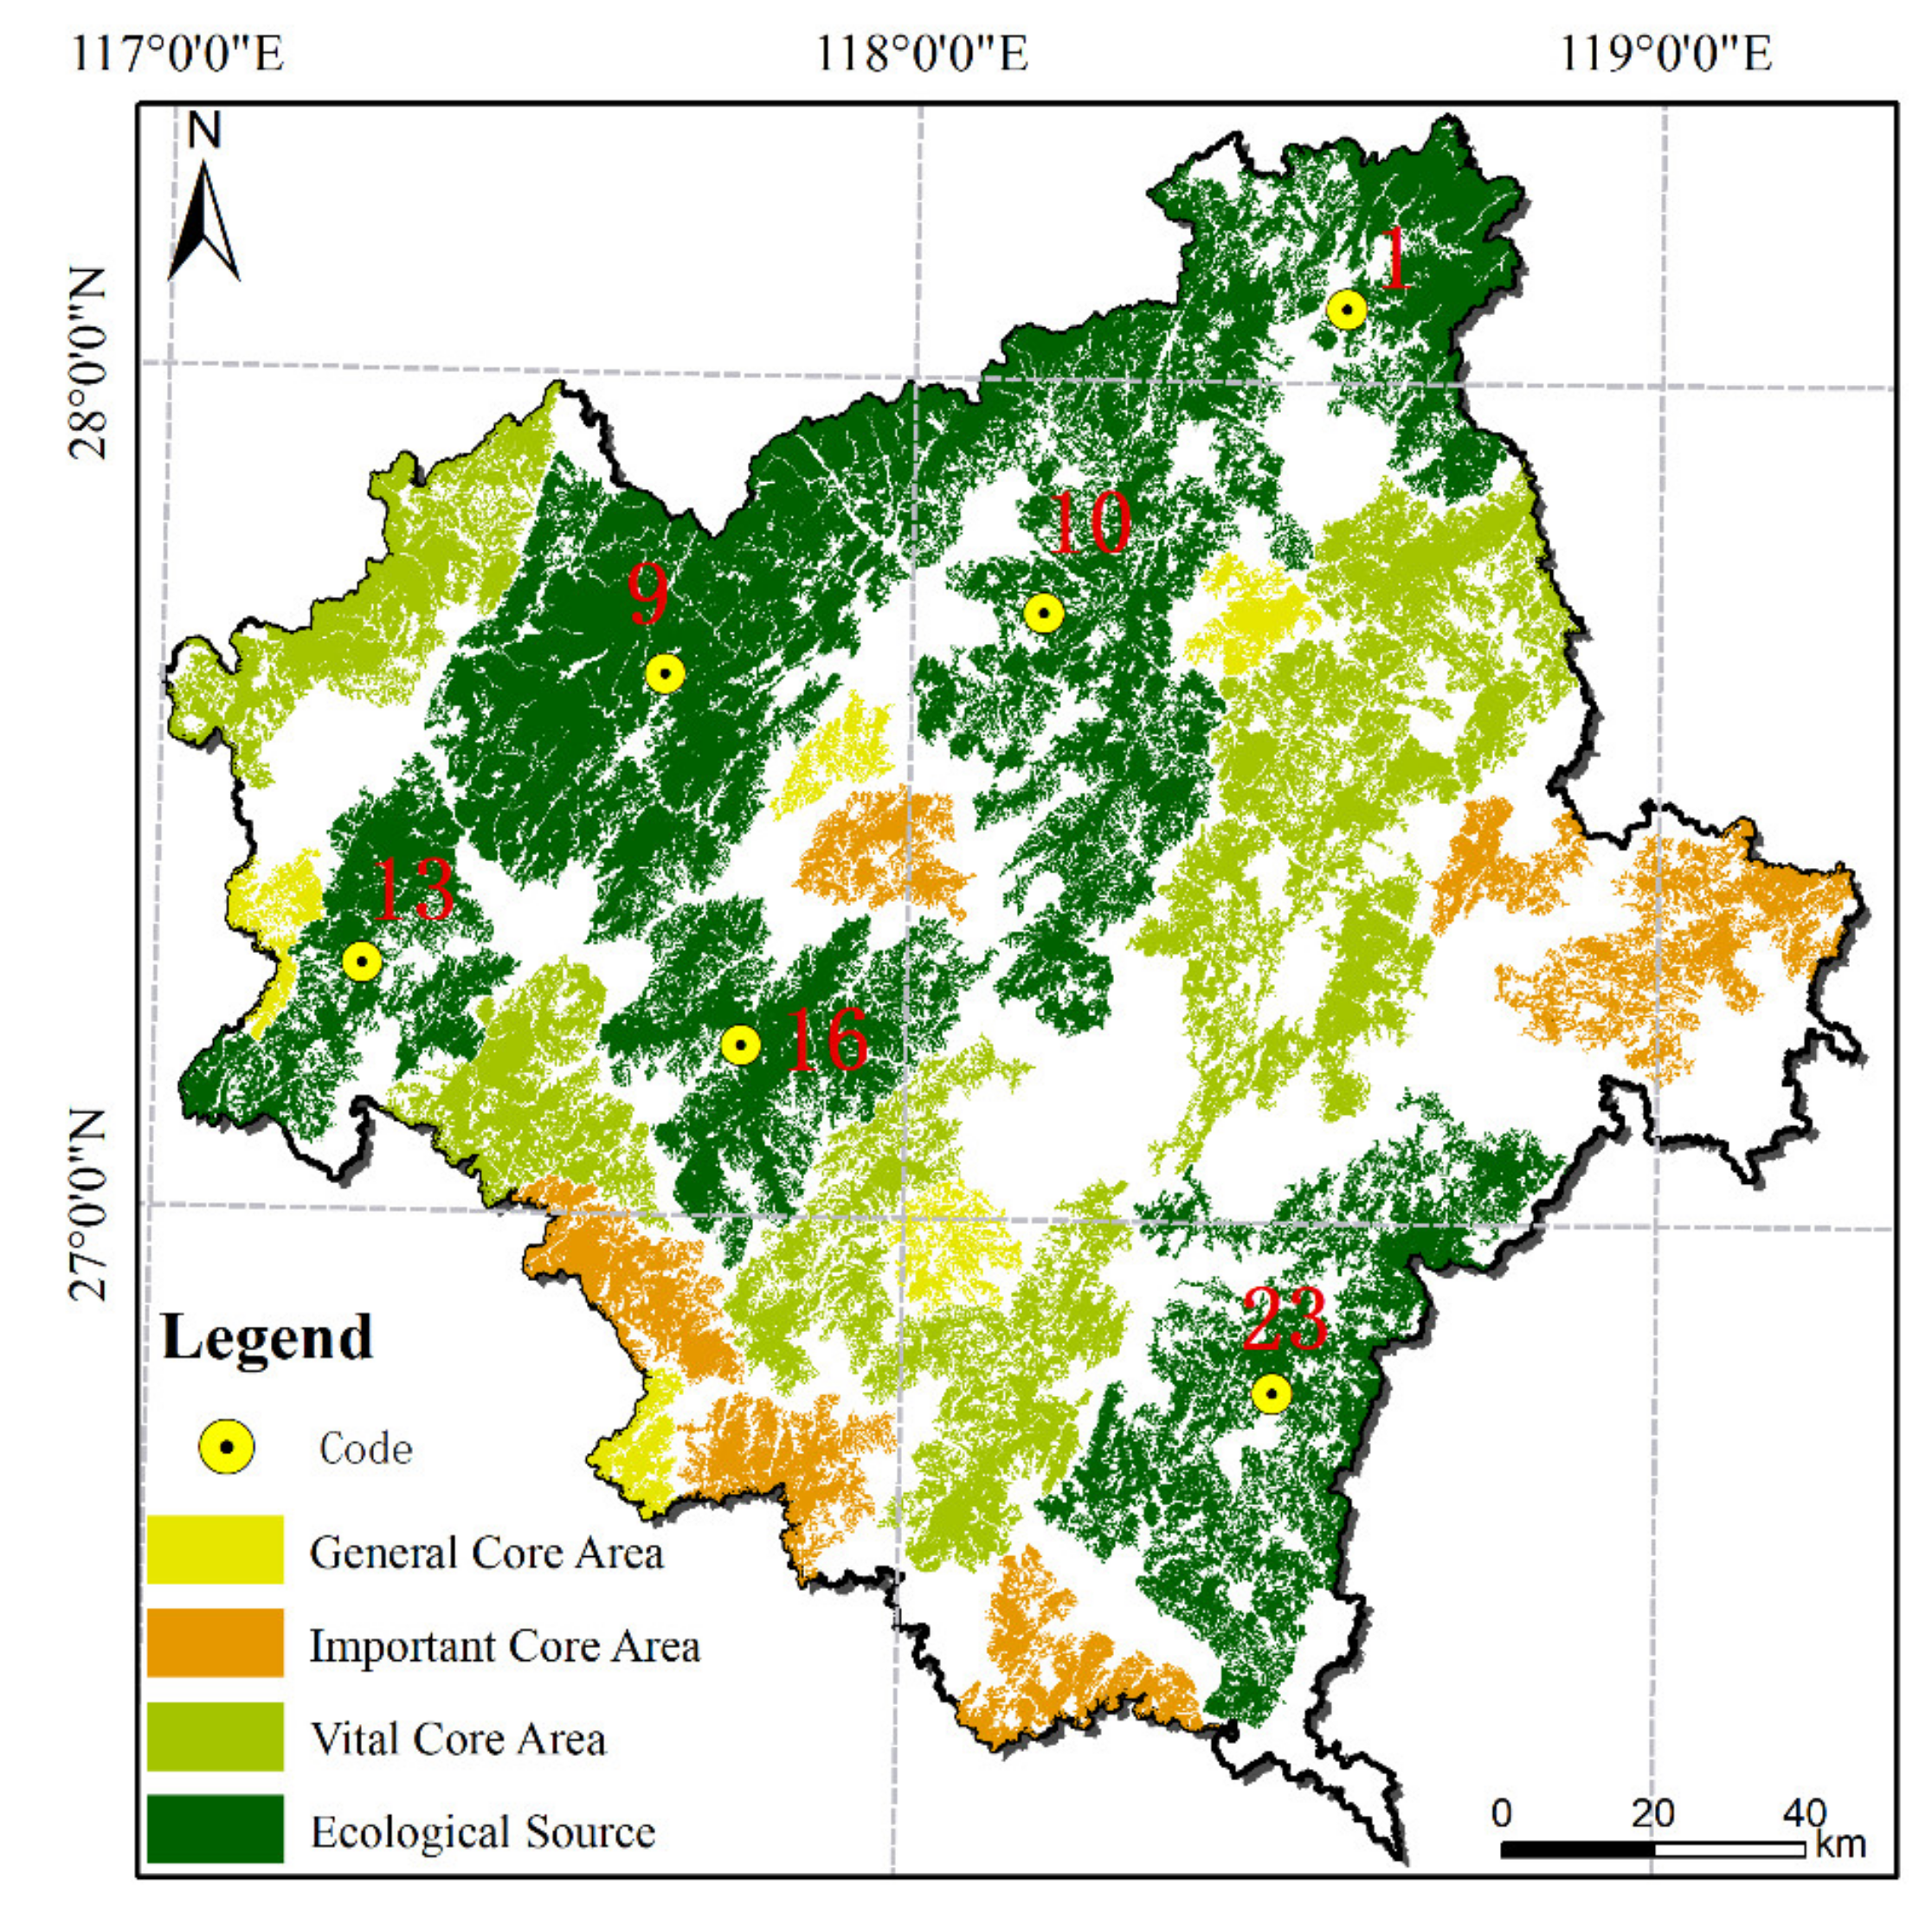
To evaluate the landscape connectivity of the study area, the threshold of patch connectivity distance was set to 5 km through repeated experiments, whereas the probability of connectivity was set to 0.5. The landscape connectivity of the 24 core areas were then evaluated with a large area extracted by the MSPA (Table 3). The importance of each patch was indicated by the value of its ecological patch connectivity index in a positive relationship. The considerable importance of patches, as represented by dI, indicated the greater contribution of patches to network connectivity. Therefore, six core areas with dPC values greater than 10 were selected as ecological source areas, whereas the remaining 18 cores areas were categorized into vital core areas (6 < dPC < 10), important core areas (2 < dPC < 6) and the general core areas (dPC < 2) (Figure 3). The ranking of the landscape connectivity index values of the core areas showed that the dIIC values of the 24 core areas were greater than 0.9, and that the dPC values were greater than 1. The patches 1, 9, 10, 16, 23 and 13, for which the dPC was greater than 10, were selected as the ecological sources for the subsequent analysis of ecosystem service functions.
As is evident in the spatial distribution of the connectivity of the ecological source area (Figure 3), the overall connectivity of the study area required improvement, with obvious faults in the north and south regions. Ecological source areas 9 and 10 in the northern part of the study area were mainly distributed in the Wuyi Mountain. Since Wuyishan City is a national key ecological function area, it was characterized by a large area of forest land with relatively better biodiversity and relatively good landscape connectivity, which was beneficial to the migration of species between patches and the flow of material energy. Only ecological source area 23 showed notable landscape connectivity in the southern region. Although a number of core areas existed in the eastern part of the study area, the important and general core areas acted as the main components, and were characterized by a poor and relatively scattered landscape connectivity and spatial distribution, respectively. The general core areas with a relatively small areas and low dPC values distributed in the central part of the study area were not conducive to the construction of ecological networks.
3.3. Evaluation and Analysis of Ecosystem Service Functions
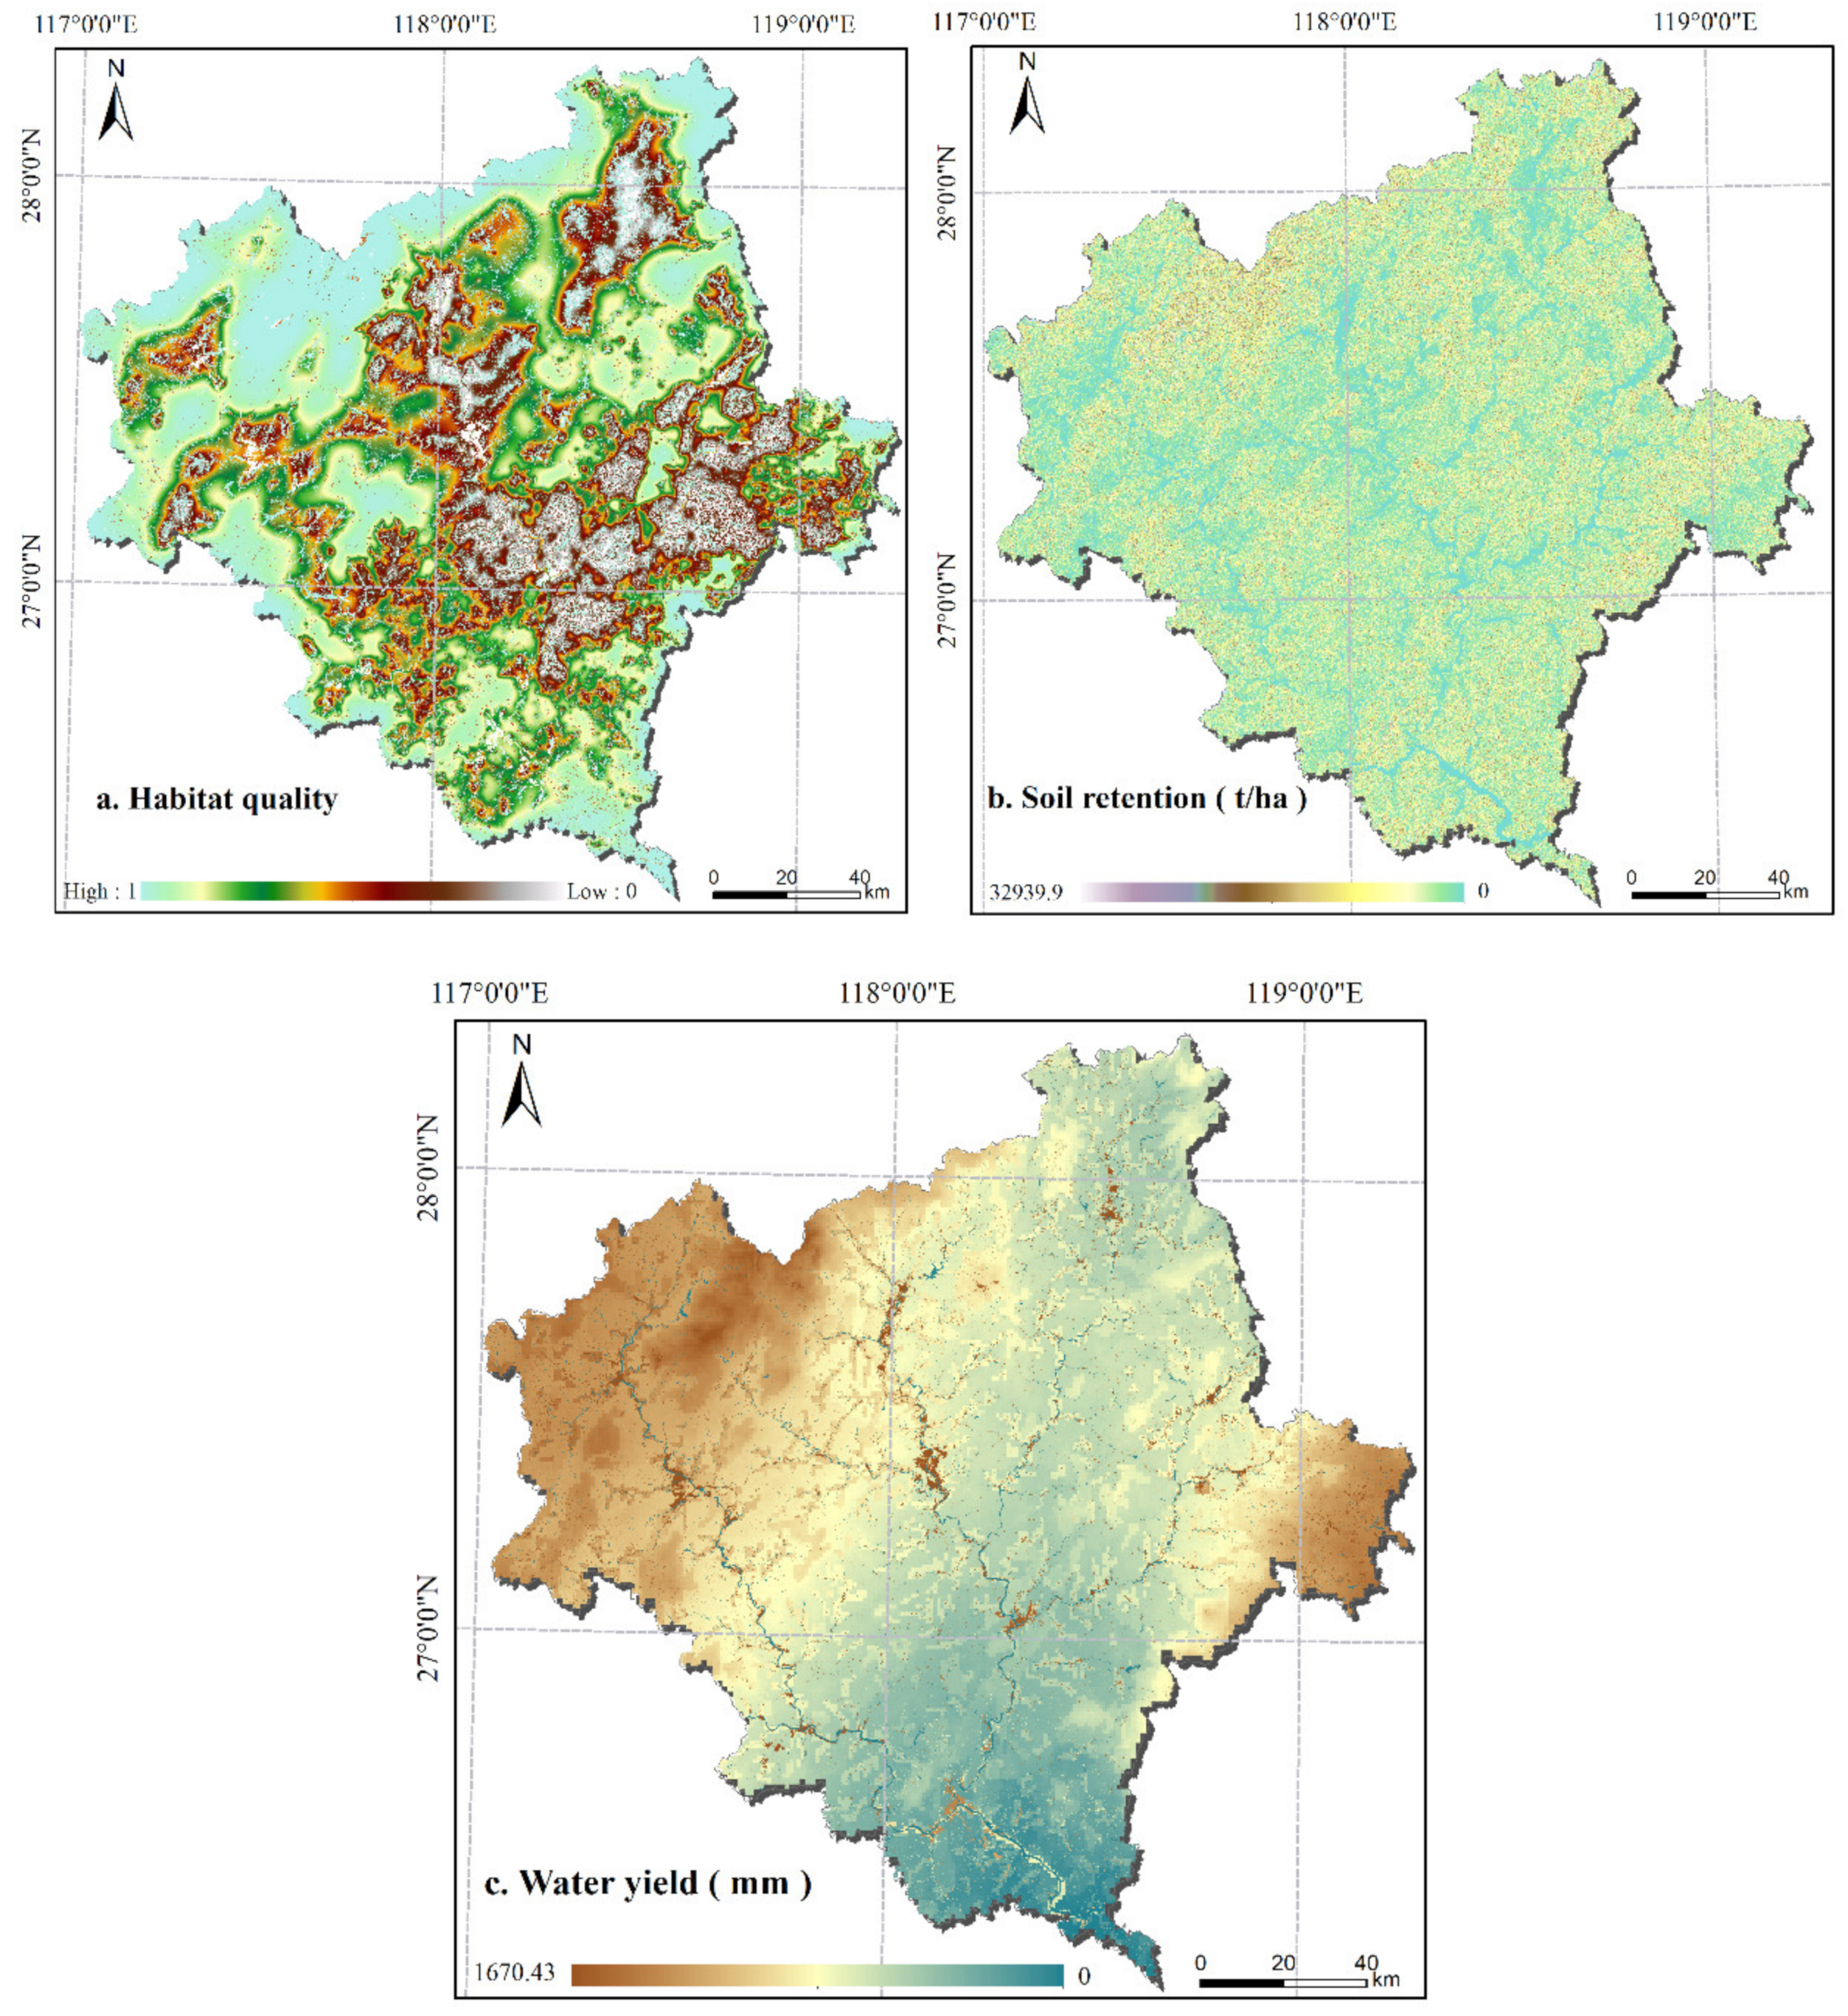
This study used the InVEST model to evaluate ecosystem service functions in Nanping, such as habitat quality, soil retention and water production, following which the ecosystem service functions of the different ecological sources were analyzed. The results showed a high spatial variation in habitat quality (Figure 4a), with low levels in the central and southeastern regions of Nanping, such as Jianou City and Jianyang District, and relatively higher levels in the northern mountainous area. The low levels of habitat quality were mainly due to the widespread distribution of built-up areas in the center of the study area and to serious soil and water loss resulting from the development of tea gardens in the southeast of the study area, indicating a declining habitat quality. The distributions of high-quality and medium-quality habitat were similar as they were both far from urban construction areas. The habitat qualities of the six ecological sources were generally high, of which the proportion of high-quality habitat exceeded 70% (Table 4) and the proportion of low-quality habitat did not exceed 1%. The proportion of the region with high-quality habitat in the largest ecological source area (9) was 93.62%, whereas that of the ecological source area 13 in the western region of the study area was 85.93%. Although the surface area of ecological source area 13 was not large, it was characterized by a low urban development intensity and improved ability for ecological restoration, with a proportion of high-quality area less than only that of the ecological source area 9 in the north. The proportion of area with medium-quality habitat in ecological source area 10 was higher than those in other ecological source areas.
There was a scattered spatial distribution of the soil retention ecological service function (Figure 4b). The average soil retention of the six highly-connected ecological source areas in Nanping was more than 2700 t ha−1, of which the average soil retentions of the ecological source areas 1 and 9 in the northeastern part of the study area and Wuyishan were both more than 3500 t ha−1. This result was mainly due to the functional orientation of the national nature reserves and scenic spots, which have high coverage of forest landscape that protect the soil resources. In general, the regional variations in soil retention in the ecological source areas were consistent with the regional variation in patch connectivity in ecological source areas, indicating that patch connectivity and soil retention of the northern ecological source areas (1 and 9) were generally higher than those in the southern ecological source area (23), and that the western ecological source areas (13 and 16) had the lowest connectivity and soil retention (Table 3, Table 4). Specifically, ecological source area 9, with the highest patch importance (dPC = 32.31) and situated in Wuyi Mountain, had an average soil retention of 4493.95 t ha−1, whereas that of ecological source area 23 in the southeastern part of the study area was 3170.48 t ha−1, which was slightly higher than that of ecological source area 10 in the north. However, the average soil retention of ecological source areas 13 and 16 located in the western part of the study area were low, with values of 2849.15 t ha−1 and 2721.16 t ha−1, respectively. These results may be related to the relatively small proportion of ecological source area.
Water production ecological service was estimated based mainly on landscape types and the physical and chemical properties of the soil, including soil contents of sand, clay and organic carbon. The results showed an uneven spatial distribution of water production, with that in the northwest region generally higher than in the south region (Figure 4c). The results in Table 4 showed that average and total water production in the grid cells of the six ecological sources ranged from 1000 to 1400 mm, from 1 × 10⁹ to 3 × 109 mm, respectively. Water production of ecological source areas 9 and 13 in the north and west, respectively, were higher than those of other ecological source areas, whereas the average water production in ecological source area 23 in the southeast region was relatively low. More specifically, total water production in ecological source areas 9 and 10 were significantly higher, reaching 3 × 109 mm and 2.5 × 109 mm, respectively, possibly related to less anthropogenic disturbance and a relatively stable ecosystem persisting in the northern region for many years, which resulted in a relatively large ecological base flow under natural conditions. Average and total water production of ecological source area 13 were 1348.18 mm and 1.06 × 109 mm, respectively, relatively lower than that of other ecological source areas, and possibly due to this area being relatively smaller.
3.4. Ecological Network Structure Analysis Based on Ecological Landscape Patterns and Ecosystem Service Functions
The MCR method is to identify the potential lowest-cost corridor of ecological flow between patches by comprehensively considering the source, resistance and distance factors. The combined analysis using MSPA and landscape connectivity evaluation determined six ecological source areas to constitute the core landscape of the study area. Different resistance values and weights as an indication of resistance to the migration of species were assigned based on multiple factors, such as land-use type, elevation, habitat quality, water production and soil retention (Table 5). The weight of resistance of each evaluation factor was estimated by superposition analysis to construct the consumption surface model of the study area. The cumulative cost surface of each ecological source area was then generated by the consumption surface and ecological source. Finally, the cost path module was used to extract the minimum cost path of the ecological source area, and the gravity model was used to construct the interaction matrix of the six ecological source areas (Table 6) to quantitatively evaluate the interaction intensity between them. The matrix results were used to extract the ecological corridors, with those with an interaction of > 1.6 classified as important corridors whereas the remainder was classified as general corridors. Using this method, the potential ecological corridors in the study area were obtained, and were further analyzed for their spatial distribution.
The interaction matrix of the ecological source area calculated by the gravity model was used as a measure of the intensity of the relationship between the different ecological sources, following which the importance of the corridor between the ecological source areas to the regional ecological environment was evaluated. The results showed that the interaction intensity between ecological source areas 1 and 10 was the strongest, followed by those between ecological source areas 16 and 9 and between ecological source areas 10 and 13, indicating a small resistance of the northern ecological source areas with a higher possibility of species migration. The interaction intensity between ecological source areas 1 and 13 was the smallest, mainly due to the long distance between them and the challenges posed to migration. Ecological source area 23 interacted strongly only with ecological source areas 10 and 16. Therefore, this study identified the need for placement of a bridge area between the north and south areas to promote the exchange of material and energy.
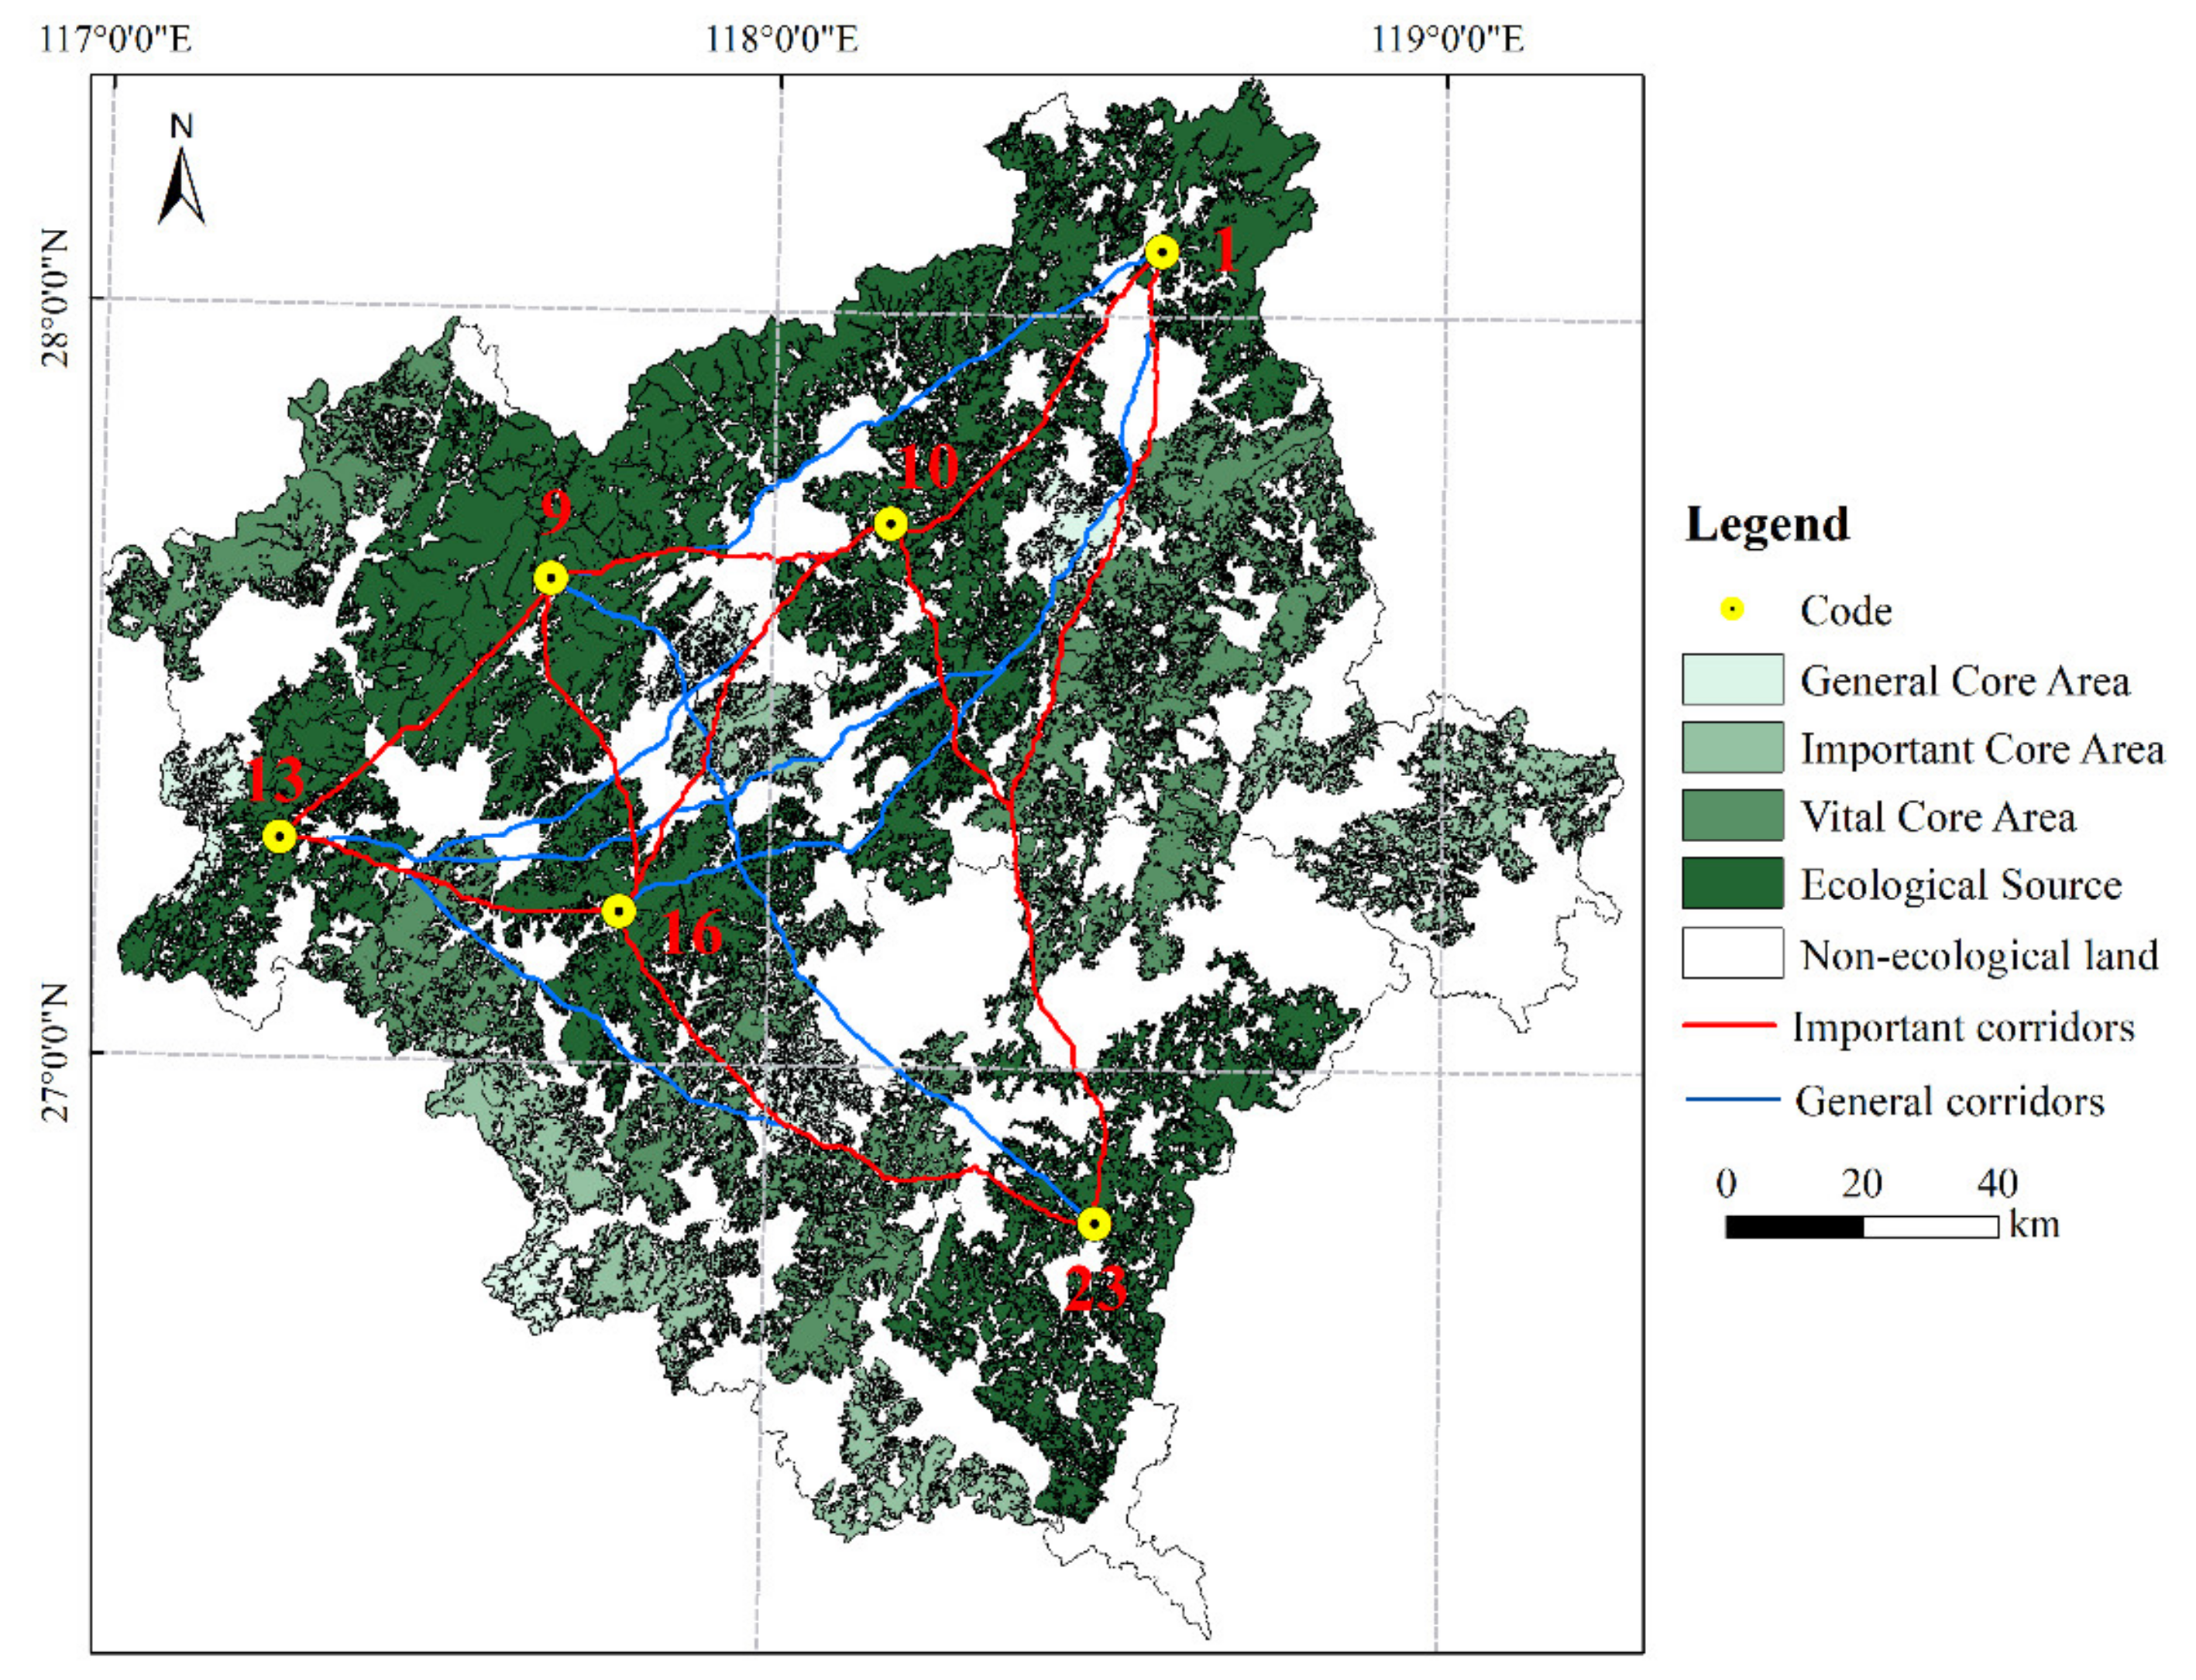
From the constructed ecological network shown in Figure 5, it can be seen that 15 potential ecological corridors were evident between the different ecological sources, including nine important ecological corridors and six general ecological corridors, with a 751.67 km total length and 1460.31 km total length. The ecological corridors showed a generally uneven spatial distribution, mainly concentrated in the northern part of the study area and extending to the southern part. The path between the north and south areas comprised natural woodland is characterized by lower landscape resistance and higher habitat quality. The density of ecological corridors in the west was higher than that in the east, with corridors in the west showing a diffuse distribution and with ecological source area 16 as the center.
There were generally relatively short distances between the ecological sources in the north, posing relatively less challenges to migration. Therefore, the distances between the corridors connecting different ecological sources were relatively short. For example, the lengths of the three corridors connected with ecological source area 9 were 55.23 km, 56.53 km and 57.07 km, respectively. The lengths of the three corridors connecting with ecological source area 23 in the south were relatively long, thereby posing a greater resistance to species migration between the north and south regions. Among these, the important ecological corridors formed a triangle network, and the general ecological corridors were concentrated in the northwest. Since only few corridors connected the east and the north, the ecological network was shown to require improvement.
4. Discussion
With the rapid expansion of cities and the deterioration of the ecological environment, species habitats are gradually being affected by human activities, and species diversity is also continuously destroyed. Therefore, how to build ecological networks and formulate comprehensive ecological protection plans to protect species habitats has become an urgent problem to solve. An ecological source is the basis of an ecological network, which can provide more ecosystem services such as product supply, ecological regulation and leisure, and is the main source of animal and plant habitats [37,38]. The corridor structure is also a key component in an ecological network and an important channel for animal migration, which has a significant impact on the landscape ecological processes [39]. In a previous study, ecological networks were mostly constructed based on the spatial structure of the ecological sources, but the ecosystem service functions of the ecological sources were less considered [40,41]. In this study, ecological service functions, including habitat quality, soil retention functions and water production services, were incorporated into the construction of an ecological network, and then a potential ecological corridor was built in Nanping through the integration of the landscape structure and ecological functions. The construction of the network not only embodies the landscape structure, but also integrates the versatility of the ecological region, which can provide a new idea for the construction of an ecological network.
The ecological network of Nanping City have nine important ecological corridors and six general ecological corridors. The important ecological corridors give priority to the paths of Wuyi Mountain and the surrounding natural forest areas, which have a better landscape structure and ecosystem service functions. These areas were less affected by human disturbance and are rich in forest resources, so they have diverse ecosystems [42,43]. The general ecological corridors are concentrated in the western and northern parts of the region. The main crossing areas are the vital core areas and important core areas far from the city; the patches in these areas are relatively large, and are adjacent to large ecological sources, so the crossing difficulty was relatively small. Metzger et al. [44] also pointed out that, as for the forest resources, larger habitat patches usually contain abundant ecological resources, thus providing a better environment for protecting species.
Land-use changes, unreasonable tourism planning and development, and improper ecological protection in Nanping City have adverse effects on ecosystem services such as soil conservation, which thus interfere with the ecological corridors [45,46]. Therefore, it is necessary to strengthen the land-use management with a future plan, to avoid fragmentation of the regional landscape and degradation of ecosystem functions, which are mainly due to overdevelopment. Furthermore, the government needs to ease the contradiction between agricultural land and ecological land, reduce the negative effects of tourism and improve the ecological restoration of the northern region, which has a rich biodiversity [47]. In addition, more attention should be paid to the ecological construction of the central urban area. More stringent ecological protection policies, such as less disorderly expansion of land resources, construction control and less interference from human activities on the ecological corridor, should be enforced so as to balance urban economic development and ecological environment protection [48].
The methodology used in this study can be applied in complex ecological environments to provide references for ecological landscape restoration and regional ecological corridor management. However, there were also some shortcomings in this study. Firstly, the sensitivity of the specific species to the width of the ecological corridor was not considered in the construction of the ecological network. The width of the ecological corridor should also be one of the factors to be considered in the future for large species. Secondly, the impact of changes in the regional landscape pattern and ecosystem service functions on ecological corridors in time had not been analyzed. The ecological landscape and ecosystem service functions of Nanping City had changed significantly over time; a study on their changing trends can provide significant references for ecological restoration or ecological corridor construction. Thirdly, although the ecosystem service functions were included in the selection of ecological resistance factors, there were still some socio-economic factors that have not been added. Natural and social factors should be fully considered in the future ecological network research. These shortcomings will be further improved in future research.
5. Conclusions
The construction of ecological networks in Nanping City has become an important factor restricting species diversity and socio-economic development [46,49]. This study applied MSPA and landscape connectivity indicators to identify the ecological source of Nanping, and then used the InVEST model to evaluate the ecosystem service functions of the ecological source, such as habitat quality, soil conservation and water production. Finally, a potential ecological corridor was built according to natural ecological elements and ecosystem services functions. Based on the analysis of the spatial distribution of the ecological network, some suggestions on the management optimization of a regional ecological network were put forward, which will provide reference for the ecological construction of Nanping City. The results showed that the overall connectivity of the ecological landscape was not high, and the northern ecological sources generally had a higher level of landscape connectivity than the southern ecological sources. In addition, the ecosystem service function level of the ecological source area was consistent with the level of landscape connectivity. The ecological source area with better landscape connectivity had a higher proportion of habitat quality, high soil retention and high water production.
On the whole, the internal ecological network is unevenly distributed. The density of the ecological corridors in the northern and western regions is relatively high, and the corridor distance is relatively short. The ecological corridors connecting the northern and southern regions are long and difficult to cross. There are few ecological corridors crossing the tea gardens in the southeast. Therefore, priority should be given to improving the connecting corridors between the north and south of the region. Engineering measures, such as storage, drainage and irrigation, could be carried out to improve the ecosystem service level of the important core areas, such as the tea garden area in the southeast. In addition, it is necessary to improve the ecological environment around the construction area in the central area, as well as to increase the number of stepping stones and also reduce the distance between these stepping stones between the important core areas and the ecological source. Then the effective connection of the north–south migration path can be built by reducing the difficulty for species crossing [50]. Moreover, the northern ecological source areas, especially the Wuyi Mountains, should be protected as the distribution of the ecological corridors involves the connection between nature reserves; the bridging role of the Wuyi Mountains also should be fully utilized to improve the level of landscape connectivity and to reduce the fragmentation of the landscape. A comprehensive management system for biodiversity protection in Nanping City would be an effective measure to protect species and ensure their migration. These results can provide certain theoretical support for Nanping City to improve the landscape pattern of different ecological sources and improve the level of ecosystem services.
Author Contributions
Conceptualization, L.X. (Ling Xiao), L.C. and Q.J.; methodology, L.X. (Ling Xiao), M.W. and L.X. (Lidan Xu); software, L.X. (Ling Xiao), L.C. and Q.J.; formal analysis, L.X. (Ling Xiao), L.C. and Q.J.; resources, L.X. (Ling Xiao), L.C., Q.J. and M.W.; data curation, L.X. (Ling Xiao), M.W. and Q.J.; writing—original draft preparation, M.W., L.X. (Lidan Xu) and Q.J.; writing—review and editing, L.X. (Ling Xiao), Q.J. and H.Y.; visualization, L.X. (Ling Xiao) and L.C.; supervision, Q.J.; funding acquisition, Q.J. and H.Y. All authors have read and agreed to the published version of the manuscript.
Funding
This research was supported by the Key Project of National Key Research and Development Plan (No. 2017YFC050400103), the National Social Science Fund Project (No. 20BGL152), the Special Social Science Projects of Other Central Departments (No. 2019-GMD-026), the National Science and Technology Projects (No. 2017ZX07101004 and No. 2017ZX07108002), the Major Research Plan of National Natural Science Foundation of China (No. 41901234 and No.51909052), the Fundamental Research Funds for the Central Universities (No.2015ZCQSB03), and Young Scientists Fund of the Hebei College Science and Technology Research Program (No. QN2018252).
Acknowledgments
Data provision and support from projects of the National Natural Science Foundation of China (No.71225005) and the Exploratory Forefront Project for the Strategic Science Plan in IGSNRR, CAS are also appreciated. In addition, we gratefully acknowledge the Beijing Municipal Education Commission for their financial support through Innovative Transdisciplinary Program “Ecological Restoration Engineering”.
Conflicts of Interest
The authors declare no conflict of interest.
References
- Güneralp, B.; Seto, K.C. Futures of global urban expansion: Uncertainties and implications for biodiversity conservation. Environ. Res. Lett. 2013, 8, 14025. [Google Scholar] [CrossRef]
- Henareh Khalyani, A.; Mayer, A.L.; Webster, C.R.; Falkowski, M.J. Ecological indicators for protection impact assessment at two scales in the Bozin and Marakhil protected area, Iran. Ecol. Indic. 2013, 25, 99–107. [Google Scholar] [CrossRef]
- Estoque, R.C.; Murayama, Y. A worldwide country-based assessment of social-ecological status (c. 2010) using the social-ecological status index. Ecol. Indic. 2017, 72, 605–614. [Google Scholar] [CrossRef]
- Saura, S.; Estreguil, C.; Mouton, C.; Rodríguez-Freire, M. Network analysis to assess landscape connectivity trends: Application to European forests (1990–2000). Ecol. Indic. 2011, 11, 407–416. [Google Scholar] [CrossRef]
- Kamal, S.; Huang, H.P.; Myint, S.W. The Influence of Urbanization on the Climate of the Las Vegas Metropolitan Area: A Numerical Study. J. Appl. Meteorol. Climatol. 2015, 54, 2157–2177. [Google Scholar] [CrossRef]
- Watson, V. Locating planning in the New Urban Agenda of the urban sustainable development goal. Plan. Theory. 2016, 15, 435–448. [Google Scholar] [CrossRef]
- Halisçelik, E.; Soytas, M.A. Sustainable development from millennium 2015 to Sustainable Development Goals 2030. Sustain. Dev. 2019, 27. [Google Scholar] [CrossRef]
- Cabeza, M.; Moilanen, A. Design of reserve networks and the persistence of biodiversity. Trends Ecol. Evol. 2001, 16, 242–248. [Google Scholar] [CrossRef]
- Hoppert, M.; Bahn, B.; Bergmeier, E.; Deutsch, M.; Epperlein, K.; Hallmann, C.; Müller, A.; Platz, T.V.; Reeh, T.; Stück, H.; et al. The Saale-Unstrut cultural landscape corridor. Environ. Earth Sci. 2018, 77. [Google Scholar] [CrossRef]
- Grashof-Bokdam, C. Forest species in an agricultural landscape in the Netherlands: Effects of habitat fragmentation. J. Veg. Sci. 1997, 8, 21–28. [Google Scholar] [CrossRef]
- Jiang, P.H.; Cheng, L.; Li, M.C.; Zhao, R.F.; Huang, Q.H. Analysis of landscape fragmentation processes and driving forces in wetlands in arid areas: A case study of the middle reaches of the Heihe River, China. Ecol. Indic. 2014, 46, 240–252. [Google Scholar] [CrossRef]
- Mõisja, K.; Uuemaa, E.; Oja, T. Integrating small-scale landscape elements into land use/cover: The impact on landscape metrics’ values. Ecol. Indic. 2016, 67, 714–722. [Google Scholar] [CrossRef]
- Parent, J.R.; Volin, J.C. Validating Landsat-based landscape metrics with fine-grained land cover data. Ecol. Indic. 2016, 60, 668–677. [Google Scholar] [CrossRef]
- Dos Santos, A.R.; Araújo, E.F.; Barros, Q.S.; Fernandes, M.M.; de Moura Fernandes, M.R.; Moreira, T.R.; de AlmeidaTelles, L.A. Fuzzy concept applied in determining potential forest fragments for deployment of a network of ecological corridors in the Brazilian Atlantic Forest. Ecol. Indic. 2020, 115, 106423. [Google Scholar] [CrossRef]
- Serret, H.; Raymond, R.; Foltête, J.-C.; Clergeau, P.; Simon, L.; Machon, N. Potential contributions of green spaces at business sites to the ecological network in an urban agglomeration: The case of the Ile-de-France region, France. Landsc. Urban Plan. 2014, 131, 27–35. [Google Scholar] [CrossRef]
- Dondina, O.; Kataoka, L.; Orioli, V.; Bani, L. How to manage hedgerows as effective ecological corridors for mammals: A two-species approach. Agric. Ecosyst. Environ. 2016, 231, 283–290. [Google Scholar] [CrossRef]
- Samways, M.J.; Pryke, J.S. Large-scale ecological networks do work in an ecologically complex biodiversity hotspot. Ambio 2015, 45, 161–172. [Google Scholar] [CrossRef] [Green Version]
- Hofman, M.P.G.; Hayward, M.W.; Kelly, M.J.; Balkenhol, N. Enhancing conservation network design with graph-theory and a measure of protected area effectiveness: Refining wildlife corridors in Belize, Central America. Landsc. Urban Plan. 2018, 178, 51–59. [Google Scholar] [CrossRef]
- Zhang, Z.Z.; Meerow, S.; Newell, J.P.; Lindquist, M. Enhancing Landscape Connectivity through Multi-functional Green Infrastructure Corridor Modeling and Design. Urban For. Urban Green. 2018. [Google Scholar] [CrossRef]
- Wilson, E.O.; Willis, E.O. Applied biogeography. In Ecology and Evolution of Communities; Harvard University Press: Cambridge, MA, USA, 1975; pp. 522–534. [Google Scholar]
- Dutta, T.; Sharma, S.; McRae, B.H.; Roy, P.S.; DeFries, R. Connecting the dots: Mapping habitat connectivity for tigers in central India. Reg. Envir. Chang. 2015, 16, 53–67. [Google Scholar] [CrossRef]
- Liu, Y.X.; Li, T.; Zhao, W.W.; Wang, S.; Fu, B.J. Landscape functional zoning at a county level based on ecosystem services bundle: Methods comparison and management indication. J. Environ. Manag. 2019, 249, 109315. [Google Scholar] [CrossRef] [PubMed]
- Wen, X.; Théau, J. Assessment of ecosystem services in restoration programs in China: A systematic review. Ambio 2019. [Google Scholar] [CrossRef] [PubMed]
- Xu, K.P.; Wang, J.N.; Wang, J.J.; Wang, X.H.; Chi, Y.Y.; Zhang, X. Environmental function zoning for spatially differentiated environmental policies in China. J. Environ. Manag. 2020, 255, 109485. [Google Scholar] [CrossRef] [PubMed]
- Ye, H.; Yang, Z.P.; Xu, X.L. Ecological Corridors Analysis Based on MSPA and MCR Model—A Case Study of the Tomur World Natural Heritage Region. Sustainability 2020, 12, 959. [Google Scholar] [CrossRef] [Green Version]
- Wang, M.L.; Shao, Y.Q.; Jiang, Q.O.; Xiao, L.; Yan, H.M.; Gao, X.W.; Wang, L.J.; Liu, P.B. Impacts of Climate Change and Human Activity on the Runoff Changes in the Guishui River Basin. Land 2020, 9, 291. [Google Scholar] [CrossRef]
- Soille, P.; Vogt, P. Morphological segmentation of binary patterns. Pattern Recognit. Lett. 2009, 30, 456–459. [Google Scholar] [CrossRef]
- Taylor, P.D.; Fahrig, L.; Henein, K.; Merriam, G. Connectivity Is a Vital Element of Landscape Structure. Oikos 1993, 68, 571. [Google Scholar] [CrossRef] [Green Version]
- Jordán, F.; Báldi, A.; Orci, K.-M.; Rácz, I.; Varga, Z. Characterizing the importance of habitat patches and corridors in maintaining the landscape connectivity of a Pholidoptera transsylvanica (Orthoptera) metapopulation. Landsc. Ecol. 2003, 18, 83–92. [Google Scholar] [CrossRef]
- Pascual-Hortal, L.; Saura, S. Comparison and development of new graph-based landscape connectivity indices: Towards the priorization of habitat patches and corridors for conservation. Landsc. Ecol. 2006, 21, 959–967. [Google Scholar] [CrossRef]
- Saura, S.; Pascual-Hortal, L. A new habitat availability index to integrate connectivity in landscape conservation planning: Comparison with existing indices and application to a case study. Landsc. Urban Plan. 2007, 83, 91–103. [Google Scholar] [CrossRef]
- Bhagabati, N.K.; Ricketts, T.; Sulistyawan, T.B.S.; Conte, M.; Ennaanay, D.; Hadian, O.; McKenzie, E.; Olwero, N.; Rosenthal, A.; Tallis, H.; et al. Ecosystem services reinforce Sumatran tiger conservation in land use plans. Biol. Conserv. 2014, 169, 147–156. [Google Scholar] [CrossRef]
- Peng, J.; Pan, Y.J.; Liu, Y.X.; Zhao, H.J.; Wang, Y.L. Linking ecological degradation risk to identify ecological security patterns in a rapidly urbanizing landscape. Habitat Int. 2018, 71, 110–124. [Google Scholar] [CrossRef]
- Marquès, M.; Bangash, R.F.; Kumar, V.; Sharp, R.; Schuhmacher, M. The impact of climate change on water provision under a low flow regime: A case study of the ecosystems services in the Francoli river basin. J. Hazard. Mater. 2013, 263, 224–232. [Google Scholar] [CrossRef] [PubMed]
- Sharps, K.; Masante, D.; Thomas, A.; Jackson, B.; Redhead, J.; May, L.; Havard, P.; Cosby, B.; Emmett, B.; Jones, L. Comparing strengths and weaknesses of three ecosystem services modelling tools in a diverse UK river catchment. Sci. Total. Environ. 2017, 584–585, 118–130. [Google Scholar] [CrossRef] [Green Version]
- Knaapen, J.P.; Scheffer, M.; Harms, B. Estimating habitat isolation in landscape planning. Landsc. Urban. Plan. 1992, 23, 1–16. [Google Scholar] [CrossRef]
- Clergeau, P.; Burel, F. The role of spatio-temporal patch connectivity at the landscape level: An example in a bird distribution. Landsc. Urban. Plan. 1997, 38, 37–43. [Google Scholar] [CrossRef]
- Crist, M.R.; Wilmer, B.; Aplet, G.H. Assessing the value of roadless areas in a conservation reserve strategy: Biodiversity and landscape connectivity in the northern Rockies. J. Appl. Ecol. 2005, 42, 181–191. [Google Scholar] [CrossRef]
- Wickham, J.D.; Riitters, K.H.; Wade, T.G.; Vogt, P. A national assessment of green infrastructure and change for the conterminous United States using morphological image processing. Landsc. Urban. Plan. 2010, 94, 186–195. [Google Scholar] [CrossRef]
- Newton, A.C.; Hodder, K.; Cantarello, E.; Perrella, L.; Birch, J.C.; Robins, J.; Douglas, S.; Moody, C.; Cordingley, J. Cost-benefit analysis of ecological networks assessed through spatial analysis of ecosystem services. J. Appl. Ecol. 2012, 49, 571–580. [Google Scholar] [CrossRef]
- Niemelä, J.; Saarela, S.R.; Söderman, T.; Kopperoinen, L.; Yli-Pelkonen, V.; Väre, S.; Kotze, D.J. Using the ecosystem services approach for better planning and conservation of urban green spaces: A Finland case study. Biodivers. Conserv. 2010, 19, 3225–3243. [Google Scholar] [CrossRef]
- Quevedo, M.; Bañuelos, M.J.; Obeso, J.R. The decline of Cantabrian capercaillie: How much does habitat configuration matter? Biol. Conserv. 2006, 127, 190–200. [Google Scholar] [CrossRef]
- Berryman, A.A.; Hawkins, B.A.; Hawkins, B.A. The refuge as an integrating concept in ecology and evolution. Oikos 2006, 115, 192–196. [Google Scholar] [CrossRef]
- Metzger, J.P. Conservation issues in the Brazilian Atlantic forest. Biol. Conserv. 2009, 142, 1138–1140. [Google Scholar] [CrossRef]
- Lee, S.W.; Hwang, S.J.; Lee, S.B.; Hwang, H.S.; Sung, H.C. Landscape ecological approach to the relationships of land use patterns in watersheds to water quality characteristics. Landsc. Urban. Plan. 2009, 92, 80–89. [Google Scholar] [CrossRef]
- Gu, F.; Huang, Y.X.; Chen, C.M.; Cheng, D.L.; Guo, J.L. Construction and optimization of ecological network for nature reserves in Fujian Province, China. J. Appl. Ecol. 2017, 28. [Google Scholar] [CrossRef]
- Prieto-Torres, D.A.; Navarro-Sigüenza, A.G.; Santiago-Alarcon, D.; Rojas-Soto, O.R. Response of the endangered tropical dry forests to climate change and the role of Mexican Protected Areas for their conservation. Glob. Change Biol. 2014, 22, 364–379. [Google Scholar] [CrossRef]
- Dong, J.Q.; Peng, J.; Liu, Y.X.; Qiu, S.J.; Han, Y.N. Integrating spatial continuous wavelet transform and kernel density estimation to identify ecological corridors in megacities. Landsc. Urban. Plan. 2020, 199. [Google Scholar] [CrossRef]
- Zheng, W.H.; Cai, F.; Chen, S.L.; Zhu, J.; Qi, H.S.; Zhao, S.H.; Liu, J.H. Ecological Suitability of Island Development Based on Ecosystem Services Value, Biocapacity and Ecological Footprint: A Case Study of Pingtan Island, Fujian, China. Sustainability 2020, 12, 2553. [Google Scholar] [CrossRef] [Green Version]
- Huang, J.; Lin, T.; Ye, H.; Zhang, G.Q.; Lin, J.Y. A Theme-Based and Network Coupled Framework for Quantatitive Indicators Selection in Ecological Construction: A Case Study in Fujian, China. Adv. Mater. Res. 2014, 869, 726–731. [Google Scholar] [CrossRef]
Figure 1.
Location and elevation of study area.

Figure 2.
(a–c) Spatial distribution of landscape pattern based on MSPA.

Figure 3.
Classification of the core area based on the patch importance.

Figure 4.
(a–c) Spatial distribution of ecosystem services in Nanping.

Figure 5.
Spatial distribution of the potential ecological corridor.


Table 1.
Definition of landscape type based on the morphological spatial pattern analysis (MSPA).
| Class | Description |
|---|---|
| Foreground | Area under forest pixels |
| Background | Area under non-forest pixels |
| Core | Foreground pixels surrounded by foreground pixels are greater than the specified edge width distance from the background. The larger habitat patches in the foreground pixels can provide a larger habitat for the species and are the ecological source of the ecological network. |
| Islet | Foreground pixels that do not contain the core. Isolated, broken small patches that are not connected. |
| Perforation | Pixels that form the transition zone between foreground and background for interior regions of the foreground. The pixels forming the inner edge would be classified as perforations. |
| Edge | Pixels that form the transition zone between foreground and background for interior regions of the foreground. The pixels forming the outer edge would be classified as edge. |
| Bridge | Foreground pixels that connect two or more disjunct areas of the core. It represents the corridor connected by patches in the ecological network. |
| Loop | Foreground pixels that connect the same core area. Loop is a shortcut for species migration in the same core area. |
| Branch | Foreground pixels that extend from an area of the core, but do not connect to another area of the core. Only one end of it is connected to the edge, bridge, loop or perforation. |
Table 2.
Statistical areas of each landscape type.
| Landscape Type | Area (hm2) | Accounting for the Forestry Area (%) | Accounting for the Study Area (%) |
|---|---|---|---|
| Core | 1377.24 | 80.85 | 63 |
| Islet | 6.81 | 0.43 | 0.33 |
| Perforation | 83.32 | 5.12 | 3.99 |
| Edge | 89.70 | 10.06 | 7.84 |
| Bridge | 31.98 | 0.81 | 0.63 |
| Loop | 14.69 | 0.7 | 0.55 |
| Branch | 272.62 | 2.04 | 1.59 |
Table 3.
Evaluation of the landscape connectivity index of the core areas.
| Rank | Code | dI | Rank | Code | dI | ||
|---|---|---|---|---|---|---|---|
| dIIC | dPC | dIIC | dPC | ||||
| 1 | 9 | 34.37 | 32.31 | 13 | 19 | 6.17 | 6.63 |
| 2 | 10 | 36.35 | 26.35 | 14 | 18 | 3.70 | 4.38 |
| 3 | 23 | 16.03 | 19.15 | 15 | 12 | 4.19 | 4.32 |
| 4 | 1 | 14.33 | 15.93 | 16 | 8 | 5.48 | 4.01 |
| 5 | 16 | 13.44 | 13.44 | 17 | 24 | 2.69 | 3.67 |
| 6 | 13 | 9.21 | 11.25 | 18 | 22 | 2.94 | 3.42 |
| 7 | 14 | 10.75 | 9.24 | 19 | 7 | 2.31 | 2.50 |
| 8 | 3 | 7.375 | 9.19 | 20 | 17 | 1.34 | 1.78 |
| 9 | 21 | 8.11 | 9.10 | 21 | 2 | 1.52 | 1.70 |
| 10 | 6 | 7.07 | 8.18 | 22 | 11 | 0.96 | 1.50 |
| 11 | 4 | 6.25 | 8.05 | 23 | 20 | 0.96 | 1.44 |
Table 4.
Ecosystem service of each ecological source area.
| Ecological Source | Low Habitat Quality % | Medium Habitat Quality % | High Habitat Quality % | Average Soil Retention (t/ha) | Average Water Production (mm) | Total Water Production (mm) |
|---|---|---|---|---|---|---|
| 1 | 0.08 | 22.40 | 77.51 | 3567.27 | 1199.94 | 1475.94 × 106 |
| 9 | 0.07 | 6.31 | 93.62 | 4493.95 | 1345.21 | 2991.79 × 106 |
| 10 | 0.08 | 26.72 | 73.20 | 3260.56 | 1235.98 | 2544.24 × 106 |
| 13 | 0 | 14.07 | 85.93 | 2849.15 | 1348.18 | 1063.25 × 106 |
| 16 | 0 | 23.10 | 76.90 | 2721.16 | 1248.95 | 1307.09 × 106 |
| 23 | 0.88 | 21.75 | 77.37 | 3170.48 | 1155.51 | 1749.55 × 106 |
Table 5.
Score and weight of the resistance factors in the study area.
| Index Layer | Class | Cost | Weight |
|---|---|---|---|
| Land use | Cultivated land | 50 | 0.2933 |
| Yard | 100 | ||
| Forest | 10 | ||
| Grassland | 200 | ||
| Water | 500 | ||
| Traffic area | 800 | ||
| Built-up area | 1000 | ||
| Unused land | 600 | ||
| Elevation | <300 | 15 | 0.0521 |
| 300–600 | 100 | ||
| 600–900 | 200 | ||
| 900–1200 | 300 | ||
| 1200–2200 | 400 | ||
| Habitat quality | 0–0.36 | 500 | 0.4109 |
| 0.36–0.77 | 10 | ||
| 0.77–1 | 5 | ||
| Soil retention | 0–775.06 | 50 | 0.4109 |
| 775.06–4391.98 | 15 | ||
| 4391.98–32939.89 | 10 | ||
| Water production | 120–764.51 | 5 | 0.0896 |
| 764.51–1269.15 | 10 | ||
| 1269.15–1670.43 | 100 |
Table 6.
Interaction matrix based on the gravity model.
| Patch ID (Code) | 1 | 10 | 9 | 13 | 16 | 23 |
|---|---|---|---|---|---|---|
| 1 | 0 | 7.08 | 1.59 | 0.66 | 1.95 | 1.46 |
| 10 | 0 | 4.89 | 1.30 | 5.85 | 2.35 | |
| 9 | 0 | 2.79 | 5.60 | 1.11 | ||
| 13 | 0 | 5.33 | 0.99 | |||
| 16 | 0 | 3.70 | ||||
| 23 | 0 |
© 2020 by the authors. Licensee MDPI, Basel, Switzerland. This article is an open access article distributed under the terms and conditions of the Creative Commons Attribution (CC BY) license (http://creativecommons.org/licenses/by/4.0/).
Share and Cite
MDPI and ACS Style
Xiao, L.; Cui, L.; Jiang, Q.; Wang, M.; Xu, L.; Yan, H. Spatial Structure of a Potential Ecological Network in Nanping, China, Based on Ecosystem Service Functions. Land 2020, 9, 376. https://doi.org/10.3390/land9100376
AMA Style
Xiao L, Cui L, Jiang Q, Wang M, Xu L, Yan H. Spatial Structure of a Potential Ecological Network in Nanping, China, Based on Ecosystem Service Functions. Land. 2020; 9(10):376. https://doi.org/10.3390/land9100376
Chicago/Turabian StyleXiao, Ling, Li Cui, Qun’ou Jiang, Meilin Wang, Lidan Xu, and Haiming Yan. 2020. "Spatial Structure of a Potential Ecological Network in Nanping, China, Based on Ecosystem Service Functions" Land 9, no. 10: 376. https://doi.org/10.3390/land9100376
Note that from the first issue of 2016, this journal uses article numbers instead of page numbers. See further details here.