Towards a Walkable City: Principal Component Analysis for Defining Sub-Centralities in the Santiago Metropolitan Area


1
Centro Producción del Espacio, Universidad de Las Américas, Santiago 7500972, Chile
2
Escuela de Construcción, Universidad de Las Américas, Santiago 7500972, Chile
*
Author to whom correspondence should be addressed.
Land 2020, 9(10), 362; https://doi.org/10.3390/land9100362
Submission received: 3 September 2020
/
Revised: 23 September 2020
/
Accepted: 26 September 2020
/
Published: 30 September 2020
(This article belongs to the Section Land Planning and Landscape Architecture)
Abstract
:This article presents a methodology for evaluating the potential for an urban area to become a 15-min city based on its existing essential urban functions. To elaborate this methodology, the research focused on the Metropolitan Area of Santiago de Chile, by identifying 28 urban functions and applying principal component analysis to review how these georeferenced variables are grouped into synthetic components that illustrate the walkability of each block concerning access to these functions. Variables are mapped by GIS software to review where concentrations of essential urban functions occur and where there is a need to increase availability of these missing uses. One of the findings of this study in the Metropolitan Area of Santiago is that essential urban functions provided by the state present a relatively equitable distribution in the metropolis. In contrast, essential urban functions provided by the market are highly concentrated in specific clusters, segregating walkability areas in the metropolitan space. The methodology presented here is replicable for other cities, and the findings offer a critical perspective on land management and urban planning for this case study, where normative frameworks must change to implement the 15-min city.
Keywords:
15-min city; Santiago; Chile; urban governance; amenities; principal component analysis; land use1. Introduction
The Mayor of Paris, Anne Hidalgo, has been elected based in part on a government initiative of creating “la ville du quart d’heure” [1]. The idea of the 15-min city is based on reducing travel distances between people’s homes and their daily activities, while increasing the quality of life in their neighbourhoods. It is a spatial approach to the idea of a circular economy. The proposal becomes even more relevant in the context of the new coronavirus pandemic, given that a city that requires fewer journeys between home and work is also a more controlled social environment, where traceability tables are easier to apply and confinements by sector can be more effective. Certainly, the idea of a city with strong sub-centralities is not a new one, and there are different antecedents to this concept that highlight different attempts at implementation in cities such as Barcelona, London, Edinburgh and Portland, among others; while nations such as China have also promoted it as an elemental part of their urban models. This 15-min city idea emerges as a synthesis of a set of urban virtues that seeks to humanise the scale of the city, abandoning the motorised vehicle approach and combating urban sprawl.
A city that is based on everyday sub-centralities has been theorised as being a walkable city. This model of the walkable city reduces the environmental impact of cities and also increases the quality of people’s mental and physical health [2]. A walkable city improves connectivity by promoting intermodality and increasing the fine grain of land use; it is also safer and improves the quality of travel [3]. Reduction of urban segments increases the significance for users of urban space: the finer the detail of uses and characteristics of the built environment, the more livable the city becomes [4]. Thus, a city where functions are within walking distance is also a city that is kinder to the elderly [5] and follows the principles of a safe city that are in line with ideas of feminist urban planning [6], adapting spatiality to debts of urban planning to the majority of urban inhabitants.
Different approaches to urban planning have been developed to measure the chances of implementation and success of a walkable city. An example of these measurements is the Walk Score metric, which assigns a certain weight to amenities, calculates distances from each location to those amenities, computes distance-based scores and normalises results from 0 to 100 in order to compare walkability [7]. This method is useful; however, it relies upon the number of variables integrated as amenities to generate weight over the distances to each location. Ewing et al. have identified a set of urban attributes that allows them to identify whether spatial conditions exist to make walkability a desirable option for users that is based on five qualities: imageability, visual enclosure, human scale, transparency and complexity [8]. As these are qualitative variables for analysis based on field work, it is difficult to apply them uniformly to a metropolitan area as a whole, as they are more appropriate for specific studies or neighbourhoods. In an analysis of the study on supermanzana typologies in Barcelona, evaluation of habitability articulates residential factors in relation to diversity of activities [9], using a direct derivation of the spatial specialisation index [10]. Developing this type of study for cities also makes it possible to identify the spatialisation of social inequality, given that various studies indicate that neighbourhoods that are less likely to be walked through tend to be made up of lower-income households [11,12,13].
From a methodological point of view, contributions from the literature mentioned above have been gathered for this study, with special emphasis on the functional bases of central place hierarchy, based on a study developed by Brian J. L. Berry and William L. Garrison in 1958 [14], where, using a set of specific functions of the neighbourhoods in relation to land use, an urban system could be configured based on hierarchies between sub-centralities, thus identifying which areas of the city best provide for urban life. In this article, we take up this methodology and develop an interpretation for the case of Santiago de Chile, generating a set of cartographies to identify urban sectors best provided with functions for urban life. Santiago de Chile is the capital of one of the nations most affected by the new coronavirus [15] and discussion about implementing the concept of a 15-min city to reduce the risk of future pandemics has begun to attract the interest of experts and decision-makers. In a city as segregated as Santiago de Chile [16,17], the possibility of generating a change in space to increase opportunities and improve distribution of urban quality of life can be key to reversing socio-spatial inequality and making the city more friendly. In the absence of scientific evidence on this possibility for the case of Santiago de Chile, this article seeks, on the one hand, to contribute to this discussion with relevant findings for decision-making and also to propose a useful methodological approach that can be replicated in other cities in Chile and other countries.
This study uses a set of 28 variables of land use functions at the primary (within 600 m away), secondary (within 1200 m away) and tertiary (within 2400 m away) levels. Above these levels, a principal component analysis is elaborated to determine centrality factorials and to evaluate the walkability of the city in relation to its everyday functions upon sub-centralities. The results indicate that the majority of the city is very far from what a 15-min city should look like, based on the definitions used; however, the findings present possible ways to resolve this inequality.
2. Materials and Methods
This study develops a two-fold approach to unpack the feasibility of a 15-min city within the Santiago Metropolitan Area: this involves a principal component analysis (PCA) of 28 urban functions and their proximity to each square of the city, and mapping of the resultant components to identify where those well-served spaces are and how many people would be excluded if Santiago were to become a 15-min city.
Data were obtained from different sources, as summarised in Table 1. The decision to include these 28 indicators is an interpretation of Brian Berry and William Garrison’s approach to central place hierarchy [14]. In their contribution, 15 urban attributes are assessed by a correlation between them to obtain their coefficients, and then three hierarchical orders are elaborated for all functions assessed. There are two changes we introduced to Berry and Garrison’s approach: we changed the correlation by conducting a principal component analysis, and we changed the variables used in the study. The variables suggested by Berry and Garrison are not necessarily applicable to the Chilean context, which has a different cultural background and social organisation. In addition, there was a need to update the concepts of how society works now in comparison to 1958, which is when they developed their approach. To discern variables by level, we used a discrete discussion between the authors to decide which urban functions are needed within a 600-m distance from home (15 min of walking for a person with a trolley, based on our measurements); within 1200-m distance from home (15 min of riding a bike or 30 min of walking slow); and within 2400 m for metropolitan or urban services that are not needed in everyday life, but which are fundamental in specific cases. In our understanding, these 28 variables may be considered essential urban functions for ensuring an urban life based on walkability principles, advancing to the possible scenario of a 15-min city.
The city of Santiago has 34 districts that were assessed. Each district was studied based on the census block data composed of 45,415 spatial tracts. Each level of analysis has a different scope:
- Primary = within 600-m radius from each block.
- Secondary = within 1200-m radius from each block.
- Tertiary = within 2400-m radius from each block.
Thus, a database is elaborated where each block is a case with 28 variables. The variables count the number of functions near the corresponding scope for each level of analysis. Therefore, those blocks with a higher number of functions are better suited to the 15-min city. In order to organise this large database and elaborate a synthetic index, a principal component analysis is applied to each level to reduce the dimensions of the sample and facilitate cartographic representation of the results.
The principal component analysis method is useful for reducing big samples that involve working with multivariate interrelated variables while keeping the variation present in the data set [18]. The transformations aim to create a new set of variables—the principal components—where the new set retains most of the variation of the original set. This method has been employed to assess the characteristics of neighbourhoods in relation to different variables related to inequality [19], providing statistical suitability to the model under study and allowing for further conclusions on how to interpret the resulting data, based on how the original variables are grouped with each other. The dimension reduction in this study was run in SPSS 22, licensed to Universidad de Las Américas. The results of this analysis will be presented in the following section. Furthermore, cartographic representation of the results and all maps presented in this article were developed in ArcGIS 10.5, licensed to Universidad de Las Américas.
3. Results
The principal component analysis was applied separately for the three different levels of analysis in the first instance. This application seeks to verify the robustness of the data for the PCA study: a Kaiser–Meter–Olkin (KMO) test was applied in order to review whether the sample under study was adequate for reduction of variables and for development of communities. The results of the KMO test can be seen in Table 2. For a principal component analysis, the KMO must be greater than 0.5, which is met for all samples in this study, along with Bartlett’s sphericity and a Sig value below 0.05. In summary, statistically, the data meet the basic requirements for a principal component analysis so that the reduction of variables can be elaborated.
The rotation method was done by Varimax with Kaiser standardisation, which resulted in six main components (Table 3). The resulting components have been classified according to the variables that converge as most representative of each communality, resulting in the following set of components:
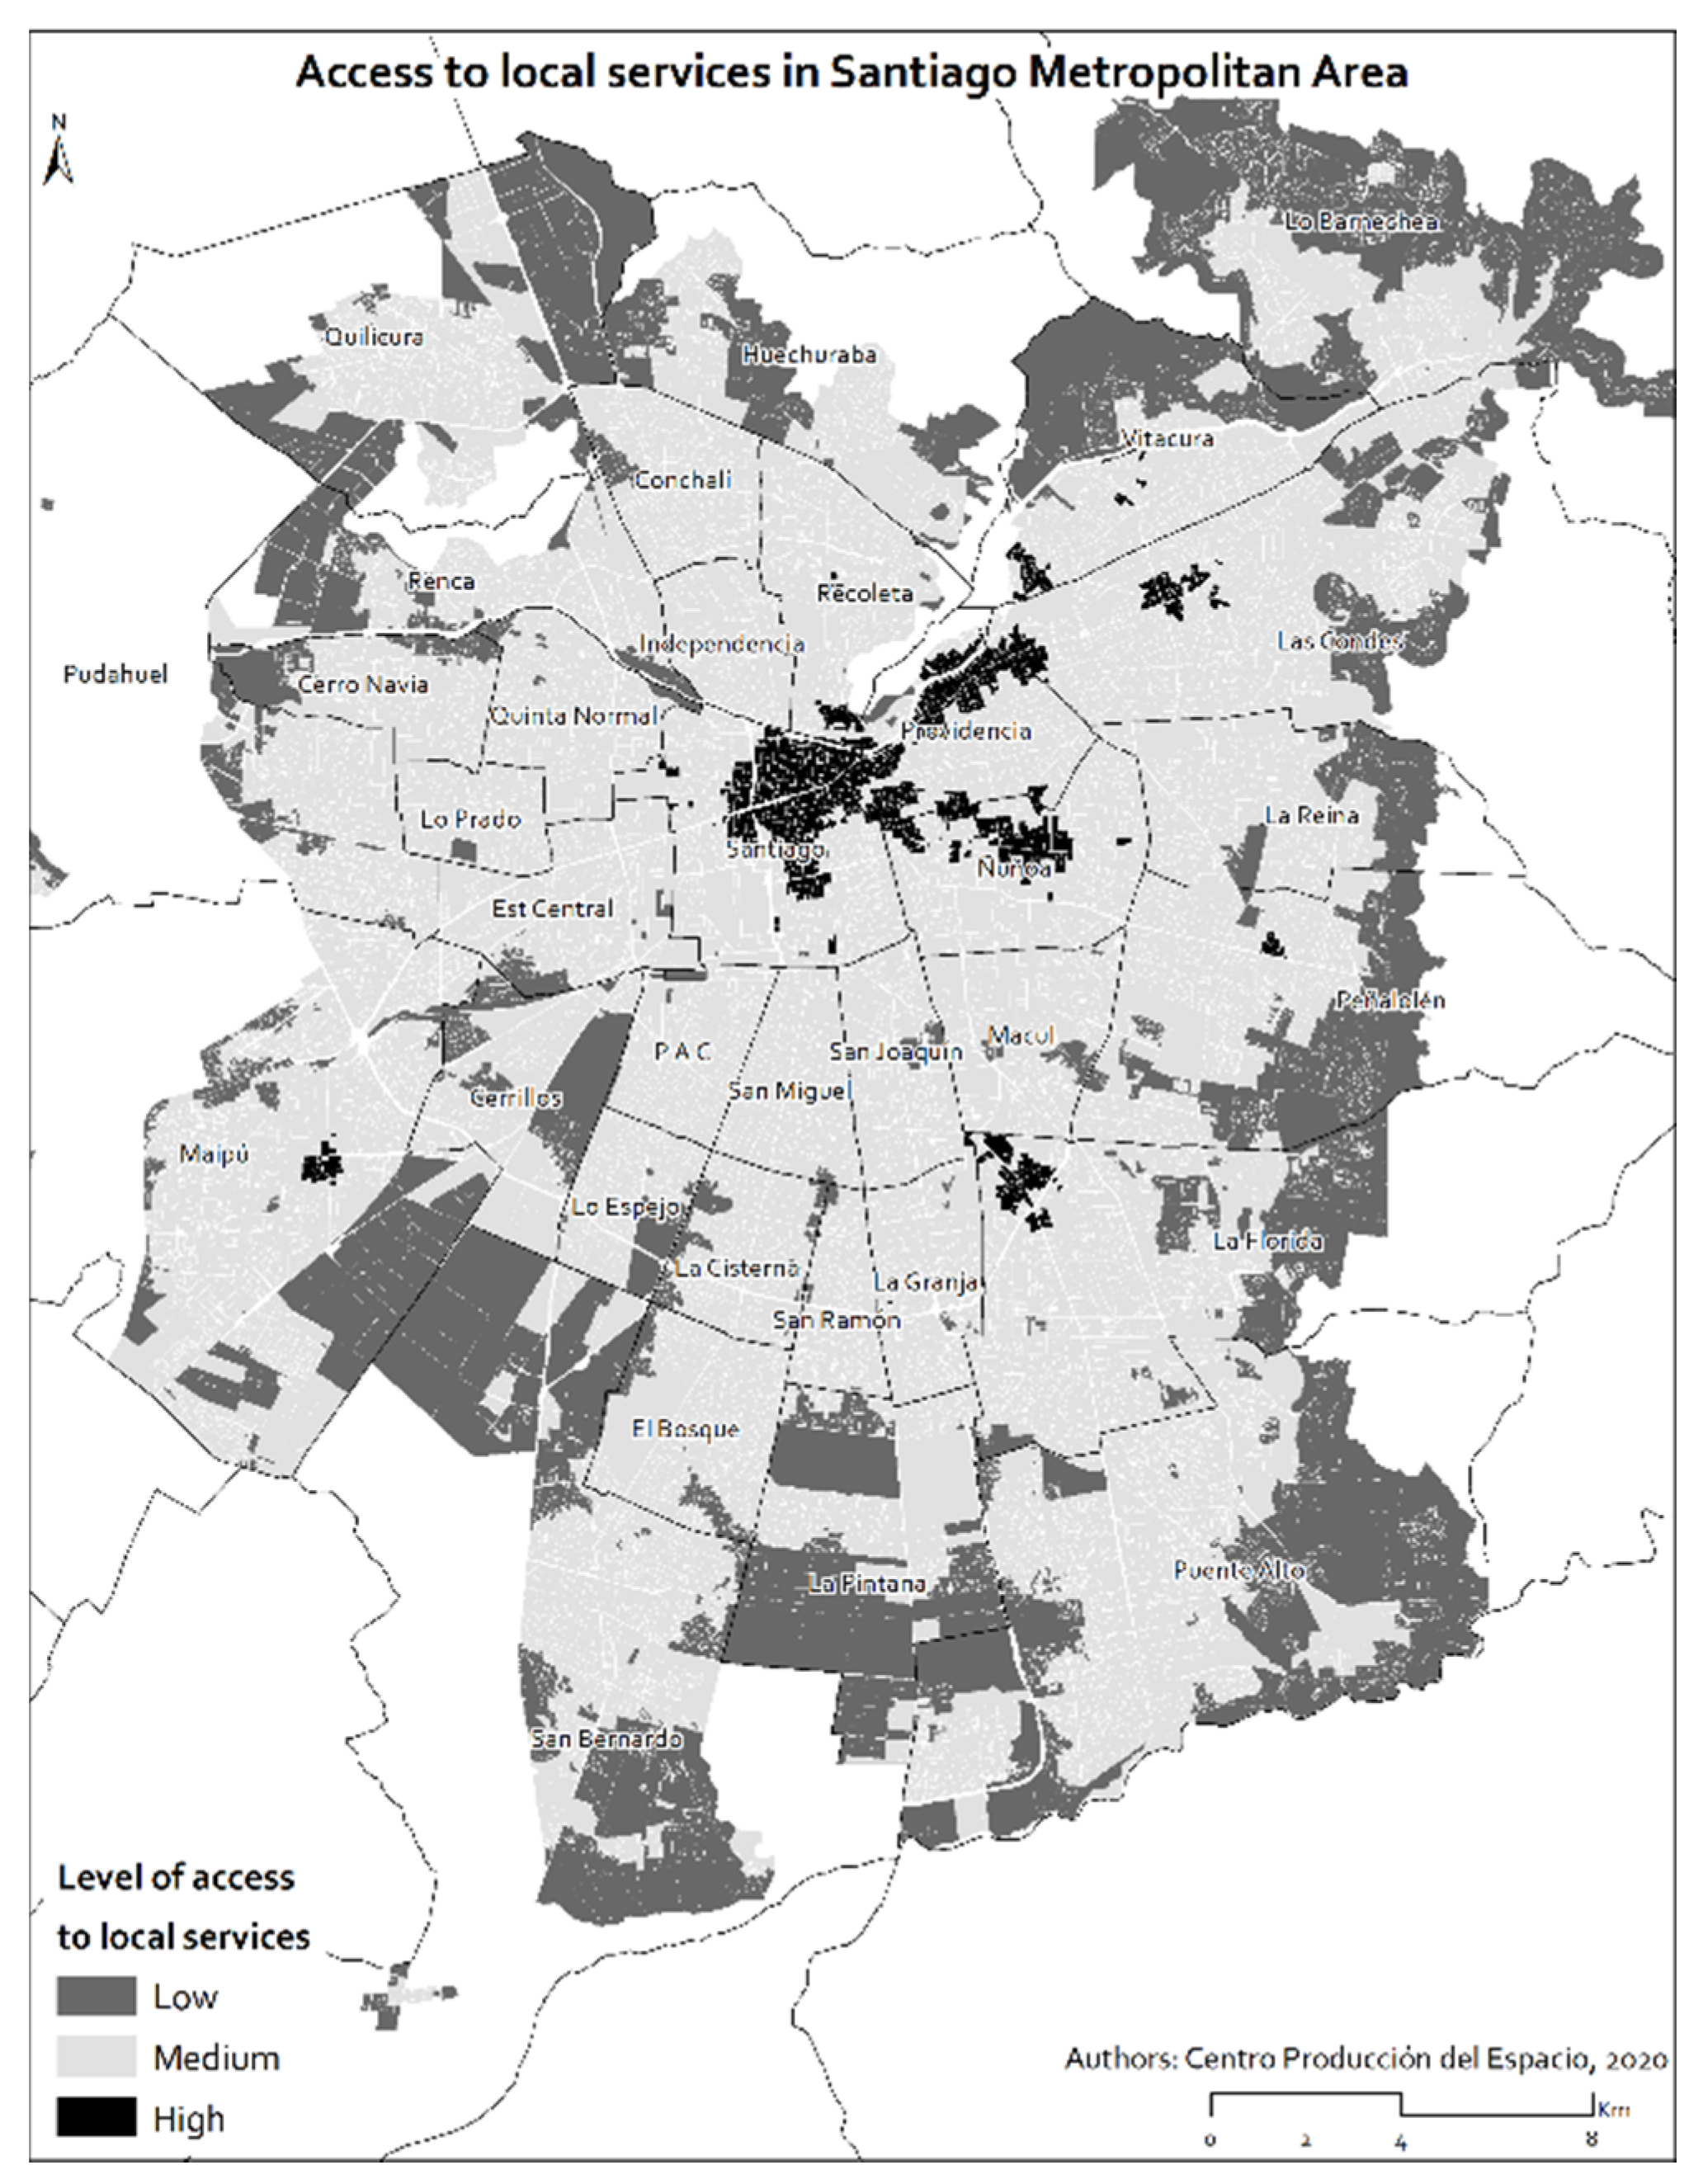
- Local Services: These correspond to rather everyday functions that are essential for life within neighbourhood units, such as pharmacies, government administrative services, cultural spaces, bookstores, book shops, supermarkets and banks.
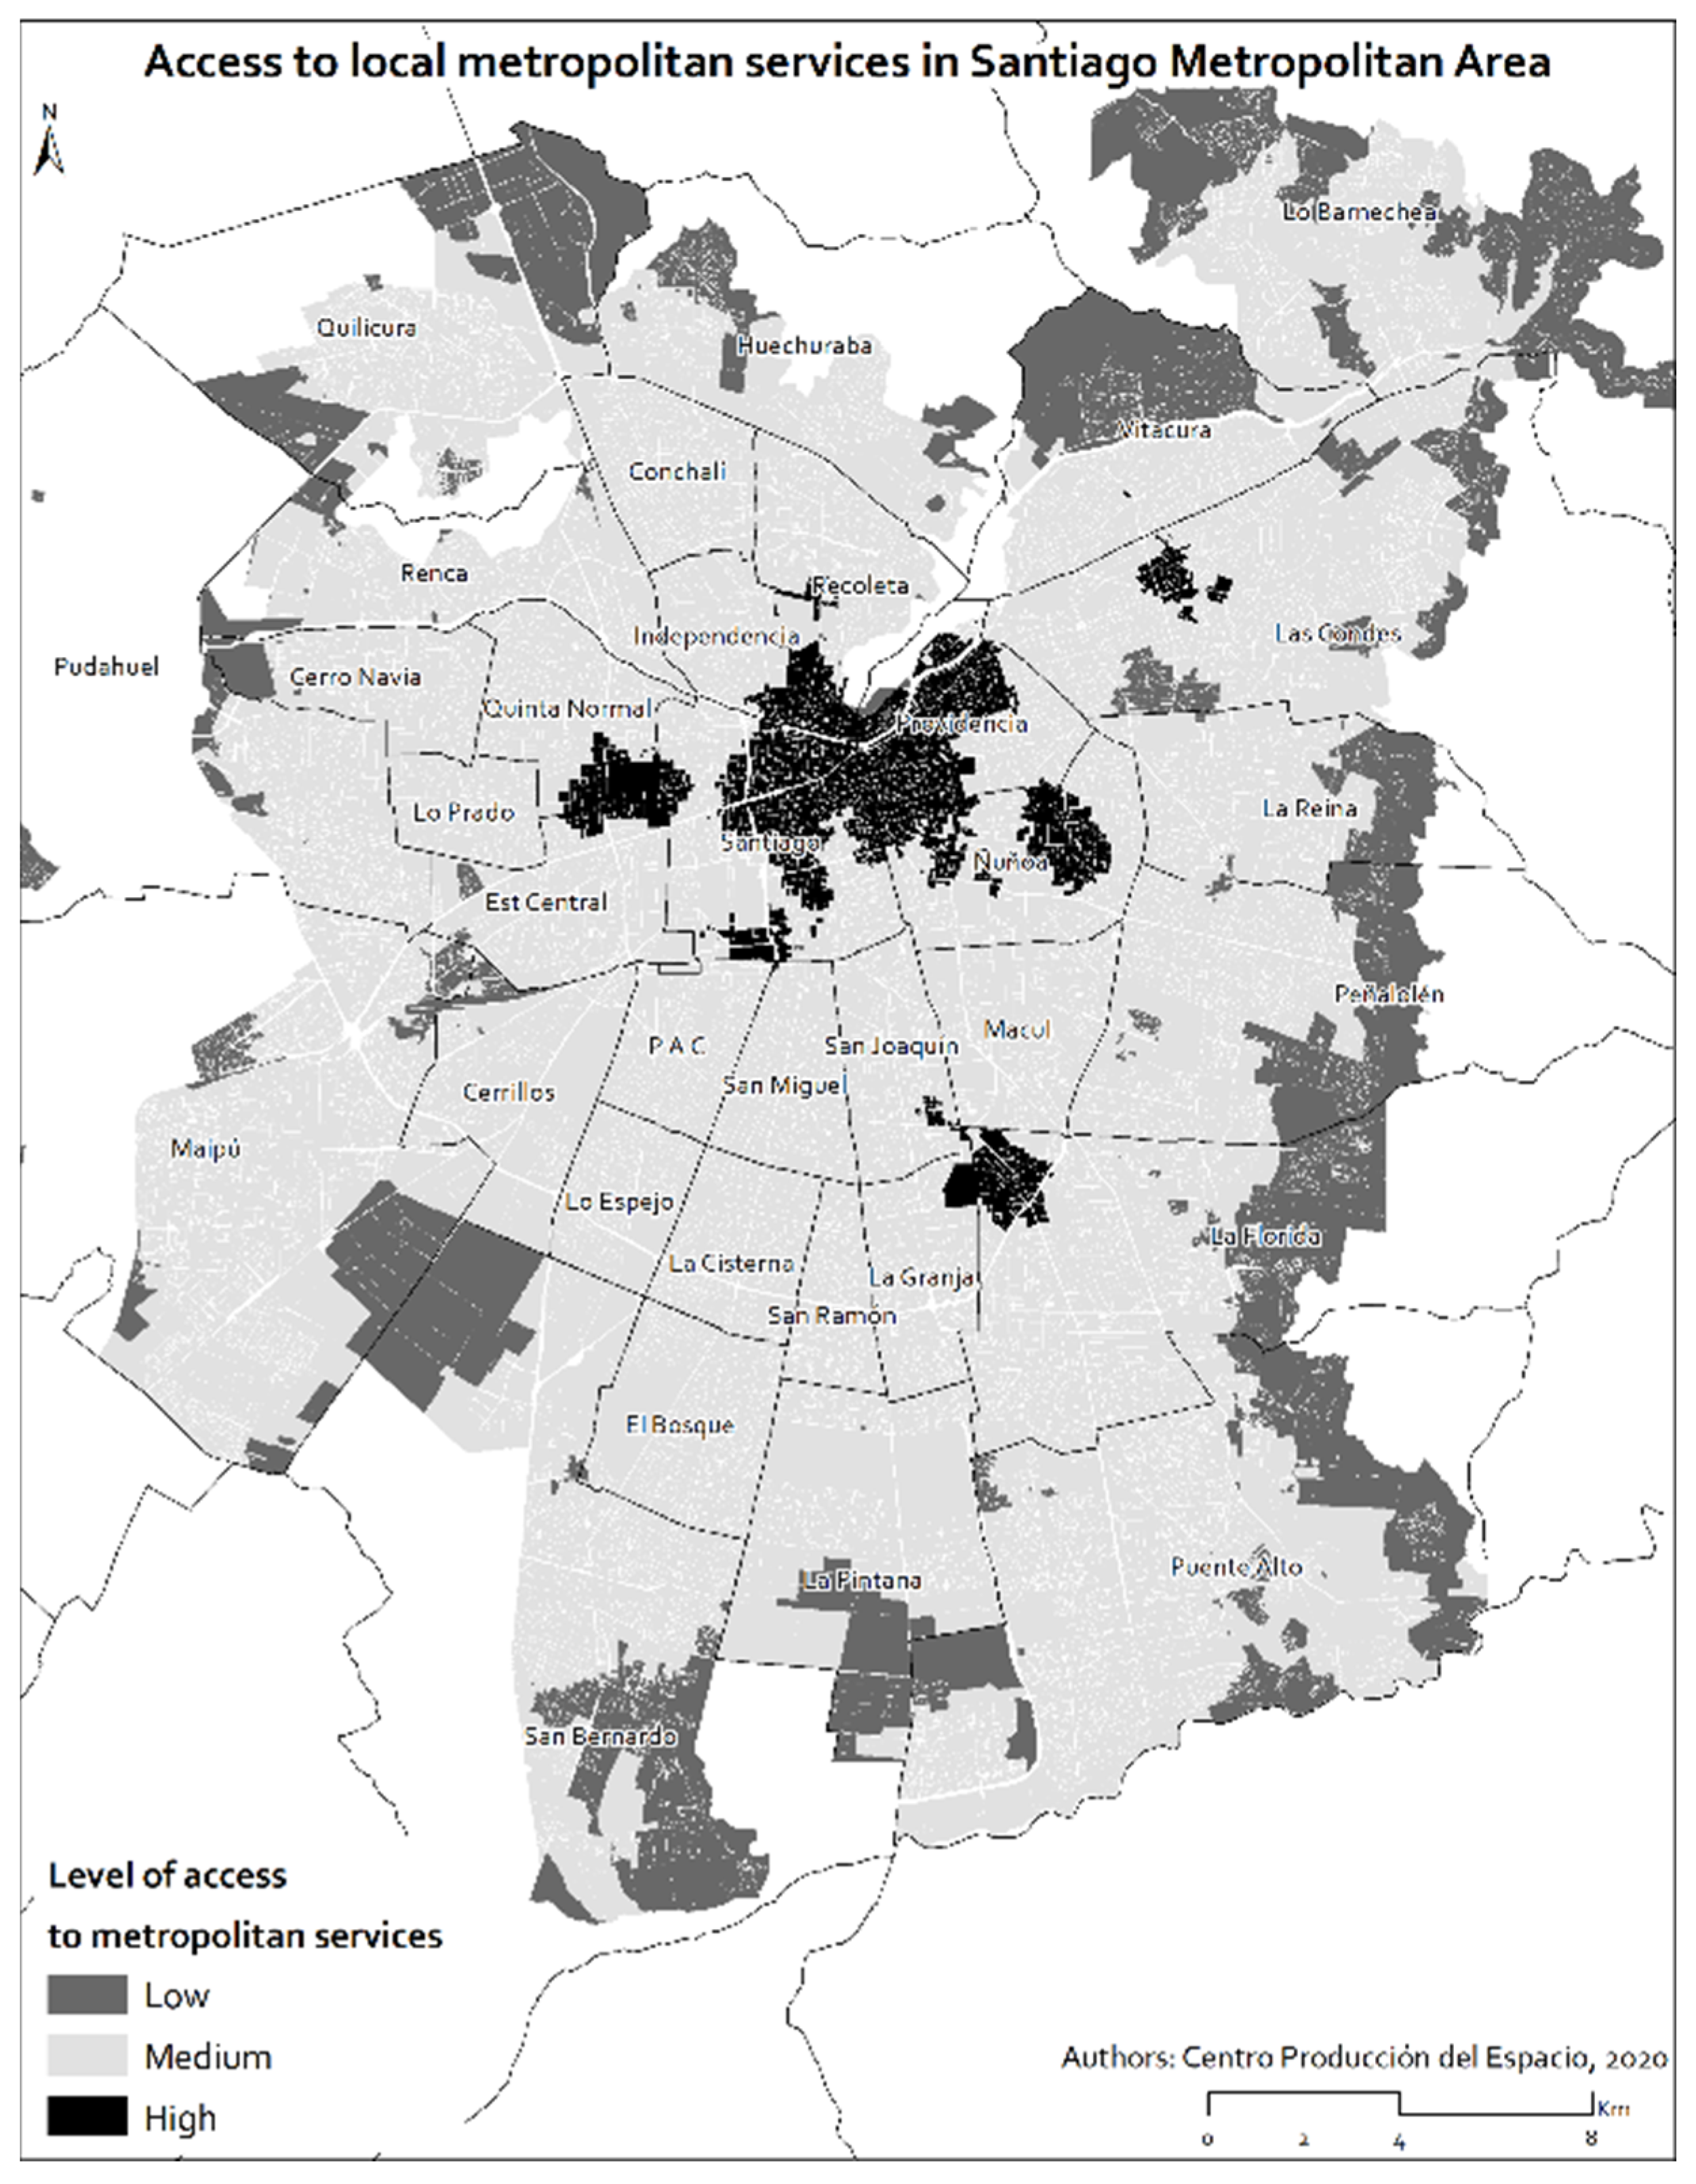
- Metropolitan Services: This category groups together functions that are on a metropolitan scale, i.e., whose load capacity exceeds the need of a single neighbourhood, such as hospitals, police stations, fire stations, cultural services, libraries, museums, cinemas and theatres.
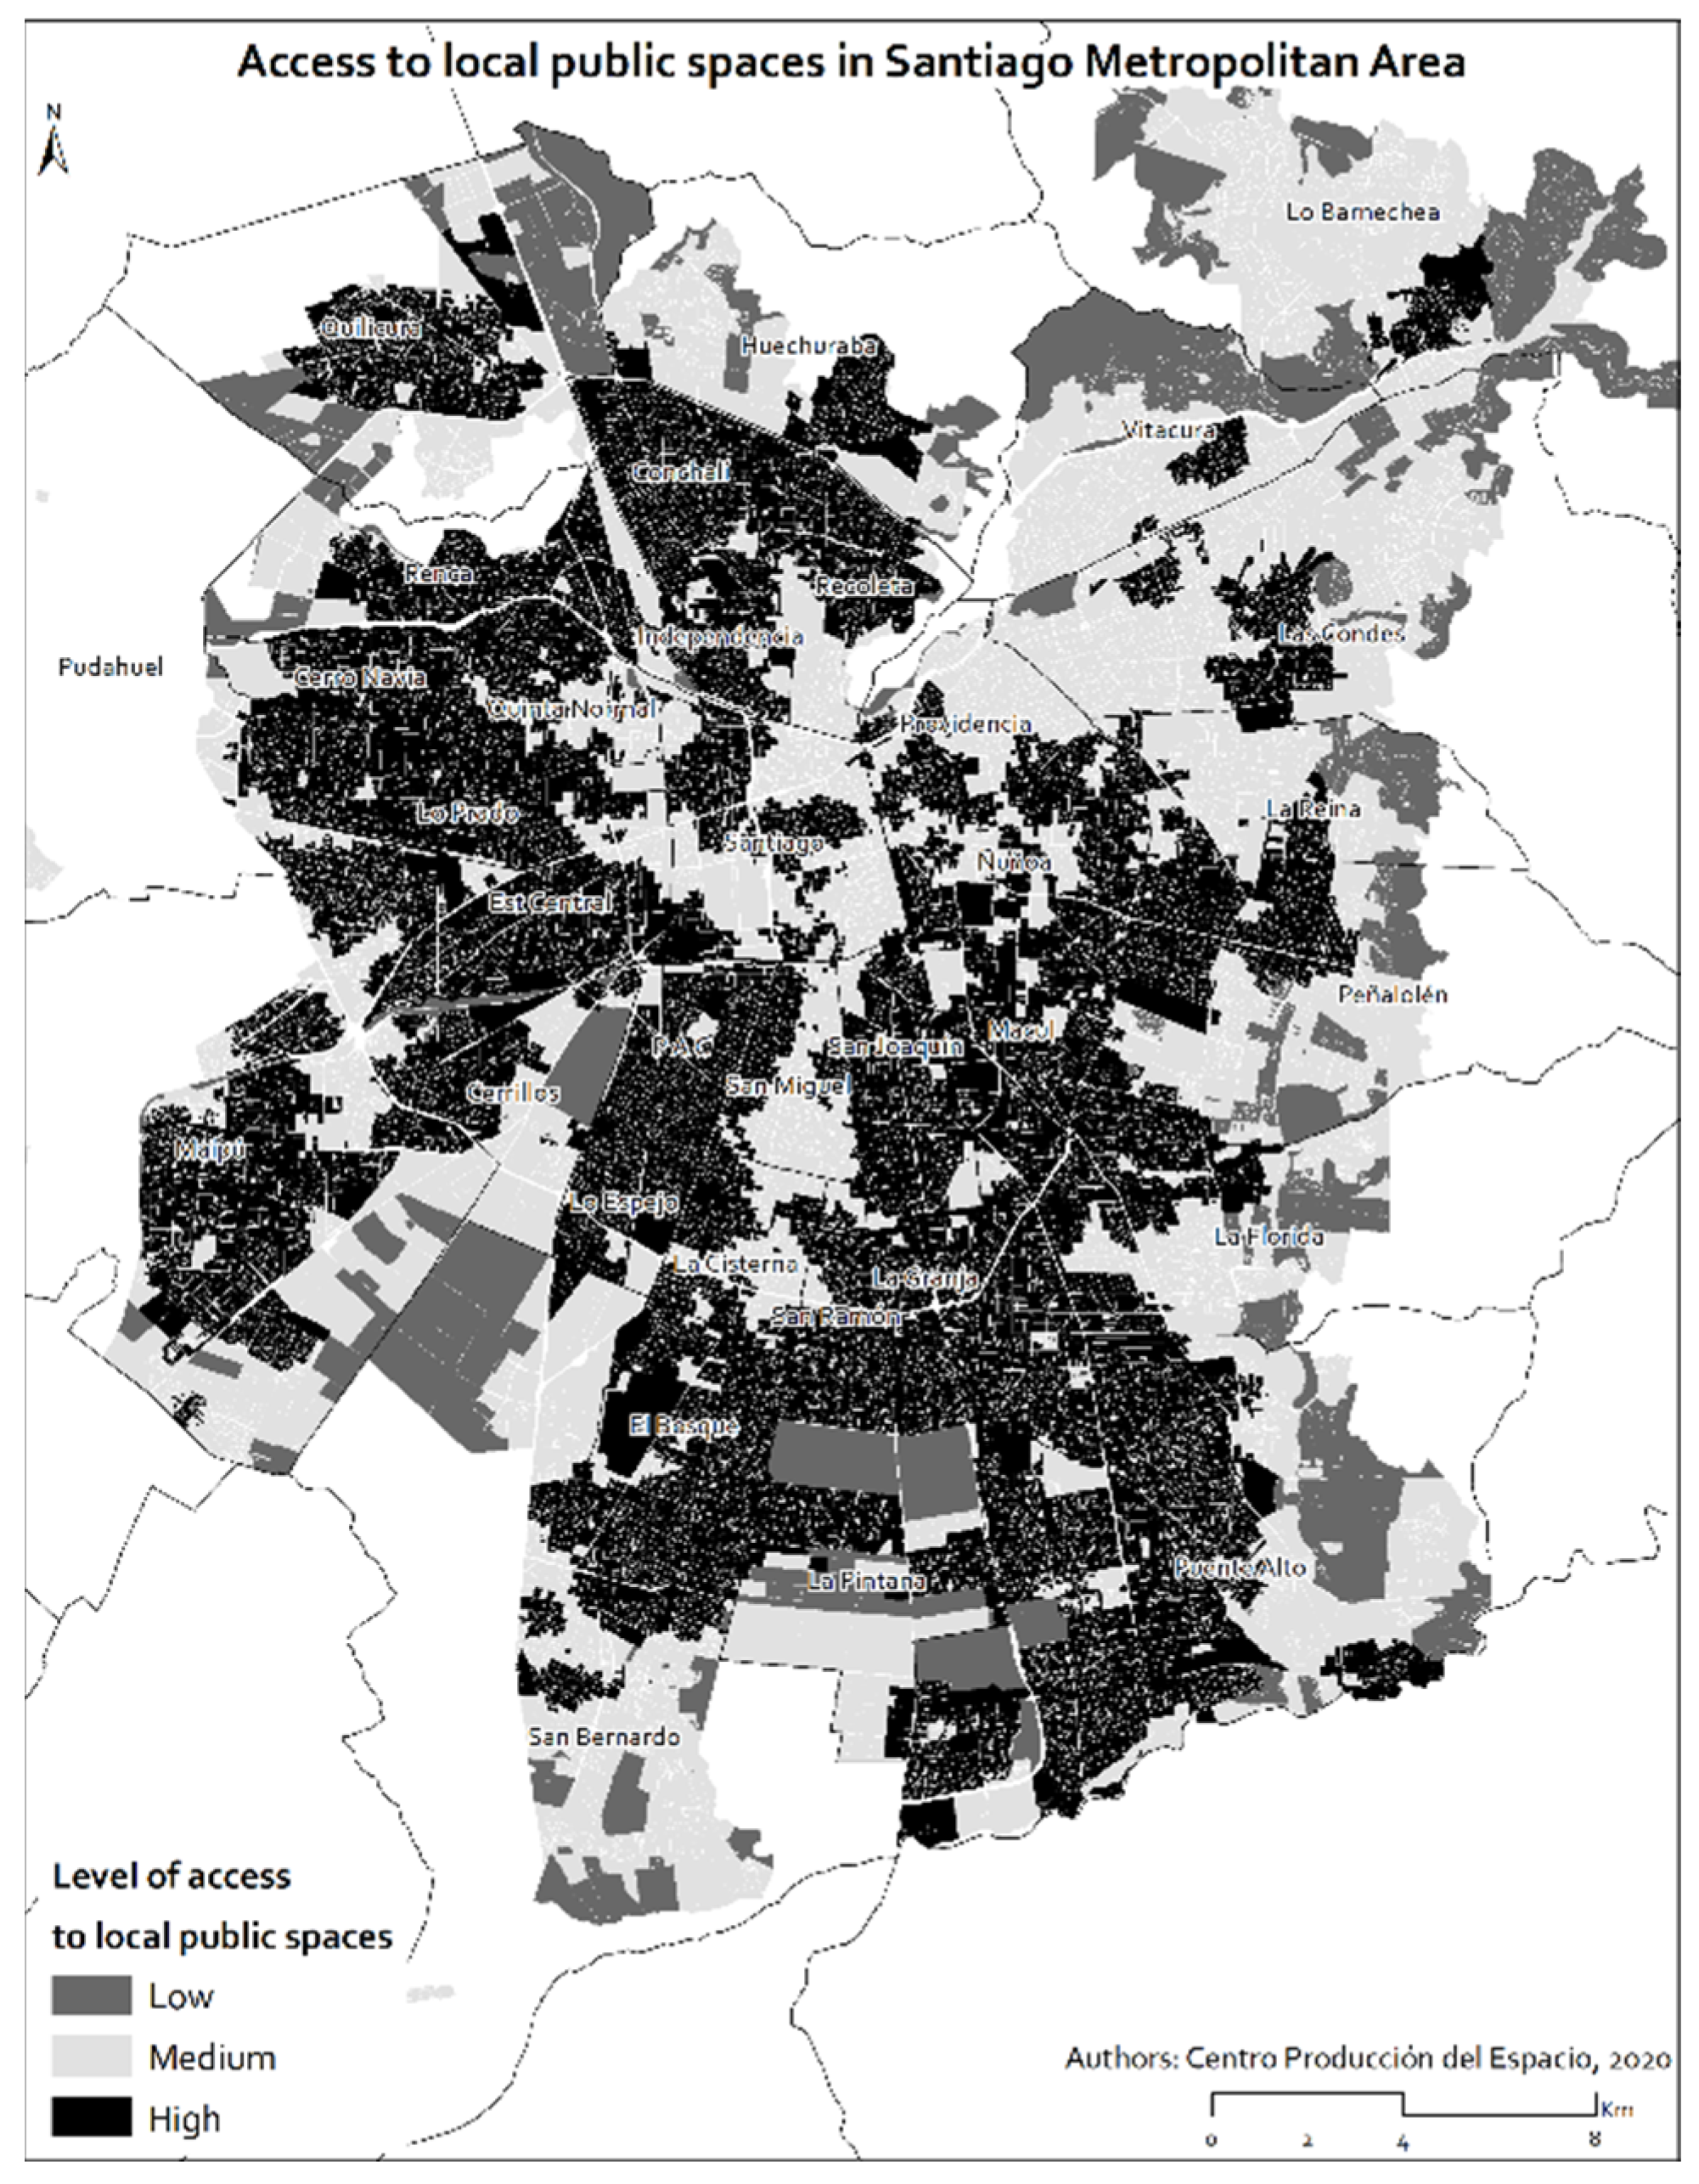
- Local Public Spaces: This refers to urban functions that allow mobility and social interaction, such as small green areas, bus stops, sports clubs and fairs.
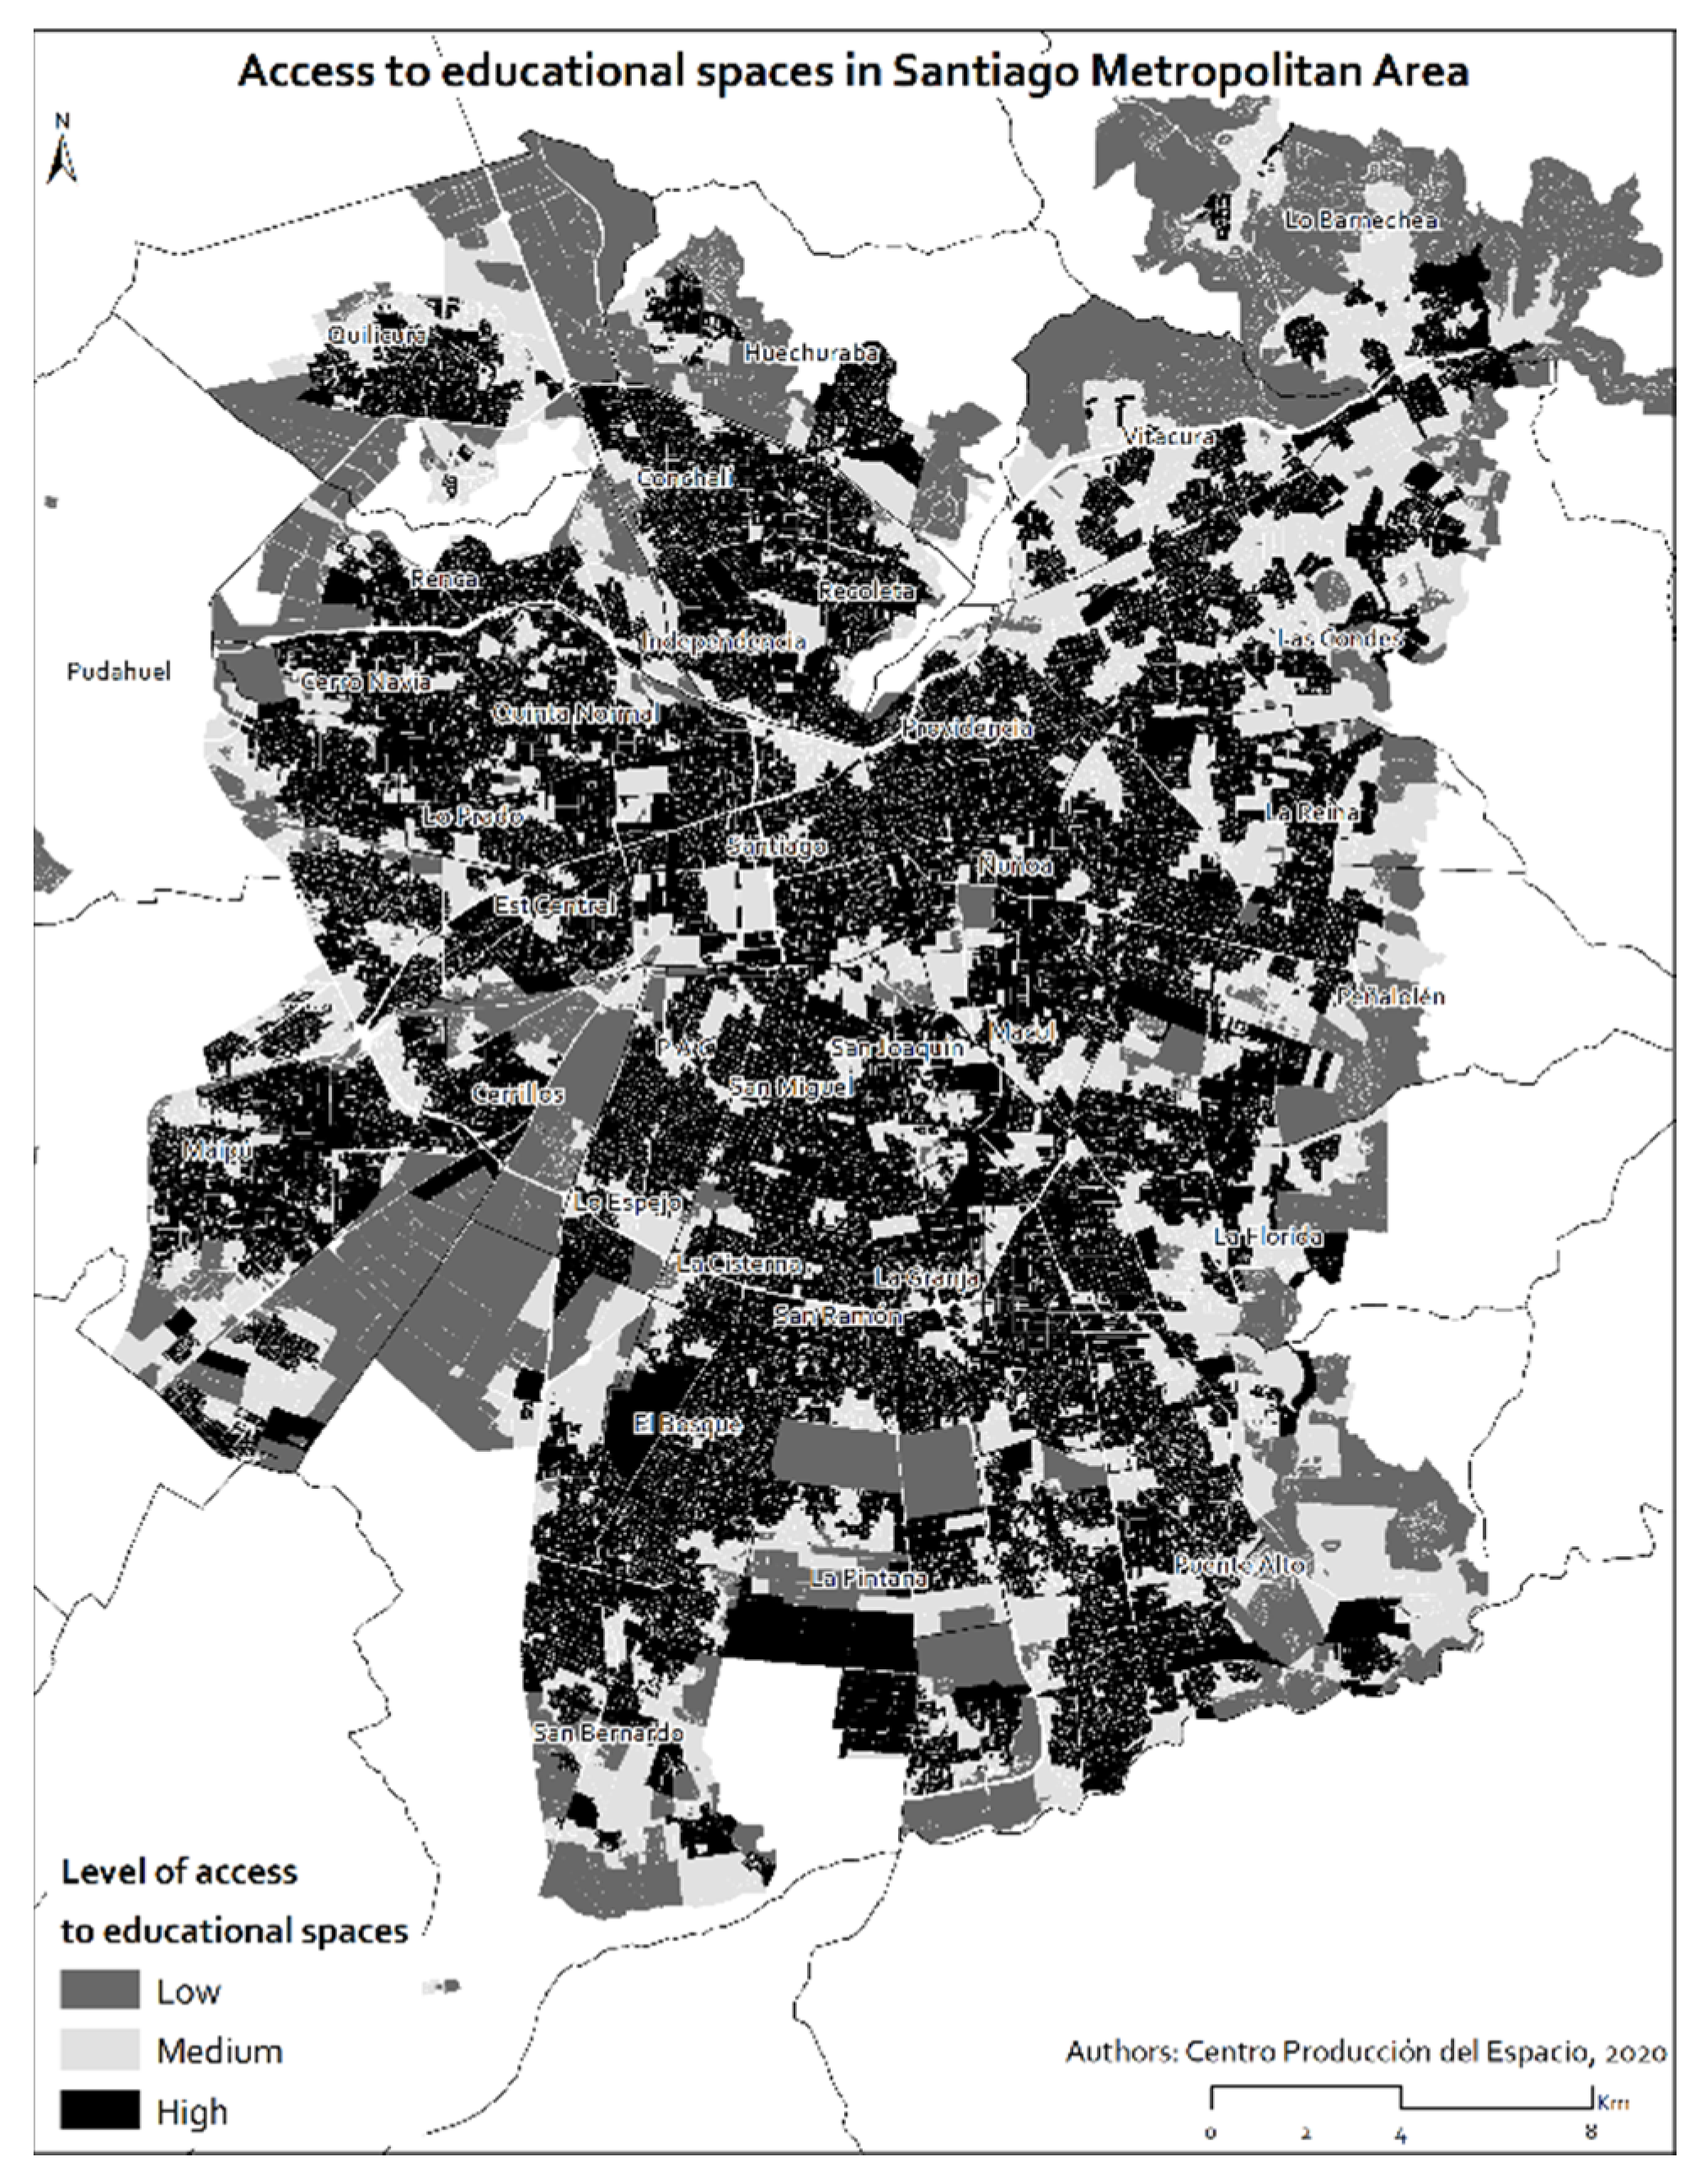
- Educational: In this component, the reference is clear to educational spaces by grouping only primary and secondary education.
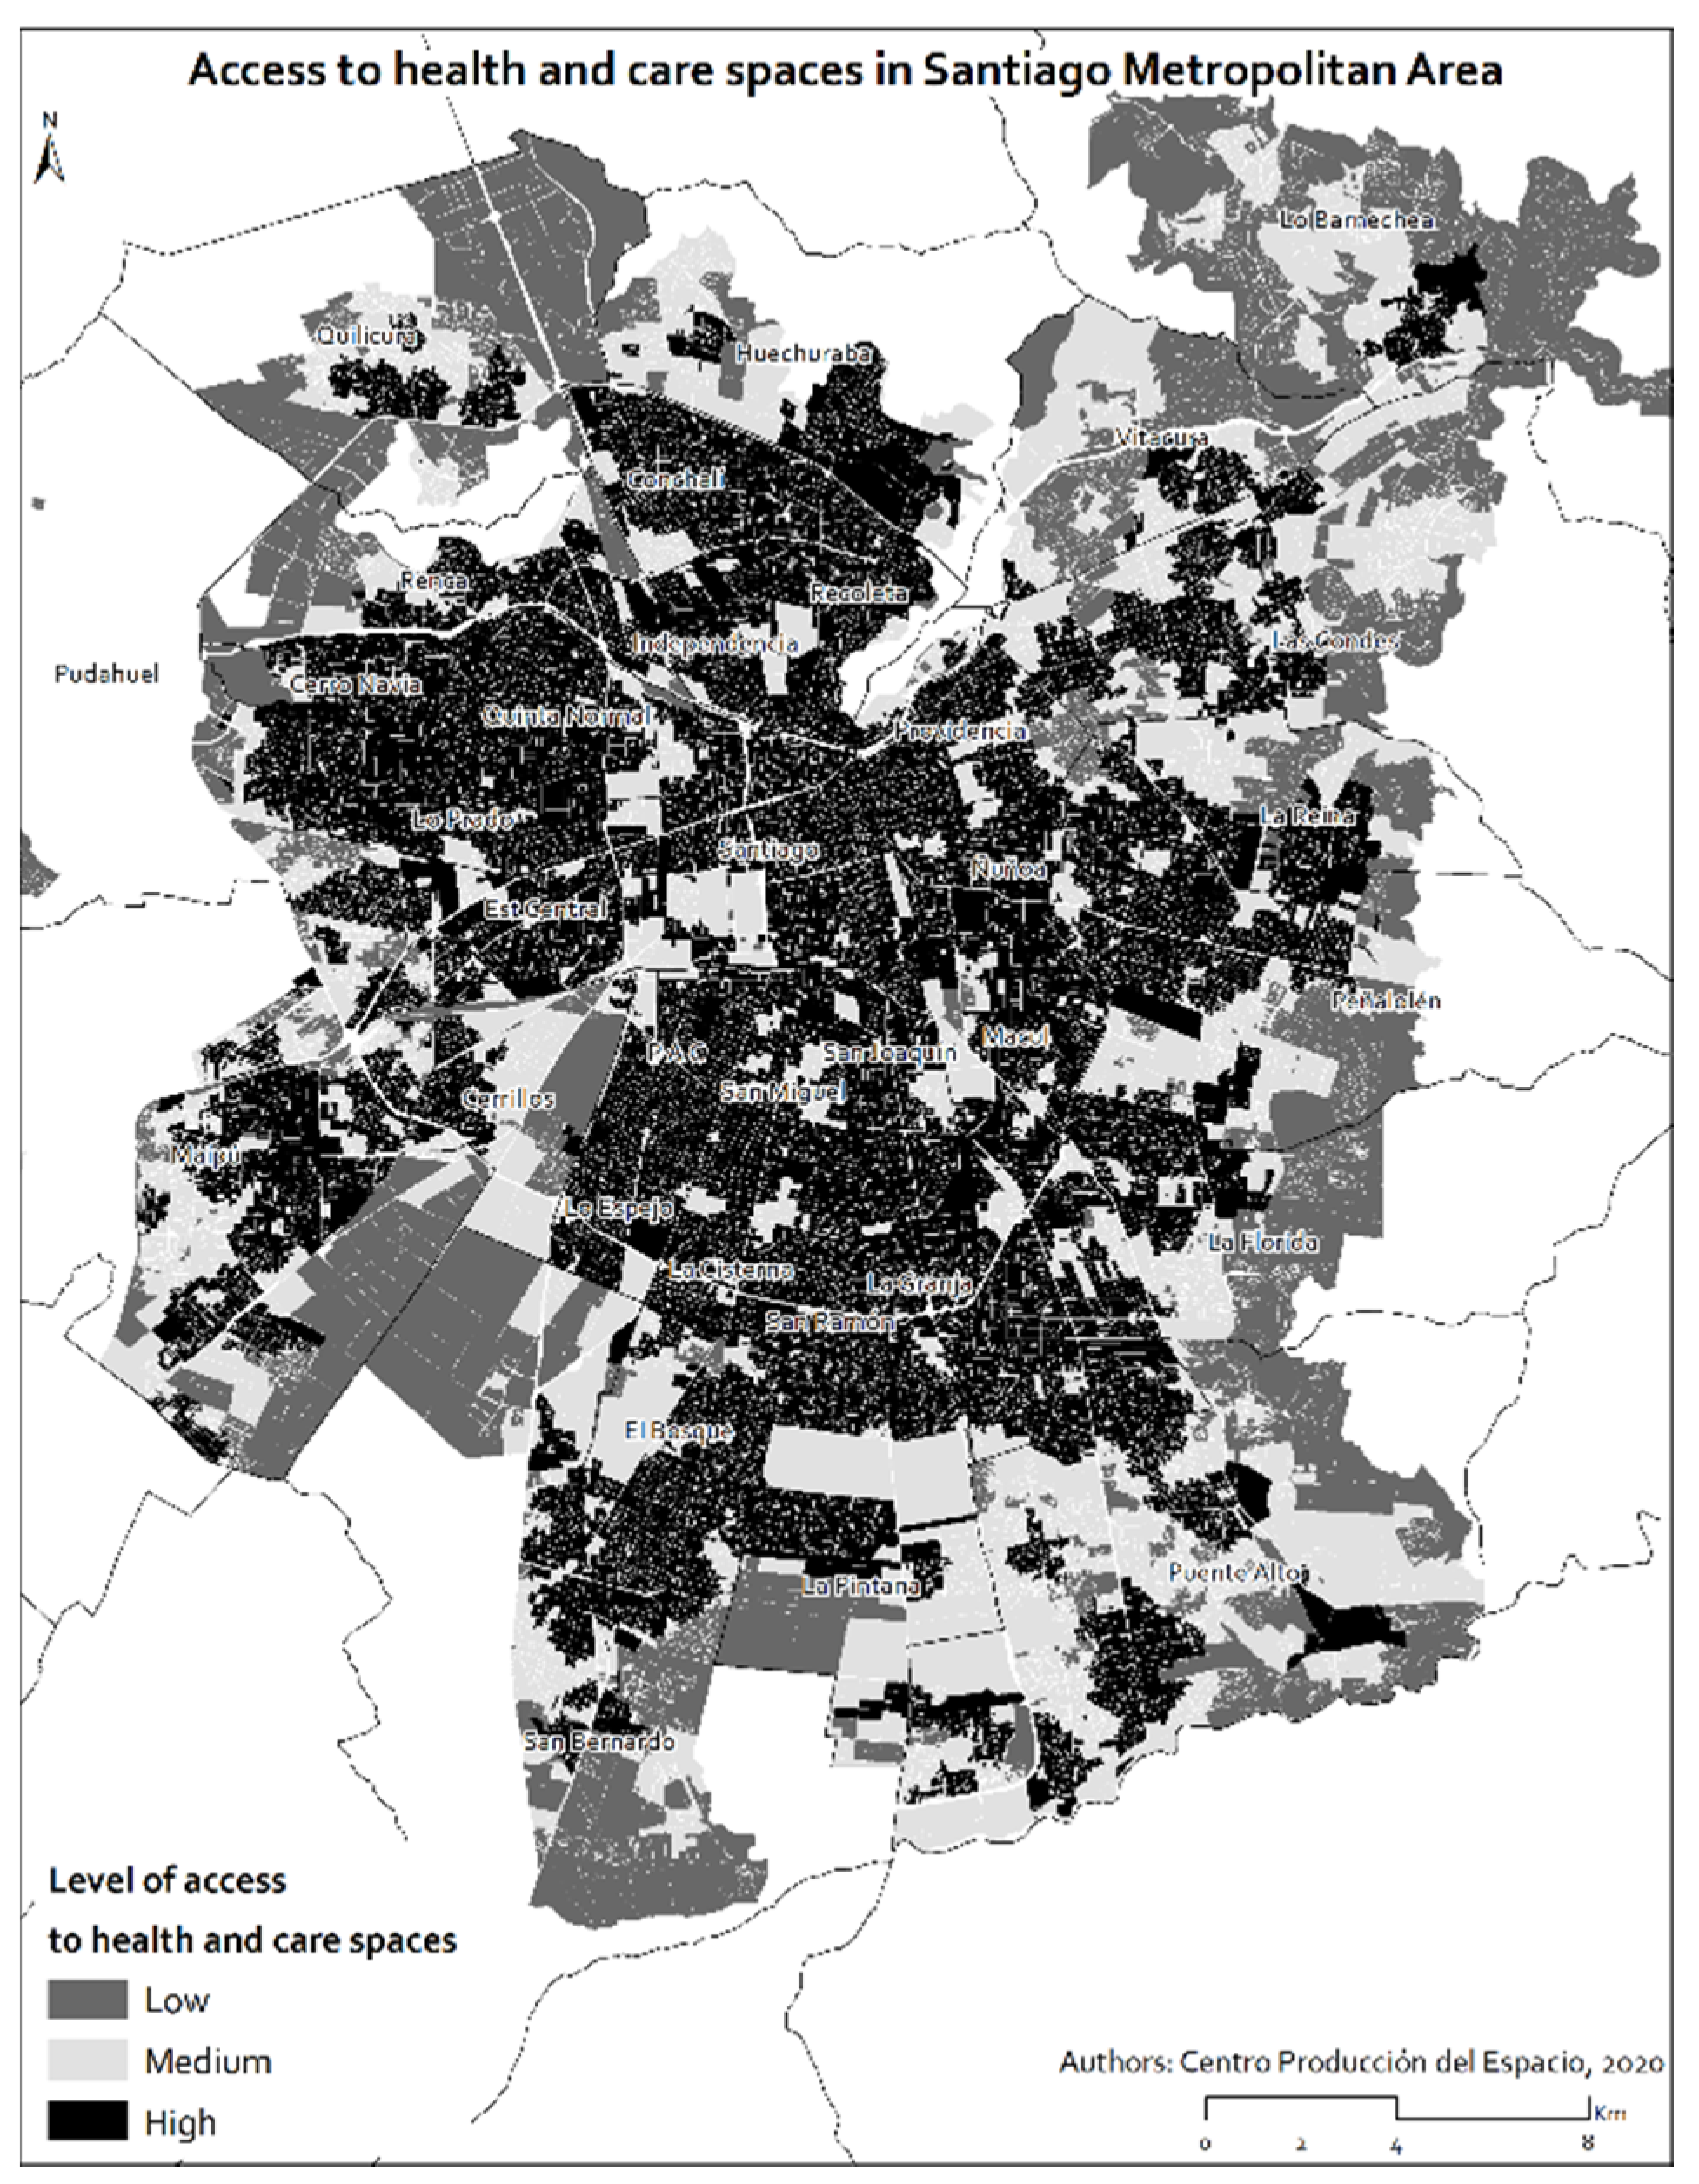
- Health and Care: This component groups together primary and secondary health facilities, as well as community equipment for leisure and collective organisations, which in Chile is usually oriented towards cooperative activities.
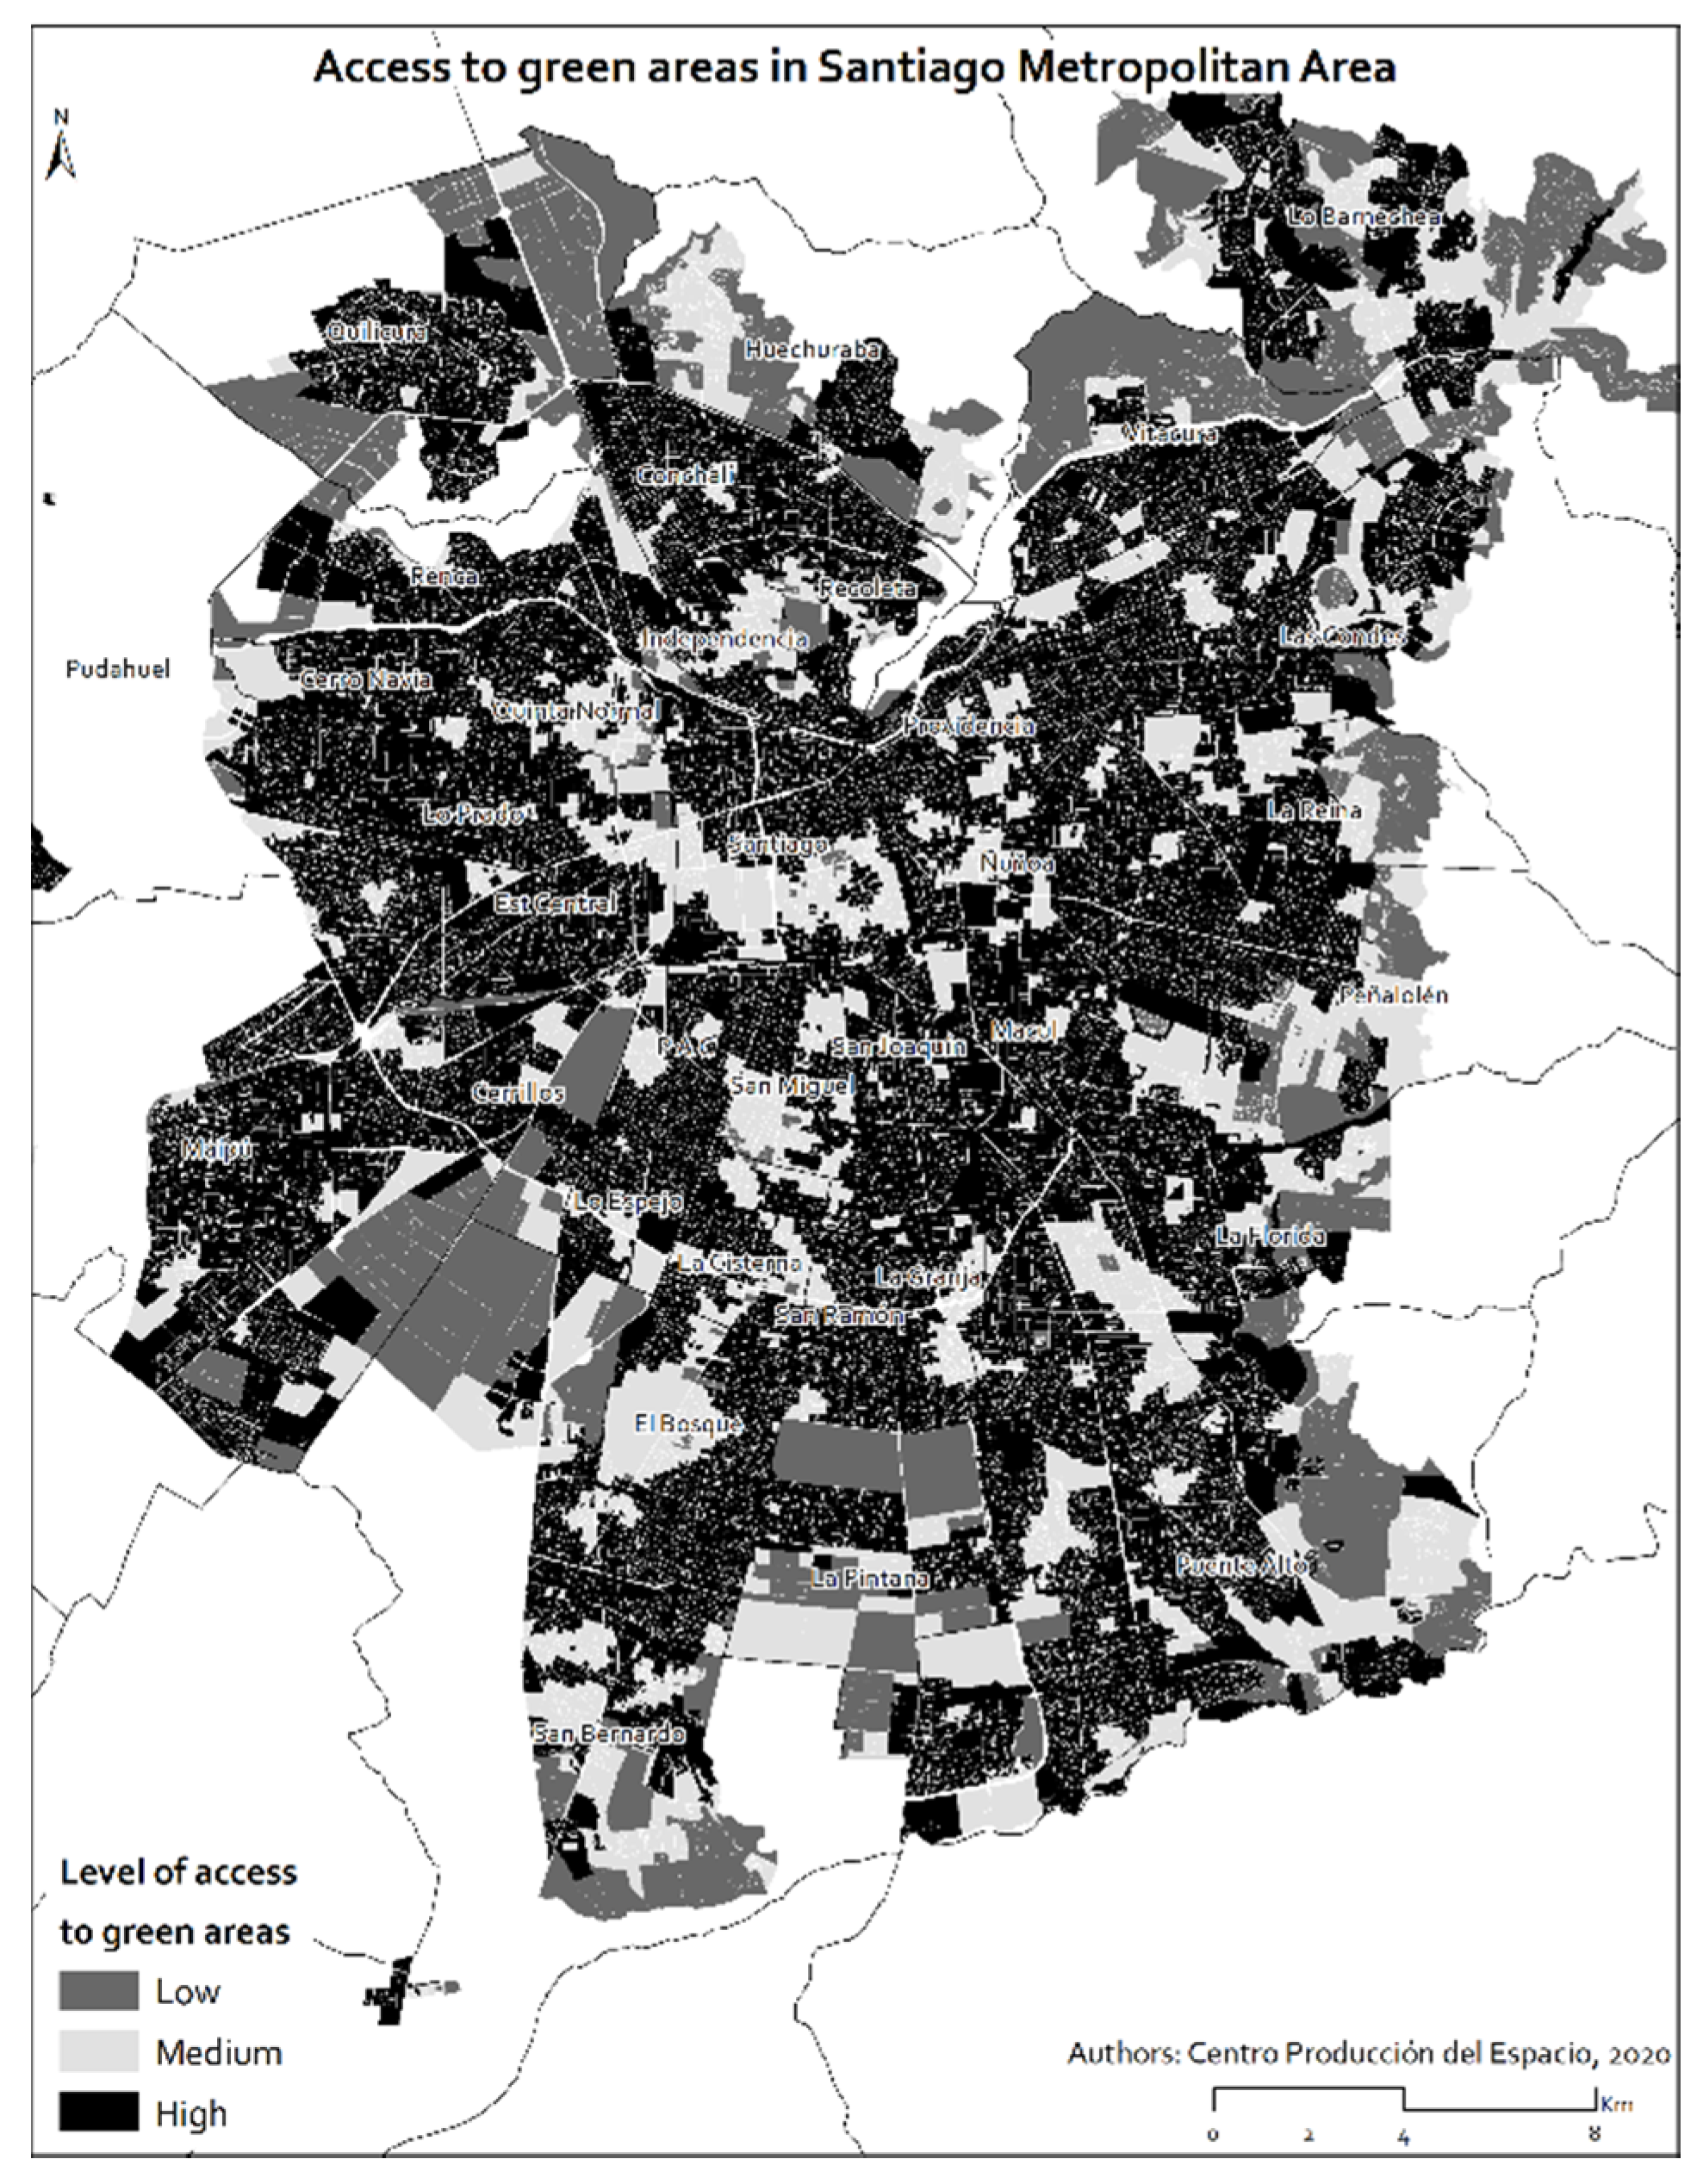
- Green Areas: This component groups together spaces for recreation and leisure.
These six components make it possible to generate a group of specific maps of the city, identifying those sectors where, depending on the essential urban functions under analysis, there is a greater presence of uses for urban life and therefore better walkability.
Based on these six components, a specific analysis is carried out for each one of them to determine the urban areas of Santiago Metropolitan Area that are best suited to implementing a 15-min city, as well as identifying those sectors where investment is needed to supply functional deficiencies for the development of urban life. The results are presented in maps for each component and are summarised in Table 4. Local Services is one of the components with the least availability at the level of Greater Santiago, as is Metropolitan Services. On the other hand, the high availability of Green Areas, Education and Local Public Spaces stands out, with considerable accessibility also available to Health and Care.
One of the most critical aspects is access to Local Services, which is very low for a large part of the city. Only the nodes near the main squares of each district and the structural axis of Alameda-Providencia1 have high levels of accessibility to Local Services. Specifically, only 300,632 people have excellent access to Local Services throughout the city, representing only 4.94% of the total population studied. This condition is problematic when considering that the Local Services component explains 29.69% of the eigenvalue, based on analysis of the main components on which this study is based (Appendix A).
Low availability is also observed in relation to Metropolitan Services, which is the second component with the highest variance accumulation (13.63%). Again, the good availability of these services tends to coincide with what is observed in Figure 1, in relation to Local Services. In this case, only 7.83% of the population (475,927 people) have access to all functions analysed, according to the distances stipulated for the component of Metropolitan Services (Figure 2).
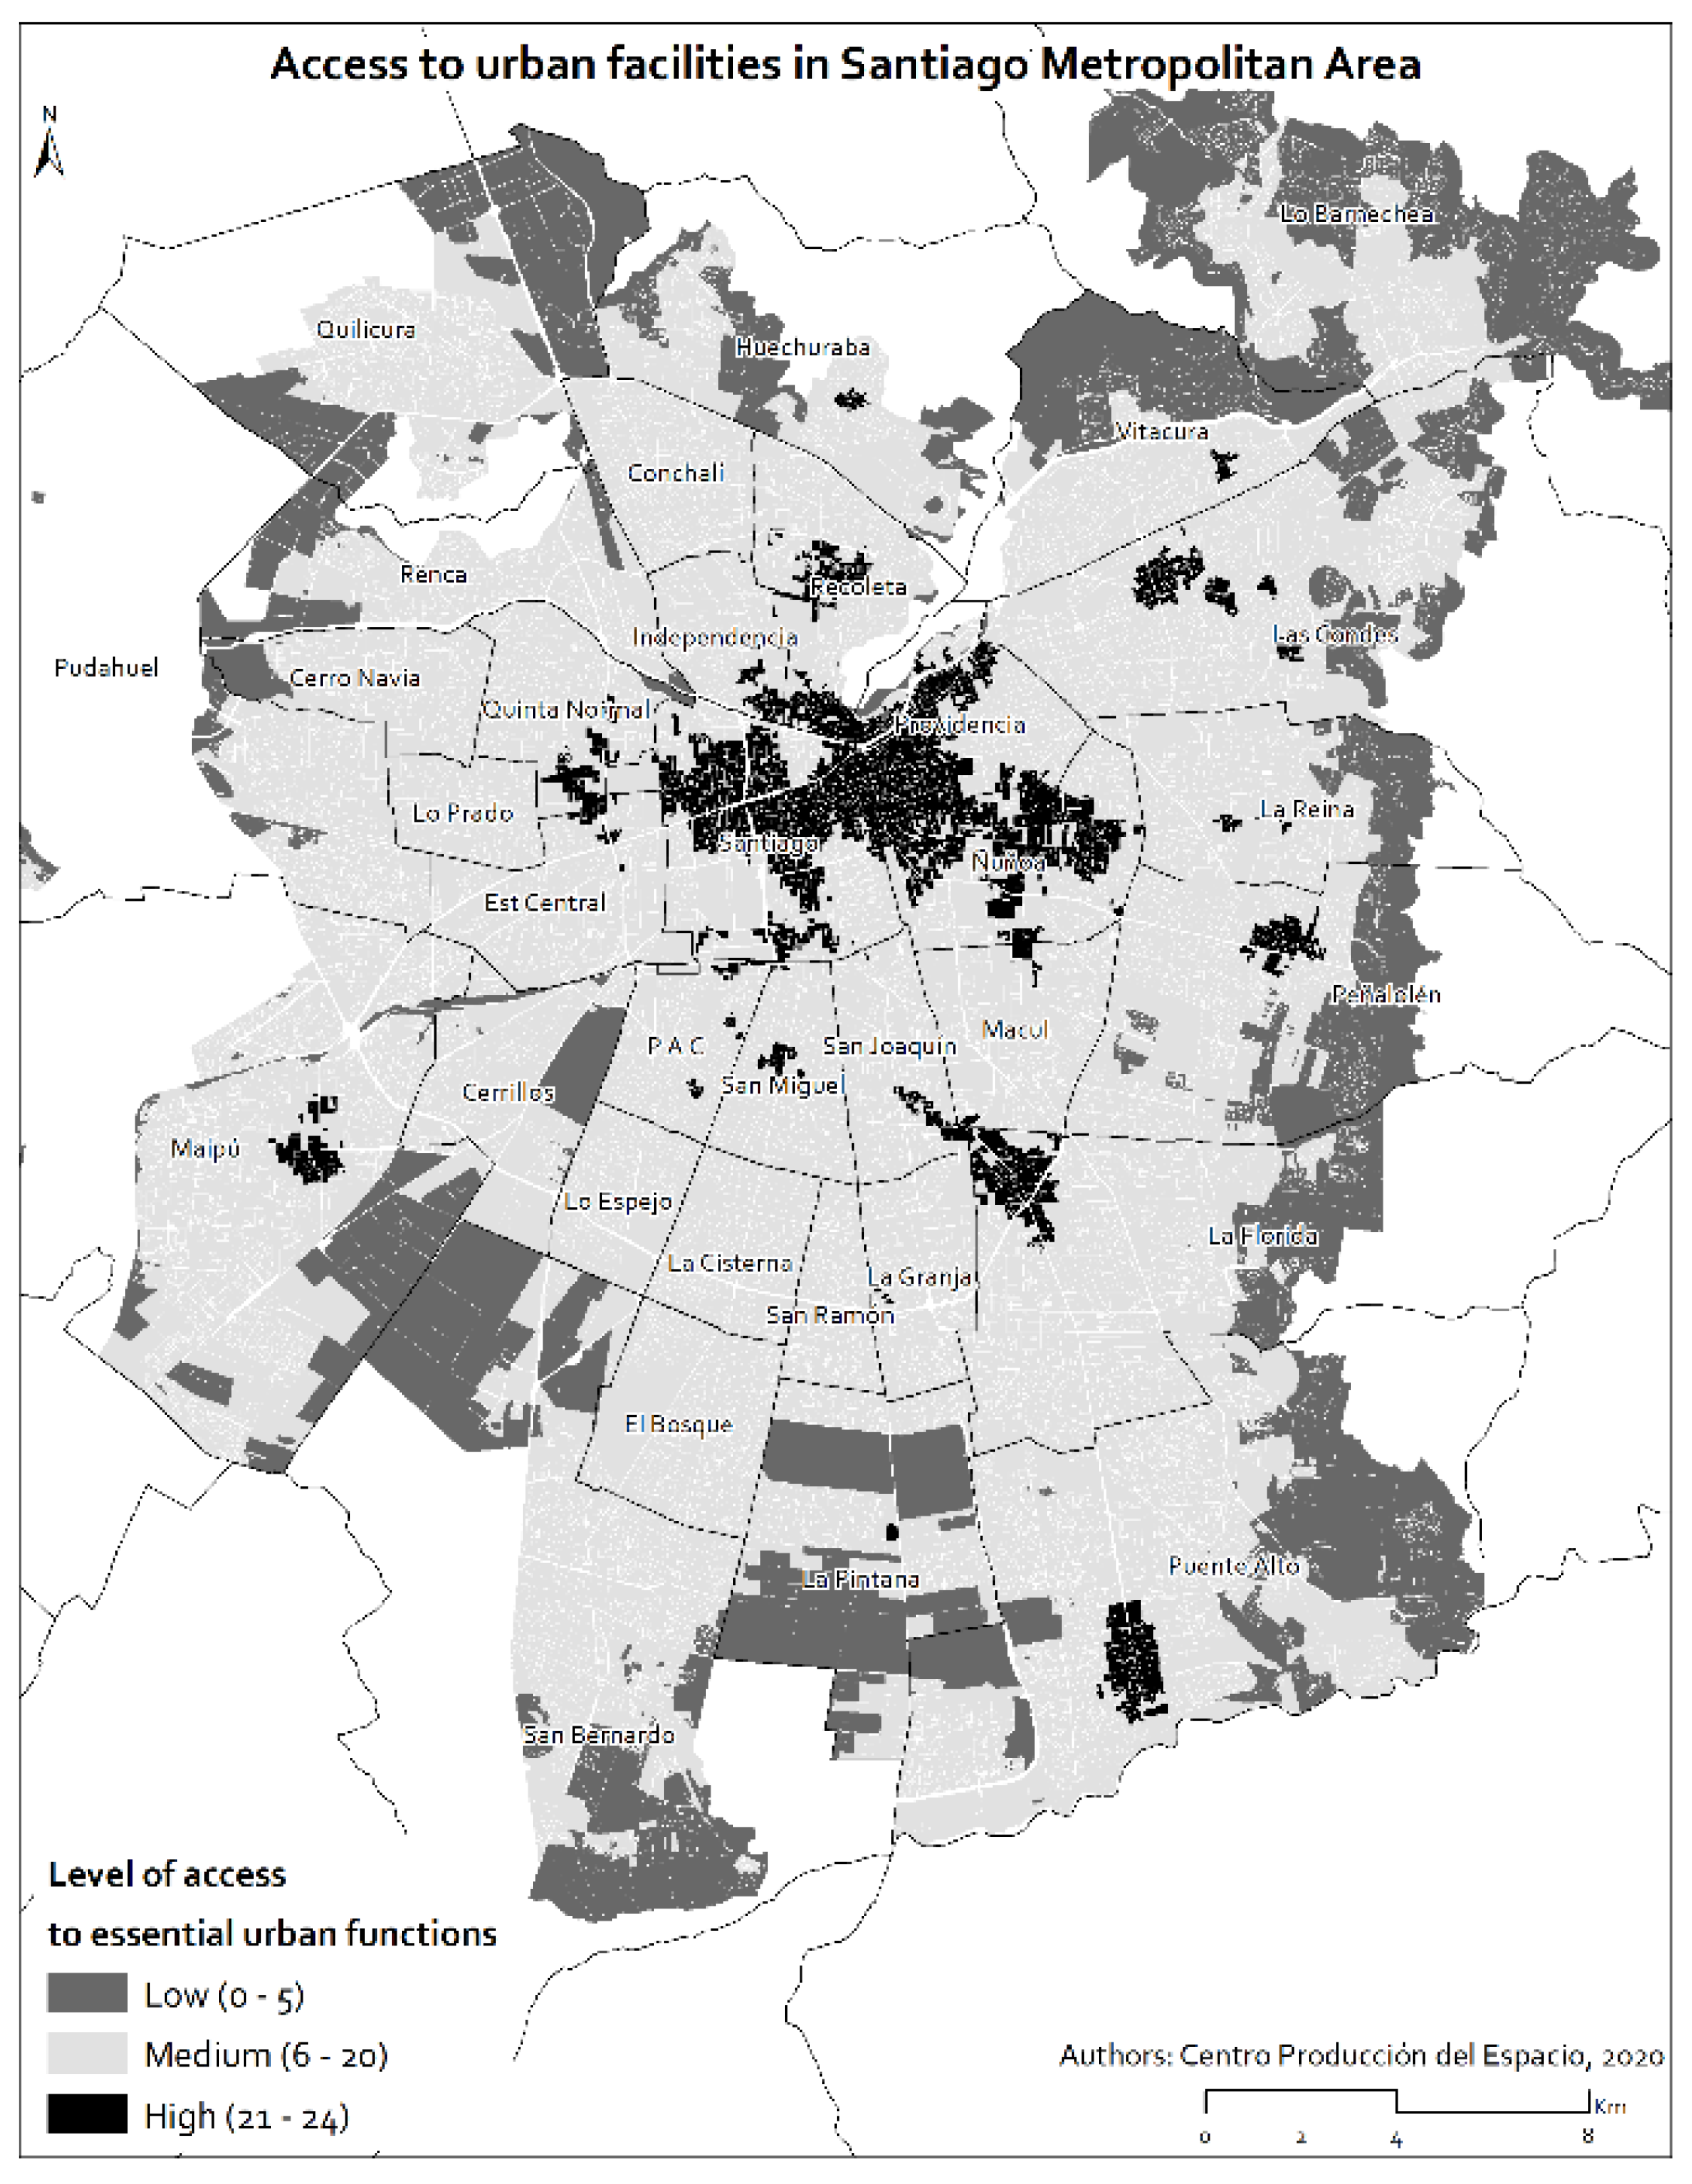
Coincidentally, general accessibility of the city is good in relation to the Local Public Spaces (Figure 3), Education (Figure 4), Health and Care (Figure 5), and Green Areas components (Figure 6). In these areas, the colour black predominates, indicating good accessibility, and their distribution over the city is relatively equal, averaging 74.32% coverage, with the lowest coverage for the total variables explored being Health and Care with 68.26% and the highest being Green Areas with 83.13%. The majority of these functions evaluated for the case of the Santiago Metropolitan Area correspond to public goods; however, these four components only explain 19.02% of the eigenvalue of the main component study. It is for this reason that, in summary, only a small portion of the city has greater accessibility to the essential urban functions that were studied (Figure 7). Specifically, if we consider the 24 key functions that were the result of the extraction by method of principal component analysis, only 1.87% of the population lives in a 15-min city. In other words, if there is a walking city contingent in Santiago, only 113,771 people live there out of a total of 6,081,881 studied. The largest concentrations of these 15-min neighbourhoods are located in the municipalities of Santiago, Providencia and Ñuñoa, followed to a lesser extent by Las Condes, Maipú, Recoleta, La Florida, Peñalolén, Vitacura, Puente Alto and San Miguel.
4. Discussion
The research findings present a strong contrast between the components of Local Services and Metropolitan Services in relation to the rest of the urban functions. For Local Services, the main component of this analysis, it is important to mention that a large part of the variables grouped in this component correspond to functions that in the city of Santiago are the responsibility of private agents, where decision-making is based on the law of supply and demand, rather than on an integrated planning system. In this context, the mercantilist approach to allocate spaces for urban functions within the city to develop commerce and local services undermines the effective possibility of moving towards a 15-min city. On the other hand, the greater availability of essential urban functions of the other factors evaluated does have very good coverage over the city, which should indicate that most of these functions depend on public projects organised by state authorities. In other words, while market-dependent urban organisation is unequal and concentrated in specific areas of the city, state-dependent urban functions are distributed equally throughout the territory. This finding indicates that if the aim is to move towards a 15-min city, the state must ensure that local services and metropolitan services are located in those sectors that have so far been deprived of such functions. To achieve this task, governance over a plan to make the Santiago Metropolitan Area a 15-min city needs to reinstate discussion on the importance of having an integrated metropolitan urban planning authority, such as a metropolitan mayor, who can organise strategic decision-making to guide the common good of the 34 districts that today lack such coordination.
A second finding complements the first: good coverage of public goods in the city allows for the prospect of making Santiago Metropolitan Area a 15-min city. This is because good coverage of schools and squares at a metropolitan level allows us to think that it is in the relationship of both spaces where development of new sub-central hierarchies for a specific neighbourhood can be located. On the one hand, schools comprise a good type of infrastructure, where their opening to the population outside of class hours can help to organise cultural, social, sporting and recreational activities in general for the whole community of a neighbourhood. Precisely, one of the proposals of Paris’ quarter-hour city plan is based on utilising schools. On the other hand, green areas and squares offer an opening space in the city, a respite from the urban fabric, which makes it possible to generate an urban landmark from which to also organise a change in the surrounding land uses so that urban functions associated with local services are developed. All districts studied have schools and squares that can guide the development of a metropolitan transformation plan, taking advantage of current advantages of the built environment. In other words, this finding makes it possible to propose an investment plan that is based on the complexity of existing infrastructure, rather than on creation of new urban spaces. Correct management and planning of land use could facilitate development of this plan. Land-use regulation should be adjusted to provision of services in order to maintain public goods over which private actors gain advantages.
In order to improve land-use planning, it is necessary for property rights to be retributive to a social role. In Chile, this was made possible by a law passed in 1967, which constitutionally established that land had a social role and that ownership was therefore subordinate to the common good [20]; however, the Constitution of 1980 subjugated the legislative hierarchy of this role to private property. In the current context, hence, there is a constitutional problem with this type of land management, since the right to own property ranks higher than the common good. In practice, urban land that has good access to essential urban functions is first exploited for commercial purposes by private parties and not by the state in pursuit of the common good. The state even promotes this form of land use, since this is established by the legal and constitutional framework. In other words, land is mainly used by the private sector to capture the surplus value of urban attributes, denaturing them as public goods. Therefore, without constitutional change to redefine the role of land for social development, it would be extremely difficult to implement the kind of change needed to move towards a 15-min city.
This 15-min city is possible, but it needs resources. Understanding the current regulatory framework in Chile, one possibility to start financing these transformations can be developed by capturing surplus value from urban investments and improving current instruments of urban contribution in order to generate an urban policy that favours the complexity of neighbourhoods in their potential sub-centres. This capturing of surplus value can take international examples, such as the Spanish Law on Land and Urban Rehabilitation or the instruments of territorial planning in Colombia.
5. Conclusions
This article has presented a methodology for evaluating the potential for an urban area to become a 15-min city based on existing urban functions. Specifically, work has been done with sub-centralities of use, identifying 28 urban functions essential to everyday life in the particular case of Chile. In summary, it is suggested that the methodology can be replicated through the following steps: (i) identify essential urban functions of each city and collect georeferenced data that informs them, (ii) apply principal component analysis to review how these georeferenced variables are grouped into synthetic components, (iii) map these variables in GIS to evaluate the availability of the different components for each city, reviewing where concentrations occur and where there is a need to increase availability of these missing uses, and (iv) explore the existing essential urban functions in the city that could contribute to triggering a major transformation. In this case study, it has been identified that those essential urban functions provided by the state present a relatively equitable distribution in the metropolis, while essential urban functions provided by the market are highly concentrated in certain clusters and do not achieve territorial equity. In order to reverse this situation, in the case of Santiago and considering the Chilean regulatory framework, more profound transformations will be needed regarding how the market and private agents are organised in the city.
In October 2019, a social outburst began in Chile, triggered by profound inequalities of the society, which are expressed materially in its cities, Santiago being one of the spaces where this inequality is most visible [21]. This social explosion was suspended by another major crisis following the pandemic of the novel coronavirus. Both the social outburst and the pandemic have installed in public opinion the importance of rethinking the organisation of the city, both in relation to its everyday mobilities and also to residential segregation. The 15-min city concept can be a way of reducing the inequality gap in space, and this study contributes to that discussion with empirical evidence and concrete proposals. Considering that from October 2020 onwards, Chile will begin to redefine its constitutional framework, rethinking of the collective space, the city, must be a fundamental part of the new social contract that will be drafted. In our opinion, the social role of property and urban land as a public good are key to reducing inequality and increasing people’s quality of life.
This research invites discussion on the urban hierarchies of the city of Santiago, on the possibility of using this methodology to redefine what the urban centre of the metropolis is and how it generates travel attractions. In other words, a possible opportunity for future research has to do with exploring methods based on urban specialisation indexes from the findings already presented in this article. The need to review the validity of urban planning instruments available in Chile, based mainly on zoning, also requires further analysis. Zoning plans seem insufficient for generating sub-centralities, even more so when the state has no direct participation in defining where the essential functions that have been characterised as Local Services are located. New methods of urban planning must be implemented in order to move towards a more complex use of land in neighbourhoods, thus advancing to enrich everyday life in a human scale and following the principles of the walkable city. Finally, at the level of public policy advocacy, the existing governance model in Santiago does not allow for articulation of decisions for urban transformation of this type due to immense fragmentation of the territory, represented by 34 districts that do not have a metropolitan mayor. Inequality is reproduced partly because of this problem and can be resolved by democratising land management and incorporating new figures to coordinate both decision-making on the territory and to organise design and planning of a new objective image for the city. This objective image does not exist, but the data and findings that emerge from this research provide key background for its formation.
Author Contributions
Conceptualisation, J.F.V.-P.; methodology, C.A.-N.; validation, J.C.-P., C.A.-N. and J.F.V.-P.; formal analysis, J.C.-P., C.A.-N. and J.F.V.-P.; investigation, J.C.-P.; resources, J.C.-P.; data curation, J.C.-P. and J.F.V.-P.; writing—original draft preparation, J.F.V.-P.; writing—review and editing, J.C.-P., C.A.-N. and J.F.V.-P.; visualisation, J.C.-P.; funding acquisition, J.F.V.-P. All authors have read and agreed to the published version of the manuscript.
Funding
This research was funded by ANID, grant number FONDECYT 11180569.
Conflicts of Interest
The authors declare no conflict of interest.
Appendix A

Table A1.
Total Variance Explained for Principal Component Analysis. Source: authors.
| Component | Initial Eigenvalues | Rotation Sums of Squared Loadings | ||||
|---|---|---|---|---|---|---|
| Total | % of Variance | Cumulative % | Total | % of Variance | Cumulative % | |
| 1 | 8313 | 29,690 | 29,690 | 5174 | 18,478 | 18,478 |
| 2 | 3817 | 13,631 | 43,321 | 3944 | 14,084 | 32,562 |
| 3 | 1643 | 5868 | 49,190 | 3164 | 11,302 | 43,864 |
| 4 | 1288 | 4601 | 53,791 | 2054 | 7337 | 51,201 |
| 5 | 1256 | 4486 | 58,277 | 1806 | 6449 | 57,650 |
| 6 | 1139 | 4067 | 62,344 | 1314 | 4694 | 62,344 |
| 7 | 960 | 3427 | 65,771 | |||
| 8 | 886 | 3164 | 68,935 | |||
| 9 | 846 | 3020 | 71,955 | |||
| 10 | 770 | 2751 | 74,706 | |||
| 11 | 750 | 2678 | 77,384 | |||
| 12 | 676 | 2415 | 79,798 | |||
| 13 | 647 | 2311 | 82,110 | |||
| 14 | 621 | 2219 | 84,329 | |||
| 15 | 592 | 2113 | 86,442 | |||
| 16 | 514 | 1835 | 88,277 | |||
| 17 | 485 | 1731 | 90,008 | |||
| 18 | 443 | 1583 | 91,591 | |||
| 19 | 415 | 1483 | 93,074 | |||
| 20 | 391 | 1395 | 94,469 | |||
| 21 | 350 | 1249 | 95,718 | |||
| 22 | 294 | 1049 | 96,767 | |||
| 23 | 266 | 949 | 97,716 | |||
| 24 | 216 | 770 | 98,487 | |||
| 25 | 175 | 625 | 99,112 | |||
| 26 | 128 | 458 | 99,570 | |||
| 27 | 120 | 430 | 100,000 | |||
| 28 | 2.086 × 10¹⁵ | 7.449 × 10¹⁵ | 100,000 | |||
Extraction Method: Principal Component Analysis.
Appendix B
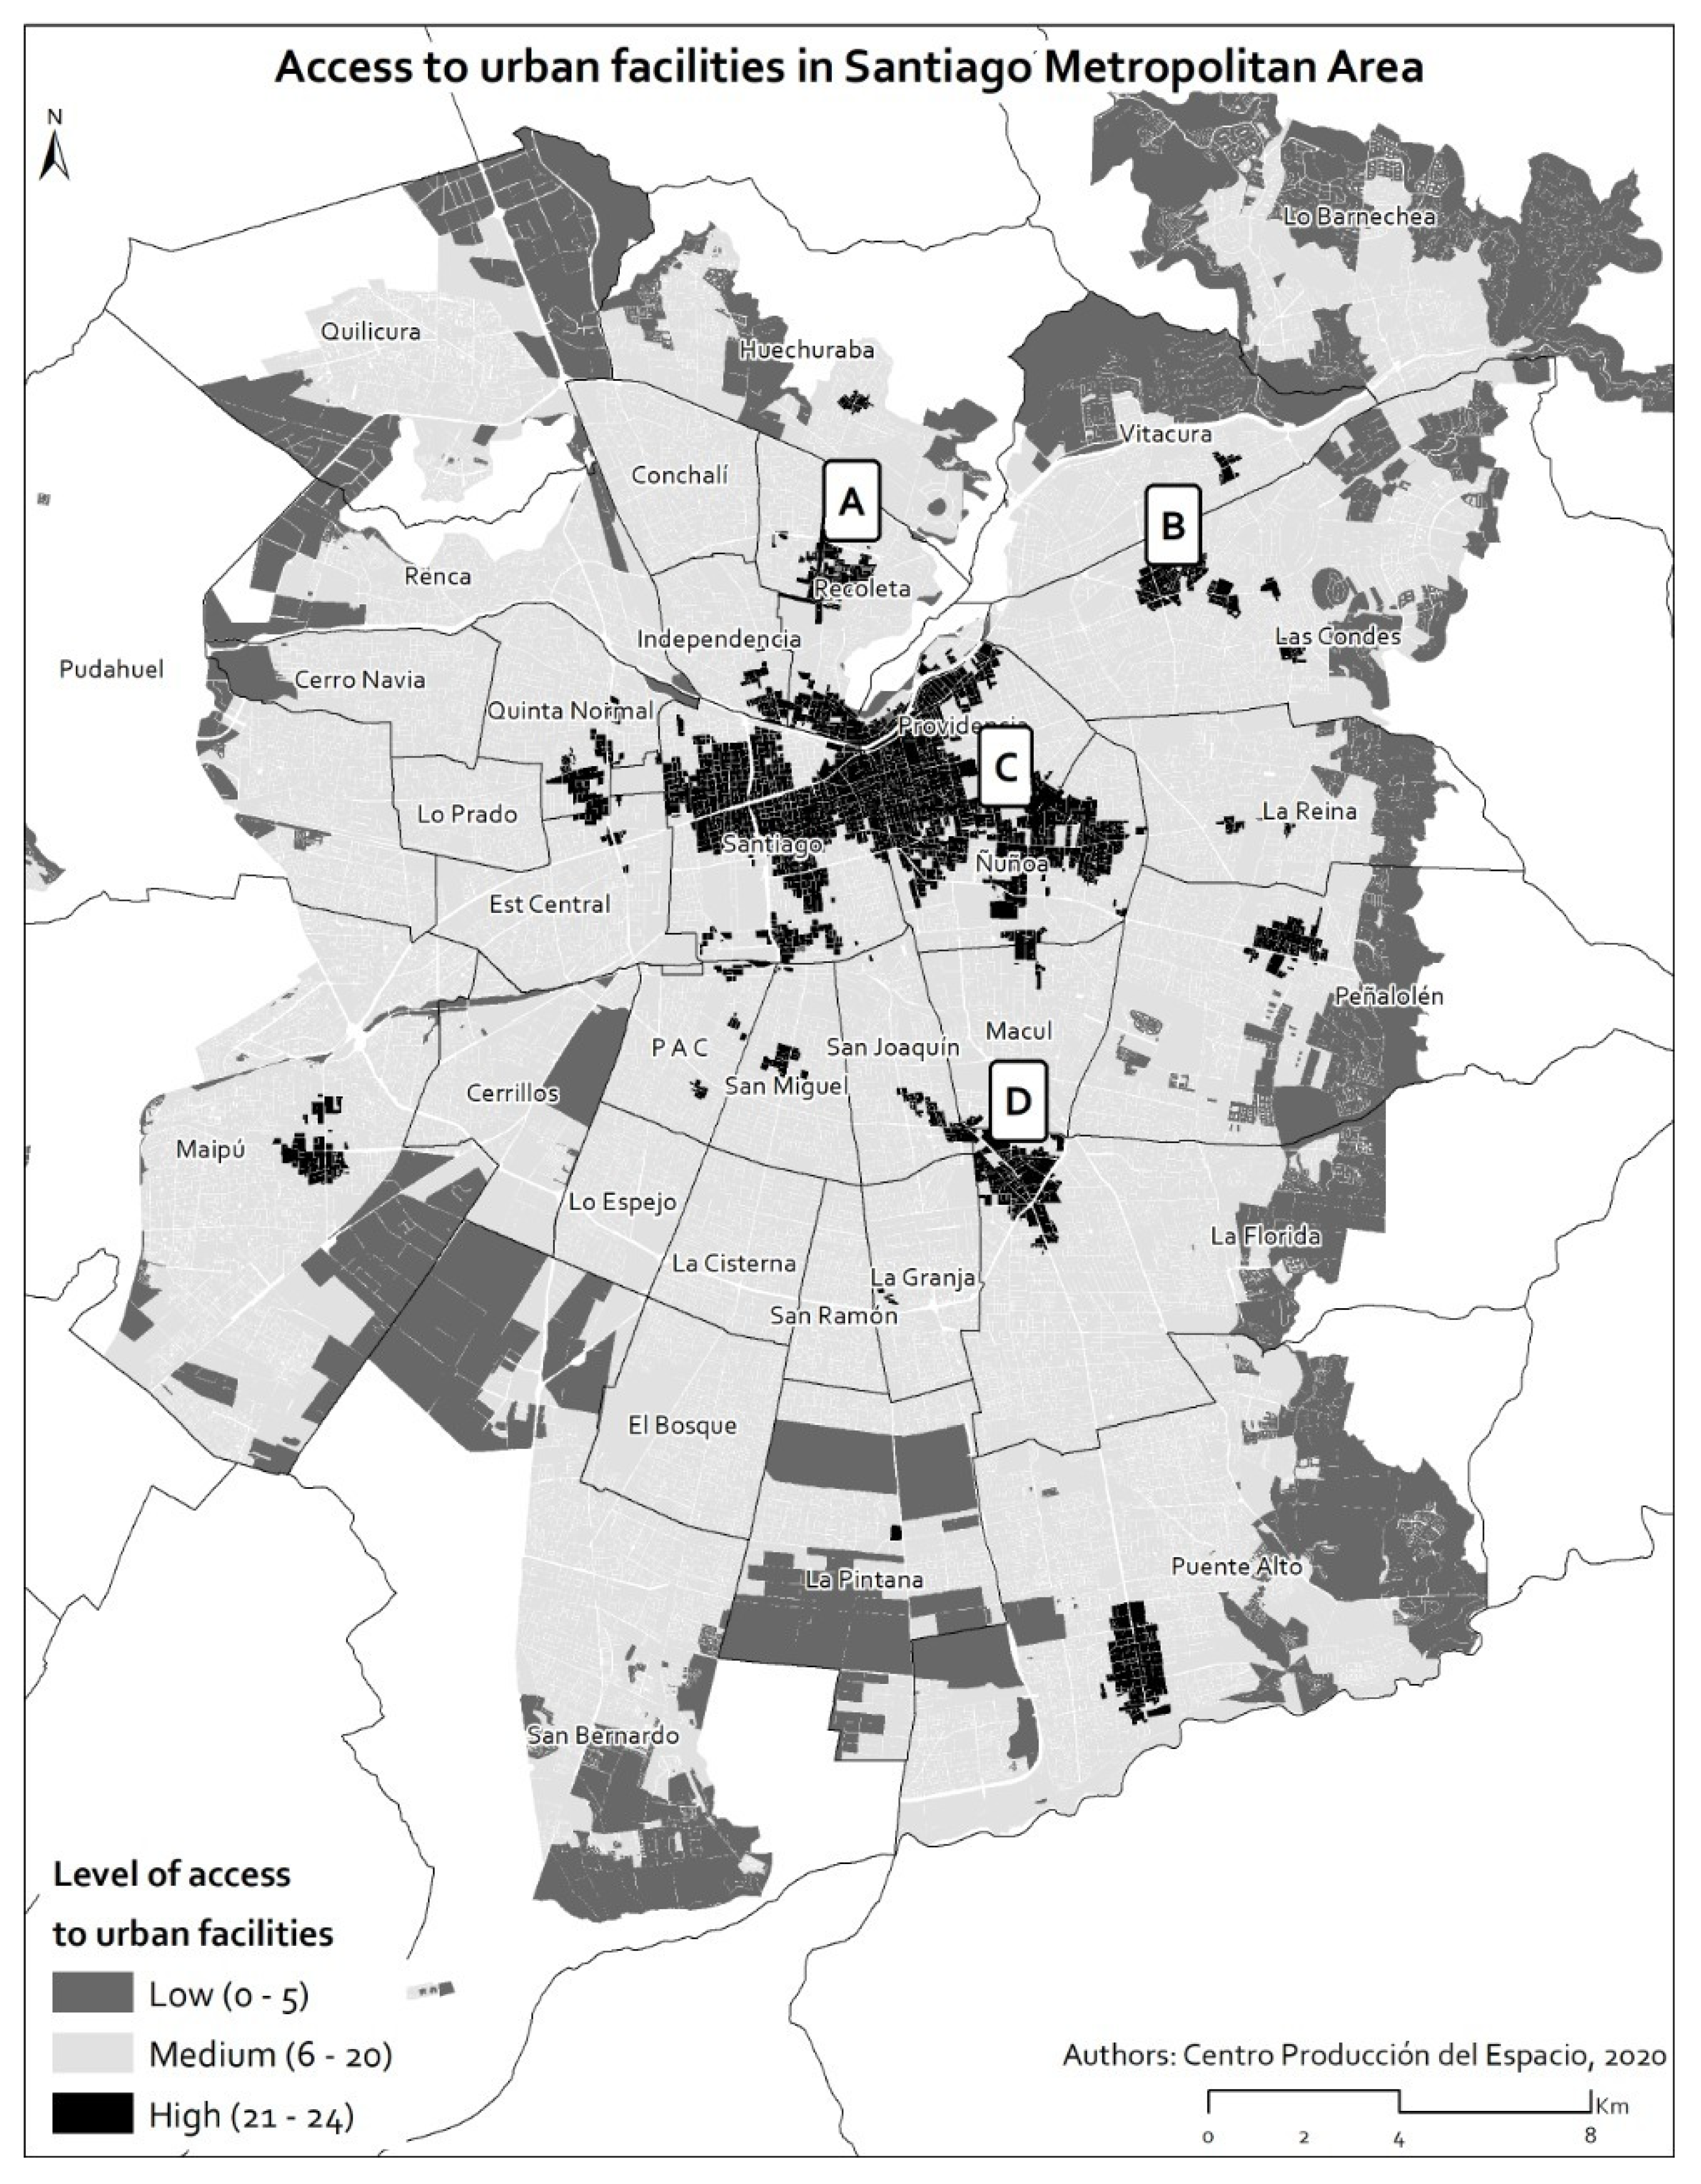
Figure A1.
Location of neighborhoods with good high access to essential urban functions. (A) Recoleta; (B) Las Condes; (C) Nunoa; (D) La Florida. Source: authors.
Figure A1.
Location of neighborhoods with good high access to essential urban functions. (A) Recoleta; (B) Las Condes; (C) Nunoa; (D) La Florida. Source: authors.

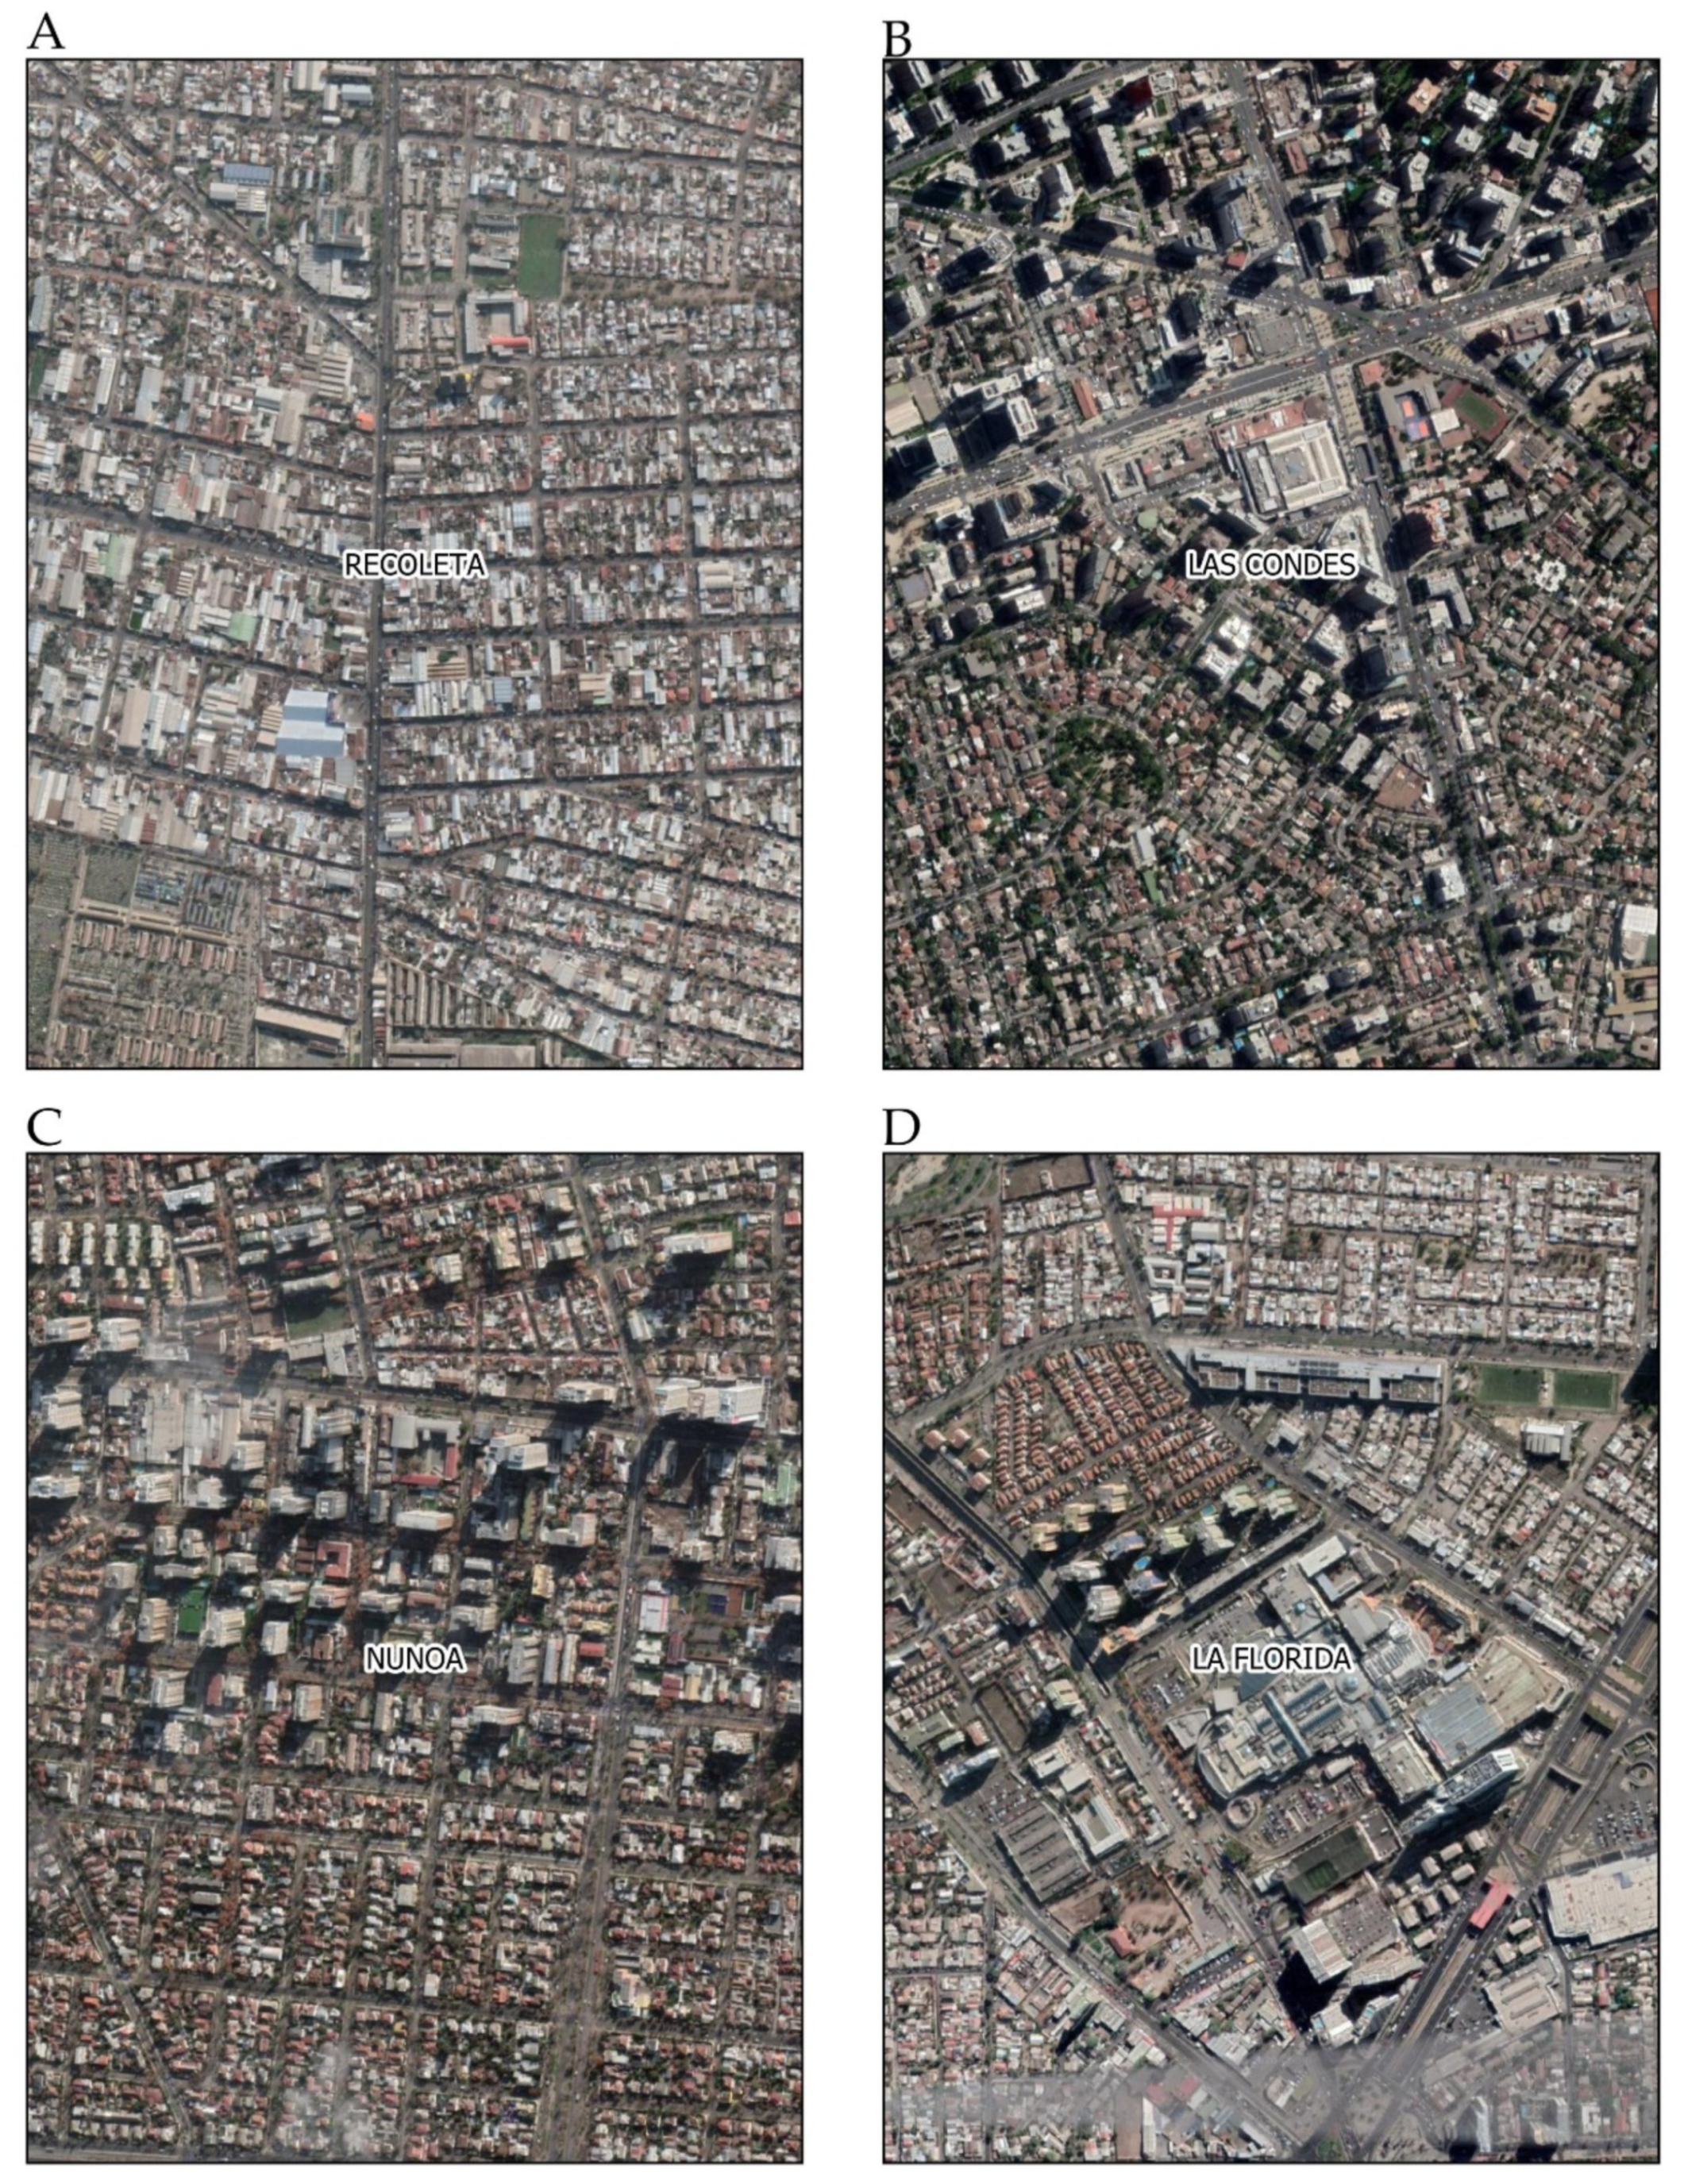
Figure A2.
Neighborhoods indicated in Figure A1. Source: Google Earth 2020.
Figure A2.
Neighborhoods indicated in Figure A1. Source: Google Earth 2020.

References
- Hidalgo, A. “Le programme d’Anne Hidalgo,” Ville du 1/4 h. 2020. Available online: https://annehidalgo2020.com/ (accessed on 31 August 2020).
- Pucher, J.; Dijkstra, L. Promoting safe walking and cycling to improve public health: Lessons from the Netherlands and Germany. Am. J. Public Health 2003, 93, 1509–1516. [Google Scholar] [CrossRef] [PubMed]
- Southworth, M. Designing the walkable city. J. Urban Plan. Dev. 2005, 131, 246–257. [Google Scholar] [CrossRef]
- Ghel, J. Life between Buildings: Using Public Space; Island Press: Washington, DC, USA; Covel, CA, USA; London, UK, 2006. [Google Scholar]
- Murthy, V.H. Making our communities walkable for older adults. Public Health Rep. 2015, 130, 424–425. [Google Scholar] [CrossRef] [PubMed] [Green Version]
- Muxi, Z.; Casanovas, R.; Cicoletto, A.; Fonseca, M.; Gutierrez, B. ¿Qué aporta la perspectiva de género al urbanismo? Feminismos 2011, 17, 105–129. [Google Scholar] [CrossRef]
- Weng, M.; Ding, N.; Li, J.; Jin, X.; Xiao, H.; He, Z.; Su, S. The 15-minute walkable neighborhoods: Measurement, social inequalities and implications for building healthy communities in urban China. J. Transp. Heal. 2019, 13, 259–273. [Google Scholar] [CrossRef]
- Ewing, R.; Handy, S.; Brownson, R.C.; Clemente, O.; Winston, E. Identifying and Measuring Urban Design Qualities Related to Walkability. J. Phys. Act. Heal. 2016, 3, S223–S240. [Google Scholar] [CrossRef] [PubMed]
- Rueda, S. La Supermanzana, Nueva Célula Urbana Para la Construcción de un Nuevo Modelo Funcional y Urbanístico de Barcelona; BCN Ecología: Barcelona, Spain, 2016. [Google Scholar]
- Mejía, E.C.; Duarte, C.M. Los sectores económicos intensivos en conocimiento y sus formas de localización en el territorio metropolitano: Un estudio para la región metropolitana de Barcelona. Arch. City Environ. 2011, 6, 223–252. [Google Scholar]
- Bereitschaft, B. Equity in neighbourhood walkability? A comparative analysis of three large U.S. cities. Local Environ. 2017, 22, 859–879. [Google Scholar] [CrossRef]
- Riggs, W. Inclusively walkable: Exploring the equity of walkable housing in the San Francisco Bay area. Local Environ. 2016, 21, 527–554. [Google Scholar] [CrossRef]
- Knight, J.; Weaver, R.; Jones, P. Walkable and resurgent for whom? The uneven geographies of walkability in Buffalo, NY. Appl. Geogr. 2018, 92, 1–11. [Google Scholar] [CrossRef]
- Berry, B.J.L.; Garrison, W.L. The functional bases of the central place hierarchy. Econ. Geogr. 1958, 34, 145. [Google Scholar] [CrossRef]
- Taylor, L. How South America Became the New Centre of the Coronavirus Pandemic. New Sci. 2020. Available online: https://www.newscientist.com/article/mg24632863-300-how-south-america-became-the-new-centre-of-the-coronavirus-pandemic/ (accessed on 31 August 2020).
- OECD. OECD Urban Policy Reviews, Chile 2013; OECD Publishing: Paris, France, 2013. [Google Scholar]
- Segregación Residencial Socioeconómica y Desigualdad en las Ciudades Chilenas. Available online: https://www.cl.undp.org/content/chile/es/home/library/poverty/documentos_de_trabajo/segregacion-residencial-socioeconomica-y-desigualdad-en-las-ciud.html (accessed on 30 July 2020).
- Jolliffe, I.T. Principal Components Analysis; Springer: New York, NY, USA; Berlin/Heidelberg, Germany, 2002. [Google Scholar]
- Lalloué, B.; Monnez, J.-M.; Padilla, C.; Kihal-Talantikite, W.; Le Meur, N.; Zmirou-Navier, D.; Deguen, S. A statistical procedure to create a neighborhood socioeconomic index for health inequalities analysis. Int. J. Equity Health 2013, 12, 1–12. [Google Scholar] [CrossRef] [Green Version]
- Lawner, M. Memorias de un Arquitecto Obstinado; Ediciones Universidad del Bío-Bío: Concepción, Chile, 2013. [Google Scholar]
- Vergara-Perucich, J.-F.; Encinas, F.; Aguirre-Núñez, C.; Truffello, R.; de Guevara, F.L. Contribución a la Economía Política de la Vivienda en Chile; RIL Editores: Santiago, Chile, 2020. [Google Scholar]
| 1 | The axis Alameda-Providencia is the main urban centrality of the Metropolitan Area of Santiago. |
Figure 1.
Access to Local Services in the Santiago Metropolitan Area. Source: authors.

Figure 2.
Access to Metropolitan Services in the Santiago Metropolitan Area. Source: authors.

Figure 3.
Access to Public Spaces in the Santiago Metropolitan Area. Source: authors.

Figure 4.
Access to Educational Spaces in the Santiago Metropolitan Area. Source: authors.

Figure 5.
Access to Health and Care in the Santiago Metropolitan Area. Source: authors.

Figure 6.
Access to Green Areas in the Santiago Metropolitan Area. Source: authors.

Figure 7.
Access to Essential Urban Functions in the Santiago Metropolitan Area. Source: authors.

Table 1.
Essential urban functions included in the study in hierarchical order. Source: authors based on public information available from Government Sources, Servicio de Impuestos Internos, Observatorio de Ciudades UC and Open Street Maps.
Table 1.
Essential urban functions included in the study in hierarchical order. Source: authors based on public information available from Government Sources, Servicio de Impuestos Internos, Observatorio de Ciudades UC and Open Street Maps.
| Variable | Source |
|---|---|
| Kindergarten | Ministry of Education |
| Elementary School | Ministry of Education |
| General Doctor Practice | Ministry of Health |
| Pharmacy | Ministry of Health |
| Green Areas | Ministry of Housing and Urbanism |
| Bus Stop | Ministry of Transports and Communications |
| Shops | Servicio de Impuestos Internos |
| Places of Worship | Open Street Maps |
| Book Stores | Open Street Maps |
| Banks | Open Street Maps |
| Secondary School | Ministry of Education |
| Medical Centre | Ministry of Health |
| Squares and Plazas | Ministry of Housing and Urbanism |
| Metro Station | Ministry of Transports and Communications |
| Administrative Services | Observatorio de Ciudades UC |
| Cultural Services | Ministry of Culture |
| Library | Ministry of Culture |
| Sport Facilities | Open Street Maps |
| Court | Open Street Maps |
| Veterinarian | Open Street Maps |
| Supermarket | Open Street Maps |
| Street Market | Observatorio de Ciudades UC |
| Hardware Store | Open Street Maps |
| Hospital | Ministry of Health |
| Police | Ministry of Internal Security |
| Fire Fighters | Ministry of Internal Security |
| Museum | Ministry of Culture |
| Cinema and Theatre | Ministry of Culture |
Table 2.
Kaiser–Meyer–Olkin (KMO) test results. Source: authors.
| Level | KMO Results | Bartlett Sphericity (Chi2) | Sig. |
|---|---|---|---|
| Primary | 0.724 | 139,252.216 | 0.000 |
| Secondary | 0.852 | 217,642.393 | 0.000 |
| Tertiary | 0.748 | 123,770.135 | 0.000 |
Table 3.
Principal component analysis results per level based on the Varimax rotated scores. Source: authors.
Table 3.
Principal component analysis results per level based on the Varimax rotated scores. Source: authors.
| # | Variables | F_LocalServices | F_MetropolitanServices | F_LocalPublicSpaces | F_Education | F_HealthandCare | F_GreenAreas |
|---|---|---|---|---|---|---|---|
| 1 | Kindergarten | 0.054 | 0.095 | 0.169 | 0.433 | 0.057 | 0.346 |
| 2 | Elementary School | −0.015 | 0.036 | 0.177 | 0.731 | 0.247 | −0.067 |
| 3 | Secondary School | 0.134 | 0.256 | 0.044 | 0.774 | −0.111 | 0.020 |
| 4 | General Doctor Practice | −0.061 | −0.038 | 0.146 | 0.032 | 0.472 | 0.065 |
| 5 | Medical Centre | 0.065 | 0.046 | −0.071 | −0.038 | 0.588 | 0.352 |
| 6 | Hospital | 0.079 | 0.768 | 0.008 | 0.080 | −0.042 | 0.045 |
| 7 | Pharmacy | 0.867 | 0.156 | 0.024 | 0.150 | 0.035 | 0.006 |
| 8 | Police | 0.068 | 0.505 | 0.291 | 0.069 | 0.259 | −0.374 |
| 9 | Fire Fighters | 0.359 | 0.579 | 0.148 | 0.348 | 0.139 | −0.082 |
| 10 | Green Areas | −0.077 | −0.174 | 0.494 | −0.040 | 0.028 | 0.526 |
| 11 | Squares and Plazas | 0.129 | 0.127 | −0.009 | 0.068 | 0.108 | 0.649 |
| 12 | Metro Station | 0.428 | 0.442 | −0.099 | 0.257 | 0.154 | −0.056 |
| 13 | Bus Stop | 0.176 | 0.089 | 0.614 | 0.260 | 0.243 | 0.085 |
| 14 | Shops | 0.399 | 0.419 | 0.098 | 0.263 | 0.203 | −0.184 |
| 15 | Administrative Services | 0.765 | 0.436 | −0.062 | 0.175 | 0.041 | 0.044 |
| 16 | Places of Worship | 0.014 | 0.030 | 0.161 | 0.158 | 0.566 | −0.250 |
| 17 | Cultural Services | 0.571 | 0.632 | −0.106 | 0.073 | 0.039 | 0.139 |
| 18 | Book Stores | 0.828 | 0.183 | −0.046 | −0.059 | 0.000 | 0.061 |
| 19 | Library | 0.561 | 0.474 | −0.020 | 0.029 | 0.116 | 0.060 |
| 20 | Museum | 0.418 | 0.762 | −0.111 | 0.154 | −0.020 | 0.076 |
| 21 | Cinema and Theatre | 0.427 | 0.786 | −0.115 | 0.085 | −0.023 | 0.135 |
| 22 | Sport Facilities | −0.089 | −0.115 | 0.770 | −0.032 | 0.058 | 0.163 |
| 23 | Court | 0.151 | 0.128 | 0.183 | 0.060 | 0.737 | 0.040 |
| 24 | Veterinarian | 0.378 | 0.158 | −0.106 | 0.434 | 0.077 | 0.039 |
| 25 | Supermarket | 0.750 | 0.357 | −0.066 | 0.252 | −0.025 | 0.068 |
| 26 | Banks | 0.913 | 0.059 | −0.026 | −0.046 | −0.007 | 0.011 |
| 27 | Street Market | −0.098 | 0.025 | 0.899 | 0.082 | 0.146 | −0.103 |
| 28 | Hardware Store | −0.098 | 0.025 | 0.899 | 0.082 | 0.146 | −0.103 |
Table 4.
Results of the assessment of access to functions in the Santiago Metropolitan Area per each principal component. Source: authors.
Table 4.
Results of the assessment of access to functions in the Santiago Metropolitan Area per each principal component. Source: authors.
| Variables | Population with No Access to Any Function | Population with Full Access to Functions | In between | |||
|---|---|---|---|---|---|---|
| Number | Portion | Number | Portion | Number | Portion | |
| Local Services | 667,510 | 10.98% | 300,632 | 4.94% | 5,113,739 | 84.08% |
| Metropolitan Services | 325,504 | 5.35% | 475,927 | 7.83% | 5,280,450 | 86.82% |
| Local Public Spaces | 75,579 | 1.24% | 4,421,974 | 72.71% | 1,584,328 | 26.05% |
| Education | 307,209 | 5.05% | 4,450,840 | 73.18% | 1,323,832 | 21.77% |
| Health and Care | 598,554 | 9.84% | 4,151,781 | 68.26% | 1,331,546 | 21.89% |
| Green Areas | 114,396 | 1.88% | 5,055,623 | 83.13% | 911,862 | 14.99% |
| Total Access | 23,937 | 0.39% | 113,771 | 1.87% | 5,944,173 | 97.74% |
© 2020 by the authors. Licensee MDPI, Basel, Switzerland. This article is an open access article distributed under the terms and conditions of the Creative Commons Attribution (CC BY) license (http://creativecommons.org/licenses/by/4.0/).
Share and Cite
MDPI and ACS Style
Correa-Parra, J.; Vergara-Perucich, J.F.; Aguirre-Nuñez, C. Towards a Walkable City: Principal Component Analysis for Defining Sub-Centralities in the Santiago Metropolitan Area. Land 2020, 9, 362. https://doi.org/10.3390/land9100362
AMA Style
Correa-Parra J, Vergara-Perucich JF, Aguirre-Nuñez C. Towards a Walkable City: Principal Component Analysis for Defining Sub-Centralities in the Santiago Metropolitan Area. Land. 2020; 9(10):362. https://doi.org/10.3390/land9100362
Chicago/Turabian StyleCorrea-Parra, Juan, José Francisco Vergara-Perucich, and Carlos Aguirre-Nuñez. 2020. "Towards a Walkable City: Principal Component Analysis for Defining Sub-Centralities in the Santiago Metropolitan Area" Land 9, no. 10: 362. https://doi.org/10.3390/land9100362
Note that from the first issue of 2016, this journal uses article numbers instead of page numbers. See further details here.