1. Introduction
Since the beginning of the economic reform and opening-up process in China, many rural laborers have moved away to work, motivated by economic interests. This has resulted in profound changes in the family income composition and land-use patterns of rural households, as well as the differentiation of livelihood strategies [
1,
2,
3,
4]. Many of the livelihood strategies of rural households have gradually changed, from agriculturally based to non-agriculturally based [
5,
6,
7,
8,
9]. However, owing to the long-term, urban–rural dual division system (especially the household registration system), labor migration and land use in China are different from those in other countries [
4,
10]. Due to the household registration system, there are differences in pension, medical care, and children’s education between urban and rural residents, and numerous rural laborers cannot “take root” in the city; therefore, labor migration exhibits the “pendulum” flow characteristic of moving away to work at the beginning of the year and returning home at the end of the year [
11,
12,
13]. However, under the influence of the household contract responsibility system, a fragmented and scattered pattern of rural land in China has evolved, with widespread, long-term, small-scale agricultural production. Therefore, moderate land scale management has a long way to go [
14,
15]. Because of massive labor migration, many hilly rural areas lack a labor force, leading to considerable land abandonment [
16,
17].
Rural households are micro-organizational systems composed of different family members, and the decision-making behaviors of these households are deeply influenced by the characteristics of family resource endowments [
18,
19,
20,
21,
22]. Affected by special labor migration characteristics and land-use patterns, the livelihood capital portfolio and livelihood strategy selection of rural households show different characteristics [
23,
24,
25]. Many empirical studies have shown that their livelihood capital allocation can significantly affect their livelihood strategy selection [
26,
27,
28]. For instance, cultivated land resources are the most important natural capital of rural households: if the cultivated land management scale is larger, rural households will invest more funds, technology, and laborers in agricultural production, and thus the livelihood strategies of rural households will be more agriculturally based [
10]. At the same time, a lack of natural capital can make rural households look for other ways of making a living to realize the diversification of livelihoods [
28,
29]. Some studies have found that the family life cycle can affect livelihood strategy selection of rural households by affecting family labor resource allocation, which can lead to the adjustment of the structure of agricultural production [
10,
30]. With the continuous evolution of family life cycles of rural households, the main decision makers, population quantity, quality of labor force, ability to resist risks, production, and living demands will all change. The above factors may have an influence on the livelihood strategy optimization of rural households from different aspects [
10]. The influence of the family life cycle and scale of land management on livelihood strategy selection in China is a key issue of the present study. Research on this issue is of great significance for understanding the development and characteristics of the behaviors of Chinese rural households, guiding the rational allocation of labor resources and land resources, and realizing the optimization of family livelihood strategies.
Sorokin first proposed the concept of the family life cycle, which refers to the process of the birth, development, and death of a family [
31]. Since the 1990s, more scholars have included consideration of the family life cycle into their analyses of rural households’ economic models [
10]. The research topics have involved the relationship between the family life cycle and land-use pattern [
32,
33]; the relationship among the family life cycle, rural households’ income, and consumption [
34,
35,
36,
37]; the relationship among the family life cycle, farm scale, and agricultural product output [
38,
39,
40,
41]; the relationship between the family life cycle and the ecological environment [
42,
43,
44]; and the relationship between the family life cycle or land scale and non-agricultural employment [
10,
30]. The above studies have provided abundant theoretical and empirical information to understand the relationship between the family life cycle and the decision-making behaviors of rural households. However, in general, previous studies on the effect of the family life cycle on the behaviors of rural households have been undertaken only for a relatively short period and the research field is relatively narrow. China’s research on rural households’ family life cycles and their decision-making behaviors (such as livelihood strategy selection) has only just commenced and there is little literature in the field. Therefore, it is vital to carry out relevant research, especially microscopic empirical research based on large sample survey data.
2. Data and Methods
2.1. Data Source
The data used in the present study were obtained mainly from the China Labor-Force Dynamics Survey (CLDS), which was implemented throughout China from 2014 by the Center for Social Science Survey of Sun Yat-sen University. The survey focused on urban and rural labor migration and its effects, including labor mobility, land-use change, and sustainability of livelihood for rural households. The survey adopts a multi-stage, multi-level probability sampling method to obtain large sample data that is nationally representative. For a detailed introduction to the dataset, see
http://css.sysu.edu.cn. Because this study only focuses on the correlation among land management scale, family life cycle, and the livelihood strategy selection of rural households, we have only selected rural households sampled from rural communities. After the basic screening of the data, samples from 8031 rural households in 27 provinces were obtained for subsequent analysis. See
Appendix A for the sample distribution of each sample province.
2.2. Methods
2.2.1. Selection and Definition of Model Variables
The objective of the present study was to explore the correlations among land management scale, family life cycle, and the livelihood strategy selection of rural households. Household livelihood strategy selection is the dependent variable of the study. Scholars often refer to the division standard of the rural fixed observation point office of the Ministry of Agriculture, it was measured by the proportion of agricultural cash income in the total family cash income. It is reasonable to divide a continuous variable into a multi-category variable, but some information will be lost. To better reflect the actual situation of rural households’ livelihood strategies, this study measured it by using the proportion of agricultural cash income in total household cash income. The land management scale and family life cycle of rural households were the core independent variables. Land management scale refers to the land that has been transferred to households after deducting the land that has been transferred out and adding the land that has been transferred in. Family life cycle reflects the changing dynamics of family circulation from formation to disintegration. Different studies have different approaches to the measurement of the family life cycle [
10]. The international common practice is to divide the family life course into six stages: formation, expansion, stability, contraction, empty nest, and disintegration. These stages are characterized by seven events, namely the first marriage, birth of the first child, birth of the last child, leaving home of the first child, leaving home of the last child, death of one spouse, and death of the other (e.g., [
32,
33,
45,
46,
47]). However, the reality of rural China is different from that of other countries worldwide [
10,
48]. In rural China, the establishment of a new family does not begin with marriage, but begins with financial separation. For example, when children reach the age of marriage, they are usually not financially independent and their marriage is usually handled by their parents. After marriage, they live together with their parents for a (long or short) period rather than live independently. Only when they are financially independent and live alone will it mean the formation and establishment of a new family. For another example, when a couple in a family loses the ability to work due to old age, their original family may face disintegration. Many elderly people, especially elderly persons with no family, choose to live with a married child and gradually integrate into the family dominated by the child. On the basis of a realistic background of rural China, according to the combination of family members and the age of children, the present study established the rural family life cycle model (
Table 1).
In addition, to reduce the impact of missing important variables on model estimation results, consistent with the research of [
49,
50,
51,
52,
53,
54,
55], the present study also added several variables that affect the livelihood strategy selection as control variables, which included human capital (e.g., the age and education level of the household head), physical capital (e.g., present value of fixed assets and agricultural assets), financial capital (e.g., whether rural households buy funds, stocks and bonds), social capital (e.g., annual gift expenditure), regional topography, and other information (
Table 2).
2.2.2. Theoretical Analysis
The theory of sustainable livelihoods and the new economics of labor migration (NELM) argue that rural households are rational and would rationally allocate livelihood assets and optimize livelihood strategies in accordance with the family situation and market environment [
7]. However, from the perspective of the maximization of the benefits of rural households (i.e., income composition), the factors that affect rural households’ realization of the optimal combination of family livelihood capital and the optimal selection of livelihood strategies are closely related to the family life cycle. First, the rational allocation of family labor resources (i.e., the proportion of family laborers engaging in agricultural production, the proportion of family laborers engaging in part-time employment and the proportion of family laborers conducting non-agricultural migration) can have an influence on a family’s agricultural income and wage income, and can be affected by the current period of the family life cycle. For example, for families in the burden period, to take better care of the elderly and children, laborers usually choose to work nearby or not to go out to work; whereas, for families in the starting period, laborers can migrate far from home to maximize wage income. Second, as an important characteristic indicator of natural capital, the land management scale can have an effect on the family’s agricultural income and can also be influenced by the period of the family life cycle. The scale of land management of rural households depends on the area of the land allocated to families by the household contract system; conversely, it depends on land transfer. However, land transfer is also affected by the family life cycle. Generally speaking, for families with minor children and elderly members, the average household land management scale is relatively large; therefore, the land needs to be transferred in. In contrast, in families without minor children or elderly members, more laborers migrate (go out to work), and the average household land management scale is relatively small; therefore, the land needs to be transferred out.
On the basis of the above analysis, under the guidance of the theory of sustainable livelihoods and NELM, the present study used large sample survey data from rural China. It constructed Tobit econometric models to explore the correlations between the family life cycle or land management scale and livelihood strategy selection of rural households to provide a basis for the formulation of policies relating to the rational allocation of livelihood assets and the optimization of livelihood strategies.
2.2.3. Estimation Strategy
Rural households’ livelihood strategy selection, the dependent variable of this study, is measured by the proportion of agricultural cash income in the total family cash income, and this variable is a continuous variable between 0 and 1. On the basis of the characteristics of the variable, this study uses Tobit econometric models to estimate the models. At the same time, considering that the core independent variable of the model may be an endogenous variable, the IV-Tobit model was used for a robustness test. The formula is described according to IV-Tobit settings. The estimated equation is as follows:
Among them, is the observable explained variable (rural household’s livelihood strategy), is the unobservable latent variable, and is the endogenous explanatory variable in the model (rural household’s land management scale). Assuming that the perturbation term () is subject to a two-dimensional normal distribution with an expected value of 0 and is independent of and , the parameters of the model can then be estimated by MLE estimation. Stata 13.0 is adopted in the implementation process of the whole model.
3. Results
3.1. Descriptive Statistical Analysis
Table 2 shows definitions of model variables and descriptive statistical analyses. The average proportion of rural households’ agricultural cash income in the total family cash income was 33.69%, and the average land management scale was 0.38 ha, whereas the proportions of the sample rural households in the five periods of the family life cycle were relatively uniform. In the control variables, regarding human capital, the average age of household heads was 53.81 years, and 12% of household heads had high school level education or above, on average. In terms of social capital, 18% of rural households contained Party members and the average annual monetary gift expenditure was 5540.65 Yuan. For physical capital, the present values of the agricultural assets and other valuable fixed assets were 800 Yuan and 43,200 Yuan, respectively; regarding social capital, in the past two years, 7% and 8% of the sample rural households borrowed money from formal financial institutions and from relatives and friends, respectively. The average distance between the rural household’s place of residence and the nearest township center was 7.12 km.
Table 3 shows the livelihood strategies of rural households with different land scales and their differences. The land management scale of rural households was primarily small-scale, with widespread small-scale agricultural production. Among the 8031 rural households sampled, 3545 (or 44.14%) had a land management scale of 0–0.20 ha, 1827 (or 22.75%) had a land management scale of 0.21–0.34 ha, and 229 (or 2.85%) had a land management scale of 1.35 ha or more. With the continuous expansion of the land management scale, the proportion of agricultural cash income in the total family income in the livelihood strategies increased. For instance, the average proportion of agricultural cash income in the total family cash income of rural households with a land management scale of 0.21–0.34 ha was 26.12%, whereas the average proportion of agricultural cash income in the total family cash income of rural households with a land management scale of 1.35 ha or more was 61.81%.
Table 4 shows the livelihood strategies of rural households in different family life cycles and their differences. There were relatively more rural households in the middle period of the family life cycle and relatively few rural households in the starting and empty nest periods. Specifically, among the 8031 rural households sampled, there were 855, 492, and 2395 in the starting period, empty nest period, and rearing period, which account for 10.65%, 6.13%, and 29.83% of the total sample, respectively. In terms of livelihood strategies of rural households in different life cycles, the proportions of agricultural cash income in the total family cash income in the stable and empty nest periods were relatively large, reaching 40.51% and 38.92%, respectively, whereas the proportion in the maintenance period was only 23.83%.
3.2. Spatial Distribution Analysis Results
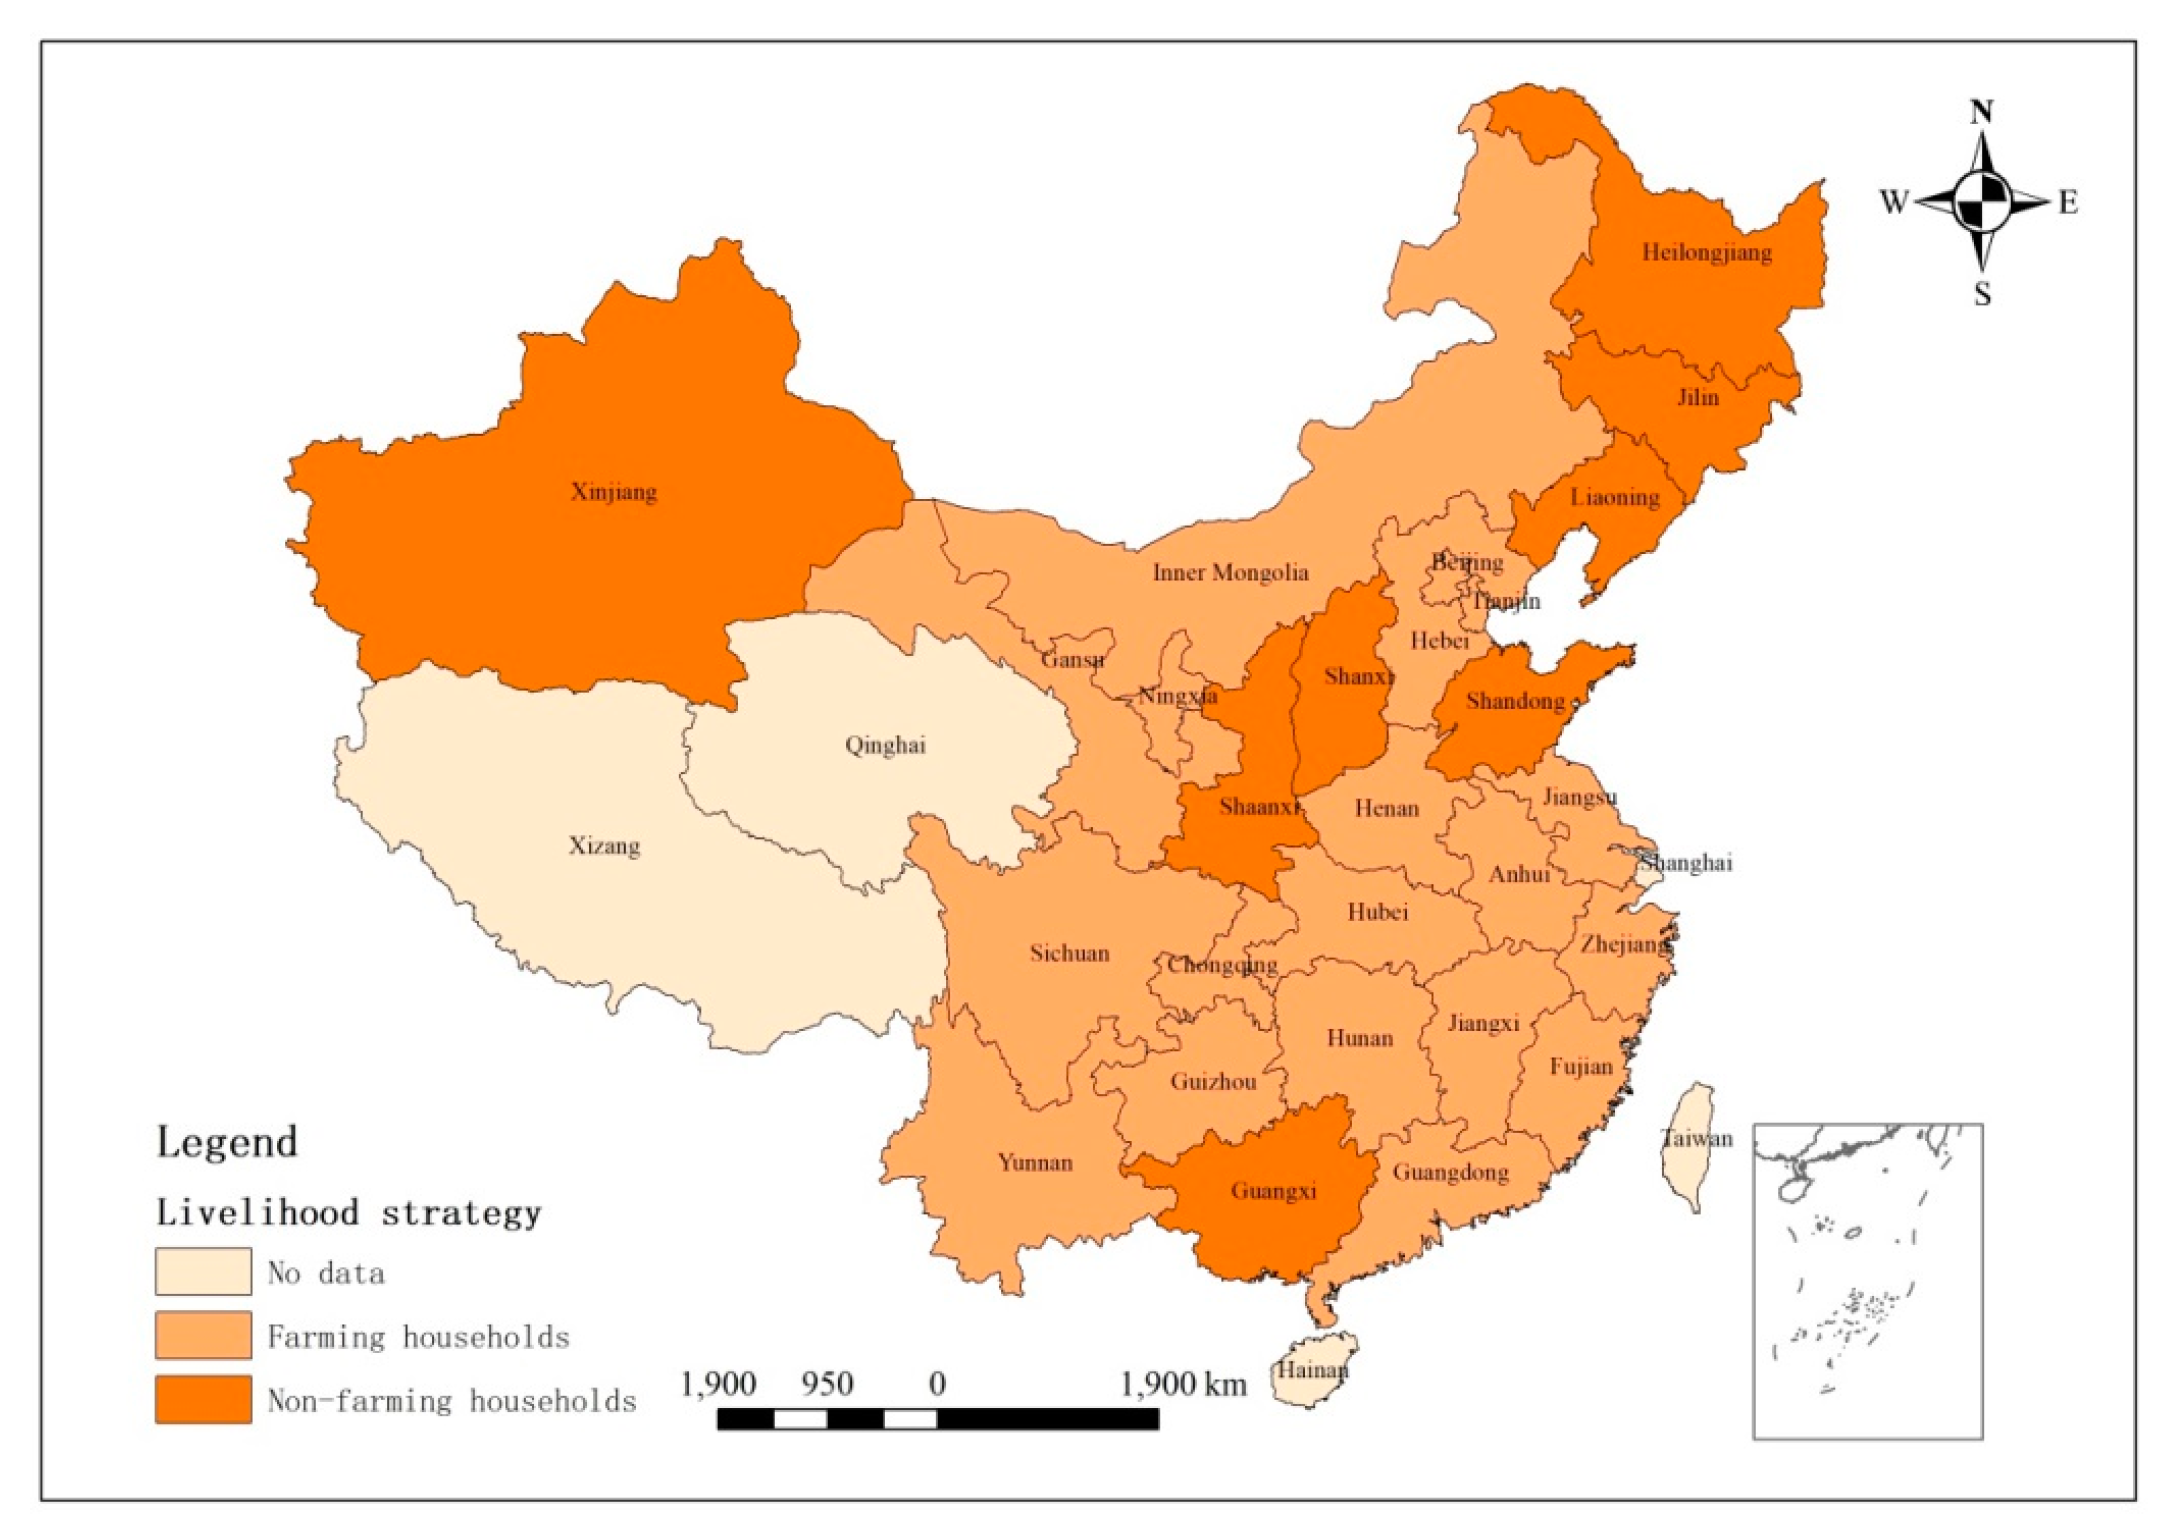
3.2.1. Spatial Distribution of Livelihood Strategy Selection of Rural Households
Figure 1 shows the spatial distribution of the livelihood strategy selection of rural households. If agricultural cash income, accounting for 50% of the total family income, was taken as the dividing line between agriculturally-based and non-agriculturally-based livelihood strategies, the predominant livelihood strategies of rural households in most sample provinces (cities) were classified as non-agriculturally-based livelihood strategies. The sample provinces of Xinjiang, Heilongjiang, Jilin, Liaoning, Shandong, Shaanxi, Shanxi, and Guangxi had predominantly agriculturally-based livelihood strategies, and the proportion of agricultural cash income in the total family cash income was more than 50%. However, in other provinces, the livelihood strategies were non-agriculturally-based and the proportion of agricultural cash income in the total family cash income did not exceed 50%.
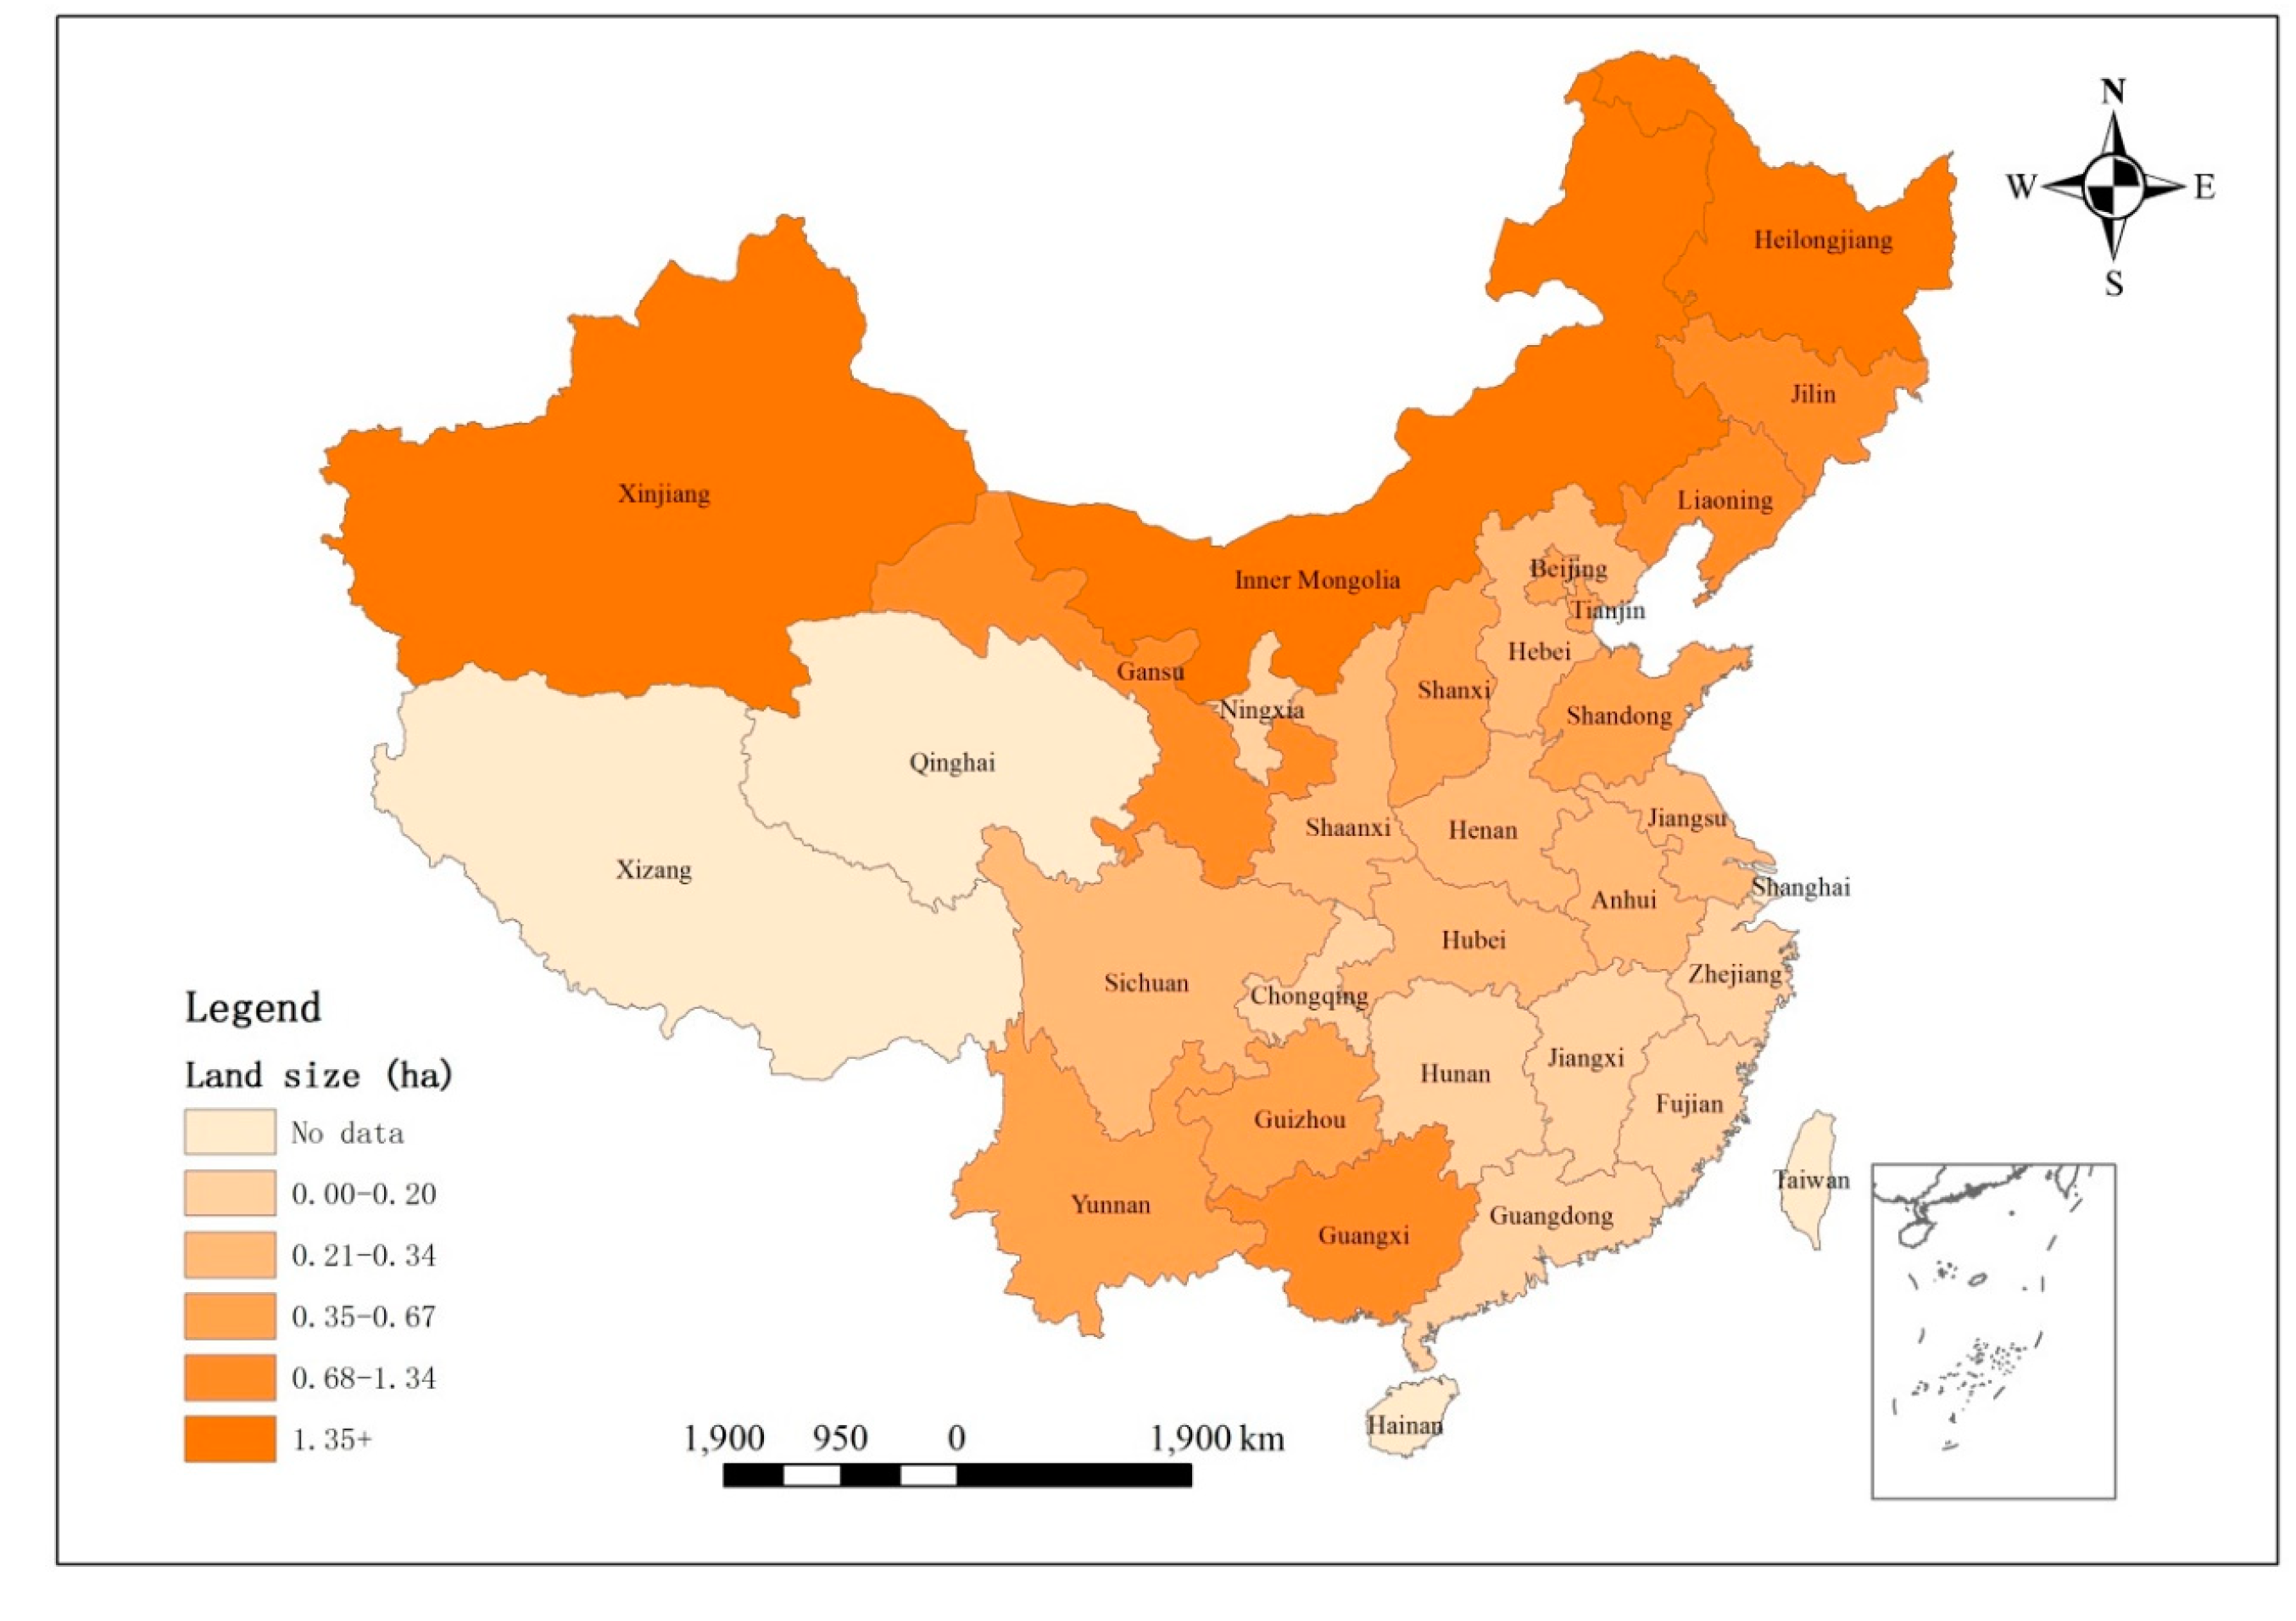
3.2.2. Spatial Distribution of Land Management Scale of Rural Households
Figure 2 shows the spatial distribution of land management scale of rural households. In a small number of provinces (cities), this scale was relatively large (more than 0.67 ha); whereas in most sample provinces (cities), this scale was less than 0.67 ha. The land management scale of rural households in Heilongjiang was the largest (with an average of more than 1.35 ha), and the land management scale of rural households in Xinjiang and Inner Mongolia was also relatively large (with an average of 0.68–1.34 ha). However, the land management scale of rural households in Fujian and Guangdong was the smallest (with an average of less than 0.20 ha).
3.3. Multivariable Results
Table 5 shows the regression results for the land management scale, family life cycle, and livelihood strategy selection. Model 1 only included the core independent variables (land management scale and family life cycle), Model 2 also included the control variables, and Model 3 reported the marginal effect of each independent variable on the dependent variable. From the overall significance test results (F value), the three models were all significant at the level of 0.01, indicating that at least one independent variable was significantly correlated with the dependent variable. The analysis of the overall model results was based on Model 3.
As shown in
Table 5, the land management scale of rural households was positively correlated with their livelihood strategy selection, and if the land management scale were larger, the proportion of agricultural cash income in the total family cash income would be larger. To be specific, when other conditions remain unchanged, with every 1 ha increase in rural households’ land management scale, the proportion of agricultural cash income in the total family cash income increased, on average, by 3.7%. In terms of the correlations between family life cycle and rural households’ livelihood strategy selection, in comparison with rural households in the empty nest period, the proportion of agricultural cash income in the total family cash income of rural households in other family life cycles was relatively small. Specifically, for rural households in the starting period, rearing period, burden period, stable period, and maintenance period, the proportion of agricultural cash income in the total family cash income decreased, on average, by 6.8%, 6.7%, 9.2%, 3.5%, and 16.3%, respectively.
With regard to the correlations between the control variables and rural households’ livelihood strategy selection, there was a positive, inverted U-shaped correlation between the age of the household head and the livelihood strategy selection. The education level of the household heads was negatively related to the livelihood strategy selection. In terms of financial capital, the proportion of total family cash income derived from the agricultural activity for rural households who purchased funds, stocks, and bonds was relatively smaller than that for households who had not purchased funds, stocks, or bonds. Regarding physical capital, the present value of the agricultural assets of rural households was noticeably positively correlated with the livelihood strategy selection, whereas the present value of other valuable fixed assets was remarkably negatively related to the livelihood strategy selection. Concerning social capital, the proportion of agricultural cash income in the total family cash income of rural households who borrowed money through formal financial channels (i.e., banks) and informal financial channels (i.e., relatives and friends) was relatively large. Regarding location, the distance between rural households’ home and the township center was significantly positively correlated with the livelihood strategy selection and, if the distance was longer, the proportion of agricultural cash income in the total family cash income of rural households was larger. In terms of topography, when compared with rural households in plain villages, the proportion of agricultural cash income in terms of total family cash income of rural households in hilly villages and mountainous villages was relatively small.
3.4. Robustness Test
To further test the robustness of the correlations between core independent variables and dependent variable, the present study adopted the following two robustness test strategies. First, a grouping regression was conducted. Specifically, rural households were divided into two groups based on the mode of land management scale, with one group at less than or equal to 0.15 ha, and the other group at more than 0.15 ha (the average land management area of rural households was approximately 0.15 ha). Second, the possible endogenous problem of core independent variables was considered and the estimation method of instrumental variables was adopted. Specifically, the present study considered that there might be a causal relationship between the land management scale and livelihood strategy selection. In other words, the land management scale could have an impact on the livelihood strategy selection of rural households, and, in turn, the livelihood strategy selection could influence their land management scale. On the basis of this possibility, the present study used type IV Tobit models to re-estimate the models. The selection of the instrumental variables was based on the methodology described by [
6,
8,
16,
17,
56,
57], and the average land management scale of other rural households in the same village (other than this rural household) was taken as the land management scale of this rural household to obtain the instrumental variables.
As shown in
Table 6, no matter which robustness test strategy was adopted, the correlations between the land management area or family life cycle and livelihood strategy selection were almost consistent with
Table 5, the only differences being in the coefficients. Therefore, the results from this study are robust and credible.
4. Discussion
On the basis of a large sample size survey of data from 27 provinces in China, from the perspective of rural households’ family life cycle, combined with spatial GIS (Geographic Information System) analysis, the present study constructed Tobit models to explore the correlations between land management scale or family life cycle and livelihood strategy selection of rural households. The research perspective is novel and the spatial analysis of GIS has its own characteristics. The research results were more in line with the reality of rural China and have strong practical significance. The present study effectively dealt with the endogenous problem caused by the two-way causality between land management scale (the core independent variable) and livelihood strategy selection, and found that the results remained robust.
Rural households’ livelihood strategy selection and the driving factors in this selection have always been a research hotspot in geography, management, economics, and other disciplines. There are similarities and differences between the results of the present study and the findings of similar studies. For instance, in line with the findings from [
29,
51,
52,
58], the present study found that the land management scale of rural households had a strong positive correlation with their livelihood strategy selection, which is consistent with logic and common sense. If the land management scale is larger, then the proportion of agricultural income in the total family income will be larger, and the family livelihood strategies will be more inclined to be agricultural-based. At the same time, the results of the present study were different from the findings of [
58], who found that, for every one period of improvement in the family life cycle of rural households, the proportion of the total income originating from agricultural activity increased by 0.14. The present study also found that the livelihood strategy selection was closely related to the periods of the family life cycle; however, the degree of influence on their livelihood strategies was different for different periods of the family life cycle. For example, this study found that, in comparison with rural households in empty nest period, for rural households in the starting period, rearing period, burden period, stable period, and maintenance period, the proportions of agricultural cash income in the total family cash income decreased, on average, by 6.8%, 6.7%, 9.2%, 3.5%, and 16.3%, respectively. Additionally, similar to most existing studies, this study also found a significant correlation between rural household’s livelihood capital and their livelihood strategies. For example, this study found that the education level of the household heads was markedly negatively related to the livelihood strategy selection; the proportion of total family cash income derived from the agricultural activity for rural households who purchased funds, stocks, and bonds was relatively smaller than that for households who had not purchased funds, stocks, or bonds.
With the development of a social economy, China’s rural areas are facing unprecedented challenges. The two most significant challenges are a massive loss of rural labor force and the fragmentation of land management scale. However, China’s rural areas are also facing unprecedented opportunities, especially after China put forward the “Rural Revitalization Strategy” in 2017. The present study discussed the livelihood strategy selection of rural households from the perspectives of family life cycle and moderate land management scale, which has important implications for the rational allocation of rural households’ livelihood assets and the optimization and adjustment of their livelihood strategies, which is especially important in developing countries.
The present study has presented some new ideas; however, there are still deficiencies. For instance, in reality, the periods of the family life cycle change dynamically, whereas the present study only focused on the correlation between the family life cycle and livelihood strategy selection at a certain time. According to general logic, a family life cycle will not change over a short period, but will over a long period; therefore, future studies could use the panel data to quantitatively reveal the influence of changes in the family life cycle on the livelihood strategy selection of rural households.
5. Conclusions
On the basis of the above descriptive statistical analysis and regression analysis, the main conclusions of the present study are as follows:
(1) Rural households’ land management scale was primarily small-scale and, as it expanded, the proportion of the total cash income coming from agricultural activities increased. Of the 8031 rural households studied, 3545 rural households had a land management scale of 0–0.20 ha, which accounted for 44.14% (the largest) of the total sample; a relative majority of rural households were in the middle period of the family life cycle, and relatively few rural households were in the starting and empty nest periods. The proportion of the total cash income of rural households coming from agricultural pursuits while in the stable and the empty nest periods was relatively large, reaching 40.51% and 38.92%, respectively. In most provinces sampled, rural households’ livelihood strategies were non-agriculturally based, and the land management scale was mainly less than 0.67 ha.
(2) Rural households’ land management scale positively correlated with their livelihood strategy selection. When other conditions remained unchanged, with every 1 ha increase in land management scale, the proportion of agricultural cash income in the total family cash income increased, on average, by 3.7%. In comparison with rural households in the empty nest period, the proportion of agricultural cash income in total family cash income of rural households in other family life cycles was relatively small. Specifically, for rural households in the starting, rearing, burden, stable, and maintenance periods, the proportion of agricultural cash income in the total family cash income decreased, on average, by 6.8%, 6.7%, 9.2%, 3.5%, and 16.3%, respectively.
In addition to their theoretical significance, the results of the present study have definite policy implications. For instance, the land management scale of rural households has a strong positive correlation with their livelihood strategy selection, i.e., if the land management scale is larger, their livelihood strategies will be more inclined to be related to agriculture. Thus, the government should further standardize the land transfer market and relevant rules, promote the appropriate allocation of rural land resources, especially in hilly areas, to professional households or new business entities, and improve the overall welfare level of families through moderate land scale management. At the same time, the family life cycle was significantly related to the livelihood strategy selection. If a rural household’s family life cycle was more advanced, their livelihood strategy selection was more inclined to be agriculturally-based. Therefore, the government should consider providing different support policies in accordance with the periods of the family life cycle of rural households. For example, for rural households in the starting period, the government could provide vocational skills training to help them better adapt to the labor market; whereas, for rural households in the empty nest period, the government could pay more attention to their health problems (both physical and mental), and help them solve the difficult problems of agricultural production as well as increase their agricultural income and meet their basic needs.
Author Contributions
Conceptualization, K.H.; Data curation, Z.M., and Z.Y.; Formal analysis, Z.M.; Funding acquisition, D.X.; Investigation, Y.L., K.H., and W.Z.; Methodology, X.D., and Z.Y.; Resources, W.Z.; Software, Y.L.; Supervision, D.X.; Writing – original draft, D.X.; Writing – review & editing, D.X. All authors have read and agreed to the published version of the manuscript.
Funding
This research was funded by National Natural Science Foundation of China (Grant No. 41801221; No.41571527; No. 41601614; No. 41701622) and Undergraduate research interest cultivation program in 2020 of Sichuan agricultural university (No. 2020466; No. 2020465).
Acknowledgments
We gratefully acknowledge financial supports from National Natural Science Foundation of China (Grant No. 41801221; No.41571527; No. 41601614; No. 41701622) and Undergraduate research interest cultivation program in 2020 of Sichuan agricultural university (No. 2020466; No. 2020465). The authors also extend great gratitude to the anonymous reviewers and editors for their helpful review and critical comments.
Conflicts of Interest
The authors declare no conflict of interest.
Appendix A
Table A1.
Sample distribution of each sample province.
Table A1.
Sample distribution of each sample province.
| Name | Sample Size | Name | Sample Size |
|---|
| Beijing | 37 | Shandong | 617 |
| Tianjin | 36 | Henan | 497 |
| Hebei | 252 | Hubei | 282 |
| Shanxi | 141 | Hunan | 346 |
| Inner Mongolia | 104 | Guangdong | 1074 |
| Liaoning | 248 | Guangxi | 391 |
| Jilin | 140 | Chongqing | 71 |
| Heilongjiang | 141 | Sichuan | 423 |
| Jiangsu | 435 | Guizhou | 176 |
| Zhejiang | 385 | Yunnan | 247 |
| Anhui | 429 | Shaanxi | 352 |
| Fujian | 354 | Gansu | 495 |
| Jiangxi | 178 | Ningxia | 70 |
| | | Xinjiang | 110 |
References
- Liu, Y.S. Introduction to land use and rural sustainability in China. Land Use Policy 2018, 74, 1–4. [Google Scholar] [CrossRef]
- Liu, Y.S.; Li, J.T.; Yang, Y.Y. Strategic adjustment of land use policy under the economic transformation. Land Use Policy 2018, 74, 5–14. [Google Scholar] [CrossRef]
- Long, H.L.; Qu, Y. Land use transitions and land management: A mutual feedback perspective. Land Use Policy 2018, 74, 111–120. [Google Scholar] [CrossRef]
- Long, H.L.; Ge, D.Z.; Zhang, Y.N.; Tu, S.S.; Qi, Y.; Ma, L. Changing man-land interrelations in China’s farming area under urbanization and its implications for food security. J. Environ. Manag. 2018, 209, 440–451. [Google Scholar] [CrossRef]
- Chang, X.; Liu, L.M. Characterizing rural household differentiation from the perspective of farmland transfer in eastern china using an agent based model. Hum. Ecol. 2018, 46, 875–886. [Google Scholar] [CrossRef]
- Xu, D.D.; Deng, X.; Guo, S.L.; Liu, S.Q. Labor migration and cropland abandonment in rural China: Empirical results and policy implications. J. Environ. Manag. 2019, 232, 738–750. [Google Scholar] [CrossRef]
- Xu, D.D.; Deng, X.; Guo, S.L.; Liu, S.Q. Sensitivity of Livelihood Strategy to Livelihood Capital: An Empirical Investigation Using Nationally Representative Survey Data from Rural China. Soc. Indic. Res. 2019, 144, 113–131. [Google Scholar] [CrossRef]
- Xu, D.D.; Deng, X.; Huang, K.; Liu, Y.; Yong, Z.L.; Liu, S.Q. Relationships between labor migration and cropland abandonment in rural China from the perspective of village types. Land Use Policy 2019, 88, 104164. [Google Scholar] [CrossRef]
- Xu, H.Z.; Chen, T. Impact of farmers’ differentiation on farmland-use efficiency: Evidence from household survey data in rural china. Agric. Econ. 2013, 59, 227–234. [Google Scholar] [CrossRef] [Green Version]
- Liang, L.; Lin, S.; Zhang, Z. Effect of the family life cycle on the family farm scale in Southern China. Agric. Econ. 2016, 61, 429–440. [Google Scholar] [CrossRef] [Green Version]
- Davies, R.B.; Pickles, A.R. An Analysis of Housing Careers in Cardiff. Environ. Plan. A Econ. Space 1991, 23, 629–650. [Google Scholar] [CrossRef]
- Lin, S.; Zhang, Z.; Lin, Y. An impact analysis of family life cycle on rural labor return: Based on a survey of Fujian Rural Area. J. Pub. Manag. 2011, 8, 76–84. [Google Scholar]
- Xie, F.T.; Xu, D.D.; Liu, S.Q.; Cao, M.T. The influence of gender and other characteristics on rural laborers’ employment patterns in the mountainous and upland areas of Sichuan, China. J. Mt. Sci. 2015, 12, 769–782. [Google Scholar] [CrossRef]
- Yang, Y.Y.; Liu, Y.S.; Li, Y.R.; Du, G.M. Quantifying spatio-temporal patterns of urban expansion in Beijing during 1985–2013 with rural-urban development transformation. Land Use Policy 2018, 74, 220–230. [Google Scholar] [CrossRef]
- Zhang, L.X.; Cao, Y.M.; Bai, Y.L. The impact of the land certificated program on the farmland rental market in rural China. J. Rural Stud. 2019. [Google Scholar] [CrossRef]
- Deng, X.; Xu, D.; Qi, Y.; Zeng, M. Labor Off-Farm Employment and Cropland Abandonment in Rural China: Spatial Distribution and Empirical Analysis. Int. J. Environ. Res. Public Health 2018, 15, 1808. [Google Scholar] [CrossRef] [PubMed] [Green Version]
- Deng, X.; Xu, D.; Zeng, M.; Qi, Y. Landslides and Cropland Abandonment in China’s Mountainous Areas: Spatial Distribution, Empirical Analysis and Policy Implications. Sustainability 2018, 10, 3909. [Google Scholar] [CrossRef] [Green Version]
- Atuoye, K.N.; Antabe, R.; Sano, Y.; Luginaah, I.; Bayne, J. Household income diversification and food insecurity in the upper west region of Ghana. Soc. Indic. Res. 2019, 144, 899–920. [Google Scholar] [CrossRef]
- De Janvry, A.; Emerick, K.; Gonzalez-Navarro, M.; Sadoulet, E. Delinking Land Rights from Land Use: Certification and Migration in Mexico. Am. Econ. Rev. 2015, 105, 3125–3149. [Google Scholar] [CrossRef] [Green Version]
- De Janvry, A.; Elisabeth, S. Agricultural growth and poverty reduction: Additional evidence. World Bank Res. Obs. 2013, 25, 1–20. [Google Scholar] [CrossRef]
- Kansanga, M.; Andersen, P.; Kpienbaareh, D.; Mason-Renton, S.; Atuoye, K.; Sano, Y.; Antabe, R.; Luginaah, I. Traditional agriculture in transition: Examining the impacts of agricultural modernization on smallholder farming in Ghana under the new green revolution. Int. J. Sustain. Dev. World 2019, 26, 11–24. [Google Scholar] [CrossRef]
- Wang, W.D.; Dong, Y.Q.; Luo, R.F.; Bai, Y.L.; Zhang, L.X. Changes in returns to education for off-farm wage employment: Evidence from rural China. China Agric. Econ. Rev. 2019, 11, 2–19. [Google Scholar] [CrossRef]
- Kamwi, J.M.; Chirwa, P.W.C.; Manda, S.O.M.; Graz, P.F.; Kätsch, C. Livelihoods, land use and land cover change in the Zambezi region, Namibia. Popul. Environ. 2015, 37, 207–230. [Google Scholar] [CrossRef] [Green Version]
- Mutoko, M.C.; Hein, L.; Bartholomeus, H. Integrated analysis of land use changes and their impacts on agrarian livelihoods in the western highlands of Kenya. Agric. Syst. 2014, 128, 1–12. [Google Scholar] [CrossRef]
- Sun, R.; Mi, J.; Cao, S.; Gong, X. Classifying Livelihood Strategies Adopting the Activity Choice Approach in Rural China. Sustainability 2019, 11, 3019. [Google Scholar] [CrossRef] [Green Version]
- Baffoe, G.; Matsuda, H. An empirical assessment of households livelihood vulnerability: The case of rural Ghana. Soc. Indic. Res. 2018, 140, 1225–1257. [Google Scholar] [CrossRef]
- Masud, M.M.; Kari, F.; Yahaya, S.R.B.; Al-Amin, A.Q. Livelihood Assets and Vulnerability Context of Marine Park Community Development in Malaysia. Soc. Indic. Res. 2016, 125, 771–792. [Google Scholar] [CrossRef]
- Peng, L.; Xu, D.D.; Wang, X.X. Vulnerability of rural household livelihood to climate variability and adaptive strategies in landslide-threatened western mountainous regions of the Three Gorges Reservoir Area, China. Clim. Dev. 2019, 11, 469–484. [Google Scholar] [CrossRef]
- Paudel, K.S.; Deng, W.; Paudel, B.; Khatiwada, J.R.; Zhang, J.; Su, Y. Household Livelihood Strategies and Implication for Poverty Reduction in Rural Areas of Central Nepal. Sustainability 2017, 9, 612. [Google Scholar] [CrossRef] [Green Version]
- Leinbach, T.R.; Smith, A. Off-Farm Employment, Land, and Life Cycle: Transmigrant Households in South Sumatra, Indonesia. Econ. Geogr. 1994, 70, 273–296. [Google Scholar] [CrossRef]
- Sorokin, P.A.; Zimmermann, C.C.; Galpin, C.J. A Systematic Source Book in Rural Sociology; Russell & Russell: New York, NY, USA, 1931; Volume 1. [Google Scholar]
- Barbieri, A.F.; Pan, B.W.K. Farm household lifecycles and land use in the Ecuadorian Amazon. Popul. Environ. 2005, 27, 1–27. [Google Scholar] [CrossRef]
- Walker, R.; Perz, S.; Caldas, M.; Silva, L.G.T. Land Use and Land Cover Change in Forest Frontiers: The Role of Household Life Cycles. Int. Reg. Sci. Rev. 2002, 25, 169–199. [Google Scholar] [CrossRef] [Green Version]
- Carriker, G.L.; Schroeder, F.T.C. Farm household consumption patterns. Rev. Agric. Econ. 1993, 15, 63–73. [Google Scholar] [CrossRef]
- Davis, J.; Mack, N.; Kirke, A. New perspectives on farm household incomes. J. Rural Stud. 1997, 13, 57–64. [Google Scholar] [CrossRef]
- El-Osta, H.S.; Morehart, M.J. Welfare decomposition in the context of the life cycle of farm operators: What does a national survey reveal? Agric. Resour. Econ. Rev. 2009, 38, 125–141. [Google Scholar] [CrossRef]
- Sene, S.O.; Mishra, A. Market Imperfection, Farm Household Consumption Behavior and the Life Cycle Model: Evidence from East Africa. Aaea & Waea Joint Meeting; Agricultural and Applied Economics Association & Western Agricultural Economics Association: San Francisco, CA, USA, 2015. [Google Scholar] [CrossRef]
- Bosma, R.H.; Nam, C.Q.; Udo, H.M.J.; Verreth, J.A.J. Assessing Farmers’ Motives for Livelihood Diversification in the Mekong Delta: Household Life Cycle, Virtual Farm Size, and Index of Integration; Wageningen University and Researchcenter Publications: Wageningen, The Netherlands, 2007. [Google Scholar] [CrossRef]
- Mishra, A.K.; Shaik, E.O. Succession decisions in U.S. family farm businesses. J. Agric. Resour. Econ. 2010, 35, 133–152. [Google Scholar] [CrossRef]
- Phimister, E. Farm household production in the presence of restrictions on debt: Theory and policy implications. J. Agric. Econ. 1995, 46, 371–380. [Google Scholar] [CrossRef]
- Winkler, T.; Schopf, K.; Aschemann, R.; Winiwarter, W. From farm to fork – a life cycle assessment of fresh Austrian pork. J. Clean. Prod. 2016, 116, 80–89. [Google Scholar] [CrossRef] [Green Version]
- Giannoccaro, G.; Berbel, J. The determinants of farmer’s intended behaviour towards the adoption of energy crops in Southern Spain: An application of the classification tree-method. Bio-Based Appl. Econ. J. 2012, 1, 199–212. [Google Scholar] [CrossRef]
- Perz, S.G.; Walker, R.T. Household life cycles and secondary forest cover among small farm colonists in the Amazon. World Dev. 2002, 30, 1009–1027. [Google Scholar] [CrossRef]
- Sherbinin, A.D.; Vanwey, L.K.; Mcsweeney, K.; Aggarwal, R.; Barbieri, A.; Henry, S.; Hunter, L.M.; Twine, W.; Walker, R. Rural household demographics, livelihoods and the environment. Glob. Environ. Chang. 2008, 18, 1–53. [Google Scholar] [CrossRef] [PubMed] [Green Version]
- Clay, D.C.; Johnson, N.E. Size of farm or size of family: Which comes first? Popul. Stud. 1992, 46, 491–505. [Google Scholar] [CrossRef]
- Haas, G.; Wetterich, F.; Geier, U. Life cycle assessment framework in agriculture on the farm level. Int. J. LCA 2000, 5, 345–348. [Google Scholar] [CrossRef]
- Hohn, C. The family life cycle: Needed extensions of the concept. In Family Demography: Methods and Their Application; Bongaarts, J., Burch, T., Wachter, K., Eds.; Clarendon Press: Oxford, UK, 1987. [Google Scholar]
- Yu, H.; Liu, Y. The modeling and empirical research of family life cycle model in China. J. Manag. Sci. 2007, 20, 45–53. [Google Scholar] [CrossRef]
- Cao, M.T.; Xu, D.D.; Xie, F.T.; Liu, E.L.; Liu, S.Q. The influence factors analysis of households’ poverty vulnerability in southwest ethnic areas of China based on the hierarchical linear model: A case study of Liangshan Yi Autonomous Prefecture. Appl. Geogr. 2016, 66, 144–152. [Google Scholar] [CrossRef]
- Guo, S.L.; Lin, L.; Wei, Y.L.; Xu, D.D.; Li, Q.Y.; Liu, S.Q. Interactions between Sustainable Livelihood of Farm household and Agricultural Land Transfer in the Mountainous and Hilly Regions of Sichuan, China. Sustain. Dev. 2019, 27, 725–742. [Google Scholar] [CrossRef]
- Wang, X.L.; Peng, L.; Xu, D.D.; Wang, X.X. Sensitivity of Rural Households’ Livelihood Strategies to Livelihood Capital in Poor Mountainous Areas: An Empirical Analysis in the Upper Reaches of the Min River, China. Sustainability 2019, 11, 2193. [Google Scholar] [CrossRef] [Green Version]
- Xu, D.D.; Zhang, J.F.; Rasul, G.; Liu, S.Q.; Xie, F.T.; Cao, M.T.; Liu, E. Household livelihood strategies and dependence on agriculture in the mountainous settlements in the Three Gorges Reservoir area, China. Sustainability 2015, 7, 4850–4869. [Google Scholar] [CrossRef] [Green Version]
- Xu, D.D.; Peng, L.; Liu, S.Q.; Su, C.J.; Wang, X.X.; Chen, T.T. Influences of migrant work income on the poverty vulnerability disaster threatened area: A case study of the Three Gorges Reservoir area, China. J. Disaster Risk Reduct. 2017, 22, 62–70. [Google Scholar] [CrossRef]
- Xu, D.; Liu, E.; Wang, X.; Tang, H.; Liu, S. Rural Households’ Livelihood Capital, Risk Perception, and Willingness to Purchase Earthquake Disaster Insurance: Evidence from Southwestern China. Int. J. Environ. Res. Public Health 2018, 15, 1319. [Google Scholar] [CrossRef] [Green Version]
- Xu, D.D.; Guo, S.L.; Xie, F.T.; Liu, S.Q.; Cao, S. The impact of rural laborer migration and household structure on household land use arrangements in mountainous areas of Sichuan Province, China. Habitat Int. 2017, 70, 72–80. [Google Scholar] [CrossRef]
- Deng, X.; Xu, D.D.; Zeng, M.; Qi, Y.B. Does early-life famine experience impact rural land transfer? evidence from China. Land Use Policy 2019, 81, 58–67. [Google Scholar] [CrossRef]
- Deng, X.; Xu, D.D.; Zeng, M.; Qi, Y.B. Does Labor Off-farm Employment Inevitably Lead to Land Rent Out? Evidence from China. J. Mt. Sci. 2019, 16, 689–700. [Google Scholar] [CrossRef]
- Zhao, W.; Zhang, N.N. Arable land operation scale, family life cycle and rural households’ livelihood strategies. China Popul. Resour. Environ. 2019, 29, 157–164. [Google Scholar]
© 2020 by the authors. Licensee MDPI, Basel, Switzerland. This article is an open access article distributed under the terms and conditions of the Creative Commons Attribution (CC BY) license (http://creativecommons.org/licenses/by/4.0/).

 ,
, 


