Land Plot Selection Rationale for the Location of Linear Facilities


Saint-Petersburg Mining University, 199106 St. Petersburg, Russia
*
Authors to whom correspondence should be addressed.
Land 2019, 8(4), 67; https://doi.org/10.3390/land8040067
Submission received: 25 March 2019
/
Revised: 15 April 2019
/
Accepted: 16 April 2019
/
Published: 19 April 2019
Abstract
:Nowadays, the issue of land plot selection for linear facilities is relevant because of high land load rate world-wide. The given research into establishing a rationale for linear facilities location focuses on the determination of an optimum alternative. The method used is based on the expert analytic hierarchy process to improve the economic, technical and ecological justification of projects of land allocation for linear facilities of utility equipment. The method was applied in order to select a land plot for a gas pipeline. A number of factors have been proven to be crucial for decision-making, such as negative impact on agricultural activities, area and type of agricultural land, straightness of gas pipeline, construction costs, area of land with restricted use regime and to-be-reclaimed zones. A case study of land allocation for gas pipeline illustrates the solution of the task to find the most appropriate plot of land.
1. Introduction
Efficient and sustainable development of resources requires rational use of land-property complex and management of land resources. The task cannot be solved without a balanced and state-controlled land use system. The system plays a crucial part in land allocation and seizure to locate capital intensive infrastructure that are socially important for the region. Examples of infrastructure are power transmission lines, main gas pipelines, motorways, etc. and their purpose is to create conditions for proper functioning of industries, commodity circulation and livelihoods. Thus, their correct location greatly contributes into economic development of the region and the country.
Frederick Engels said in his classical work “Herr Eugen Dühring’s Revolution in Science”: “Only a society which makes possible the harmonious co-operation of its productive forces on the basis of one single vast plan can allow industry to settle in whatever form of distribution over the whole country is best adapted to its own development and the maintenance of development of the other elements of production” [1].
To locate linear facilities (railways, motorways, main pipelines, communication lines, electric power lines) of utility infrastructure in Russia and other countries of the world it is necessary to design a land allocation project that would meets technical, legislative, economic and other requirements. According to the law of the Russian Federation several options have to be developed and the local authority approves the final option. The criteria for choosing the most appropriate project are still being discussed and cannot be found in legal documents yet. Unconsidered land allocation for industries, transport and power engineering often results in irresponsible land use, deterioration of soil quality, disturbance of ecological balance, landscape alteration, water and air pollution. Fertile lands are often transferred to non-agricultural use which is stated in the governmental (national) report on the conditions and usage of land in the Russian Federation [2]. The main legal document on the regional development of Russia is the decree of the President №13 dated 16 January 2017 which guidelines the practical issues of the state policy concerning infrastructural development. In accordance with the Federal Law № 172-FZ dated 28 June 2014 “On strategic planning in the Russian Federation” a project entitled Strategy of spatial development of Russia up to 2025 has been developed. The main tool used in the Strategy is a comprehensive plan for modernization and extension of the mainline infrastructure. As reported by RBC (dated 20 August 2018) the project of complex development of the national mainline infrastructure schedules construction of 690 infrastructural objects between 2019 and 2024. The research topic is therefore relevant and important.
The goal of the research is to develop rationale guidelines for choosing plots of land to locate linear facilities of utility infrastructure with the use of mathematical tools. To reach the goal a number of tasks are undertaken in the work: to analyze legislation in the field of land allocation for non-agricultural objects; to reveal specific features of land allocation for linear facilities; to examine case studies of land allocation for engineering infrastructure and to develop a pilot project; to reveal drawbacks in land allocation projects and propose methods for improvement; to evaluate the proposed method used in the pilot project.
2. Literature and Laws Preview
2.1. Regulations of Land Allocation for Non-Agricultural Infrastructure Object
In the Russian Federation there are a number of laws and regulations of various levels defining land allocation for objects of different purposes. Fundamentals of legislation are primarily set by the main law of the country—the Constitution of the Russian Federation, paragraph 9 which declares “Land and other natural resources are used and protected as the basis of life and activity of peoples living in the area”. Under the Constitution there are Codes, the most relevant for the present topic being the Land Code. However, the Urban Development Code, Forestry, Water, Civil, Tax and Housing Codes of Russia regulate a large part of the issues associated with construction and provision of land for this purpose. Land use activities required under land allocation are set by Federal Law “On Land Use” dated 18 June 2001 №78-FZ (amended 18 July 2011), where basic concepts as well as objectives and content of such activities are given, obligation and reasons of land use are explained, the terms of land regulation, supervision and examination of land documents are listed, etc. Federal Law “On the State Registration of Immovable Property” governs the process of cadastral registration of land plots and registration of land propertyuse. As a rule, the construction of a non-agricultural infrastructure disturbs the current lay out of the area requiring the change of land use category. Moreover, sanitary and ecological standards have to be met, the environmental protection has to be provided and negative impact has to be avoided or at least reduced. It means that the land choice is made in accordance with Federal Laws “On the Conversion of Land from One Category to Another”, “On the Environmental Protection”, “On the Sanitary-Epidemiological Welfare of Population”, “On Specially Protected Natural Areas”, “On Subsoil Resources”, etc. Legislation on taxes and fees and valuation activities legislation of the Russian Federation govern the issues concerning payment for land. In case of land seizure and land allocation such documents as Decrees of the President, Government Resolutions, provisions, rules, guidelines and instructions should be taken into consideration.
As it has been said, the project design is an essential part of engineering facilities construction. The project is prepared at the stage of prior approval of infrastructure location and if necessary it is revised at the stage of land plot seizure and allocation. To design the project it is necessary:
- To collect initial information
- To calculate the area of land
- To define land plot borders
- To find the loss of the former landowners, land users, owners and tenants
- To plan activities on earth mulching and land reclamation
- To establish the regimes of land use, encumbrances (restrictions)
- Feasibility study of land plot selection [3].
Before infrastructure project starts all initial information available is collected including the fundamentals for the design and approval of design documentation. The list of initial data is individual for every project but it usually includes map material and information from the Unified State Register of Immovable Property.
Calculation and rationale of the plot area is done on the basis of the documents provided by the customer. According to paragraph 33 of Land Code of the Russian Federation “the limits of land plots are set in accordance with the approved procedure of land allocation for specific activities or with the rules of land use and construction as well as land surveying, urban planning and project documentation”. The allocated land plot is required to provide proper operation of the facility including sanitary, fire and environmental safety. However, the allocated land plot should not contain surplus land as it leads to irrational and inefficient use of land resources. In the practice of land use in Russia three ways of plot area calculation are used: according to land allocation standards; according to minimum built-up density for industrial enterprises; and by analogy projects.
The common way of plot area calculation for linear facilities applies land allocation standards for various purposes. It is used for land allocation for linear facilities (railways, motorways, main pipelines, communication lines, electric power lines). There are also standards of land allocation for oil and gas wells, airports, fishing farms, hydro-reclamation systems. Standards of land allocation are widely applied in town development, planning and construction of public, administrative, residential and industrial buildings in urban and rural areas. For instance, the width of land plot for motorways is established according to the type of motorways and conditions of the territory. The area of land plot for an airport depends on its type. For many facilities land is allocated using a standard unit (per capita, per one power transmission tower, per holidaymaker, etc.). The use of standards is aimed not only at saving land resources, but also at safety consideration of commercial facilities, their sanitary, fire and other protection. That is the reason why there may be a set of various standards: for facility construction, for protective zones, for design and survey work, for material storage or waste rock resulting from mining operations, etc.
The technical part of land allocation includes location of land plot, delimitation and demarcation of boundaries. Land plots for linear and non-linear facilities require different ways of delimitation of boundaries. To find the best solution several variants of facility location are usually drawn up that are acceptable for all parties and all participants of land survey. The options should aim to the extent possible meet the following basic requirements:
- to use preferably state reserve land or low-yielding land of other categories that is inefficiently used
- to avoid significant violation of the existing system of land use
- to avoid substantial change of social and ecological situation in the area
- to avoid erosion, bogging formation, flooding and other processes of land degradation and disturbance
- to provide conditions for successful operation of the non-agricultural facility with regard to its production efficiency and socio-economic goals of employees
It is particularly important to meet these requirements in case of land allocation for linear facilities: railways, main oil and gas pipelines, reclamation canals, etc. Land plots for linear facilities occupy relatively small areas but cause significant restrictions of economic operations of local enterprises and disturbance of their structure.
The boundaries of land plots are then mapped. The map scale depends on the area of the plot and its impact zone. It is common practice to use a map scale of 1:10,000, but for linear extended facilities an additional 1:25,000 scale map or even smaller is prepared. The project plan shows basic features, agricultural and other types of land, land plots of different ownership forms, zones of special land use, restrictions and encumbrance as well as boundaries and description of adjacent plots.
In case of designing composite land plots for linear facilities it often happens that private land parcels are affected. Therefore, the project makes provision for land seizure and compensation payment to the holders—owners, landholders, land users and tenants. The amount of compensation is determined in accordance with legislation concerning valuation activities. The compensation is generally made up of real damage (cost of the lost property and expenses to be paid by the person whose use has been compromised to restore the use) and loss of expected profit (lost revenues that under normal conditions could be received).
When land is allocated for linear facilities there is a threat of soil fertility loss. Soil fertility is a valuable land quality which is why the project has to provide land mulching and reclamation operations. Land mulching is used in fertile areas where engineering facilities are going to be built. Fertile soil is removed, transported and placed onto low-yielding areas. The process of soil removal depends on the quality characteristics of upper soil, such as thickness, humus level, acidity, particle-size distribution and other fertility factors. If a decision is taken to keep fertile soil then it is removed up to a certain depth, stored and preserved to be used later. This process may vary greatly depending on the quality of land areas where the preserved soil will be used. Land reclamation, i.e. soil fertility recovery is common on the territories that are temporarily used for construction of linear facilities. In case of land reclamation, the preserved soil is put back on the areas where it used to be after the construction operations are completed.
The next stage of the development of a land allocation project is to establish land use regimes, encumbrances (restrictions) and easement as well as to fix the boundaries of the limited regime of use. Legal regime of land use is determined by land category and the permitted land use along with the established encumbrances (restrictions). In order to create favorable conditions for maintenance of linear facilities the areas where the facilities are located may be surrounded by various zones of the limited regime of use, such as buffer zones, sanitary protection zones, off-the-road shores. These zones provide only limited regime of land use in accordance with their target purpose.
The last and most important stage of the project development is the feasibility study of land plot selection. At this stage all the proposed options are compared and contrasted; technical, economic, social and ecological indicators are calculated and analyzed. As a result, the best option is selected.
2.2. Scientific Background
Various approaches to the selection of best projects in the organization of land use were developed in Russia long ago. When the Committee for the organization of land use was established in 1906 and Stolypin’s agricultural reforms were realized, numerous activities aimed at the rational land use were carried out. These activities gave a start to a national system of the land use organization [4]. The Land Codex of the Russian Republic was issued in 1922. According to the Codex all land use activities had to have a land use project [5]. Further development of the organization of land use was influenced by historic events in the country. From 1954 to 1990 one of the most important tasks was to design engineering infrastructure, including road network. It was vital for new farms located in remote areas. As a result, scientific methods applied for the development of land use projects were in high demand [6]. In 1986 much research was done into the selection of factors that should be considered when designing and arranging roads, power lines and other linear engineering units. It should be noted that mathematical methods were not used at that time. Kuznetsov G.A. [7] thoroughly studied and described a wide range of natural (relief, hydrogeology, soils, etc.), social and economic (areas of agricultural land, cost of construction works, annual road and transportation expenses, communication, etc.) as well as operating and technical (length, sinuosity, slopes, visibility conditions, etc.) factors used for the rationale of road construction design. By 2001 the number of factors had been significantly reduced. The analysis of alternatives for land plot allocation combined economic and technical considerations. The economic analysis was done after the technical feasibility study had been completed (factors complied with predicted traffic intensity, turnover of goods, etc.) [8] (p. 173). Volkov S.N. claims that it was common to choose an alternative with the best coefficient of absolute efficiency of capital investment that exceeded the standard level (Formula (1)):
where EC и ES—coefficient of calculated and standard efficiency of capital investment; Cexи Cpr—annual production costs and loss (due to construction and maintenance of roads, changes in production service), existing and in project; K—capital investment in road construction and road buildings. Moreover, discounted costs (loss) were compared: , where L1—total loss of production due to damage of crops [9] (pp. 190–192); L2—total loss of production due to dust condition of crops.
Sulin M.A. [10] (pp. 332–333) pointed out that the computing-constructive method combined with alternative method was the main method used for land plot allocation rationale in land use projects in 2005. The computing-constructive method is based on a system of calculations and balances; it results in a project solution and makes it possible to assess its efficiency. To decide on the best project of the main road network as part of land use organization and other projects one should follow the acting normative documents VSN 21–83 (Ministry of motorways of the Russian Soviet Republic) “Guidelines on economic efficiency determination of capital investment into construction and repair work of motorways”. Nowadays in Russia the comparison method of discounted costs is widely applied. The discounted costs are calculated by Formula (2):
where C: total annual costs (production costs) for roads operation and maintenance; EC: standard coefficient of capital investment efficiency (EC = 0.08–0.12). The best alternative is considered to be the one which meets technical requirements and high efficiency of capital investment alongside with the least area of agricultural land retirement.
In general cases of comparison if nonrecurring costs emerge many times and do not coincide in time whereas current costs are alternating, the indicator of the best option is the least amount of discounted costs for the period of comparison:
where Kpr: nonrecurring costs for the present option fixed at one basic time moment; ENP = 0.08: regulatory standard for fixing costs occurring at different times; Ct: current costs for the present option in year t; tc: time period of options comparison in years; t: the number of years between the basic year and the year of making payments.
When the options are compared and the substantial time periods of their operations are taken into consideration, the total discounted costs (whose minimum shows the most efficient option) can be calculated by the modified Formula (3):
Most foreign researchers studying a considerable number of factors that influence the location of linear facilities of engineering infrastructure agree on cutting down construction costs.
In fact, the issue of construction and development of engineering infrastructure has been important in recent years in Russia, that is why there are so many works dealing with the issue—by Frolova E.V. [11], Guvennov M.B. [12], Khandazhapova L.M. andLubsanova N.B. [13], Nechaev A.S. [14], Kuznetsov A.L. and Kuznetsova L.A. [15], Miroshnikov S.N. and Charkina E.S. [16], and many others. One more important question is connected with perspective schemes of territory planning at different levels.
Authors all over the world have paid much attention to the calculation complexity of linear facilities design on the plane. In the 1980s it was proved that the best solution of k-center is NP hard [17,18].
The issue of efficient records for linear facilities construction and their impact on the environment and quality of life for residents is getting more acute. In 2007 Murray and Daoqin developed an approach for the problem of covering spatial demand for service where potential facilities are located in the continuous plane. They showed that weighted demand, represented as points, lines or polygons, can be optimally served by a finite number of potential facility location, called the polygon intersection point set (PIPS) [19]. A lot of works should be mentioned written by international authors and devoted to ecological [20,21,22,23], social and market consequences [24,25] of their negative impact. Therefore, for the design and location of linear units it is of utmost importance to consider not only technical and ecological factors but also social ones.
In the US the most important factors for selecting the location of power transmission lines are environmental protection, land use, project feasibility, public needs, expenditures and demand for electric power. The routes proposed by designers are evaluated by state regulators in public hearings and tailored according to the needs. To standardize the method of high-voltage power transmission lines and help to protect the best route corridors against state regulators Schmidt [26] proposed to use tools of the spatial analysis GIS.
The use of GIS for modelling route corridors of linear facilities has been in practice for a long time but the problem of choosing the best option is still acute. Many researchers depending on their majors propose various criteria for selecting the best route, but only some of them work out methods for the rationale. A common way of ranging factors for selecting an oil pipeline route corridor in Malaysia is described in the article [27]. It is assumed that that the oil pipeline route is automatically integrated into GIS. Eroglu and Aydin [28] in order to solve a multi-criteria task of electric power transmission line design proposed to apply Analytic Hierarchy Process and Fuzzy Analytic Hierarchy Process (FAHP) with the use of GIS technologies. These methods are used at the preliminary work stage to design a number of routes which is very expensive as the total area is under consideration, not just certain options of location. For this purpose, special land maps are prepared where the importance of different factors are specified. The complex map of the territory surface shows the most favorable zones for the location of electric power transmission lines. This direction is promising for designers but the obtained assessment of the territory with all the applied criteria provides alternatives for designers and they have to decide which one is the best.
As can be seen, researchers from all over the world are struggling to work out an optimum number of factors as the exceeding number leads to difficulties in decision making and choosing the best alternative of a linear unit location.
One of the recent Russian works on the topic was research by Dormidontova T.V., Gareeva L.K. and Solkaryan N.G. [29] where it was proposed to use the simplest method in order to compare alternatives. The proposed method is named the method of relative preference. The authors mention that this method can be used for choosing the best alternative of location of roads having comparable design. In the research the authors applied the method for the selection of best alternative of a roadway.
3. Methodology
In Saint Petersburg and Leningrad region there are a number of geodetic and design bureaus developing project for all parts of Russia. Their practical experience shows that land allocation projects for linear facilities construction is a complex and difficult task that has to be solved by experts from different fields (land surveyors, economists, ecologists, engineers, etc.). This approach results in proposing a balanced and well-reasoned solution.
Undertaking the research along with analysis of legislation and experience of project development in the field of land allocation for construction of linear facilities made it possible to reveal one of the main drawbacks of such projects. It consists in insufficient methodological justification of the facility layout variant. As a matter of fact, the process of land allocation for construction operation deals with most of the legal framework of the Russian Federation and requires not only huge investments but also substantiation and social equity in decision-making.
One of the main difficulties in the process of facility layout selection is to take into consideration numerous factors influencing the economic efficiency of the facility as well as public and state interests.
Many managerial problems including the issue of finding the best solution for land plot layout can be solved with the use of various decision-making methods. Authors [30] divide all decision-making methods into two groups: formalized (mathematical) and non-formalized (heuristic). The task of establishing a rationale and selecting a land plot layout is clear and well-structured. It means that it does not require generation of possible solutions at this stage. That is why formalized methods based on the quantitative results of calculations should be preferred in this case. These methods are: economic and mathematical models and methods (EMM) formalizing the relationship of processes and phenomena; systems analysis that reveals interaction between components of the system, predicts their development; expert estimates and opinions that allow qualified specialists to evaluate the significance of events, phenomena and factors, also forecasts of developments of systems and subsystems, the ratio of probabilistic and deterministic factors.
Expert estimates and opinions make it possible to find the best solution with the help of respondents who are specialists (in this case they are administrative staff of local authorities). The estimates and opinions cannot be received by analytical way. The following methods of expert estimates are well-known: associations, pairwise (binary) comparisons, vector preferences, focal objects, individual expert interviews, midpoint method.
The Thomas Saaty Analytic Hierarchy Method [31] has a well-developed theoretical basis; it is one of the most reliable methods nowadays. The method allows the solving of multi-objective problems. It is widely used in Russia and worldwide in various fields (business, management, logistics, appraisal practice, administration, etc.). However, neither this method nor others are applied for establishing a rationale for facility layout selection yet. One of the authors of the present paper has tested the method in 38 projects of land allocation for linear facilities construction and regarded it to be efficient. Below you can find the details of one project where the method has been applied.
Stages of the proposed method are:
- Selection of factors for technical and economic assessment of land plot location where a linear engineering infrastructure unit is going to be arranged
- The aim of decision making: selection of a project alternative of land plot allocation
- Construction of a hierarchal structure for the optimum alternative selection
- Finding experts and collecting expert data
- Calculation of factors weight and conformity in experts’ opinions
- Averaging of the obtained weighting factors and their ranging
- Calculation of integral estimation and selection of a dominant alternative
Technical and economic factors of assessment of land plot allocation should include standard and specific factors. Standard factors do not need any justification as they have already been justified and widely used in land plot projects for various linear facilities. Among them are land plot area, including different types of agricultural lands, the number of involved land owners, emergence of overlapping, as well of lands not suitable for mechanized processing, amount of losses, construction costs, etc. The list of specific factors depends on amendments of laws in the sphere of linear facilities design. The specific factors are:
- for motor roads: curve radius of turns; location in regard of nearest settlements: in roundabout way/through; specific features of the project causing dramatic difference of landscape; the number of crossings, entries/exits
- for railways: possibility of further development of railroad network; the number of crossings with motor roads; the number of crossings with rivers; maximum radius on curved distances of the way
- for power lines: distance between transformers and schools, kindergartens, sport facilities, etc.
The importance of ecological and social factors has been proved by many foreign researchers, therefore such factors should be included in assessment.
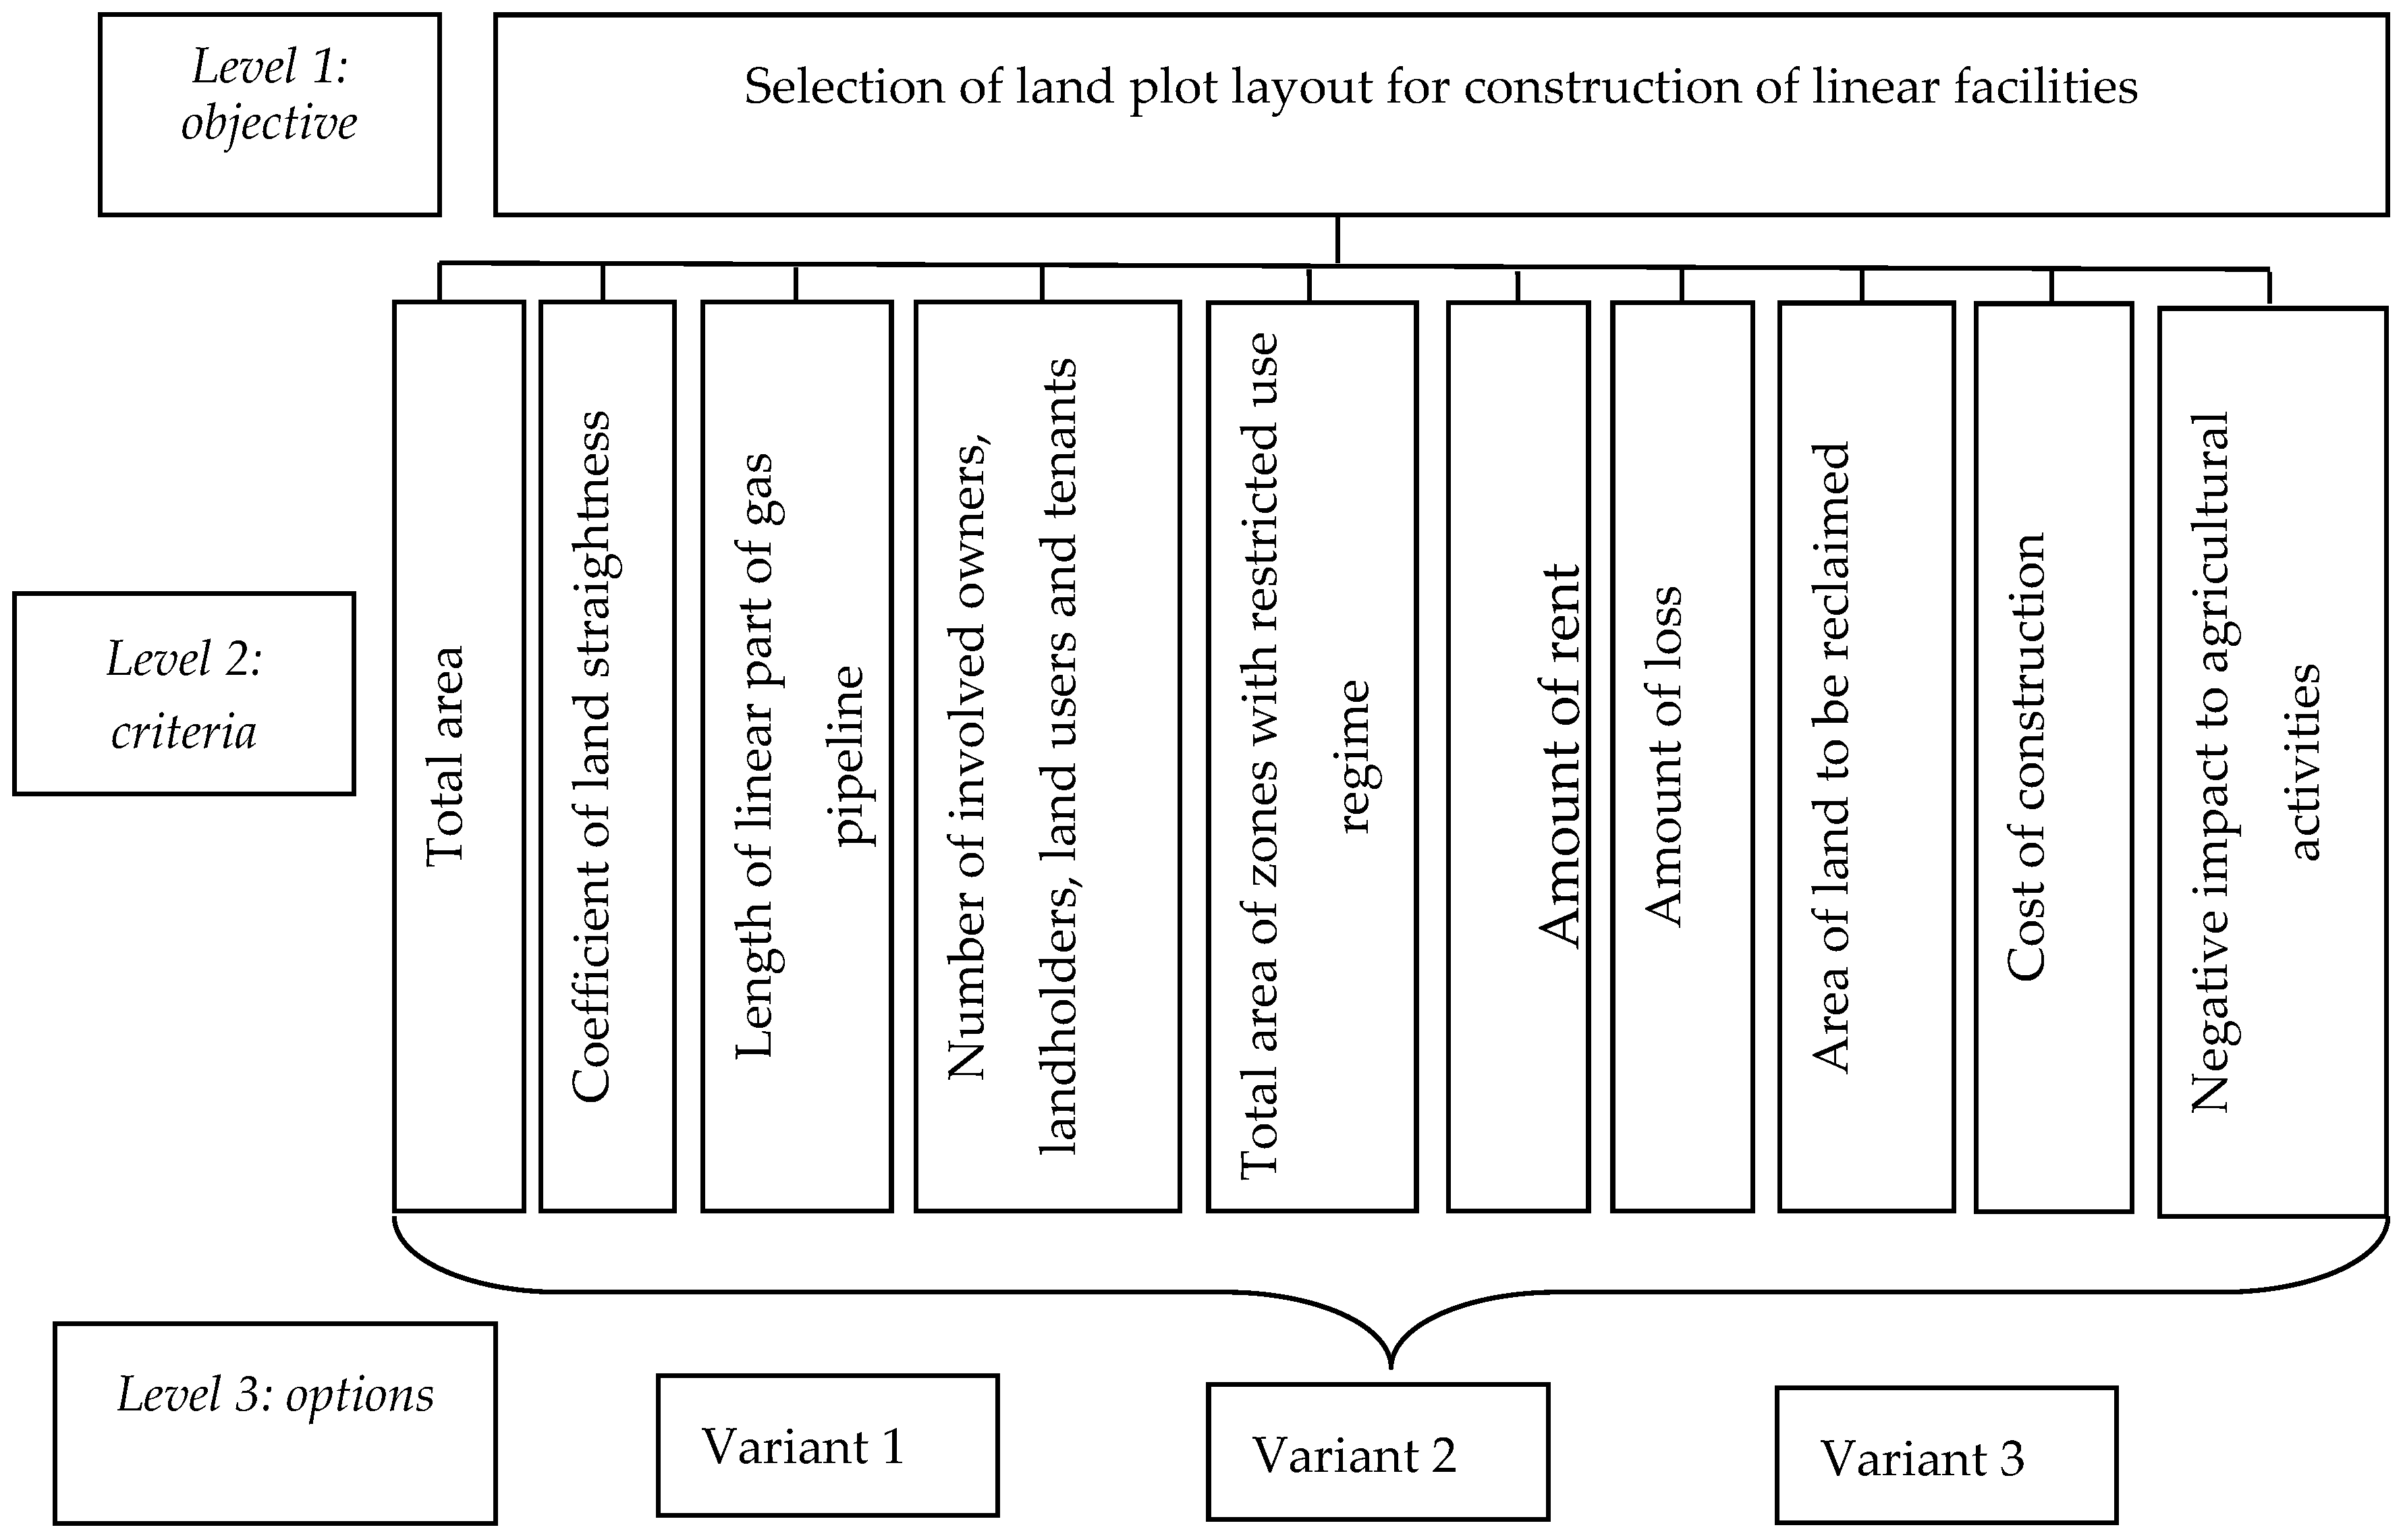
The aim of the decision making is to select the most appropriate alternative of land plot layout for the construction of linear facilities. The hierarchical structure of the project selection shown in Figure 1 has three levels: objective, criteria for decision making, options to be considered. The criteria (factors) are basic for selection, they represent technical and economic indicators with order numbers 1,2,…,i. The exceptions are indicators with the same values in all alternatives under study.
To assess all project alternatives it is necessary to have an expert commission and to collect expert data. As has been said above, the pool of experts consists of civil servants of state power and local authorities who in accordance with the established procedure make a decision on approving an option of linear facilities location. It is necessary to know the necessary number of experts. The number of experts can be determined using different approaches [32]:
- The number of experts must not be fewer than the number of factors (n) or alternatives to be ranged (m ≥ n) [33].
- The number of experts according to Gestalt principle must exceed ten people.
- Based on the empirical evidence the recommended number of experts should be at least 7–10 people [34], as a greater number of experts leads to inaccurate team assessment and difficulties in the arrangement of expert survey.
- The number of experts can be determined by Formula (6) [35]:where m*—the number of experts in a preliminary-formed group; Qi: competence of i-numbered expert evaluated in points (from 1 to 5 points); Qmax: the highest possible competence of i-numbered expert< for example, 5 points. Next, if the initial data is m* = 10 and all experts are of the highest qualification level Qi = 5 (i = 1…10) and Qmax = 5, then m ≤ 15.
As a result, the initial setting of the expert number suggests that the given number has a permissible level of results validity. That is why for the initial calculation of the minimal number of expert Formula (1) was used and their sufficient number was justified at the stage of analyzing the obtained weighting factor of each expert compared with the general level of competence of the expert group.
Next, the matrix of pair-wise comparisons of “Criteria” level is made up based on the above-mentioned structure. The matrix is compiled with the use of the relative importance rank (Table 1). Comparing the criteria (factors), the following should be noted: each of the given assertions has a code number from 1/9 to 9. In the coding procedure the number of the relevant row of Table 1 is used. For example, if an expert considers factor Fi. to be more important than factor Fj, then it will be transferred to the matrix of pair-wise comparisons—aij = 3, aji = 1/3.
The elements of “Criteria” level depend on the objective. The vector of priority (weight) is then determined (Table 2), given that the sum of all elements of the vector of priorities equals one.
In order to check the consistency of matrices of pair-wise comparisons, it is necessary to calculate consistency index that provides information about the degree of failure in numerical and transitive (ordinal) consistency (see Table 2). For example, pair-wise comparisons may show that criterion 1 is more important than criterion 2, 2 is more important than 3, but 3 is more important than 1. It is possible in case when the weights of criteria 1, 2 and 3 are very close and they are difficult to distinguish.
The consistency index is used to determine the degree of matrix consistency and therefore to check expert estimates (see Table 2). It is assumed that the data is quite consistent (coherent) if the value of consistency degree (CD) is less than 10; if matrix has large dimension it can be 20%. If consistency degree (CD) has greater value it is necessary to study the task and check expert estimates. For the present matrix having 10 shapes the value of consistency degree equals 20%.
The arranged group of experts consisted of 18 people, their personal matrices being approved. The results of their estimation are given in Table 3.
In order to assess the consistency of expert opinions a variation coefficient was used. Its value for most factors was less than 0.2 which proves high consistency of experts, and for two factors it was less than 0.3 which is quite acceptable. Moreover, the three sigma rule is followed as all expert values are in the interval [ − 3; + 3 ]. It should also be mentioned that every analysis stage was supplemented by the checked general competence level of experts which was calculated as arithmetic average of opinion deviation coefficients that allowed drawing a conclusion about the sufficient number of experts.
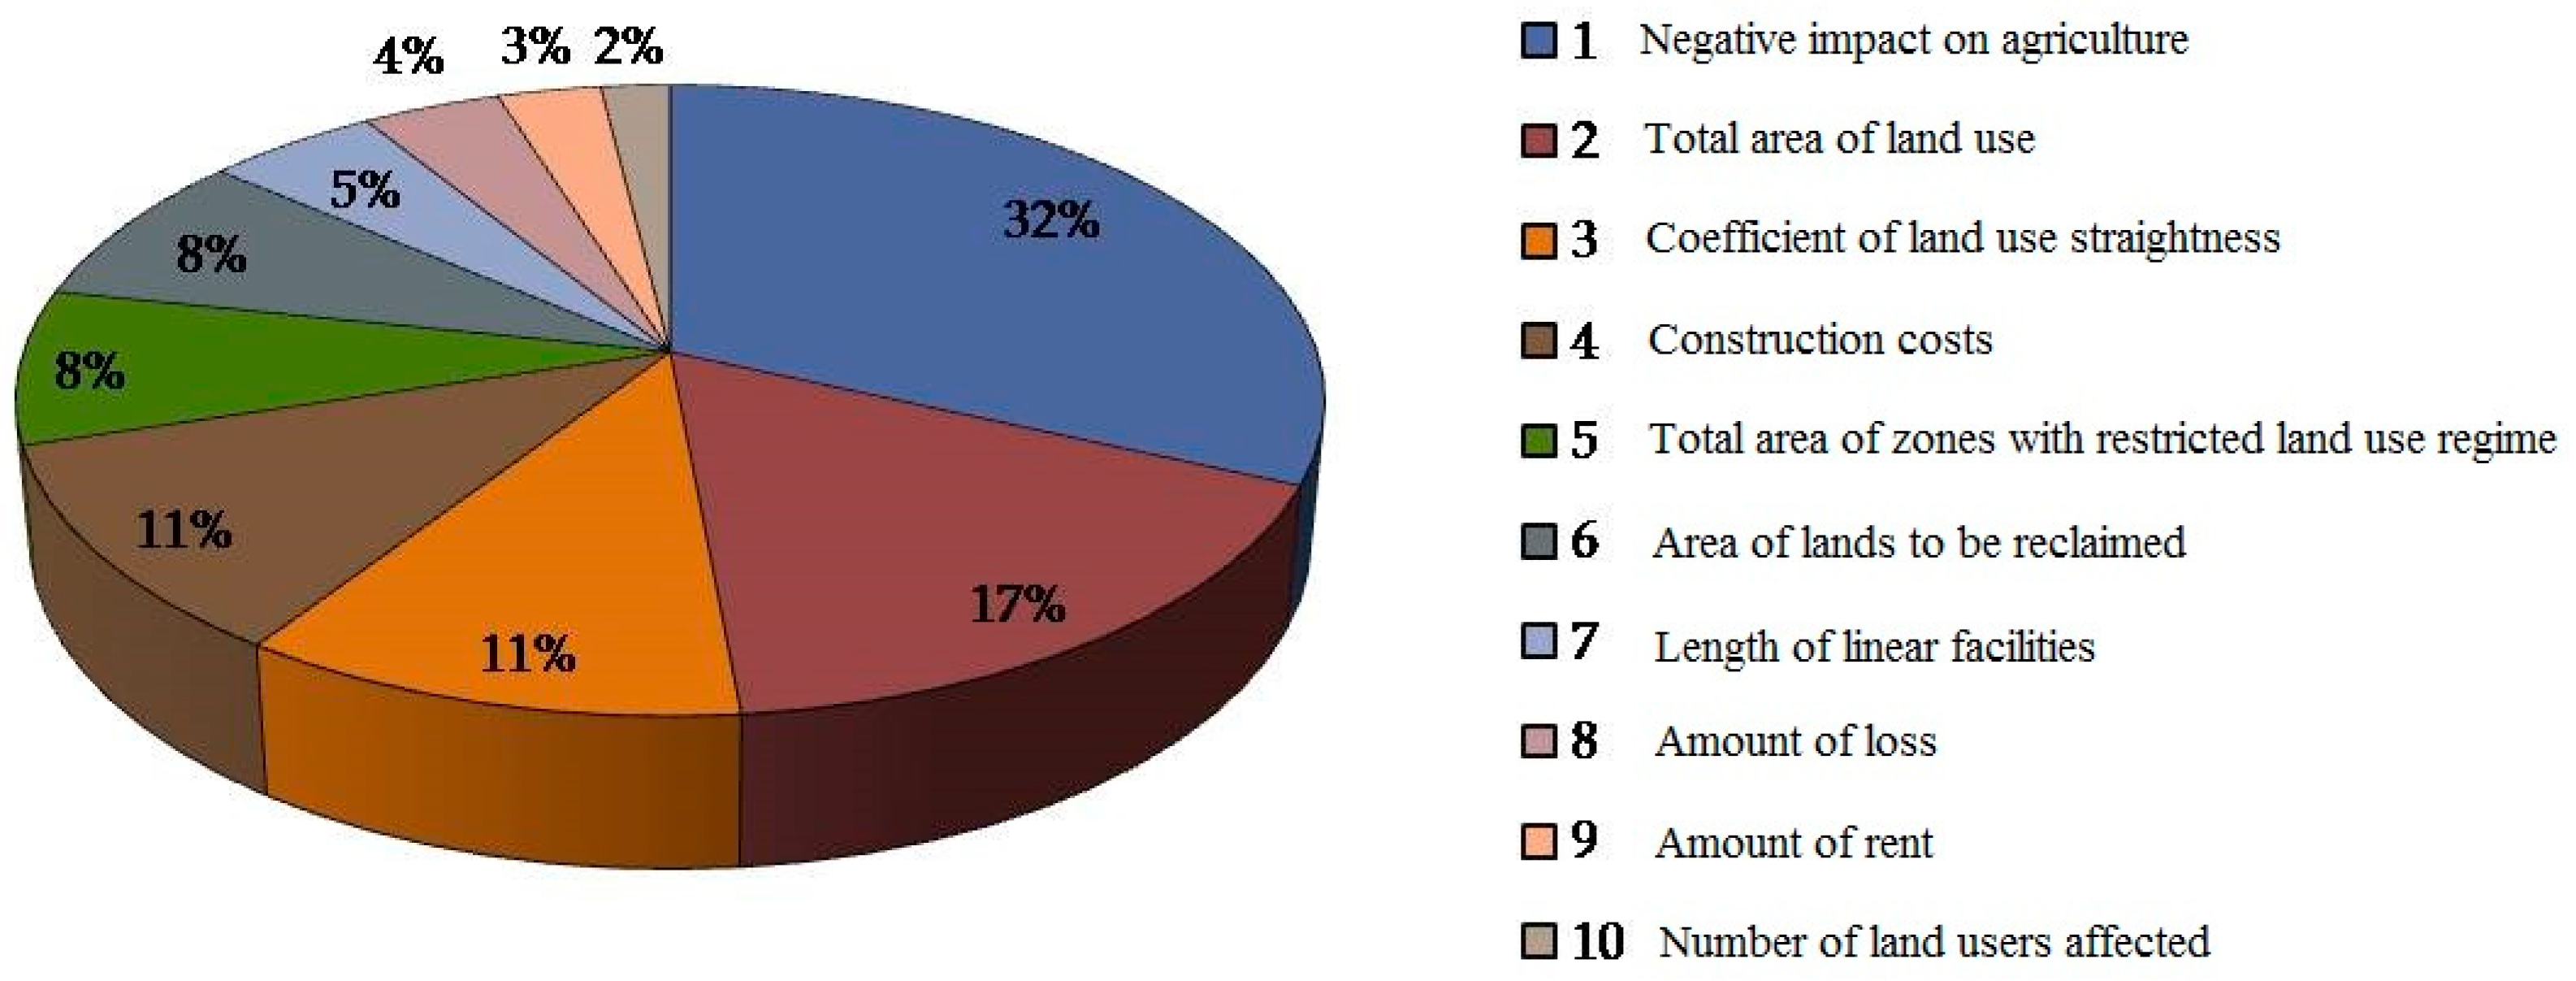
The results of calculation of average weights in per cent and diagram of priority factors are given in Figure 2.
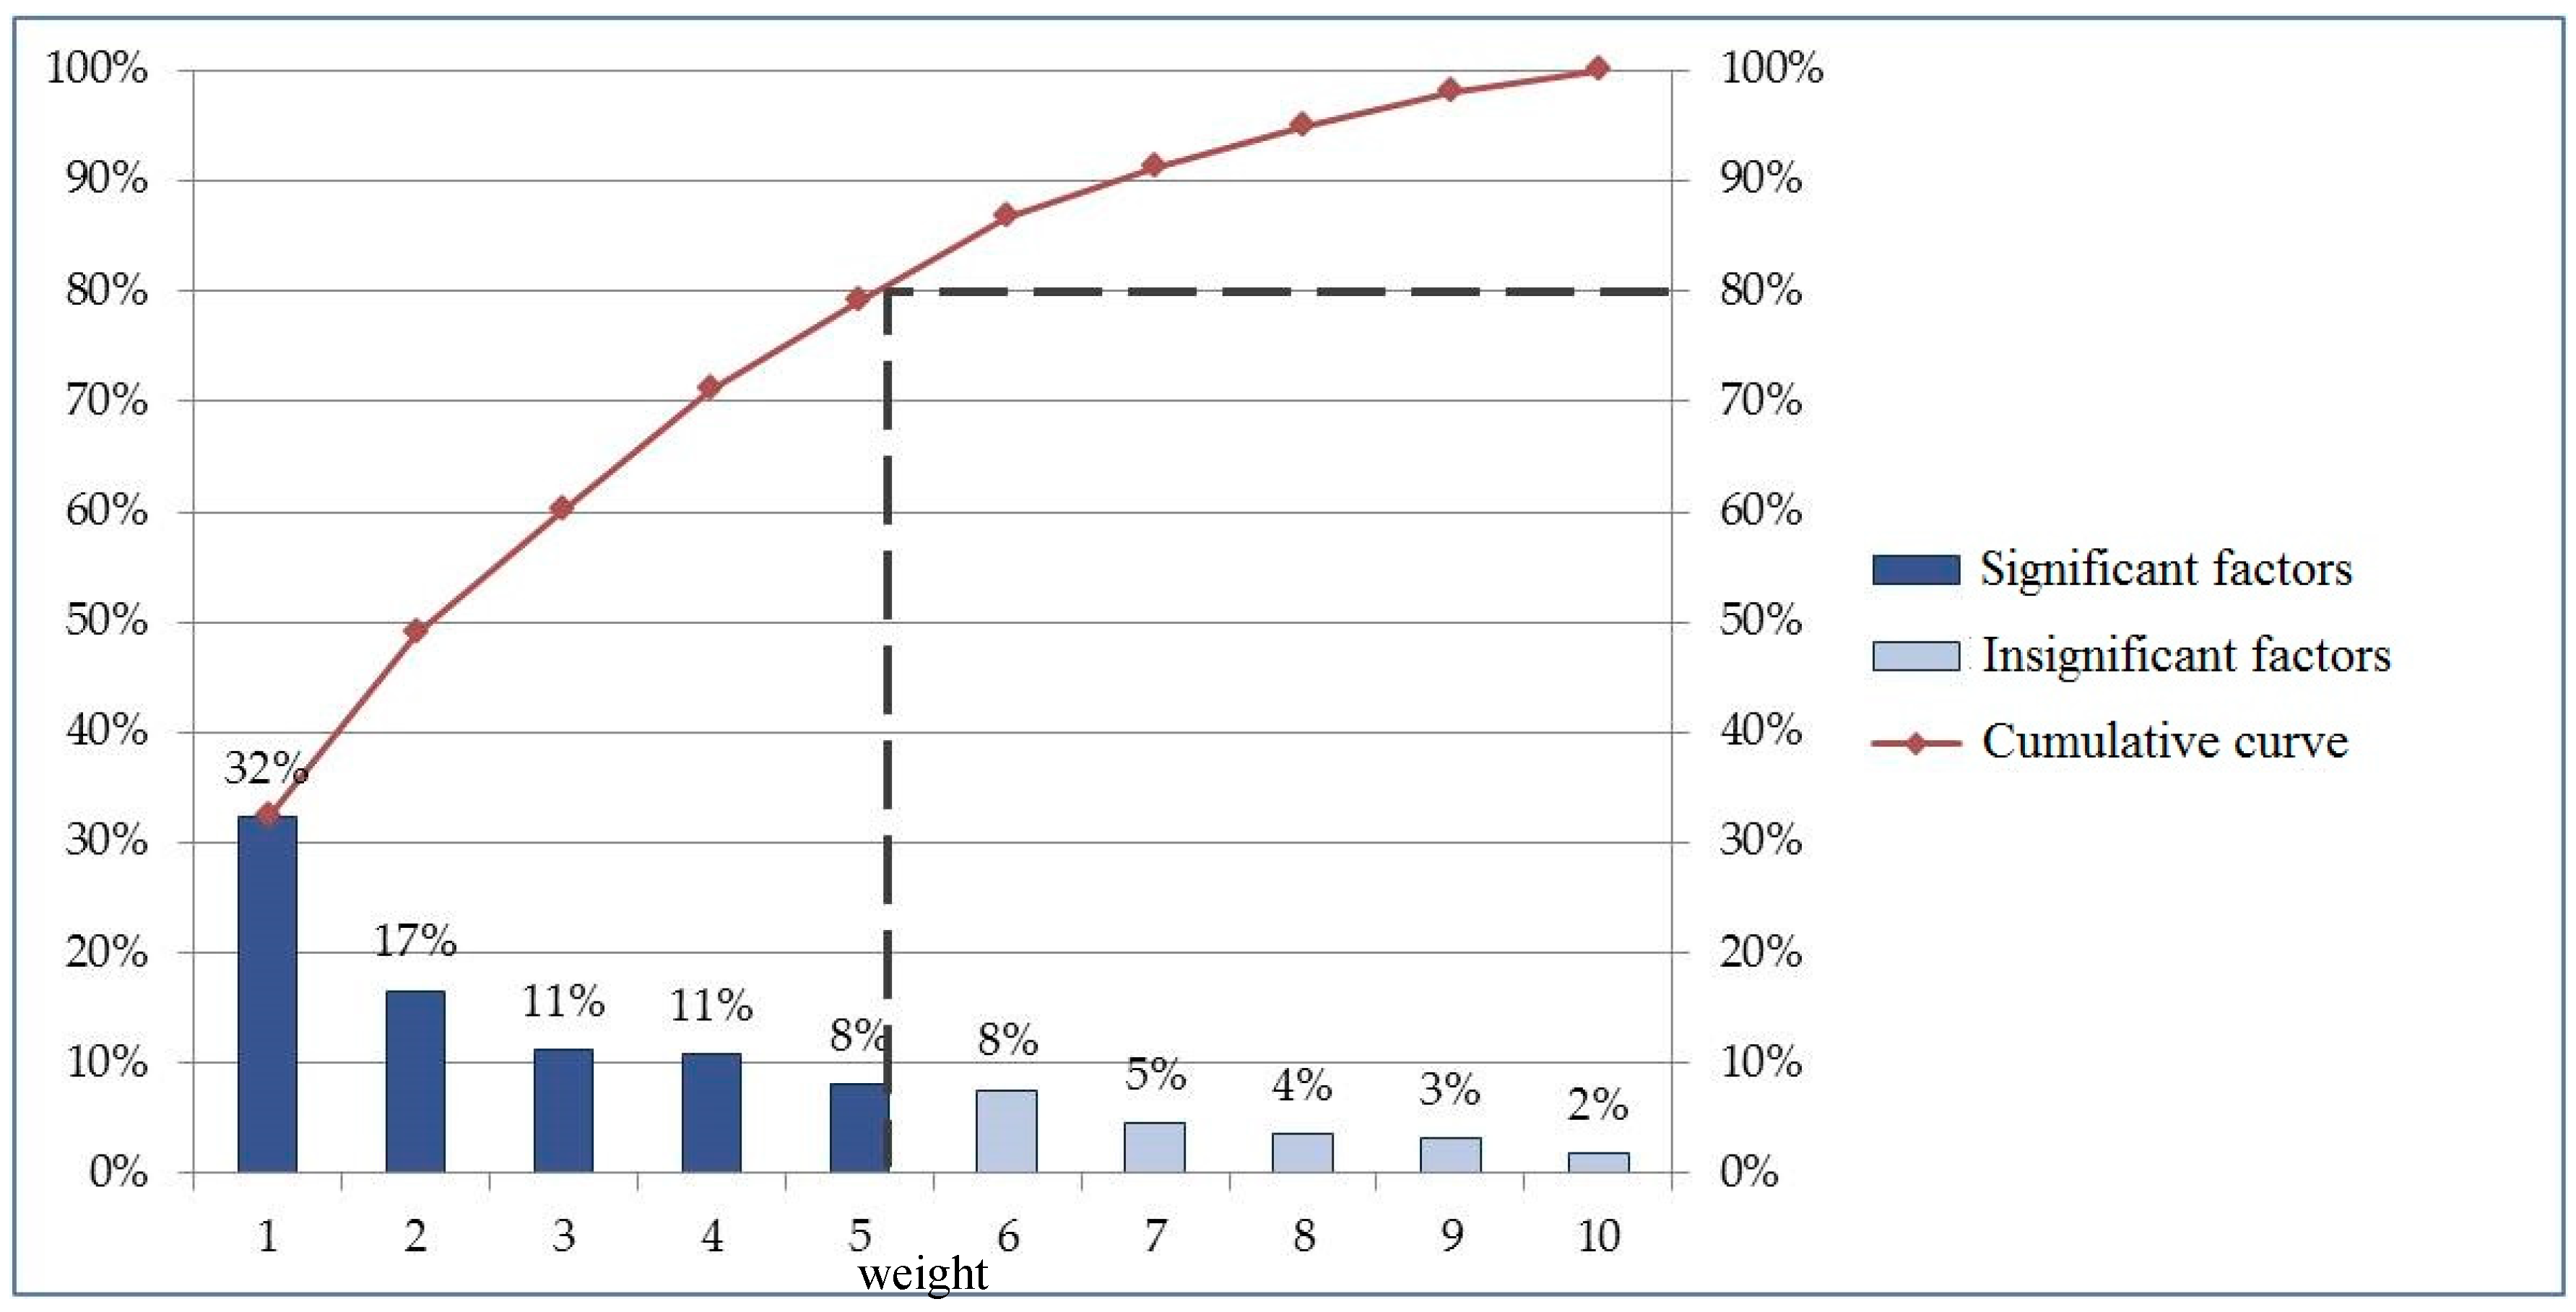
The selection of priority option with the maximum value may be omitted as the criteria values of option selection will be compared later. If the number of selection criteria is large it is suggested to use Pareto diagram in order to determine the most significant ones (Figure 3). It looks like a bar graph with a cumulative curve; the criteria in a Pareto diagram are distributed in the order of decreasing importance (impact power on the object of analysis). The Pareto diagram is based on the 80/20 principle. According to this principle 20% of reasons cause 80% of problems [31,37,38]. It is the most relevant method to reveal the content of significant factors, its advantages being versatility, clearness, automation possibility. It should be noted that the method selection depends on the distribution of the factors’ importance.
It can be seen from the diagram (Figure 4), that the most important factors are: negative impact on the agricultural production, total area of the land plot, coefficient of land straightness, cost of construction, total area of zones with restricted use regime, area of land to be reclaimed. The rest of the factors located on the right from the dashed line are insignificant and therefore will not be taken into consideration.
The final stage of the proposed method is to obtain integral estimation of options (variants) of the project which is calculated as follows (Formula (7)):
where Pi: indicator value by i-factor; Wi: weight of i-factor.
4. Case Study
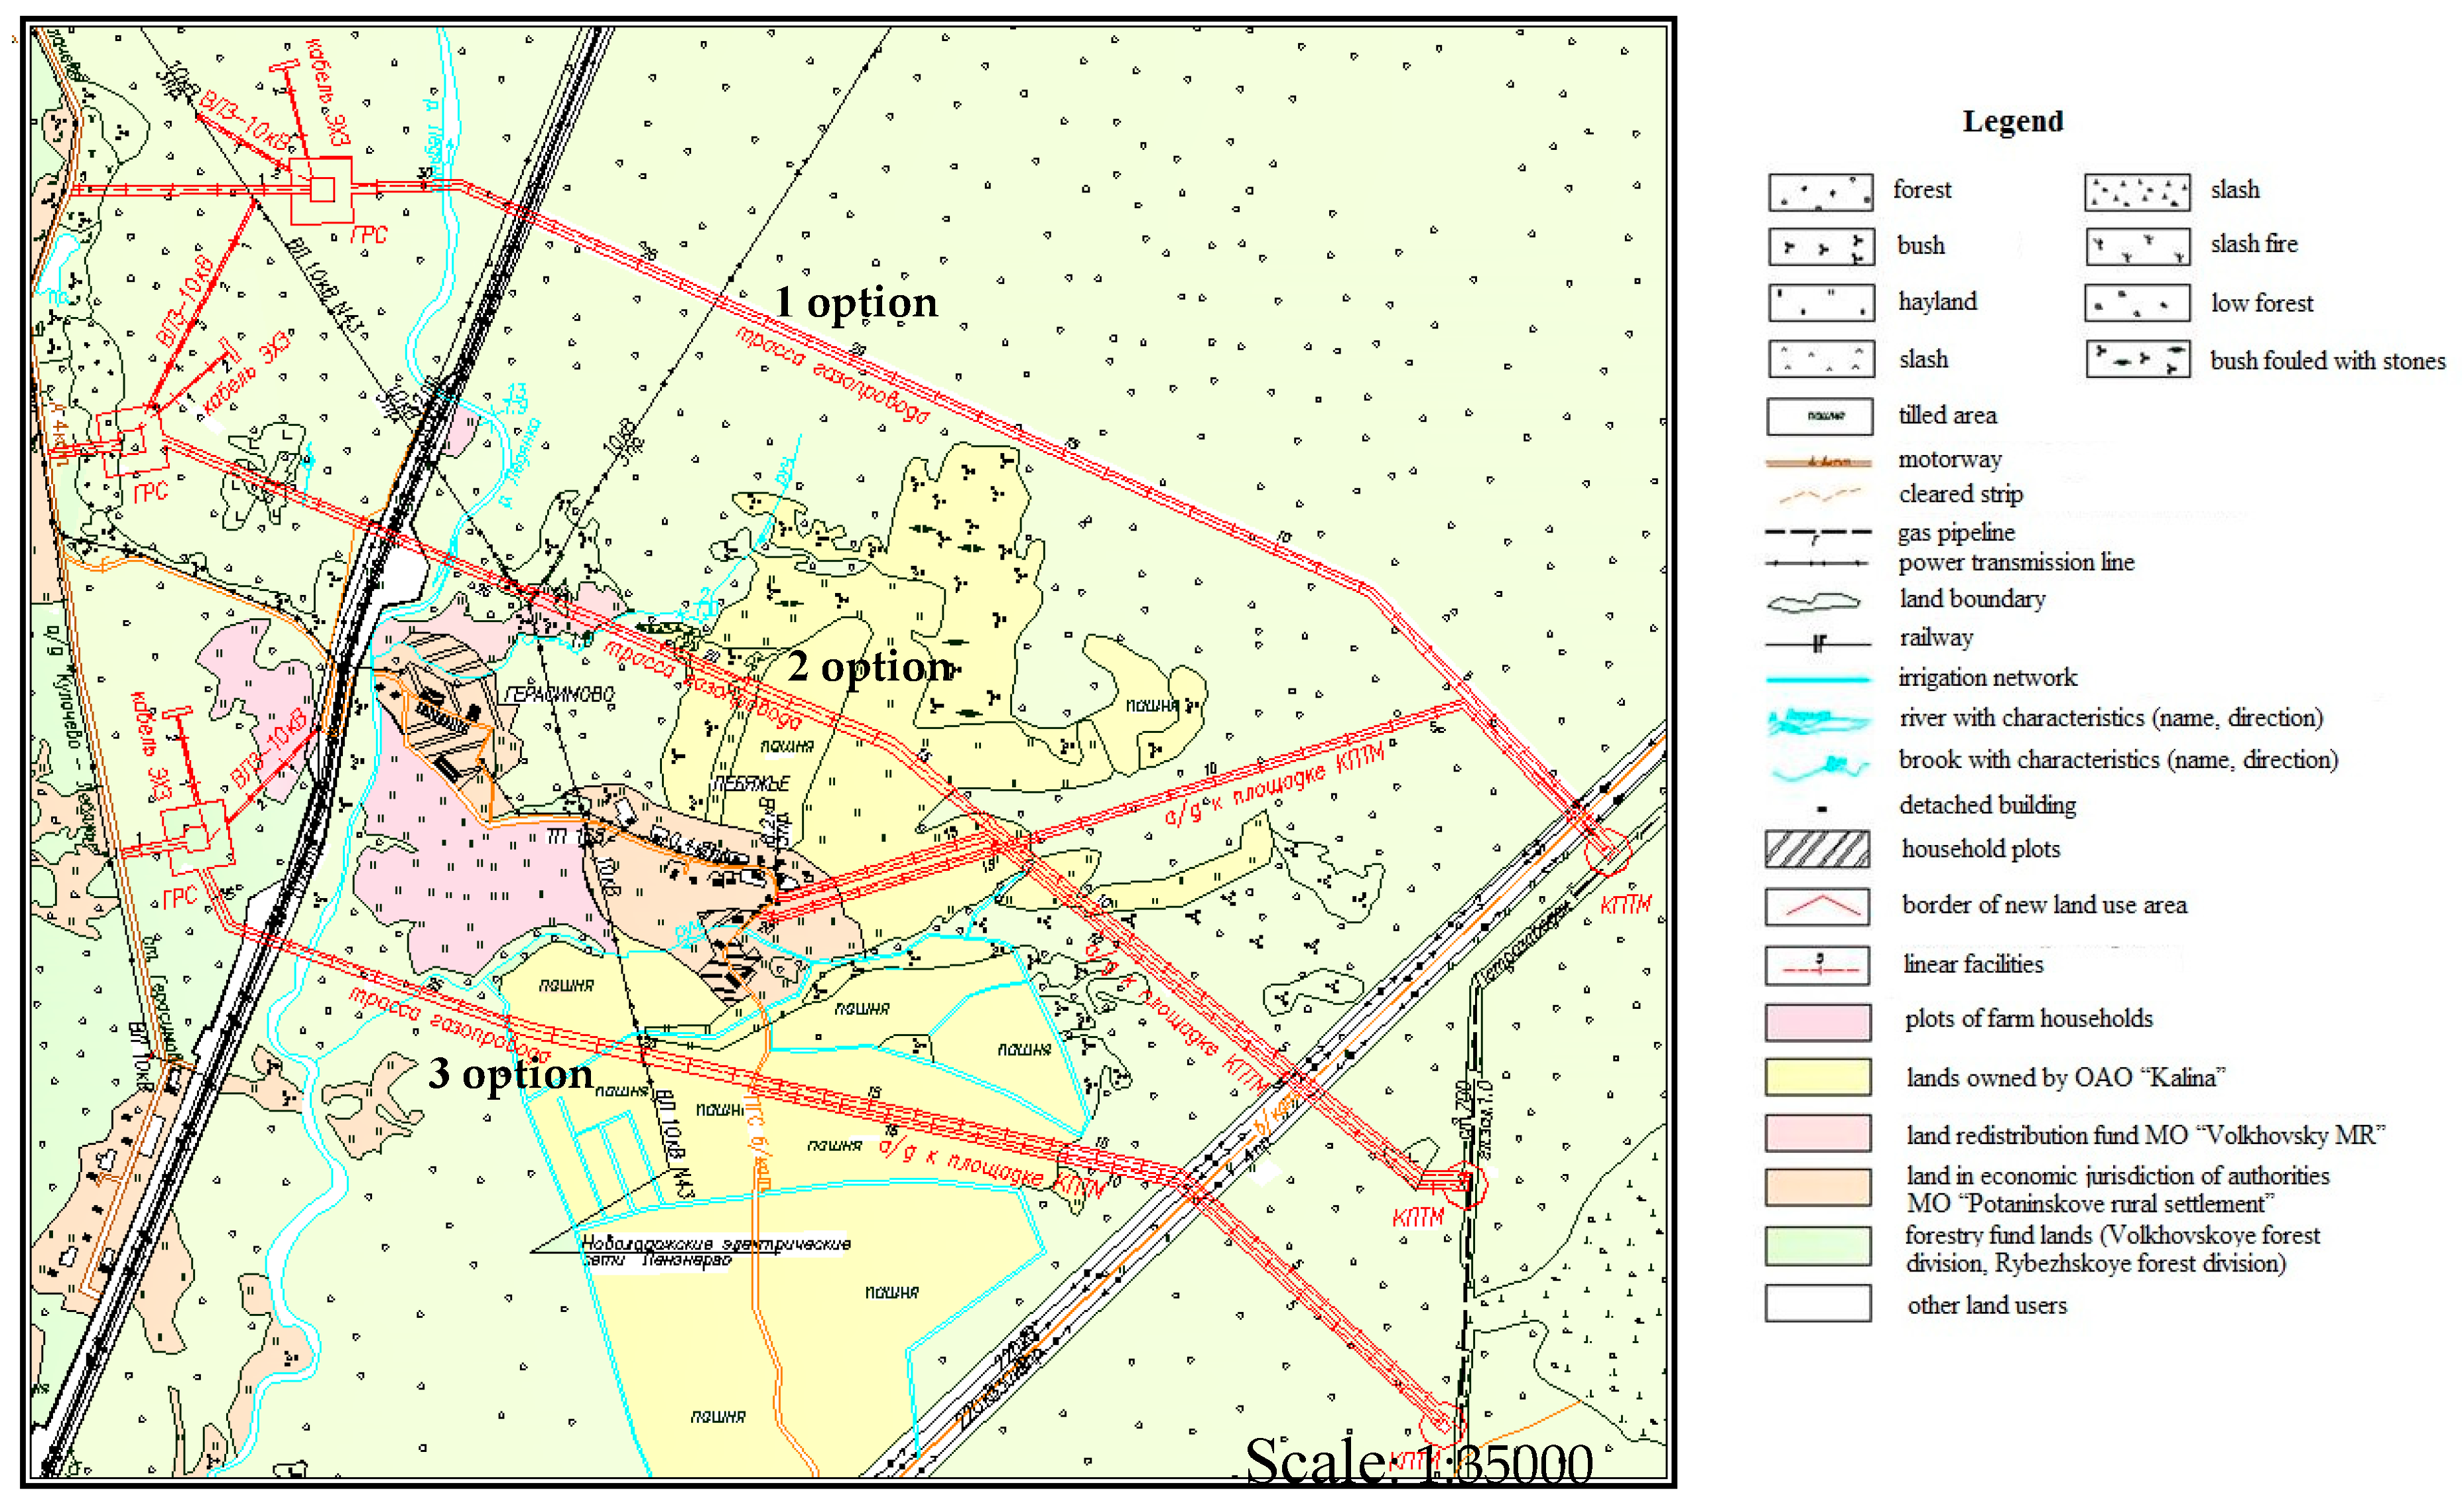
The project deals with land allocation for a main gas pipeline. Three options for a gas pipeline layout in Leningrad region (Volkhov district) are shown in Figure 4.
The final system of indicators used for contrasting and comparing all options are given in Table 4.
The predominant alternative is determined by the highest value of an integrated estimation. The results of the pilot project are given in Table 5.
The calculation shows that the first variant of land plot location has the highest value (0.37).
5. Results and Discussion
The result of the proposed method is the selection of best alternative for the location of a linear unit of engineering infrastructure.
Standard and specific technical and economic factors were determined in order to analyse a better alternative for a gas pipeline location. The results of the expert analysis showed that the importance of each factor may be different for a selection of the best gas pipeline location:
- the most important factor for decision-making of a route corridor for gas pipeline was negative impact on agriculture (factor weight: 32%) which sounds quite natural for Russia where agricultural lands have a priority usage and support of farmers is the basic for food security
- the second most important factor was the area of a land plot required for gas pipeline construction (17%). Its importance is revealed by the withdrawn area and composition of the agricultural lands (tilled fields, hayland, fields, etc.) which could be used according to their target purpose
- equal factors in expert opinions were coefficient of land use straightness and construction costs (11%). The straightness ensures safety of functioning and cutting down on construction costs of gas pipeline, it means they are interconnected and therefore their importance is similar
- equal factors were also common areas of lands with restricted usage and areas of land plots to be reclaimed (8%), the latter being of restricted operation, according to paragraph 27 of the Land Codex of the Russian Federation
- equally decreasing importance have such factors as the length of gas pipeline (5%), amount of losses (4%), rent (3%) and the number of involved land owners (2%).
The analysis of factors values in the pilot project proves the priority of this alternative as it has two distinct advantages: slight impact on agricultural lands; no withdrawal of tilled land; significant straightness from the technical point of view; the least land area to be reclaimed; the least amount of losses to be paid back to land owners; the least number of involved land owners. The given advantages make up for high construction costs, total area of the land plot and the amount of rent compared with two other alternatives.
As the mathematical rationale is not taken into consideration in the decision-making process by state authorities in Russia, the proposed method can supplement the existing practice of linear facilities location. The current legislation does not impose ant restrictions on the application of the method. The market economy pays special attention to the interests of private owners whose land plots may be seized or temporarily used for construction of linear facilities of federal, regional or local significance.
6. Conclusions
Summing up the results of the carried-out research a number of conclusions can be made:
Firstly, to establish a rationale and choose the best land plot for linear facilities of utility equipment in Russia it is necessary to use mathematical tools. The option is to be approved by state local authorities. The legislation of the Russian Federation can make provisions for mathematical tools to be compulsorily used before a decision on facility location is taken.
Secondly, as there are no laws and legal guidelines governing the issue the environment and social conditions often face a negative impact. As a result, the area of fertile land is reducing and the ecological situation is deteriorating.
Thirdly, the factors that are used for decision making to select the best location of linear facilities of engineering infrastructure have to include the standard and specific ones depending on the type of a designed unit. Nowadays, the most important ones are those factors which show the impact on agriculture and describe legal interest of private lands.
Next, the assessment method of land plot location for linear facilities of engineering infrastructure is proposed. The method will make it possible to reduce prosecutor’s supervision aimed at revealing law violations in the field of land plot allocation. The issues of environmental protection, seizure of land and decisions taken by local authorities will be less controversial.
Moreover, the tested method of location assessment alternatives of linear facilities of engineering infrastructure is implemented in the case of main gas pipeline design. It made it possible to determine the importance of each technical and economic factor and select the best option for unit location according to weights of factors and their actual values.
The suggested method involves the opinion of experts from various fields who work for the committee dealing with land allocation, which is why the whole process should become more responsible.
The proposed method can be an issue for discussion and has some drawbacks but its advantages overweigh concerns, as the economic target of land conversion can be reached by consideration of experts’ opinion and high level of decision-making. It will be a solid basis for reasonable land planning resulting in the increase of its investment attraction and reduction of ecological and public impact.
Author Contributions
Conceptualization, B.E.; methodology, B.E.; software, B.E., G.I.G.; validation, B.E., G.I.G.; formal analysis, B.E., G.I.G.; investigation, B.E., G.I.G.; resources, B.E., G.I.G.; data curation, B.E., G.I.G.; writing—original draft preparation, B.E., G.I.G.; writing—review and editing, B.E., G.I.G.; visualization, B.E., G.I.G.; supervision, G.I.G.; project administration, B.E., G.I.G.; funding acquisition, G.I.G.
Funding
This research received no external funding.
Acknowledgments
We are grateful to the Department of Engineering Geodesy and Department of Foreign Languages of Saint-Petersburg Mining University for inspiration, encouragement and administrative support.
Conflicts of Interest
The authors declare no conflict of interest.
References
- Engels, F. Herr Eugen Dühring’s Revolution in Science (Anti-Dühring); International Publishers: New York, NY, USA, 1939; p. 323. [Google Scholar]
- State (National) Report on Condition and Use of Lands in Russian Federation in 2017; Ministry for Economic Development of Russian Federation, Federal Bureau of State Registration, Cadaster and Cartography: Moscow, Russia, 2018; p. 197.
- Heldak, M.; Bykova, E. Construction of Public Roads at the Meeting Point of Different Legislation System. J. Ecol. Eng. 2017, 18, 86–94. [Google Scholar] [CrossRef]
- Volkov, S.N. Organisation of Land Use. Theoretical basics of Organization of Land Use; Kolos: Moscow, Russia, 2001; Volume 1, p. 496. [Google Scholar]
- Bochkov, N.V.; Pershin, P.N.; Snegirev, M.A.; Sharapov, V.F. The History of Land Relations and Organization of Land Use; Selkhozgiz: Moscow, Russia, 1959; p. 248. [Google Scholar]
- Verveyko, A.P. Scientific Basics of Organization of Land Use; Kharkov agricultural institute after V.V. Dokuchaev: Kharkov, Poland, 1980; p. 96. [Google Scholar]
- Kuznetsov, G.A. Geography and Planning of Agricultural Areas; Mysl’: Moscow, Russia, 1971; pp. 438–441. [Google Scholar]
- Volkov, S.N. Organisation of Land Use. Economy of Organisation of Land Use; Kolos: Moscow, Russia, 2001; Volume 5, p. 456. [Google Scholar]
- Kuznetsov, G.A. Roads of Local Importance; Agropromizdat: Moscow, Russia, 1986; p. 351. [Google Scholar]
- Sulin, M.A. Organisation of Land Use; Publishing House “Lan”: Saint Petersburg, Russia, 2005; p. 448. [Google Scholar]
- Frolova, E.V. Problems with infrastructure in small towns of Russia. Sotsiologiya Vlasti 2011, 3, 56–61. [Google Scholar]
- Guvennov, M.B. On the necessity to improve the approval procedure of location and technical specifications of engineering infrastructure with the application of geo-informational systems. Aktualnye Voprosy Proektirovaniya Avtomobilnykh Dorog 2011, 2, 38–54. [Google Scholar]
- Khandazhapova, L.M.; Lubsanova, N.B. Problems of sustainable development of rural areas of Russia in regional research. Natsionalnye Interesy Prioritetyi Bezopasnost 2015, 21, 25–32. [Google Scholar]
- Nechaev, A.S. The influence of the engineering infrastructure on social-economic and demographic development of the area. Regionalnye Problemy Preobrazovaniya Economiki 2016, 74, 158–163. [Google Scholar]
- Kuznetsov, A.L.; Kuznetsova, L.A. Engineering infrastructure of rural settlements. Vestnik Selskogo Razvitiya I Socialnoy Polotoki 2016, 9, 19–23. [Google Scholar]
- Miroshnikov, S.N.; Charkina, E.S. Engineering and public infrastructure as the most important element of investment attractiveness of Russian regions. Upravlencheskoye Konsultirovanie 2016, 91, 72–80. [Google Scholar]
- Megiddo, N.; Arie, T. On the complexity of locating linear facilities in the plane. Oper. Res. Lett. 1982, 1, 194–197. [Google Scholar] [CrossRef]
- Murray, A.T.; Tong, D. Coverage optimization in continuous space facility siting. Int. J. Geogr. Inf. Sci. 2007, 21, 757–776. [Google Scholar] [CrossRef]
- Fowler, R.J.; Paterson, M.S.; Tanimoto, S.L. Optimal packing and covering in the plane are NP-complete. Inf. Process. Lett. 1981, 12, 133–137. [Google Scholar] [CrossRef]
- Goosem, M. Internal fragmentation: The effects of roads, highways and powerline clearings on movements and mortality of rainforest vertebrates. In Tropical Forest Remnants; Laurance, W.F., Bierregaard, R.O., Jr., Eds.; University of Chicago Press: Chicago, IL, USA, 1997; pp. 241–255. [Google Scholar]
- Laurance, W.F.; Goosem, M.; Laurance, S.G.W. Impacts of roads of roads and linear clearings on tropical forests. Trends Ecol. Evol. 2009, 12, 659–669. [Google Scholar] [CrossRef] [PubMed]
- Labarraque, D.; Roussel, S.; Tardieu, L. Exploring direct and indirect regulation ecosystem services loss caused by linear infrastructure construction. Revue d’Économie Politique 2015, 125, 277–298. [Google Scholar] [CrossRef]
- Hammad, A.W.A.; Ali, A.; David, R. Sustainable urban facility location: Minimising noise pollution and network congestion. Transp. Res. Part E Logist. Transp. Rev. 2017, 107, 38–59. [Google Scholar] [CrossRef]
- Paschke, M. Legal challenges of the new energy policy in Germany. J. Min. Inst. 2017, 226, 487–496. [Google Scholar] [CrossRef]
- Gellert, P.K.; Lynch, B.D. Mega-projects as displacements. Int. Soc. Sci. J. 2003, 175, 15–25. [Google Scholar] [CrossRef]
- Schmidt, A.J. Implementing a GIS Methodology for Siting High Voltage Electric Transmission Lines. In Papers in Resource Analysis; Saint Mary’s University of Minnesota University Central Services Press: Winona, MN, USA, 2009; Volume 11, p. 17. [Google Scholar]
- Balogun, A.-L.; Matori, A.-N.; Lawal, D.U.; Chandio, I. Optimal Oil Pipeline Route Selection using GIS: Community Participation in Weight derivation and Disaster Mitigation. In Proceedings of the International Conference on Future Environment and Energy (ICFEE), Singapore, 26–28 February 2012; pp. 100–104. [Google Scholar]
- Eroglu, H.; Aydin, M. Optimization of electrical power transmission lines’ routing using AHP, fuzzy AHP, and GIS. Turk. J. Electr. Eng. Comput. Sci. 2015, 23, 1418–1430. [Google Scholar] [CrossRef]
- Dormidontova, T.V.; Gareeva, L.K.; Solkaryan, N.G. Application of “Decision tree” method and planned experiment for the selection of best alternatives with specified criteria in transport construction. Naukovedenie 2015, 7. Available online: http://naukovedenie.ru/PDF/107EVN215.pdf (accessed on 5 March 2019).
- Abakumov, V.V.; Golubev, A.A.; Kustarev, V.P.; Podlesnykh, V.I.; Prokhorov, Y.K.; Tyulenev, L.V. Management; SPbGU ITMO: Saint Petersburg, Russia, 2003; Available online: http://de.ifmo.ru/bk_netra/page.php?tutindex=3andindex=63 (accessed on 5 March 2019).
- Saaty, T.L. Decision Making. The Analytical Hierarchy Process; Radio I Svyaz: Moscow, Russia, 1993. [Google Scholar]
- Margolin, E. Method of expert survey data processing. Poligraphiya 2006, 5, 14–16. [Google Scholar]
- Lukicheva, L.I.; Yegorychev, D.N. Managerial Decisions; Omega-L: Moscow, Russia, 2009; p. 383. [Google Scholar]
- Petrov, A.Y. Integral Estimation of Commercial Potential of Investment Product; Moskovsky Pechatnik: Moscow, Russia, 2010; p. 23. [Google Scholar]
- Zerniy, Y.V.; Polyvany, A.G.; Yakushin, A.A. Quality Management in Instrument Manufacture; Novy Center: Moscow, Russia, 2011; p. 479. [Google Scholar]
- Shevchenko, S.A.; Samarin, Y.N. Selection of prepress equipment meeting specified requirements. Probl. Print. Ind. Publ. Bus. 2006, 4, 3–12. [Google Scholar]
- Andersen, B.; Fagerhaug, T. Root Cause Analysis. Simplified Tools and Technoques; ASQ Quality Press: Milwaukee, WI, USA, 1999; p. 156. [Google Scholar]
- Postnikov, V.M. Analysis of approaches to expert team members nomination aimed at developing and decision making. Sci. Educ. Electron. Sci. Tech. J. 2012, 5, 333–346. [Google Scholar]
Figure 1.
Hierarchical structure of project selection to locate a linear facility.

Figure 2.
of priority factors affecting selection of best option of land plot location for linear facility.
Figure 2.
of priority factors affecting selection of best option of land plot location for linear facility.

Figure 3.
Pareto diagram.

Figure 4.
Options of gas pipeline layout.


Table 1.
Relative importance rank.
| № п/п | Assertion | Explanation |
|---|---|---|
| 1 | Equal importance | Equal contribution to reach the goal |
| 2 | Transitional assertion | |
| 3 | Moderate advantage | Experience and assertion give a slight advantage to one factor over the other |
| 4 | Transitional assertion | |
| 5 | Considerable advantage | Experience and assertion give a strong advantage to one factor over the other |
| 6 | Transitional assertion | |
| 7 | Significant advantage | A significant advantage is observed in practice |
| 8 | Transitional assertion | |
| 9 | Very strong advantage | A strong advantage of one factor over the other is observed in practice |
Table 2.
Diagram of weight estimation sequence.
| A | Criteria to be Compared | Geometric Mean | Estimation of Priority (Weight) Vector Elements | |||
|---|---|---|---|---|---|---|
| 1 | 2 | … | 10 | |||
| 1 | 1 | w1/w2 | … | w1/w10 | ||
| 2 | 1 | … | … | … | ||
| … | … | … | … | … | ||
| 10 | w10/w1 | w10/w2 | … | 1 | ||
| 1 | ||||||
| : set of compared criteria, – weights. | ||||||
| n: number of compared criteria; : maximum eigen value of matrix A. For antisymmetric matrix it is always true > n and , where i, j: indexes of row and column of matrix A, —expert estimates (opinions). | ||||||
| AI: average consistency index, it equals (here) 1.49. | ||||||
Table 3.
Summary table of priority values of factors and consistency of expert evaluations.
| Experts/Factors | Total Area of Land Plot | Coefficient of Land Straightness | Length of Linear Part of Gas Pipeline | Number of Involved Owners, Landholders, Land Users and Tenants | Total Area of Zones with Restricted Use Regime | Amount of Rent | Amount of Loss | Area of Land to be Reclaimed | Cost of Construction | Negative Impact to Agricultural Activities |
|---|---|---|---|---|---|---|---|---|---|---|
| 1 | 0.16 | 0.11 | 0.05 | 0.02 | 0.08 | 0.03 | 0.04 | 0.08 | 0.11 | 0.32 |
| 2 | 0.16 | 0.11 | 0.05 | 0.02 | 0.09 | 0.02 | 0.04 | 0.08 | 0.12 | 0.31 |
| 3 | 0.18 | 0.13 | 0.08 | 0.02 | 0.07 | 0.05 | 0.03 | 0.04 | 0.06 | 0.34 |
| 4 | 0.16 | 0.11 | 0.05 | 0.01 | 0.08 | 0.02 | 0.03 | 0.08 | 0.15 | 0.31 |
| 5 | 0.16 | 0.11 | 0.05 | 0.02 | 0.08 | 0.03 | 0.04 | 0.08 | 0.11 | 0.32 |
| 6 | 0.16 | 0.1 | 0.05 | 0.02 | 0.08 | 0.02 | 0.03 | 0.09 | 0.13 | 0.32 |
| 7 | 0.18 | 0.08 | 0.06 | 0.01 | 0.1 | 0.03 | 0.05 | 0.05 | 0.1 | 0.34 |
| 8 | 0.17 | 0.11 | 0.05 | 0.02 | 0.08 | 0.03 | 0.03 | 0.08 | 0.11 | 0.32 |
| 9 | 0.16 | 0.11 | 0.05 | 0.02 | 0.08 | 0.02 | 0.04 | 0.1 | 0.11 | 0.31 |
| 10 | 0.16 | 0.11 | 0.05 | 0.02 | 0.08 | 0.03 | 0.04 | 0.08 | 0.11 | 0.32 |
| 11 | 0.16 | 0.11 | 0.05 | 0.02 | 0.08 | 0.02 | 0.05 | 0.08 | 0.12 | 0.31 |
| 12 | 0.17 | 0.11 | 0.05 | 0.02 | 0.08 | 0.03 | 0.04 | 0.07 | 0.11 | 0.32 |
| 13 | 0.16 | 0.11 | 0.05 | 0.02 | 0.08 | 0.04 | 0.04 | 0.08 | 0.11 | 0.31 |
| 14 | 0.17 | 0.11 | 0.05 | 0.02 | 0.08 | 0.03 | 0.04 | 0.07 | 0.11 | 0.32 |
| 15 | 0.18 | 0.1 | 0.04 | 0.03 | 0.07 | 0.02 | 0.03 | 0.09 | 0.12 | 0.32 |
| 16 | 0.17 | 0.11 | 0.05 | 0.01 | 0.09 | 0.02 | 0.04 | 0.08 | 0.11 | 0.32 |
| 17 | 0.17 | 0.1 | 0.06 | 0.02 | 0.07 | 0.03 | 0.05 | 0.07 | 0.11 | 0.32 |
| 18 | 0.16 | 0.11 | 0.05 | 0.02 | 0.08 | 0.03 | 0.04 | 0.08 | 0.11 | 0.32 |
| Average value | 0.17 | 0.11 | 0.05 | 0.02 | 0.08 | 0.03 | 0.04 | 0.08 | 0.11 | 0.32 |
| Variation coefficient | 0.05 | 0.09 | 0.15 | 0.25 | 0.09 | 0.29 | 0.17 | 0.18 | 0.15 | 0.03 |
| − 3 | 0.14 | 0.08 | 0.03 | 0.005 | 0.06 | 0.004 | 0.02 | 0.04 | 0.06 | 0.29 |
| + 3 | 0.19 | 0.14 | 0.08 | 0.03 | 0.1 | 0.05 | 0.06 | 0.12 | 0.16 | 0.34 |
Table 4.
Technical and economic parameters of the project.
| № | Parameters | Unit of Measure | Indicator Values of the Options | ||
|---|---|---|---|---|---|
| 1 | 2 | 3 | |||
| 1 | Total area of land plot, including | ha | 13.54 | 13.18 | 12.59 |
| 1.1 | tilled area | ha | 0 | 0.52 | 4.04 |
| 1.2 | hayland | ha | 1.10 | 3.55 | 0.095 |
| 1.3 | forest | ha | 12.07 | 8.16 | 7.68 |
| 1.4 | other types of land | ha | 0.37 | 0.96 | 0.77 |
| 2 | Coefficient of land straightness | - | 1.02 | 1.01 | 1.04 |
| 3 | Length of linear part of gas pipeline | m | 3154.49 | 3274.71 | 3067.44 |
| 4 | Number of involved owners, landholders, land users and tenants | number | 5 | 6 | 6 |
| 5 | Total area of zones with restricted use regime | ha | 58.58 | 59.78 | 58.24 |
| 6 | Amount of rent | Rub | 681336.26 | 640461.13 | 604052.84 |
| 7 | Amount of loss suffered by owners, landholders, land users and tenants | Rub | 520503.43 | 1256617.49 | 2910851.93 |
| 8 | Area of land to be reclaimed | ha | 0.77 | 2.27 | 2.92 |
| 9 | Cost of construction | thousand rub | 83641.65 | 81682.79 | 79294.24 |
| 10 | Negative impact to agricultural activities | nature of impact | weak | moderate | strong |
Table 5.
estimation of land plot options for gas pipeline construction.
| Options | Integral Estimation |
|---|---|
| Variant 1 | 0.37 |
| Variant 2 | 0.22 |
| Variant 3 | 0.20 |
© 2019 by the authors. Licensee MDPI, Basel, Switzerland. This article is an open access article distributed under the terms and conditions of the Creative Commons Attribution (CC BY) license (http://creativecommons.org/licenses/by/4.0/).
Share and Cite
MDPI and ACS Style
Elena, B.; Gennadyevna, G.I. Land Plot Selection Rationale for the Location of Linear Facilities. Land 2019, 8, 67. https://doi.org/10.3390/land8040067
AMA Style
Elena B, Gennadyevna GI. Land Plot Selection Rationale for the Location of Linear Facilities. Land. 2019; 8(4):67. https://doi.org/10.3390/land8040067
Chicago/Turabian StyleElena, Bykowa, and Gerasimova Irina Gennadyevna. 2019. "Land Plot Selection Rationale for the Location of Linear Facilities" Land 8, no. 4: 67. https://doi.org/10.3390/land8040067
Note that from the first issue of 2016, this journal uses article numbers instead of page numbers. See further details here.