People and Post-Mining Environments: PPGIS Mapping of Landscape Values, Knowledge Needs, and Future Perspectives in Northern Finland

1
Department of Geographical and Historical Studies, University of Eastern Finland, P.O. Box 111, FI-80101 Joensuu, Finland
2
Environmental Policy Centre, Finnish Environment Institute, P.O. Box 140, FI-00251 Helsinki, Finland
*
Author to whom correspondence should be addressed.
Land 2018, 7(4), 151; https://doi.org/10.3390/land7040151
Submission received: 14 October 2018
/
Revised: 15 November 2018
/
Accepted: 30 November 2018
/
Published: 5 December 2018
(This article belongs to the Special Issue Geospatial Social Data and Participatory Mapping for Landscape Change and Socio-Environmental Systems)
Abstract
:Mining can have a notable environmental and social footprint both during the production phase and after the mine closure. We examined local stakeholders’ viewpoints on two post-mining areas in northern Finland, Hannukainen and Rautuvaara, using a public participation geographic information system (PPGIS) approach. Spatially explicit data on local residents’ and visitors’ values, knowledge needs, and future perspectives on mining landscapes were collected with an online map-based survey tool (Harava). The results show that post-mining sites were generally considered unpleasant places. A majority of respondents were of the opinion that areas would need better reclamation and landscaping measures. The landscape surrounding the post-mining sites contained a wide diversity of pleasant places with high nature and recreational value. Respondents addressed various environmental concerns related to the impacts of former mining activities on the quality of ground water and surface water, potential soil contamination, and the safety of natural products. Opinions on the planned mine reopening were strongly divided among the respondents. One of the key questions was whether a large open-pit mine and nature-based tourism can coexist in the same region. Our results highlight that “the shadow of the mine”—observed environmental impacts, uncertainties related to the spatial extent, duration, and magnitude of impacts, and knowledge gaps—can affect local stakeholders’ land use far outside the mining sites and long after the mine closure. Identifying and mapping stakeholder values, opinions, and knowledge needs could significantly improve post-mining land use planning and mitigate the loss of multifunctional landscapes.
1. Introduction
Global demand for minerals continues to increase with economic prosperity and globalization [1]. Northern regions have experienced a mining boom in the 21st century, with extensive exploration activities, restarting old mines, and opening new ones [2,3,4,5]. Mining often brings significant social, economic, and environmental changes to the region. On the one hand, mining activities can create new jobs and prosperity in local communities and boost regional economies. On the other hand, mining can have notable negative impacts on natural environments, and particularly nature-based industries and livelihoods, which can create the potential for conflicts among different stakeholders [6,7,8,9,10,11].
The environmental and social impacts of mining are not restricted to the active mining phase but can continue long after the mine closes. Mine closure takes place when mineral resources are exhausted, or mining is no longer economically profitable due to the high cost of mining or low market prices [12,13,14]. Post-mining areas usually differ significantly from the surrounding environment and can have limited future land use options [15,16,17]. Local communities in post-mining regions often face significant challenges related to altered landscapes and lowered environmental quality [18,19,20,21,22]. Particularly problematic are old abandoned or inadequately reclaimed mines, which can cause further degradation of the surrounding environment [23,24,25,26]. Mine reclamation means taking measures to return land to a stable condition, ensure public safety, minimize potential negative environmental impacts, and allow alternative land use opportunities [27,28,29,30].
Land use potential in post-mining regions depends on environmental, technical, economic, social, and cultural factors [29,31]. The most common post-mining land uses include agriculture, forestry, recreation, construction, conservation, and lakes [16,27,32,33]. A mine can also be reopened as a consequence of higher mineral prices or new technologies, which starts a new cycle of landscape dynamics [14,34]. The impacts of mining on the surrounding area depend on the characteristics of a specific project, such as size, duration, and mining methods (e.g., open-pit versus underground mining), as well as the location of the mine in the physical and human environments [20,27]. The average size of mining projects has increased, and ore grades have declined worldwide [2,35]. This means that the characteristics of old and new mines and, consequently, their environmental and social impacts can significantly differ.
Long-term sustainable development in mining regions requires better knowledge of how mining alters the local environment and affects future land use potential. Environmental transformations also bring forward questions on the distribution and magnitude of benefits and harms among local stakeholders [36,37,38,39,40,41]. Landscape-level studies in mining regions have often focused on mapping land cover dynamics with generalized land cover/land use classifications (e.g., References [42,43,44,45]). Descriptions of mining-induced alterations in the biophysical environment and landscape, however, cannot reveal the everyday impacts experienced by local communities and stakeholders. Further, more sustainable land use and management require understanding the values people associate with places and landscapes [46].
Public participation geographic information systems (PPGISs) provide spatially explicit methods and technologies to link stakeholders’ values, experiences, and land use preferences to specific locations in the landscape [47,48,49]. Place-based knowledge can significantly contribute to understanding how people perceive and experience the landscape, how they use their local environment, and what they want from it. Web-based PPGIS allows data to be collected over large areas and among different stakeholder groups [50,51]. In the context of mining, (public) participatory GIS approaches have been applied, e.g., to identify locations with potential future land use conflicts [52,53], to communicate the impacts of mining on reindeer grazing areas [6], and to assess the restoration history of post-mining sites [54].
Modern metal mining in Finland dates back to the first part of the 20th century, and mines have been established particularly in northern and eastern parts of the country [55]. These regions contain recently opened mines, planned mining projects, and a notable number of post-mining sites in a wide variety of physical and human environments. Despite the long mining history in Finland, post-mining landscapes have received relatively little scientific attention [16]. To our knowledge, there have been no spatially explicit studies on the long-term impacts of mining on local land use or stakeholder values in post-mining landscapes in Finland or elsewhere.
We studied landscape values, knowledge needs, and land use preferences by local residents and visitors in two post-mining areas in northern Finland, Hannukainen and Rautuvaara, using a PPGIS approach. The studied iron ore–copper mines were closed three decades ago, and the reopening of the mining sites has been planned in recent years. In this paper, we focus on the following questions: (1) What kind of opinions and perceptions do different stakeholders have on the post-mining areas? (2) What kind of positive and negative values (co)exist in the post-mining areas and the surrounding regions? (3) Does the post-mining landscape contain sites of specific environmental concern? (4) How would mine reopening impact the current land use from the different stakeholders’ perspectives?
2. Materials and Methods
2.1. Study Area
2.1.1. Landscape Characteristics
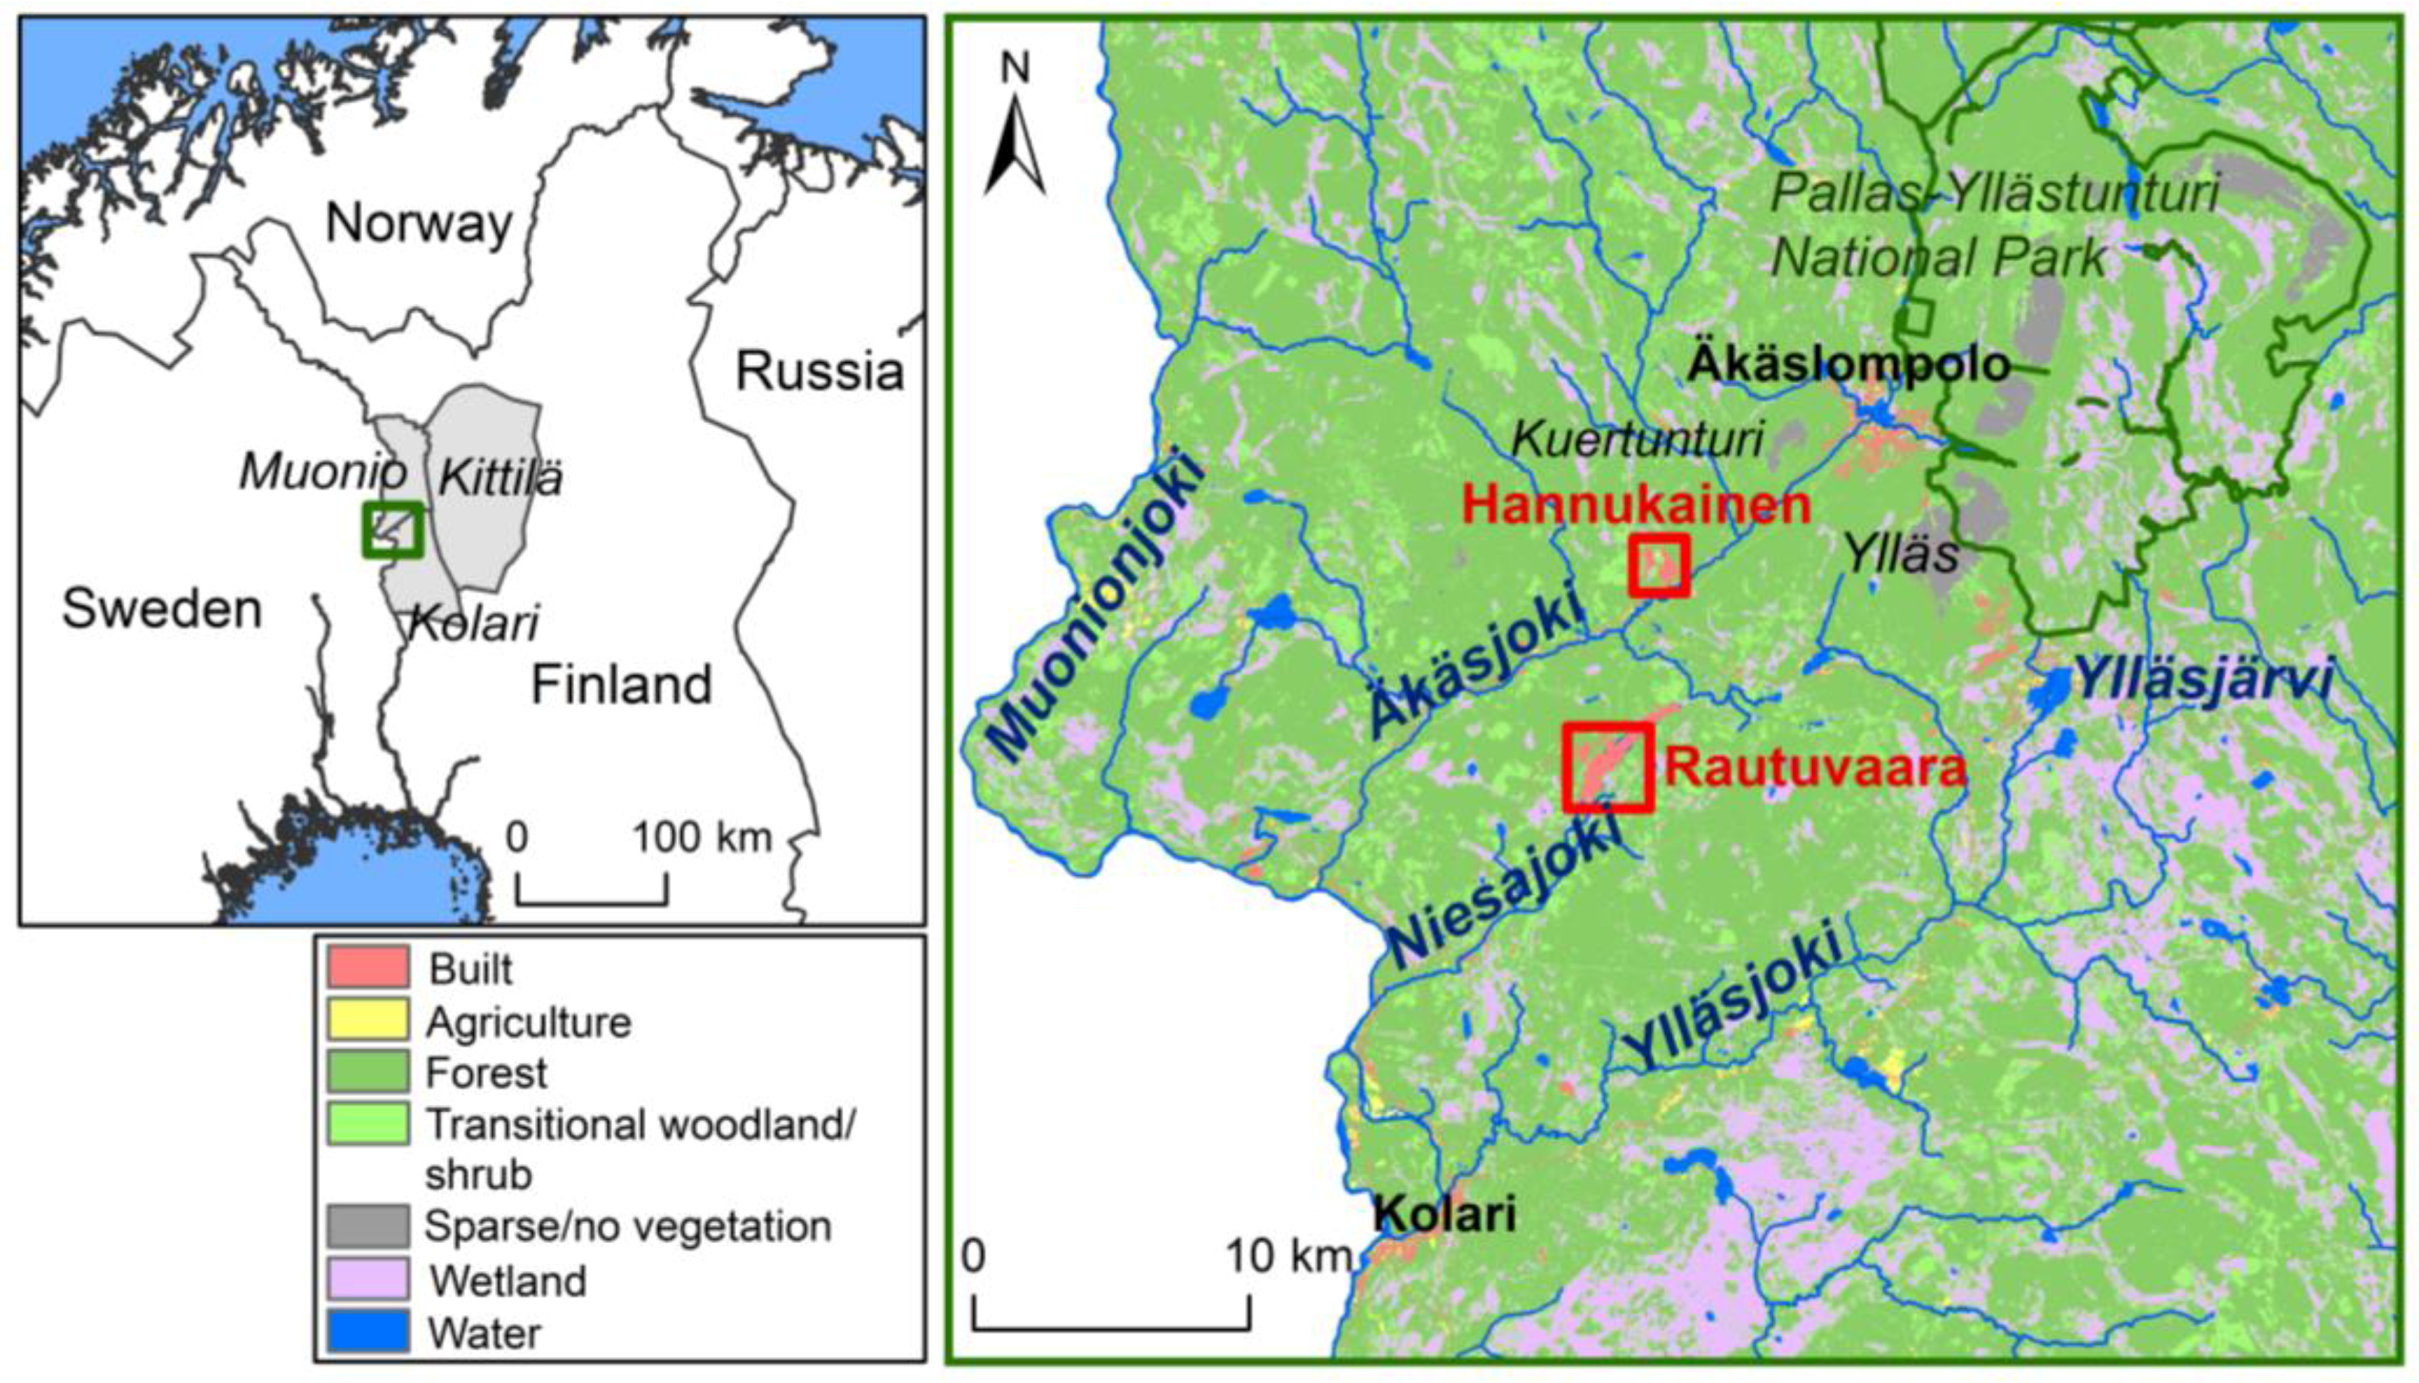
The study area is located in the northern boreal zone in northwestern Finland (Figure 1). The mean annual air temperature was −1.0 °C and the mean annual precipitation was 521 mm during the climatological normal period 1981–2010. The ground is covered with snow about 7 months of the year [56]. The landscape is dominated by northern boreal forests, mires, and fell chains [57]. Scots pine (Pinus sylvestris L.) and Norway spruce (Picea abies (L.) Karst.) are the main tree species in coniferous forests, and the average elevation of the actual timberline is less than 400 m.a.s.l. Coniferous tree line borders scattered mountain birch forests (Betula pubescens ssp. czerepanovii) or directly treeless mountain heaths [58]. The highest fell tops are Yllästunturi (718 m.a.s.l.) and Lainiotunturi (613 m.a.s.l.).
The studied post-mining sites, Hannukainen and Rautuvaara, are located in the Kolari municipality with a population of around 3800 inhabitants (Figure 1). Tourism, forestry, reindeer herding, and other nature-based livelihoods are major land uses in the area. Tourism is strongly concentrated at the Ylläs ski resort, which is situated approximately 10 km from the closed Hannukainen mine [11]. The Pallas-Yllästunturi National Park, the most visited protected area in Finland (553,000 visits in 2017), is an important nature-based tourism destination. Popular recreational activities include hiking and cross-country skiing [59]. The River Muonionjoki (continuing as River Tornionjoki downstream) on the border of Finland and Sweden is an important free-flowing salmon river and part of the Natura 2000 protection network [60]. The River Muonionjoki and River Äkäsjoki are known to be important for supporting populations of both Baltic Sea salmon and sea trout [61,62,63].
2.1.2. Hannukainen and Rautuvaara Post-Mining Sites
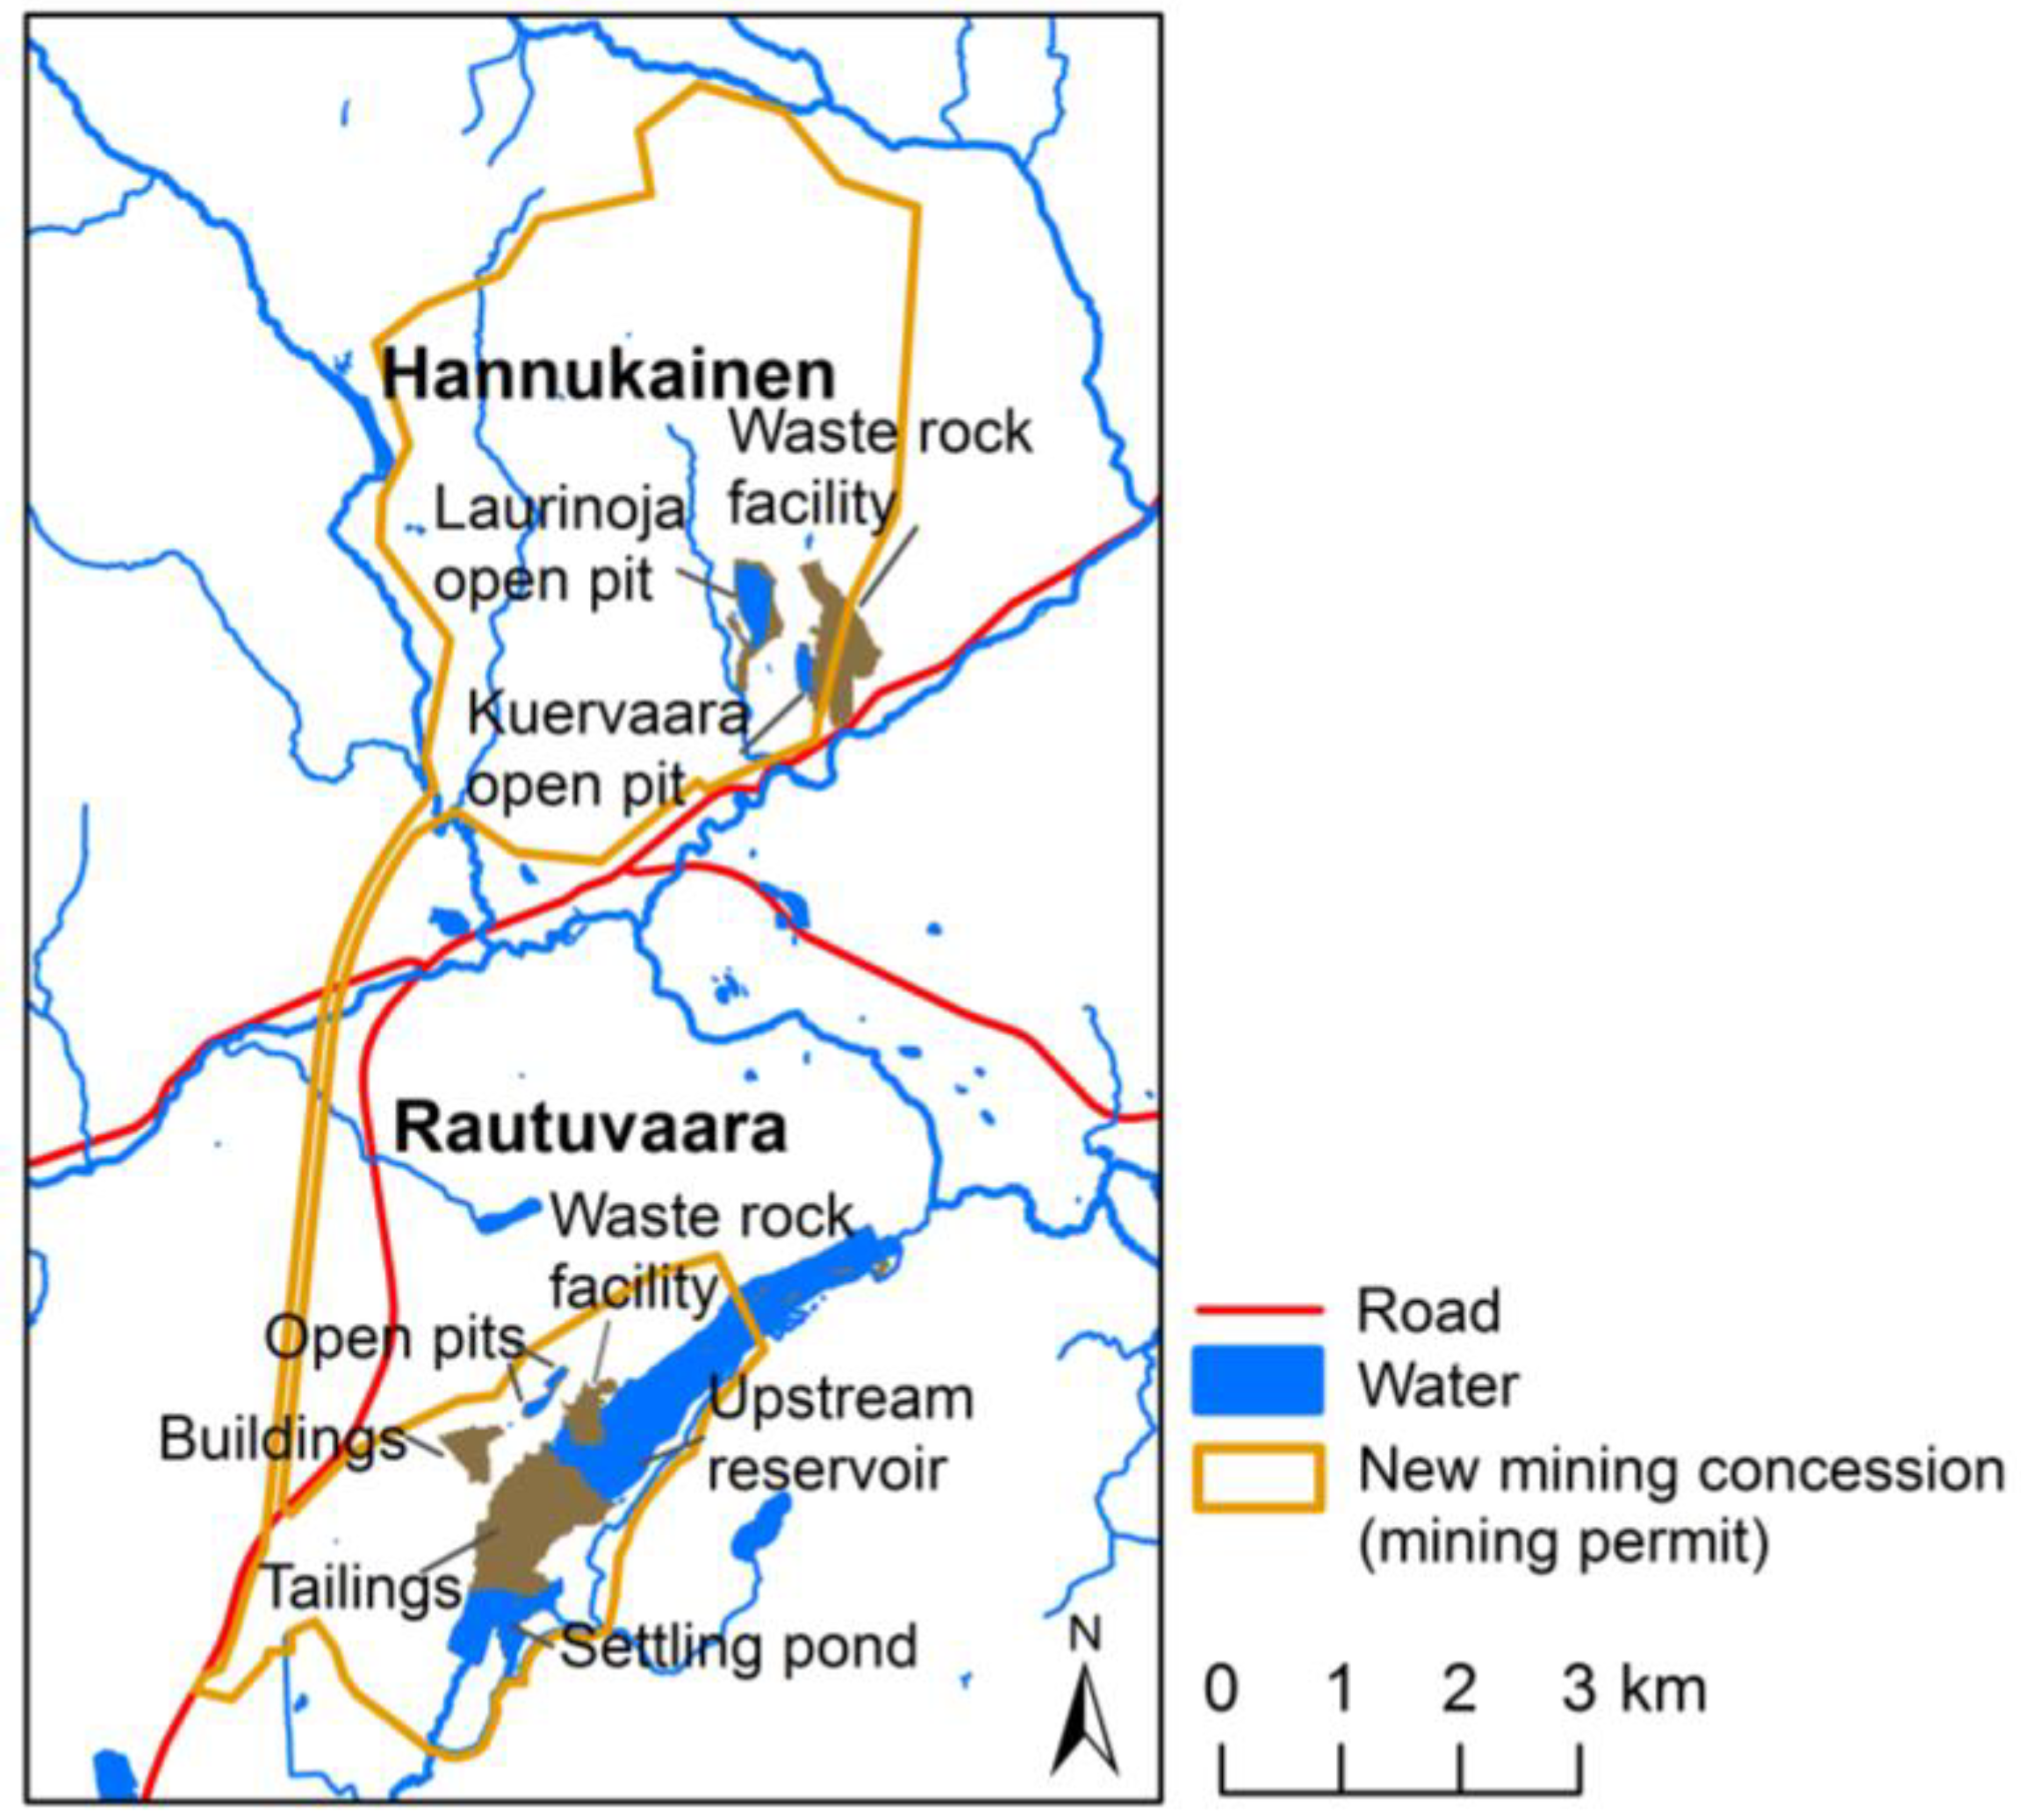
The Hannukainen iron–copper mine operated in 1978–1990 and the Rautuvaara iron mine in 1962–1988 (Figure 2). The total excavation (ore and waste rock) in Hannukainen and Rautuvaara was 10.2 Mt and 12.9 Mt, respectively. The Hannukainen mining site includes 2 water-filled open pits, Laurinoja (16 ha) and Kuervaara (5 ha), and a waste rock facility. The Rautuvaara mining site contains 2 water-filled open-pits (1 ha and 4 ha), an underground mine, tailings (135 ha), a settling pond, an upstream reservoir, and a waste rock facility. A concentration plant operated in Rautuvaara until 1996. No major reclamation or landscaping measures have been carried out at the mining sites. At the Hannukainen site, construction materials have been extracted for the needs of the local community [65,66,67,68]. The northern part of the water reservoir in Rautuvaara is utilized by the Ylläs wastewater treatment plant [63].
Reopening of the mining sites was first planned by Northland Resources S.A. (Northland Mines Oy in Finland) in 2005–2014. In 2015, Hannukainen Mining Oy (Tapojärvi Oy, Finland) took over the project after Northland Mines went bankrupt [69]. The mining concession (mining permit), covering nearly 3000 ha, was licensed in 2017 and the legal validation process is ongoing (Figure 2). The annual excavation is estimated to be 5–7 Mt iron ore and 18–30 Mt waste rock (the total amount of excavated waste rock is 370 Mt). The mining plan includes the establishment of 2 open pits of 200 ha and 55 ha, large waste rock facilities, tailings, and other infrastructure. Iron ore would be transported from the Hannukainen area to the Rautuvaara concentration plant via a conveyor belt. Processed mine water would be discharged to Muonionjoki via a pipeline. The estimated active mining period is 17–25 years, after which mine closure would take approximately 5 years and monitoring the next 30 years [70,71].
2.2. Public Participation GIS Data and Methods
Public participation GIS data were gathered using an interactive map-based survey tool, Harava, which enables the collection of citizens’ experiences and opinions online [72]. The Harava system allows both map surveys and conventional surveys (e.g., multiple-choice questions and text fields) to be conducted. In a Harava map survey, respondents can mark on the map points, lines, or areas that describe meaningful places to them. This provides an efficient approach to locate and make visible, e.g., different values, local environmental knowledge, and human–landscape relationships [51].
The Harava survey was directed to local residents and visitors age 15 years or older in the Kolari, Muonio, and Kittilä municipalities (Figure 1). The survey (in Finnish) consisted of 4 map questions with detailed subquestions, 13 questions based on a Likert scale, 9 multiple-choice questions (yes/no/no opinion) with optional text, and 1 free-text question. In the case of map questions, respondents were asked to mark points on the map of the Hannukainen and Rautuvaara mining sites or elsewhere in the surrounding area describing (1) pleasant places (positive experiences); (2) unpleasant places (negative experiences); (3) places where more information is needed on the state of the environment, and (4) places where positive or negative impacts of mine reopening would be experienced. Respondents were able to zoom in and out on the background map to identify the places and make accurate map markings. A popup window opened after each map marking and asked in detail the respondent’s opinions and perceptions of the location. Multiple-choice questions were related to respondents’ opinions on (1) the Hannukainen and Rautuvaara post-mining areas; (2) reopening of the mines, and (3) environmental impacts of mining.
Background information was collected with 14 questions. The questions included the respondent’s gender, age, place of residence, family form, education, occupation, and work and leisure in the study area. We also asked whether the respondent lived or owned a vacation home within 20 km distance or farther from the mining sites, and whether the respondent had visited the mining sites or observed them from a distance. The survey was publicly available online for 30 days between 18 January and 16 February 2017. The survey was promoted in a local newspaper, in Facebook groups, in a mining seminar in Kolari, and by sending e-mail invitations to local organizations, societies, and entrepreneurs related to mining, tourism, nature conservation, reindeer herding, and outdoor activities.
A Pearson chi-square test was conducted to study the association between the respondent’s opinions and his or her gender, age, relation to the region, and relation to the mining industry. To calculate the statistics, the responses for each question on a Likert scale were collapsed into 2 categories, agree (strongly agree/agree) and disagree (strongly disagree/disagree).
Spatial data collected in the survey were analyzed and visualized by ArcGIS 10.5.1 software (Esri). We calculated the total sum of map markings for pleasant places, unpleasant places, places where more knowledge on the state of the environment was needed, and places where positive or negative impacts of mine reopening would be experienced within 1 km grid squares to study their distribution and to identify “hotspots” of particularly meaningful places in the landscape. The detailed point data were not shown on the maps to protect the anonymity of responses. A few map markings located a significantly long distance from the study area were excluded from the analyses. The proportion of overlapping 1 km grid squares (with one or more map markings) was calculated to examine co-occurrence of different values. Further, the number of map markings related to the 4 studied categories was calculated within old mining sites, a new mining concession, 1 km, 2 km, and 5 km buffer zones calculated around a new mining concession, and elsewhere in the landscape.
3. Results
3.1. Survey Participation and Characteristics of Respondents
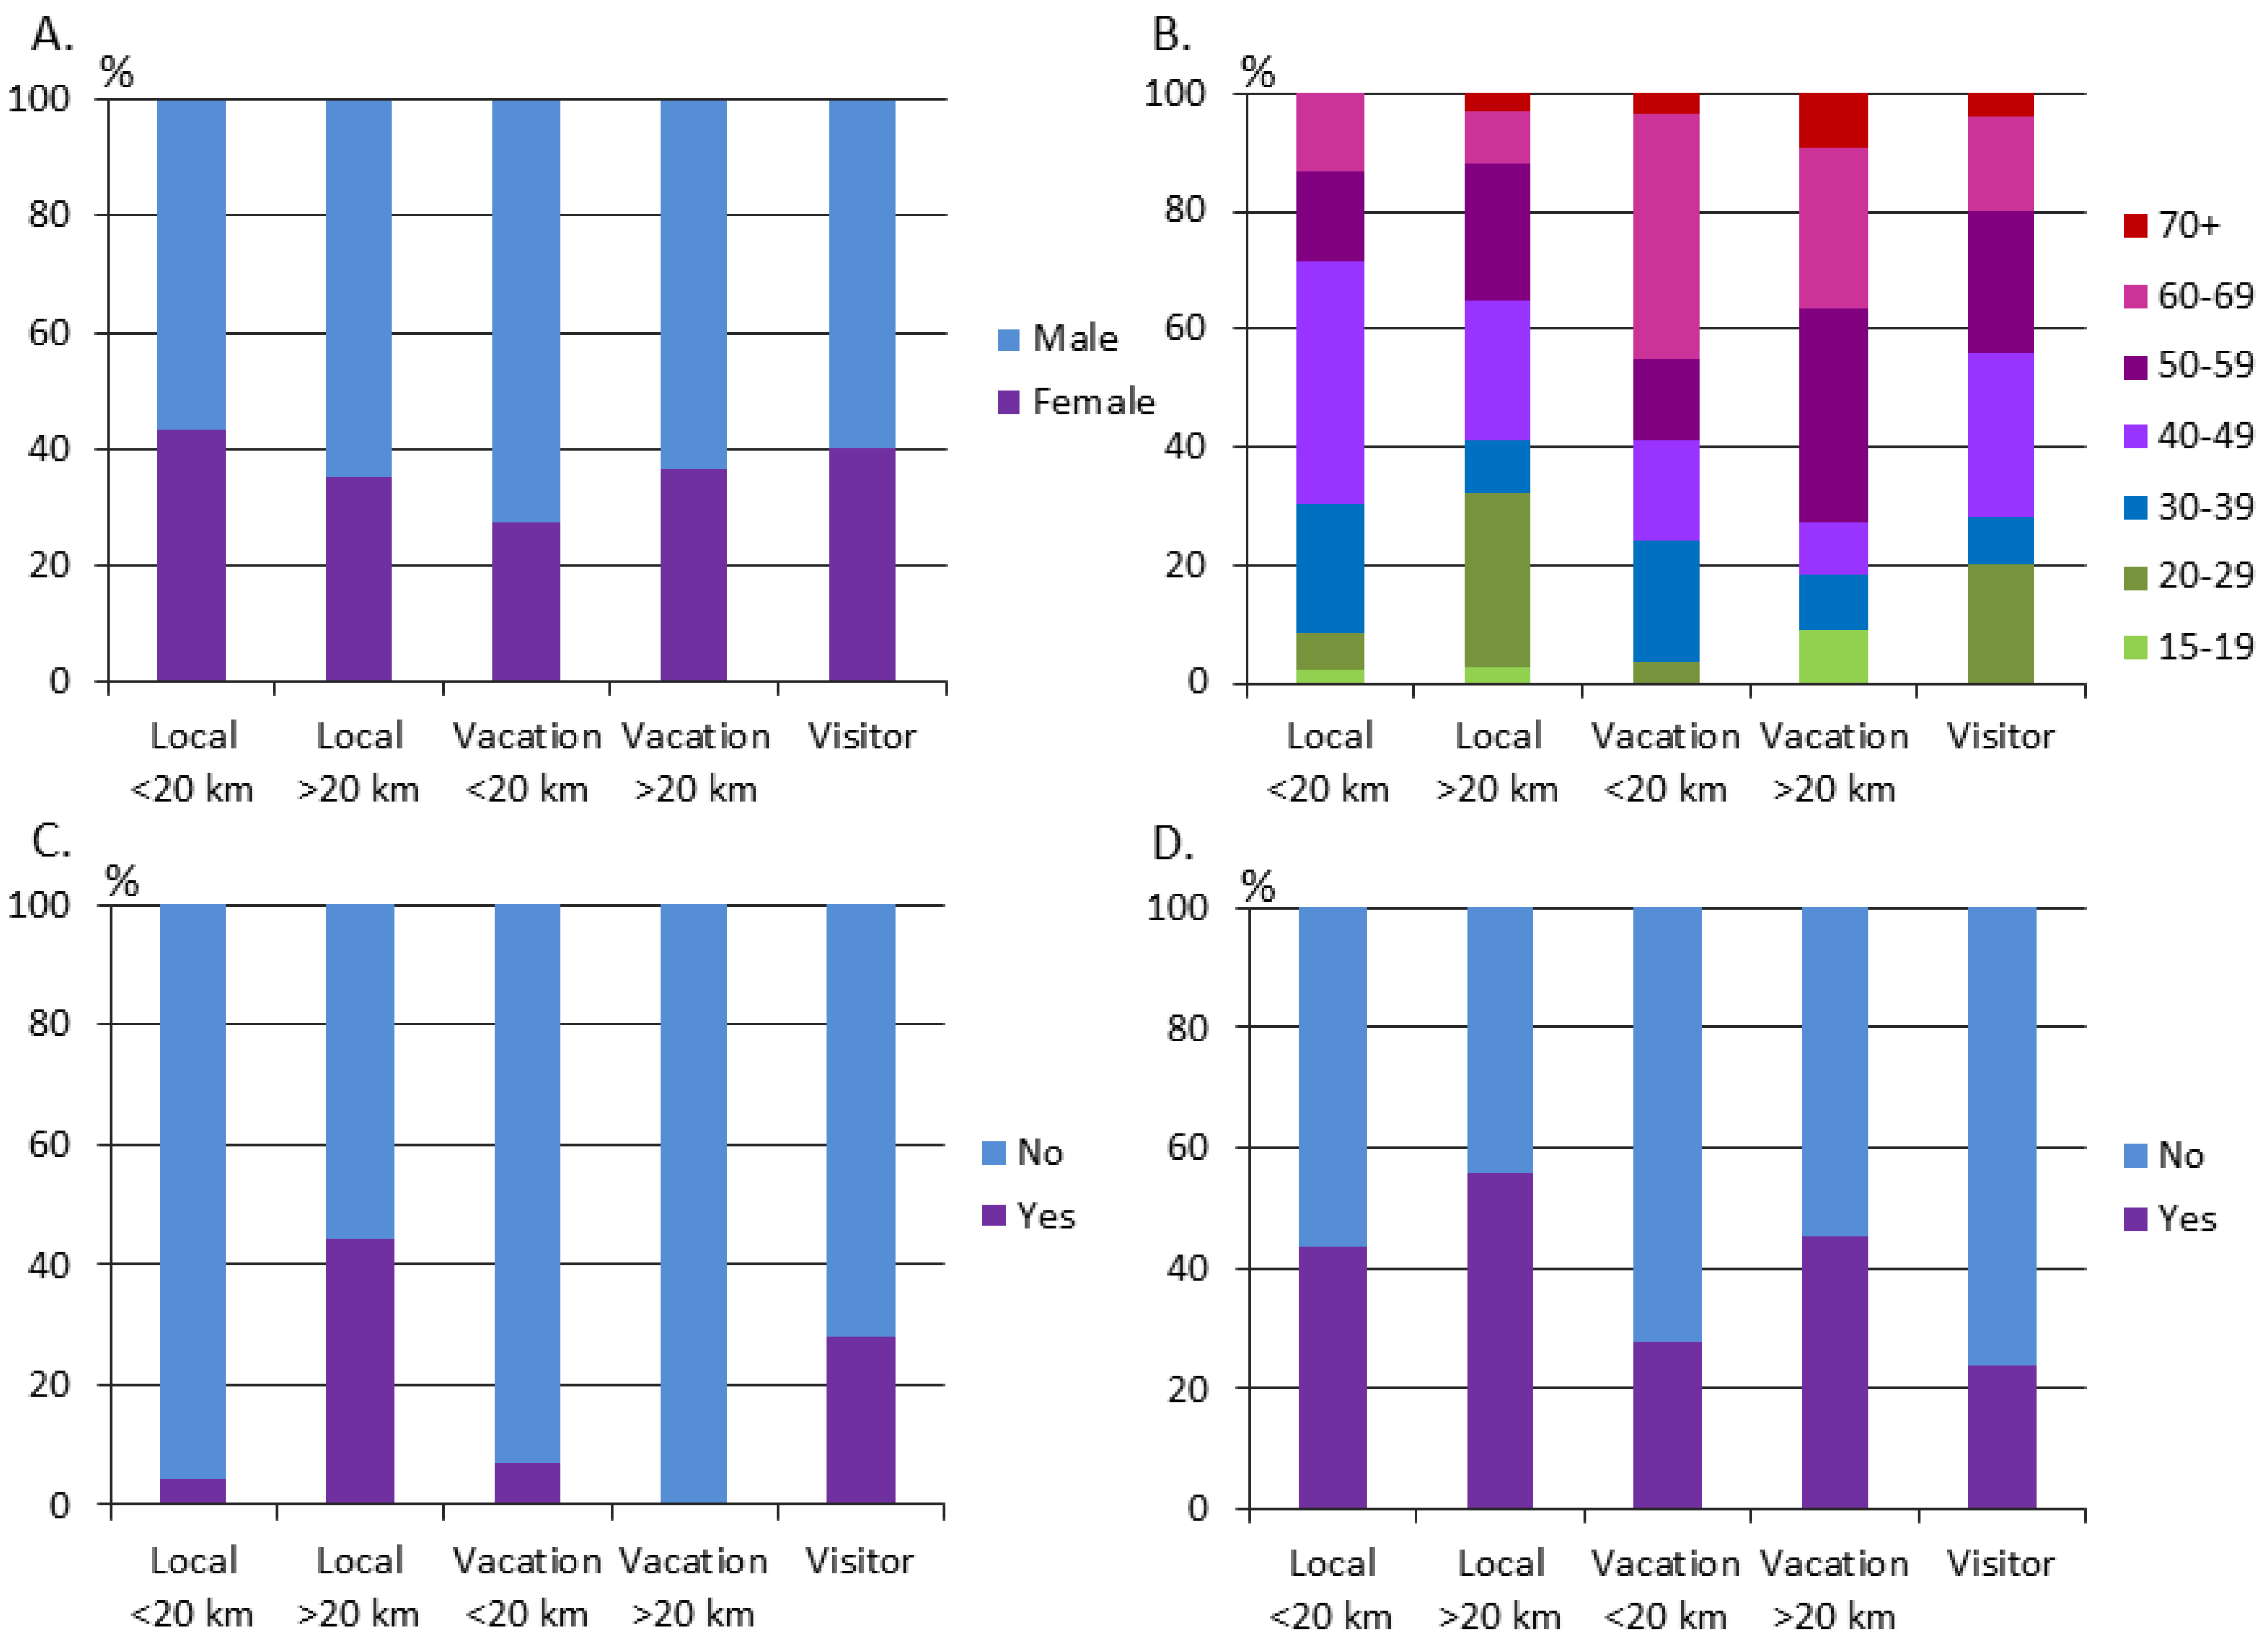
We included in the analyses data from 145 respondents who completed the whole survey, i.e., replied to map questions and other survey questions. In addition, the survey had been opened or partly replied to 70 times. Of 145 respondents, 37% were female and 63% were male (Table 1). Nearly half of the respondents were 40–59 years of age, 30% were 15–39, and 22% were 60 or older. Approximately 55% of the respondents were local residents living in the Kolari, Muonio, and Kittilä municipalities, and 28% were vacation home owners not living permanently in the region. Over half of the respondents lived permanently or owned a vacation home less than 20 km from the studied post-mining sites. Furthermore, 17% of the respondents were visitors who spent leisure time or worked in the region. Approximately 18% of the respondents were working or had worked in the mining industry, and 40% had a relative whose work was/had been related to mining.
The highest proportion of 15- to 29-year-old respondents (32%) was found among local residents living >20 km from the mining sites, whereas the highest proportion of respondents 60 years or older was found among vacation home owners (<20 km, 45%; >20 km, 36%) (Figure 3). Approximately 44% of local respondents living >20 km from the mining sites were working or had worked in the mining industry, and 56% had a relative whose work was/had been related to the mining industry. These proportions were notably smaller among other respondents.
A majority of the respondents (80%) spent time in nature or pursued outdoor activities in the study region. Approximately 57% of the respondents picked wild berries, mushrooms, and other products, 52% went fishing or hunting, and 4% had a nature-based occupation. Furthermore, 58% of respondents used tourism services in the area, and 28% worked in the tourism industry. Approximately 84% of the respondents had visited the post-mining sites or their close surroundings, and 65% had observed the closed mining sites from a distance from a high place.
3.2. Opinions on the Current State of Post-Mining Areas and Their Impacts on Land Use
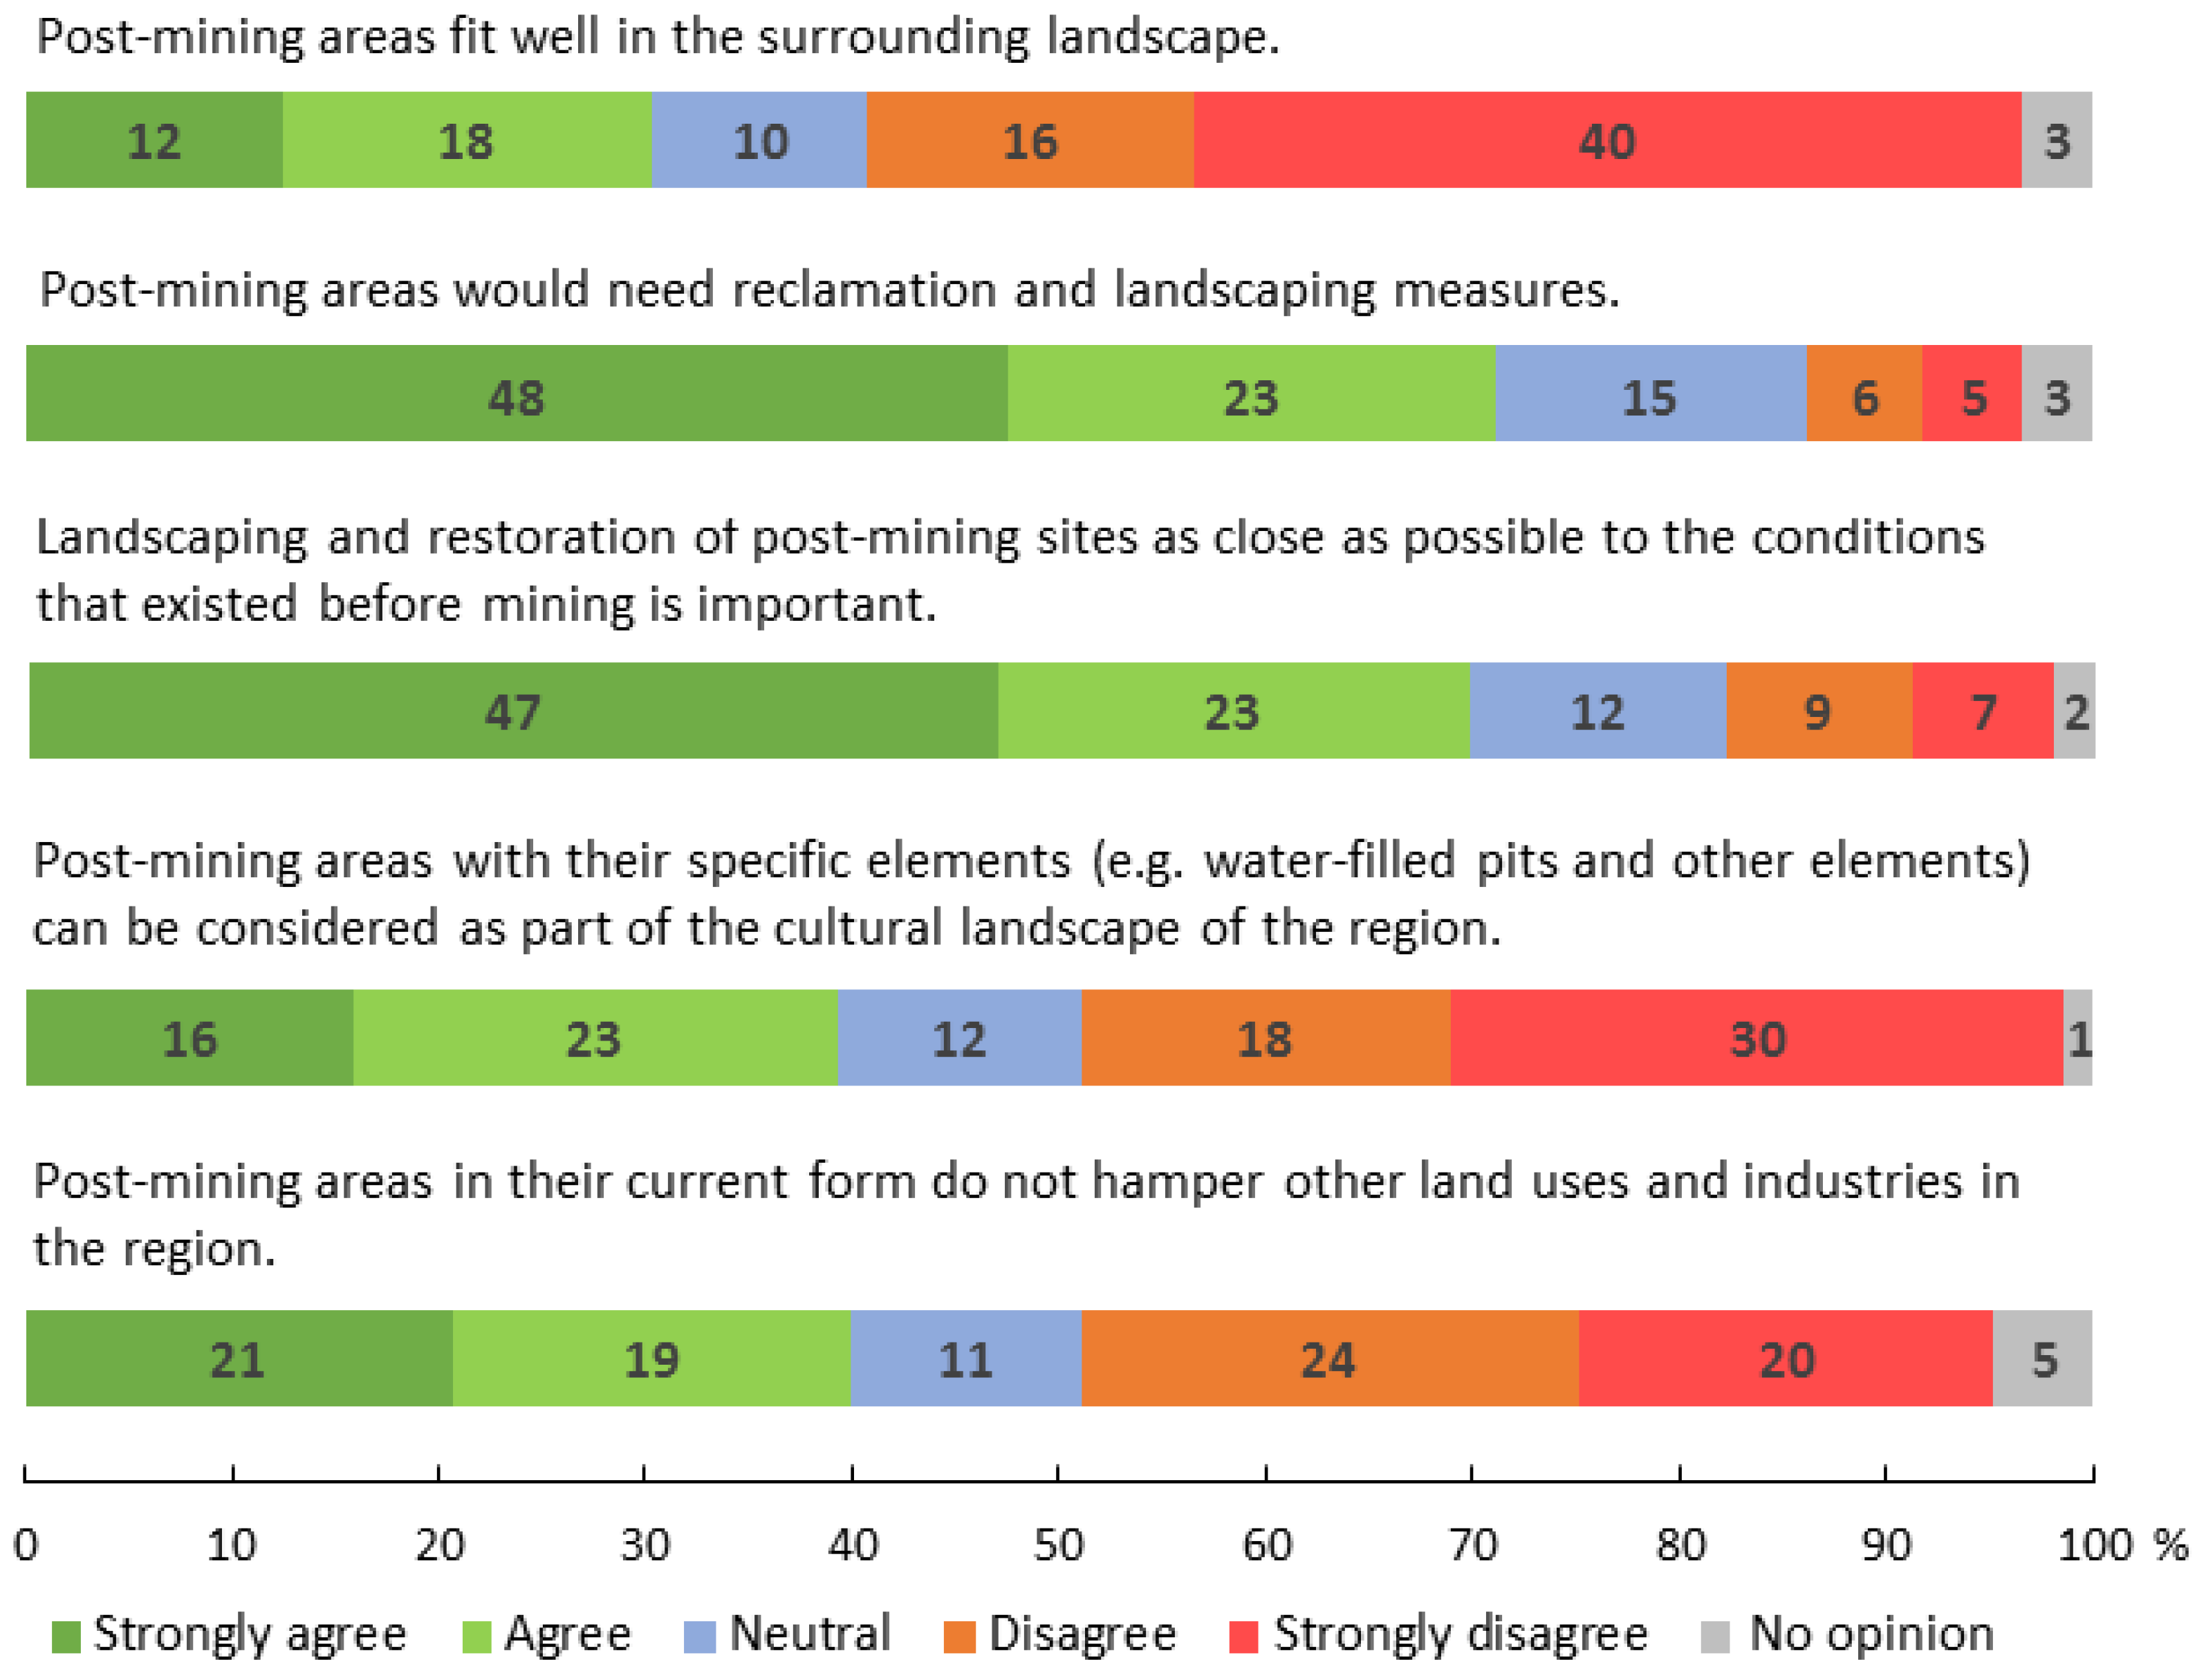
Over half of the respondents strongly disagreed/disagreed that post-mining areas fit well in the surrounding landscape (Figure 4). A majority of the respondents (71%) strongly agreed/agreed that post-mining areas would need reclamation and landscaping measures and that landscaping and restoration of post-mining sites as close as possible to the conditions that existed before mining is important (70%). Nearly half of the respondents strongly disagreed/disagreed that post-mining areas with their specific elements can be considered as part of the cultural landscape of the region, whereas 39% of the respondents strongly agreed/agreed with this statement. Furthermore, 44% of the respondents strongly disagreed/disagreed, and 40% strongly agreed/agreed with the statement that post-mining areas in their current form do not hamper other land uses and industries in the region.
A significant difference of opinions was found among respondents whose work or relative’s work was/had been related to the mining industry and respondents with no relation to the mining industry (Table 2). Positive opinions on post-mining areas and negative opinions on the reclamation, restoration, and landscaping needs were found to be more common among respondents with a connection to the mining industry and those living more than 20 km away from the mining sites. A significant relationship was found between respondents’ opinions on some of the statements and their age. In general, the relatively highest proportion of positive opinions on post-mining areas was found within the age group 20–29 years, whereas the relatively highest proportion of negative opinions was found within the age group 60–69 years. No difference in opinion was found between female and male respondents.
There was a significant association between respondents’ opinions and their relationship to the region (Table 2 and Table 3). A majority of respondents, excluding local residents living farther than 20 km from the closed mining sites, disagreed that post-mining sites fit well in the surrounding landscape. Many of the respondents living more than 20 km away from the mining sites agreed that post-mining sites can be considered as part of the cultural landscape and do not hamper other land uses and industries in the region, whereas especially vacation home owners disagreed with these statements. A majority of respondents in all groups, particularly vacation home owners and visitors, agreed that post-mining areas would need reclamation and landscaping measures and that landscaping and restoration as close as possible to the conditions that existed before is important.
3.3. Opinions on the Planned Mine Reopening and Its Impacts
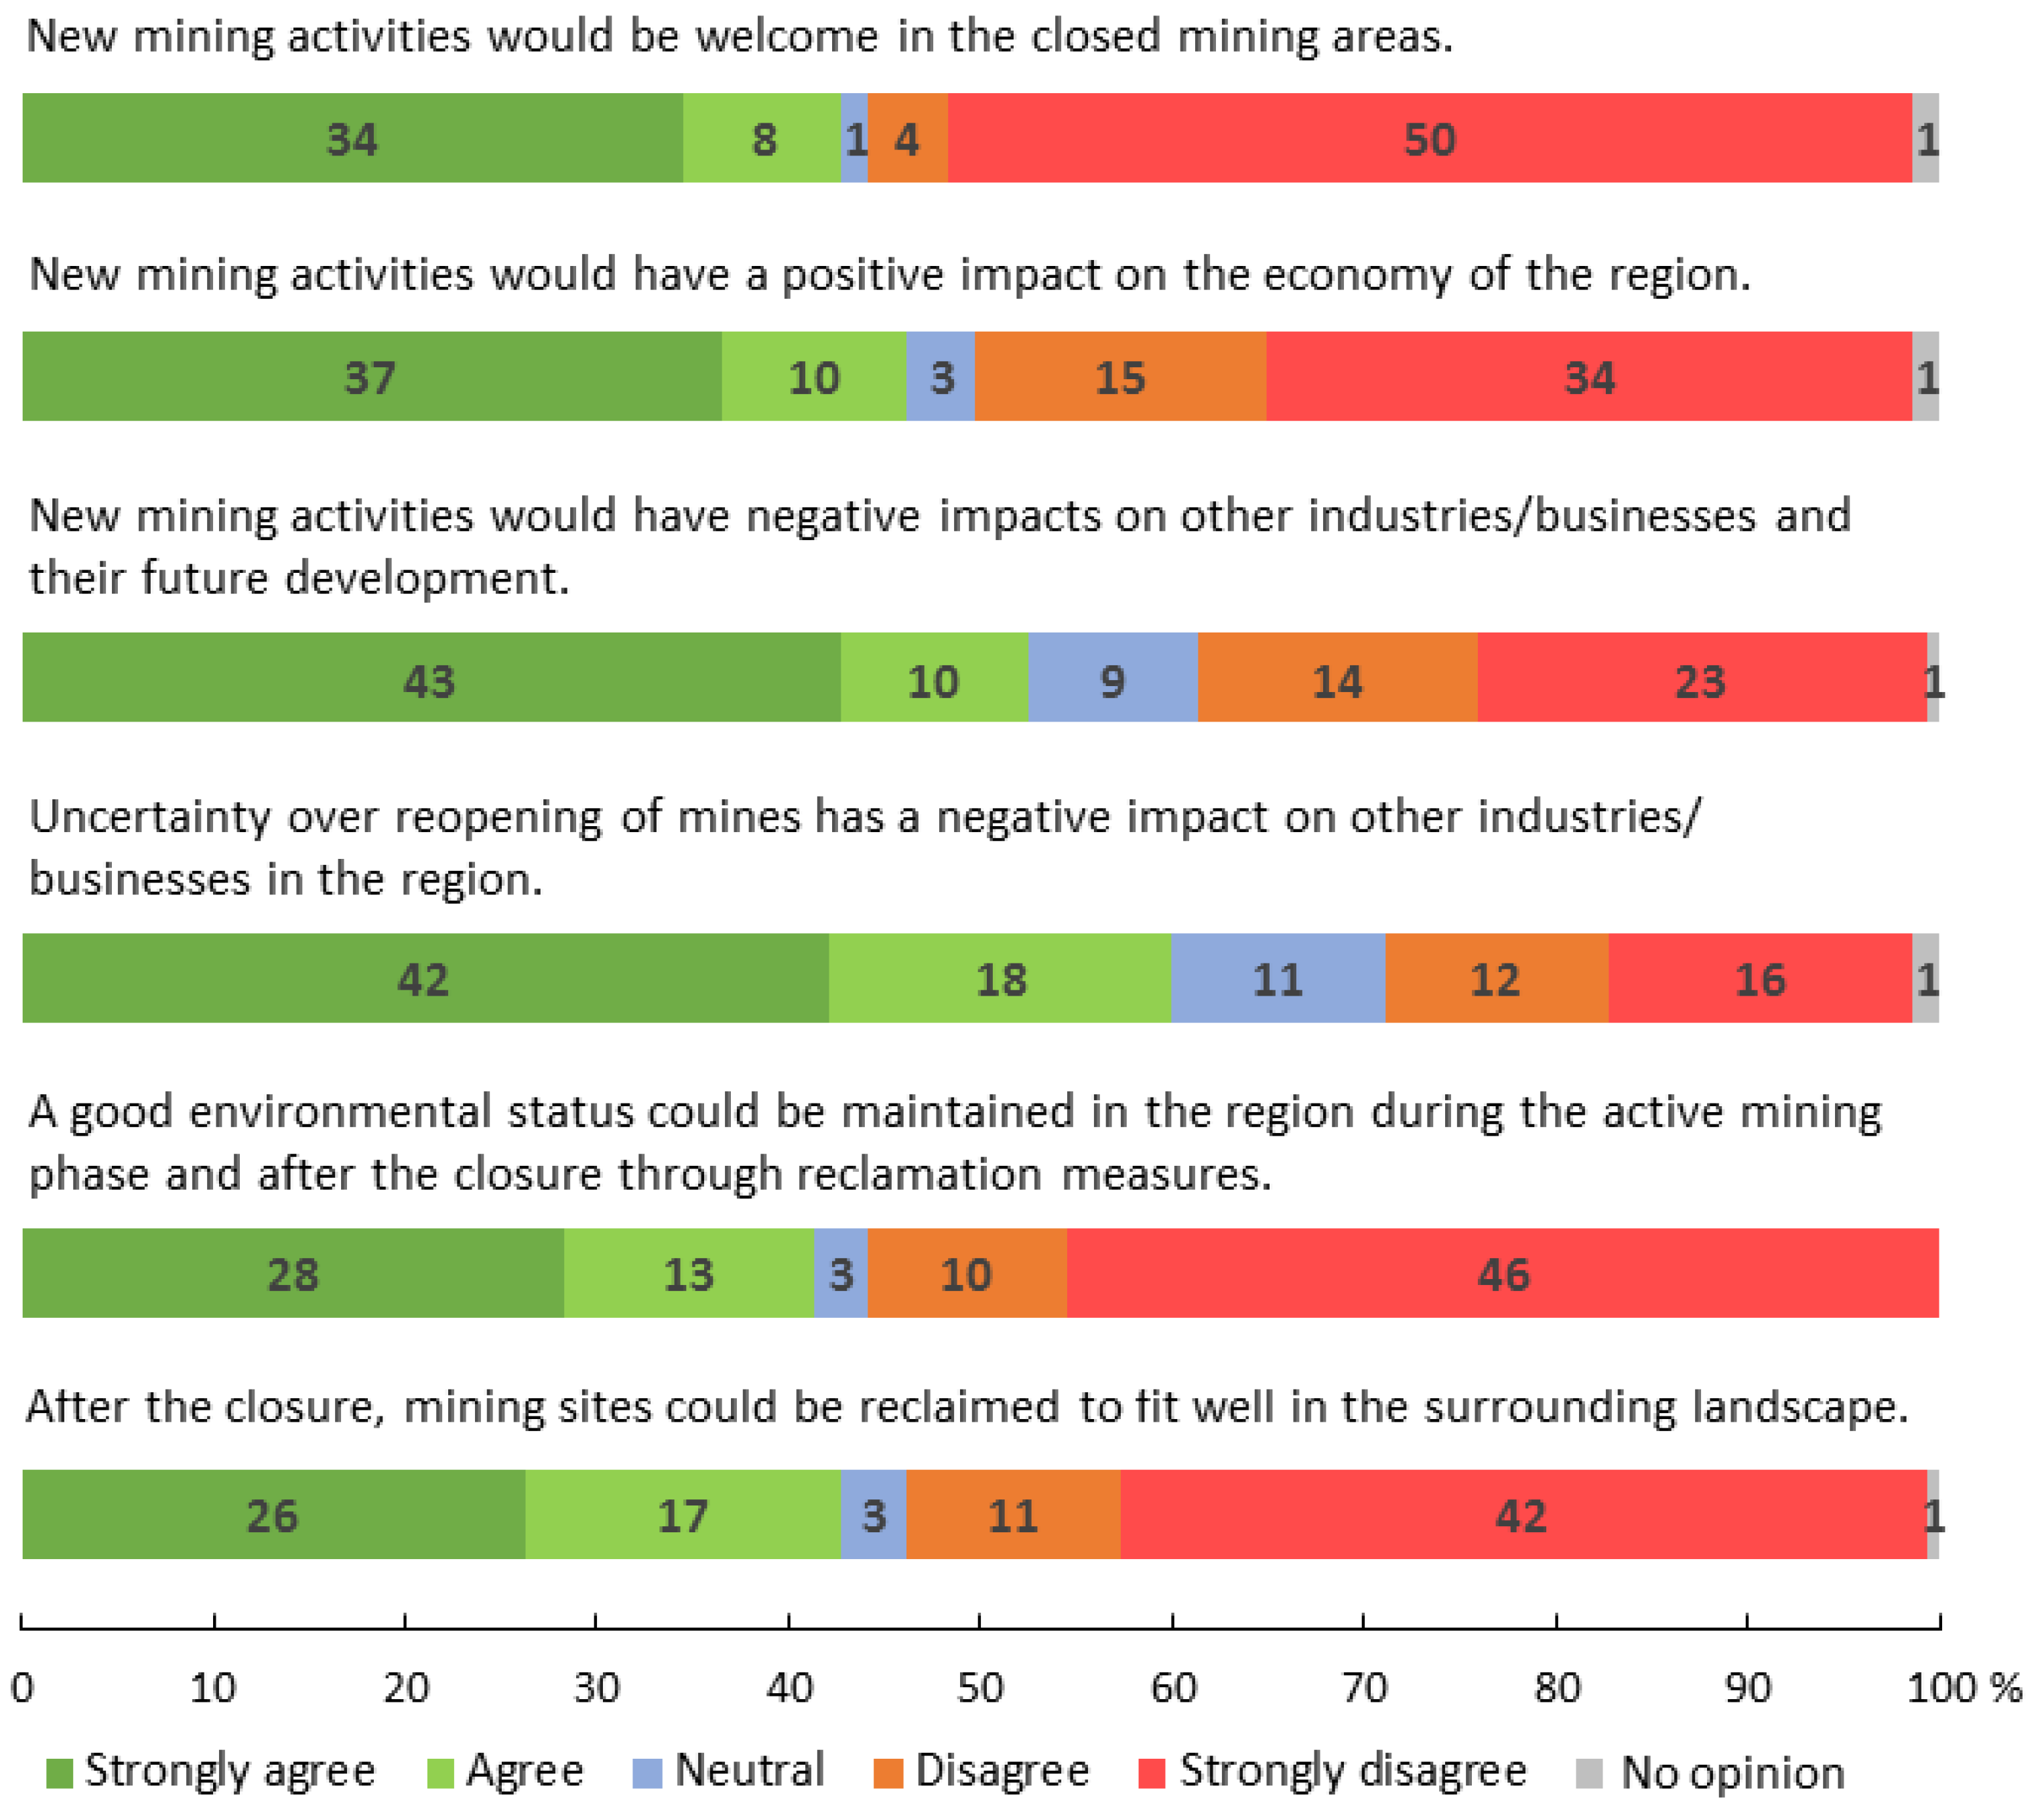
Approximately 54% of the respondents strongly disagreed/disagreed, and 42% strongly agreed/agreed that new mining activities would be welcome in the closed mining areas (Figure 5). Nearly half of the respondents strongly disagreed/disagreed that new mining activities would have a positive impact on the regional economy, while another half strongly agreed/agreed with the statement. Over half of the respondents strongly agreed/agreed that new mining activities would have a negative impact on other industries/businesses and their future development, whereas 37% strongly disagreed/disagreed. Furthermore, 60% of the respondents strongly agreed/agreed that uncertainty over the reopening of mines has a negative impact on other industries/businesses in the region, whereas 28% strongly disagreed/disagreed. Over half of the respondents strongly disagreed/disagreed that a good environmental status could be maintained in the region during the active mining phase and after closure through reclamation measures and that mining sites could be reclaimed to fit well in the surrounding landscape after closure. Approximately 41–43% of the respondents strongly agreed/agreed with these statements.
A significant difference of opinion was found among respondents whose work or relative’s work was/had been related to the mining industry and respondents with no relationship to the mining industry (Table 4). Positive opinions on new mining activities tended to be more common among respondents who were working/had worked or whose relatives were working/had worked in the mining industry. No significant difference in opinion was found between female and male respondents or among different age groups (except one statement).
A significant relationship was found between respondents’ opinions and their relationship to the region (Table 4 and Table 5). New mining activities were most supported by local residents living over 20 km from the mines. A majority agreed that mining would have a positive impact on the economy of the region and that a good environmental status could be maintained during the production phase and after the mine closure. On the contrary, a majority of vacation home owners and over half of local residents living less than 20 km from the mines disagreed with these statements. The opinions on new mining activities and their economic and environmental impacts were rather evenly distributed among visitors. A majority of respondents, excluding local residents living over 20 km from mines, agreed that uncertainty over mine reopening has a negative impact on other industries/businesses in the region.
Figure 6 shows the relationship between respondents’ activities in the region and their opinions on new mining activities in the closed mining areas. A majority of respondents (61–70%) who work in the tourism industry, use tourism services or pursue outdoor activities in nature resisted new mining activities. The opinions on mining were more evenly distributed within other classes.
Respondents were also asked their opinion on the new mining projects in Finland. Approximately 49% of respondents supported, and 34% did not support new mining projects at the national level, 11% were neutral, and 6% did not have an opinion. There was a significant association between respondents’ opinions on new mining projects and their relationship to the region and to the mining industry through their own or a relative’s work. No significant difference was found between respondents’ opinions and their gender or age.
3.4. Values, Opinions, and Knowledge Needs of Specific Places in the Landscape
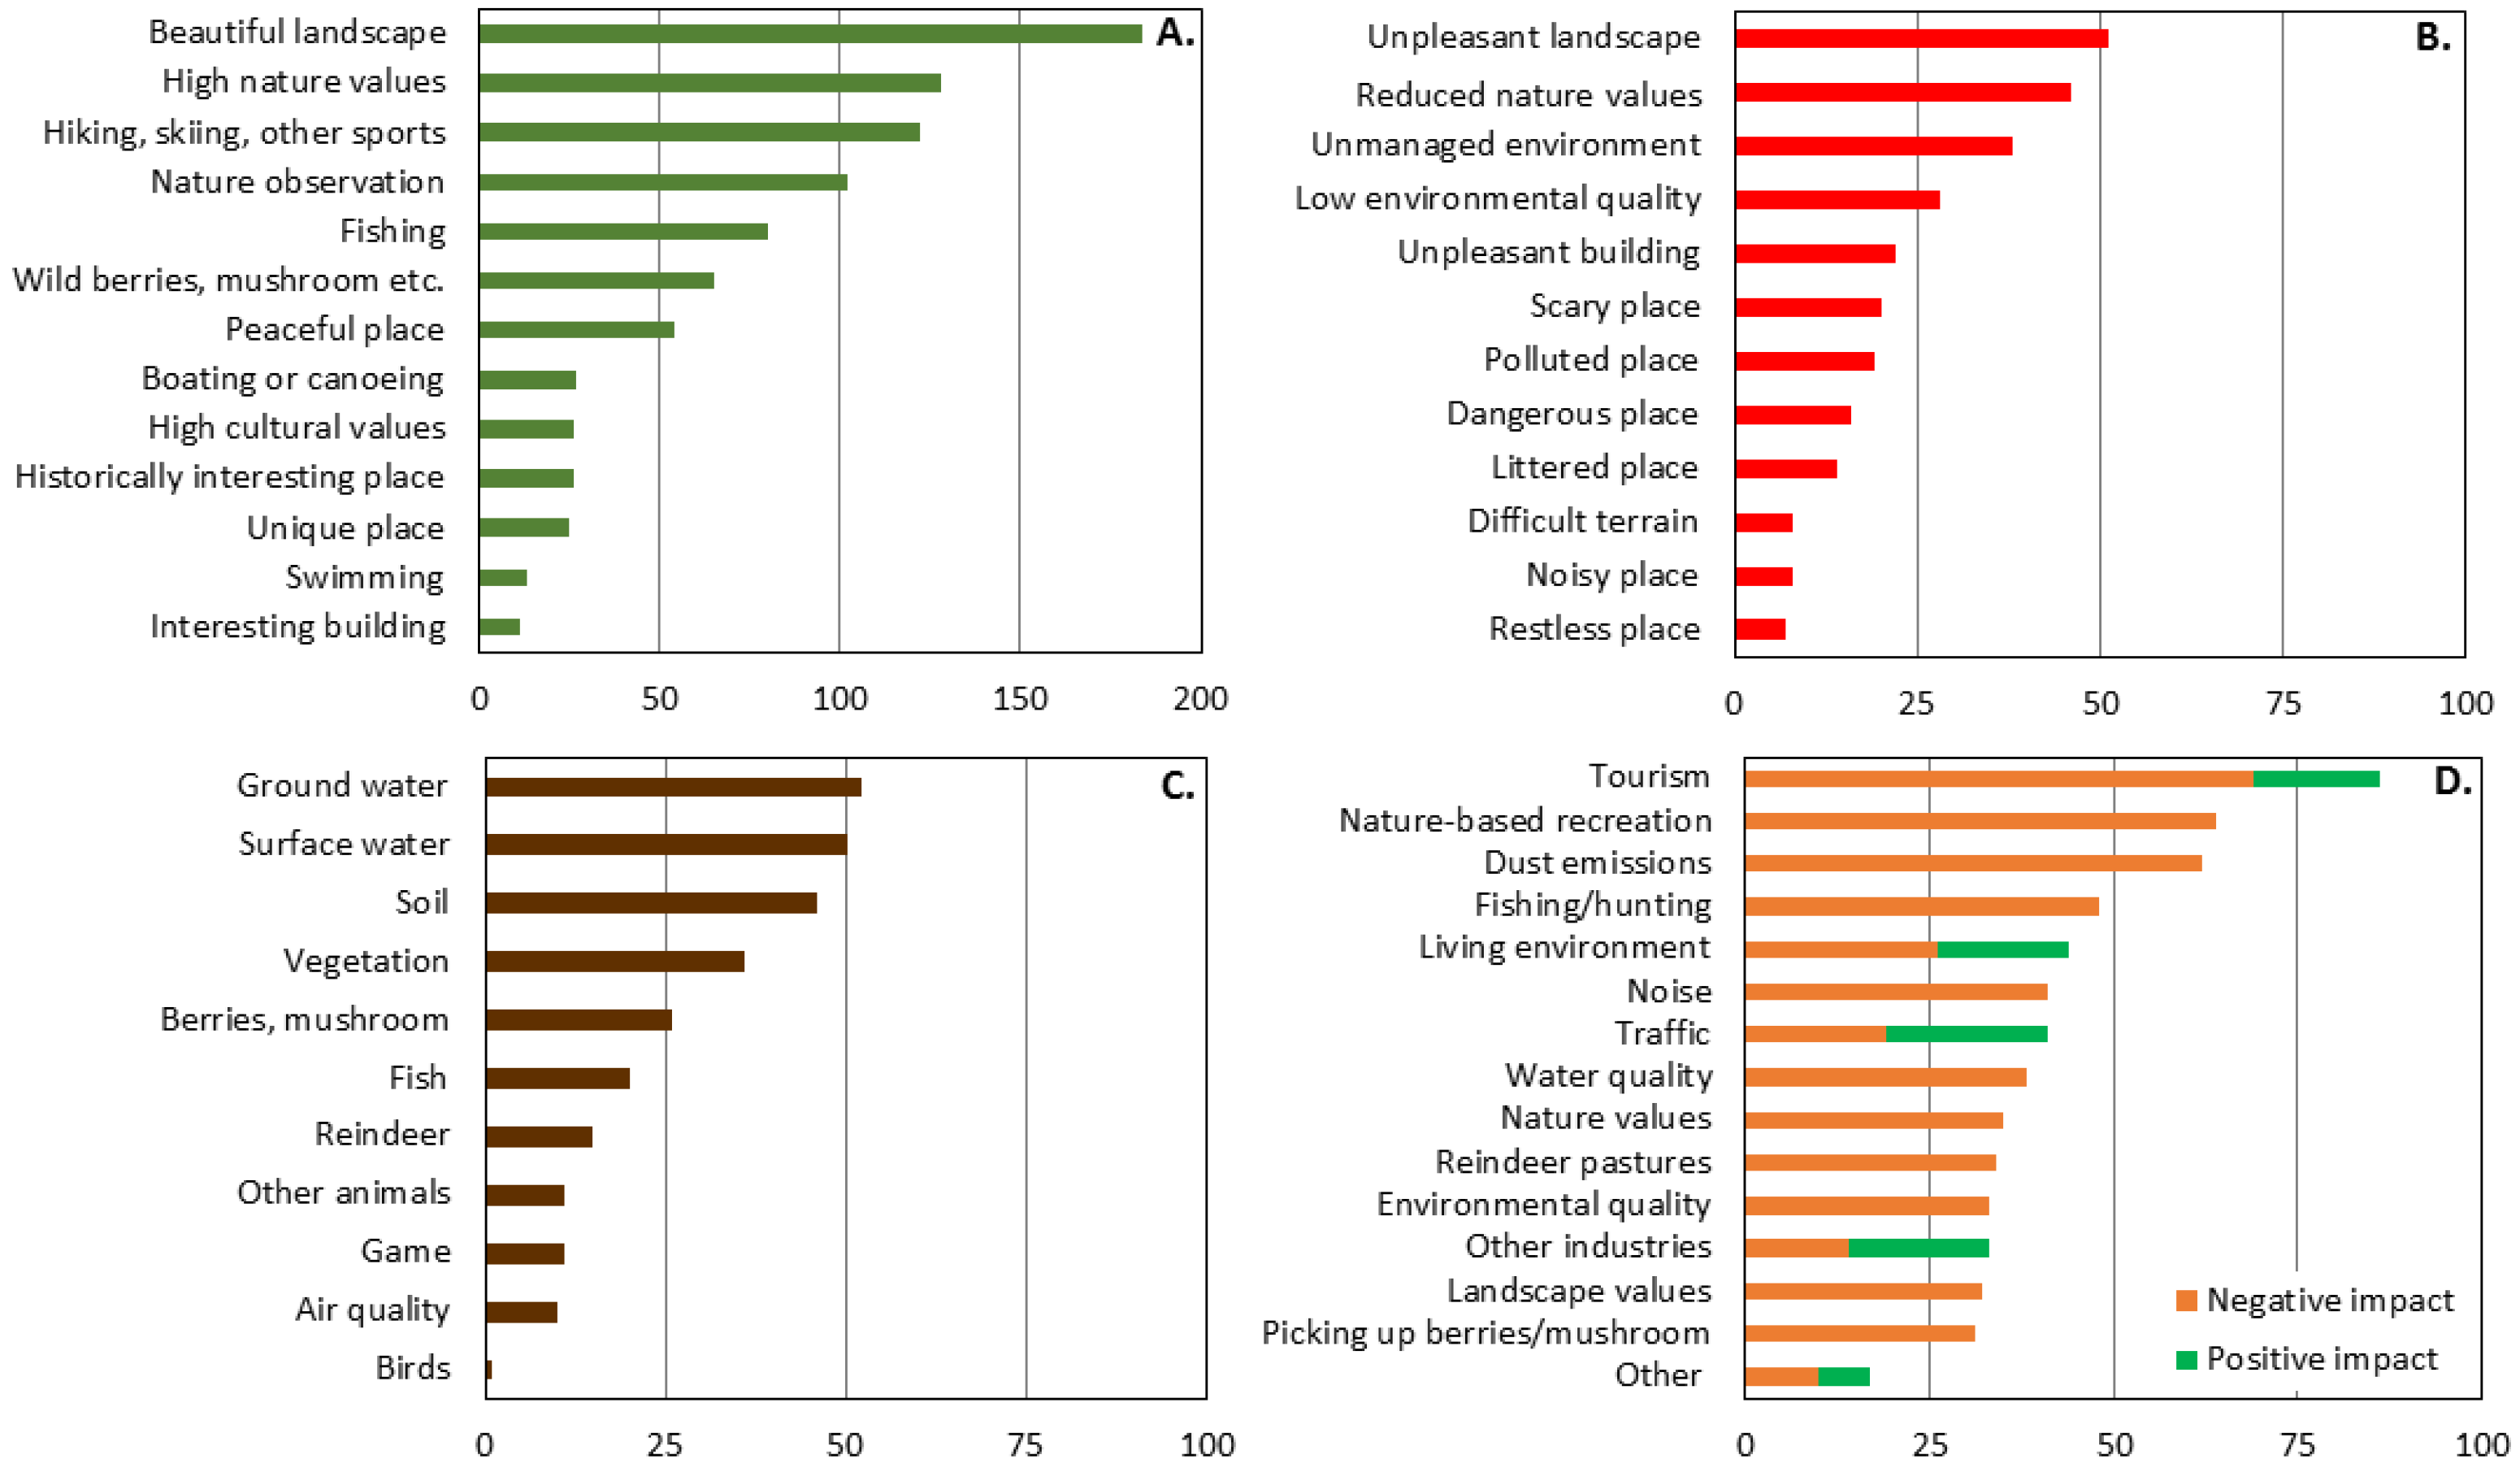
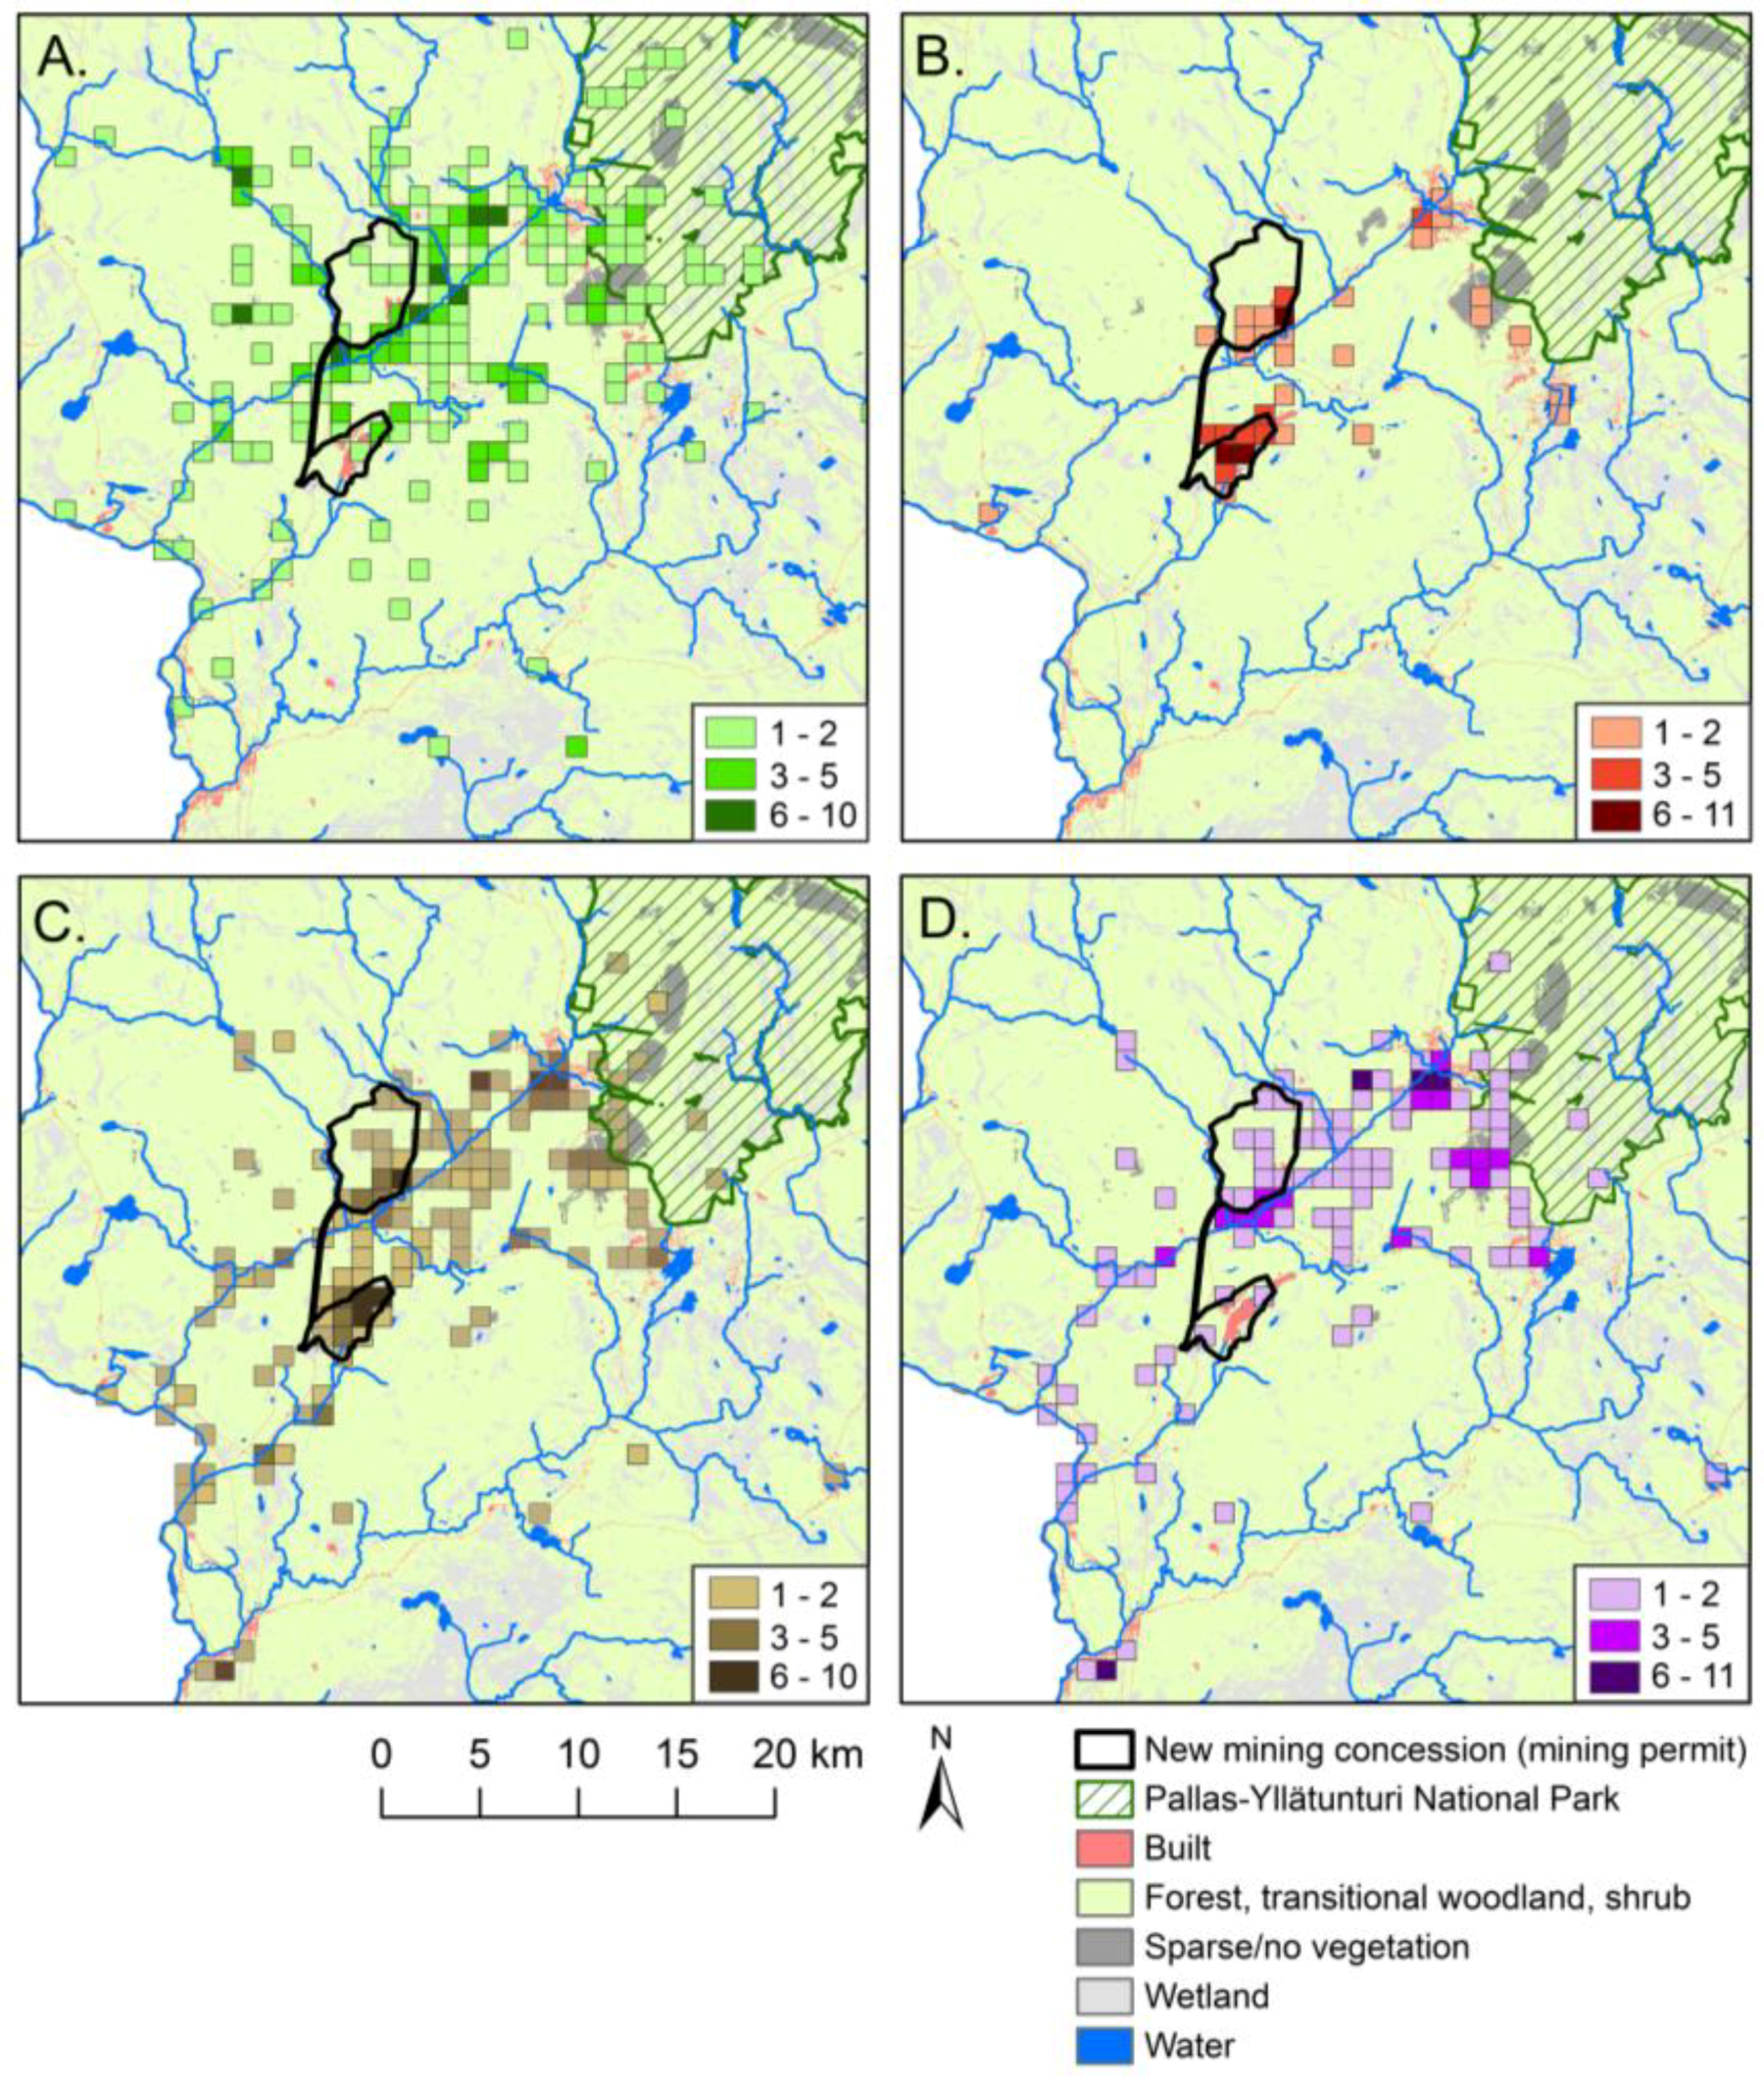
Respondents marked a total of 759 places on the maps describing their values, opinions, and perceptions on the mining sites and the surrounding landscape (Figure 7 and Figure 8). A total of 372 map markings (49.0%) described pleasant places, and 93 map markings (12.3%) described unpleasant places (Figure 7A,B). Furthermore, there were 100 map markings (13.2%) for places where more information on the state of the environment was needed, and 194 markings (25.6%) for places where positive or negative impacts of mine reopening would be experienced (Figure 7C,D).
Pleasant places were distributed widely across the landscape surrounding the closed mining sites (Figure 8A). A pleasant place was most often described as a beautiful landscape (Figure 7A). Pleasant places also included sites with high nature or recreational value, such as hiking, skiing, nature observation, fishing, hunting, collecting wild berries and mushrooms, and peaceful areas. Particular “hotspots” of positive experiences were located along the River Äkäsjoki and in the Kuertunturi fell area. Around 3% of pleasant places were located in the post-mining sites (Table 6). Positive experiences in the mining sites were related to nature observation (birds and bats) or outdoor activities such as biking, fishing, and ice racing, or the places were considered historically and culturally interesting. One-third of the pleasant places were located in a new mining concession and a 2 km buffer zone surrounding the concession. Similarly, nearly 60% of the pleasant places were located in a new mining concession and a 5 km buffer zone surrounding the concession.
Over half of the unpleasant places were located in the post-mining sites, and 76% were located within a new mining concession and a 1 km buffer zone surrounding the concession (Figure 8B, Table 6). Unpleasant places were most often described as unpleasant landscapes and sites with reduced nature value, unmanaged environment, and low environmental quality (Figure 7B). Hotspots of negative experiences were located in the barren landscape of the Hannukainen site and around old tailings and a settling pond at the Rautuvaara site. A few map markings also described the Ylläs tourist resort area as an unpleasant place.
Places where more information on the state of the environment would be needed were located in the closed mining sites (44%), but also along the river systems and forest areas surrounding the mines (Figure 8C, Table 6). In these places, respondents’ concerns were most often related to the impacts of former mining activities on the quality of ground water and surface water and soil contamination. Respondents also wanted more information on the impacts of former mining on vegetation and animals, and the safety of berries and mushrooms (Figure 7C). Some map markings were also located in the Ylläs tourist resort area, reflecting the concerns of some respondents about the impact of tourism on the environment. Table 7 summarizes the specific questions raised by respondents on the current state of the environment. The table is based on respondents’ optional comments given in multiple-choice and map questions.
Places where positive or negative impacts of mine reopening would potentially be experienced were located between the Hannukainen mining area and the Äkäslompolo-Ylläs region as well as along the rivers downstream of the mining area (Figure 8D). Approximately half of the places were located within a new mining concession and a 5 km buffer area around the concession, and another half elsewhere in the landscape (Table 6). Respondents most often mentioned the potential negative impacts of new mining activities on tourism, nature-based recreation, and fishing and hunting (Figure 7D). Places with potential dust emissions and noise were also frequently marked on the map. Other potential negative impacts marked on the map were related to water quality, nature value, reindeer pastures, environmental quality, landscape value, and picking berries and mushrooms. Map markings describing potential impacts of mine reopening on the living environment, traffic, and other industries were both positive and negative. The most important positive effects raised by respondents included year-round employment (compared to the seasonality of the tourism industry), better public services, and improved infrastructure in the region.
Approximately 9% of the grid squares with pleasant places also included unpleasant places, and 10% included places where more knowledge on the state of the environment is needed (Table 8A). Further, 32% of the grid squares with pleasant places included places where potential impacts of mining would be experienced. Approximately 47% of the grid squares with unpleasant places also contained pleasant places (Table 8B). Similarly, 53% of the grid squares with unpleasant places included places where more knowledge on the state of the environment is needed.
4. Discussion
In northern Europe, numerous metal mines were started and closed during the past century, leaving behind a variety of little-studied post-mining areas [16,73]. Land disturbances together with possible soil, water, and air contamination can irreversibly change future land use potential of the mined areas. Our results from the Hannukainen and Rautuvaara post-mining areas demonstrate that the impacts of mining are not limited to the mining sites themselves or the operational phase of the mine. Rather, mining can also reduce the multifunctionality of the surrounding landscape, and the negative impacts on other land uses can continue long after the closure of the mine.
Globally, the levels of reclamation of post-mining sites range from abandoned “zombie” mines to carefully planned post-mining landscapes for a wide variety of purposes [21,23,29,32,74,75,76,77]. The closed Hannukainen and Rautuvaara mines belong to mining sites where no major reclamation and landscaping measures have taken place, resulting in a sharp contrast between the mined land and the surrounding forest landscape. It has been observed that mines closer to populated areas are under greater pressure from society to be adequately reclaimed compared to remote sites [28]. In Finland, remote and/or small mining sites include a generally smaller number of new post-mining functions compared to significant mines located in the vicinity of population centers [16].
Our results show that a majority of respondents were dissatisfied with the post-closure management of mines. Waste rock, tailings, and other barren land were perceived as unpleasant places containing reduced nature value and low environmental quality. A majority of respondents were of the opinion that post-mining areas would need reclamation measures and that landscaping and restoration of sites as close as possible to the conditions that existed before would be important. The results show that positive opinions on post-mining areas were more common among respondents with a relationship to the mining industry and among local respondents living more than 20 km away from the mining sites. These groups were partially related, as local respondents living more than 20 km from the mining sites more often had a relationship to the mining industry compared to other respondent groups.
Although the perception of post-mining landscapes is often negative, some of them can hold cultural value reflecting past industrial history. This is particularly the case with mining areas that have had large mining communities and contain regionally or nationally valuable buildings and landscapes originating with historical mining activities [16,32,78]. Some post-mining areas in Finland include mining heritage tourism, and some areas are utilized, e.g., for public (noncommercial) outdoor activities, such as birdwatching and scuba diving [16]. In our survey, nearly half of the respondents disagreed, and around 40% agreed that the Hannukainen and Rautuvaara post-mining areas can be considered as part of the cultural landscape of the region. Post-mining land use at the sites was very limited. Only a few map markings indicated recreational activities or described closed mines as culturally or historically interesting places.
The results show that local stakeholders had various environmental concerns about the impacts of past mining activities on water quality, potential soil contamination, and the safety of natural products. While a majority of marked unpleasant places were concentrated in the post-mining sites, places where stakeholders wanted more information on the state of the environment were distributed over a considerably wider area in the landscape. Map markings related to environmental concerns and specific questions raised by respondents (Table 7) highlight that, in addition to observed environmental changes, knowledge gaps and uncertainties on the state of the environment can impact local stakeholders’ everyday land use far outside the mining sites and long after the active mining period. National inventories of mining waste facilities in Finland show that the current environmental state of many post-mining areas is not well known. Although none of the closed metal mines included in the inventories present major accident hazards, reclamation needs should be assessed in more detail at many of the sites [67,79,80].
The PPGIS survey shows that respondents had environmental concerns on water quality over relatively long distances from the post-mining sites. Globally, water contamination related to both active mining and historical mining legacies is a significant concern [19,81,82,83]. According to hydrological impact assessments in the study area, the water quality in most rivers is good. However, baseline water quality in River Niesajoki is negatively affected by former mining activities, and the quality improves with distance from the tailings in the Rautuvaara site [63]. Historical tailings include harmful substances that can potentially dissolve in the water through oxidation [66,68]. So far, no significant amounts of harmful substances have been detected in ground water or in the riverine system. However, it has been recommended, for example, that an acidic pond between dams in the northern part of the Rautuvaara site should be fenced so that reindeer and other animals cannot drink acidic water containing heavy metals and uranium [68]. Pit lakes in the Hannukainen and Rautuvaara sites contain elevated concentrations of various metals, and the water quality varies considerably according to the water depth [63,65].
Respondents were also unsure if it was safe to consume natural products collected in the vicinity of post-mining sites and for wild animals to graze/prey in the mined areas. In general, there is not much information available on soil contamination in post-mining areas and their surroundings in Finland. Separate studies carried out in connection with the environmental impact assessment of the Hannukainen mine showed, e.g., higher than baseline concentrations of many metals in humus and moss in the closed mining sites and their surroundings. Further, the concentration of cadmium exceeded the maximum allowed level in some mushroom samples collected in the vicinity of Hannukainen mine and roads [65]. A recent inventory examined concentrations of heavy metals in natural products and water in mining environments in eastern Finland [84]. The results of the inventory suggest that it would be important to know the baseline values resulting from the natural concentrations of metals in the soil and water compared to concentrations resulting from mining activities. In addition to increasing scientific knowledge on the environmental state of post-mining areas, it would also be crucial to distribute this information to local stakeholders.
Environmental accidents, human rights issues, and questions related to the share of benefits generated by mining have contributed to growing public concern about the environmental and social sustainability of the mining industry [9,85], and opposition to mining at the community level has increased during the 21st century [86,87,88]. In the case of the new Hannukainen mining project, opinions on reopening the closed mining sites were notably polarized between respondents (see also Reference [11]). As in the case of opinions on post-mining landscapes, positive opinions on mine reopening were more common among respondents with a relationship to the mining industry and among local respondents living more than 20 km from the mining sites. The most important positive effects raised by respondents included year-round employment, better public services, and improved infrastructure in the region. The strongest resistance was found among those working in the tourism industry or using tourism services. Particularly, vacation home owners, as well as respondents who reported outdoor activities in nature, did not support mining activities in the area. In addition to the negative impacts of mining on the nature-based tourism industry, respondents also raised concerns about mining impacts on reindeer herding. Respondents had more positive attitudes toward new mining projects in Finland (49% positive, 34% negative) than in the Hannukainen/Rautuvaara region (42% positive, 54% negative), which may at least partly reflect the unique multiple landscape values of the natural environment and high attraction to the area by both local and visiting land users.
The strength of the PPGIS survey is that it can reveal the spatial dimensions of potentially conflict-causing issues [8,52]. In our study area, nearly 60% of the pleasant places were located in the area containing the new mining concession and a surrounding 5 km buffer zone. Furthermore, map markings showed that pleasant places and places where the impacts of mining would potentially be experienced widely overlapped (32% of the 1 km grid cells). This clearly and spatially explicitly demonstrates the concerns over loss of the diversity of landscape elements and functions that support both occupational and recreational land use.
Increasing sizes of mining projects and declining ore grades result in increasing amounts of waste rock, a larger volume of tailings, and more extensive disturbed areas [35]. The Hannukainen and Rautuvaara post-mining sites are relatively small compared to many mining areas in northern Europe. New mining activities would leave behind notably larger areas of disturbed land cover compared to past mining. For example, current post-mining landscapes include pit lakes of 1–16 ha, whereas new post-mining areas would contain two water-filled open pits of 64 ha and 220 ha [65]. The plan to pump the processed waste water into the River Tornionjoki-Muonionjoki on the border of Finland and Sweden extends the potential negative environmental impacts far away from the mining site. When assessing the potential environmental impacts, highly relevant issues to address are the cumulative impact of all ongoing and planned mining activities in the region and transboundary environmental impacts [89,90].
A general objective of mine closure is to ensure long-term physical, chemical, and biological stability of the site to minimize potential environmental and health risks. In Finland, the statutory requirements placed on mine closure derive from a set of various statutes governing inter alia mining activity, environmental protection, and waste management. Some statutes are applied to all mining projects by default (for example, the Mining Act (621/2011) and the Environmental Protection Act (86/2000)), whereas others are applied to mining projects based on the scale, nature, and/or location of the activities. Thus, the applicable legislation and stipulations for mine closure can vary from project to project. Requirements regarding mine closure are stipulated on a legislative level and through various government-issued permits. In addition, mining activity is also regulated by guides and instructions given and published by various authorities, experts, and scientists [91,92,93].
Nowadays, mining licensing and environmental permitting usually require closure management plans in the early phase of the project. A mine closure plan is typically updated regularly during the project, and revision of the financial sureties for mine closure may also be required [91,92,93]. The current preliminary closure plan of the Hannukainen mining project seeks to mitigate the harmful environmental impacts and ensure security in the area after the closure. The plan includes, for example, recommended options for the closure of open pits, tailings, waste rock, and infrastructure, and landscaping measures, but does not contain detailed information on future land use options in the post-mining sites [94]. According to the plan, post-mining land use will be decided among stakeholders during the production phase. Our results show that over half of the respondents disagreed that a good environmental status could be maintained in the region during the active mining phase and after closure. Similarly, over half of the respondents disagreed that mining sites could be reclaimed to fit well in the surrounding landscape. Incomplete reclamation measures and lack of landscaping of former mining activities may contribute to shaping opinions on the success of future reclamation measures in the area.
A need for corporate social responsibility and social impact assessment has strengthened during the past years. The term “social license to operate” (SLO) describes a way of conceptualizing a corporation’s relationship with society and local communities. In the case of the mining industry, it has been interpreted as the social acceptance granted by a community for mineral exploration and mining activities [95,96,97,98,99,100]. In practice, the levels of approval or acceptance can vary over time. A mining company rarely has either total or zero approval or acceptance, as it is also unlikely that either all stakeholders or no one would approve mining activities. Furthermore, stakeholders may accept some aspects of a mining project and not accept others [95]. The research of Reference [3] highlights the importance of transparency in mining operations and the continuity of communication with local stakeholders in building and maintaining the social license to mine. Recently, the concept of social license to close has emerged from the need for a more holistic view of the impacts of mine closure on stakeholders. Better closure planning would help local communities adapt to closure, sustain future socioeconomic well-being, and promote beneficial reuse of project assets [101].
In addition to perceived environmental impacts, mining conflicts and resistance also arise from the lack of representation and participation of local communities [7,102]. Public involvement in land use and natural resource planning has been rapidly increasing in recent years. The development of new geospatial information technologies, such as web-based PPGIS, provides new opportunities to open up land planning processes to citizens. PPGIS can integrate, organize, and present huge amounts of geospatial information, and remove place and time restrictions, which hinder stakeholders’ opportunities for public involvement. PPGIS captures local knowledge, helps to identify sensitive issues and locations, increases the exchange of information, opinions, and perspectives, and democratizes the planning process [103,104,105]. The results of our study suggest that integrating detailed place-based data provided by different stakeholders as part of the planning process could support better land management in mining areas. PPGIS could also provide a useful tool for more sustainable land use planning in other kinds of northern environments that experience rapid land cover transformations arising from different land use pressures [36,106,107].
However, PPGIS approaches include many challenges to be taken into account. A web-based PPGIS survey can offer the possibility to influence individuals or social groups usually excluded from formal decision-making by governments and local authorities, but it can also exclude people who are not familiar with computers and map applications [51,105]. It has also been found that PPGIS yields the highest responses from people whose livelihood or other interests are closely related to topics of the survey [108,109], and that participants tend to be disproportionately male, older, and have higher levels of education and income [110]. In our survey, there was a bias toward male participants as well as middle-aged participants. There were also relatively few younger respondents, which highlights the importance of better advertising of PPGIS surveys to younger citizens. Web-based PPGIS surveys combined with other means of participation are likely to produce the best outcomes in land use planning processes [51].
5. Conclusions
Our study demonstrates that it is crucial to pay more attention to the post-mining phase of mining projects. Inadequate reclamation and landscaping decrease landscape value and functions in post-mining areas. Both observed environmental impacts and knowledge gaps on the current state of the environment have impacts on local stakeholders’ everyday land use in the region. Key questions raised by respondents of this study were about uncertainties related to the spatial extent, duration, and magnitude of the environmental impacts of former and planned future mining activities. A big-picture view of the mining impacts on local land use requires understanding “the shadow of the mine” that extends far outside the mining sites and seems to persist long after the mine closure. Identifying and mapping values and opinions that people assign to mining landscapes is important to prevent or mitigate the loss of landscape elements and functions that support both occupational and recreational land use. A PPGIS approach included in decision-making processes related to all phases of the mining cycle from planning to post-mining could significantly contribute to better land management and more sustainable long-term land use. This is especially important in the case of big mining projects, which leave behind large areas of altered land cover and reduced land use potential.
Author Contributions
Conceptualization, S.K., K.V. and T.K.; Formal analysis, S.K.; Funding acquisition, S.K.; Methodology, S.K. and K.V.; Project administration, S.K.; Resources, S.K. and K.V.; Visualization, S.K.; Writing—original draft, S.K., K.V. and T.K.; Writing—review and editing, S.K., K.V. and T.K.
Funding
This study was funded by the Maj and Tor Nessling Foundation and TOKAT-project (European Regional Development Fund).
Acknowledgments
We thank Marja Anttonen for comments related to the contents of the PPGIS survey. We thank all respondents who participated in the survey and provided opinions and perspectives on post-mining landscapes.
Conflicts of Interest
The authors declare no conflict of interest.
References
- Poulton, M.M.; Jagers, S.C.; Linde, S.; Van Zyl, D.; Danielson, L.J.; Matti, S. State of the world’s nonfuel mineral resources: Supply, demand, and socio-institutional fundamentals. Annu. Rev. Environ. Resour. 2013, 38, 345–371. [Google Scholar] [CrossRef]
- Tuusjärvi, M.; Mäenpää, I.; Vuori, S.; Eilu, P.; Kihlman, S.; Koskela, S. Metal mining industry in Finland–Development scenarios to 2030. J. Clean. Prod. 2014, 84, 271–280. [Google Scholar] [CrossRef]
- Heikkinen, H.I.; Lépy, É.; Sarkki, S.; Komu, T. Challenges in acquiring a social licence to mine in the globalising Arctic. Polar Rec. 2016, 52, 399–411. [Google Scholar] [CrossRef]
- Kröger, M. Spatial causalities in resource rushes: Notes from the Finnish mining boom. J. Agric. Chang. 2016, 16, 543–570. [Google Scholar] [CrossRef]
- Tano, S.; Pettersson, Ö.; Stjernström, O. Labour income effects of the recent “mining boom” in northern Sweden. Res. Policy 2016, 49, 31–40. [Google Scholar] [CrossRef]
- Herrmann, T.M.; Sandström, P.; Granqvist, K.; D’Astous, N.; Vannar, J.; Asselin, H.; Saganash, N.; Mameamskum, J.; Guanish, G.; Loon, J.-B.; et al. Effects of mining on reindeer/caribou populations and indigenous livelihoods: Community-based monitoring by Sami reindeer herders in Sweden and First Nations in Canada. Polar J. 2014, 4, 28–51. [Google Scholar] [CrossRef]
- Conde, M. Resistance to mining: A review. Ecol. Econ. 2017, 132, 80–90. [Google Scholar] [CrossRef]
- Karimi, A.; Brown, G. Assessing multiple approaches for modelling land-use conflict potential from participatory mapping data. Land Use Policy 2017, 67, 253–267. [Google Scholar] [CrossRef]
- Sairinen, R.; Tiainen, H.; Mononen, T. Talvivaara mine and water pollution: An analysis of mining conflict in Finland. Extr. Ind. Soc. 2017, 4, 640–651. [Google Scholar] [CrossRef]
- Lindahl, K.B.; Johansson, A.; Zachrisson, A.; Viklund, R. Competing pathways to sustainability? Exploring conflicts over mine establishments in the Swedish mountain region. J. Environ. Manag. 2018, 218, 402–415. [Google Scholar] [CrossRef]
- Similä, J.; Jokinen, M. Governing conflicts between mining and tourism in the Arctic. Arct. Rev. 2018, 9, 148–173. [Google Scholar] [CrossRef]
- Laurence, D. Establishing a sustainable mining operation: An overview. J. Clean. Prod. 2011, 19, 278–284. [Google Scholar] [CrossRef]
- Pokhrel, L.R.; Dubey, B. Global scenarios of metal mining, environmental repercussions, public policies, and sustainability: A review. Crit. Rev. Environ. Sci. Technol. 2013, 43, 2352–2388. [Google Scholar] [CrossRef]
- Haque, M.A.; Topal, E.; Lilford, E. A numerical study for a mining project using real options valuation under commodity price uncertainty. Res. Policy 2014, 39, 115–123. [Google Scholar] [CrossRef]
- Mborah, C.; Bansah, K.J.; Boateng, M.K. Evaluating alternate post-mining land-uses: A review. Environ. Pollut. 2015, 5, 14. [Google Scholar] [CrossRef]
- Kivinen, S. Sustainable post-mining land use: Are closed metal mines abandoned or re-used space? Sustainability 2017, 9, 1705. [Google Scholar] [CrossRef]
- Redondo-Vega, J.M.; Gómez-Villar, A.; Santos-González, J.; González-Gutiérrez, R.B.; Álvarez-Martínez, J. Changes in land use due to mining in the north-western mountains of Spain during the previous 50 years. Catena 2017, 149, 844–856. [Google Scholar] [CrossRef]
- Pereira, R.; Barbosa, S.; Carvalho, F.P. Uranium mining in Portugal: A review of the environmental legacies of the largest mines and environmental and human health impacts. Environ. Geochem. Health 2014, 36, 285–301. [Google Scholar] [CrossRef]
- Bird, G. The influence of the scale of mining activity and mine site remediation on the contamination legacy of historical metal mining activity. Environ. Sci. Pollut. Res. 2016, 23, 23456–23466. [Google Scholar] [CrossRef]
- Lei, K.; Pan, H.; Lin, C. A landscape approach towards ecological restoration and sustainable development of mining areas. Ecol. Eng. 2016, 90, 320–325. [Google Scholar] [CrossRef]
- Keeling, A.; Sandlos, J. Ghost towns and zombie mines: The historical dimensions of mine abandonment, reclamation, and redevelopment in the Canadian North. In Ice Blink: Navigating Northern Environmental History; Bocking, S., Martin, B., Eds.; University of Calgary: Calgary, AB, Canada, 2017; pp. 377–420. [Google Scholar]
- Horowitz, L.S.; Keeling, A.; Lévesque, F.; Rodon, T.; Schott, S.; Thériault, S. Indigenous peoples’ relationships to large-scale mining in post/colonial contexts: Toward multidisciplinary comparative perspectives. Extr. Ind. Soc. 2018, 5, 404–414. [Google Scholar] [CrossRef]
- Fields, S. The earth’s open wounds: Abandoned and orphaned mines. Environ. Health Perspect. 2003, 111. [Google Scholar] [CrossRef] [PubMed]
- Cater, T.; Keeling, A. “That’s where our future came from”: Mining, landscape, and memory in Rankin Inlet, Nunavut. Études/Inuit/Studies 2013, 37, 59–82. [Google Scholar] [CrossRef] [Green Version]
- Mhlongo, S.E.; Amponsah-Dacosta, F. A review of problems and solutions of abandoned mines in South Africa. Int. J. Min. Reclam. Environ. 2016, 30, 279–294. [Google Scholar] [CrossRef]
- Venkateswarlu, K.; Nirola, R.; Kuppusamy, S.; Thavamani, P.; Naidu, R.; Megharaj, M. Abandoned metalliferous mines: Ecological impacts and potential approaches for reclamation. Rev. Environ. Sci. Bio/Technol. 2016, 15, 327–354. [Google Scholar] [CrossRef]
- McHaina, D.M. Environmental planning considerations for the decommissioning, closure and reclamation of a mine site. Int. J. Surf. Min. Reclamat. Environ. 2001, 15, 163–176. [Google Scholar] [CrossRef]
- Slingerland, N.; Wilson, G.W. End Land Use as a Guide for Integrated Mine Planning and Closure Design; Mine Closure: Vancouver, BC, Canada, 2015. [Google Scholar]
- Lima, A.T.; Mitchell, K.; O’Connell, D.W.; Verhoeven, J.; Van Cappellen, P. The legacy of surface mining: Remediation, restoration, reclamation and rehabilitation. Environ. Sci. Policy 2016, 66, 227–233. [Google Scholar] [CrossRef]
- Kauppila, T. Mine Closure Consists of Decommissioning and Mine Site Reclamation. Mine Closure Wiki. Available online: http://wiki.gtk.fi/group/mine-closedure/wiki/-/wiki/Wiki/Mine+closure+consists+of+decommissioning+and+mine+site+reclamation (accessed on 10 October 2016).
- Masoumi, I.; Naraghi, S.; Rashidi-nejad, F.; Masoumi, S. Application of fuzzy multi-attribute decision-making to select and to rank the post-mining land-use. Environ. Earth Sci. 2014, 72, 221–231. [Google Scholar] [CrossRef]
- Wirth, P.; Cernic-Mali, B.; Fischer, W. Post-Mining Regions in Central Europe—Problems, Potentials, Possibilities; Oekom, München: Munich, Germany, 2012. [Google Scholar]
- Cueva, V.P. Knowledge about mine legacies, international best practice standards and mine closure regulation in the USA and El Salvador. In An Assessment of Mine Legacies and How to Prevent Them; Springer International Publishing: Cham, Switzerland, 2017; pp. 5–12. [Google Scholar]
- Magnussen, T.; Dale, B. The Municipal No to Mining. The Case Concerning the Reopening of the Biedjovaggi Gold Mine in Guovdageainnu Municipality, Norway. In The Will to Drill-Mining in Arctic Communites; Springer: Cham, Switzerland, 2018; pp. 175–195. [Google Scholar]
- Crowson, P. Mine size and the structure of costs. Res. Policy 2003, 29, 15–36. [Google Scholar] [CrossRef]
- Kumpula, T.; Pajunen, A.; Kaarlejärvi, E.; Forbes, B.C.; Stammler, F. Land use and land cover change in Arctic Russia: Ecological and social implications of industrial development. Glob. Environ. Chang. 2011, 21, 550–562. [Google Scholar] [CrossRef]
- Keskitalo, E.C.H.; Horstkotte, T.; Kivinen, S.; Forbes, B.; Käyhkö, J. “Generality of mis-fit”? The real-life difficulty of matching scales in an interconnected world. Ambio 2016, 45, 742–752. [Google Scholar] [CrossRef] [PubMed]
- Persson, S.; Harnesk, D.; Islar, M. local people? Examining the Gállok mining conflict and the rights of the Sámi population in terms of justice and power. Geoforum 2017, 86, 20–29. [Google Scholar] [CrossRef]
- Ranängen, H.; Lindman, Å. A path towards sustainability for the Nordic mining industry. J. Clean. Prod. 2017, 151, 43–52. [Google Scholar] [CrossRef]
- Suopajärvi, L.; Ejdemo, T.; Klyuchnikova, E.; Korchak, E.; Nygaard, V.; Poelzer, G.A. Social impacts of the “glocal” mining business: Case studies from Northern Europe. Miner. Econ. 2017, 1, 31–39. [Google Scholar] [CrossRef]
- Mancini, L.; Sala, S. Social impact assessment in the mining sector: Review and comparison of indicators frameworks. Res. Policy 2018, 57, 98–111. [Google Scholar] [CrossRef]
- Latifovic, R.; Fytas, K.; Chen, J.; Paraszczak, J. Assessing land cover change resulting from large surface mining development. Int. J. Appl. Earth Obs. Geoinf. 2005, 7, 29–48. [Google Scholar] [CrossRef]
- Townsend, P.A.; Helmers, D.P.; Kingdon, C.C.; McNeil, B.E.; de Beurs, K.M.; Eshleman, K.N. Changes in the extent of surface mining and reclamation in the Central Appalachians detected using a 1976–2006 Landsat time series. Remote Sens. Environ. 2009, 113, 62–72. [Google Scholar] [CrossRef]
- Antwi, E.K.; Boakye-Danquah, J.; Asabere, S.B.; Takeuchi, K.; Wiegleb, G. Land cover transformation in two post-mining landscapes subjected to different ages of reclamation since dumping of spoils. SpringerPlus 2014, 3, 702. [Google Scholar] [CrossRef]
- Qian, D.; Yan, C.; Xing, Z.; Xiu, L. Monitoring coal mine changes and their impact on landscape patterns in an alpine region: A case study of the Muli coal mine in the Qinghai-Tibet Plateau. Environ. Monit. Assess. 2017, 189, 559. [Google Scholar] [CrossRef]
- Brown, G.; Raymond, C. The relationship between place attachment and landscape values: Toward mapping place attachment. Appl. Geogr. 2007, 27, 89–111. [Google Scholar] [CrossRef]
- Kingston, R.; Carver, S.; Evans, A.; Turton, I. Web-based public participation geographical information systems: An aid to local environmental decision-making. Comput. Environ. Urban Syst. 2000, 24, 109–125. [Google Scholar] [CrossRef]
- Sieber, R. Public participation geographic information systems: A literature review and framework. Ann. Assoc. Am. Geogr. 2006, 96, 491–507. [Google Scholar] [CrossRef]
- Brown, G.; Kyttä, M. Key issues and research priorities for public participation GIS (PPGIS): A synthesis based on empirical research. Appl. Geogr. 2014, 46, 122–136. [Google Scholar] [CrossRef]
- Brown, G.; Raymond, C.M. Methods for identifying land use conflict potential using participatory mapping. Landsc. Urban Plan. 2014, 122, 196–208. [Google Scholar] [CrossRef]
- Vartiainen, K.; Tanskanen, T.; Paloniemi, R. Kyselypalvelu Harava maankäytön suunnittelun tukena. Terra 2014, 126, 75–83. [Google Scholar]
- Brown, G.; Kangas, K.; Juutinen, A.; Tolvanen, A. Identifying environmental and natural resource management conflict potential using participatory mapping. Soc. Nat. Resour. 2017, 30, 1458–1475. [Google Scholar] [CrossRef]
- Evans, J.D.; Kirkpatrick, J.B.; Bridle, K.L. A reciprocal triangulation process for identifying and mapping potential land use conflict. Environ. Manag. 2018, 1–15. [Google Scholar] [CrossRef]
- Rich, K.J.; Ridealgh, M.; West, S.E.; Cinderby, S.; Ashmore, M. Exploring the links between post-industrial landscape history and ecology through participatory methods. PLoS ONE 2015, 10, e0136522. [Google Scholar] [CrossRef]
- Eilu, P.; Boyd, R.; Hallberg, A.; Korsakova, M.; Krasotkin, S.; Nurmi, P.; Ripa, M.; Stromov, V.; Tontti, M. Mining history of Fennoscandia. In Mineral Deposits and Metallogeny of Fennoscandia; Geological Survey of Finland: Espoo, Finland, 2012; Volume 53, pp. 19–32. [Google Scholar]
- Pirinen, P.; Simola, H.; Aalto, J.; Kaukoranta, J.P.; Karlsson, P.; Ruuhela, R. Tilastoja Suomen Ilmastosta 1981–2010; Ilmatieteen Laitos: Helsinki, Finland, 2012.
- Alalammi, P. (Ed.) Atlas of Finland: Finland’s Landscapes, and Urban and Rural Milieus. Folio 350; National Land Survey of Finland: Helsinki, Finland, 1994. [Google Scholar]
- Autio, J.; Colpaert, A. The impact of elevation, topography and snow load damage of trees on the position of the actual timberline on the fells in central Finnish Lapland. Fenn.-Int. J. Geogr. 2005, 183, 15–36. [Google Scholar]
- Metsähallitus. Visitation Numbers in Protected Areas of Finland. Available online: http://www.metsa.fi/web/en/visitationnumbers (accessed on 2 October 2018).
- Finnish Environment Institute (SYKE). Tornionjoen-Muonionjoen Vesistöalue. Available online: http://www.ymparisto.fi/fi-FI/Luonto/Suojelualueet/Natura_2000_alueet/TornionjoenMuonionjoen_vesistoalue(6144) (accessed on 2 October 2018).
- Vähä, V.; Romakkaniemi, A.; Ankkuriniemi, M.; Keinänen, M.; Pulkkinen, K.; Mäntyniemi, S. Lohi-ja Meritaimenkantojen Seuranta Tornionjoessa Vuonna 2006; Kala-ja Riistaraportteja nro 405; Riista-ja Kalatalouden Tutkimuslaitos: Helsinki, Finland, 2007. [Google Scholar]
- Vähä, V.; Romakkaniemi, A.; Ankkuriniemi, M.; Pulkkinen, K.; Keinänen, M. Lohi-ja Meritaimenkantojen Seuranta Tornionjoessa Vuonna 2007; Riista-ja Kalatalous. Selvityksiä 7/2008; Riista-ja Kalatalouden Tutkimuslaitos: Helsinki, Finland, 2008. [Google Scholar]
- SRK Consulting (UK) Limited. Hydrological Impact Assessment for the Hannukainen Iron Ore-Copper-Gold Project, Phase 2; Prepared for Northland Mines Oy. UK4970; SRK Consulting: Cardiff, UK, 2013. [Google Scholar]
- Finnish Environment Institute. Producing Land Cover and Land Use Data in CORINE Land Cover 2012 Project in Finland. Available online: http://www.syke.fi/en-US/Research__Development/Research_and_development_projects/Projects/Producing_land_cover_and_land_use_data_in_CORINE_Land_Cover_2012_project_in_Finland/Producing_land_cover_and_land_use_data_i(9087) (accessed on 12 October 2018).
- Finnish Environment Institute (SYKE). Hannukaisen Rautakaivoshanke, Ympäristövaikutusten Arviointiselostus. Available online: http://www.ymparisto.fi/fi-FI/Asiointi_luvat_ja_ymparistovaikutusten_arviointi/Ymparistovaikutusten_arviointi/YVAhankkeet/Hannukaisen_rautakaivoshanke_Kolari/Hannukaisen_rautakaivoshanke_ymparistova(24263) (accessed on 5 November 2018).
- Närhi, P.; Räisänen, M.L.; Sutinen, M.L.; Sutinen, R. Effect of tailings on wetland vegetation in Rautuvaara, a former iron-copper mining area in northern Finland. J. Geochem. Explor. 2012, 116, 60–65. [Google Scholar] [CrossRef]
- Räisänen, M.L.; Beucher, A.; Tornivaara, A.; Kauppila, P. Suljettujen ja Hylättyjen Metallikaivosalueiden Nykytila ja Arvio Jätealueiden Ympäristöriskipotentiaalista. Geological Survey of Finland. Archive Report. Geological Survey of Finland, 2015. Available online: http://tupa.gtk.fi/raportti/arkisto/46_2015.pdf (accessed on 12 September 2018).
- Räisänen, M.L.; Väisänen, U.; Lanne, E.; Turunen, P.; Väänänen, J. Rautuvaaran Kaivoksen Rikastushiekka-Altaan Kemiallinen Nykytila, Vaikutukset Pinta-ja Pohjavesiin ja Suositukset Jälkihoidolle. 2015. Available online: http://tupa.gtk.fi/raportti/arkisto/64_2015.pdf (accessed on 12 September 2018).
- Hannukainen Mining. Available online: http://www.hannukainenmining.fi/etusivu.html (accessed on 12 October 2018).
- TUKES 2017. Kaivospiirin Määrääminen. Hannukainen, Turvallisuus-ja Kemikaalivirasto (Tukes). Available online: www.maanmittauslaitos.fi/sites/maanmittauslaitos.fi/files/Kaivoslupa_0.pdf (accessed on 10 October 2018).
- TUKES. Mining, Ore Prospecting and Gold Panning. Map Files. Available online: https://tukes.fi/en/mining-ore-prospecting-and-gold-panning/map-files (accessed on 2 October 2018).
- Dimenteq 2017. Harava. Available online: https://dimenteq.fi/en/services/harava/ (accessed on 5 September 2018).
- Jürisoo, M.; Nilsson, A.E. The global context of mineral resources in northern Europe: Geopolitical and sustainability dynamics. In Stockholm Environmental Institute Discussion Brief; Stockholm, 6; Stockholm Environmental Institute: Stockholm, Sweden, 2015. [Google Scholar]
- Pearman, G. 101 Things to do with a Hole in the Ground; Post-Mining Alliance in Association with the Eden Project: Cornwall, UK, 2009. [Google Scholar]
- Larondelle, N.; Haase, D. Valuing post-mining landscapes using an ecosystem services approach—An example from Germany. Ecol. Ind. 2012, 18, 567–574. [Google Scholar] [CrossRef]
- Svobodova, K.; Sklenicka, P.; Molnarova, K.; Salek, M. Visual preferences for physical attributes of mining and post-mining landscapes with respect to the sociodemographic characteristics of respondents. Ecol. Eng. 2012, 43, 34–44. [Google Scholar] [CrossRef]
- Everingham, J.A.; Rolfe, J.; Lechner, A.M.; Kinnear, S.; Akbar, D. A proposal for engaging a stakeholder panel in planning post-mining land uses in Australia’s coal-rich tropical savannahs. Land Use Policy 2018, 79, 397–406. [Google Scholar] [CrossRef]
- Jolliffe, L.; Conlin, M. 20 Lessons in transforming mines into tourism attractions. In Mining Heritage and Tourism: A Global Synthesis; Routledge Advances in Tourism; Routledge: Oxon, UK; New York, NY, USA, 2010. [Google Scholar]
- Räisänen, M.-L.; Tornivaara, A.; Haavisto, T.; Niskala, K.; Silvola, M. Suljettujen ja Hylättyjen Kaivosten Kaivannaisjätealueiden Kartoitus. Ympäristöministeriön Raportteja 2013, 24, 45. Available online: https://helda.helsinki.fi/handle/10138/41486 (accessed on 12 September 2018).
- Tornivaara, A.; Räisänen, M.L.; Kovalainen, H.; Kauppi, S. Suljettujen ja Hylättyjen Kaivosten kaivannaisjätealueiden Jatkokartoitus (KAJAK II). Suomen Ympäristökeskuksen Raportteja 12/2018. Available online: https://helda.helsinki.fi/handle/10138/235617 (accessed on 5 October 2018).
- Johnson, D.B.; Hallberg, K.B. Acid mine drainage remediation options: A review. Sci. Total Environ. 2005, 338, 3–14. [Google Scholar] [CrossRef]
- Baeten, J.; Langston, N.; Lafreniere, D. A spatial evaluation of historic iron mining impacts on current impaired waters in Lake Superior’s Mesabi Range. Ambio 2018, 47, 231–244. [Google Scholar] [CrossRef] [PubMed]
- Rautio, A.B.; Korkka-Niemi, K.I.; Salonen, V.P. Thermal infrared remote sensing in assessing groundwater and surface-water resources related to Hannukainen mining development site, northern Finland. Hydrogeol. J. 2018, 26, 163–183. [Google Scholar] [CrossRef]
- Arresto, A.; Pennanen, H. Pohjois-Karjalan Kaivosympäristön Luonnontuotteiden ja Talousvesien Raskasmetallit-Hanke: Taustaselvitys. Pohjois-Karjalan Ympäristöterveys & Elinkeino-, Liikenne ja Ympäristökeskus. 2015. Available online: http://www.joensuu.fi/documents/11127/24817/Kaivoshankkeen+taustaselvitys/f6776deb-99f7-4cc3-9667-839b40c76191 (accessed on 5 October 2018).
- Hilson, G. An overview of land use conflicts in mining communities. Land Use Policy 2002, 19, 65–73. [Google Scholar] [CrossRef]
- Jenkins, H.; Yakovleva, N. Corporate social responsibility in the mining industry: Exploring trends in social and environmental disclosure. J Clean. Prod. 2006, 14, 271–284. [Google Scholar] [CrossRef]
- Kemp, D. Community relations in the global mining industry: Exploring the internal dimensions of externally orientated work. Corp. Soc. Responsib. Environ. Manag. 2010, 17, 1–14. [Google Scholar] [CrossRef]
- Fraser, J. Mining companies and communities: Collaborative approaches to reduce social risk and advance sustainable development. Res. Policy 2018. [Google Scholar] [CrossRef]
- Koivurova, T.; Masloboev, V.; Petrétei, A.; Nygaard, V.; Hossain, K. Transboundary EIA in the Barents region. Nord. Environ. Law J. 2014, 3, 45–62. [Google Scholar]
- Larsen, R.K.; Österlin, C.; Guia, L. Do voluntary corporate actions improve cumulative effects assessment? Mining companies’ performance on Sami lands. Extr. Ind. Soc. 2018, 5, 375–383. [Google Scholar] [CrossRef]
- Heikkinen, P.M.; Noras, P.; Salminen, R. Mine Closure Handbook. Environmental Techniques for the Extractive Industries; Geological Society of Finland: Espoo, Finland, 2008; 169p, Available online: http://tupa.gtk.fi/julkaisu/erikoisjulkaisu/ej_074.pdf (accessed on 15 September 2018).
- Kauppila, T.; Vartiainen, N. Legal Requirements for Mine Closure. Mine Closure Wiki. Available online: http://wiki.gtk.fi/group/mine-closedure/wiki/-/wiki/Wiki/Legal+requirements+for+mine+closure (accessed on 15 September 2017).
- Vartiainen, N. Statutory Requirements for Mine Closure in Finland. Mine Closure Wiki. Available online: http://wiki.gtk.fi/web/mine-closedure/wiki/-/wiki/Wiki/Statutory+requirements+for+mine+closure+in+Finland/ (accessed on 15 September 2017).
- Ramboll. Alustava Sulkemissuunnitelma Hannukaisen Kaivokselle. Available online: https://tietopalvelu.ahtp.fi/Lupa/AvaaLiite.aspx?Liite_ID=2725820 (accessed on 10 October 2018).
- Parsons, R.; Lacey, J.; Moffat, K. Maintaining legitimacy of a contested practice: How the minerals industry understands its ‘social licence to operate’. Res. Policy 2014, 41, 83–90. [Google Scholar] [CrossRef]
- Koivurova, T.; Buanes, A.; Riabova, L.; Didyk, V.; Ejdemo, T.; Poelzer, G.; Taavo, P.; Lesser, P. ‘Social license to operate’: A relevant term in Northern European mining? Polar Geogr. 2015, 38, 194–227. [Google Scholar] [CrossRef]
- Kotilainen, J.; Prokhorova, E.; Sairinen, R.; Tiainen, H. Corporate social responsibility of mining companies in Kyrgyzstan and Tajikistan. Res. Policy 2015, 45, 202–209. [Google Scholar] [CrossRef]
- Ranängen, H.; Lindman, Å. Exploring corporate social responsibility practice versus stakeholder interests in Nordic mining. J. Clean. Prod. 2018, 197, 668–677. [Google Scholar] [CrossRef]
- Espiritu, A.A. Kautokeino and Kvaslund compared: Rejection and acceptance of mining in communities in northern Norway. North. Rev. 2015, 3, 53–65. [Google Scholar]
- Litmanen, T.; Jartti, T.; Rantala, E. Refining the preconditions of a social licence to operate (SLO): Reflections on citizens’ attitudes towards mining in two Finnish regions. Extr. Ind. Soc. 2016, 3, 782–792. [Google Scholar] [CrossRef]
- Genter, S.; Whincup, T. Moving from a social licence to operate to a social licence to close. AusIMM Bull. 2017, 40–41. Available online: https://www.ausimmbulletin.com/feature/moving-social-licence-operate-social-licence-close/ (accessed on 4 December 2018).
- Poelzer, G.A. A stake in mining: Participatory elements in Swedish mine development. North. Rev. 2015, 39, 39–52. [Google Scholar]
- Garcia, X.; Benages-Albert, M.; Vall-Casas, P. Landscape conflict assessment based on a mixed methods analysis of qualitative PPGIS data. Ecosyst. Serv. 2018, 32, 112–124. [Google Scholar] [CrossRef]
- Hasegawa, Y.; Sekimoto, Y.; Seto, T.; Fukushima, Y.; Maeda, M. My City Forecast: Urban planning communication tool for citizen with national open data. Comput. Environ. Urban Syst. 2018. [Google Scholar] [CrossRef]
- Santé, I.; Fernández-Ríos, A.; Tubío, J.M.; García-Fernández, F.; Farkova, E.; Miranda, D. The Landscape Inventory of Galicia (NW Spain): GIS-web and public participation for landscape planning. Landsc. Res. 2018, 1–29. [Google Scholar] [CrossRef]
- Kivinen, S.; Kumpula, T. Detecting land cover disturbances in the Lappi reindeer herding district using multi-source remote sensing and GIS data. Int. J. Appl. Earth Obs. Geoinf. 2014, 27, 13–19. [Google Scholar] [CrossRef]
- Kivinen, S. Many a little makes a mickle: Cumulative land cover changes and traditional land use in the Kyrö reindeer herding district, northern Finland. Appl. Geogr. 2015, 63, 204–211. [Google Scholar] [CrossRef]
- Brown, G. A review of sampling effects and response bias in internet participatory mapping (PPGIS/PGIS/VGI). Trans. GIS 2017, 21, 39–56. [Google Scholar] [CrossRef]
- Kantola, S.; Uusitalo, M.; Nivala, V.; Tuulentie, S. Tourism resort users’ participation in planning: Testing the public participation geographic information system method in Levi, Finnish Lapland. Tour. Manag. Perspect. 2018, 27, 22–32. [Google Scholar] [CrossRef]
- Brown, G.; Kelly, M.; Whitall, D. Which ‘public’? Sampling effects in public participation GIS (PPGIS) and volunteered geographic information (VGI) systems for public lands management. J. Environ. Plan. Manag. 2014, 57, 190–214. [Google Scholar] [CrossRef]
Figure 1.
The location of the study area and the closed Hannukainen and Rautuvaara mines in northern Finland (land cover classes based on CORINE Land Cover 2012) [64].
Figure 1.
The location of the study area and the closed Hannukainen and Rautuvaara mines in northern Finland (land cover classes based on CORINE Land Cover 2012) [64].

Figure 2.
Specific mining elements remaining at the closed Hannukainen and Rautuvaara sites and the area covered by a new mining concession (mining permit) (see [65,66,67,68,69,70,71] for more details).

Figure 3.
Characteristics of respondents (n = 145) participating in the public participation geographic information system (PPGIS) survey according to their relation to the region: local residents living <20 km distance (n = 46) and >20 km distance (n = 34) from the mining sites, vacation home owners <20 km distance (n = 29) and >20 km distance (n = 11) from the mining sites, and visitors (n = 25). (A) gender, (B) age, (C) respondent works in the mining industry, and (D) respondent’s relative(s) work in the mining industry.

Figure 4.
Opinions of respondents (n = 145) on post-mining landscapes in the Hannukainen/Rautuvaara region.
Figure 4.
Opinions of respondents (n = 145) on post-mining landscapes in the Hannukainen/Rautuvaara region.

Figure 5.
Opinions of respondents (n = 145) on new mining activities in the Hannukainen/Rautuvaara region.
Figure 5.
Opinions of respondents (n = 145) on new mining activities in the Hannukainen/Rautuvaara region.

Figure 6.
Relationship between respondents’ activities in the region and opinion on the statement “New mining activities would be welcome in the closed mining areas”.
Figure 6.
Relationship between respondents’ activities in the region and opinion on the statement “New mining activities would be welcome in the closed mining areas”.

Figure 7.
Total numbers of descriptions related to (A) pleasant places (positive experiences), (B) unpleasant places (negative experiences), (C) places where more knowledge is needed on the state of the environment, and (D) places were potential impacts of new mining activities would be experienced. One map marking can include multiple descriptions (e.g., a pleasant place can be a beautiful landscape with high nature value).

Figure 8.
Numbers of map markings in 1 km grid squares for (A) pleasant places (positive experiences, n = 372), (B) unpleasant places (negative experiences, n = 93), (C) places where more knowledge on the state of the environment is needed (n = 100), and (D) places where positive or negative impacts of mine reopening would be experienced (n = 194). See Figure 2 for detailed landscape elements in the closed mining sites.


Table 1.
Characteristics of respondents (n = 145) participating in the public participation geographic information system (PPGIS) survey on post-mining landscapes in the Hannukainen/Rautuvaara region.
Table 1.
Characteristics of respondents (n = 145) participating in the public participation geographic information system (PPGIS) survey on post-mining landscapes in the Hannukainen/Rautuvaara region.
| Respondents (%) | % |
|---|---|
| Gender | |
| Female | 37 |
| Male | 63 |
| Age | |
| 15–19 | 2 |
| 20–29 | 13 |
| 30–39 | 15 |
| 40–49 | 28 |
| 50–59 | 20 |
| 60–69 | 19 |
| 70 or over | 3 |
| Relation to the region | |
| Local resident, <20 km | 32 |
| Local resident, >20 km | 23 |
| Vacation home owner, <20 km | 20 |
| Vacation home owner, >20 km | 8 |
| Visitor (leisure or work) | 17 |
| Work in the mining industry | |
| Respondent | 18 |
| Respondent’s relative(s) | 40 |
Table 2.
Chi-square statistics for respondents’ opinions on statements related to post-mining landscapes in the Hannukainen/Rautuvaara region. See Figure 4 for full statements. Relationships between opinions (agree/disagree) and gender, age, relationship to the region, respondent’s work in the mining industry, and respondent’s relative(s) work in the mining industry were examined.
| Gender | Age | Relation | Min. Res. | Min. Rel. | ||||||
|---|---|---|---|---|---|---|---|---|---|---|
| CS | Sig. | CS | Sig. | CS | Sig. | CS | Sig. | CS | Sig. | |
| Post-mining areas fit well in the… | 0.11 | n.s | 15.84 | * | 21.81 | *** | 22.91 | *** | 27.07 | *** |
| Post-mining…need reclamation… | 0.53 | n.s. | 7.05 | n.s. | 13.10 | * | 1.42 | n.s. | 12.60 | *** |
| Landscaping and restoration of… | 2.13 | n.s. | 7.29 | n.s. | 7.03 | n.s. | 20.97 | *** | 6.84 | ** |
| Post-mining areas…cultural... | 0.09 | n.s. | 17.68 | ** | 31.86 | *** | 32.27 | *** | 31.66 | *** |
| Post-mining areas…other land uses… | 1.15 | n.s. | 13.18 | * | 23.54 | *** | 11.98 | ** | 18.69 | *** |
Gender (df = 1), Age (df = 6), Relation (df = 4), Min. Res. (df = 1), Min. Rel. (df = 1); n.s. = not significant, * p < 0.05, ** p < 0.01, *** p < 0.001.
Table 3.
Respondents’ opinions on statements related to post-mining landscapes in the Hannukainen/Rautuvaara region in different stakeholder groups. Proportions for agreement (A) and disagreement (D) are calculated using the total number of respondents within each category: local residents <20 km distance (n = 46) and >20 km distance (n = 34), vacation home owners <20 km distance (n = 29) and >20 km distance (n = 11), and visitors (n = 25).
| Local Resident (%) | V. Home Owner (%) | Visitor (%) | |||
|---|---|---|---|---|---|
| <20 km | >20 km | <20 km | >20 km | ||
| A/D | A/D | A/D | A/D | A/D | |
| Post-mining areas fit well in the surrounding landscape. | 35/59 | 50/26 | 10/79 | 0/82 | 32/52 |
| Post-mining areas would need reclamation and landscaping measures. | 67/15 | 53/21 | 90/0 | 73/9 | 80/0 |
| Landscaping and restoration of post-mining sites as close as possible to the conditions that… | 65/22 | 56/21 | 90/7 | 91/0 | 64/16 |
| Post-mining area with their specific elements…can be considered as part of the cultural landscape… | 39/57 | 74/15 | 14/79 | 9/64 | 36/32 |
| Post-mining areas in their current form do not hamper other land uses and industries… | 39/48 | 71/21 | 21/62 | 0/73 | 40/0 |
Table 4.
Chi-square statistics for respondents’ opinions on statements related to new mining activities in the Hannukainen/Rautuvaara region. See Figure 5 for full statements. Relationships between opinions (agree/disagree) and gender, age, relationship to the region, respondent’s work in the mining industry, and respondent’s relative(s) work in the mining industry were examined.
| Gender | Age | Relation | Min. Res. | Min. Rel. | ||||||
|---|---|---|---|---|---|---|---|---|---|---|
| CS | Sig. | CS | Sig. | CS | Sig. | CS | Sig. | CS | Sig. | |
| New mining…welcome… | 0.25 | n.s | 16.34 | * | 39.96 | *** | 30.23 | *** | 34.29 | *** |
| New mining…economy… | 0.07 | n.s. | 10.39 | n.s. | 33.43 | *** | 23.07 | *** | 22.95 | *** |
| New mining…industries… | 0.89 | n.s. | 10.22 | n.s. | 31.49 | *** | 23.16 | *** | 22.70 | *** |
| Uncertainty over reopening… | 2.26 | n.s. | 4.08 | n.s. | 10.42 | * | 16.06 | *** | 6.01 | * |
| A good environmental… | 0.81 | n.s. | 10.95 | n.s. | 37.05 | *** | 30.93 | *** | 31.68 | *** |
| After the closure, mining… | 1.17 | n.s. | 9.30 | n.s. | 39.71 | *** | 32.59 | *** | 27.31 | *** |
Gender (df = 1), Age (df = 6), Relation (df = 4), Min. Res. (df = 1), Min. Rel. (df = 1); n.s. = not significant, * p < 0.05, ** p < 0.01, *** p < 0.001.
Table 5.
Respondents’ opinions on statements related to new mining activities in the Hannukainen/Rautuvaara region in different stakeholder groups. Proportions for agreement (A) and disagreement (D) are calculated using the total number of respondents within each category: local residents <20 km distance (n = 46) and >20 km distance (n = 34), vacation home owners <20 km distance (n = 29) and >20 km distance (n = 11), and visitors (n = 25).
| Local Resident (%) | V. Home Owner (%) | Visitor (%) | |||
|---|---|---|---|---|---|
| <20 km | >20 km | <20 km | >20 km | ||
| A/D | A/D | A/D | A/D | A/D | |
| New mining activities would be welcome in the closed mining areas. | 43/57 | 79/18 | 10/86 | 0/91 | 48/48 |
| New mining activities would have a positive impact on the economy of the region. | 43/50 | 85/15 | 21/79 | 9/82 | 44/44 |
| New mining activities would have negative impacts on other industries/businesses… | 57/35 | 18/68 | 76/17 | 100/0 | 44/44 |
| Uncertainty over reopening of mines has a negative impact on other industries/businesses… | 63/26 | 32/41 | 76/24 | 91/9 | 60/24 |
| A good environmental status could be maintained in the region during the active mining phase and… | 41/57 | 76/21 | 10/86 | 0/91 | 48/52 |
| After the closure, mining sites could be reclaimed to fit well in the surrounding landscape. | 46/50 | 79/18 | 10/90 | 0/82 | 44/52 |
Table 6.
Proportions of pleasant places, unpleasant places, places where more knowledge on the state of the environment is needed, and places where positive or negative impacts of mine reopening would be experienced in old mining sites, in the new mining concession, different buffer zones, and elsewhere in the landscape.
| (%) | Pleasant | Unpleasant | Knowledge | Impacts |
|---|---|---|---|---|
| Old mining sites | 3 | 53 | 44 | 2 |
| New mining concession | 4 | 60 | 56 | 8 |
| New mining concession + 1 km buffer | 22 | 76 | 72 | 21 |
| New mining concession + 2 km buffer | 34 | 77 | 75 | 27 |
| New mining concession + 5 km buffer | 59 | 81 | 86 | 47 |
| Elsewhere (outside a new mining concession + 5 km buffer) | 41 | 19 | 14 | 53 |
Table 7.
Summary of specific questions raised by the respondents on the current state of the environment.
Table 7.
Summary of specific questions raised by the respondents on the current state of the environment.
| Specific Questions Raised by Respondents |
|---|
| Do rivers contain toxic substances? |
| What is the water quality in the ponds? |
| Do toxic substances in the ponds disperse to the downstream rivers? |
| Is ground water contaminated? |
| Do toxic substances in the ponds dissolve in the ground water? |
| Do waste rock facilities contain harmful substances? |
| Does melt water in the spring dissolve chemicals to the downstream rivers? |
| Is soil contaminated? |
| What is the uranium content of the soil? |
| Do waste rock facilities have impacts on air quality? |
| Is it safe to consume fish from the water bodies near the closed mines? |
| Are fish in the water-filled open pits safe for birds? |
| Is it safe to consume berries/mushrooms picked from the nearby areas? |
| Do toxic substances accumulate in reindeer meat if reindeer spend time in the area? |
| Why there is no vegetation in the mined sites? |
| Can similar vegetation that existed before mining be established in the area? |
| What are the impacts of mining on ecosystems? |
Table 8.
Co-occurrence of pleasant places, unpleasant places, places where more knowledge on the state of the environment is needed, and places where positive or negative impacts of mine reopening would be experienced within 1 km grid squares. The proportion of overlapping 1-km grid squares of (A) all pleasant grid squares (n = 179); and (B) all unpleasant grid squares (n = 34).
| A. | |
| % of Pleasant | |
| Overlapping 1-km Grid Squares | (n = 179) |
| No overlap | 63.1 |
| Unpleasant | 0.6 |
| Knowledge needs | 3.4 |
| Impacts | 22.3 |
| Unpleasant + knowledge needs | 0.6 |
| Unpleasant + Impacts | 4.4 |
| Knowledge needs + impacts | 2.2 |
| Unpleasant + knowledge needs + impacts | 3.4 |
| Total | 100.0 |
| B. | |
| % of Unpleasant | |
| Overlapping 1-km Grid Squares | (n = 34) |
| No overlap | 20.6 |
| Pleasant | 2.9 |
| Knowledge needs | 20.6 |
| Impacts | 5.9 |
| Pleasant + knowledge needs | 2.9 |
| Pleasant + Impacts | 17.7 |
| Knowledge needs + impacts | 5.9 |
| Pleasant + knowledge needs + impacts | 23.5 |
| Total | 100.0 |
© 2018 by the authors. Licensee MDPI, Basel, Switzerland. This article is an open access article distributed under the terms and conditions of the Creative Commons Attribution (CC BY) license (http://creativecommons.org/licenses/by/4.0/).
Share and Cite
MDPI and ACS Style
Kivinen, S.; Vartiainen, K.; Kumpula, T. People and Post-Mining Environments: PPGIS Mapping of Landscape Values, Knowledge Needs, and Future Perspectives in Northern Finland. Land 2018, 7, 151. https://doi.org/10.3390/land7040151
AMA Style
Kivinen S, Vartiainen K, Kumpula T. People and Post-Mining Environments: PPGIS Mapping of Landscape Values, Knowledge Needs, and Future Perspectives in Northern Finland. Land. 2018; 7(4):151. https://doi.org/10.3390/land7040151
Chicago/Turabian StyleKivinen, Sonja, Kaarina Vartiainen, and Timo Kumpula. 2018. "People and Post-Mining Environments: PPGIS Mapping of Landscape Values, Knowledge Needs, and Future Perspectives in Northern Finland" Land 7, no. 4: 151. https://doi.org/10.3390/land7040151
Note that from the first issue of 2016, this journal uses article numbers instead of page numbers. See further details here.