1. Background
Land degradation is one of the development challenges of humankind. Different sustainable land management technologies have been developed, but land degradation remains a growing problem, particularly for developing nations as Ethiopia where the majority of the people are dependent on land cultivation for their livelihoods.
Soil erosion by water is a major agent of land degradation in Ethiopia and more specifically in the Upper Blue Nile Basin, and it has significant impacts on ecosystem services [
1]. Land degradation in Ethiopia has been affected by increasing human and livestock populations, climatic variations, recurring droughts, inappropriate land use practices, and top-down resource conservation approaches [
2,
3,
4]. Less responsive policies have also exacerbated land degradation and heightened poverty levels [
5]. The result is a widespread degradation of the land base.
The federal government of Ethiopia and non-governmental organizations have recognized land degradation as a major environmental and socio-economic problems and they have put considerable efforts into reducing the problem and stop further degradation [
2,
6]. A variety of conservation practices, which include terraces, soil bunds, and area enclosures, have been introduced into individual and communal lands in massive scales in Ethiopia [
7,
8,
9,
10,
11]. Although efforts made thus far to tackle land degradation have yielded some success, there is still a long way to go to address this critical challenge in the country [
10].
The federal government and several non-government agencies have launched watershed development initiatives to tackle some of the generic problems, aiming to develop soil conservation, improve land productivity, and promote appropriate technologies for efficient and sustainable use of natural resources [
11]. Today, there is a massive movement in watershed management in almost all regions of Ethiopia [
12]. However, watershed management has merely been considered a practice of soil and water conservation where only technological approaches were adopted from the earlier successful projects and from the lessons related to institutional arrangements were neglected [
13,
14]. Yet, integrated watershed management goes beyond the conservation activities. It emphasizes strengthening local institutions, income-generating activities through alternative sources, and creating markets to improve financial livelihoods [
14,
15].
The Water and Land Resource Center (WLRC) of Addis Ababa University has established six learning watersheds and applied research-supported watershed development interventions to improve land products and people’s livelihoods in the watersheds. Aba-Gerima and Debre Mewi are among the watersheds in the Lake Tana Basin in north central? Ethiopia where the WLRC interventions were applied. In these two watersheds, the community played a major role in designing and implementing land and water management interventions with WLRC leading several components; mainly, capacity building, experience sharing, and exposing the communities and local leadership to different technologies that are suitable for varying landscapes and resource bases.
The existing institutional arrangements for watershed development programs have been hierarchical in nature. They include higher level entities, which are engaged in planning, coordination, and control, and the grassroots-level entities that operate closer to the farming community. In the hierarchical structure of Ethiopia’s Federal Ministry of Agriculture (MoA), development agents (DAs) are the responsible persons at the
kebele or community level for the direct implementation of the components. Generally, village-level institutions do not have the required managerial capabilities to coordinate the complexities that are involved in the natural resources management [
13]. This type of institutional weaknesses poses a significant challenge and often leads to a poor process of implementation and outcome [
15].
Earlier efforts on halting degradation were focused on generating soil and water conservation technologies. When the technologies were not effective in bringing the required change, a participatory approach was promoted. Again, the emphasis was then made to ensure that communities benefit from watershed development [
11,
15]. Although these have brought a lot of improvements, more is required to reach the goal of halting degradation [
16].
Another dimension that has been examined is understanding the institutional arrangements [
17,
18,
19,
20], institutional functionality and the performance culture, which has not been addressed adequately. Efforts are made to evaluate the role that institutional arrangements can play by considering two approaches in which one is considered successful as compared to the other to demonstrate the need to include the institutional dimension in the integrated watershed development interventions.
2. Conceptual Framework for Studying Functionality Analysis on Watershed Development
Research and practical experiences demonstrate that strong local level institutions at the grass roots level are crucial for successful watershed management [
21,
22]. Watershed management requires coordination, comprehensive efforts, and a more direct involvement of local communities, government and non-governmental institutions, and other stakeholders. In the new institutional economics, institutions are viewed as durable rules which govern human interactions, and which are also ‘humanly devised’ [
23]. Strong village-level institutions are a prerequisite for successful watershed management [
21,
24,
25]. Based on the foundations of new institutional economics, Pagan [
26] has identified five key characteristics, which are clarity of objectives, effective interactions, adaptiveness, appropriateness of scale, and compliance to the rule that (may be) required and observed in effective institutions. In addition, in the context of watershed development, Gandhi [
27] has identified seven rationalities, which are technical, economical, environmental, social, organizational, financial, and governmental that must be addressed for good governance and performance. Each of the institutional characteristic and rationalities are explained hereunder.
Institutional Characteristics:
The five key characteristics that (may be) required and observed in effective institutions are the following:
Clear objectives: Clarity of objectives and their acceptance by stakeholders creates order, reduces possible conflicts, lessens the transaction costs, and results in greater congruence.
Good Interaction: Good interaction leads to planning the appropriate activities and enhancing the chances of their acceptance and ownership by the villagers.
Adaptiveness: Adaptiveness to varying external and internal environments is necessary for reduced transaction costs and enhanced sustainable performance. A lack of adaptiveness raises transaction costs and lead to institutional failure.
Appropriate scale: Spatial and administrative scales in scope and size help to avoid large transaction costs and provide for better control on internal and external environments. It can lead to better institutional performance.
Compliance capacity: Compliance to the rules by a large section of the members decreases transaction costs, thereby making the institution more meaningful. [Be positive] The objectives and rules give shape and meaning to the institution, and compliance to the rules of the institution is essential to make the institution meaningful and effective.
Consideration of Rationalities:
Theories of management, organizational design, and governance identify some rationalities that need to be addressed for good governance and performance [
27]. Rationality is the quality or state of being reasonable, based on facts or reasons rather than emotions or feelings. A rational decision is the one that is not just reasoned, but also optimal for achieving a goal or solving a problem. In the context of watershed development, Gandhi [
27] has proposed consideration of seven rationalities. The complete set is as follows:
Technical rationality deals with the involvement of experts or technically skilled people in planning and decision-making for activities, like selection of technologies. It also considers the type, specifications, and location of various watershed management activities.
Economic rationality deals with the evaluation and selection of activities by giving due consideration to markets, demands, prices, profitability, and returns on investments.
Environmental rationality requires the consideration of the externalities and efforts towards conservation of water, and land and natural vegetation on a sustainable basis.
Social rationality deals with the consideration of the social or community setting to enhance ownership, acceptability, and the cooperation of different social groups for watershed development activities.
Organizational rationality is the consideration of the present level of specialization, division of labor, and the effective coordination, which are critical for effective institutions. Similarly, it is also important how institutions induce and promote leadership, managerial skills, knowledge, and training of its key constituents.
Financial rationality involves the inclusion of procedures, responsibility, and accounting systems to enhance discipline, and care in proper handling of the finances.
Government rationality requires proper design of programs and effective and speedy support from the government system.
In this paper, the functionality and performance of two watershed groups; (1) WLRC supported Model watersheds (‘Model Watershed’ from here on) and (2) adjacent Community watersheds developed through community mobilization (‘Community watershed’ hereafter) were evaluated using the above- described institutional characteristics and rationalities (
Table S1).
3. Material and Methods
3.1. Study Area
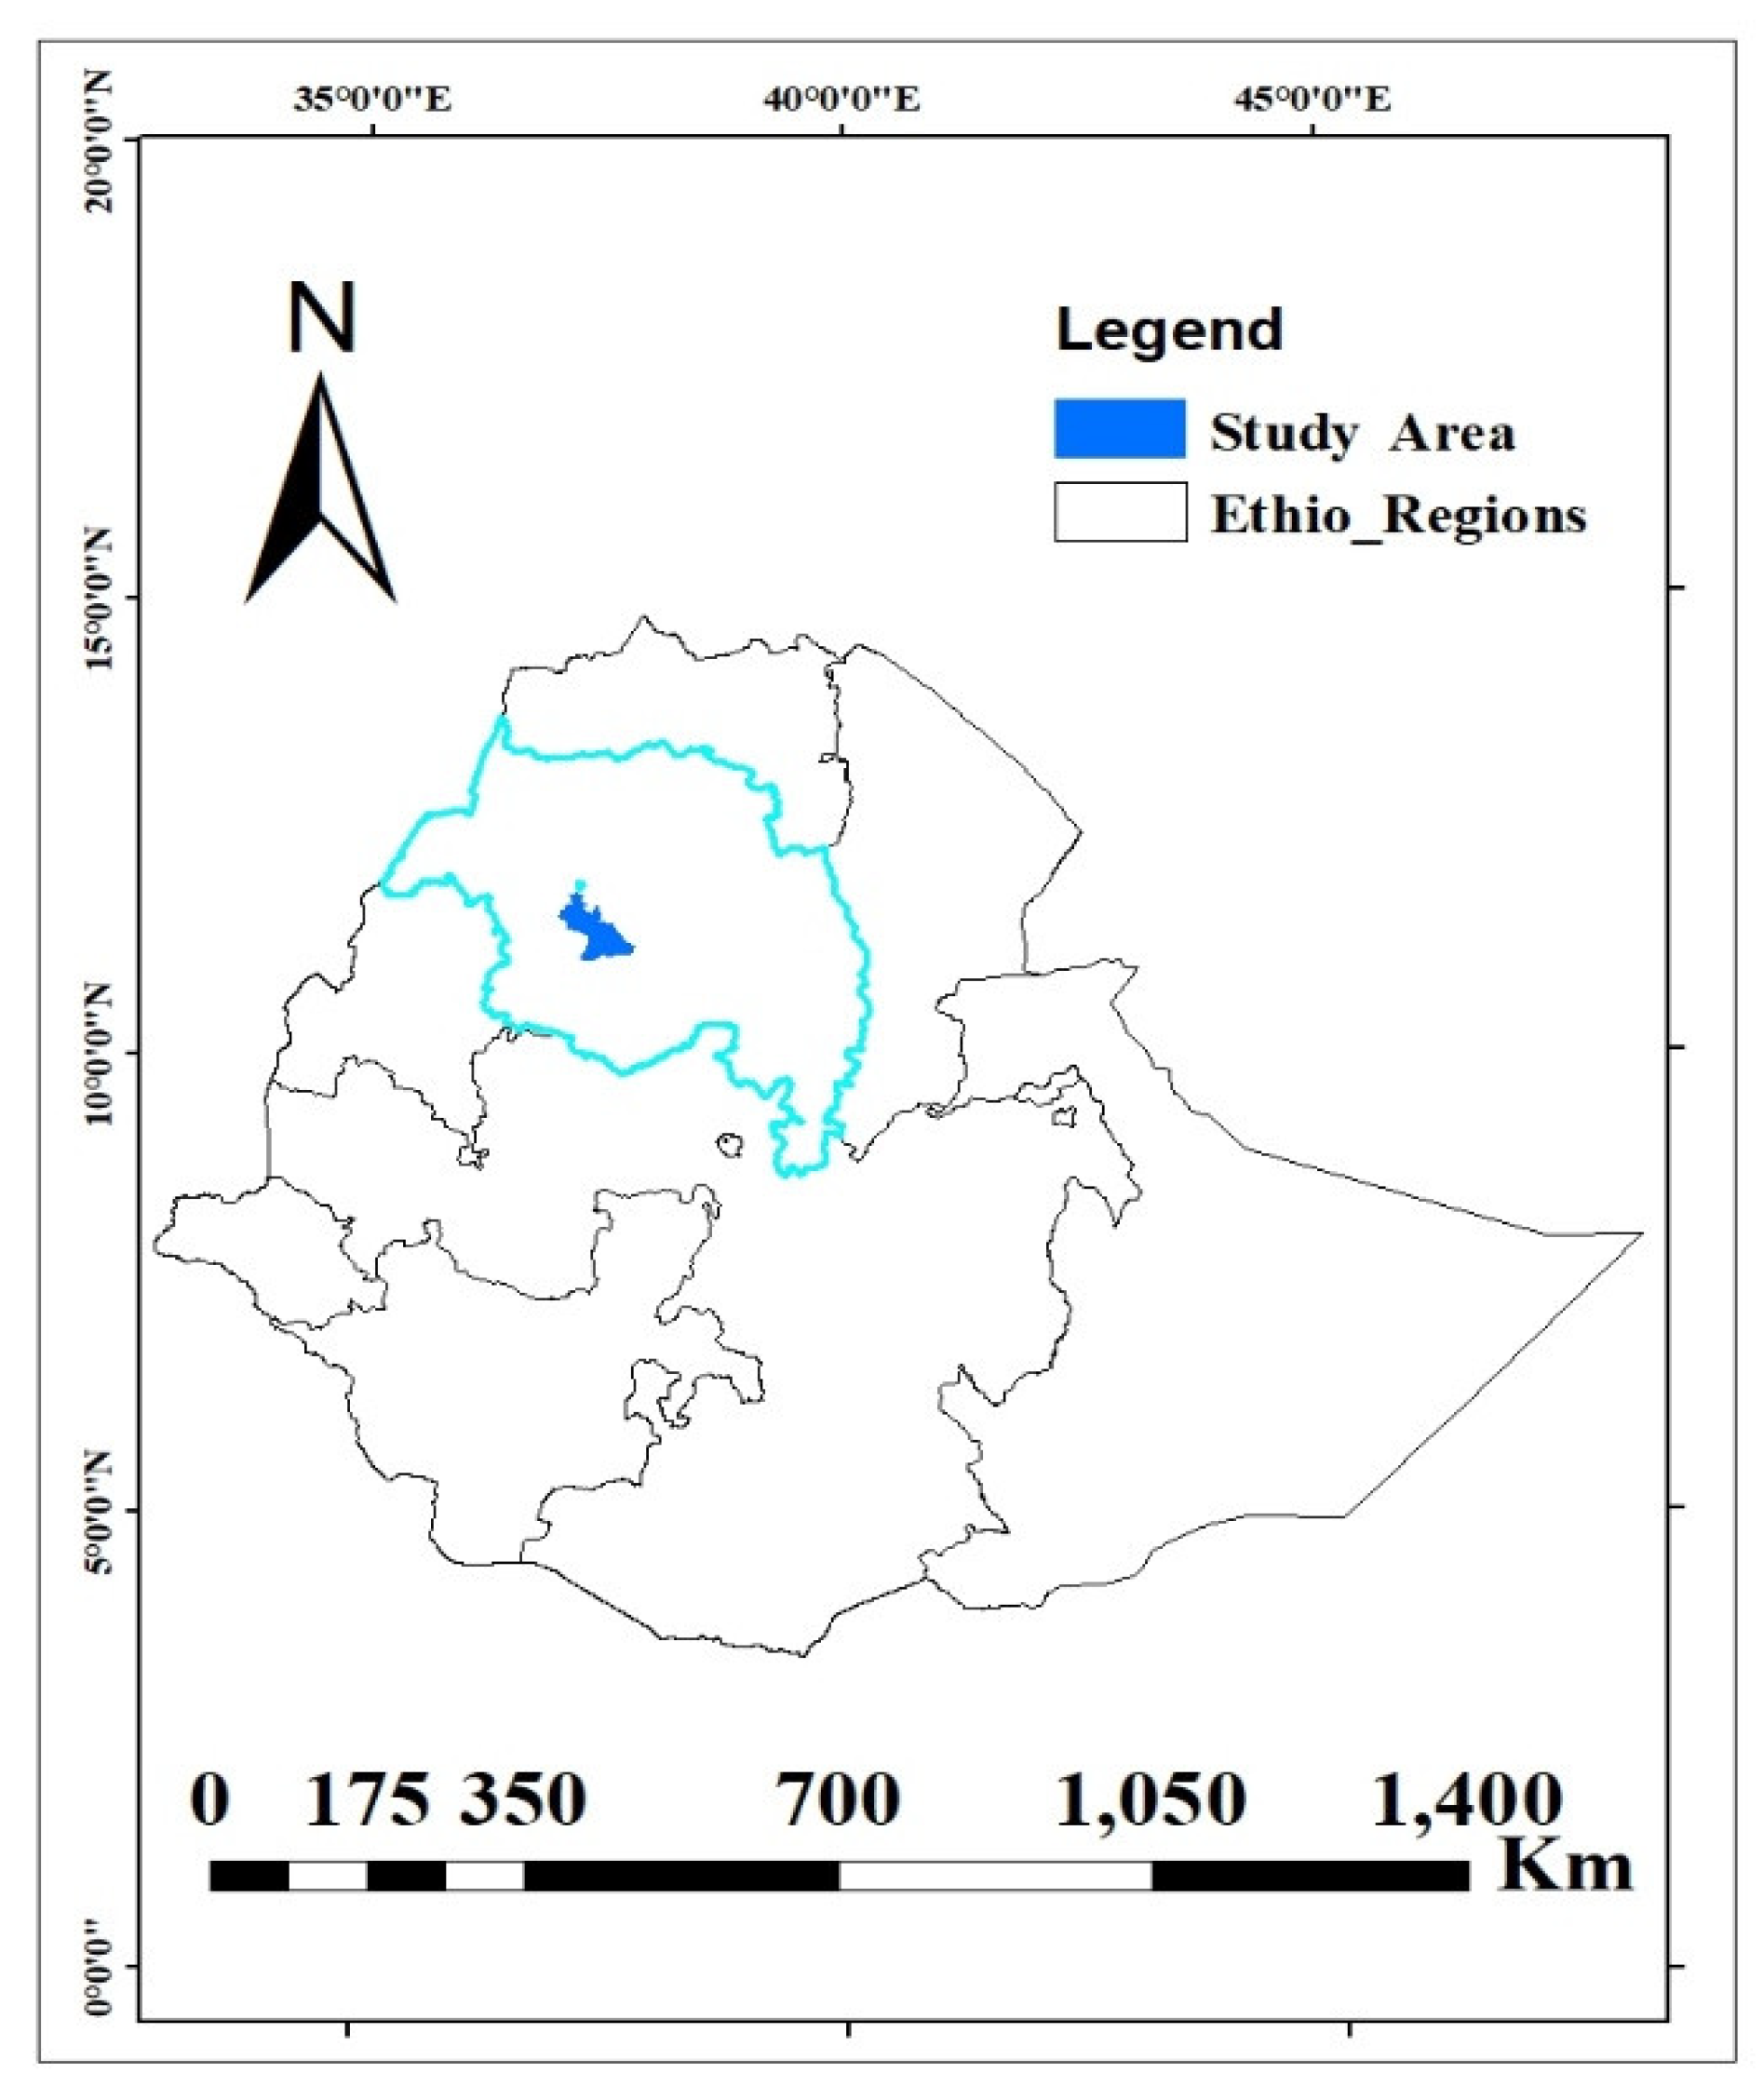
The study was conducted in four micro-watersheds, namely, Aba Gerima, Yinesu, Debre Mewi, and the Koti in the West Gojam Zone of the Amhara Region of Ethiopia (
Figure 1). The biophysical and socio-economic conditions of the four watersheds were similar, and they were all situated in Lake 127 Tana Basin. All of the the sites had Woyina Dega/mid-land/ agro-ecology. The mean annual rainfall varied between 1190 mm and 1200 mm·year
−1 [
28,
29], with an average of 1195 mm·year
−1. The mean annual temperature for all micro-watershed reached about 20 °C. The altitude of the study sites ranged from 2398 to 2430 meter above sea level. The rainy season usually occurred between June and September, which was also the growing season varying between 90 and 120 day [
28,
30,
31,
32].
Mixed crop-livestock farming was the backbone of the households’ livelihood in all study sites [
28,
29,
30]. Major crops grown in these watersheds were tef, maize, barley, finger millet, wheat, faba bean, potato, grass pea, and noug (
Guizotia abyssinica).
In Ethiopia, land is owned by the state and farmers have a right to till the land. Realizing the need for securing land tenure for sustainable land management, the current federal government of the country has halted further land redistribution and started land certification for farmers effective 2005. This protects land use rights as long as farmers wisely use their land.
In all the micro-watershed, SWC measures were introduced in 1990s with the regular government extension program [
28,
29]. Different approaches have been followed to disseminate SWC practices in the area. Before 2005, farmers participated in SWC programs through mass mobilization with a top-down approach. The approach was not watershed based, but it was
kebele based (the lowest administrative community body). Thus, farmers constructed bunds for other villages (at a distance) in their
kebeles. However, some of the farmers were not the beneficiaries of what they constructed. They constructed bunds without incentives.
Currently, the watershed approach is being used again through community mass mobilization in all micro-watersheds. However, in Aba Gerima and Debere Mewi, a range of watershed management intervention measures, including area closure, graded bund, level bund, and a forestation have been conducted with the support of WLRC since 2011. Technical staff were assigned to lead the watershed activities with close supervision of the quality of work. Supervision was provided through a closer engagement and consultation with communities. Emphasis was given to ensure that every intervention focused on livelihood enhancement. Also, WLRC made the local institution effective and functional.
As watershed team was established to coordinate the planning and implementation of watershed management agendas at the kebele level. The watershed team comprised of 15 members was established while taking gender and social strata representation into consideration. The watershed committee included village leaders, kebele development agents, elder farmers, women farmers, innovative model famers, community institutions, like the ider/(ingenious social security), and leaders from each community. This watershed team was supervised by a woreda watershed team organized at the district level with different specialization. Again, the woreda watershed team was supervised by a regional level watershed team organized at the regional level.
3.2. Sampling Design
A three-stage sampling method was employed to select sample households for the survey. First stage selection was the
woredas, including Bahir Dar Zuriya and Yilamana Densa woredas where Model watersheds are found. The second stage selection was the Aba Gerima watershed from Bahir Dar Zuriya and Debre Mewi watershed from Yilamana Densa as the Model watersheds. Yinesu and Koti watersheds were systematically selected based on watershed homogeneity from Bahir Dar Zuriya and Yilmana Densa
woredas, respectively. Finally, the sample frame was prepared from the
kebele records and 5% of randomly selected households in each watershed were selected for the household survey. In order to capture governance-related issues, between four and six village administration staff from each village, eight to thirteen watershed committee members from each watershed, and thirty-seven experts responsible in sectorial offices that are relevant to the management of the watershed management at different levels (village, district, zone, and region) were purposively selected for this interview (
Table 1).
3.3. Data Collection Instruments
Quantitative and qualitative data were collected using a formal household survey instrument prepared in Amharic, focus group discussions (FGDs), and key informant interviews that were conducted in 2016 and 2017. The household survey used a structured questionnaire to compare the performance of Model, the WLRC supported model watersheds and Community watersheds developed through community mobilization on the selected set of indicators using a non–parametric Mann-Whitney U test using SPSS Version 20 [
33].
Responses were generated using a three point Likert scale questions with 1—agree, 2—neutral, and 3—disagree. The interviews were carried out at the watershed member’s homestead during Community watershed management practice and at their offices for the experts.
A total of ten focus group discussions were conducted and two group discussions were undertaken in each watershed with farmers to gather qualitative data. After thorough discussions with farmers, other focus group discussions with development agents and experts of agricultural natural resource at district level were undertaken. The number of participants in each group ranged from six to nine. The major issues that were included in the questionnaire were the functionality of the local watershed institution to administer the watershed resources including holding meetings, devising and enforcing rules, undertaking maintenance; major constraints in the watershed management, main gaps in fully discharging responsibilities; staff turnover matters; and, monitoring and evaluation mechanisms of the watershed management.
Key informant interviews (KII) were conducted with individuals who were considered as knowledgeable and rich in experiences about watershed management activities and the socio-economic conditions of the community KII data were collected using a semi-structured questionnaire in Amharic. Elderly people, model farmers, watershed development committee members, development agents, and wereda and regional natural resource experts were selected as key informants. The focus of the questionnaire was on the level of community participation in watershed developments, the capability of the experts in watershed management, the culture of maintenance of constructed structures, the commitment of watershed committee and village administrators, and the role of WLRC in the watershed management in the two watersheds.
3.4. Data Analysis
Since the data for semi-structured interview was non-normal in distribution, the non-parametric Mann–Whitney U-test, which is equivalent of the parametric t-test for independent sample test was employed to test the differences between the ratings of responses between the two watershed groups. It is a rank–ordered test for assessing the distribution of two independent groups. The test helps to assess whether difference in institutional features and rationalities between the two watersheds groups are statistically significant or not [
34]. This was estimated first by ranking all the values from low to high, without considering which group each value belongs. Hence, the smallest value gets a rank of 1 and the largest value gets a rank of n, where n is the total number of values in the two groups. Then, the mean of the ranks would be calculated for each group. If the means of the ranks for the two groups are very different, it indicates that the difference does not happen by chance and there is statistical significant difference between the ratings of the two groups.
In this paper, the response options were agree (1), neutral (2), disagree (3); thus, the group with the lowest mean rank is the group with more number of favorable responses (agree on the stated issue). The test was conducted using the Statistical Package for Social Science (SPSS 20 for Windows) [
33]. The formula for Mann–Whitney U-test estimation is given, as follows:
where:
Moreover, the qualitative information was analyzed, summarized and presented employing the three key strategies (description, classification, and connection) of qualitative data analysis [
35].
4. Results
4.1. Effectiveness of Institutional Characteristics between Model and Community Watersheds
The results of institutional characteristics (required and observed in effective institutions) were compared using the five indicators as shown in
Table 2,
Table 3,
Table 4,
Table 5 and
Table 6. It was found that the clarity of the objectives, good interaction, adaptiveness and compliance to the rule significantly varied between the two watershed groups. Yet, with reference to the scale of the watershed, the statistical test showed no significant difference between the two watersheds groups. In the subsequent section, each of the institutional characteristics with their respective variable are presented and described.
4.1.1. Clarity of Objectives
The results indicate that the clarity of objectives was found to be significantly different between Community and Model watersheds. For Model watershed managements, objectives and purpose were clear to all (U = 3239, Z = −2.13, p = 0.03). The mean rank for this indicator in WLRC watersheds was found to be 81, while that of Community watersheds was 96. The lower the mean rank implies that the majority of the respondent in WLRC agreed on the stated issue. Hence, the objective of watershed management in Model watersheds was clear to all community members.
On the other hand, no significant differences were observed between the two watershed groups with respect to organization has clear set of objectives and deviation from natural resource management objectives were not frequent (see
Table 2), implying that in both watershed groups organizations have clear set of objectives and their intervention measures were not deviating from natural resource management research objectives. However, the WLRC watershed groups were committed towards attaining their objectives.
4.1.2. Interaction and Integration among Institutions
The results of the Mann-Whitney U tests showed that there was statistically significant difference between Model and Community watersheds on good leadership to facilitate and guide the interaction (U = 3228, Z = −2.2, p = 0.033), good interaction between the watershed committee and the villagers (U = 3265, Z = −2.0, p = 0.042) and regular meeting for watershed committee (U = 3139, Z = −2.4, p = 0.016). The mean rank for the above indicators in watersheds managed by WLRC (Aba Gerima and Debere Mewi watersheds) was found to be smaller than watersheds that were managed by communities (
Table 3), suggesting that good interaction and integration were observed in WLRC supported watersheds. However, in relation to interaction with higher level government officials, no statistically significant difference were observed between the two groups (U = 4126, Z = −1.9, p = 0.056). Due to the strong governmental will and commitments, both of the watershed institutions have good relationship with the higher level government official at least for campaign works.
4.1.3. Adaptiveness
Statistically significant variation was observed between the two groups with regard to the rules and procedures of watershed institution flexibility (U = 3180, Z = −2.295, p = 0.022); presence of a clear set of mechanism for changing the rule (U = 3267, Z = −2.060, p = 0.039); and, regular review of the rules and systems of the institution (U = 3253, Z = −2.081, p = 0.037). Lower mean rank was witnessed in WLRC supported watersheds (
Table 4), implying that, in this watershed group, the rules are flexible; a clear set of mechanism exist for changing the rule and the rules and systems are regularly reviewed.
4.1.4. Scale of the Watershed
The scale of the watershed was not found to be significantly different between Model and Community watersheds (
Table 5). In both watershed groups, the scale of the watershed is appropriate and up to the recommended size for effective watershed management.
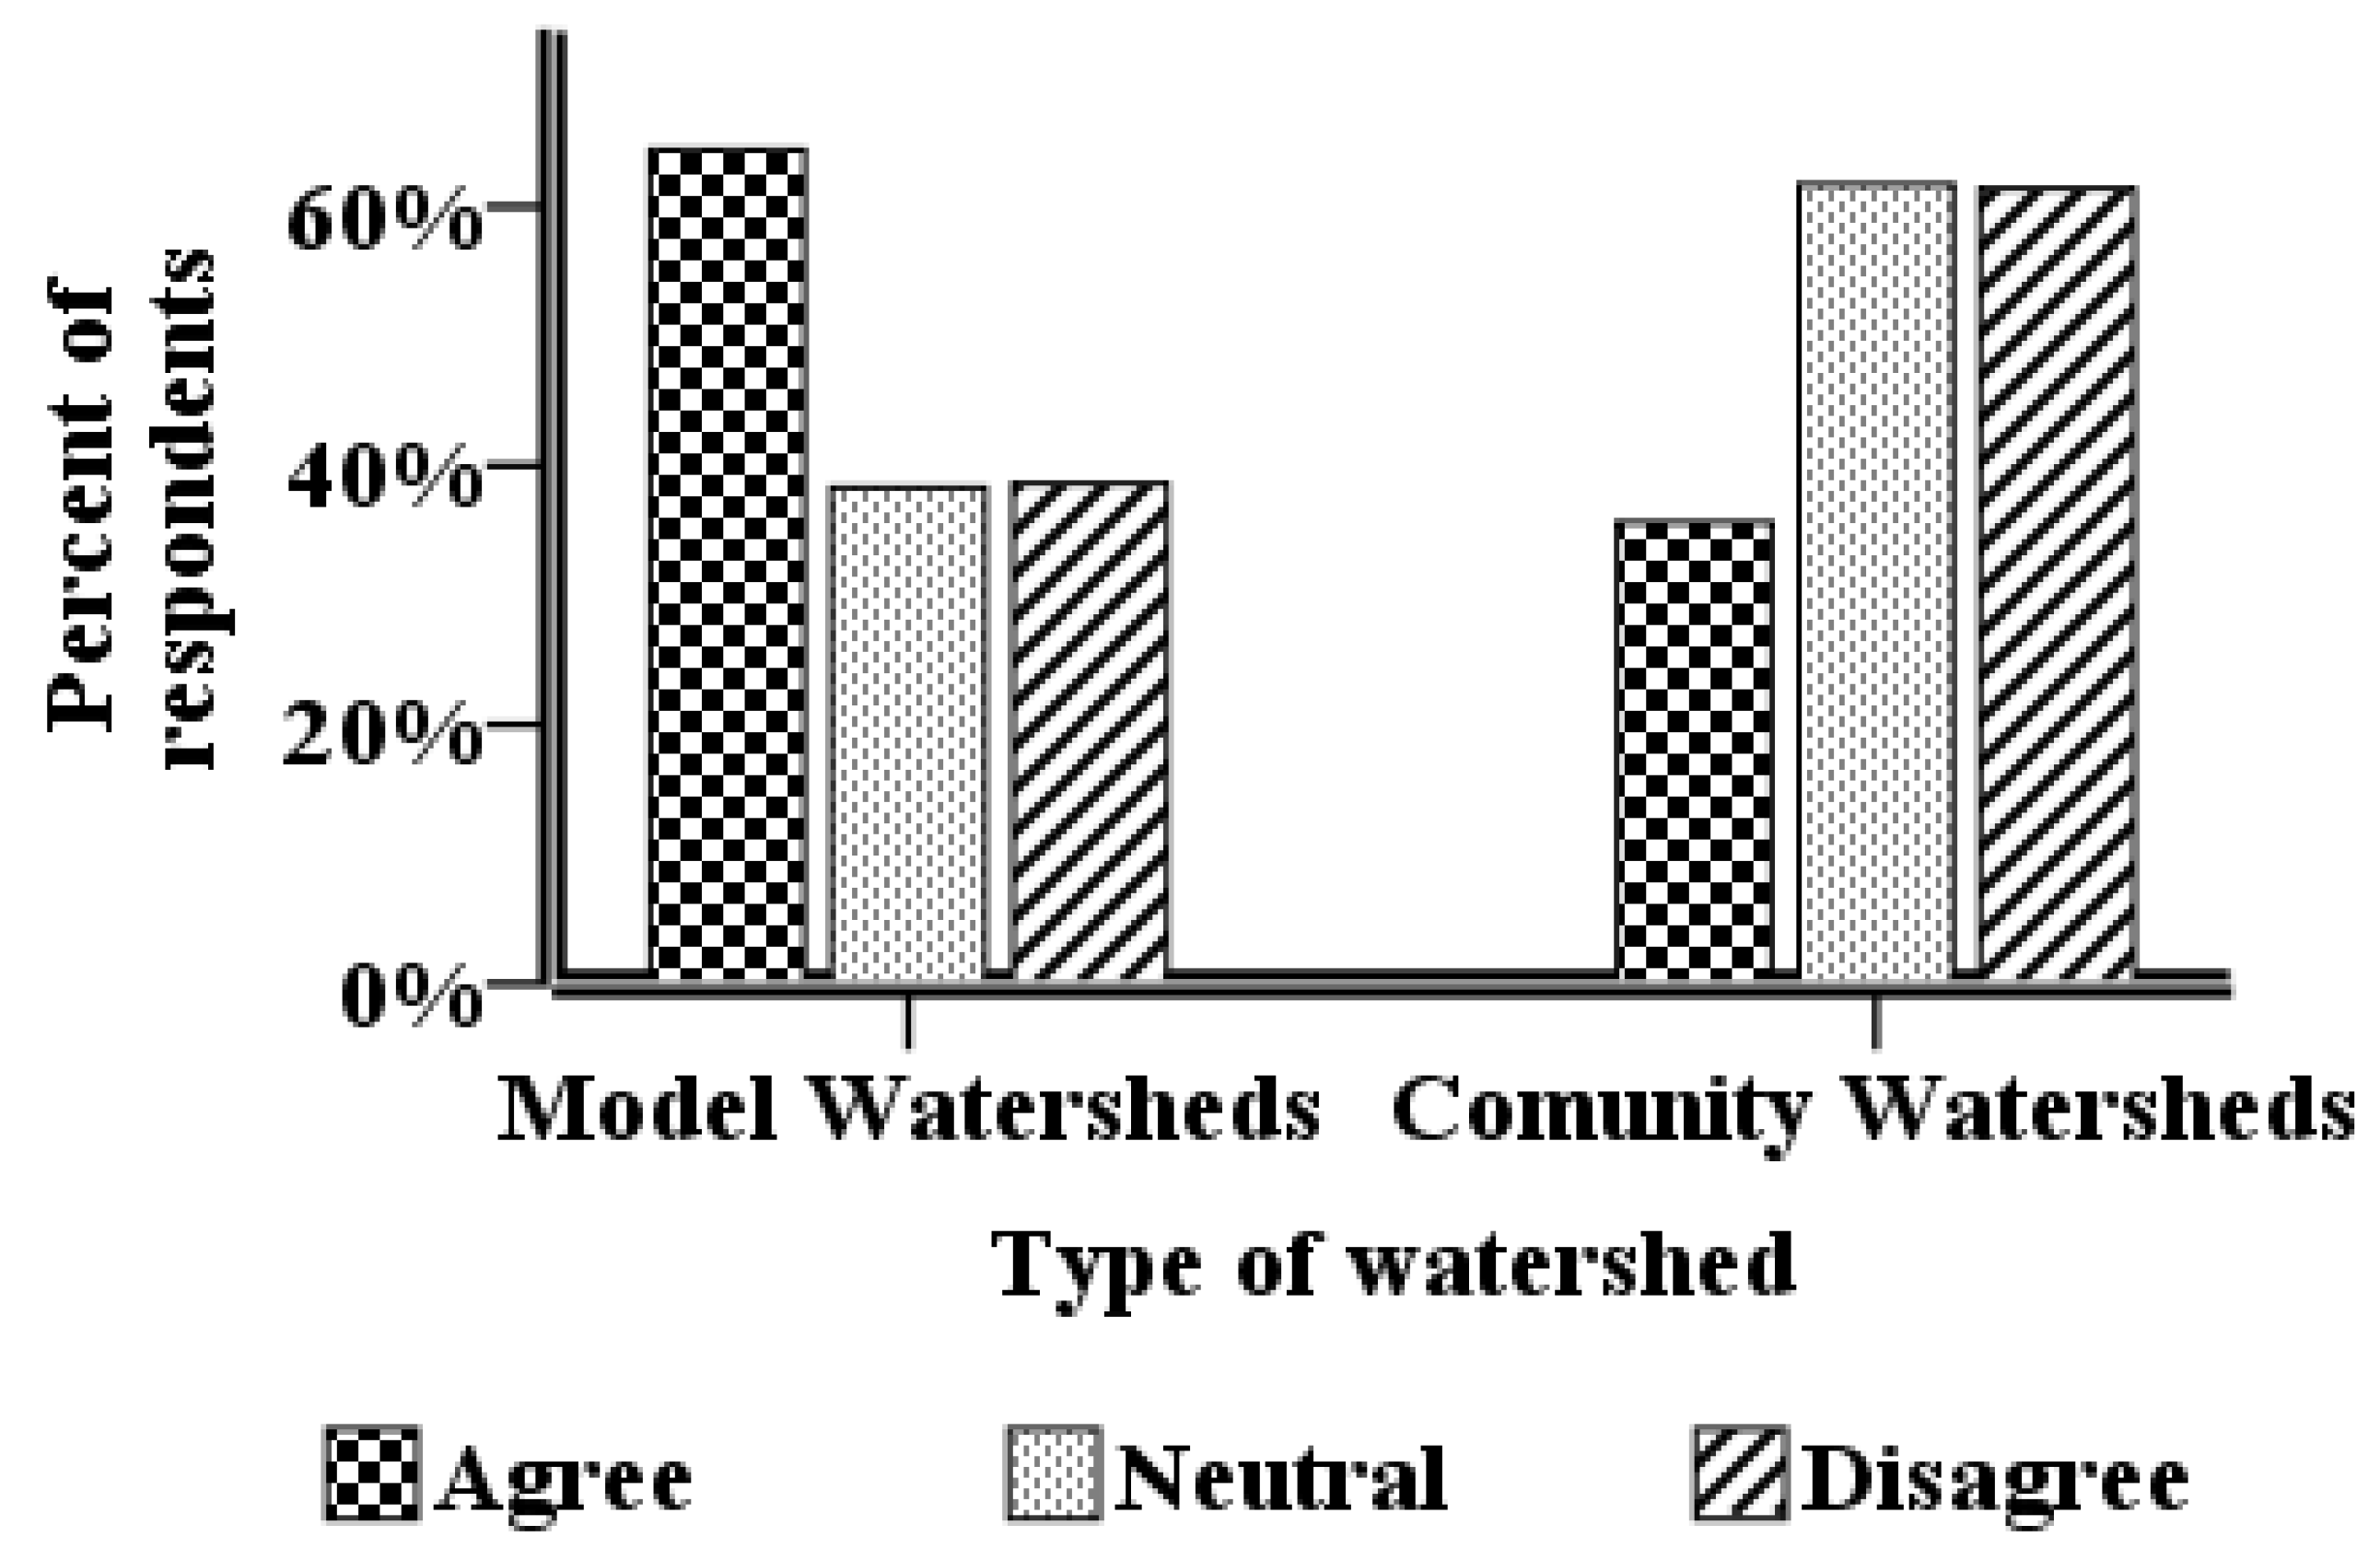
4.1.5. Compliance to the Rule
The findings revealed that significant differences were observed in all compliance variables (p < 0.05) between the two groups (
Table 6). Smaller mean rank value was observed in Model watersheds as compared to Community watersheds. This indicates the presence of strong by-laws and enforcement, members’ awareness of the rule, sufficient compliance rule. On top of this, the institution follows its rule to set the compliance in watershed managed with support of WLRC. The results of
Figure 2 also confirms that the two Model have strong by-laws that facilitate the higher performance level.
4.2. Rationalities between Model Watersheds and Community Managed Watersheds
The existence of rationalities in the two watershed groups was compared using seven indicators as shown from
Table 7,
Table 8,
Table 9 and
Table 10. The result confirmed that, WRLC supported Model watersheds have shown good rationalities with three of the variables that enabled watershed management institution to be effective. On the other hand, no significant differences were observed between financial, economic, and governmental rationalities. The results of these rationalities are described separately here below.
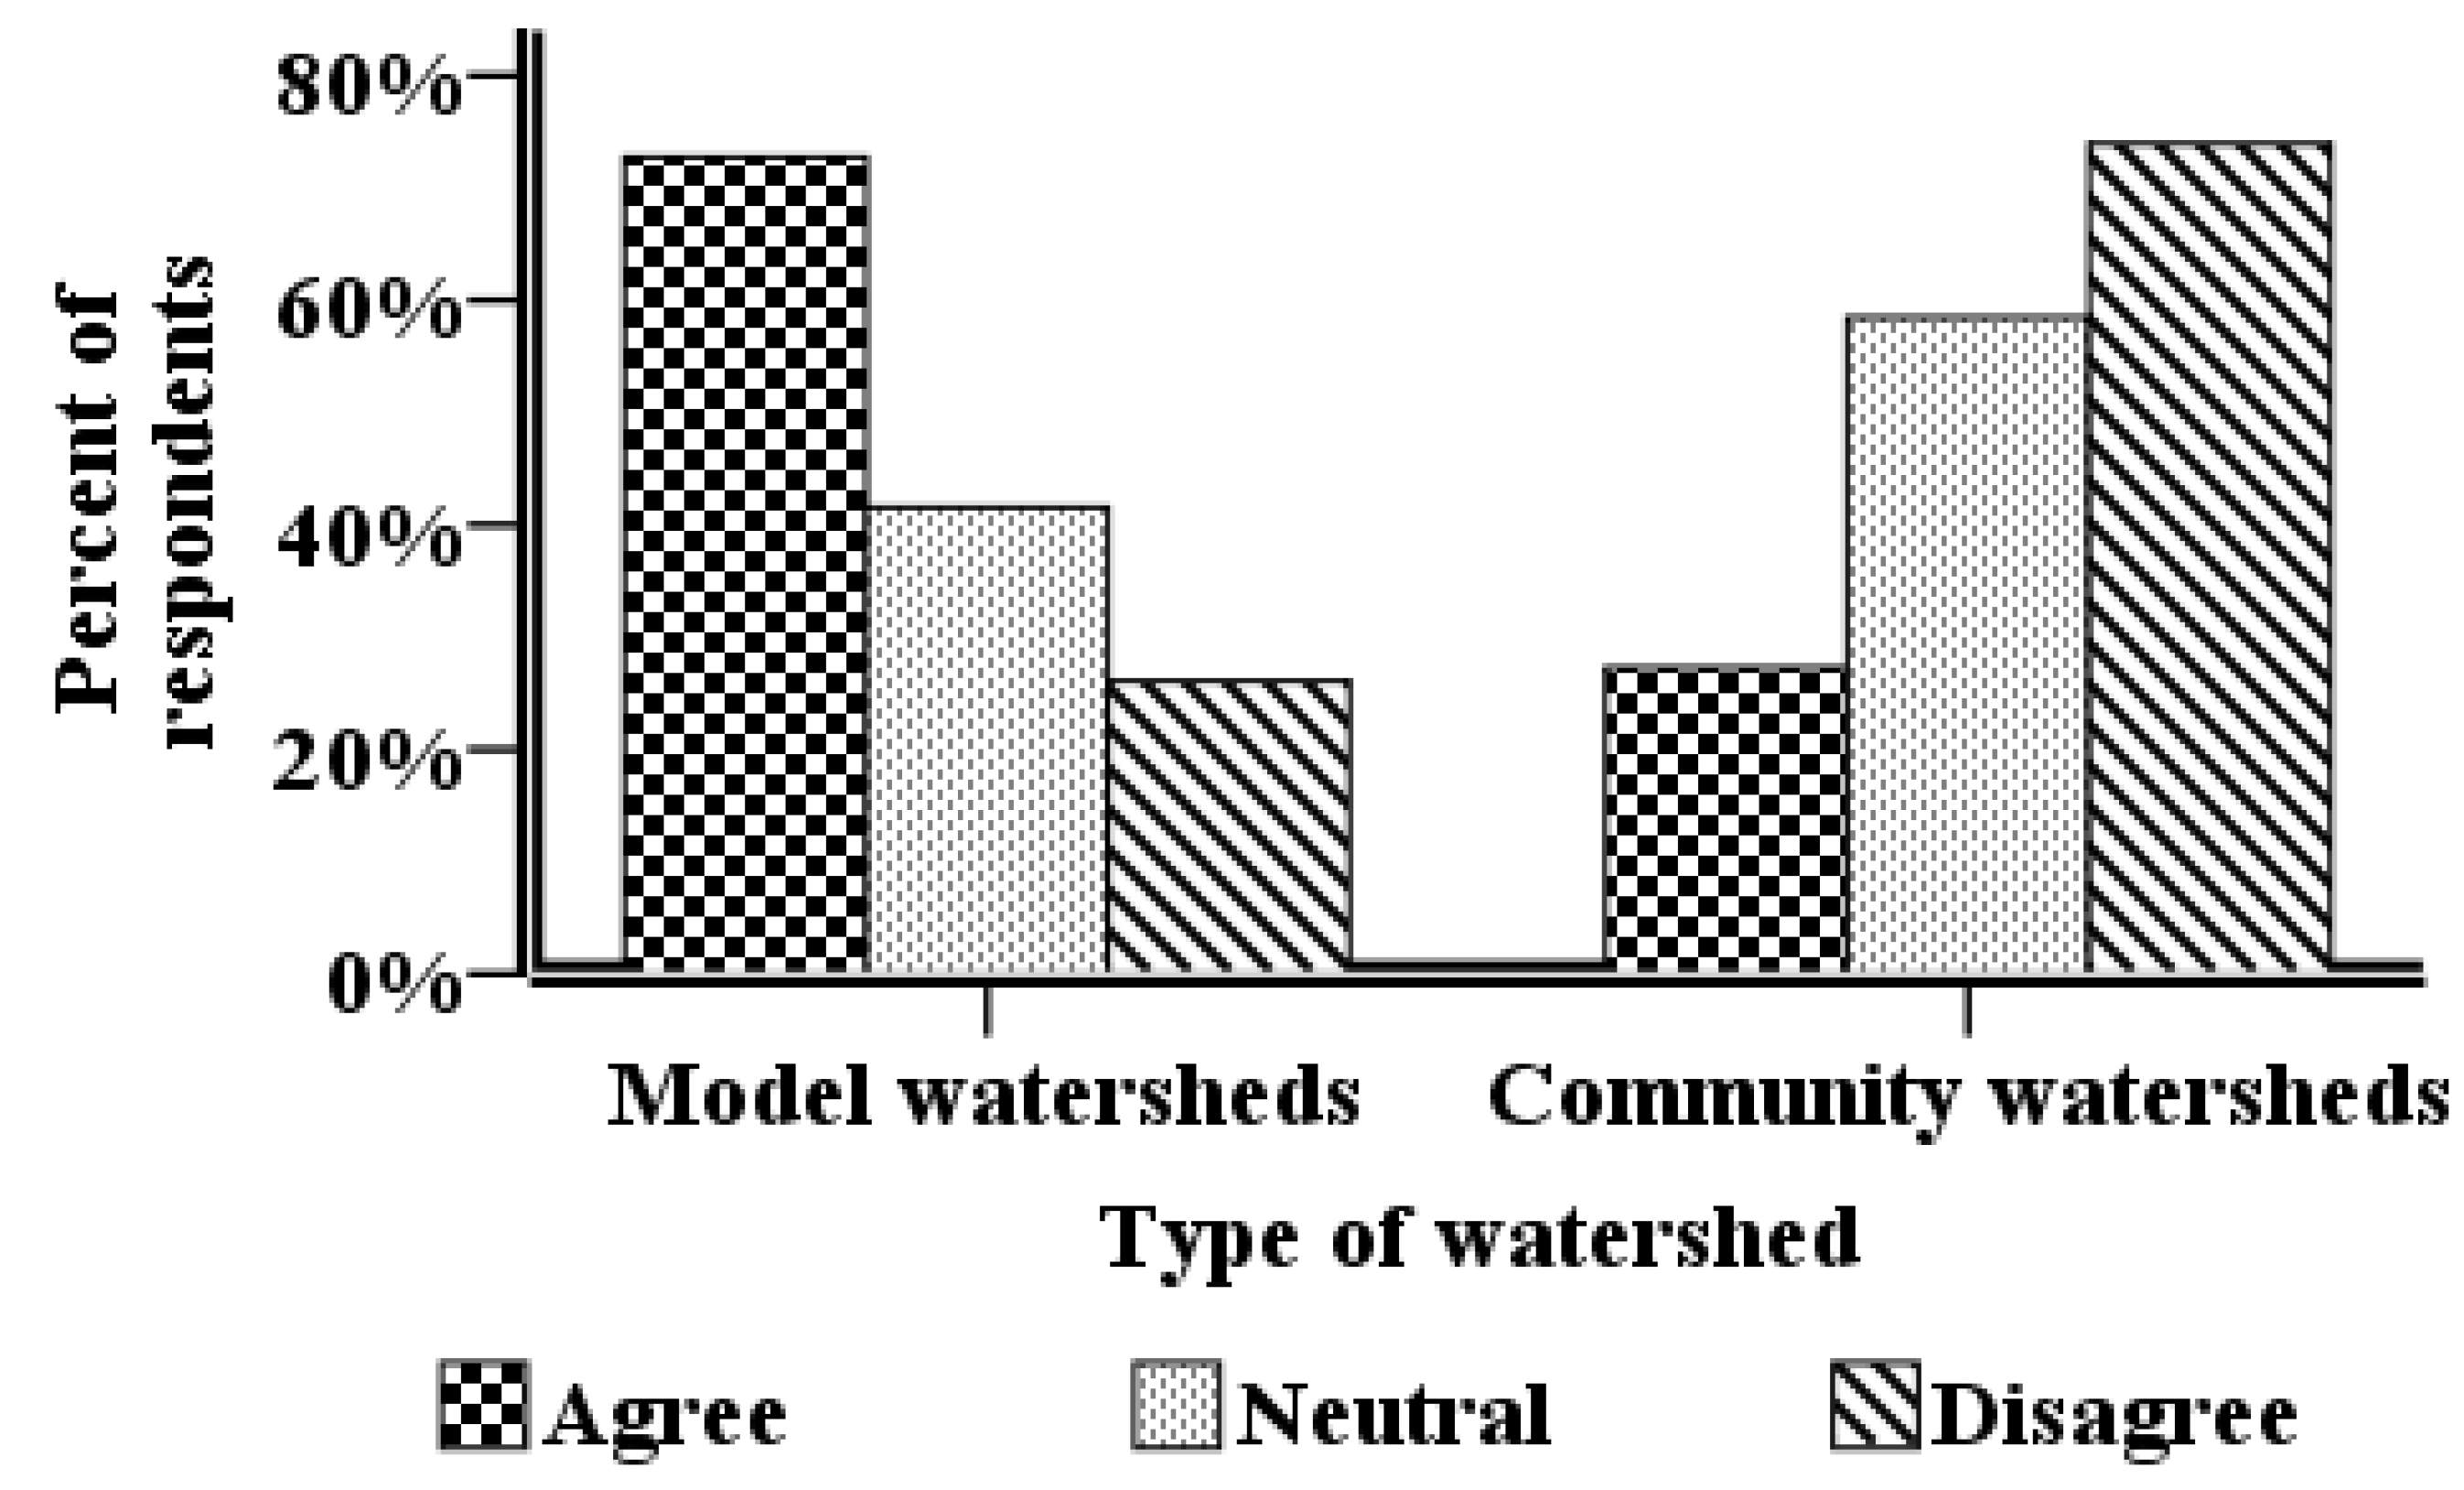
4.2.1. Technical Rationality
Based on the findings, existence of robust planning system, site specific conservation plan, maintenance of watershed structures and existence of monitoring and evaluation system were found to be significantly different between the two watershed groups (
Table 7). Lower mean rank values observed in WLRC groups explain the variability. In addition, the culture of maintenance of constructed structure and the availability of monitoring and evaluation system was described (
Figure 3 and
Figure 4).
Key informant interview and focus group discussions revealed that, in Model watersheds, there is a special mechanism for close monitoring and evaluation. On the other hand, in the Community watersheds, often monitoring is not regular and feedback system is weak. Poor institutional capacity, vaguely defined objectives, low quality of monitoring and evaluation indicators and weak evidence databases could be the possible reason for weak monitoring system in Community watershed [
36]. The marked difference in the availability of close monitoring system between the two watershed groups was depicted in
Figure 4.
4.2.2. Environmental and Social Rationality
No significant difference was observed in environmental rationality (p = 0.119) between the two watershed groups. The result reveals that both watershed groups consider the environment while they are planning the watershed management intervention. However, WLRC supported watershed institutions showed more concern showing minimum mean rank (
Table 8).
Statistically significant variations were observed between the two watershed groups, when social mobilization and involvements are concerned (
Table 8). The lowest mean rank value in the Model watersheds confirms the existence of active participation of various social groups. Besides, landless and marginal farmers are considered in the planning of watershed management and they are also involved in the decision making process of watershed management activities. This involvement of different social groups probably has enhanced the success of watershed management in these watershed management groups.
4.2.3. Financial and Economical Rationality
According to the results, the availability of sufficient fund for watershed management, effective handling of funds, and absence of dispute about the management of funds were not found to be statically different between the two watershed groups in the three indicators (
Table 9). Yet, successful development efforts at the watershed level requires sufficient financial resource. Similarly, the results indicated that, though there was a greater tendency towards it by the WLRC supported watershed institutions having lowest mean rank, the economic rationality were not significantly different between the two groups.
4.2.4. Organizational and Governmental Rationality
A statistically significant variation was observed between the two watersheds groups (
Table 10) for the creation of good local institutions, creation of active user groups, and coordination and management planning and implementation activities (with p–values 0.010, 0.000, and 0.02, respectively). In all the above-mentioned organizational rationalities, the watersheds managed by the support of WLRC have showed lowest mean rank as compared to Community watersheds, indicating better performance in the case of the former.
Lastly, statistically significant differences were observed between Model and Community watersheds in terms of involvement of village leaders in watershed management (p = 0.001). The mean rank for this indicator in the Model Aba Gerima and Debre Mewi watersheds was found to be 76, lower than the Community watersheds (101), indicating that village leaders were actively involved in WLRC supported model watersheds than in Yinesu and Koti Community watersheds. On the other hand, the results showed that there was no significant difference between the two groups in the role of higher level government officials in mobilizing villagers (U = 3567, Z = −1.1, p = 0.267), indicating that both groups had received similar support (technical and financial) from higher offices, starting from district and regional agricultural bureaus.
4.3. Discussion
When compared to Community watersheds, Model watersheds were found to perform better. We believe that the elements of intuitional characteristics and rationality have a role to play in the improved performance. The first major difference observed between the two institutional arrangements is the difference in the clarity of objectives. In the Model watersheds, this was made possible through continuous engagement of watershed communities through the experts assigned to support watershed development, whereas in Community watersheds, development still tends to be top down and prescriptive. This was clearly visible from their response on the interaction between their watershed activity and economic benefits anticipated from project. Low level of awareness on the economic benefits of sustainable watershed management practices has been identified as the primary cause of enduring watersheds in Hadush [
37] and Jembere [
38].
Moreover, the good interaction between the community members, the watershed committee, and local leadership may have also contributed for the better performance in Model watershed. On top of this, the presence of a well-informed watershed technician had made proactive intervention to varying external and internal environments more adaptive. In contrast, low adaptive capacity of institution to alter the emerging challenges on socio economic and biophysical contexts were seen in Community watershed groups [
39]. Compliance to the rules, which is another measure of the institutional performance, and the effort to enforce the agreed rules by watershed committee were better in the model watersheds. This was made possible by setting bylaws in consultation with community members (
Figure 2).
From the rationalities side, the Model watersheds were duly planned through a rigorous watershed planning in consultation with communities. On the other hand, this was not observed in the Community watersheds. This is also associated with the presence of individual and institutional capacity limitation such as insufficient technical knowledge; weak assessment abilities and limited research capacity on natural resource management in almost all Community watersheds in Ethiopia [
39]. The marked difference in capacity between extension agents working in model and Community watersheds is attributed to the limited capacity building effort to the latter. The former usually have access to some additional training and resource from WLRC, and have better exposure to methodological and technical issues. But, this does not mean that capacity problems are not an issue in WLRC supported watersheds. The causes of poor capacity, according to key informant discussants are: (i) shortage of focus in service training or often poor quality of training, (ii) staff turnover, especially at district level, and (iii) weak technical support to the district and development agents by the federal and regional offices. The result is in line with Awlachew et al. [
39], who reported that capacity limitations as crucial bottleneck for inadequate undertakings in watershed management in Ethiopia.
In Model watersheds, awareness creation was done to all land users at village level, focusing on the magnitude and extent of land degradation, depletion of natural resources and its impact on reduction of land productivity, the importance of watershed management, the community role and benefit obtained from the watershed development. Apparently, the training of farmers and providing them with opportunities for experience-sharing with others improves their capacity for participation in planning, designing and implementation of sustainable land management (SLM) technologies. In addition, in the Model watersheds, training for the surveyor farmers specifically focused on layout of soil and water conservation structures were provided. On top of this, participatory integrated watershed management, baseline survey techniques and tools, and gully controlling mechanism training were delivered for agricultural and SLM experts (Woreda and village watershed technician). This training is likely to contribute to the difference between the two watershed types.
During field observation, poor soil conservation structure maintenance was observed in watershed made through community mobilization. This may be due to the absence of institutional mechanisms to manage assets created during watershed management interventions, which leads to constructed structures to be destroyed during cultivation, open grazing by livestock interference, and lack of maintenance [
40]. On the contrary, in Model watersheds there is a good culture of maintenance of the constructed structures (
Figure 3). Besides in these watershed free grazing is restricted too.
The probable reason why there was no significant difference in the economic rationality between the two watersheds groups could be attributed to the time it takes for the benefits that comes with watershed development activities. Both sets of watershed were only about seven years old, hence too early to expect significance economic return from the interventions.
5. Summary and Analysis of the Institutional Differences
Due to the existence of the above mentioned institutional characteristics and rationalities in the watershed management institutions, extensive physical and biological conservation works were carried out in Aba Gerima and Debre Mawi watersheds through free community labor mobilization. Physical interventions included were widespread hillside terracing, check dams using stone/sand bags, stone and soil bunds. The biological intervention measures mainly focused on area closure, gully rehabilitation, hillside planting, and individual homestead plantations, stabilization of farmland soil by direct sowing on bunds of forage species, such as Sesbania, Leucenea, and pigeon pea has shown very encouraging results. Increased forage production by beneficiaries allowed households to meet livestock feed requirements.
The hillsides showed very rapid regeneration of natural vegetation, resulting in cut and carry profits for the user groups, decreased soil loss, and increased water infiltration and groundwater recharge. This led to seasonal stream flows at Aba Gerima being extended. Due to the success of the trial, the Aba Gerima and Debre Mawi community has become a show piece watershed that holds farmers’ days to educate others about integrated watershed management.
As opposed to the (community) Yinesu and Koti watersheds development works, in the model watersheds the community actively participates in problem identification, planning, technology and treatments choice, designing, community byelaws setting, implementation, monitoring, evaluations and maintenance of the interventions. All of these outcomes are the result of good institutional arrangements implemented with the support of WLRC.
On the contrary, as the Ethiopian government advocated collective action on physical soil and water conservation works in all districts of the country, Yinesu and Koti watersheds are also implementing integrated watershed management by motivating and creating awareness to farmers about Green Development Strategy. In the study area, the first round public massive SWC work was launched on January 2011 for consecutive 30 days. Still now, structures of those campaign works are prevalent on the ground. Annually the campaign starts in February, when most parts of the region is off season for agricultural activity thus farmers have less work load which enable them to willingly participate. Though it is not target oriented, the extension agents have trained on watershed management prior to the construction. All of the integrated watershed management activities are directed by village Administrator, ’watershed committee’ composed of 7 to 10 member from different groups and development agents monitored by district and regional experts.
In general, due to lack of the above-mentioned institutional characteristics and rationalities in the watershed management institutions, the intervention in Yinesu and Koti watersheds was ineffective in many aspects. Yet, it has some features in which the watershed management has satisfactory achievements, like construction of physical conservation measures. Among the major interventions terracing, stone and soil bunds, trench bunds, are constructed in dry season. The majority of introduced physical SWC structures are appropriate for the area. However, the implemented structures layout and design were not in accordance with the standards. In addition, the participation status of communities in watershed management was poor. Moreover, the regular maintenance and management of implemented SWC structures were overlooked. On top of this, integrating physical watershed practices with more productive and economically beneficial technologies to the farmer was unnoticed. Generally, the success of watershed management in Yinesu and Koti watershed is not satisfactory.
6. Conclusions
From the finding of the study, it was recognized that, apart from technical and financial aspect, good institutional arrangements and functionality are vital for the effective management of the watershed resources. The result also showed that structurally institutional arrangements for land and water in Ethiopia in generally and Tana Basin in particular, are relatively well defined. The extension, agricultural research, and education systems in the country have a relatively favorable setup, though it requires further effort to make it more responsive and efficient to address the problems that are associated with watershed management. However, the problem arises when it comes to the functionality of the arrangements.
Model watersheds have good coordination and strong commitment by the community, watershed committees, and the WLRC project coordination staff, which should be used to inform future practice. All stakeholders were responsible from problem identification to monitoring and evaluation, which is missing in Community watersheds. Furthermore, poor participation of farmers and absence of strong watershed committee were some of the factors to negatively affecting the success of watershed management practices in Community watersheds. The most innovative aspect of watershed management is, therefore, the importance given to the development of local capacity and institutions. More importantly, the lack of regular monitoring system with strong feedback and follow up mechanism at all levels was one of the major bottlenecks that hinders the success of watershed management.
Based on the new economic institutional theory point of view, it can be concluded that institutional characteristics and rationalities (indicator of successful management), such as clarity of objectives, coordination, adaptiveness, technical rationality, social rationality, and organizational rationality were observed in WLRC supported Model watershed institutions. From the Community watersheds side, apart from their lack of strong watershed committee, the rationalities and institutional characteristics such as coordination, adaptiveness, technical, social, and organizational rationalities were poor. Hence, Model watershed institutions performed much better on all performance indicators than Community watersheds. This paper therefore identifies that institutional functionality differences do indeed exist among the two watershed groups in fundamental ways. Thus, rationalities and institutional characteristics could be taken as potential factors for enhancing the effectiveness of watershed management interventions.
Moreover, this study showed how relatively small investments, with strong community involvement, technical support, close monitoring and evaluation system can generate multiple benefits for both people and nature. Therefore, emphasis must be given to the effective organization of communities rather than only focusing on technology development. To this end, there is a need to revisit the sustainable watershed development approach followed by the government. Ultimately, this will have a policy implications in that the current sustainable land management practices need to be improved to address the institutional arrangements.


