Article

Predicting the Potential Impact of Climate Change on Carbon Stock in Semi-Arid West African Savannas

by
Kangbéni Dimobe
1,2,*,
Jean Léandre N’djoré Kouakou
3,
Jérôme E. Tondoh
1,3,
Benewinde J.-B. Zoungrana
1,
Gerald Forkuor
1 and
Korotimi Ouédraogo
2
1
West African Science Service Centre for Climate Change and Adapted Land Use (WASCAL), Competence Centre, 06 BP 9507 Ouagadougou 06, Burkina Faso
2
Laboratory of Plant Biology and Ecology, University Ouaga I Pr Joseph Ki-Zerbo, UFR/SVT, 03 BP 7021 Ouagadougou 03, Burkina Faso
3
UFR des Sciences de la Nature, Université Nangui Abrogoua, 02 BP 801 Abidjan 02, Côte d’Ivoire
*
Author to whom correspondence should be addressed.
Land 2018, 7(4), 124; https://doi.org/10.3390/land7040124
Submission received: 2 September 2018 / Revised: 17 October 2018 / Accepted: 18 October 2018 / Published: 21 October 2018

Abstract

:
West African savannas are experiencing rapid land cover change that threatens biodiversity and affects ecosystem productivity through the loss of habitat and biomass, and carbon emissions into the atmosphere exacerbating climate change effects. Therefore, reducing carbon emissions from deforestation and forest degradation in these areas is critical in the efforts to combat climate change. For such restorative actions to be successful, they must be grounded on a clear knowledge of the extent to which climate change affects carbon storage in soil and biomass according to different land uses. The current study was undertaken in semi-arid savannas in Dano, southwestern Burkina Faso, with the threefold objective of: (i) identifying the main land use and land cover categories (LULCc) in a watershed; (ii) assessing the carbon stocks (biomass and soil) in the selected LULCc; and (iii) predicting the effects of climate change on the spatial distribution of the carbon stock. Dendrometric data (Diameter at Breast Height (DBH) and height) of woody species and soil samples were measured and collected, respectively, in 43 plots, each measuring 50 × 20 m. Tree biomass carbon stocks were calculated using allometric equations while soil organic carbon (SOC) stocks were measured at two depths (0–20 and 20–50 cm). To assess the impact of climate change on carbon stocks, geographical location records of carbon stocks, remote sensing spectral bands, topographic data, and bioclimatic variables were used. For projections of future climatic conditions, predictions from two climate models (MPI-ESM-MR and HadGEM2-ES) of CMIP5 were used under Representative Concentration Pathway (RCP) 8.5 and modeling was performed using random forest regression. Results showed that the most dominant LULCc are cropland (37.2%) and tree savannas (35.51%). Carbon stocks in woody biomass were higher in woodland (10.2 ± 6.4 Mg·ha−1) and gallery forests (7.75 ± 4.05 Mg·ha−1), while the lowest values were recorded in shrub savannas (0.9 ± 1.2 Mg·ha−1) and tree savannas (1.6 ± 0.6 Mg·ha−1). The highest SOC stock was recorded in gallery forests (30.2 ± 15.6 Mg·ha−1) and the lowest in the cropland (14.9 ± 5.7 Mg·ha−1). Based on modeling results, it appears clearly that climate change might have an impact on carbon stock at horizon 2070 by decreasing the storage capacity of various land units which are currently suitable. The decrease was more important under HadGEM2-ES (90.0%) and less under MPI-ESM-MR (89.4%). These findings call for smart and sustainable land use management practices in the study area to unlock the potential of these landscapes to sequestering carbon.

1. Introduction

The preponderance of degraded lands in the semi-arid savanna is largely the cause of low agricultural productivity, and therefore food insecurity and poor household livelihoods. This situation is worsened by climate change, the consequences of which are predicted to be particularly significant for West African socio-ecological landscapes [1,2].
One way of addressing climate change is to build up resilient socio-ecological landscapes by increasing the level of carbon in trees, belowground, and soils through the smart management of landscapes [3,4].
At the global level, landscape management decisions aim to increase their carbon sequestration potential [5,6] to mitigate the adverse effects of increased emissions of greenhouse gases (GHGs). For example, the Kyoto Protocol addressing climate change, with a focus on GHG sources, reservoirs and sinks, recognizes the need to control and reduce GHG emissions [7]. The protocol also calls for an emphasis on improving carbon sinks through forestry and agroforestry. Indeed, carbon sequestration under the Kyoto Protocol will not only stimulate significant changes in soil management, but will also, by increasing the organic matter content, have significant direct effects on soil properties and a positive impact on environmental or agricultural qualities and biodiversity. The benefits will simultaneously include the reduction of atmospheric CO2, increased soil fertility and productivity, and food security. This economic instrument will also make agricultural practices more sustainable and help prevent or mitigate the degradation of soil resources. To do this, the United Nations Framework Convention on Climate Change (UNFCCC) has examined the possibility of reducing these emissions through the international REDD+ initiative described as policy approaches and positive incentives on issues related to emissions reductions from deforestation and forest degradation, the role of conservation, sustainable forest management, and increased carbon stocks in forests [8].
The REDD+ mechanism aims to encourage developing countries to conserve forests through financial offsets from carbon credits [9]. However, its implementation depends on thorough monitoring, reporting, and verification (MRV) systems for estimating biomass and carbon stocks in forests [10,11,12,13], for which data are rarely available in West Africa. Moreover, there is a dearth of scenario-oriented studies that will come up with trends in carbon sequestration in the near future along with recommendations to create enabling environments to support informed policy decision- making.
So far, the most accurate method of measuring tree biomass has been destructive sampling [14,15,16,17], where trees are selected, cut, packaged, and dried to constant mass. However, the use of allometric models (non-destructive method) seems to be more respectful of nature and is an essential tool for estimating the individual biomass of trees. Allometric models can also be used on a large scale, contributing to accurate estimates of biomass and carbon stocks in terrestrial ecosystems [18,19,20].
Several studies have been conducted on the potential of soils to sequester carbon [21,22,23,24,25,26] and plant biomass [16,17,27,28,29,30,31,32] in semi-arid landscapes and their possible contribution to climate change mitigation. However, these studies only focused on the carbon stocks present either in the aboveground biomass or the soil, without integrating all these components at the same time. In addition, assessing the impact of climate change on carbon sinks and predicting carbon stocks in a changing environment will make recommendations for the sustainable management of socio-ecological landscapes. Once the alarm is sounded, politicians and key actors can consider appropriate measures to mitigate the adverse effects of climate change. The benefits of assessing the impact of climate change on carbon stocks in semi-arid West African savannas are that this will inform monitoring, reporting, and verification (MRV) for reducing deforestation and forest degradation (REDD+), and effectively assess forest management options under climate change. The present study was carried out in Dano watershed located in southwestern Burkina Faso, specifically in the Sudanian zone of West Africa. The aim of the study was to assess the potential of carbon stored in plant biomass and soil in semi-arid landscapes and to what extent climate change could affect their spatial distribution under current and future climate conditions.

2. Materials and Methods
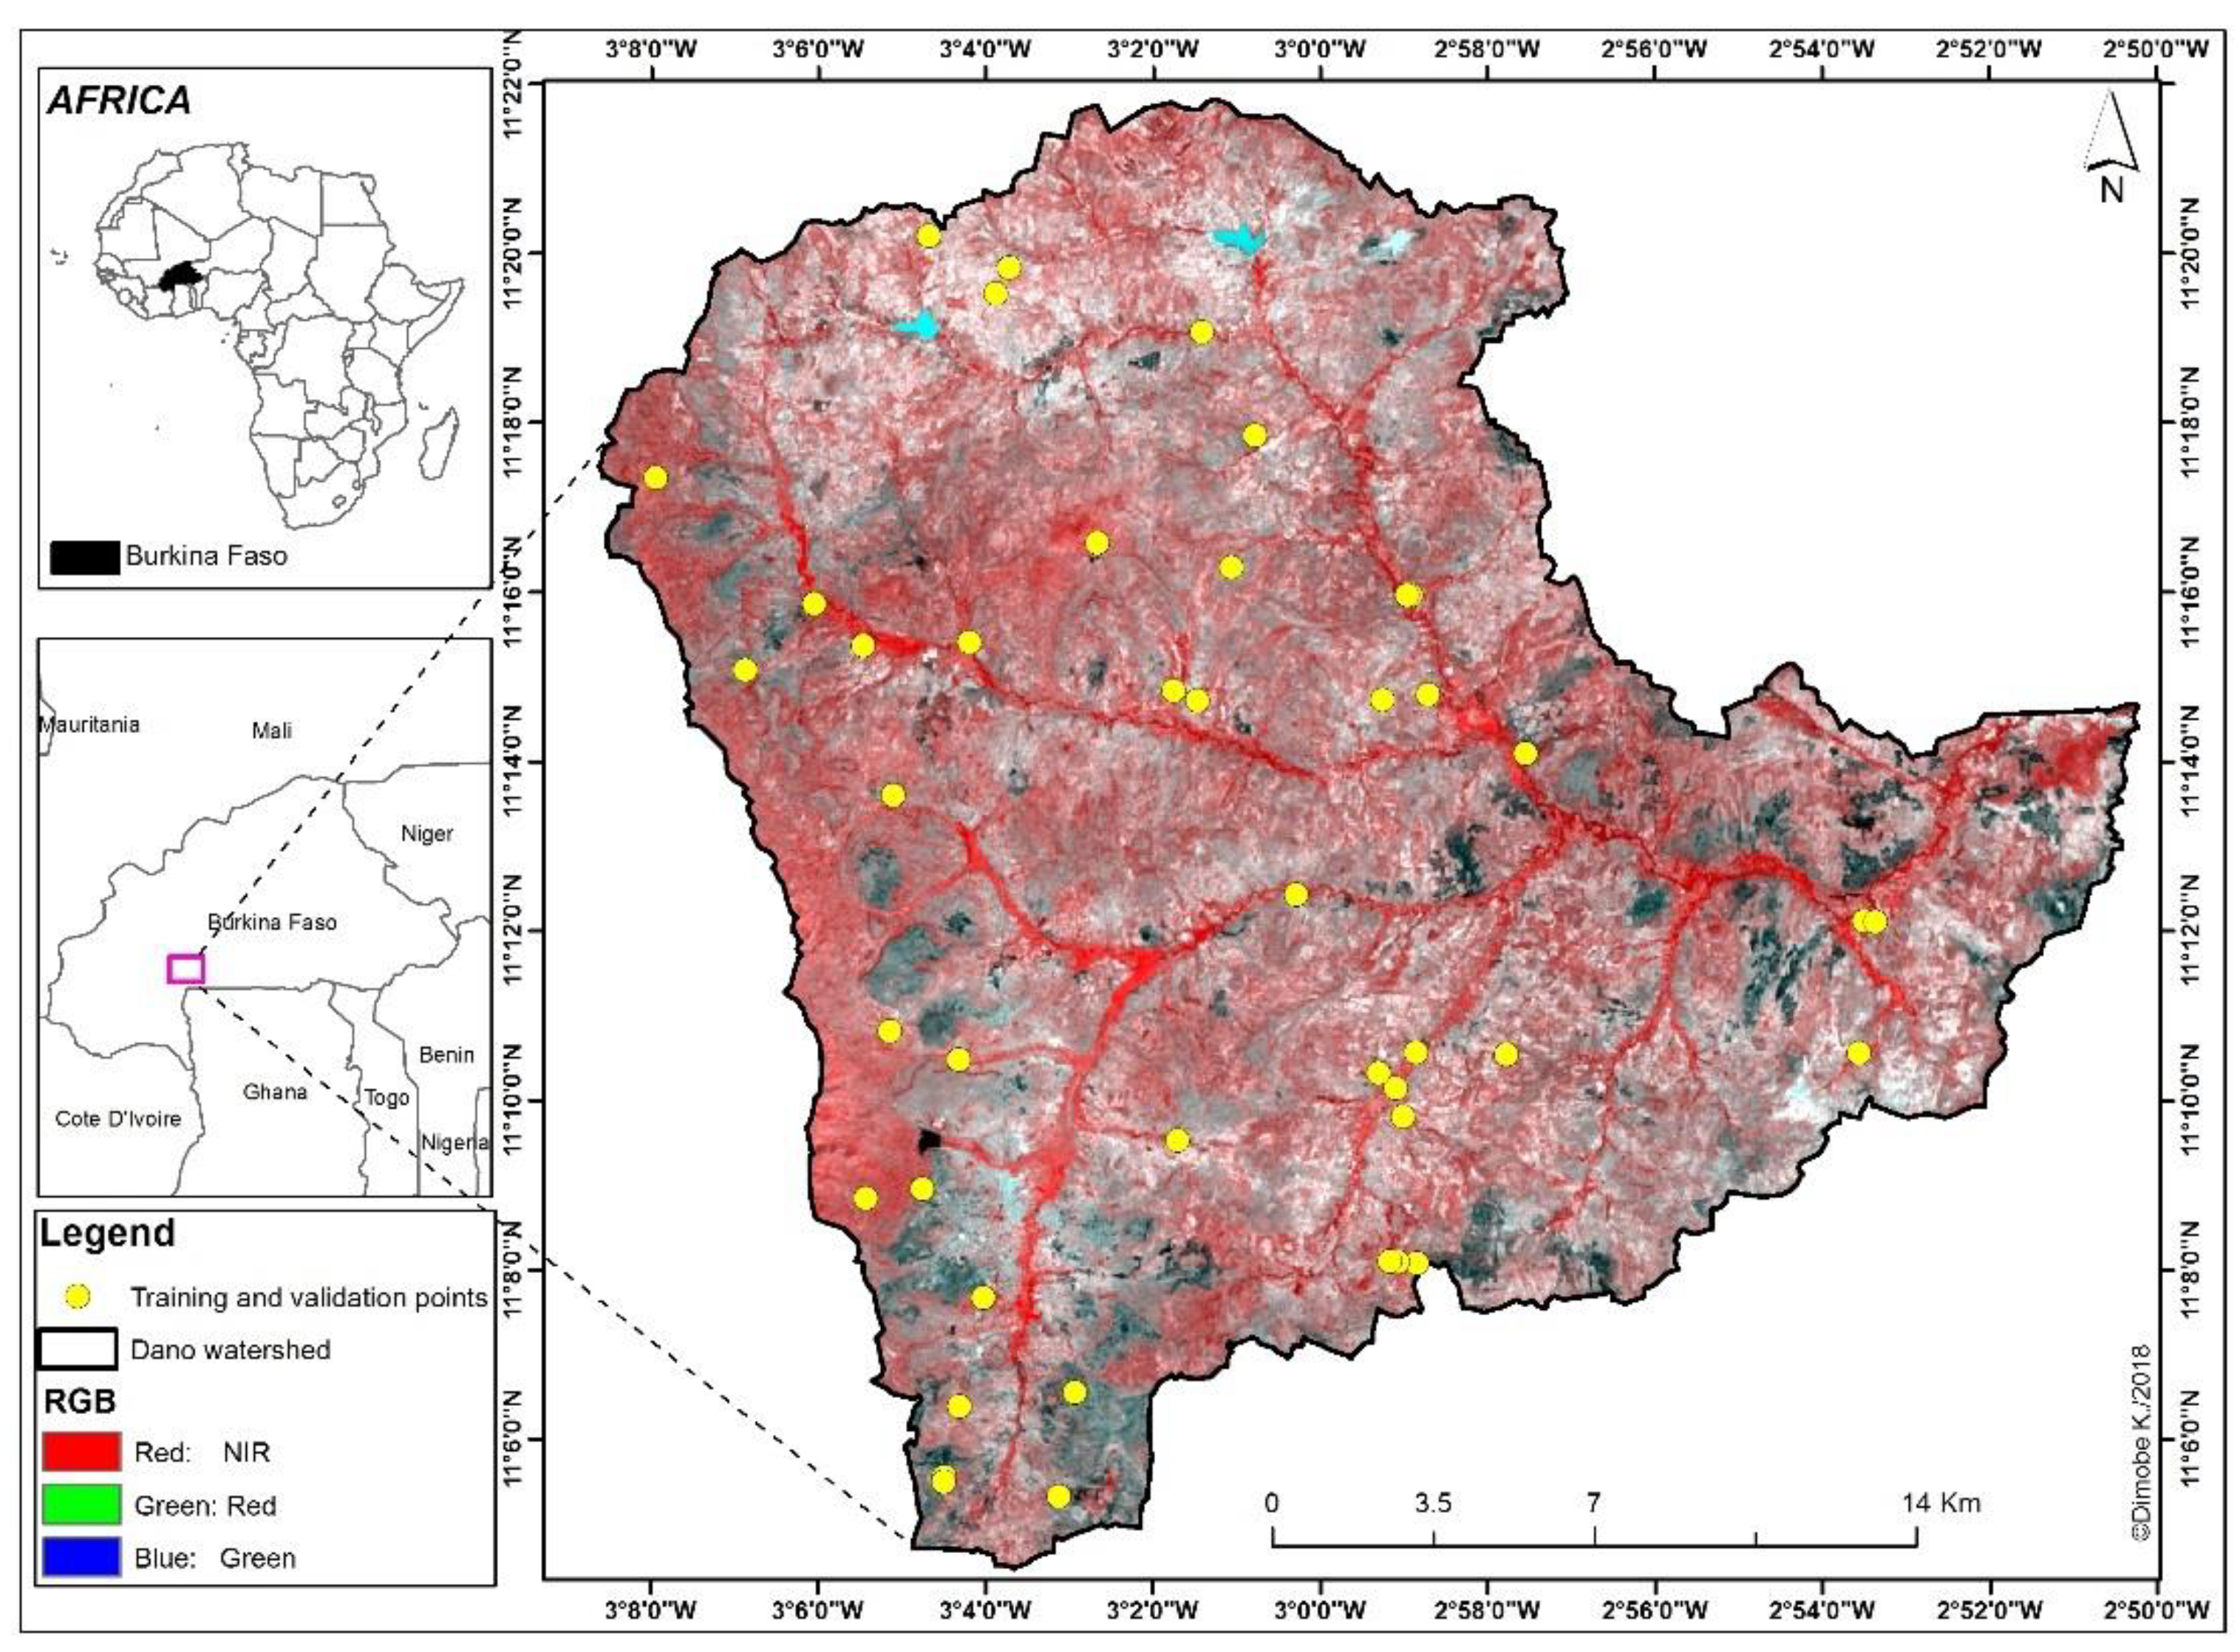
2.1. Study Area

The study was conducted in the Dano watershed area, which is located in the Sudanian Savanna belt, described as having the potential to become the breadbasket of Africa. It was selected by WASCAL (West African Science Service Centre on Climate Change and Adapted Land Use) as a focal investigation area where meteorological, hydrological, agricultural, biological, and socio-economic research is concentrated. For its research program, WASCAL has adopted this watershed as a core research station to investigate the resilience of ecological and socio-economic systems in the face of climate change and land use change to ensure the flows of key ecosystem services. Hydrologically, the watershed falls within the Volta River Basin, which drains 43% of the total land area of Burkina Faso [33]. Geographically, the Dano watershed is located in the south-west of Burkina Faso, specifically (Figure 1). It lies between the latitudes of 11°21′50“and 11°04′27” N and the longitudes of 3°08′37“and 2°50′15” W (Figure 1) and its area is about 580 km2 [17]. The climate is tropical with a unimodal rainy season, lasting for about 6 months from May to October during which major agricultural activities are undertaken. Rainfall reaches its peak in July or August, depending on the onset of the rains. The mean annual rainfall for a 30-year period (1983–2013) is 879.2 ± 149.4 mm [17]. The rainy season is followed by a long dry season between November and April, during which agricultural activities cease [34]. The temperature ranges from 16 to 32 °C in December–January and 26–40 °C in March–April [17]. The Dano watershed is located in the southern Sudanian agro-ecological zone of Burkina Faso across a flat area with an average altitude of 300 m [17]. The widespread vegetation types in the study area are tree and shrub savannas with a grass layer dominated by annual grasses such as Andropogon pseudapricus Stapf. and Loudetia togoensis (Pilger) C.E. Hubbard, as well as perennials such as Andropogon gayanus Kunth. and Andropogon ascinodis C.B.Cl. The main woody species encountered in the study area are Faidherbia albida (Delile) A.Chev., Lannea microcarpa Engl. & K. Krause, Parkia biglobosa (Jacq.) R.Br. ex Benth., Tamarindus indica L., Vitellaria paradoxa C.F.Gaertn, Anogeisus leiocarpa (DC.) Guill. & Perr., Diospyros mespiliformis Hochst. Ex A.DC., and Pterocarpus erinaceus Poir (Dimobe, 2017). The most frequently encountered soils are Lixisols. Agriculture (crop farming and livestock rearing) is the main source of livelihood for the rural population living in the study watersheds [35,36].

2.2. Sampling Design and Data Collection

2.2.1. Satellite Imagery and Data Pre-Processing

To identify the main land use and land cover categories (LULCc) in the study area, a set of multitemporal sentinel-2 (S-2) images (June, September, October, November, and December), acquired in 2017, were obtained at no cost from the European Space Agency (ESA)’s Sentinels data hub (https://scihub.copernicus.eu/dhus/#/home), and analyzed in this study. The S-2 scenes all fall in the tile 30 PWT. These images were selected based on their availability and cloud cover. All S-2 images downloaded were cloud-free over the study area. They were already geometrically adjusted and projected to UTM WGS 84 zone 30. In importing the S-2 images, the spatial resolution of the red-edge and shortwave infrared (SWIR) bands was resampled to 10 m using the nearest neighbor method to ensure integration with the 10-m visible and near infrared (NIR) bands.
Reference data for the classification were collected in July 2017 during the field campaign. A handheld Global Positioning System (GPS) device was used to map representative plots of these classes, keeping the minimum mapping area at 30 m × 30 m. In total, reference data for seven LULC classes were generated for subsequent analysis. These were: (1) woodland; (2) tree savanna; (3) shrub savanna; (4) grass savanna; (5) settlement; (6) water body; and (7) bare soil.

2.2.2. Vegetation Data

Dendrometric data (DBH and tree height) were collected in 61 plots for all woody species with DBH ≥ 5 cm. The 61 plots were distributed proportionally to the area of each vegetation type and this resulted in 20, 15, 12, 8, and 6 plots established in cropland, tree savanna, shrub savanna, woodland, and gallery forest. The size of the plot varied according to the type of vegetation. In the savannas and woodlands, the size was 1000 m2 (50 × 20 m) [37], while in the gallery forest and cropland, it was 500 m2 (50 m × 10 m) [38] and 2500 m2 [39], respectively. For trees forking below 1.3 m, the diameter of all ramifications was measured and the quadratic mean diameter (root-mean-squared) was calculated as:
D = i = 1 n d b h i 2
where D is the quadratic mean diameter, and dbhi are the diameters of various measured stems.
The heights of the trees were estimated using a pole or a clinometer. The identification of the species and family names of plants follows Thiombiano et al. [40].
The data collected were used to compute the biomass and carbon stored in woody species.

2.2.3. Soil Sampling, Processing, and Carbon Stock Calculation

Soil samples were collected at the same sampling plots where vegetation data were collected using an auger at four points to account for its heterogeneity. Two sampling depths, namely 0–20 cm (topsoil) and 20–50 cm (subsoil), were considered. Soil samples from the same layer were thereafter pooled, and thoroughly mixed to form a composite soil sample ready for soil organic carbon concentration determination at BUNASOL (National Soil Analysis Centre) in Ouagadougou. To measure the soil bulk density, the cumulative mass approach consisting in using a metal sampling plate and an auger was used to collect the soil sample at the center of each plot and at the same depths, that is 0–20 cm and 20–50 cm [41]. The fresh weight of the soil sample collected was determined in the field and the sample brought to the lab for dry weight assessment after drying at 105 °C for 48 h.
The proportion of fine soil was determined by drying, grinding, reducing to powder, and sieving with 2 mm mesh size, and soil samples were taken at the depth of 0–20 and 20–50 cm in each plot. The proportion of fine soil was then determined as the weight of the soil passing through the 2 mm mesh. For a given soil depth (0–20 cm or 20–50 cm), the soil organic carbon stock was calculated using the following formula [41]:
SOCstock = C 100 D a P ( 1 F r a g ) 100 ,
where
  • SOCstock: soil organic carbon (Mg C ha−1);
  • C: carbon concentration in the finer fraction;
  • Da: soil bulk density (Mg·cm−3);
  • P: thickness of soil layer (cm);
  • Frag: % of volume of coarse fragments/100; 100 will be used to convert the unit to Mg C ha−1.

2.2.4. Above and Belowground Biomass and Carbon Stock

Since allometric equations are not available for most of the species, aboveground biomass (AGB) was estimated using the generalized allometric model equation 4 of Chave et al. [42]:
A G B d r y = 0.0673 ( W D d b h 2 H ) 0.976
where H = height (m), dbh = diameter at breast height, WD = wood density (g cm−3)
The getWoodDensity function from the BIOMASS package in R software was used to assign a wood density value to each taxon using the global wood density database as a reference [43]. By default, getWoodDensity assigns to each taxon a species-or genus-level average if at least one wood density value in the same genus as the focal taxon is available in the reference database [44].
Belowground biomass (BGB) was assessed using the suggested RS-ratios, which is 0.25 for trees [45]. The predicted AGB and BGB were further upscaled from the tree level to the plot level.
The aboveground carbon (AGC) and belowground carbon (BGC) stocks were determined by applying the default Intergovernmental Panel on Climate Change (IPCC) carbon fraction value of 0.47 [46]. The total amount of carbon stored in the plant biomass was calculated as the sum of AGC and BGC.
The total amount of carbon in a plot was calculated as the sum of carbon stored in the soil profile plus the total biomass carbon.

2.2.5. Geographical Distribution of Carbon Stock under Changing Climate

Four types of data were used: (i) Geographical location records of total carbon stock (biomass + soil); (ii) satellite spectral data (S-2 spectral bands, nine soil and vegetation indices); (iii) terrain attributes; and (iv) bioclimatic variables (Table 1). The spectral data (Table 1) were obtained from sentinel-2 data. The terrain attributes (Table 2) were derived from SRTM (Shuttle Radar Topography Mission) DEM with 30 m resolution ASTER GDEM, http://asterweb.jpl.nasa.gov/GDEM.ASP. For the bioclimatic variables (mean annual precipitation (bio12) and temperature (Bio1)), current (1950–2000) climate data and future climate projections (2070) were obtained from WorldClim, version 1.4 (www.worldclim.org). The bioclimatic layers were interpolated from weather stations on a 30 s grid. For projections of future climatic conditions, predictions from two models of the Coupled Model Inter-comparison Project phase 5 (CMIP5) were used: the Met Office climate model (HadGEM2-ES), and the Max-Planck Institute Earth System Model for medium resolution version (MPI-ESM-MR) [47,48]. The projections were run under one of the four scenarios developed by the Intergovernmental Panel on Climate Change (IPCC) in its Fifth Assessment Report (AR5): the mid-21st century RCP 8.5. To ensure integration with the S-2 data, the bioclimatic variables and the terrain attributes were resampled to 10 m resolution using the bilinear interpolation methods [49] and projected to UTM WGS 84 zone 30. In addition to the original spectral bands, nine soil and vegetation indices were computed for each image.

2.2.6. Statistical Analyses

Random Forest (RF) [50] was used to classify the S-2 images. This algorithm was selected because of its high performance, as reported by several studies [49,51,52]. The RF belongs to the family of ensemble learning techniques that predicts a response (in this case the carbon stock) from a set of predictors (matrix of training data) by creating multiple decision trees (DTs) and aggregating their results [49]. Each tree in the forest is independently constructed using a unique bootstrap sample (random sampling with replacement) of the training data. Whereas other machine learning algorithms use the best split among all predictors for node splitting, RF chooses the best split from a randomly selected subset of predictors. Additionally, RF requires no assumption of the probability distribution of the target predictors as with linear regression, and is robust against nonlinearity and overfitting, although overfitting may occur in instances where noisy data are being modeled. The caret package was chosen to implement the classification algorithm due to its ability to streamline the model building and evaluation process of a multitude of algorithms [26]. The package reduces the complexity associated with model tuning by first iterating over a range of values of model parameters and then selecting the parameter combination that gives the best performance for building a final model. For RF modeling, parameters requiring tuning such as the number of trees to grow in the forest (ntree) and the number of randomly selected predictor variables at each node (mtry) were set using the grid search method implemented in the Classification and Regression Training (Caret) package using 10-fold cross-validation with 5 repetitions [49]. In implementing the classification algorithm, reference samples were derived by overlaying the reference data on the image data and extracting the underlying values. For each LULCc, a condition was set to extract a maximum of 500 samples points for all possible samples falling within polygons of that class.
Statistical analyses were done using the R statistical software package, version 3.3.2 [53]. Statistical assumptions were explored visually as proposed by Zuur and colleagues [54]. We first checked for normality among the different variables using the Shapiro–Wilk normality test. As data were not normally distributed (Shapiro–Wilk test, p < 0.05), the Wilcoxon Rank Sum test was used for probing the statistical differences between two variables and the Kruskal-Wallis Rank Sum test was used for more than two variables. The “computeAGB” function from the BIOMASS package was used to calculate the AGB. Statistical analyses were performed at a significance level of 0.05. A one-way analysis of variance was used to determine if there was a significant difference in LULCc with respect to species richness, DBH, tree height, basal area, and carbon stock.
RF regression [49,50] was also used to build a predictive model using the total carbon stock (biomass + soil) as dependent/response variables and the spectral and terrain/climatic variables as independent variables. Feature selection was carried out using the RF recursive feature elimination algorithm of the R “caret” package [26]. The following variables were finally retained for the carbon stock prediction: temperature, aspect, topographic wetness index, precipitation, elevation, red (spectral band), EVI, near infrared (spectral band), hue index, green (spectral band), NDVI, blue (spectral band), brightness index, redness index, and SAVI. The measure of the variable importance based on the mean decrease in the prediction accuracy before and after random shuffling of the predictors gives insight into the influence that each of the explanatory variables has on the response variable. The latter was considered for identifying the most important factors affecting the carbon stocks. The RF regression analysis was carried out using the R “caret” package using 10-fold cross-validation with five repetitions.
The carbon data were split, with 75% of the samples used to train the model while 25% were used as an independent validation test. For each model (current and future), the accuracy of the prediction was assessed using the respective 25% testing data. Differences between observed and predicted carbon stocks were calculated with the mean absolute error (MAE) and the root-mean-squared error (RMSE). Additionally, the coefficient of determination (R2) for the present and future models was noted for the validation set.

3. Results

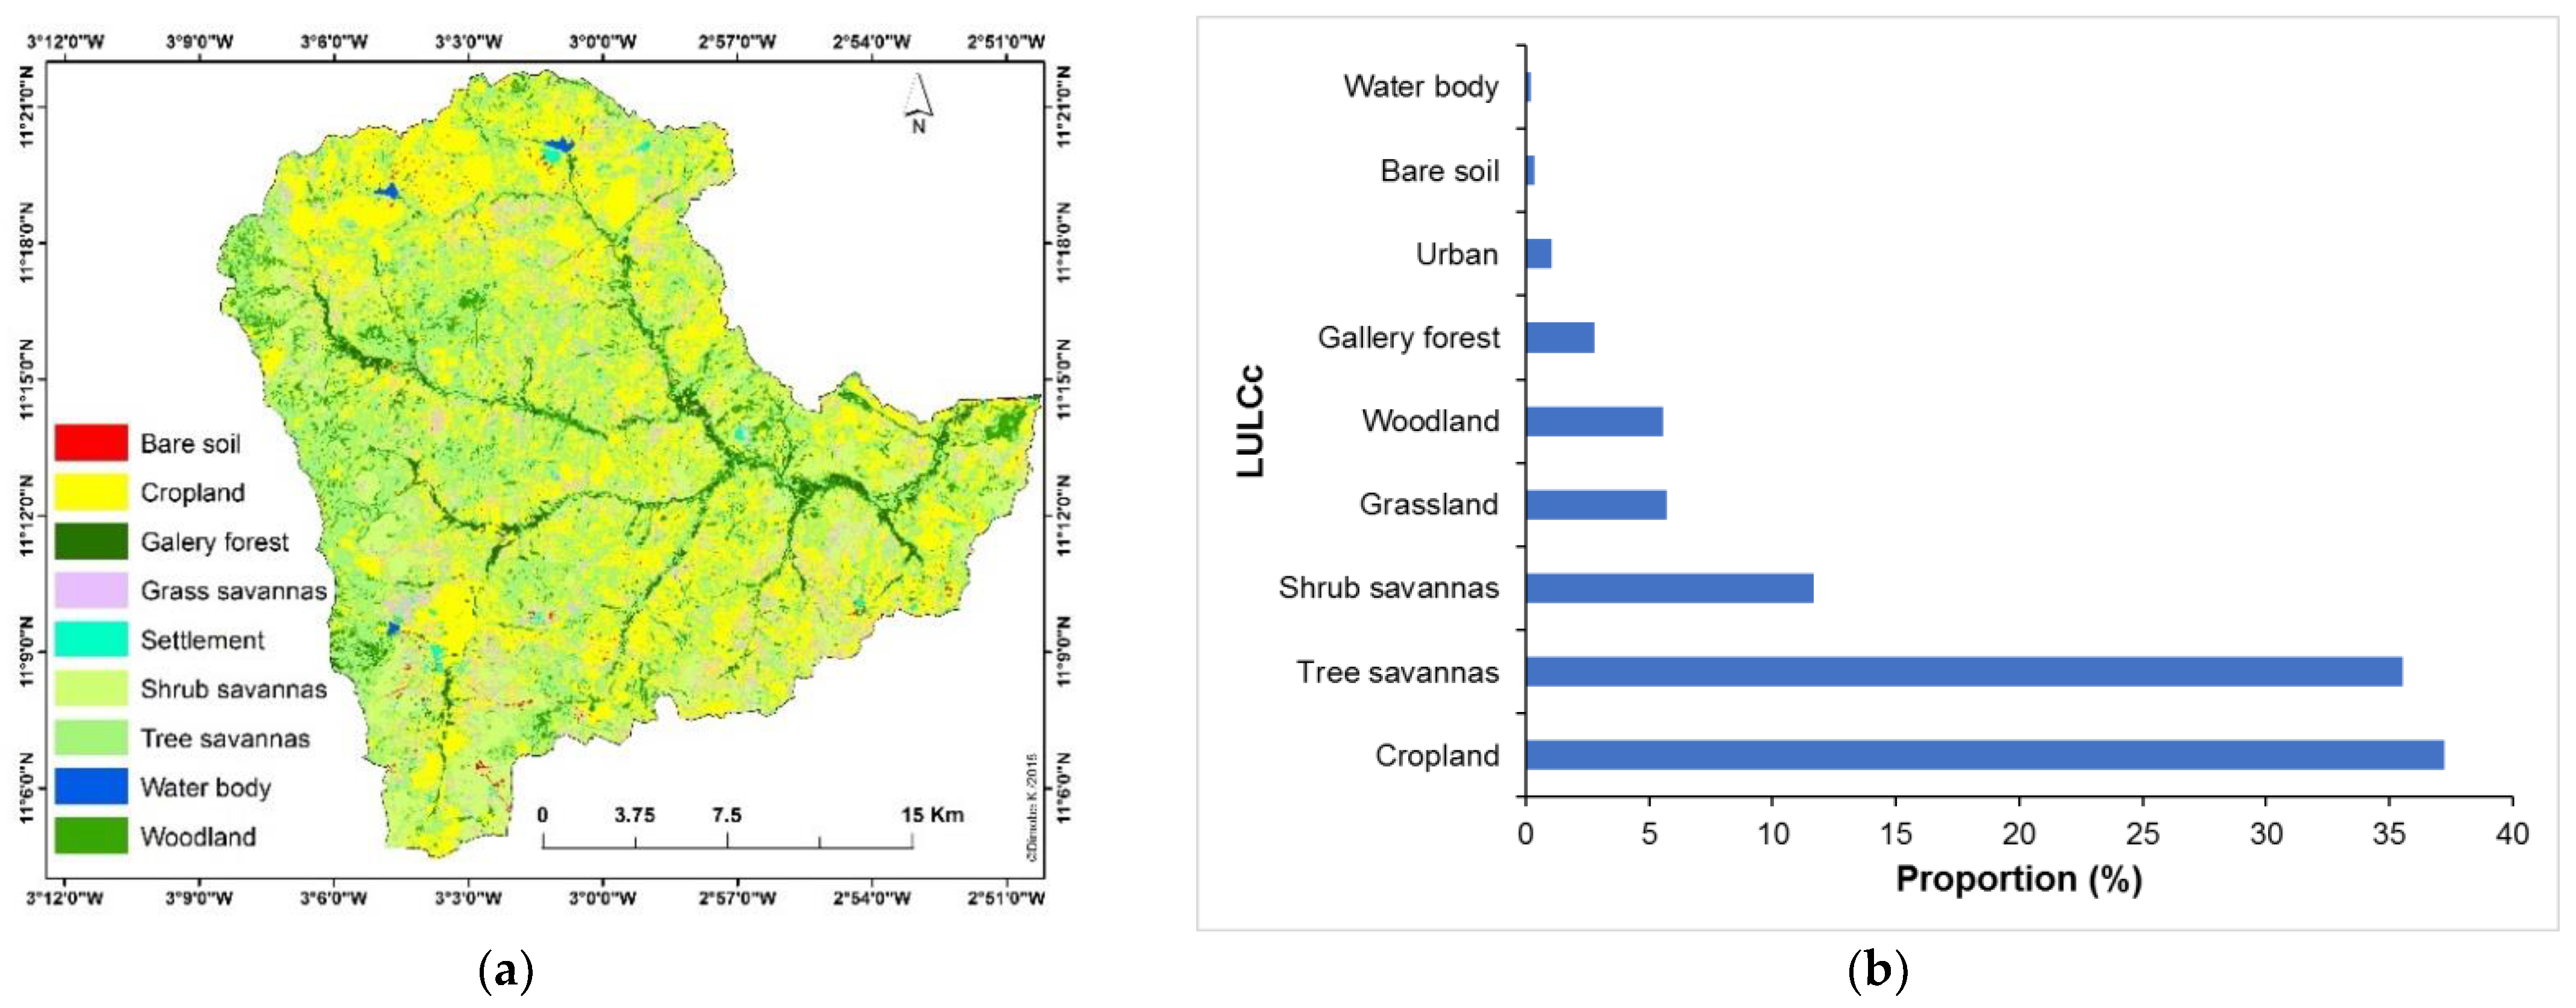
3.1. Main Land Use and Land Cover Categories

The classification yielded 94.29% as overall accuracy and 92.95% as kappa index values for the LULCc map of 2017. The LULCc map was produced for the year 2017 (Figure 2a) and the individual class area was computed. We presented the accuracy assessment results using confusion matrix in Table 3, which shows the level of agreement between classified and reference points. Based on the area of each LULCc (Figure 2b), the main LULCc selected for the study were the cropland (37%), tree savannas (35%), shrub savannas (12%), woodland (6%), gallery forests (3%), and grass savannas (6%), despite their relative dominance compared to gallery forests, which were not taken into account due to the absence of woody species. Although in the Sudanian zone grass savanna can be an important component of the aboveground biomass, reaching a maximum standing crop of around 4–6 Mg C ha−1 [55,56], it is a dynamic and seasonal biomass.

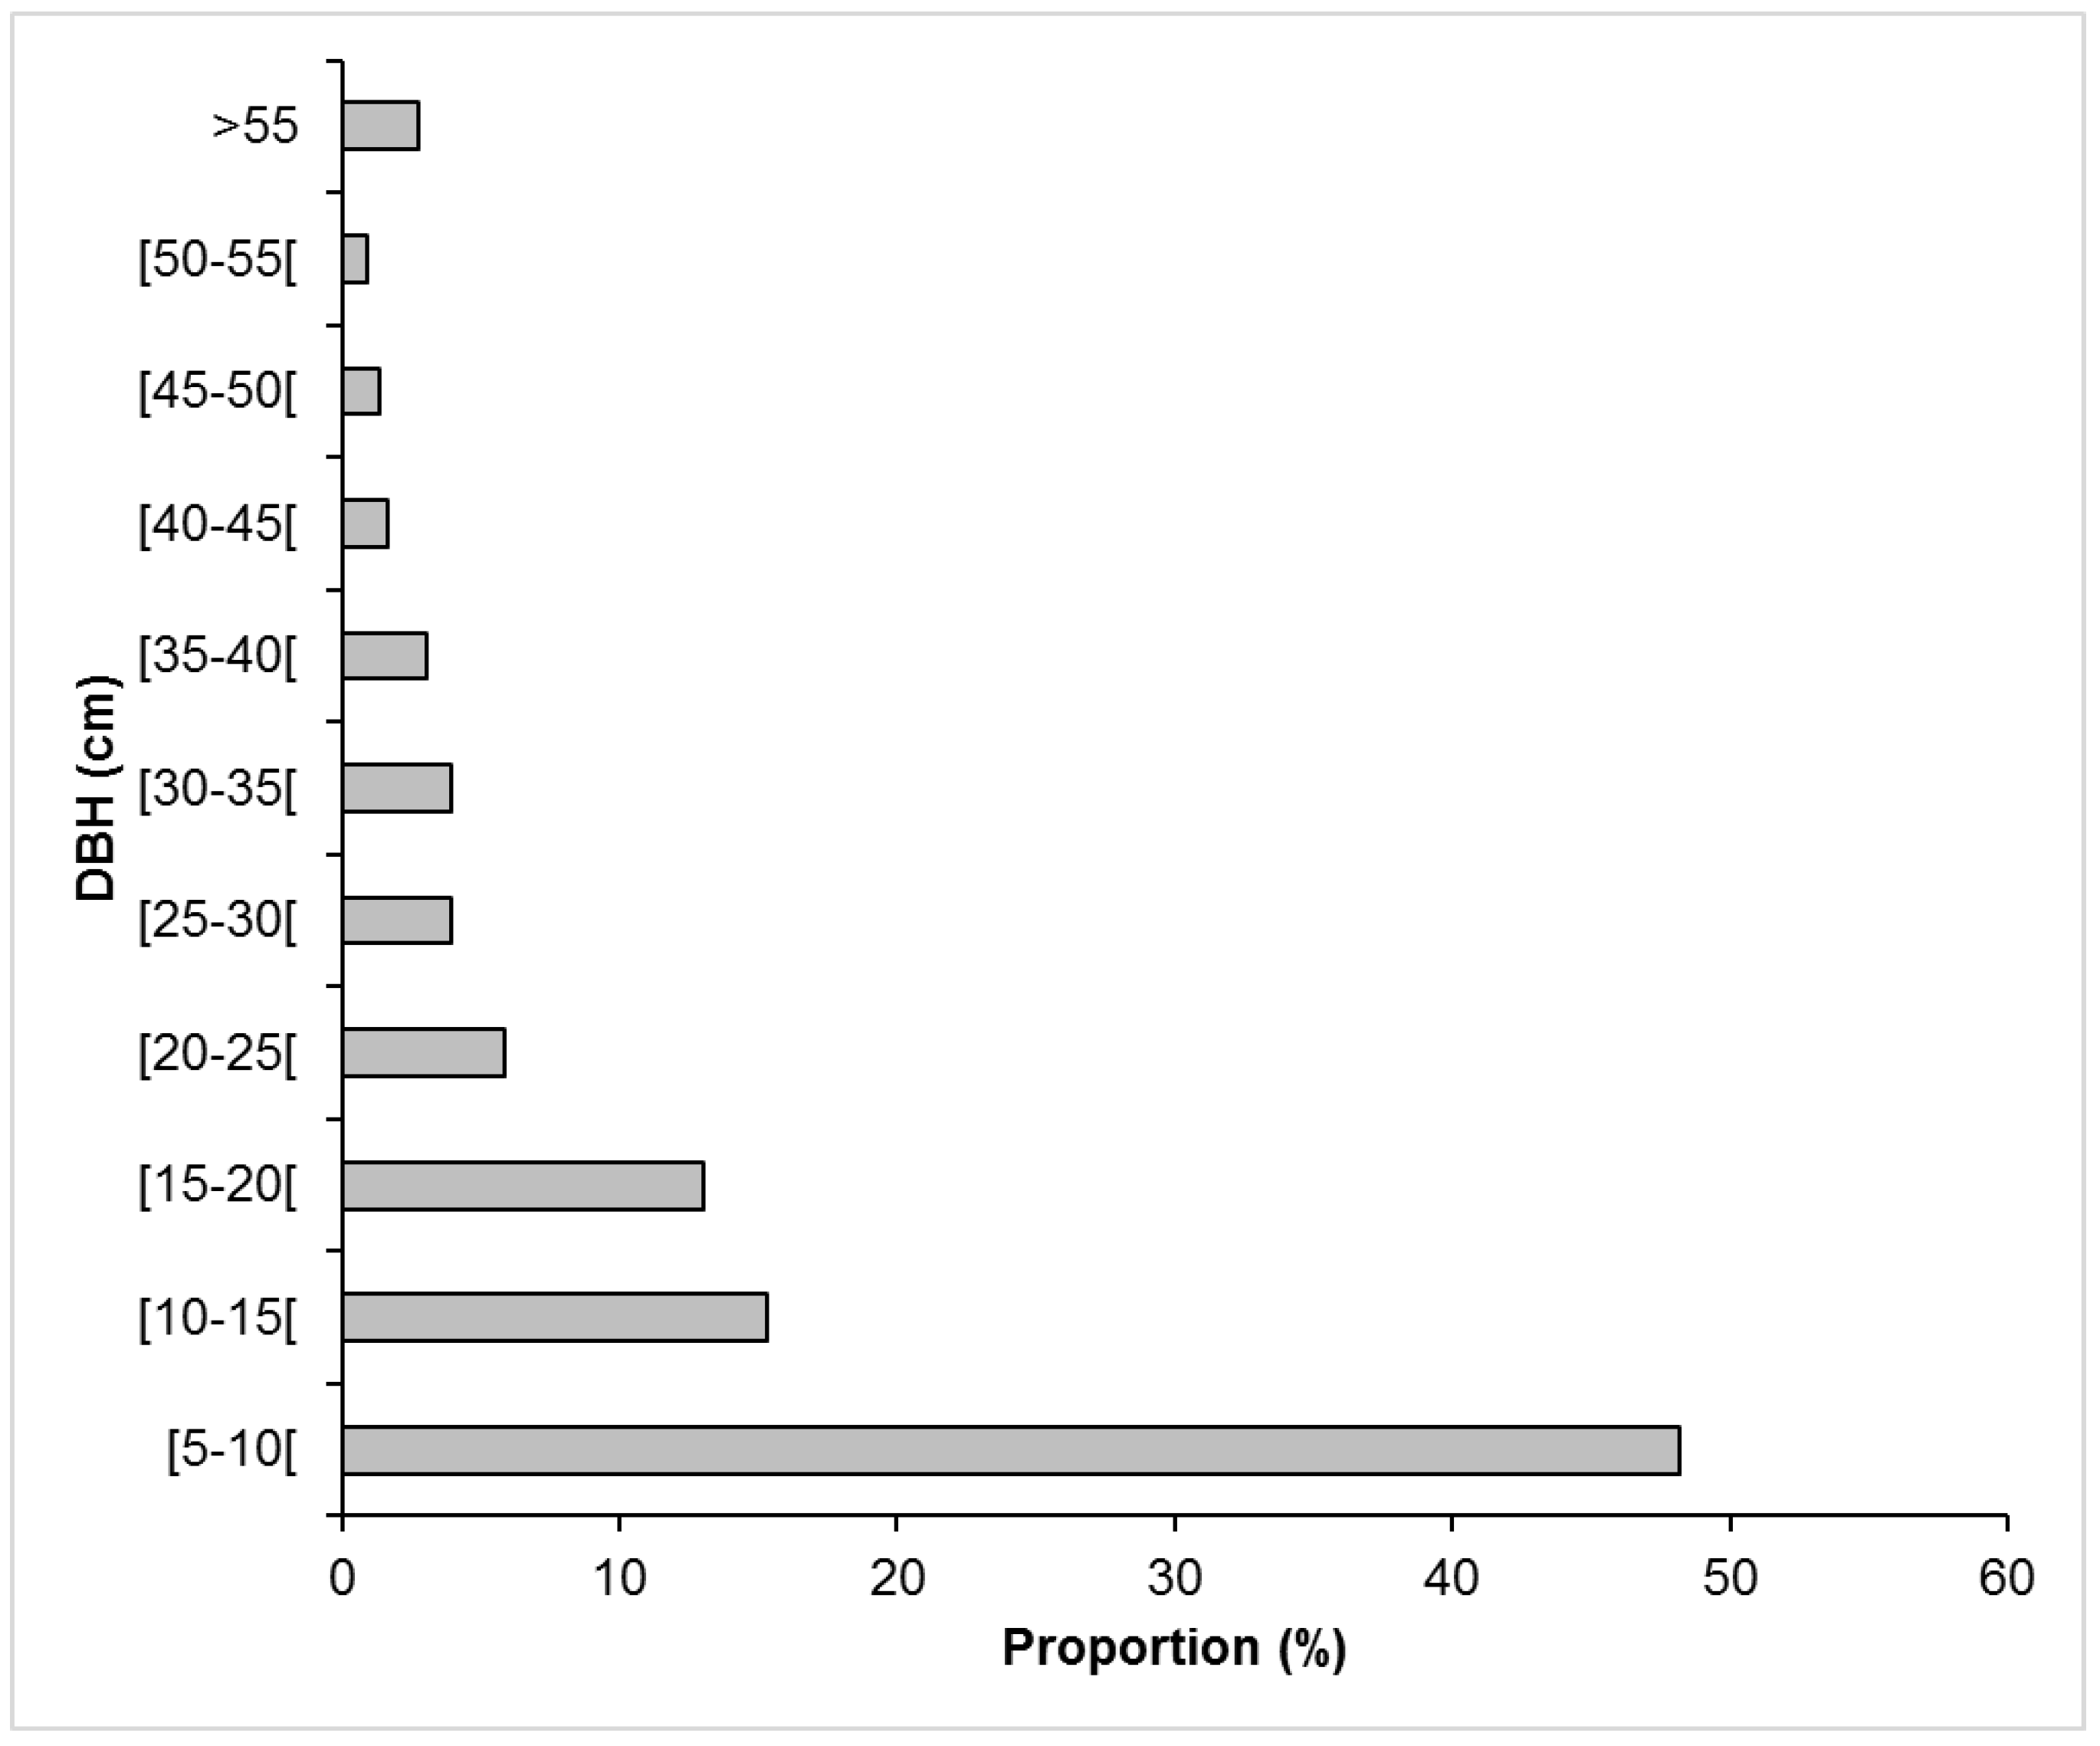
3.2. Vegetation Structure

A total of 1450 trees were inventoried over an area of 6 ha in 61 locations covering 20 cropland, 15 tree savanna, 12 shrub savanna, 8 woodland and 6 gallery forest plots across the study area. Tree size-class distribution profiles showed a greater proportion of stems in the smallest size class, <10 cm, and fewer stems in the intermediary and leading size classes (Figure 3). Trees found in croplands were relatively bigger than those in near-natural vegetation (Table 4).
Species richness varied significantly with land use types in the study area (X-squared = 46.484, p < 0.0001) with woodland, gallery forest, and tree savanna having a significantly higher richness compared to cropland and shrub savanna (Table 4). Basal area varied significantly (F = 53.93; p < 0.0001) between plant community types ranging from 3.2 ± 3.5 m2·ha−1 in shrub savanna to 21.27 ± 9.94 m2·ha−1 in gallery forest (Table 4). Tree density was higher in gallery forest (920 stem·ha−1), woodland (773.7 stem·ha−1), and tree savanna (332.2 stem·ha−1) than in shrub savanna (116 stem·ha−1) and croplands (32.6 stem·ha−1) (Table 4).
In the study area, land use had an effect on tree sizes (F = 73.44; p < 0.0001). The highest values of DBH were recorded in cropland (36.4 ± 24.2 cm) followed by gallery forest (17.5 ± 16.8 cm), while the lowest values were measured in tree savanna (11.6 ± 8.1 cm) and shrub savanna (12.5 ± 14 cm).
With respect to tree height, there was a significant difference in land use types (F = 37.08; p < 0.0001). The highest values were obtained in cropland (10.3 ± 4.4 m), followed by woodland (8.9 ± 4.9 m), and gallery forests (7.5 ± 4.5 m) (Table 2). However, in the savannas the lowest values varied from 4.84 to 5.70 m.

3.3. Carbon Stock in the Sudanese Savanna Landscape

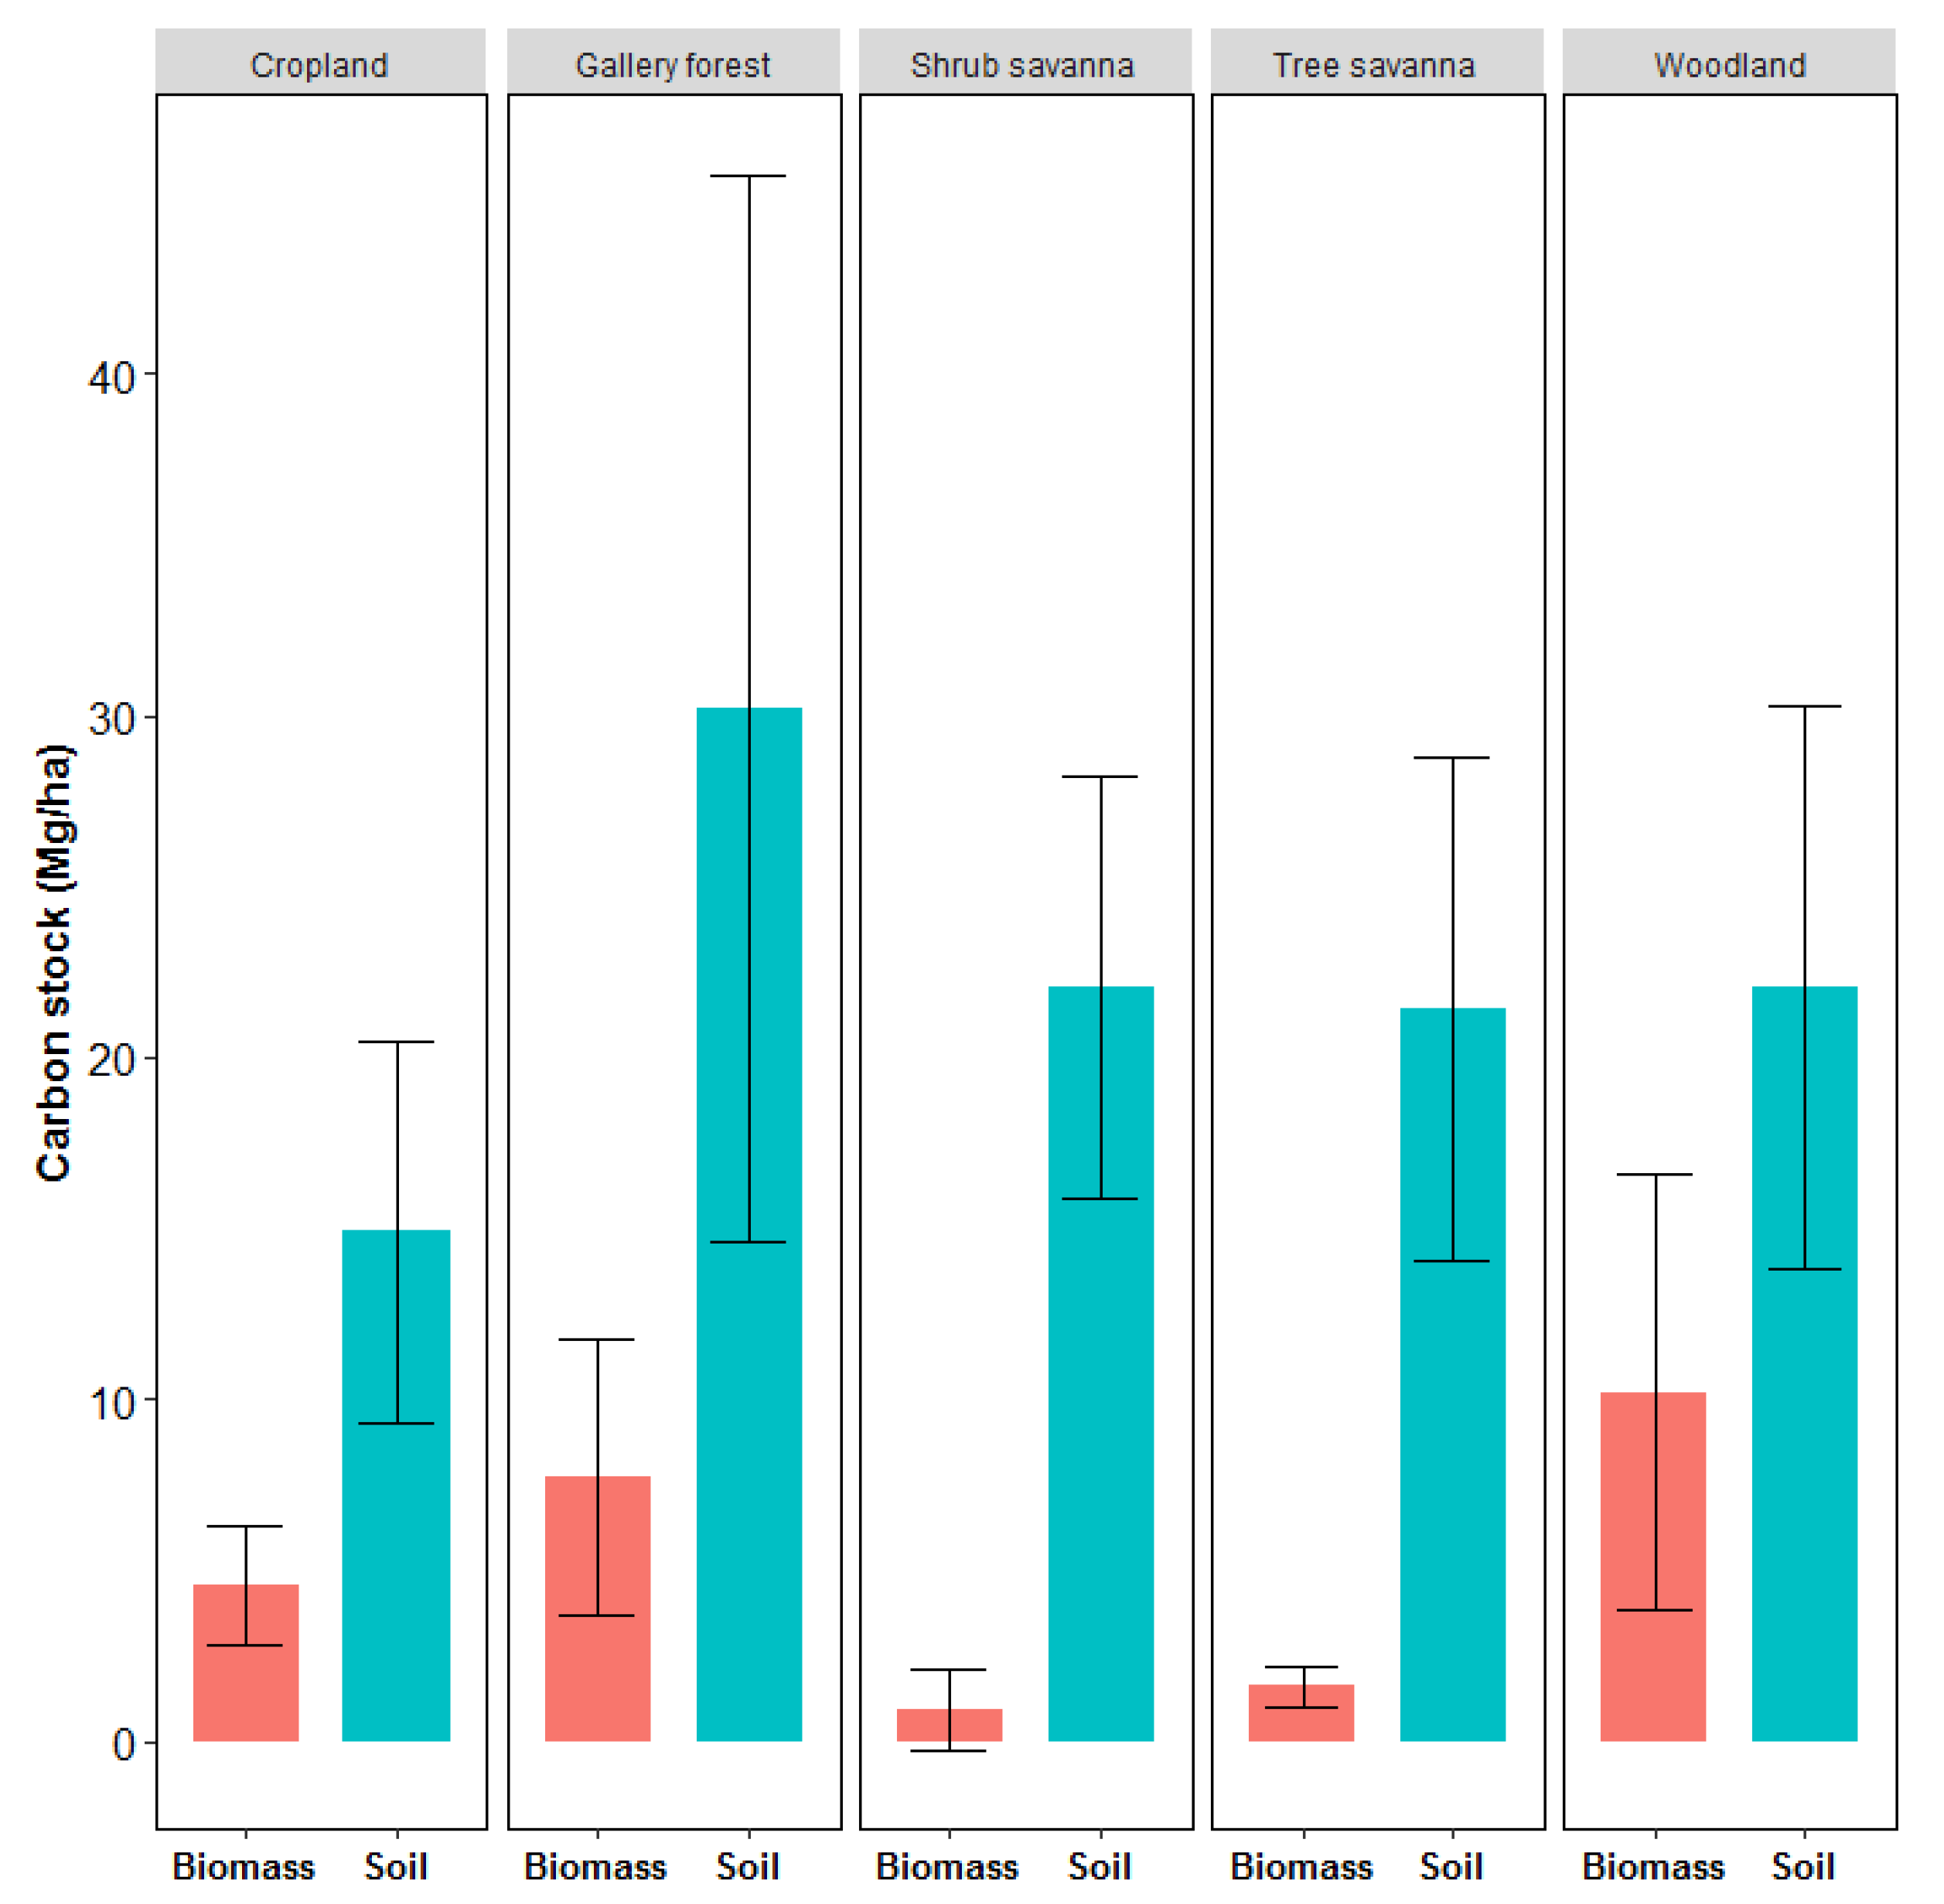
3.3.1. Carbon Stock in Plant Biomass

Aboveground carbon stocks differed between LULCc in the study area (F = 29.36, p < 0.0001). Carbon stock values were higher in woodland (10.2 ± 6.4 Mg·ha−1), followed by gallery forests (7.75 ± 4.05 Mg·ha−1) and cropland (6.4 ± 2.5 Mg·ha−1). However, shrub savannas and tree savannas recorded the lowest carbon stocks with 0.9 ± 1.2 Mg·ha−1 and 1.60 ± 0.60 Mg·ha−1, respectively (Table 4).

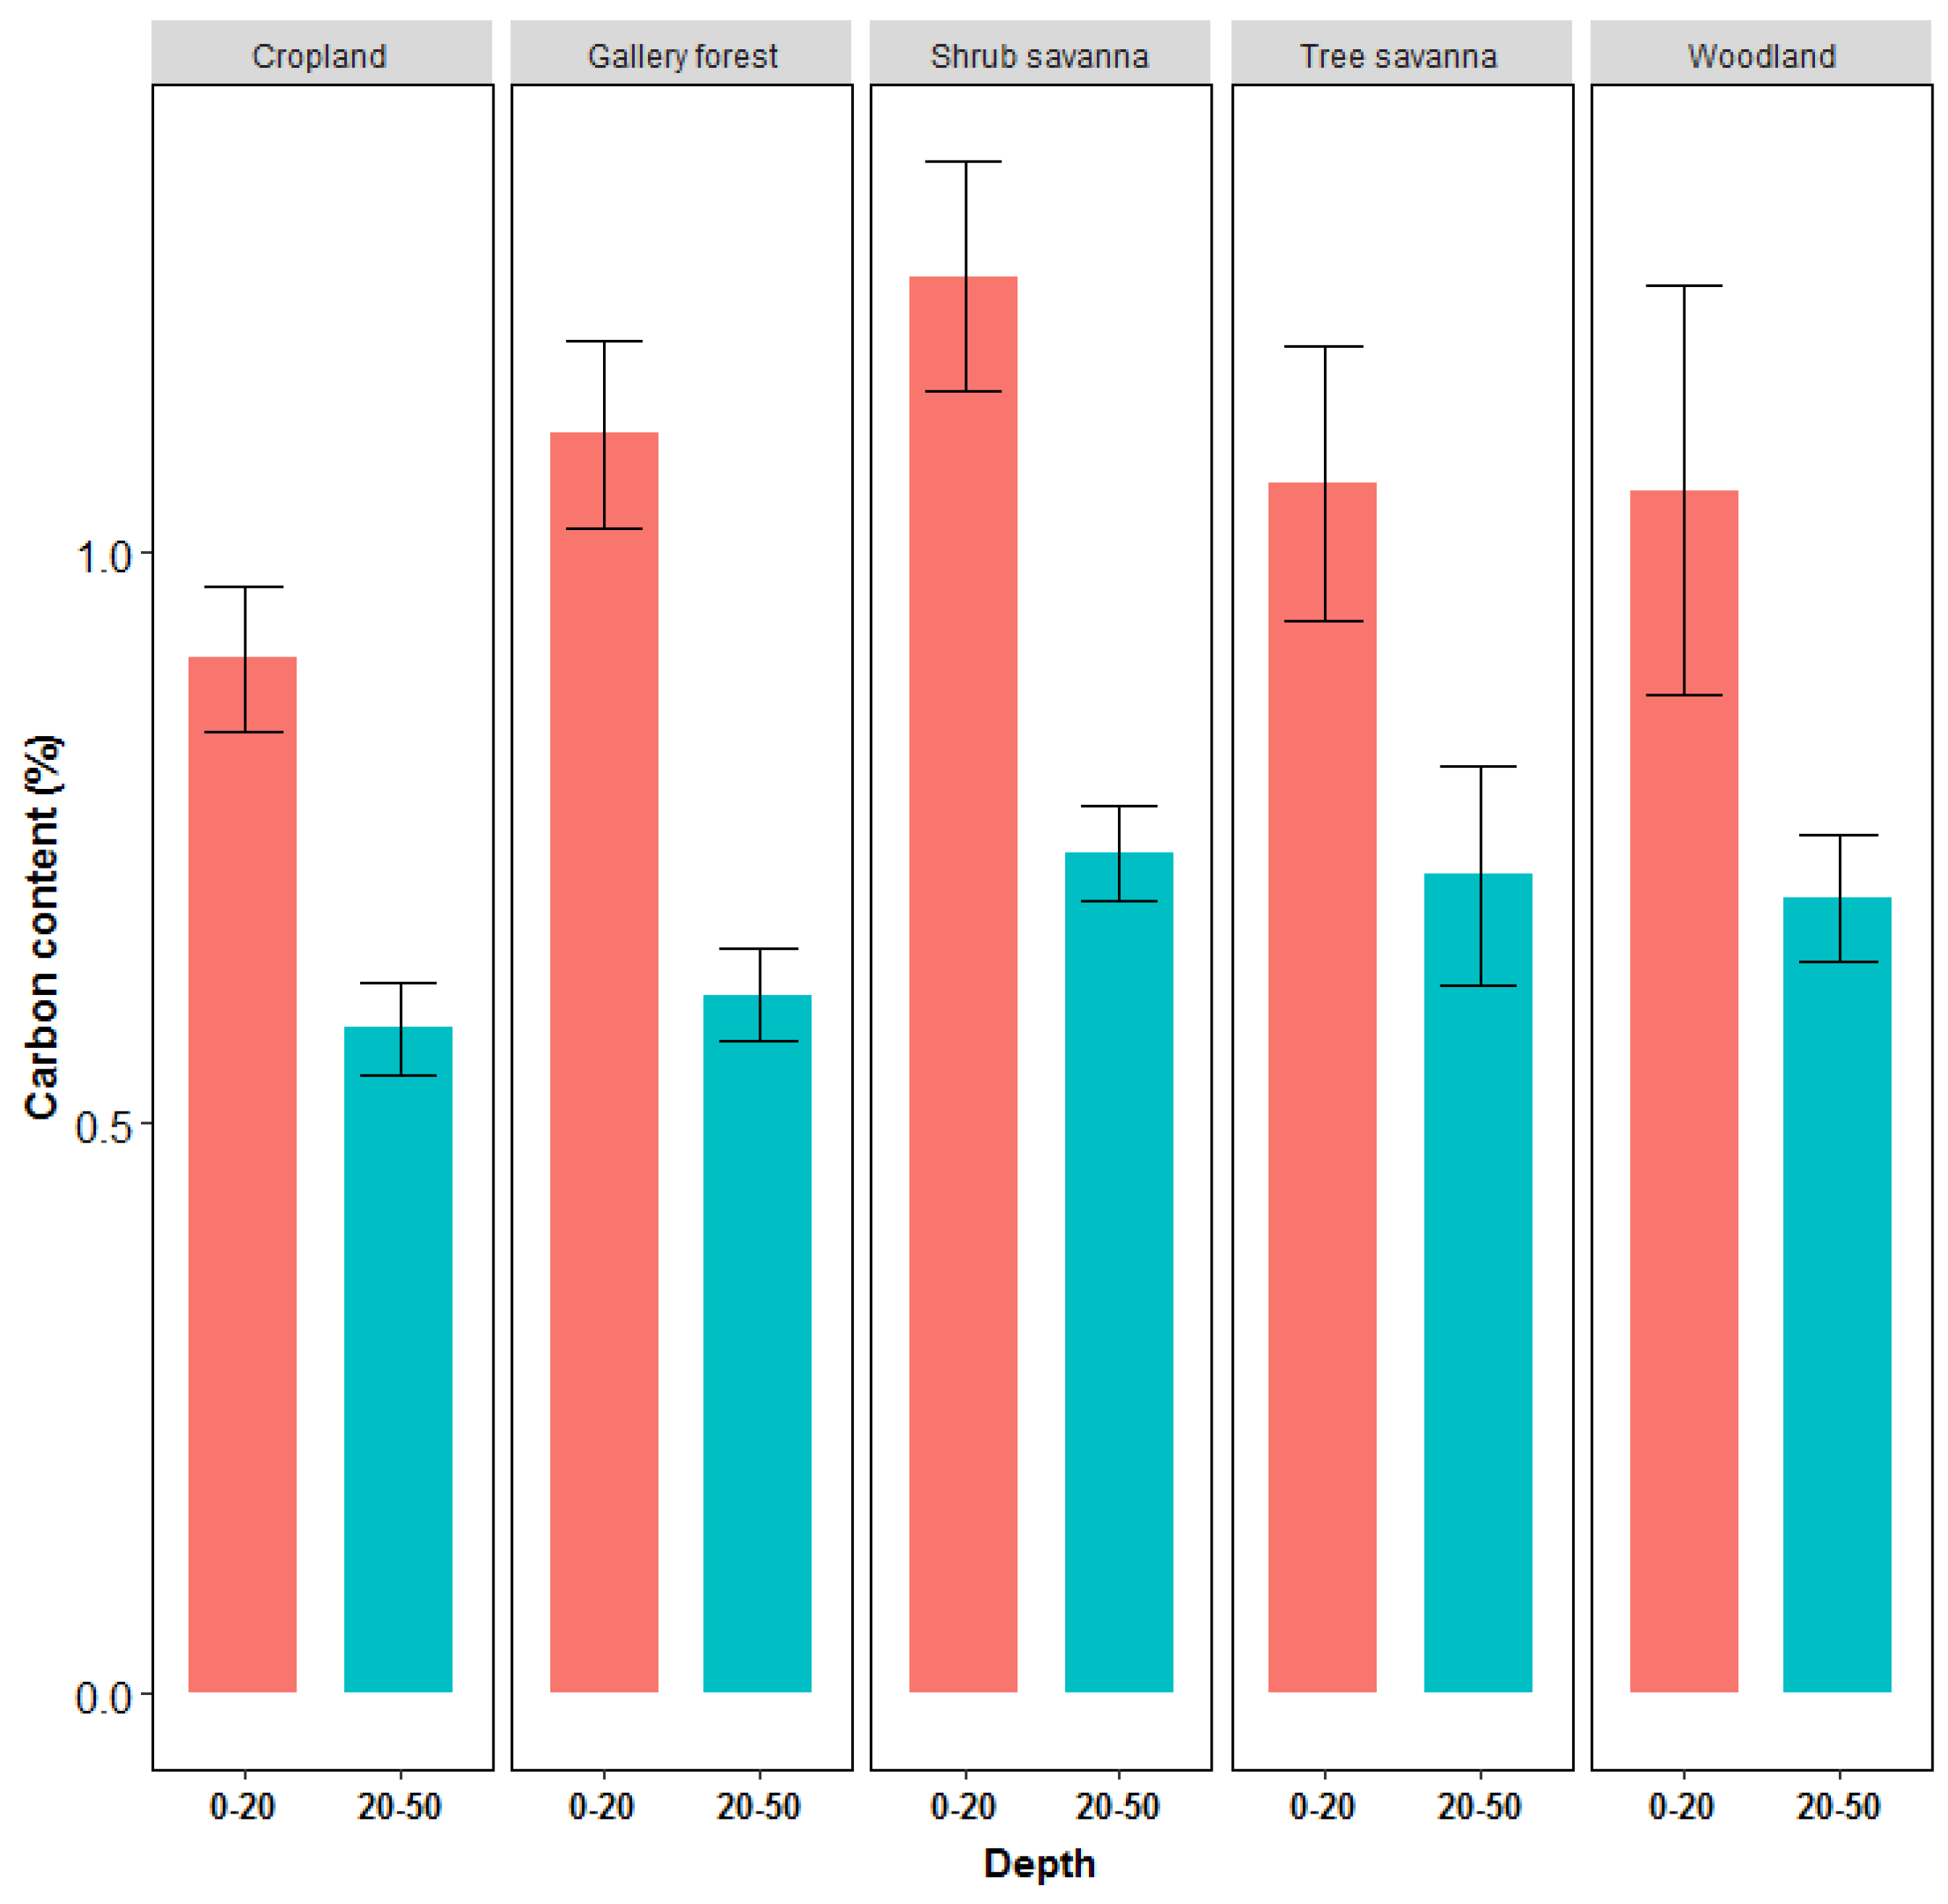
3.3.2. Soil Organic Carbon Stock

The soil organic carbon (SOC) content in the selected LULCc was higher in the topsoil (0–20 cm) than in the subsoil (20–50 cm) (Table 5 and Figure 4). In the topsoil, shrub savanna (1.2 ± 0.1%) and gallery forest (1.10 ± 0.08%) were the vegetation types in which the highest amount of SOC contents were recorded (Figure 4), while the subsoil, shrub savanna (0.73 ± 0.04%), and tree savanna (0.71 ± 0.1%) had the highest amount of SOC content. The lowest values of soil organic carbon content were recorded in cropland in topsoil (0.9 ± 0.06%) and subsoil (0.6 ± 0.04%).
In the top and subsoil, the mean value of SOC stock was highest in the gallery forests, and lowest in the croplands (Table 5). In addition, SOC values in the subsoil were higher than those in the topsoil in all LULCc except in the gallery forest.
At the landscape scale, gallery forest soils store much more carbon (30.2 ± 15.6 Mg·ha−1) than shrub savannas (22.1 ± 6.1 Mg·ha−1), woodland (22 ± 8.2 Mg·ha−1), and tree savannas (21.4 ± 7.4 Mg·ha−1). Cropland soils store less carbon (14.9 ± 5.7 Mg·ha−1).

3.3.3. Total Carbon Stock in the Main LULCc

Considering the stock of carbon stored in the plant biomass and in soil in each LULCc, it appears that gallery forests (38 ± 17.8 Mg·ha−1) and woodland (32.2 ± 7.7 Mg·ha−1) store more carbon than other LULCc (see Table 5). The estimated carbon stock in the plant biomass and in soil across the different LULCc is shown in Figure 5. The results indicated that soils contributed between 2 and 5 times more carbon than the aboveground pools.

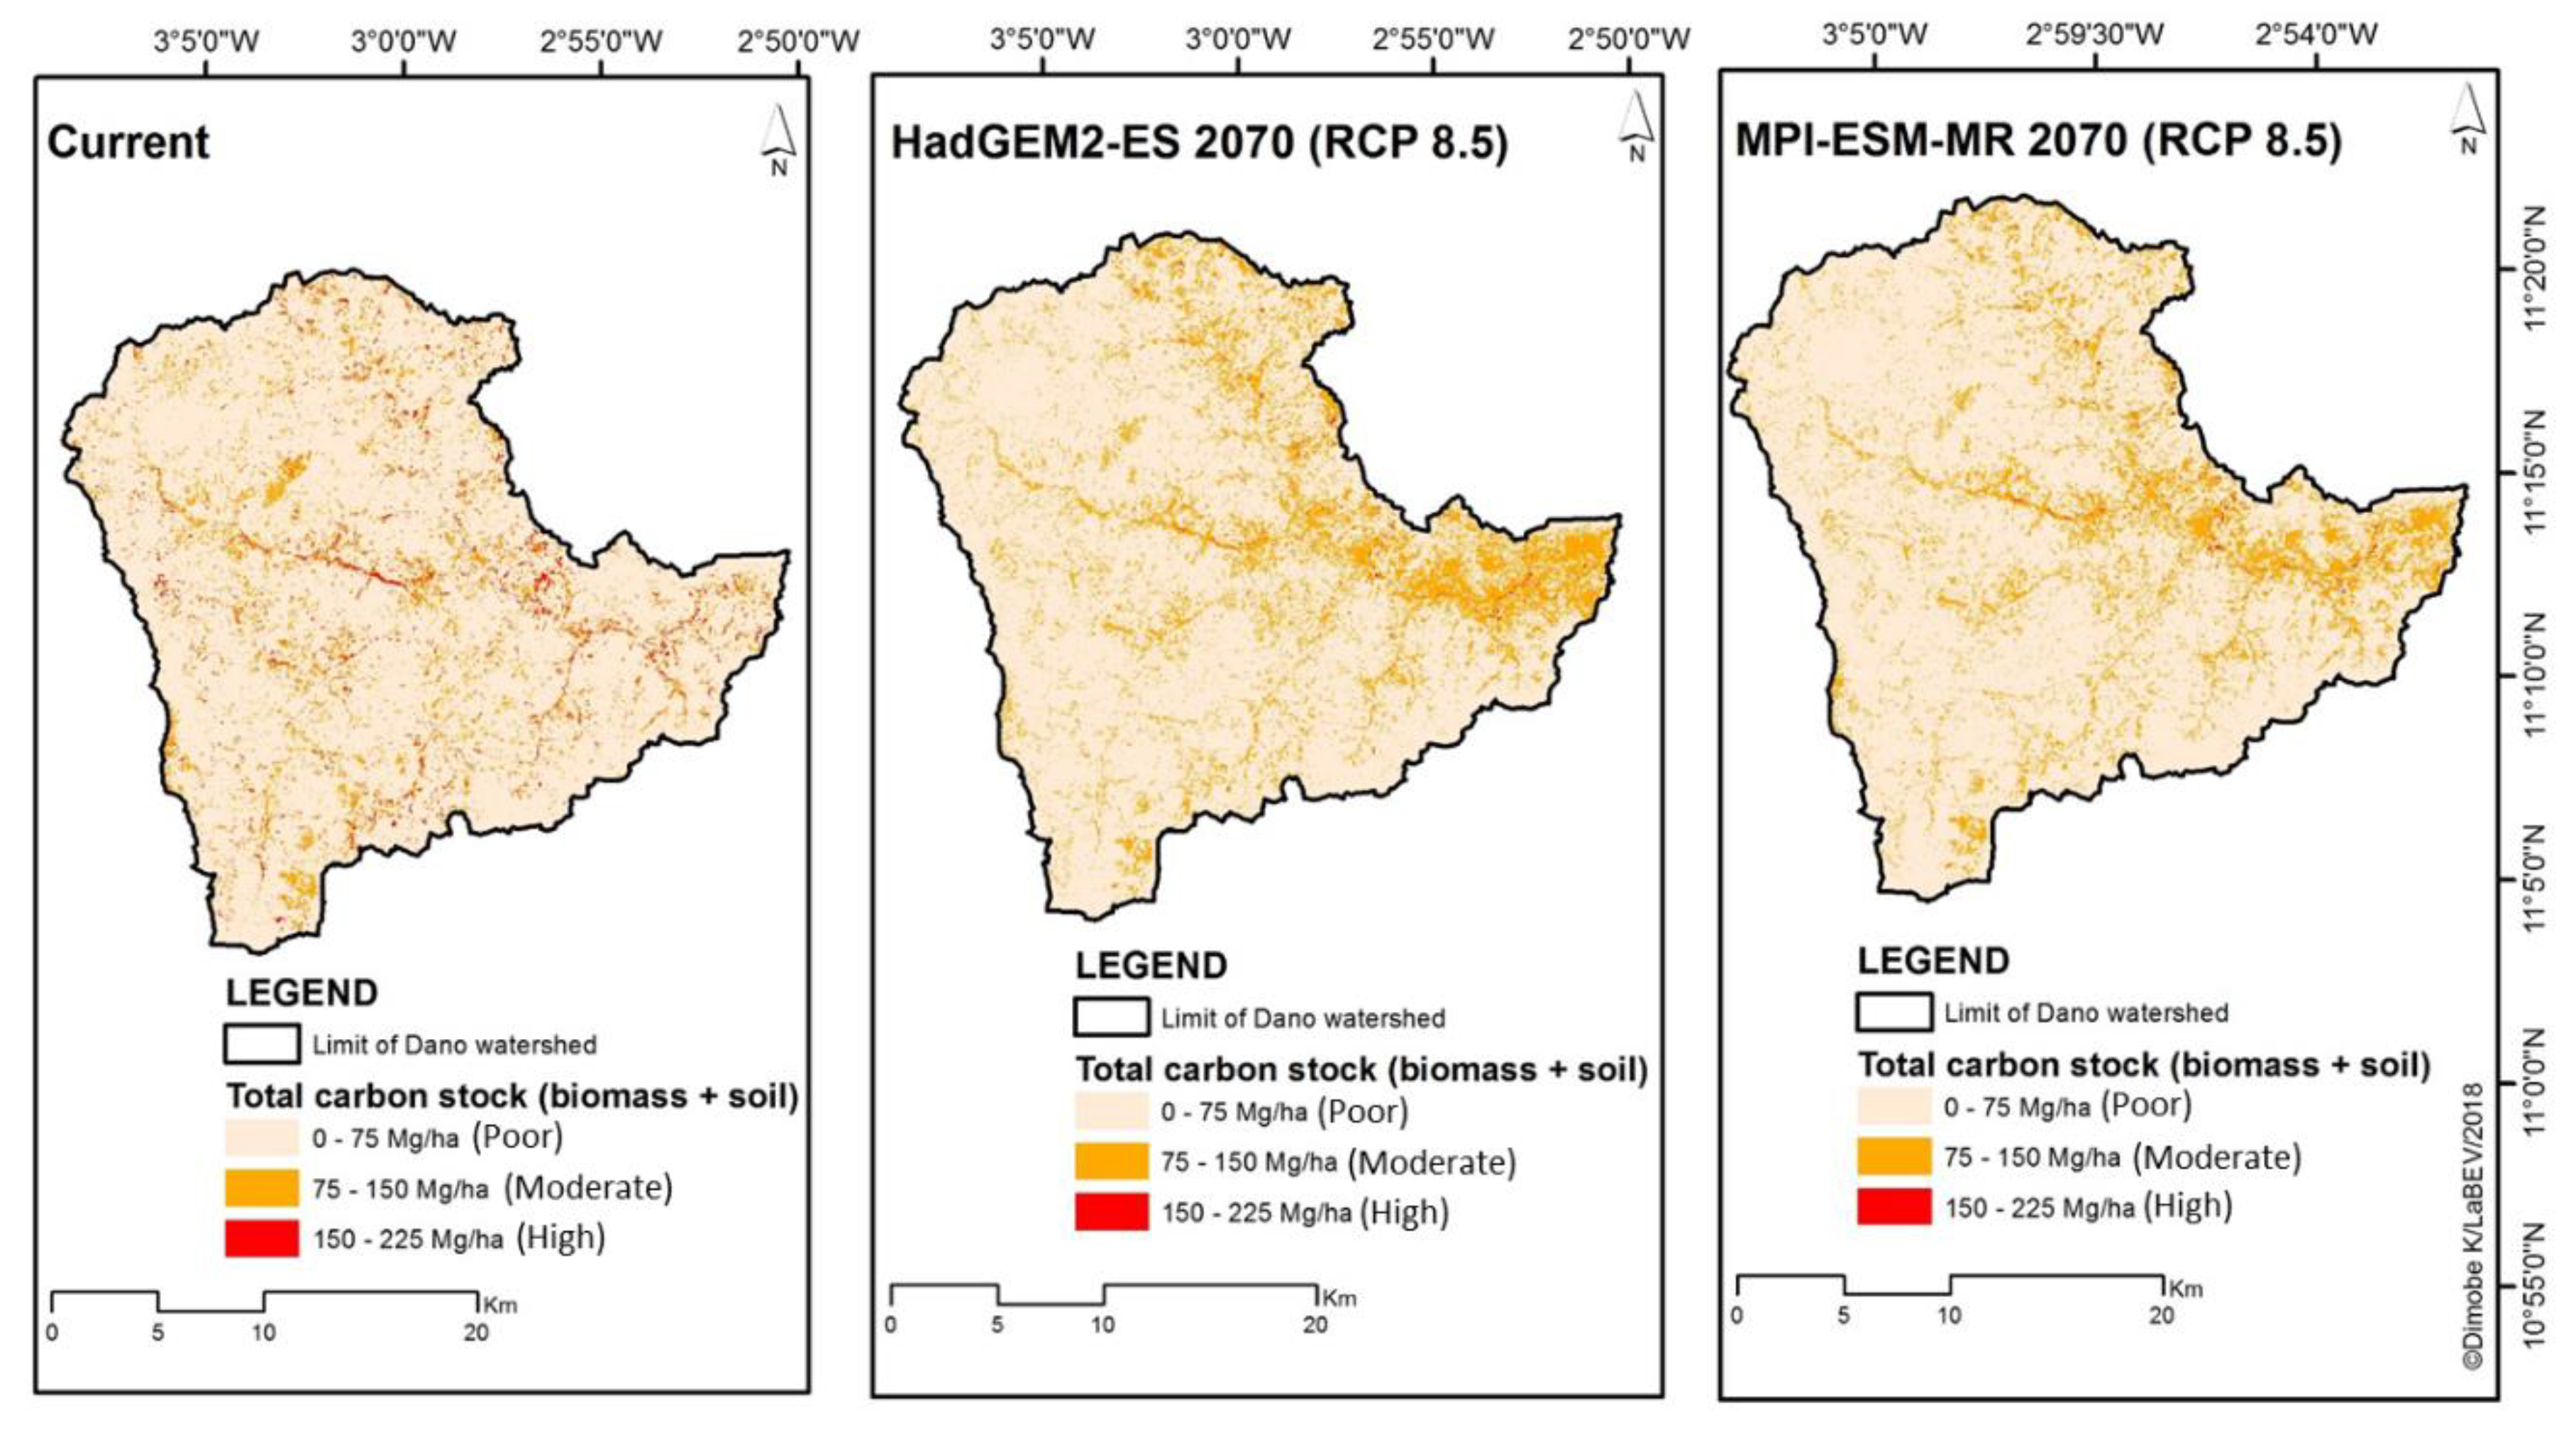
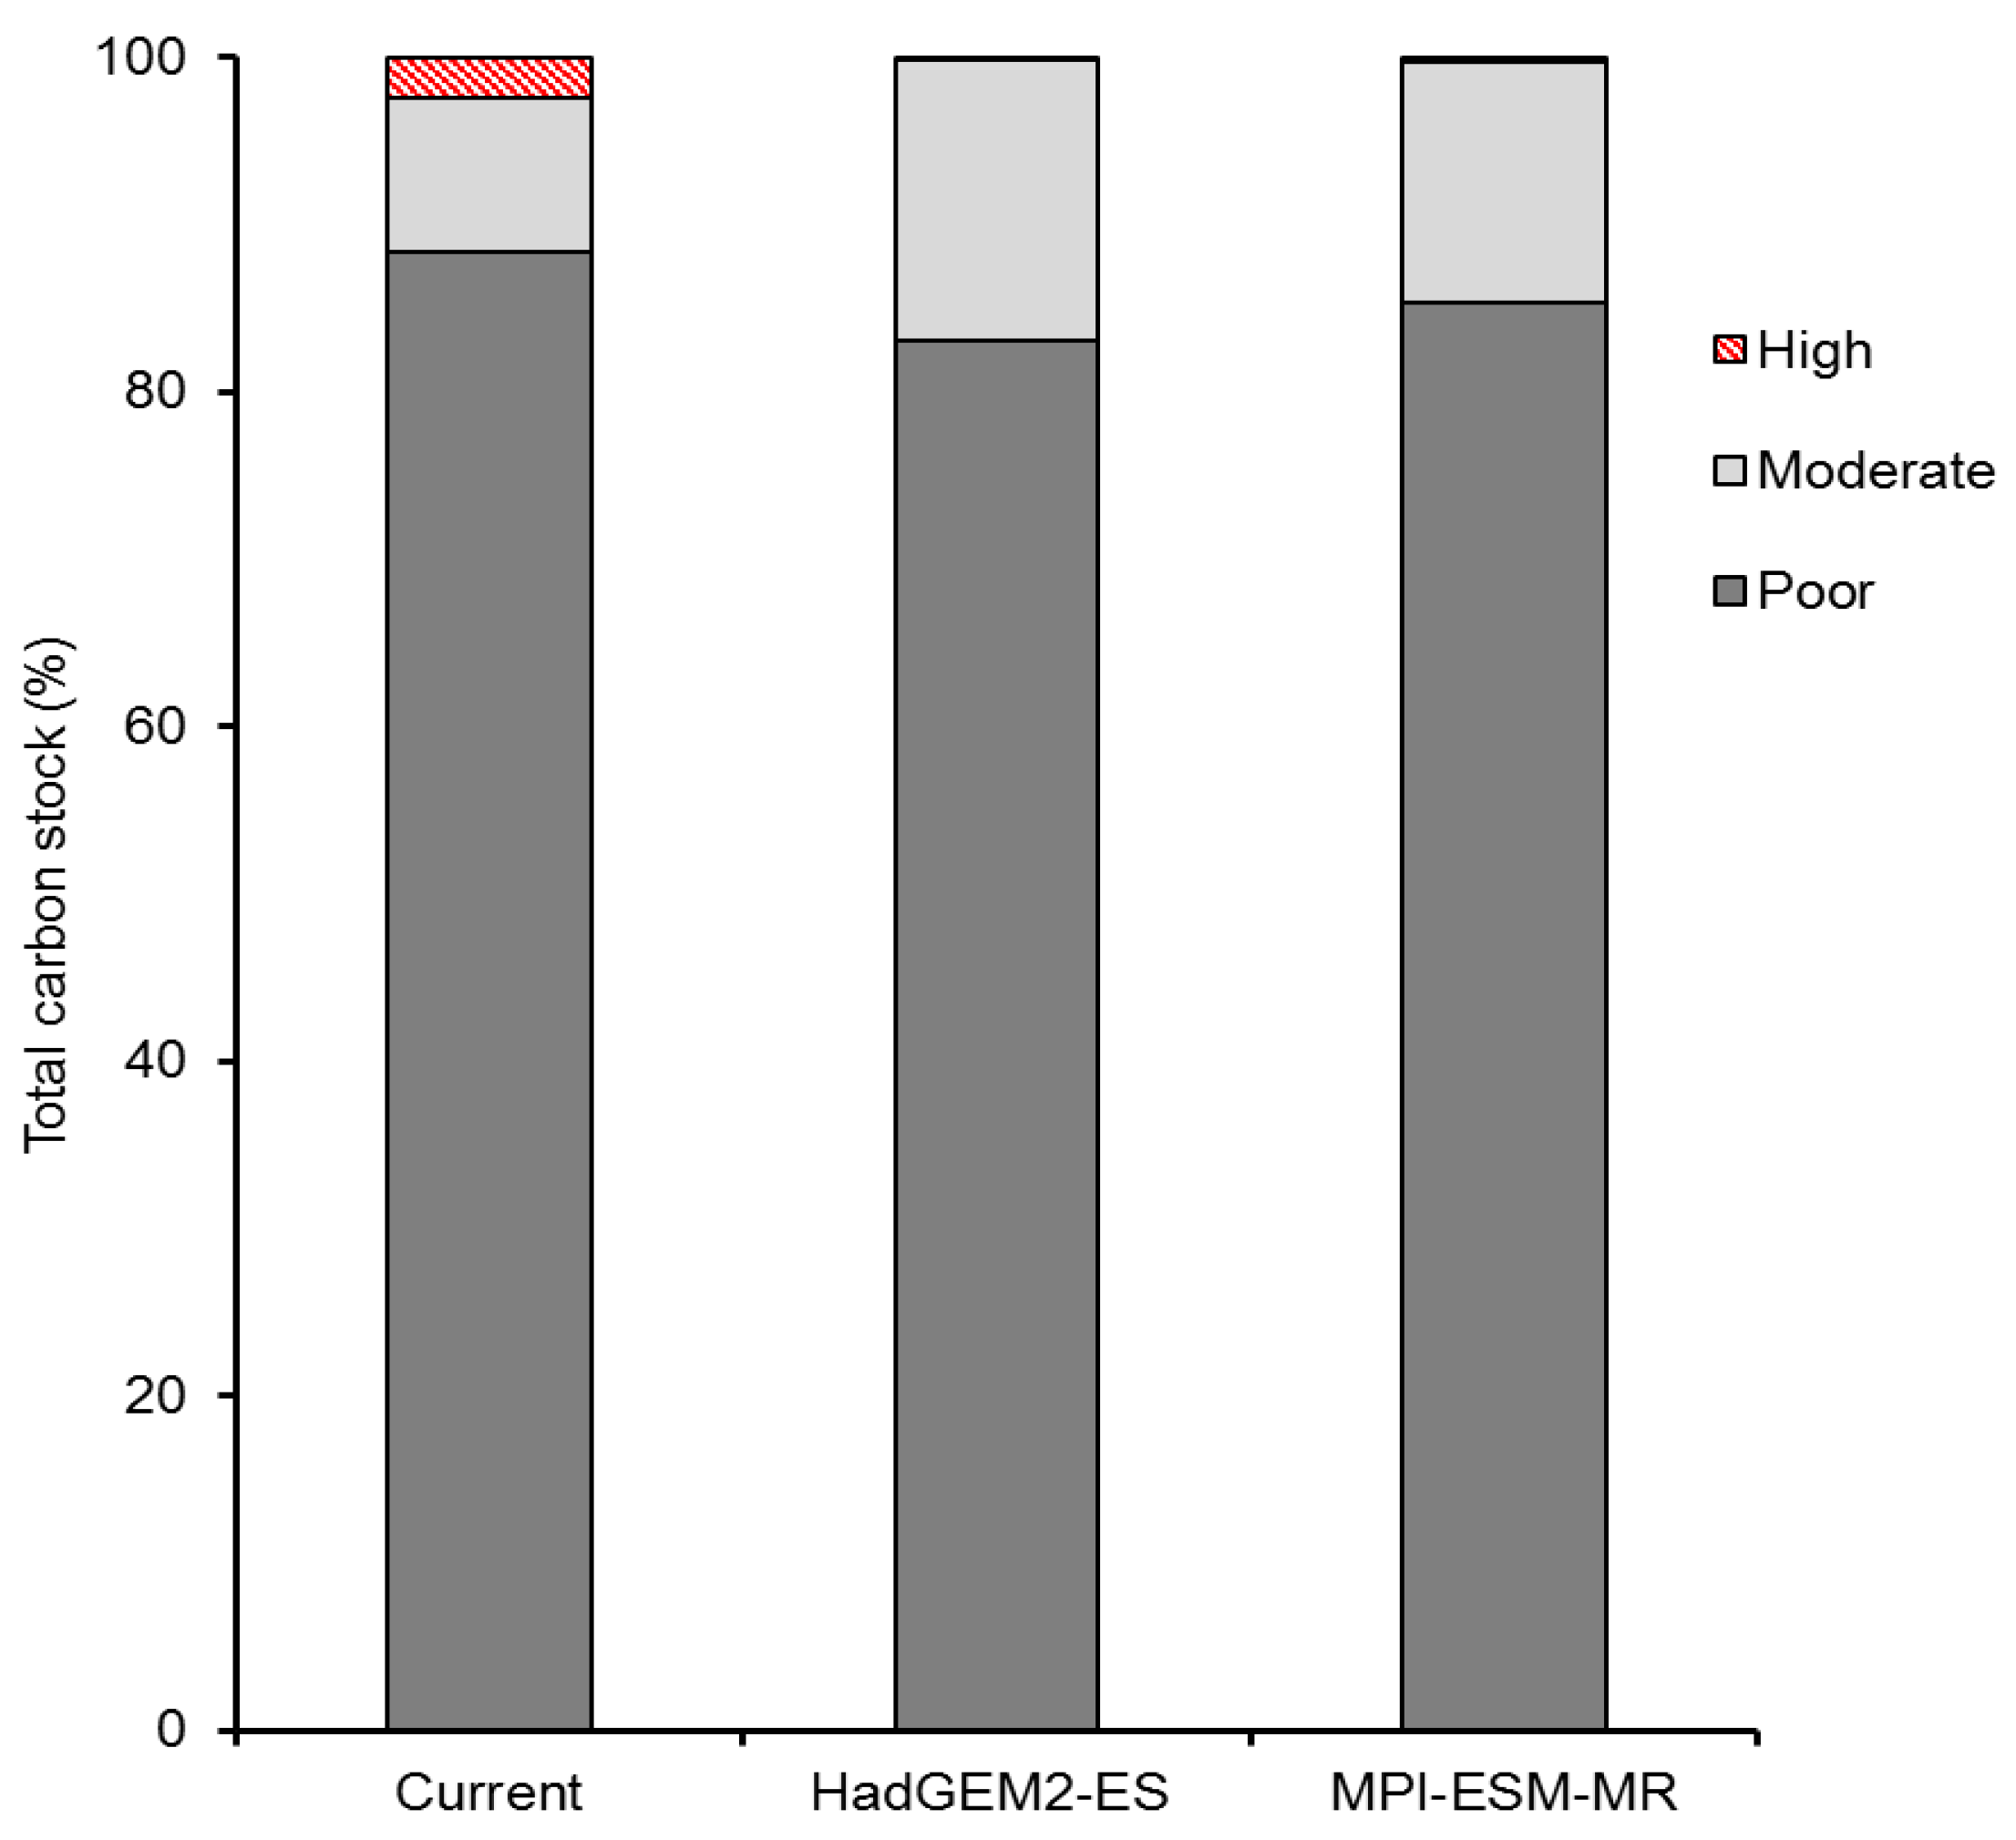
3.4. Geographical Distribution of Carbon Stock under Changing Climate

The optimal subset of covariates resulting from the recursive feature elimination scheme retained fifteen variables: temperature, aspect, topographic wetness index, precipitation, elevation, red (spectral band), EVI, near infrared (spectral band), hue index, green (spectral band), NDVI, blue (spectral band), brightness index, redness index, and SAVI, which have been used to model the current and future distribution of carbon stock in the Dano watershed (Figure 6). The importance measures of the investigated predictor variables by RF indicated that near infrared (spectral band) is the most important variable in explaining the spatial distributions of carbon stock in the Dano watershed (Supplementary Information). Less important but still of major dominance is the topographic wetness index, while precipitation (Bio12) is the third most important variable that influences the spatial distribution of carbon stocks.
The performances of the models are shown in Table 6. The mean absolute error (MAE) ranged between 20.31 and 21.22 and was lower for the current model (Table 6). For the root-mean-squared error (RMSE), values between 12.41 and 13.10 were calculated. Additionally, high coefficients of determination values of 98.40% to 98.92% indicated a strong correlation between measured and predicted carbon stocks.
The projected total carbon stock in 2070 varied depending on the global climate model (GCM) used (Figure 7). More than 80% of the studied area is classified as a poor carbon stock habitat (between 0 and 75 Mg·ha−1) in all cases, i.e., current and future. It is followed by a moderate habitat (75–150 Mg·ha−1), which represents ca. 9% of the studied area, and high carbon stock habitat (150–225 Mg·ha−1) with 2.41% (Figure 7). According to the HadGEM2-ES model and under RCP 8.5, the poor carbon stock habitat will lose about 6% of its initial area by 2070. This model also predicts a decrease in carbon stock in the high carbon stock habitat while a net increase is observed in the moderate habitat by 2070 (Figure 7). The MPI-ESM-MR model predicts the same trends as the HadGEM2-ES. There will be a depletion of high carbon stock habitats by 2070, irrespective of the climate model used. A relatively higher increase in the moderate carbon stock habitat is predicted under HadGEM2-ES compared to MPI-ESM-MR.

4. Discussion

4.1. Main Land Use and Land Cover Categories

The classification technique used to derive the LULC map for the year 2017 was the random forest (RF) algorithm. This algorithm has been used, e.g., by Forkuor [33], Knauer et al. [57] and Zoungrana et al. [58], in the Sudanian Savanna of West Africa to analyze LULC dynamics. Previous studies [51,59,60,61] have compared the performances of different machine learning algorithms (MLAs), such as support vector machines (SVM), regression trees (RTs), Artificial Neural Networks (ANN), stochastic gradient boosting (SGB), and RF. They showed that RF performed better than the other algorithms. Moreover, croplands were found to be the most dominant land use type in the study area. This result concurs with that of Forkuor et al. [49], who reported that agriculture is the major land use system in the Dano watershed, covering nearly 45% of the total area of the study area.

4.2. Vegetation Structure

The landscape of the Dano watershed is dominated by small (low biomass) individuals. Large trees are scarce due to removal through regular harvesting for fuelwood and land clearing for crops. This is evidenced by the abrupt drop in tree numbers above DBH of 5 cm, and the gradual decline in individuals with an increase in size. Moreover, the production of a local beer (dolo) results in the use of about 6400 t of firewood per year from the native savanna sites; this also constitutes a major source of degradation of natural resources [62]. Wood harvesting and charcoal production are a major cause of loss of trees in the study area, through clearing, harvesting, and bushfires [26,33]. However, the dominance of trees in lower DBH is very interesting for the survival of the vegetation. The low values of tree density observed in the shrub savanna and croplands could be explained as being the result of human activities such harvesting, pasture, and agriculture, which have changed the structure of the vegetation [63]. Most of the trees found in croplands are mainly composed of high-growth species benefiting from the protection of farmers because of the important role they play in the provision of socio-economic and environmental services for local populations [64].

4.3. Carbon Stock in the Sudanese Savanna Landscape

4.3.1. Carbon in Plant Biomass

The average aboveground carbon stock in the Dano watershed is low compared to the values recorded by Goussanou et al. [65] in the Lama forest, located in southern Benin and in the Miombo woodland in Tanzania [66] and in northern Mozambique [67]. This could be explained by better environmental conditions that would favor vegetation productivity in these areas, as observed by Ribeiro et al. [67] in the Miombo.
The lower carbon stock found in shrub savanna and tree savanna were apparently a direct consequence of land degradation and deforestation affecting tree density [68]. Several studies in tropical regions have reported a higher biomass in preserved areas than in degraded vegetation [65,69,70]. The high biomass in croplands is attributed to the presence of high biomass trees while the shrub savanna and tree savanna are dominated by moderate to low biomass trees, which occur in high numbers. It could also be explained by higher tree density, large trees, and also the presence of trees with a high potential for carbon storage such Vitellaria paradoxa [16].
The high values of carbon stock recorded in the woodlands and gallery forests could be explained by: (i) the high abundance of woody trees; and (ii) the protection of these stands from logging and anthropogenic samples. This finding was consistent with results of Qasim et al. [71], who stressed that carbon stocks in plant biomass in the wildlife reserve of Bontioli and Nazinga Game Ranch located in Burkina Faso were higher in forest (gallery forests and wooded savannas) than in tree and shrub savannas.

4.3.2. Soil Organic Carbon

This study reveals that the mean SOC stocks are higher in gallery forests and lower in croplands, indicating the negative impact of agricultural practices on SOC stock. This result is in line with the findings of Hounkpatin et al. [26] in the same study area. A study in Ghana by Boakye-Danquah et al. [72] reported that SOC cropland (22.9 Mg C ha−1) is lower than that in native vegetation (49.4 Mg C ha−1) for the topsoil (0–20 cm). In Burkina Faso, Hien et al. [73] recorded 16–25 Mg C ha−1 for cropland and 61 Mg C ha−1 for savanna soils in Poni Province in southwestern Burkina Faso. However, our data for the Dano watershed showed smaller differences between the two land use systems. This study showed that the SOC content obtained in the croplands was low compared to other LULCc. This could be explained by the presence of high human activity in croplands [26]. For example, according to Lal [74], fire is a major disturbance that can impact SOC stock. In this study, croplands are in a fire-prone area and may have been impacted by the effects of this disturbance, which might have lowered their carbon stock.
The total carbon stock in the Dano watershed was found to be higher in the gallery forest, followed by the woodland, tree savanna, shrub savanna, and croplands. These results are consistent with those of Boakye-Danquah et al. [72] in northern Ghana. This shows that natural or semi-natural vegetation have a higher carbon storage capacity than environments degraded or transformed by anthropogenic activities, and that carbon sequestration is a function of the abundance of trees in the environment. However, it should be noted that carbon stocks are a result not only of management, but also of site-specific pedological and climatic conditions that maybe confounding to the management effect [75,76].

4.4. Geographical Distribution of Carbon Stock under Changing Climate

The results of carbon stock modeling showed that the poor carbon stock habitat is widespread in the study area, while the high carbon stock habitat has a lower representation. By analogy with the results of the image classification, the poor carbon stock habitat is equivalent to the croplands and tree savanna, while that of the high habitat represents woodlands and gallery forests, and the intermediate class (75–150 Mg C ha−1) corresponds to shrub savanna. The two climate models used in this study project a reduction in the carbon stock for the poor habitat (about 5% for HadGEM2-ES, and 3% for MPI-ESM-MR) and the high habitat (ca. 2.17% for HadGEM2-ES, and 2.15% for MPI-ESM-MR). Although the models considered in this study predict a significant decrease in carbon stock, there were some variations in the extent of the predicted habitats and their level of suitability according to the climate model and the scenario (RCP) used. Variations in prediction under future climates have largely been reported in the climate change modeling literature, and many factors including the estimated variables, the process applied in a model construction, variation in modeling technique, or the climate scenario are likely to influence the outcome of the model [77,78].
The decrease in the carbon stock by 2070 in both models could generally be due to human activities and the adverse effects of climate change, because according to Harris et al. [79], there is a strong correlation between anthropogenic activities and the amount of carbon lost. In degraded and non-degraded forests/savannas, carbon stock, vegetation structure and biodiversity can be highly variable, ultimately affecting ecological functioning and recovery time [80,81]. According to Nabuurs et al. [82], the degradation of vegetation leads to immediate CO2 emissions (with small amounts of CO, CH4, and N2O) when biomass and dead organic matter are burned, and slower release when the biomass and dead organic matter disintegrate. At the same time, deforestation is the main cause of the loss of global biodiversity in terrestrial ecosystems [68,83]. In addition to the anthropogenic factors, the regressive trends of the carbon stock suggesting that climate change will have a negative impact on: (i) plant species, especially woody species, as reported by Thuiller [77]; and (ii) carbon stock in the study area. This also confirms the hypothesis that climate change may alter the range of species, as evidenced by several studies [77,84,85]. The reduction in the carbon stock by 2070 could be related to the planned shift to a somewhat more arid climate.

5. Conclusions

The current study is a pilot research project using biomass models to derive vegetation carbon stocks and their spatial distribution. Soil was the most important pool of carbon stock in our study area. Modeling results showed that climate change could affect the carbon storage potential of woody species in the Dano watershed by reducing areas or LULCc that currently have high carbon storage potential. The results of this study can be used to develop strategies for woody species conservation and to improve the adaptive capacity of local people to reduce their vulnerability to the effects of climate change. The creation of databases on the potential impact of climate change on the carbon storage capacity of woody species according to the different climate scenarios could accelerate the adaptive decision-making as part of their integration into forest management systems (e.g., by developing decision-making models that incorporate climate change to identify carbon stock hotspots to be protected). The approach applied in this study could be used as a basis for establishing vegetation reference emissions in the context of REDD+ (reduction emissions from forest degradation, conversion of forests, and the enhancement of forest carbon stocks). In this study, the aboveground carbon stock was estimated using the generalized equation developed by Chave et al. [42] and the global wood density database because of the lack of species-specific allometric equations and wood densities at the local level. Thus, future studies should endeavor to contribute to filling this gap. In the future, the model performance will be improved by considering other environmental data and other up-to-date remote sensing techniques.

Supplementary Materials

The following are available online at https://www.mdpi.com/2073-445X/7/4/124/s1, Figure S1: Variable importance derived from RF models for carbon stock (NIR, Green, Red, and Blue represent the near infra-red, green, red and blue bands from the S-2 image; Topo.wet_index: topographic wetness index; Bio12: precipitation; Bio1: temperature, HI: hue index; BI: brightness index; RI: redness index; SI: saturation index; CI: coloration index; Topo_position_index: topographic position index; Terrain_rug: terrain ruggedness).

Author Contributions

Conceptualization, K.D. and J.E.T.; Data curation, K.D.; Formal analysis, K.D.; Funding acquisition, J.E.T.; Investigation, K.D. and J.L.N.K.; Methodology, K.D. and K.O.; Software, K.D.; Supervision, J.E.T.; Writing–original draft, K.D.; Writing–review and editing, K.D., J.L.N.K., J.E.T., B.J.-B.Z., G.F. and K.O.

Funding

This research was funded by the German Federal Ministry of Education and Research through WASCAL (West African Science Service Center on Climate Change and Adapted Land use, www.wascal.org).

Acknowledgments

The authors are grateful to the field assistants and local people who helped with the data collection. The authors thank the three anonymous reviewers for their efforts and constructive comments, which allowed us to improve the manuscript.

Conflicts of Interest

The authors declare no conflict of interest.

References

  1. Sylla, M.B.; Faye, A.; Giorgi, F.; Diedhiou, A.; Kunstmann, H. Projected Heat Stress Under 1.5 °C and 2 °C Global Warming Scenarios Creates Unprecedented Discomfort for Humans in West Africa. Earths Future 2018, 6, 1029–1044. [Google Scholar] [CrossRef]
  2. Sultan, B.; Roudier, P.; Quirion, P.; Alhassane, A.; Muller, B.; Dingkuhn, M.; Ciais, P.; Guimberteau, M.; Traore, S.; Baron, C.; et al. Assessing climate change impacts on sorghum and millet yields in the Sudanian and Sahelian savannas of West Africa. Environ. Res. Lett. 2013, 8, 014040. [Google Scholar] [CrossRef] [Green Version]
  3. Gockowski, J.; van Asten, P. Agricultural Intensification as a Climate Change and Food Security Strategy for Sub-Saharan Africa. In E. Wollenberg, A. Nihart, M.L. Tapio-Bostro and M. Grieg-Gran, Climate Change Mitigation and Agriculture. International Center for Research in Agroforestry-International Center for Tropical Agriculture: London-New York, 2012; pp. 382–390. Available online: http://hdl.handle.net/10568/80518 (accessed on 20 August 2018).
  4. Lott, J.E.; Ong, C.K.; Black, C.R. Understorey microclimate and crop performance in a Grevillea robusta-based agroforestry system in semi-arid Kenya. Agric. For. Meteorol. 2009, 149, 1140–1151. [Google Scholar] [CrossRef]
  5. Law, E.A.; Bryan, B.A.; Torabi, N.; Bekessy, S.A.; McAlpine, C.A.; Wilson, K.A. Measurement matters in managing landscape carbon. Ecosyst. Serv. 2015, 13, 6–15. [Google Scholar] [CrossRef]
  6. Thomson, A.M.; Calvin, K.V.; Chini, L.P.; Hurtt, G.; Edmonds, J.A.; Bond-Lamberty, B.; Frolking, S.; Wise, M.A.; Janetos, A.C. Climate mitigation and the future of tropical landscapes. Proc. Natl. Acad. Sci. USA 2010, 107, 19633–19638. [Google Scholar] [CrossRef] [PubMed] [Green Version]
  7. Dumanski, J. Carbon sequestration, soil conservation, and the Kyoto protocol: Summary of implications. Clim. Chang. 2004, 65, 255–261. [Google Scholar] [CrossRef]
  8. Bali. Report of the Conference of Parties on Its Thirtheenth Session. Bali, Indonesia, 3–15 December 2007. Available online: https://unfccc.int/resource/docs/2007/cop13/eng/06.pdf (accessed on 14 July 2018).
  9. Angelsen, A.; Brockhaus, M.; Sunderlin, W.D.; Verchot, L.V. Analyse de la REDD+ Les Enjeux et les Choix; CIFOR: Bogor, Indonesia, 2013. [Google Scholar]
  10. Gibbs, H.K.; Brown, S.; Niles, J.O.; Foley, J.A. Monitoring and estimating tropical forest carbon stocks: Making REDD a reality. Environ. Res. Lett. 2007, 2, 045023. [Google Scholar] [CrossRef]
  11. Saatchi, S.S.; Harris, N.L.; Brown, S.; Lefsky, M.; Mitchard, E.T.; Salas, W.; Zutta, B.R.; Buermann, W.; Lewis, S.L.; Hagen, S. Benchmark map of forest carbon stocks in tropical regions across three continents. Proc. Natl. Acad. Sci. USA 2011, 108, 9899–9904. [Google Scholar] [CrossRef] [PubMed] [Green Version]
  12. Baccini, A.; Goetz, S.J.; Walker, W.S.; Laporte, N.T.; Sun, M.; Sulla-Menashe, D.; Hackler, J.; Beck, P.S.A.; Dubayah, R.; Friedl, M.A. Estimated carbon dioxide emissions from tropical deforestation improved by carbon-density maps. Nat. Clim. Chang. 2012, 2, 182. [Google Scholar] [CrossRef]
  13. Clark, D.B.; Kellner, J.R. Tropical forest biomass estimation and the fallacy of misplaced concreteness. J. Veg. Sci. 2012, 23, 1191–1196. [Google Scholar] [CrossRef] [Green Version]
  14. Basuki, T.M.; Van Laake, P.E.; Skidmore, A.K.; Hussin, Y.A. Allometric equations for estimating the above-ground biomass in tropical lowland Dipterocarp forests. For. Ecol. Manag. 2009, 257, 1684–1694. [Google Scholar] [CrossRef]
  15. Mbow, C.; Van Noordwijk, M.; Luedeling, E.; Neufeldt, H.; Minang, P.A.; Kowero, G. Agroforestry solutions to address food security and climate change challenges in Africa. Curr. Opin. Environ. Sustain. 2014, 6, 61–67. [Google Scholar] [CrossRef] [Green Version]
  16. Dimobe, K.; Goetze, D.; Ouédraogo, A.; Mensah, S.; Akpagana, K.; Porembski, S.; Thiombiano, A. Aboveground biomass allometric equations and carbon content of the shea butter tree (Vitellaria paradoxa C.F. Gaertn., Sapotaceae) components in Sudanian savannas (West Africa). Agrofor. Syst. 2018. [Google Scholar] [CrossRef]
  17. Dimobe, K.; Mensah, S.; Goetze, D.; Ouédraogo, A.; Kuyah, S.; Porembski, S.; Thiombiano, A. Aboveground biomass partitioning and additive models for Combretum glutinosum and Terminalia laxiflora in West Africa. Biomass Bioenergy 2018, 115, 151–159. [Google Scholar] [CrossRef]
  18. Brown, S. Estimating Biomass and Biomass Change of Tropical Forests: A Primer; Food & Agriculture Organization: Rome, Italy, 1997; ISBN 92-5-103955-0. [Google Scholar]
  19. Chave, J.; Andalo, C.; Brown, S.; Cairns, M.A.; Chambers, J.Q.; Eamus, D.; Fölster, H.; Fromard, F.; Higuchi, N.; Kira, T. Tree allometry and improved estimation of carbon stocks and balance in tropical forests. Oecologia 2005, 145, 87–99. [Google Scholar] [CrossRef] [PubMed]
  20. IPCC. Climate Change: Mitigation. Contribution of Working Group III to the Fourth Assessment Report; IPCC: Geneva, Switzerland, 2007. [Google Scholar]
  21. Fearnside, P.M. Global warming and tropical land-use change: Greenhouse gas emissions from biomass burning, decomposition and soils in forest conversion, shifting cultivation and secondary vegetation. Clim. Chang. 2000, 46, 115–158. [Google Scholar] [CrossRef]
  22. Manlay, R.J.; Kairé, M.; Masse, D.; Chotte, J.-L.; Ciornei, G.; Floret, C. Carbon, nitrogen and phosphorus allocation in agro-ecosystems of a West African savanna: I. The plant component under semi-permanent cultivation. Agric. Ecosyst. Environ. 2002, 88, 215–232. [Google Scholar] [CrossRef]
  23. Ardö, J.; Olsson, L. Assessment of soil organic carbon in semi-arid Sudan using GIS and the CENTURY model. J. Arid Environ. 2003, 54, 633–651. [Google Scholar] [CrossRef]
  24. Feral, C.J.W.; Epstein, H.E.; Otter, L.; Aranibar, J.N.; Shugart, H.H.; Macko, S.A.; Ramontsho, J. Carbon and nitrogen in the soil–plant system along rainfall and land-use gradients in southern Africa. J. Arid Environ. 2003, 54, 327–343. [Google Scholar] [CrossRef]
  25. Archer, S.; Boutton, T.W.; McMurtry, C. Carbon And Nitrogen Accumulation in a Savanna Landscape: Field And Modeling Perspectives. In Global Environmental Change in the Ocean and on Land. Available online: https://pdfs.semanticscholar.org/d88c/3335ffe001ccee0d5076b8c8b4aa39ceb2e9.pdf (accessed on 21 October 2018).
  26. Hounkpatin, O.K.L.; de Hipt, F.O.; Bossa, A.Y.; Welp, G.; Amelung, W. Soil organic carbon stocks and their determining factors in the Dano catchment (Southwest Burkina Faso). Catena 2018, 166, 298–309. [Google Scholar] [CrossRef]
  27. Tiessen, H.; Feller, C.; Sampaio, E.; Garin, P. Carbon sequestration and turnover in semiarid savannas and dry forest. Clim. Chang. 1998, 40, 105–117. [Google Scholar] [CrossRef]
  28. Gifford, R.M.; Howden, M. Vegetation thickening in an ecological perspective: Significance to national greenhouse gas inventories. Environ. Sci. Policy 2001, 4, 59–72. [Google Scholar] [CrossRef]
  29. San José, J.J.; Montes, R.A. Management effects on carbon stocks and fluxes across the Orinoco savannas. For. Ecol. Manag. 2001, 150, 293–311. [Google Scholar] [CrossRef]
  30. Woomer, P.L.; Tieszen, L.L.; Tschakert, P.; Parton, W.J.; Touré, A. Landscape Carbon Sampling and Biogeochimical Modelling. A Two-Week Skills Development Workshop Conducted in Senegal. USGS, CSE, 2001. Available online: https://www.researchgate.net/profile/Larry_Tieszen/publication/229037894_Landscape_Carbon_Sampling_and_Biogeochemical_Modeling/links/0fcfd50a2991c39b06000000/Landscape-Carbon-Sampling-and-Biogeochemical-Modeling.pdf (accessed on 14 July 2018).
  31. Sawadogo, L.; Savadogo, P.; Tiveau, D.; Dayamba, S.D.; Zida, D.; Nouvellet, Y.; Oden, P.C.; Guinko, S. Allometric prediction of above-ground biomass of eleven woody tree species in the Sudanian savanna-woodland of West Africa. J. For. Res. 2010, 21, 475–481. [Google Scholar] [CrossRef]
  32. Mbow, C.; Verstraete, M.M.; Sambou, B.; Diaw, A.T.; Neufeldt, H. Allometric models for aboveground biomass in dry savanna trees of the Sudan and Sudan-Guinean ecosystems of Southern Senegal. J. For. Res. 2013, 19, 340–347. [Google Scholar] [CrossRef]
  33. Forkuor, G. Agricultural Land Use Mapping in West Africa Using Multi-sensor Satellite Imagery. Ph.D. Thesis, University of Würzburg, Würzburg, Germany, 2014. [Google Scholar]
  34. Waongo, M. Optimizing Planting Dates for Agricultural Decision-Making under Climate Change over Burkina Faso/West Africa. Ph.D. Thesis, 2015. Available online: https://d-nb.info/1077705913/34 (accessed on 15 July 2018).
  35. Sissoko, K.; van Keulen, H.; Verhagen, J.; Tekken, V.; Battaglini, A. Agriculture, livelihoods and climate change in the West African Sahel. Reg. Environ. Chang. 2011, 11, 119–125. [Google Scholar] [CrossRef]
  36. Sanfo, S. Politiques Publiques Agricoles et Lutte Contre la Pauvreté au Burkina Faso: Le cas de la Région du Plateau Central. Ph.D. Thesis, Paris 1. 2010. Available online: http://agritrop.cirad.fr/558233/1/document_558233.pdf (accessed on 30 August 2018).
  37. Thiombiano, A.; Glèlè-Kakai, R.; Bayen, P.; Boussim, J.I.; Mahamane, A. Méthodes et dispositifs d’inventaires forestiers en Afrique de l’Ouest: État des lieux et propositions pour une harmonisation. Ann. Sci. Agron. 2015, 19, 15–31. [Google Scholar]
  38. Sambaré, O.; Bognounou, F.; Wittig, R.; Thiombiano, A. Woody species composition, diversity and structure of riparian forests of four watercourses types in Burkina Fas. J. For. Res. 2011, 22, 145–158. [Google Scholar] [CrossRef]
  39. Aleza, K.; Wala, K.; Bayala, J.; Villamor, G.B.; Dourma, M.; Atakpama, W.; Akpagana, K. Population structure and regeneration status of Vitellaria Paradoxa (C. F. Gaertner) under different land management regimes in Atacora department, Benin. Agrofor. Syst. 2015, 89, 511–523. [Google Scholar] [CrossRef]
  40. Thiombiano, A.; Schmidt, M.; Dressler, S.; Ouédraogo, A.; Hahn, K.; Zizka, G. Catalogue des plantes vasculaires du Burkina Faso. Boissiera 2012, 65, 1–391. [Google Scholar]
  41. Aynekulu, E.; Vagen, T.-G.; Shephard, K.D.; Winowiecki, L. A Protocol for Modeling, Measurement and Monitoring Soil Carbon Stocks in Agricultural Landscapes. Available online: http://www.worldagroforestry.org/publication/protocol-modeling-measurement-and-monitoring-soil-carbon-stocks-agricultural-landscapes (accessed on 21 October 2018).
  42. Chave, J.; Réjou-Méchain, M.; Búrquez, A.; Chidumayo, E.; Colgan, M.; Delitti, W.; Duque, A.; Eid, T.; Fearnside, P.; Goodman, R.; et al. Improved allometric models to estimate the aboveground biomass of tropical trees. Glob. Chang. Biol. 2014, 20, 3177–3190. [Google Scholar] [CrossRef] [PubMed]
  43. Zanne, A.E.; Lopez-Gonzalez, G.; Coomes, D.A.; Ilic, J.; Jansen, S.; Lewis, S.L.; Miller, R.B.; Swenson, N.G.; Wiemann, M.C.; Chave, J. Global Wood Density Database; University College of London: London, UK, 2009. [Google Scholar]
  44. Réjou-Méchain, M.; Tanguy, A.; Piponiot, C.; Chave, J.; Hérault, B. Biomass: An R Package for Estimating Above-Ground Biomass and Its Uncertainty in Tropical Forests. Methods Ecol. Evol. 2017, 8, 1163–1167. [Google Scholar] [CrossRef]
  45. Takimoto, A.; Nair, P.K.R.; Nair, V.D. Carbon stock and sequestration potential of traditional and improved agroforestry systems in the West African Sahel. Agric. Ecosyst. Environ. 2008, 125, 159–166. [Google Scholar] [CrossRef]
  46. IPCC. Guidelines for National Greenhouse Gas Inventories (Institute for Global Environmental Strategies, Japan, 2006); IPCC: Geneva, Switzerland, 2006. [Google Scholar]
  47. Giorgetta, M.A.; Jungclaus, J.; Reick, C.H.; Legutke, S.; Bader, J.; Böttinger, M.; Brovkin, V.; Crueger, T.; Esch, M.; Fieg, K. Climate and carbon cycle changes from 1850 to 2100 in MPI-ESM simulations for the Coupled Model Intercomparison Project phase 5. J. Adv. Model. Earth Syst. 2013, 5, 572–597. [Google Scholar] [CrossRef] [Green Version]
  48. Fandohan, A.B.; Oduor, A.M.O.; Sodé, A.I.; Wu, L.; Cuni-Sanchez, A.; Assédé, E.; Gouwakinnou, G.N. Modeling vulnerability of protected areas to invasion by Chromolaena odorata under current and future climates. Ecosyst. Health Sustain. 2015, 1, 1–2. [Google Scholar] [CrossRef]
  49. Forkuor, G.; Hounkpatin, O.K.L.; Welp, G.; Thiel, M. High Resolution Mapping of Soil Properties Using Remote Sensing Variables in South-Western Burkina Faso: A Comparison of Machine Learning and Multiple Linear Regression Models. PLoS ONE 2017, 12, e0170478. [Google Scholar] [CrossRef] [PubMed]
  50. Breiman, L. Random Forests. Mach. Learn. 2001, 45, 5–32. [Google Scholar] [CrossRef] [Green Version]
  51. Freeman, E.A.; Moisen, G.G.; Coulston, J.W.; Wilson, B.T. Random forests and stochastic gradient boosting for predicting tree canopy cover: Comparing tuning processes and model performance. Can. J. For. Res. 2016, 46, 323–339. [Google Scholar] [CrossRef]
  52. Forkuor, G.; Dimobe, K.; Serme, I.; Tondoh, J.E. Landsat-8 vs. Sentinel-2: Examining the added value of sentinel-2’s red-edge bands to land-use and land-cover mapping in Burkina Faso. GISci. Remote Sens. 2018, 55, 331–354. [Google Scholar] [CrossRef]
  53. R Core Team. R: A Language and Environment for Statistical Computing; R Core Team: Vienna, Austria, 2015. [Google Scholar]
  54. Zuur, A.F.; Ieno, E.N.; Elphick, C.S. A protocol for data exploration to avoid common statistical problems. Methods Ecol. Evol. 2010, 1, 3–14. [Google Scholar] [CrossRef]
  55. Fournier, A. Cycle saisonnier et production nette de la matière végétale herbacée en savanes soudaniennes pâturées: Les jachères de la région de Bondoukuy (Burkina Faso). Ecologie 1994, 25, 173. [Google Scholar]
  56. Sawadogo, L.; Tiveau, D.; Nygå ard, R. Influence of selective tree cutting, livestock and prescribed fire on herbaceous biomass in the savannah woodlands of Burkina Faso, West Africa. Agric. Ecosyst. Environ. 2005, 105, 335–345. [Google Scholar] [CrossRef]
  57. Knauer, K.; Gessner, U.; Fensholt, R.; Forkuor, G.; Kuenzer, C. Monitoring agricultural expansion in Burkina Faso over 14 years with 30 m resolution time series: The role of population growth and implications for the environment. Remote Sens. 2017, 9. [Google Scholar] [CrossRef]
  58. Zoungrana, B.J.B.; Conrad, C.; Amekudzi, L.K.; Thiel, M.; Da, E.D.; Forkuor, G.; Löw, F. Multi-Temporal Landsat Images and Ancillary Data for Land Use/Cover Change (LULCC) Detection in the Southwest of Burkina Faso, West Africa. Remote Sens. 2015, 7, 12076–12102. [Google Scholar] [CrossRef] [Green Version]
  59. Rodriguez-Galiano, V.F.; Chica-Olmo, M.; Abarca-Hernandez, F.; Atkinson, P.M.; Jeganathan, C. Random Forest classification of Mediterranean land cover using multi-seasonal imagery and multi-seasonal texture. Remote Sens. Environ. 2014, 121, 93–107. [Google Scholar] [CrossRef]
  60. Inglada, J.; Arias, M.; Tardy, B.; Hagolle, O.; Valero, S.; Morin, D.; Dedieu, G.; Sepulcre, G.; Bontemps, S.; Defourny, P.; et al. Assessment of an Operational System for Crop Type Map Production Using High Temporal and Spatial Resolution Satellite Optical Imagery. Remote Sens. 2015, 7, 12356–12379. [Google Scholar] [CrossRef] [Green Version]
  61. Adam, E.; Mutanga, O.; Odindi, J.; Abdel-Rahman, E.M. Land-use/cover classification in a heterogeneous coastal landscape using RapidEye imagery: Evaluating the performance of random forest and support vector machines classifiers. Int. J. Remote Sens. 2014, 35, 3440–3458. [Google Scholar] [CrossRef]
  62. Blin, J.; Sidibe, S. Caractérisation et Amélioration d’un Foyer de Cuisson de” dolo” Équipé d’un Brûleur à Huile Végétale (Jatropha). 2012. Available online: http://agritrop.cirad.fr/577011/1/ID%20577011.pdf (accessed on 7 August 2018).
  63. Dimobe, K.; Wala, K.; Dourma, M.; Kiki, M.; Woegan, Y.; Folega, F.; Batawila, K.; Akpagana, K. Disturbance and Population Structure of Plant Communities in the Wildlife Reserve of Oti-Mandouri in Togo (West Africa). Annu. Res. Rev. Biol. 2014, 4, 2501–2516. [Google Scholar]
  64. Traore, L.; Ouedraogo, I.; Ouedraogo, A.; Thiombiano, A. Perceptions, usages et vulnérabilité des ressources végétales ligneuses dans le Sud-Ouest du Burkina Faso. Int. J. Biol. Chem. Sci. 2011, 5. [Google Scholar] [CrossRef]
  65. Goussanou, C.A.; Guendehou, S.; Assogbadjo, A.E.; Sinsin, B. Application of site-specific biomass models to quantify spatial distribution of stocks and historical emissions from deforestation in a tropical forest ecosystem. J. For. Res. 2018, 29, 205–213. [Google Scholar] [CrossRef]
  66. Madoffe, S.S.; Rija, A.A.; Midtgaard, F.; Katani, J.Z.; Mbeyale, G.; Zahabu, F.; Liwenga, F.; Christopher, B.C. Preliminary Assessment of Forest Structure, Management and Carbon Stocking in Tanzania Miombo Woodland. In Proceedings of the first Climate Change Impacts, Mitigation and Adaptation Programme Scientific Conference, Dar Es Salaam, Tanzania, 2–3 January 2012; pp. 106–117. [Google Scholar]
  67. Ribeiro, N.S.; Matos, C.N.; Moura, I.R.; Washington-Allen, R.A.; Ribeiro, A.I. Monitoring vegetation dynamics and carbon stock density in miombo woodlands. Carbon Balance Manag. 2013, 8, 11. [Google Scholar] [CrossRef] [PubMed] [Green Version]
  68. Dimobe, K.; Ouédraogo, A.; Soma, S.; Goetze, D.; Porembski, S.; Thiombiano, A. Identification of driving factors of land degradation and deforestation in the Wildlife Reserve of Bontioli (Burkina Faso, West Africa). Glob. Ecol. Conserv. 2015, 4, 559–571. [Google Scholar] [CrossRef]
  69. Lindner, A.; Sattler, D. Biomass estimations in forests of different disturbance history in the Atlantic Forest of Rio de Janeiro, Brazil. New For. 2012, 43, 287–301. [Google Scholar] [CrossRef]
  70. Lin, D.; Lai, J.; Yang, B.; Song, P.; Li, N.; Ren, H.; Ma, K. Forest biomass recovery after different anthropogenic disturbances: Relative importance of changes in stand structure and wood density. Eur. J. For. Res. 2015, 134, 769–780. [Google Scholar] [CrossRef]
  71. Qasim, M.; Porembski, S.; Sattler, D.; Stein, K.; Thiombiano, A.; Lindner, A. Vegetation Structure and Carbon Stocks of Two Protected Areas Within the South-Sudanian Savannas of Burkina Faso, West Africa. Environment 2016, 3, 1–16. [Google Scholar] [CrossRef]
  72. Boakye-Danquah, J.; Antwi, E.K.; Saito, O.; Abekoe, M.K. Impact of farm management practices and agricultural land use on soil organic carbon storage potential in the savannah ecological zone of Northern Ghana. J. Disaster Res. 2014, 9, 484–500. [Google Scholar] [CrossRef]
  73. Hien, E.; Ganry, F.; Oliver, R. Carbon sequestration in a savannah soil in southwestern Burkina as affected by cropping and cultural practices. Arid Land Res. Manag. 2006, 20, 133–146. [Google Scholar] [CrossRef]
  74. Lal, R. Carbon sequestration in dryland ecosystems. Environ. Manag. 2004, 33, 528–544. [Google Scholar] [CrossRef] [PubMed]
  75. Kumar, B.M.; Nair, P.R. Carbon Sequestration Potential of Agroforestry Systems: Opportunities and Challenges; Springer Science & Business Media: Berlin, Germany, 2011. [Google Scholar]
  76. Dayamba, S.D.; Djoudi, H.; Zida, M.; Sawadogo, L.; Verchot, L. Biodiversity and carbon stocks in different land use types in the Sudanian Zone of Burkina Faso, West Africa. Agric. Ecosyst. Environ. 2015, 216, 61–72. [Google Scholar] [CrossRef]
  77. Thuiller, W. Patterns and uncertainties of species’ range shifts under climate change. Glob. Chang. Biol. 2004, 10, 2020–2027. [Google Scholar] [CrossRef]
  78. Pittock, B.A. Climate Change: The Science, Impacts and Solutions, 2nd ed.; CSIRO: London, UK, 2009. [Google Scholar]
  79. Harris, N.L.; Brown, S.; Hagen, S.C.; Saatchi, S.S.; Petrova, S.; Salas, W.; Hansen, M.C.; Potapov, P.V.; Lotsch, A. Baseline map of carbon emissions from deforestation in tropical regions. Science 2012, 336, 1573–1576. [Google Scholar] [CrossRef] [PubMed]
  80. Berenguer, E.; Ferreira, J.; Gardner, T.A.; Aragão, L.E.O.C.; De Camargo, P.B.; Cerri, C.E.; Durigan, M.; De Oliveira, R.C.; Vieira, I.C.G.; Barlow, J. A large-scale field assessment of carbon stocks in human-modified tropical forests. Glob. Chang. Biol. 2014, 20, 3713–3726. [Google Scholar] [CrossRef] [PubMed] [Green Version]
  81. Burivalova, Z.; Şekercioğlu, Ç.H.; Koh, L.P. Thresholds of logging intensity to maintain tropical forest biodiversity. Curr. Biol. 2014, 24, 1893–1898. [Google Scholar] [CrossRef] [PubMed]
  82. Metz, B.; Davidson, O.R.; Bosch, P.R.; Dave, R.; Meyer, L.A. Contribution of Working Group III to the Fourth Assessment Report of the Intergovernmental Panel on Climate Change, 2007; Cambridge University Press: Cambridge, UK, 2007. [Google Scholar]
  83. Dimobe, K.; Goetze, D.; Ouédraogo, A.; Forkuor, G.; Wala, K.; Porembski, S.; Thiombiano, A. Spatio-temporal dynamics in land use and habitat fragmentation within a protected area dedicated to tourism in a sudanian savanna of West Africa. J. Landsc. Ecol. 2017, 10, 75–95. [Google Scholar] [CrossRef]
  84. Hannah, L.; Midgley, G.F.; Lovejoy, T.; Bond, W.J.; Bush, M.; Lovett, J.C.; Scott, D.; Woodward, F.I. Conservation of biodiversity in a changing climate. Conserv. Biol. 2002, 16, 264–268. [Google Scholar] [CrossRef]
  85. Zonneveld, M.; van Jarvis, A.; Dvorak, W.; Lema, G.; Leibing, C. Climate change impact predictions on Pinus patula and Pinus tecunumanii populations in Mexico and Central America. For. Ecol. Manag. 2009, 257, 1566–1576. [Google Scholar] [CrossRef]
Figure 1. Map of study area showing the location of training and validation samples.
Land 07 00124 g001
Figure 2. Main land use and land cover category (a) and their proportion (b).
Land 07 00124 g002
Figure 3. The proportion of trees measured per diameter class.
Land 07 00124 g003
Figure 4. Variation of soil organic carbon in top and subsoil across different land use and land cover categories (LULCc).
Land 07 00124 g004
Figure 5. Estimated carbon stock across the different LULCc.
Land 07 00124 g005
Figure 6. Current and future (2070) spatial distribution of the total carbon stock in the Dano catchment according to the MPI-ESM-MR and HadGEM2-ES climate models under RCP 8.5.
Land 07 00124 g006
Figure 7. Suitable areas predicted under current and future climate models.
Land 07 00124 g007
Table 1. Spectral bands, soil and vegetation indices derived from the S-2 data.
Spectral Bands 1234
S-2 Band NameBlue (B)Green (G)Red (R)Near Infra Red (NIR)
Spectral IndicesNameFormulaReferences
Brightness Index (BI)((R2 + G2 + B2)/3)0.5Ray et al., 2004
Saturation Index (SI)(R-B)/(R + B)Ray et al., 2004
Hue Index (HI)(2 ∗ R-G-B)/(G-B)Ray et al., 2004
Coloration Index (CI)(R-G)/(R + G)Ray et al., 2004
Redness Index (RI)R2/(B ∗ G)3Ray et al., 2004
Normalized Difference Vegetation Index (NDVI) N D V I   =   ( N I R     R e d ) ( N I R   +   R e d ) Huete et al., 2002
Enhanced Vegetation Index 2 (EVI2) E V I 2   =   2.5     ( N I R     R e d ) ( N I R   +   2.4 R e d   +   1 ) Jiang et al., 2008
Enhanced Vegetation Index (EVI) V I   =   ( 2.5     ( N I R     R e d ) ( N I R   +   6 R e d     7.5 B l u e   +   1 ) Huete et al., 1997
Soil Adjusted Vegetation Index (SAVI) S A V I   =   ( 1   +   L ) ( N I R     R e d ) ( N I R   +   R e d   +   L ) Huete, 1988
Table 2. Terrain attributes used as predictors for carbon mapping.
VariablesUnit
Aspectdegree
Catchment aream2
Flow direction-
Flow line curvatureDegree·m−1
Plan curvatureDegree·m−1
SlopeRadians/%
Terrain ruggedness-
Topographic wetness index-
Topographic position index-
Total curvatureDegree·m−1
Table 3. Confusion matrix and classification accuracy for 2017 sentinel-2 image.
ClassifiedReferences
Gallery ForestWoodlandTree SavannaShrub SavannaGrass SavannaCroplandBare SoilWater BodySettlementTotal Raw
2017
Gallery forest1110000000021
Woodland658600000070
Tree savannas04233001000238
Shrub savannas0009550000100
Grass savannas0001118000029
Cropland00003186000189
Bare soil000100310234
Water body00000003570357
Settlement0000132006782
Column total1772239107391893135769
Overall accuracy (%)94.29
Kappa coefficient (%)92.95
Table 4. Plant community type characteristics.
Vegetation TypeNo. of PlotsSpecies Richness (S, Species)DBH (cm)Height (m)Tree Density (Tree·ha−1)Basal Area (m2·ha−1)C Stock (Mg·ha−1)
Cropland201436.4 ± 24.210.3 ± 4.432.612.2 ± 4.74.6 ± 1.6
Shrub savanna121312.5 ± 14.04.8 ± 2.61163.2 ± 3.50.9 ± 1.2
Tree savanna153011.6 ± 8.15.7 ± 2.5332.25.2 ± 1.61.6 ± 0.6
Woodland85413.3 ± 10.08.9 ± 4.9773.818.7 ± 6.810.2 ± 6.4
Gallery forest65017.5 ± 16.87.5 ± 4.592021.3 ± 9.97.8 ± 4
Table 5. Mean values (± standard error) of soil organic carbon in different LULCc and soil depths. The mean total carbon stock represents the stock of carbon stored in the plant biomass and in soil in different LULCc.
LULCDepth (cm)SOC (Mg/ha)Mean Total Carbon Stock (Mg·ha−1)
Gallery forest0–2016.7 ± 8.538 ± 17.8
20–5013.5 ± 8.5
Woodland0–2010.4 ± 1.232.2 ± 7.7
20–5011.6 ± 8.4
Tree savanna0–209.9 ± 4.923.0 ± 7.3
20–5011.5 ± 4.5
Shrub savanna0–209.2 ± 4.922.9 ± 7.1
20–5012.9 ± 4.7
Cropland0–206.2 ± 2.219.5 ± 6.3
20–508.7 ± 4.3
Table 6. Mean Absolute Error (MAE), Root-Mean-Squared Error (RMSE), and coefficient of variation (R2) of the validation set.
Evaluation IndexCurrentHadGEM2-ESMPI-ESM-MR
MAE20.3121.1221.22
RMSE12.4113.1012.57
R2 (%)98.9298.6798.40

