Land Use Changes in Iberian Peninsula 1990–2012


Land laboratory (LaboraTe), Department of Agricultural and Forest Engineering, Universidade de Santiago de Compostela, 15782 Santiago de Compostela, Spain
*
Authors to whom correspondence should be addressed.
Land 2018, 7(3), 99; https://doi.org/10.3390/land7030099
Submission received: 8 June 2018
/
Revised: 3 August 2018
/
Accepted: 19 August 2018
/
Published: 20 August 2018
Abstract
:This work aims to provide a comprehensive, wall-to-wall analysis of land use/cover changes in the continental areas of Portugal and Spain between 1990 and 2012. This overall objective is developed into two main research questions: (1) Whether differences between the extent and prevalence of changes exist between both countries and (2) which are the hotspots of change (areas where a given land use/cover transition dominates the landscape) in each country. We used Corine Land Cover in three different points in time (1990, 2000, 2012) to explore eight characteristic land cover transitions and carried out a cluster analysis at LAU2 level (municipalities in Spain, parishes in Portugal) that allowed to identify the areas in which each transition was dominant. The main findings include the decline of agricultural area and the increase of urbanized and artificial covers in both countries, but different trends followed by forest cover, with an increase in Spain and a decrease in Portugal. At the same time, the spatial analysis provided an overview of the main gradients of change related to tensions between agricultural intensification–extensification, on the one hand, and deforestation–afforestation, on the other.
1. Introduction
In the turn of the twentieth century, major land use/cover changes took place in Europe. Among their known drivers were societal changes affecting mountain communities, globalization and major policy/institutional changes, such as the collapse of former socialist regimes and the reforms of the European Common Agricultural Policy [1,2,3]. These transformations have affected most of the more common (in terms of area) land uses/covers, but abandonment of farmland is probably the change that affected a larger area in the European landscapes [4]. For the most part, land use/cover changes are the most visible face of a constant trend of adjustment followed by land systems that also encompasses changes in land use intensity. Although the first could be said to be more drastic and reflect in more important changes in the levels of goods and services provided by the landscape, the latter are arguably more silent but also relevant. Nevertheless, published evidence suggests that land use intensity has become rather stable in Europe [5] or that, at least, input and output intensity in the farming sector are increasingly decoupled [6]. Occupation of former agricultural land by urbanization is also a matter of concern [7].
With regard to the implications derived from the adjustment of agricultural land uses, these are usually coupled to environmental and landscape-type risks [8,9]. Intensification of agricultural practices is known to be linked to the use of pesticides and fertilizers, locally increasing the levels of human appropriation of net primary production (HANPP) [10] and favoring the degradation of soils that are increasingly technological [2,6]. In the areas of southern Europe this is often associated to overexploitation of water resources and the advance of desertification [11]. On the contrary, the decrease in productive capacity and the marginalization of remote areas [3,12] has caused a general increase in biomass [13] which often couples to increased risk of wildfires [14,15]. Agricultural extensification and eventual abandonment of previously cultivated farmland is also closely related to the loss of traditional agricultural systems, structures and practices in the countryside, mostly affecting agrarian landscapes and the economic sustainability of certain regions [4,16].
Very much related to what happened to agricultural areas, forest cover has increased steadily in most European Member States [17,18,19]. Nevertheless, deforestation can be still locally important as a result of forest fires in southern countries such as, for example, Spain, France, Portugal, Croatia or Greece [15,20,21]. Human pressure has increased forest fragility [22], but in spite of active logging and extreme climatic events, forest biomass is on the rise in these countries, also contributing to the risk of wildfires [23].
The relative importance of these and other land use/cover changes varies among different countries in the European Union. For example, urbanization processes show the highest ratios in and around the so-called “European pentagon” (Holland, Belgium, Germany and France), with the Iberian Peninsula, Italy and Ireland in a second level and the lowest rates of urbanization in Eastern and South-Eastern countries [17,24]. On the other hand, the Baltic countries, Ireland, Hungary, Spain and Portugal present high rates of agricultural intensification and extensification, showing a much stronger tension than other parts of the continent [2,6]. Areas most affected by marginalization of agriculture are often linked to mountain areas, inland areas of East Europe and the Mediterranean areas [3,12,25].
Encompassing two biogeographic regions, large mountainous areas, several major metropolitan areas and a large variety of agricultural systems, the Iberian Peninsula is an excellent study area for land use/cover change research. In the last decades, a very relevant expansion of greenhouse agriculture [26] has coexisted with the extensification and eventual abandonment of extensive farming systems [27,28,29,30,31]. Intensive afforestation projects have increased the area of forest plantations for wood and pulp production [15,32,33], but this was simultaneous with spontaneous vegetation encroachment where agricultural frontier retreated. Urbanization took place at a relevant pace [31], but very often concentrated in a strip of land very close to the coast [30,34,35,36].
The aim of this work is to provide a comprehensive, wall-to-wall analysis of land use/cover changes in the continental areas of Portugal and Spain (583.118 km2) between 1990 and 2012. This overall objective is related to two main research questions: (1) Whether differences between the extent and importance of changes exist between both countries; and (2) which are the hotspots of change in each country. For the purposes of this work, we defined hotspots as areas where a given land use/cover transition dominates the landscape and covers a large proportion of total area.
2. Materials and Methods
The main data sources for this study are the 1990, 2000 and 2012 editions of the Corine Land Cover (CLC) project downloaded from the Spanish National Geographic Institute (Instituto Geográfico Nacional) and from the Portuguese Territorial General Directorate (Direçao Geral do Território). The cartographic scale of the original maps is 1:100.000 and the area of the minimum mapping unit is 25 hectares. All the subsequent analyses were carried out in raster format using a spatial resolution of 25 m × 25 m, GRASS GIS 7 [37] and the R project for statistical computing [38]. We reclassified the original level 3 CLC legend (44 different categories) into a simplified system with two levels (L1 and L2) and 12 and 6 categories, respectively (Table 1). The reclassification is intended to focus on covers that are managed for productive purposes. Accordingly, different subcategories (L1) were kept for different types of agricultural and forest areas, as changes between these often indicate changes in the intensity with which they are used. We used the resulting maps to produce simple transition matrixes in order to produce a first assessment, in terms of total area occupied, of net changes and transitions among categories.
After the first assessment, we classified all the observed changes into a set of 8 land use/cover transitions (LCT, Figure 1), following a similar approach to Feranec et al. (2010) [15]: Afforestation (LCT1), Conversion to agriculture (LCT2), Farmland abandonment (LCT3), Agricultural extensification (LCT4), Deforestation (LCT5), Change of forest composition (LCT6), Agricultural intensification (LCT7), Urbanization (LCT8). A similar approach has also been used for the Spanish case by Martínez-Fernández et al. (2015) [39]. These LCT are intended to capture the main gradients of change that are present in the area of study and, accordingly, some of them represent opposite trends (e.g., LCT1 and LTC5, LCT4 and LCT7), while others may take place sequentially in time (e.g., LCT3 often represents the last stages of LCT4).
In order to identify the regions within the study area where each LCT (or combination of several LCT) is more important in terms of the area it occupies, we calculated the proportion of area that each of the eight LCT represented in each LAU-2 unit along the whole period 1990–2012. We used this information to perform a cluster analysis on the eight LCT variables, so we could divide the 12,099 LAU-2 units in the study area into a number of homogenous groups of municipalities/parishes with similar patterns of land cover transition. We used Ward’s minimum variance method (a hierarchical clustering method) on the Euclidean distance among observations. Each resulting cluster was then described regarding the land cover transition/s that account for the largest share in terms of area. We assume a cluster of municipalities/parishes in which a given LCT is dominant as a hotspot of that given transition.
3. Results
3.1. Net Changes
The occupation data for the entire peninsular territory (Table 2; detailed results for each country in Table A1 and Table A2) suggests that around 65.5% (381.924 km2) of its total area has not undergone any changes at L1 level over the 1990–2012 period. If we look at each State separately, the Spanish territory seems to have been subjected to slightly more changes (36.6% of its area underwent some kind of change at L1 level) than Portugal (22.4%).
Overall, agricultural areas occupy the largest share in the Iberian Peninsula, covering almost 50% of total area for the whole period. Although they showed a slight decline (from 50.22% in 1990 to 47.26% in 2012), this concentrated on some of the L1 classes of Dehesa/Montado, rainfed and permanent crops, while irrigated crops and pastures experienced a slight increase over the same period that was not enough to compensate for the losses of other agricultural categories. The loss of agricultural land appeared to be slightly more pronounced in Spanish territory than in Portugal.
Following the opposite trend, forest area expanded over the same period and went from 19.73% of total area in 1990 to 22.17% in 2012. This expansion seemed to be concentrated in the 2000–2012, as the period 1990–2000 showed larger stability of forest area. Hardwood forests showed the largest increase, followed by coniferous forests (which underwent a slight decrease during the first ten years that was more than compensated by the area gained during 2000–2012). The trends in Spain and Portugal, nevertheless, appeared to be clearly different. Forest area in continental Spain increased from 18.4% in 1990 to 22.1% in 2012, while in continental Portugal went from 27.0 to 22.6%.
Shrublands appeared as the second L2 category in terms of total area in the Iberian Peninsula (26.6%), and remained largely stable along the whole period. Again, they seem to have followed opposite trends in both countries, from 28.6% in 1990 to 26.8% in 2012 in Spain and from 20.3% to 25.5% in Portugal. Built (impervious) areas, while occupying much less area in total, showed a relatively important increase in both countries.
3.2. Land Use/Cover Transitions
In this section we focus on the relative importance, in terms of area, of the land cover transitions (LCT) as defined in the methodology. Results suggest that the changes that took place in 1990–2000 were much more limited than those occurred in 2000–2012 (Table 3). Accordingly, we will briefly comment the results based on the relative importance of each LCT, for the whole Iberian Peninsula, in 2000–2012.
The most important transition in the Iberian Peninsula, in both periods, was LCT1 (afforestation). Results indicate that this process was more intense in Portugal in 1990–2000, but that since then changed and affected a larger share of total area in Spain in 2000–2012. Agricultural intensification (LCT7) appeared as the second largest process in terms of the share of area affected (a total of 5.18% of the Peninsula in 2000–2012). Again, results suggest that this process affected more area in 2000–2012 than in 1990–2000, and appears to have been much more important in Spain than in Portugal.
On a third level (in 2000–2012) are LCT2 (conversion to agricultural use) and LCT3 (abandonment of agricultural use). Both appeared to occupy slightly more than 4% of total area in the Iberian Peninsula in 2000–2012, and be considerably more important in Spain than in Portugal. These transitions are closely followed by LCT4 (extensification of agricultural use), LCT5 (deforestation) and LCT6 (change of forest composition), which occupied around 3–4% of the Iberian Peninsula in 2000–2012. Of these three, only LCT5 (deforestation) occupied a largest share in Portugal.
The last process in terms of the proportion of area occupied is LCT8 (urbanization/increase of impervious surface). This seemed to have been more important in Portugal than in Spain in 1990–2000, but affected a larger share of area in Spain in 2000–2012.
3.3. Cluster Analysis
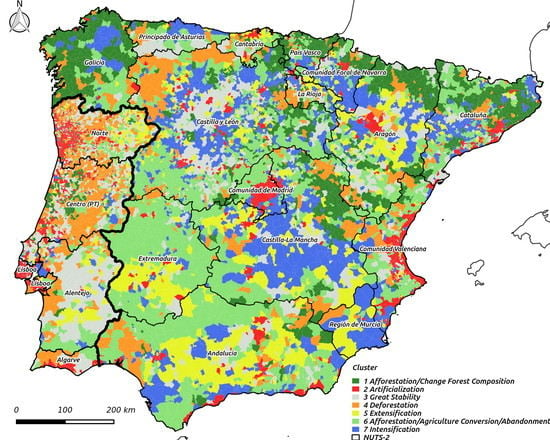
The results of the cluster analysis allowed to identify seven distinct groups of municipalities/parishes, internally homogeneous in terms of the relative importance of land use/cover transitions (LCT) along the whole period of study (Figure 2 and Figure 3). Along the following lines we will shortly describe the main processes in each group (detailed averages of area occupied by each LCT in each group of municipalities/parishes are shown in Table A3).
Cluster 1 combines municipalities in which more than 45% of area was transformed. For the most part, this is explained by the expansion of forests (LCT1), covering an average of 13.7% of municipal/parish area, and internal changes in forests (LCT6, 17.46% of municipal/parish area). Municipalities in cluster 1 are mainly located in the Spanish regions of Galicia, Euskadi (Basque Country), Aragon and Catalunya.
Cluster 2 is formed by municipalities that experienced a large increase of urban areas (an average of 12.90% of municipal/parish area). While some of them are scattered along the whole Iberian Peninsula, some clear concentrations can be identified around the main cities (e.g., Madrid, Lisbon, Barcelona, Zaragoza, Valencia, Porto).
Cluster 3 is formed by municipalities with the highest degree of stability along the twenty-two years of study, as only an average of 11% of municipal/parish area was modified. There is a slight tendency towards afforestation, though, as this showed slightly higher values than deforestation.
Cluster 4 is formed by municipalities with the highest rates of deforestation (16.9% on average). Many of these areas are located in Portugal, where they occupy a large proportion of the total area along interior areas North of Tejo (Tajo) river and coastal areas to the South. Nevertheless, clear hotspots can be also appreciated in Spain, particularly in the Northwest of Castilla y León region or in the province of Huelva in Andalucía.
Cluster 5 is formed by municipalities that experienced high rates of agricultural extensification (15.17% of municipal area, on average). Agricultural intensification and other land use/cover transitions are also present in these areas, albeit in a lower scale. Many of the municipalities/parishes in this cluster appear in the Spanish regions of Andalucia and Extremadura and the Portuguese region of Alentejo, although some are also present in other regions.
Cluster 6 gathers municipalities in which afforestation played a large role (11.09% of municipal area on average), but which also show an interesting tension between conversion of natural and semi-natural areas for agriculture (LCT2, representing on average 7.2% of municipal/parish area) and farmland abandonment (LCT3, 6.78%). The largest area formed by these municipalities is located in the Spanish region of Extremadura and the western portion of Castilla la Mancha.
Finally, land use/cover transitions in cluster 7 appear clearly dominated by agricultural intensification (LCT7, 21.01%), even though afforestation, agricultural extensification and farmland abandonment are also present in the range of 4–5% of municipal/parish area. Along with cluster 1, cluster 7 includes municipalities with the highest amount of changes (affecting around 43% of the municipal/parish area). Areas in this cluster appear in several Spanish regions, mostly in the Eastern portion of the country.
4. Discussion
It is likely that the period of time covered by this study has been one of very substantial changes. Some authors suggest that the institutional change represented by the access of Portugal and Spain to the European Economic Community in 1986 greatly accelerated the effects of social and technological transformations of the second half of the twentieth century [40].
The results obtained are in line with the findings of works already published on land use/cover changes in Spain and Portugal. These have pointed out the existence of natural regeneration of forest areas and afforestation in several areas of Spain, such as Galicia [40], Pyrenees [20], Central and Iberian System [41,42], as well as in Portugal [32]. Many of the cited studies coincide with areas corresponding to clusters 1 and 6, which we identified in this work as hotspots of forest expansion. Although probably initiated earlier, forest expansion may have increased after the access of both countries to the European Economic Community in 1986, as a consequence of policy and market changes that accelerated the transformation of the agricultural sector, including afforestation measures under Regulation (EC) 2080/92 [15,43]. On the other hand, the net reduction of forest area in Portugal is also consistent with published literature [19,21], is largely concentrated in areas included in cluster 4 and may be related to the extent and recurrence of forest fires [44].
Another process commonly registered by European literature is agricultural extensification and eventual abandonment of agricultural activity [3,25]. In Spain, it has been documented in many areas included in clusters 5 and 6. For example, in the Pyrenees and Ebro Depression [45,46], Andalucía [47], and Murcia [26]. On the contrary, productive intensification would concentrate in areas included in cluster 7. This distribution is consistent with the expansion of irrigated greenhouse crops in where the highest rates appear in coastal areas [26,48] and the main river basins [49].
Another one of the most researched processes is urbanization and the increase in impervious surface. However, oftentimes the sprawl occurs diffusely [30,34,50] and it is therefore difficult to quantify using data sources as CLC. This process is well represented in cluster 2, including municipalities near the main metropolitan areas and Mediterranean coastal areas in both countries.
As far as forests composition is concerned, a shortcoming of the original level-three CLC data is the inability to tell apart different types of hardwood forests. The original category 311 (“Broad-leaved forests”) includes both fast growing species, most typically included in genus Eucalyptus, and slow growing native species. Considering that the origin of new stands is usually different in both groups (very often human made plantations in the former, spontaneous encroachment in the latter) and that their environmental value is also quite different, it would have been nice to be able to classify them in separate categories. A related difficulty is associated with the size of the minimum mapped area in the original data (25 ha), that is often much larger than the average plot size in the highly fragmented landscapes of the northern and northwestern parts of the Iberian Peninsula [27,51]. Particularly when considering the original level-three CLC class 313 (“Mixed forests”), this means that many patches are not necessarily “mixed forests” in strict sense, but a spatial mixture of small homogeneous forest stands [13]. The mosaic structure of many landscapes in the Mediterranean basin makes it difficult to assess changes using relatively coarse datasets such as CLC.
Finally, results suggest a very small quantity of changes between 1990 and 2000 in Spain, compared to what is found in Portugal during the same period [52], and specially compared to what is found for both countries in 2000–2012. We were concerned that this may be due to quality problems of the original data for the year 2000 (most likely) or the year 1990 which would result in an inability to adequately capture changes between both years, particularly in Spanish territory. Our efforts to carry out a cluster analysis using the land use/cover transitions of both time periods provided unsatisfactory results, and results improved greatly when we opted to use transitions over 1990–2012 as the input data for the cluster analysis. However, another explanation could be related to changes in the methodology of CLC 2012 in comparison with the one used in previous editions, as the Spanish version of CLC12 was produced by generalization of more detailed, already existing, land use/cover maps, instead of manual photointepretation [53].
5. Conclusions
The general image provided by our results indicates that peninsular territory has been subjected to intense processes of change as a result of the cultural, social and institutional changes of recent decades. The decline of agricultural area and the increase of urbanized and artificial covers appear as common trends in the continental territory of both Portugal and Spain. The trends followed by forest cover, nevertheless, appear as opposite—an increase in Spain but a decrease in Portugal. At the same time, the spatial analysis allowed to provide an overview of the main gradients of change related to tensions between agricultural intensification–extensification, on the one hand, and deforestation–afforestation, on the other. The result of the spatial cluster analysis also allowed to identify the hotspots of the aforementioned processes.
Author Contributions
Conceptualization, E.C.-R. and D.F.-N.; Formal Analysis, D.F.-N.; Validation, E.C.-R.; Writing-Original Draft Preparation, D.F.-N.; Writing-Review & Editing, E.C.-R. and D.F.-N.; Visualization, E.C.-R. and D.F.-N.
Funding
This research received no external funding.
Conflicts of Interest
The authors declare no conflict of interest.
Appendix A

Table A1.
Results: area of L1 and L2 classes in Spain in 1990, 2000 and 2012.
| Land Use/Cover | 1990 | 2000 | 2012 | |||
|---|---|---|---|---|---|---|
| km2 | % | km2 | % | km2 | % | |
| Irrigated crops | 21,054 | 4.26 | 23,501 | 4.76 | 25,577 | 5.18 |
| Rainfed crops | 102,220 | 20.70 | 98,559 | 19.96 | 99,154 | 20.08 |
| Pastures | 6299 | 1.28 | 6225 | 1.26 | 8584 | 1.74 |
| Permanent crops | 71,446 | 14.47 | 72,574 | 14.70 | 62,162 | 12.59 |
| Dehesas | 48,347 | 9.79 | 48,887 | 9.90 | 38,316 | 7.76 |
| (Agricultural areas) | 249,366 | 50.51 | 249,745 | 50.58 | 233,793 | 47.36 |
| Hardwood forest | 37,600 | 7.62 | 37,794 | 7.65 | 50,663 | 10.26 |
| Coniferous forest | 38,900 | 7.88 | 38,384 | 7.77 | 44,691 | 9.05 |
| Mixed forest | 14,403 | 2.92 | 14,894 | 3.02 | 13,738 | 2.78 |
| (Forest area) | 90,903 | 18.41 | 91,072 | 18.45 | 109,093 | 22.10 |
| Shrubland | 141,531 | 28.67 | 139,043 | 28.16 | 132,534 | 26.85 |
| Unproductive | 2015 | 0.41 | 1993 | 0.40 | 2263 | 0.46 |
| Wetlands and water bodies | 3768 | 0.76 | 4149 | 0.84 | 4228 | 0.85 |
| Artificial Surface | 6139 | 1.24 | 7721 | 1.56 | 11,811 | 2.39 |
Table A2.
Results: area of L1 and L2 classes in Portugal in 1990, 2000 and 2012.
| Land Use/Cover | 1990 | 2000 | 2012 | |||
|---|---|---|---|---|---|---|
| km2 | % | km2 | % | km2 | % | |
| Irrigated crops | 1935 | 2.16 | 2596 | 2.90 | 2662 | 2.98 |
| Rainfed crops | 10,954 | 12.25 | 10 228 | 11.44 | 8555 | 9.56 |
| Pastures | 547 | 0.61 | 423 | 0.47 | 803 | 0.90 |
| Permanent crops | 16,264 | 18.19 | 16,070 | 17.97 | 15,741 | 17.60 |
| Dehesas | 13,772 | 15.40 | 13,346 | 14.93 | 14,004 | 15.67 |
| (Agricultural areas) | 43,471 | 48.62 | 42,663 | 47.71 | 41,765 | 46.71 |
| Hardwood forest | 10,604 | 11.86 | 11,263 | 12.60 | 10,322 | 11.54 |
| Coniferous forest | 7897 | 8.83 | 7116 | 7.96 | 4825 | 5.40 |
| Mixed forest | 5637 | 6.30 | 5475 | 6.12 | 5065 | 5.66 |
| (Forest area) | 24,139 | 27.00 | 23,854 | 26.68 | 20,211 | 22.60 |
| Shrubland | 18,160 | 20.31 | 18,488 | 20.68 | 22,488 | 25.15 |
| Unproductive | 351 | 0.39 | 351 | 0.39 | 100 | 0.11 |
| Wetlands and water bodies | 1173 | 1.31 | 1218 | 1.36 | 1485 | 1.67 |
| Artificial Surface | 2123 | 2.37 | 2834 | 3.17 | 3361 | 3.76 |
Table A3.
Average percentages of area affected by LCT for the municipalities in each group, 1990–2012.
Table A3.
Average percentages of area affected by LCT for the municipalities in each group, 1990–2012.
| Cluster | LCT1 | LCT2 | LCT3 | LCT4 | LCT5 | LCT6 | LCT7 | LCT8 |
|---|---|---|---|---|---|---|---|---|
| 1 | 13.71 | 2.75 | 2.09 | 1.81 | 2.88 | 17.46 | 3.39 | 1.71 |
| 2 | 1.96 | 2.24 | 1.38 | 2.70 | 2.60 | 1.01 | 1.39 | 12.90 |
| 3 | 2.22 | 1.12 | 1.62 | 1.76 | 1.43 | 0.73 | 1.75 | 0.50 |
| 4 | 4.83 | 1.95 | 2.47 | 2.14 | 16.89 | 3.79 | 1.54 | 0.68 |
| 5 | 3.14 | 3.84 | 3.60 | 15.17 | 0.96 | 0.64 | 4.94 | 1.36 |
| 6 | 11.09 | 7.21 | 6.78 | 2.26 | 2.50 | 1.21 | 2.21 | 0.82 |
| 7 | 5.93 | 3.59 | 5.19 | 4.03 | 0.96 | 0.64 | 21.01 | 2.06 |
References
- Meyfroidt, P.; Lambin, E.F.; Erb, K.H.; Hertel, T.W. Globalization of Land Use: Distant Drivers of Land Change and Geographic Displacement of Land Use. Curr. Opin. Environ. Sustain. 2013, 5, 438–444. [Google Scholar] [CrossRef]
- Van Vliet, J.; de Groot, H.L.F.; Rietveld, P.; Verburg, P.H. Manifestations and Underlying Drivers of Agricultural Land Use Change in Europe. Landsc. Urban Plan. 2015, 133, 24–36. [Google Scholar] [CrossRef]
- Lasanta, T.; Arnáez, J.; Pascual, N.; Ruiz-Flaño, P.; Errea, M.P.; Lana-Renault, N. Space–Time Process and Drivers of Land Abandonment in Europe. Catena 2017, 149, 810–823. [Google Scholar] [CrossRef]
- Plieninger, T.; Draux, H.; Fagerholm, N.; Bieling, C.; Bürgi, M.; Kizos, T.; Kuemmerle, T.; Primdahl, J.; Verburg, P.H. The Driving Forces of Landscape Change in Europe: A Systematic Review of the Evidence. Land Use Policy 2016, 57, 204–214. [Google Scholar] [CrossRef]
- Van der Sluis, T.; Pedroli, B.; Kristensen, S.B.P.; Lavinia Cosor, G.; Pavlis, E. Changing Land Use Intensity in Europe-Recent Processes in Selected Case Studies. Land Use Policy 2016, 57, 777–785. [Google Scholar] [CrossRef]
- Levers, C.; Butsic, V.; Verburg, P.H.; Müller, D.; Kuemmerle, T. Drivers of Changes in Agricultural Intensity in Europe. Land Use Policy 2016, 58, 380–393. [Google Scholar] [CrossRef]
- Van Vliet, J.; Eitelberg, D.A.; Verburg, P.H. A Global Analysis of Land Take in Cropland Areas and Production Displacement from Urbanization. Glob. Environ. Chang. 2017, 43, 107–115. [Google Scholar] [CrossRef]
- De Chazal, J.; Rounsevell, M.D.A. Land-Use and Climate Change within Assessments of Biodiversity Change: A Review. Glob. Environ. Chang. 2009, 19, 306–315. [Google Scholar] [CrossRef]
- Verburg, P.H.; Crossman, N.; Ellis, E.C.; Heinimann, A.; Hostert, P.; Mertz, O.; Nagendra, H.; Sikor, T.; Erb, K.H.; Golubiewski, N. Land System Science and Sustainable Development of the Earth System: A Global Land Project Perspective. Anthropocene 2015, 12, 29–41. [Google Scholar] [CrossRef] [Green Version]
- Haberl, H.; Erb, K.H.; Krausmann, F.; Gaube, V.; Bondeau, A.; Plutzar, C.; Gingrich, S.; Lucht, W.; Fischer-Kowalski, M. Quantifying and mapping the human appropriation of net primary production in earth’s terrestrial ecosystems. PNAS 2007, 104, 12942–12947. [Google Scholar] [CrossRef] [PubMed]
- Turpin, N.; ten Berge, H.; Grignani, C.; Guzmán, G.; Vanderlinden, K.; Steinmann, H.H.; Siebielec, G.; Spiegel, H.; Perret, E.; Ruysschaert, G.; et al. An Assessment of Policies Affecting Sustainable Soil Management in Europe and Selected Member States. Land Use Policy 2017, 66, 241–249. [Google Scholar] [CrossRef]
- MacDonald, D.; Crabtree, J.R.; Wiesinger, G.; Dax, T.; Stamou, N.; Fleury, P.; Gutierrez Lazpita, J.; Gibon, A. Agricultural Abandonment in Mountain Areas of Europe: Environmental Consequences and Policy Response. J. Environ. Manag. 2000, 59, 47–69. [Google Scholar] [CrossRef]
- Ellis, E.C. Sustaining biodiversity and people in the world’s anthropogenic biomes. Environ. Sustain. 2013, 5, 368–372. [Google Scholar] [CrossRef]
- Viedma, O.; Moity, N.; Moreno, J.M. Changes in Landscape Fire-Hazard during the Second Half of the 20th Century: Agriculture Abandonment and the Changing Role of Driving Factors. Agric. Ecosyst. Environ. 2015, 207, 126–140. [Google Scholar] [CrossRef]
- Lomba, A.; Vicente, J.; Moreira, F.; Honrado, J. Effects of Multiple Factors on Plant Diversity of Forest Fragments in Intensive Farmland of Northern Portugal. For. Ecol. Manag. 2011, 262, 2219–2228. [Google Scholar] [CrossRef]
- Meyfroidt, P.; Lambin, E.F. Global Forest Transition: Prospects for an End to Deforestation. Ann. Environ. Resour. 2011, 36, 343–371. [Google Scholar] [CrossRef]
- Feranec, J.; Jaffrain, G.; Soukup, T.; Hazeu, G. Determining Changes and Flows in European Landscapes 1990–2000 Using CORINE Land Cover Data. Appl. Geogr. 2010, 30, 19–35. [Google Scholar] [CrossRef]
- Lindner, M.; Maroschek, M.; Netherer, S.; Kremer, A.; Barbati, A.; Garcia-Gonzalo, J.; Seidl, R.; Delzon, S.; Corona, P.; Kolström, M.; et al. Climate Change Impacts, Adaptive Capacity, and Vulnerability of European Forest Ecosystems. For. Ecol. Manag. 2010, 259, 698–709. [Google Scholar] [CrossRef]
- Oliveira, T.M.; Guiomar, N.; Baptista, F.O.; Pereira, J.M.C.; Claro, J. Is Portugal’s Forest Transition Going up in Smoke? Land Use Policy 2017, 66, 214–226. [Google Scholar] [CrossRef]
- Badia, A.; Pèlachs, A.; Vera, A.; Tulla, A.; Soriano, J. Cambios En Los Usos y Cubiertas Del Suelo y Los Efectos En La Vulnerabilidad En Las Comarcas de Montaña de Cataluña.Del Rol Del Fuego Como Herramienta de Gestión a Los Incendios Como Amenaza. Pirineos Revista de Ecología de Montaña 2014, 169, 1–13. [Google Scholar] [CrossRef]
- Viedma, O.; Moreno, J.M.; Güngöroglu, C.; Cosgun, U.; Kavgacı, A. Recent Land-Use and Land-Cover Changes and Its Driving Factors in a Fire-Prone Area of Southwestern Turkey. J. Environ. Manag. 2017, 197, 719–731. [Google Scholar] [CrossRef] [PubMed]
- Martinez del Castillo, E.; García-Martin, A.; Longares Aladrén, L.A.; de Luis, M. Evaluation of Forest Cover Change Using Remote Sensing Techniques and Landscape Metrics in Moncayo Natural Park (Spain). Appl. Geogr. 2015, 62, 247–255. [Google Scholar] [CrossRef]
- Tasser, E.; Leitinger, G.; Tappeiner, U. Climate Change versus Land-Use Change—What Affects the Mountain Landscapes More? Land Use Policy 2017, 60, 60–72. [Google Scholar] [CrossRef]
- Irwin, E.G.; Bockstael, N.E. The Evolution of Urban Sprawl: Evidence of Spatial Heterogeneity and Increasing Land Fragmentation. Proc. Natl. Acad. Sci. USA 2007, 104, 20672–20677. [Google Scholar] [CrossRef] [PubMed]
- Estel, S.; Kuemmerle, T.; Alcántara, C.; Levers, C.; Prishchepov, A.; Hostert, P. Mapping Farmland Abandonment and Recultivation across Europe Using MODIS NDVI Time Series. Remote Sens. Environ. 2015, 163, 312–325. [Google Scholar] [CrossRef]
- Romero Díaz, A.; Martínez Hernández, C.; Belmonte Serrato, F. Cambios de Usos Del Suelo En La Región de Murcia. El Almendro Como Cultivo de Referencia y Su Relación Con Los Procesos de Erosión. Nimbus 2012, 29–30, 607–626. [Google Scholar]
- Pinto-Correia, T.; Mascarenhas, J. Contribution to the Extensification/Intensification Debate: New Trends in the Portuguese Montado. Landsc. Urban Plan. 1999, 46, 125–131. [Google Scholar] [CrossRef]
- Fanlo, R.; Chocarro, C.; Baches, X.; Masip, G. Cambios de Uso Del Suelo En Los Últimos 50 Años En Un Valle Pirenaico. Pastos 2004, 34, 33–46. [Google Scholar]
- Sarria, F.; Castillo, F.; García, F. Análisis Temporal de Los Cambios de Usos Del Suelo En La Cuenca Del Segura Mediante Teledetección. Implicaciones Sobre La Degradación. Cuaternario Geomorf. 2010, 24, 71–86. [Google Scholar]
- Serra, P.; Vera, A.; Francesc, A.; Salvati, L. Beyond urban-rural dichotomy: Exploring socioeconomic and land-use processes of change in Spain (1991–2011). Appl. Geogr. 2014, 55, 71–81. [Google Scholar] [CrossRef]
- Corbelle Rico, E.; Crecente Maseda, R. Urbanización, Forestación e Abandono. Cambios Recentes Na Paisaxe de Galicia, 1985–2005. Rev. Galega Econ. 2016, 23, 35–51. [Google Scholar]
- Jones, N.; de Graaff, J.; Rodrigo, I.; Duarte, F. Historical Review of Land Use Changes in Portugal (before and after EU Integration in 1986) and Their Implications for Land Degradation and Conservation, with a Focus on Centro and Alentejo Regions. Appl. Geogr. 2011, 31, 1036–1048. [Google Scholar] [CrossRef]
- Guaita, N.; López, I.; Fidalgo, P.; Jiménez, L.; Moreira, J.; Prieto, F.; Reyes, J.; Martín, A. Cambios de Ocupación del suelo en España. Implicaciones Para La Sostenibilidad (OSE); Mundiprensa Libros: Castelló, Madrid, 2006; p. 483. [Google Scholar]
- Aguilera Benavente, F.; Botequilha-Leitão, A. Selección de Métricas de Paisaje Mediante Análisis de Componentes Principales Para La Descripción de Los Cambios de Uso y Cobertura Del Suelo Del Algarve, Portugal. GeoFocus 2012, 12, 93–121. [Google Scholar]
- Membrado Tena, J.C. Siose Valencia 2005: Resultados, Aplicaciones y Comparación Con Corine. Cuad. Geogr. 2011, 89, 1–22. [Google Scholar]
- Valera Lozano, A.; Añó Vidal, C.; Sánchez Díaz, J. Medio Siglo (1956–2005) de Crecimiento Urbano y Pérdida de Suelo En El Litoral Mediterráneo Español. El Entorno Metropolitano de Alacant-Elx. In Documents d’Anàlisi Geogràfica; Departament de Geografia, Universitat Autònoma de Barcelona: Barcelona, Spain, 2013; Volume 59, pp. 291–312. [Google Scholar]
- GRASS Development Team. Geographic Resources Analysis Support System (GRASS). Software, Version 7.2.0. Open Source Geospatial Foundation. 2016. Available online: http://grass.osgeo.org (accessed on 14 March 2018).
- R Developmmento Core Team. A Language and Environment for Statistical Computing. R Foundation for Statistical Computing, Vienna, Austria. 2016. Available online: http://www.R-project.org (accessed on 14 March 2018).
- Martínez-Fernández, J.; Ruiz-Benito, P.; Zavala, M.A. Recent Land Cover Changes in Spain across Biogeographical Regions and Protection Levels: Implications for Conservation Policies. Land Use Policy 2015, 44, 62–75. [Google Scholar] [CrossRef]
- Corbelle-Rico, E.; Butsic, V.; Enríquez-García, M.J.; Radeloff, V.C. Technology or Policy? Drivers of Land Cover Change in Northwestern Spain before and after the Accession to European Economic Community. Land Use Policy 2015, 45, 18–25. [Google Scholar] [CrossRef]
- Gallardo, M.; Gómez, I.; Vilar, L.; Martínez-Vega, J.; Martín, M.P. Impacts of Future Land Use/Land Cover on Wildfire Occurrence in the Madrid Region (Spain). Reg. Environ. Chang. 2016, 16, 1047–1061. [Google Scholar] [CrossRef]
- Martínez Fernández, J.; Sánchez Martín, N.; Celaya Irigoyen, L. Evolución de La Cubierta Forestal de La Cuenca Del Duero: Análisis Multitemporal Mediante Teledetección. In Tecnologías de la Información para Nuevas Formas de ver el Territorio, Proceedings of the XVI Congreso Nacional de Tecnologías de la Información Geográfica, en Alicante. Madrid, 25–27 July 2014; Universitat d´ Alacant/Universidad de Alicante: Alicante, Spain, 2014; Volume 4, pp. 47–54. [Google Scholar]
- Montiel, M.C.; Galiana, M.L. La Reforestación de Paisajes Forestales a Través de La Forestación de Tierras Agrarias. Cuad. Soc. Esp. Cien. For. 2004, 17, 193–198. [Google Scholar]
- Parente, J.; Pereira, M.G.; Amraoui, M.; Tedim, F. Negligent and Intentional Fires in Portugal: Spatial Distribution Characterization. Sci. Total Environ. 2018, 624, 424–437. [Google Scholar] [CrossRef] [PubMed]
- Pueyo, Y.; Beguería, S. Modelling the Rate of Secondary Succession after Farmland Abandonment in a Mediterranean Mountain Area. Landsc. Urban Plan. 2007, 83, 245–254. [Google Scholar] [CrossRef] [Green Version]
- Vidal-Macua, J.J.; Ninyerola, M.; Zabala, A.; Domingo-Marimon, C.; Gonzalez-Guerrero, O.; Pons, X. Environmental and Socioeconomic Factors of Abandonment of Rainfed and Irrigated Crops in Northeast Spain. Appl. Geogr. 2018, 90, 155–174. [Google Scholar] [CrossRef]
- Areal, F.J.; Riesgo, L. Farmers’ Views on the Future of Olive Farming in Andalusia, Spain. Land use policy 2014, 36, 543–553. [Google Scholar] [CrossRef]
- Bermejo, D.; Cáceres, F.; Moreira, J.M. Medio siglo de Cambios en la Evolución de Usos del Suelo de Andalucía 1956–2007; Consejería de Medio Ambiente (Junta de Andalucía): Sevilla, Spain, 2011; Volume 1, p. 169. [Google Scholar]
- Lasanta, T. Cambios de función en los regadíos de la cuenca del Ebro: Un análisis del papel de los regadíos a lo largo del tiempo. Boletín Asociación de Geógrafos Españoles 2009, 50, 81–110. [Google Scholar]
- Abrantes, P.; Fontes, I.; Gomes, E.; Rocha, J. Compliance of Land Cover Changes with Municipal Land Use Planning: Evidence from the Lisbon Metropolitan Region (1990–2007). Land Use Policy 2016, 51, 120–134. [Google Scholar] [CrossRef]
- Calvo-Iglesias, M.S.; Fra-Paleo, U.; Diaz-Varela, R.A. Changes in Farming System and Population as Drivers of Land Cover and Landscape Dynamics: The Case of Enclosed and Semi-Openfield Systems in Northern Galicia (Spain). Landsc. Urban Plan. 2009, 90, 168–177. [Google Scholar] [CrossRef]
- Caetano, M.; Carrão, H.; Painho, M. Alteraçoes Da Ocupaçao Do Solo Em Portugal Continental 1985–2000; Instituto do Ambiente: Lisboa, Spain, 2005; Volume 1, p. 52.
- García-Álvarez, D.; Camacho Olmedo, M.T. Changes in the Methodology Used in the Production of the Spanish CORINE: Uncertainty Analysis of the New Maps. Int. J. Appl. Earth Obs. Geoinf. 2017, 63, 55–67. [Google Scholar] [CrossRef]
Figure 1.
A schematic representation of the 8 Land Cover Transitions (LCT) defined in this work, following the approach suggested by Feranec et al. (2010) [15].
Figure 1.
A schematic representation of the 8 Land Cover Transitions (LCT) defined in this work, following the approach suggested by Feranec et al. (2010) [15].

Figure 2.
Radar chart of area affected by each transition in each cluster.

Figure 3.
Groups of municipalities/parishes (LAU2) resulting from the cluster analysis. Administrative division at NUTS-2 level is included as reference. Each cluster name appears n the legend along with the main land cover transition (in terms of area) in each case.
Figure 3.
Groups of municipalities/parishes (LAU2) resulting from the cluster analysis. Administrative division at NUTS-2 level is included as reference. Each cluster name appears n the legend along with the main land cover transition (in terms of area) in each case.
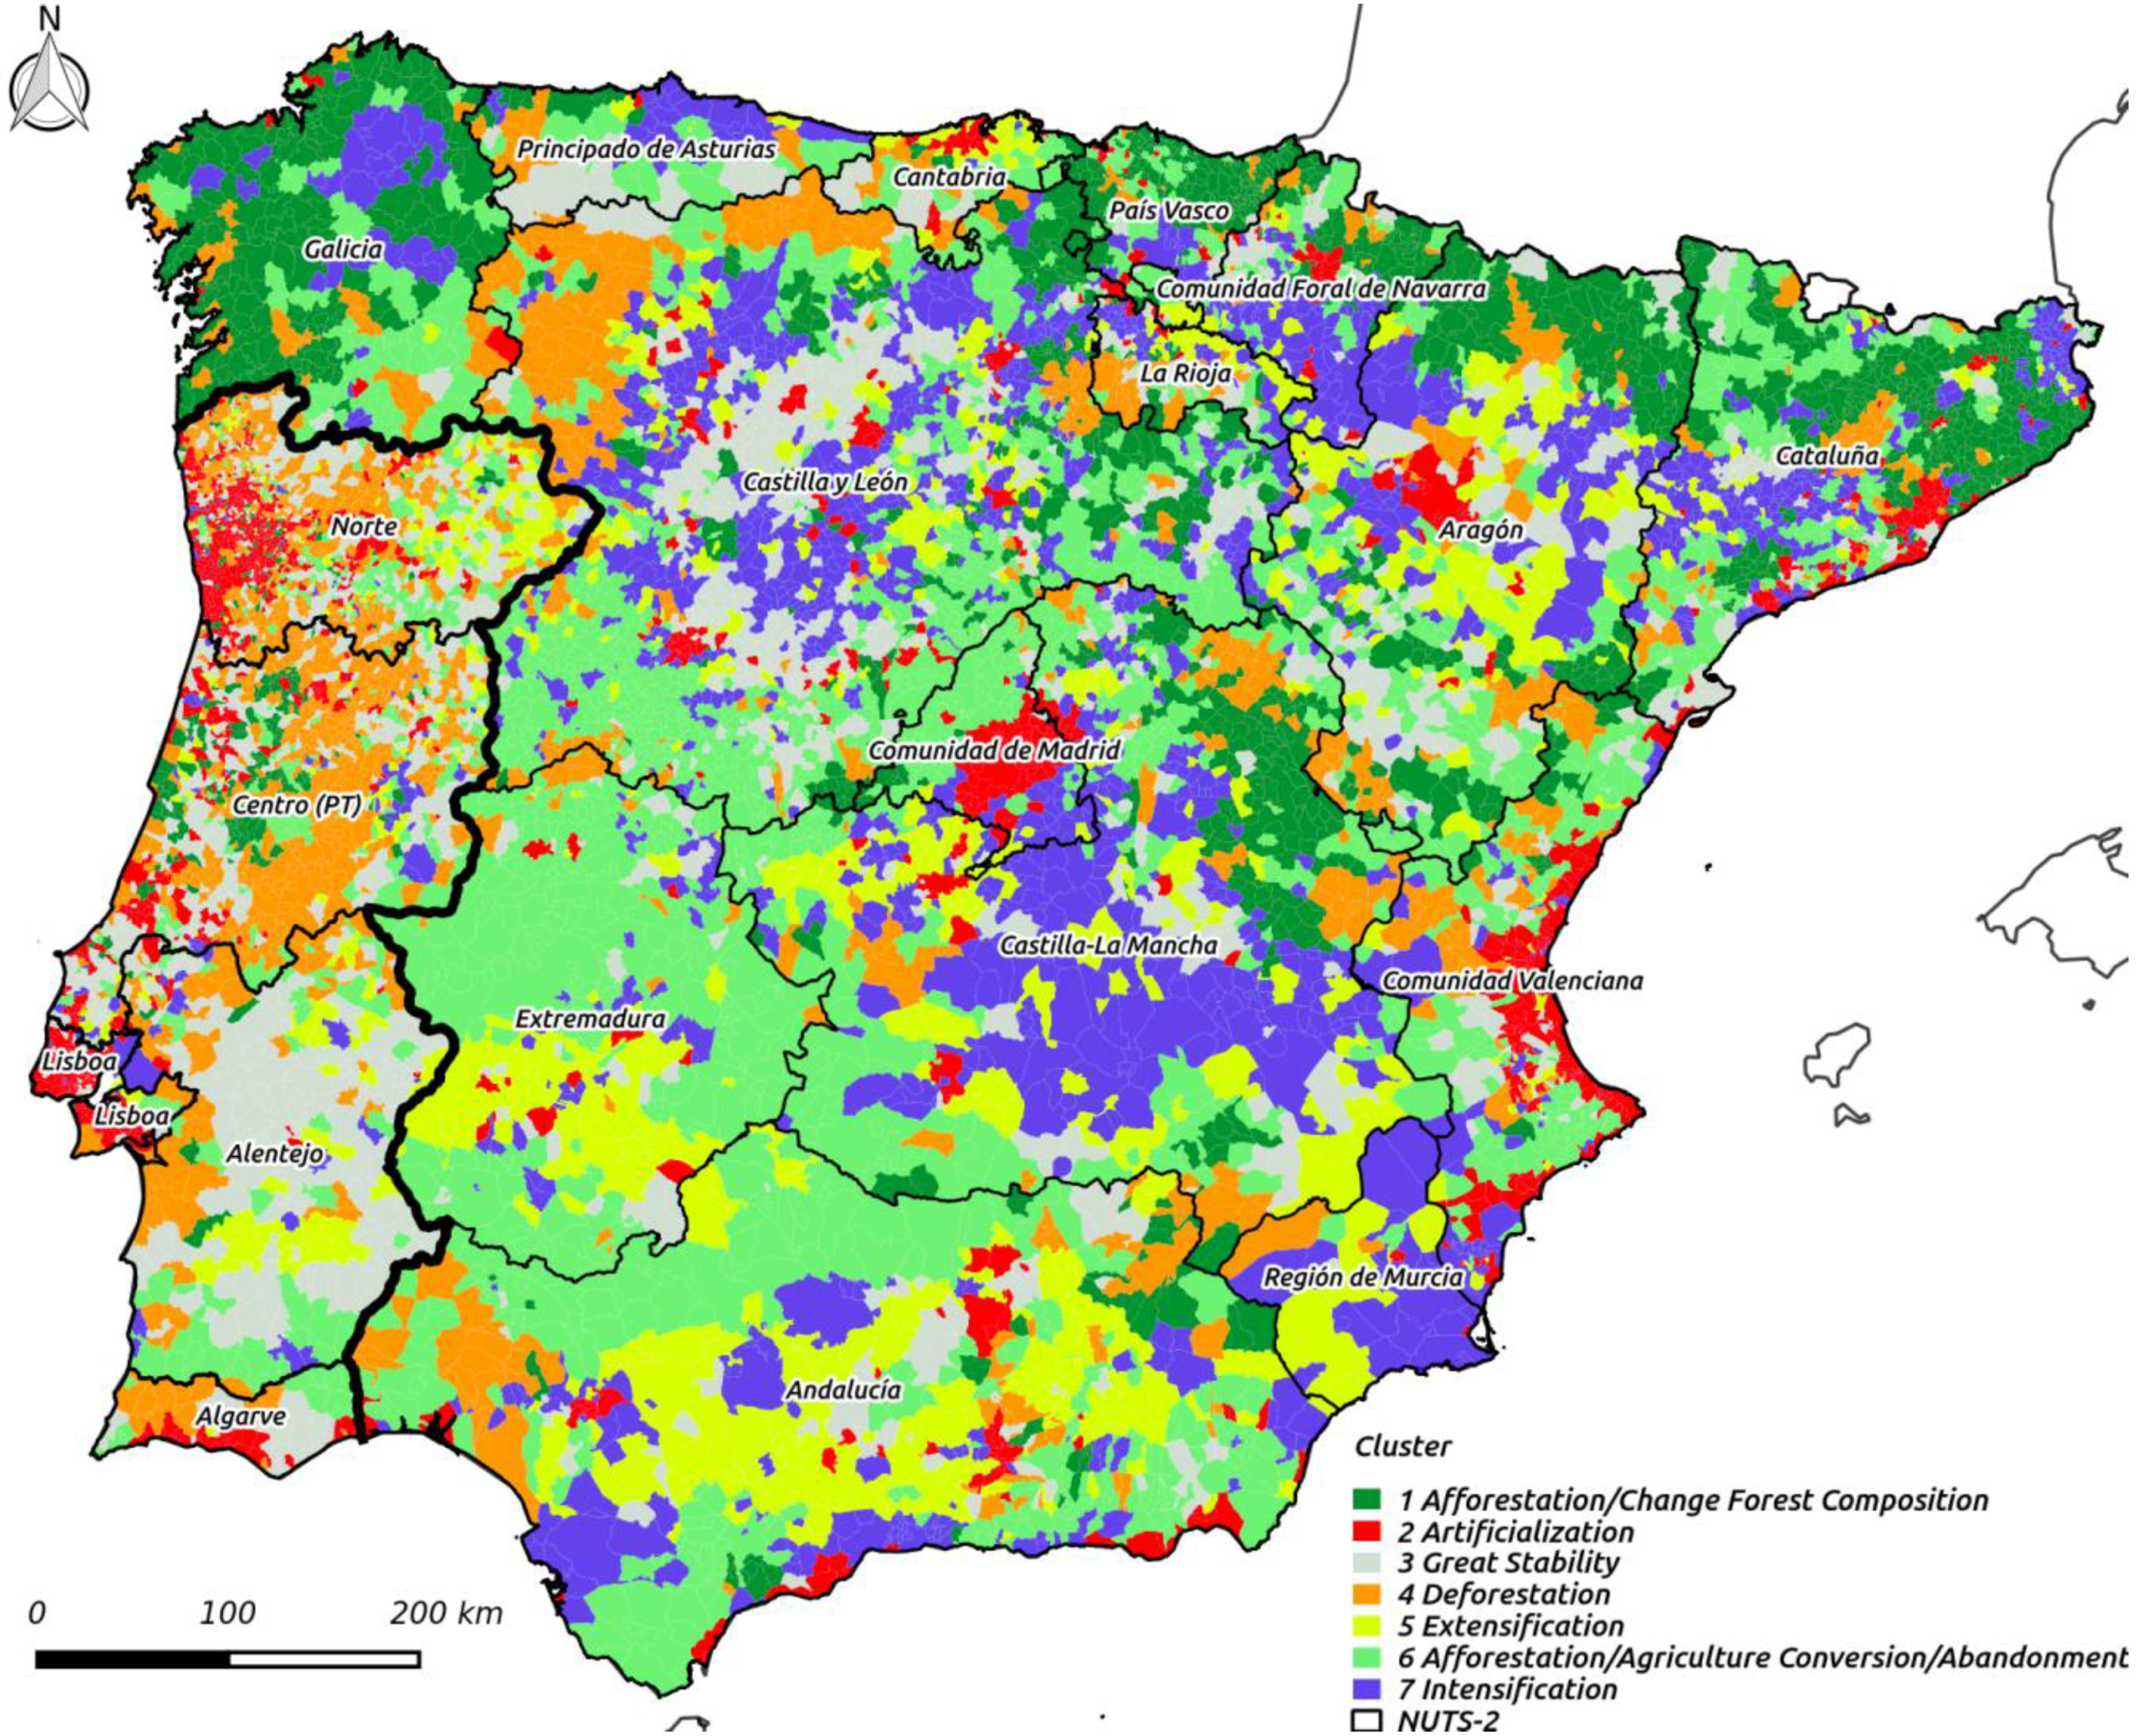
Table 1.
Reclassification of the original Corine Land Cover (CLC) level 3 legend into simplified L1 and L2 land use/cover classes.
Table 1.
Reclassification of the original Corine Land Cover (CLC) level 3 legend into simplified L1 and L2 land use/cover classes.
| CLC Level 3 | Reclassification | |
|---|---|---|
| L1 | L2 | |
| 212,213 | Irrigated land | Agricultural areas |
| 211 | Rainfed crops | |
| 231 | Pastures | |
| 221,222,223,241,242 | Permanent crops | |
| 243,244 | Dehesa/Montado 1 | |
| 321,322,323,324,333,334 | Shrubland/Natural areas | Shrubland/Natural areas |
| 331,332,335 | Unproductive areas | Unproductive areas |
| 311 | Hardwood forest | Forest areas |
| 312 | Coniferous forest | |
| 313 | Mixed forest | |
| 411,412,421,422,423,511,512,521,522,523 | Wetlands and water bodies | Wetlands and water bodies |
| 111,112,121,122,123,124,131,132,133,141,142 | Artificial/Urban areas | Artificial/Urban areas |
1Dehesa (ES) and Montado (PT) are a form of traditional silvopastoral system in which extensive livestock grazing is combined with sparse sometimes defined as an “orchard meadow”.
Table 2.
Net results: area occupied by L1 and L2 classes in the Iberian Peninsula in 1990, 2000 and 2012.
Table 2.
Net results: area occupied by L1 and L2 classes in the Iberian Peninsula in 1990, 2000 and 2012.
| Land Use/Cover | 1990 | 2000 | 2012 | |||
|---|---|---|---|---|---|---|
| km2 | % | km2 | % | km2 | % | |
| Irrigated crops | 22,989 | 3.94 | 26,096 | 4.48 | 28,239 | 4.84 |
| Rainfed crops | 113,174 | 19.41 | 108,786 | 18.66 | 107,709 | 18.47 |
| Pastures | 6846 | 1.17 | 6648 | 1.14 | 9386 | 1.61 |
| Permanent crops | 87,709 | 15.04 | 88,644 | 15.20 | 77,902 | 13.36 |
| Dehesas | 62,118 | 10.65 | 62,232 | 10.67 | 52,319 | 8.97 |
| (Agricultural areas) | 292,836 | 50.22 | 292,405 | 50.15 | 275,556 | 47.26 |
| Hardwood forest | 48,204 | 8.27 | 49,056 | 8.41 | 60,983 | 10.46 |
| Coniferous forest | 46,797 | 8.03 | 45,499 | 7.80 | 49,516 | 8.49 |
| Mixed forest | 20,040 | 3.44 | 20,369 | 3.49 | 18,803 | 3.22 |
| (Forest area) | 115,041 | 19.73 | 114,924 | 19.71 | 129,301 | 22.17 |
| Shrubland | 159,682 | 27.38 | 157,523 | 27.01 | 155,021 | 26.58 |
| Unproductive | 2366 | 0.41 | 2344 | 0.40 | 2362 | 0.41 |
| Wetlands and water bodies | 4932 | 0.85 | 5367 | 0.92 | 5713 | 0.98 |
| Artificial Surface | 8262 | 1.42 | 10,555 | 1.81 | 15172 | 2.60 |
Table 3.
Estimation of area affected by land use/cover transitions (LCT) in the Iberian Peninsula, continental Spain and continental Portugal, in 1990–2000 and 2000–2012.
Table 3.
Estimation of area affected by land use/cover transitions (LCT) in the Iberian Peninsula, continental Spain and continental Portugal, in 1990–2000 and 2000–2012.
| LCT | Spain | Portugal | Peninsula | |||
|---|---|---|---|---|---|---|
| km2 | % | km2 | % | km2 | % | |
| 1990–2000 | ||||||
| LCT1 (Afforestation) | 3810 | 0.77 | 2776 | 3.10 | 6586 | 1.13 |
| LCT2 (Conv. to agric.) | 2688 | 0.54 | 425 | 0.48 | 3113 | 0.53 |
| LCT3 (Abandonment) | 914 | 0.19 | 482 | 0.54 | 1396 | 0.24 |
| LCT4 (Extensification) | 2310 | 0.47 | 253 | 0.28 | 2563 | 0.44 |
| LCT5 (Deforestation) | 3263 | 0.66 | 2706 | 3.03 | 5969 | 1.02 |
| LCT6 (Ch. of forest comp.) | 149 | 0.03 | 120 | 0.13 | 269 | 0.05 |
| LCT7 (Intensification) | 3666 | 0.74 | 831 | 0.93 | 4497 | 0.77 |
| LCT8 (Urbanization) | 1645 | 0.33 | 718 | 0.80 | 2363 | 0.41 |
| 2000–2012 | ||||||
| LCT1 (Afforestation) | 39,630 | 8.03 | 2280 | 2.55 | 41,910 | 7.19 |
| LCT2 (Conv. to agric.) | 22,585 | 4.57 | 1495 | 1.67 | 24,080 | 4.13 |
| LCT3 (Abandonment) | 23,954 | 4.85 | 1572 | 1.76 | 25,526 | 4.38 |
| LCT4 (Extensification) | 20,028 | 4.06 | 2512 | 2.81 | 22,540 | 3.87 |
| LCT5 (Deforestation) | 16,237 | 3.29 | 5128 | 5.73 | 21,365 | 3.66 |
| LCT6 (Ch. of forest comp.) | 17,223 | 3.49 | 1432 | 1.60 | 18,655 | 3.20 |
| LCT7 (Intensification) | 29,041 | 5.88 | 1145 | 1.28 | 30,186 | 5.18 |
| LCT8 (Urbanization) | 5500 | 1.11 | 606 | 0.68 | 6106 | 1.05 |
© 2018 by the authors. Licensee MDPI, Basel, Switzerland. This article is an open access article distributed under the terms and conditions of the Creative Commons Attribution (CC BY) license (http://creativecommons.org/licenses/by/4.0/).
Share and Cite
MDPI and ACS Style
Fernández-Nogueira, D.; Corbelle-Rico, E. Land Use Changes in Iberian Peninsula 1990–2012. Land 2018, 7, 99. https://doi.org/10.3390/land7030099
AMA Style
Fernández-Nogueira D, Corbelle-Rico E. Land Use Changes in Iberian Peninsula 1990–2012. Land. 2018; 7(3):99. https://doi.org/10.3390/land7030099
Chicago/Turabian StyleFernández-Nogueira, David, and Eduardo Corbelle-Rico. 2018. "Land Use Changes in Iberian Peninsula 1990–2012" Land 7, no. 3: 99. https://doi.org/10.3390/land7030099
Note that from the first issue of 2016, this journal uses article numbers instead of page numbers. See further details here.