Tropical Protected Areas Under Increasing Threats from Climate Change and Deforestation
by
 ,
,
Karyn Tabor
1,* ,
,
Jennifer Hewson
1,
Hsin Tien
1,
Mariano González-Roglich
1,
David Hole
1 and
John W. Williams
2 1
Betty & Gordon Moore Center for Science, Conservation International, Arlington, VA 22202, USA
2
Department of Geography, University of Wisconsin, Madison, WI 53706, USA
*
Author to whom correspondence should be addressed.
Land 2018, 7(3), 90; https://doi.org/10.3390/land7030090
Submission received: 29 June 2018
/
Revised: 24 July 2018
/
Accepted: 25 July 2018
/
Published: 28 July 2018
(This article belongs to the Special Issue Biodiversity and Protected Areas)
Abstract
:Identifying protected areas most susceptible to climate change and deforestation represents critical information for determining conservation investments. Development of effective landscape interventions is required to ensure the preservation and protection of these areas essential to ecosystem service provision, provide high biodiversity value, and serve a critical habitat connectivity role. We identified vulnerable protected areas in the humid tropical forest biome using climate metrics for 2050 and future deforestation risk for 2024 modeled from historical deforestation and global drivers of deforestation. Results show distinct continental and regional patterns of combined threats to protected areas. Eleven Mha (2%) of global humid tropical protected area was exposed to the highest combined threats and should be prioritized for investments in landscape interventions focused on adaptation to climate stressors. Global tropical protected area exposed to the lowest deforestation risk but highest climate risks totaled 135 Mha (26%). Thirty-five percent of South America’s protected area fell into this risk category and should be prioritized for increasing protected area size and connectivity to facilitate species movement. Global humid tropical protected area exposed to a combination of the lowest deforestation and lowest climate risks totaled 89 Mha (17%), and were disproportionately located in Africa (34%) and Asia (17%), indicating opportunities for low-risk conservation investments for improved connectivity to these potential climate refugia. This type of biome-scale, protected area analysis, combining both climate change and deforestation threats, is critical to informing policies and landscape interventions to maximize investments for environmental conservation and increase ecosystem resilience to climate change.
1. Introduction
Protected areas (PAs) represent a cornerstone strategy for preserving global biodiversity. PAs and connective corridors have, to date, been established over approximately 15% of the global terrestrial surface to provide refuge and to facilitate migrations and diversification of the gene pools among secluded populations [1,2]. Protecting important ecosystems is also essential to preserve ecosystem services and for climate change mitigation and adaptation strategies [3]. Furthermore, improving habitat extent and connectivity, a barrier to species dispersal, is vital to improving the adaptive capacity of species to climate change [4,5].
PAs have proven effective in reducing habitat destruction and deterring some illegal activities including poaching, illegal logging, and cattle grazing [6]. However, the expansion and maintenance of a robust protected area network that meets global conservation goals has been, and continues to be, challenging [1,7,8]. Chronic underfunding, shorter-term investments, lack of political support, and limited local engagement contribute to the current trends of PA deterioration [9]. In addition, there is an urgent need to assess the conservation outcomes of protected areas to design more effective interventions and improve management of protected areas [10].
Climate change presents an additional challenge to the effectiveness of PAs because the global protected area network accounts for the current distribution of species and habitats, not potential future distributions. Static PAs may be ineffective when trying to protect biodiversity during a century likely to be characterized by shifting species ranges, elevational migrations, and possibly extinctions due to climate change [11,12,13,14]. Segurado et al. [15] estimated 6–11% of species will be pushed out of reserved areas by mid 21st century. Loarie et al. [16] estimated only 8% of PAs have the climatic heterogeneity required to accommodate species shifts in response to anticipated climate change over the next 80 years.
A combination of restricted migration due to habitat reduction and fragmentation, and with the projected rapid warming or drying are likely to render species more vulnerable than during previous historical episodes of climate change [17,18]. Some projections of climate change impacts on species estimate an average of 8–16% global extinction risk depending on the representative concentration pathway [19]. Furthermore, two-thirds of Earth’s species are concentrated in the tropics, predominantly in tropical forests [20] and these forests are under significant threat from agriculture conversion and resource extraction. Only one quarter of the ~1990 extents of these humid tropical forests remain, and they are reduced by an additional 5.5 million hectares each year [21]. While an estimated 23% of tropical forests are under protection, deforestation continues to occur inside tropical PAs [22].
Solutions to protecting species from climate change are dependent on land use planning and management; for example, protected area network expansion, protecting climate refugia, and climate-change corridors [23,24,25,26]. Planning for PA expansion or corridors requires knowledge of both climate risks and deforestation risks to strategically invest in effective land use planning for habitat preservation or restoration. Researchers have employed a variety of modeling techniques to inform the potential impacts of anthropogenic change on biodiversity [27]. Assessing biodiversity threats from deforestation is based directly on observed data typically from satellite remote sensing [28,29,30,31,32]. Using observed rates of change with information on the driving forces of land cover change allows for deforestation risk assessments or projections of future forest cover scenarios into the near-future [33]. The biodiversity response to habitat change is well documented and the consequences are severe. The uncertainty related to deforestation risk projections are tied to uncertainties in changing geopolitical and socioeconomic factors that directly affect drivers of deforestation making long-term forest cover projections (greater than 20 years) ineffective. Climate models are optimized for longer-term future projections (50–100 years), however, projecting the impacts of climate change on biodiversity is challenging given the uncertainties of how vulnerable or adaptable individual species are to climate change [34,35]. Thus, many studies avoid specifying climate tolerance of species, indirectly assessing climate change impacts on species by quantifying climate change on habitat or in restricted habitats such as PAs [16,36,37,38].
In recent years, researchers have applied climate metrics applied to measure biodiversity exposure to climate change risks [39]. For example, climate metrics measuring climate dissimilarity (i.e., disappearing and novel climates) are global risk surfaces indicating areas of extreme climatic regime shifts. Disappearing climates indicate areas where the late 20th century climate will cease to exist and therefore species adapted to these climates will go extinct if unable to adapt to new climatic conditions. These species cannot simply migrate to a new location because there are no future climate regimes that meet their 20th century niche requirements [40]. Novel climates, similarly, are too different from any 20th century climate to support the current species if the species are unable to adapt to the new climate. Novel climates are particularly challenging for ecological forecasting because of the uncertainty of species adaptability to these new climates that did not exist in the 20th century [39,40,41,42].
Land use change and climate change are interlinked as human-induced forces disrupting ecological processes and driving global change [43,44,45]. Yet to date, only a handful of studies have addressed the combined impacts of future climate change and land cover change (e.g., [26,43,46,47] despite the risk of extinction and negative economic and human well-being affects from these stressors [18,48,49,50]. Evaluating the vulnerability of the protected area system to both climate change and habitat loss is essential to inform the prioritization of conservation investments, adaptation and mitigation strategies, and land use planning initiatives that aim to preserve biodiversity and promote long-term resilience. These interventions are crucial towards achieving a range of international initiatives and agreements including Reducing Emissions from Deforestation and Degradation (REDD+), the Aichi biodiversity targets and the United Nations Sustainable Development Goals (SDGs). In this study, we assessed the exposure of PAs in the humid tropical forest biome to both deforestation risk derived from satellite monitoring and climate exposure metrics to compare how the exposure of PAs varies among continents and regions to inform transboundary landscape management solutions. Understanding the potential impacts of anthropogenic change on PAs is critical to informing where and how to invest in biodiversity conservation.
2. Materials and Methods
2.1. Protected Areas
We used the World Database of Protected Areas (WDPA) [51] and selected PAs within the humid tropical forest biome, based on the tropical/subtropical moist broadleaf forest class defined in the Terrestrial Ecoregions of the World [52]. We defined forest as areas with greater than 10% tree cover in 2000 [30]. This threshold captures low-density dry forests, in addition to denser forests. PAs without any forest cover meeting the definition were omitted from the analysis. We also omitted PAs located outside the spatial extent of the climate data used in the analysis, as described below. This yielded 7672 remaining PAs of the 8161 total terrestrial PAs in the humid tropical forest biome.
2.2. Deforestation Risk
For exposure to anthropogenic land cover change, we used a potential deforestation risk layer generated using historical deforestation (2000–2014) and a suite of potential deforestation drivers [53]. The historical deforestation was based-on 30-m global forest loss data from Hansen et al. [30] using a forest definition of 10% tree cover [54] in 2000. The tree cover dataset, by definition, included both natural and production forests. We used a set of potential drivers of deforestation (Table 1) as explanatory variables to predict deforestation. First, we aggregated all deforestation and driver data to 1km due to the resolution of the majority of the deforestation driver datasets. Next, we tested these variables for predicating deforestation and selected only variables with a significant relationship to historical deforestation. We used a multi-layer perceptron model in TerrSet Land Change Modeler software (https://clarklabs.org/terrset/) to generate a layer of future deforestation risk [33]. The layer represented the modeled percent likelihood of potential deforestation, scaled from 0–1, by 2024.
2.3. Climate Exposure
We analyzed the relative exposure to climate change using two climate metrics generated from 10-min, downscaled future climate projections. The two metrics were: (1) disappearing climate risk and (2) novel climate risk [64]. We calculated both metrics for 2050 with a high emission scenario, using the IPCC AR4 A2 scenario, similar to AR5 RCP8.5 [65]. The metrics represented dissimilarity measurements of the squared Euclidean distance between seasonal (June–August and December–February) temperature and precipitation variables in the 20th century climate and mid- 20th century climate [40,66]. The disappearing climate metric was a measure of dissimilarity between a pixel’s late 20th century climate and its closest matching pixel in the global set of 21st-century climates. The novel climate metric represented the dissimilarity between a pixel’s future climate and its closest matching pixel in the global set of late 20th-century climates. We calculated mean disappearing and mean novel climate metrics for each of the 7672 PAs. High disappearing risk for a PA indicated that a PA’s current climate was very different from any climate that will exist anywhere globally in the mid-21st century, therefore at risk for disappearing. High novel risk for a PA indicated that the future climate was very different than any climates that existed in the 20th-century and therefore emerged as new climates previously unknown in the 20th century.
2.4. Methods
We rescaled the disappearing and novel climate layers from 0 to 1 using the minimum for each as the lower threshold and the 99th percentile as the upper threshold to remove outliers. We then displayed the three outputs: deforestation risk, disappearing climate risk, and novel climate risk as color display channels (red-green-blue). This allowed visual exploration of the spatial patterns emerging over the global tropics when the three risk layers were combined. We analyzed the combined risk by calculating the distribution of the mean deforestation risk, mean disappearing climate risk, and mean novel climate risk for each PA using the original data values, not scaled from 0–1. The highest risk PAs were considered the 75th percentile and the 25th percentile were considered the lowest risk PAs (Table 2). We then identified PAs with the following combinations of risk: highest deforestation risk and highest climate risk (either highest disappearing or highest novel); highest deforestation risk and lowest climate risk; lowest deforestation risk and highest climate risk; and lowest deforestation risk and lowest climate risk.
3. Results & Discussion
3.1. Global Patterns
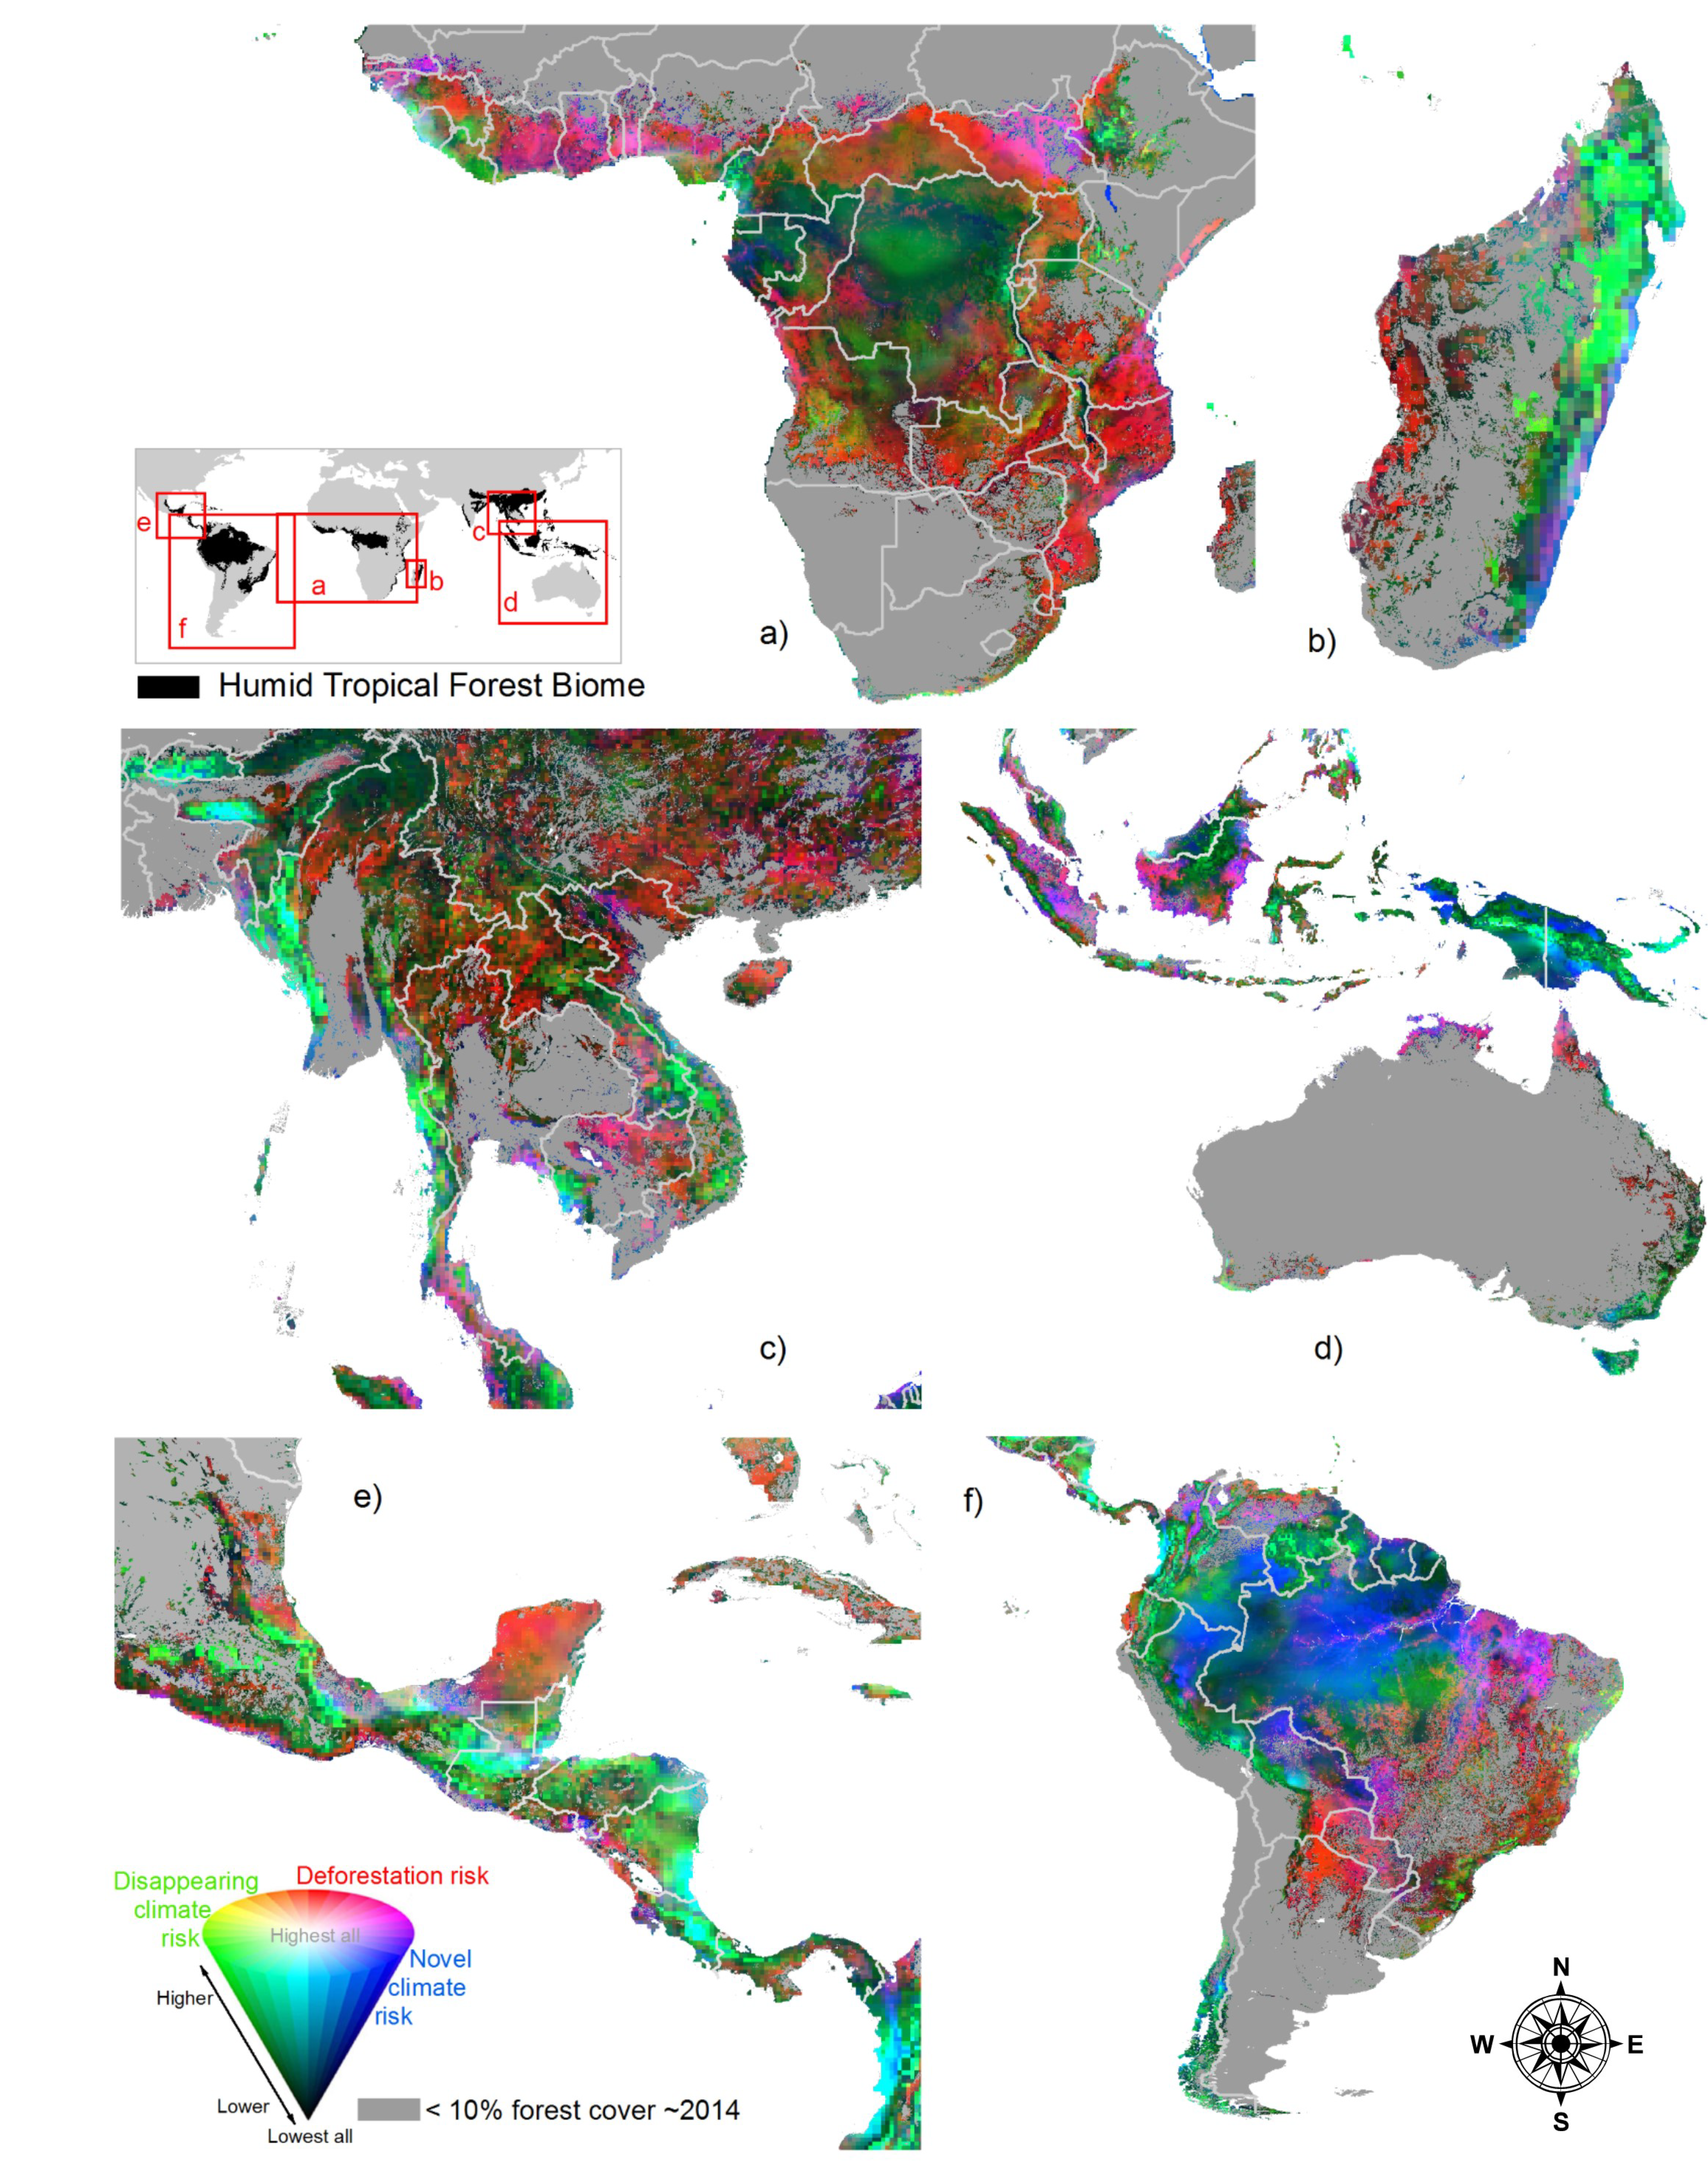
Our results indicated distinct patterns of relative risk for climate change and deforestation when comparing the spatial variation of the combined threats of deforestation and climate risk for global tropical forests (Figure 1). Areas exposed to the highest deforestation risk included the Atlantic Forests in Brazil; the Yucatan peninsula in Mexico; northern Thailand, Laos, and Vietnam; Sumatra and coastal Borneo; East Africa; and western Madagascar. The Brazilian Amazon had a very low deforestation risk most likely driven by the reduction in deforestation in the Amazon in the latter half of the deforestation time-period (2007–2014) [67,68]. Deforestation impacts PAs through reducing habitat for species of concern, degrading ecosystem services, and decreasing the ecosystem resilience to climate change. The highest risk deforestation areas that are also high-movement areas for species dispersal under climate change should be prioritized for protection. Once such area indicated in our results was the Atlantic Forest of Brazil due to the area’s past and projected future role for high levels of species movements under climate change conditions [47].
The climate exposure risks results revealed the highest risk areas for disappearing climates were in higher altitude areas (e.g., Andes, eastern Sumatra, Papua New Guinea, central Mexico, and the eastern forests in Madagascar). Novel climate risks were highest in lower elevation tropical areas (e.g., Amazon basin; the Tabasco region in Mexico; southern Myanmar; the lowlands of Sumatra and New Guinea; Liberia; Gabon; and the south-east coast of Madagascar). These findings were similar to other studies that used climate dissimilarity measures [16,40]. Species in PAs exposed to the disappearing climate risk in these higher elevation areas may be able to move up or down slope to find new habitat if habitat remains intact. This will be challenging in areas with high deforestation risk (e.g., mountain forests in Eastern Madagascar, Colombia Andes, and the highlands of Zambia and Angola; Figure 1). Another challenge is species response to novel climate risk in vast lowland basins like the Amazon, where despite conservation efforts to protect habitat and corridors, species migration may be outpaced by the velocity of change [16]. Areas exposed to the highest risks of disappearing climate, novel climate, and deforestation (e.g., southeast Amazon; southwest Cambodia; and Liberia and Coastal Cameroon) will require intensified landscape interventions and planning for transboundary landscape connectivity. Intensive measures beyond landscape management (e.g., assisted migration, rewilding, and ex-situ conservation) [5] may be required in areas of highest climate risk and deforestation risk.
3.2. Protected Areas
The spatial distribution of humid tropical forest biome PAs in our analysis varied by continent, although almost half of the PAs in the study were in Asia, when considering area of PAs, almost three-quarters of the total area was located in South America (Table 3). Globally, 29 Mha (6%) of PAs were exposed to a deforestation risk greater than 40% (the highest-risk threshold) (Figure 2). The low proportion of PAs exposed to highest deforestation threat was expected because PAs historically have lower deforestation rates than unprotected areas and PAs often are more remote and exposed to less threats [9,69]. Further exploration with a lower threshold revealed that 132 Mha (26%) of PAs was exposed to greater than 10% chance of deforestation. These results are more conservative than the results of Jones et al. [70] indicating that 32.8% of global PAs are exposed to intense human pressure, or “human footprint”. The human footprint score is not a measure of deforestation, but instead pressure that may compromise ecosystem intactness and function. Our results suggested that in most regions, PAs can continue to serve in their intended role as reserves for species threatened by deforestation based on observed, historical deforestation rates and not solely proxy measures.
The continent with the greatest total area of PA exposed to the highest deforestation risk was South America, with a total of 8.8 Mha at risk. North America had the highest percent of area under protection with high deforestation risk (27%) (Figure 2). In addition to the high biodiversity value inherent in the PAs, these areas also represent high biomass value and ecosystem service provision zones, thus investments will have the maximum impact on protecting threatened ecosystems and mitigating climate change. Landscape interventions stemming from international policies addressing climate mitigation such as REDD+ may be a viable option. REDD+ aims to reduce deforestation and degradation by providing countries with a range of incentives and result-based payments in exchange for emissions reductions. Many REDD+ investments focus on reducing forest dependency of local communities by providing alternative livelihoods to reduce deforestation pressures [71]. Conservation investments that focus on improving livelihoods are important because communities vulnerable to climate change rely more on forest products as a safety-net during times of low agricultural production [72]. Other landscape interventions include improving management effectiveness (i.e., “upgrading”) and increasing landscape connectivity (i.e., “upsize and interconnect”) to enable species movement away from threats [9]. Restoring habitat is another intervention intended to increase ecosystem resiliency to fire propagation [73]. Another key management tool is near real-time monitoring of ecosystem threats utilizing community-based monitoring, remotely-sensed data, or in-situ sensors. These systems enable PA managers with time-sensitive alerts on deforestation threats of fires and illegal extractives to strategically patrol protected areas and enable rapid response to prevent further ecosystem destruction (e.g., [74,75,76,77]).
When examining combined climate risks, 226 Mha (44%) were exposed to the highest risk of either highest disappearing or highest novel risk; parsed into 62 Mha (12%) at highest risk of high disappearing climates and 165 M ha (32%) at highest risk of novel climates. PAs at highest risk for disappearing climate indicate areas where species may go extinct [40]. Forty-five percent of North America PA area was exposed to the highest disappearing climate risk whereas 42% of South America PA area was exposed to highest novel climate risk (Figure 2). Garcia et al. [39] and Williams et al. [40] both concluded that novel climates are more likely in the tropics and subtropics and our study indicated that the Amazon basin may be a hotspot for novel climates. This may be because the area is already among the warmest in the world, and also has relatively little seasonality and interannual climatic variability. Hence the 21st-century warming will quickly move the mean temperatures for this region beyond the background range of interannual climates found here or anywhere else in the range of 20th-century climates [40,78].
Novel climates, while posing similar threats to species as disappearing climates, also cause greater uncertainty for how species may reject or adapt to new climates [79]. While these two metrics of climate exposure may indicate different biological conservation responses, landscape management responses are similar as species in both highest-risk disappearing and novel areas may benefit from a reduction of global emissions to mitigate climate change in addition to local forest conservation/climate adaptation planning because intact, healthy ecosystems may increase species’ resilience to climate change [80]. Increasing landscape connectivity (upsize and interconnect) will assist species migrations to suitable habitats. In addition to these practices applied to high deforestation risk areas, these PAs could benefit from in-situ monitoring of species response to climate change [81]. Asia had a large proportion of PAs with the lowest risks of disappearing climate (32%) and lowest novel climates (45%), and thus, may be a suitable area for conservation investments increasing connectivity to allow species dispersal to these climate refugia [23].
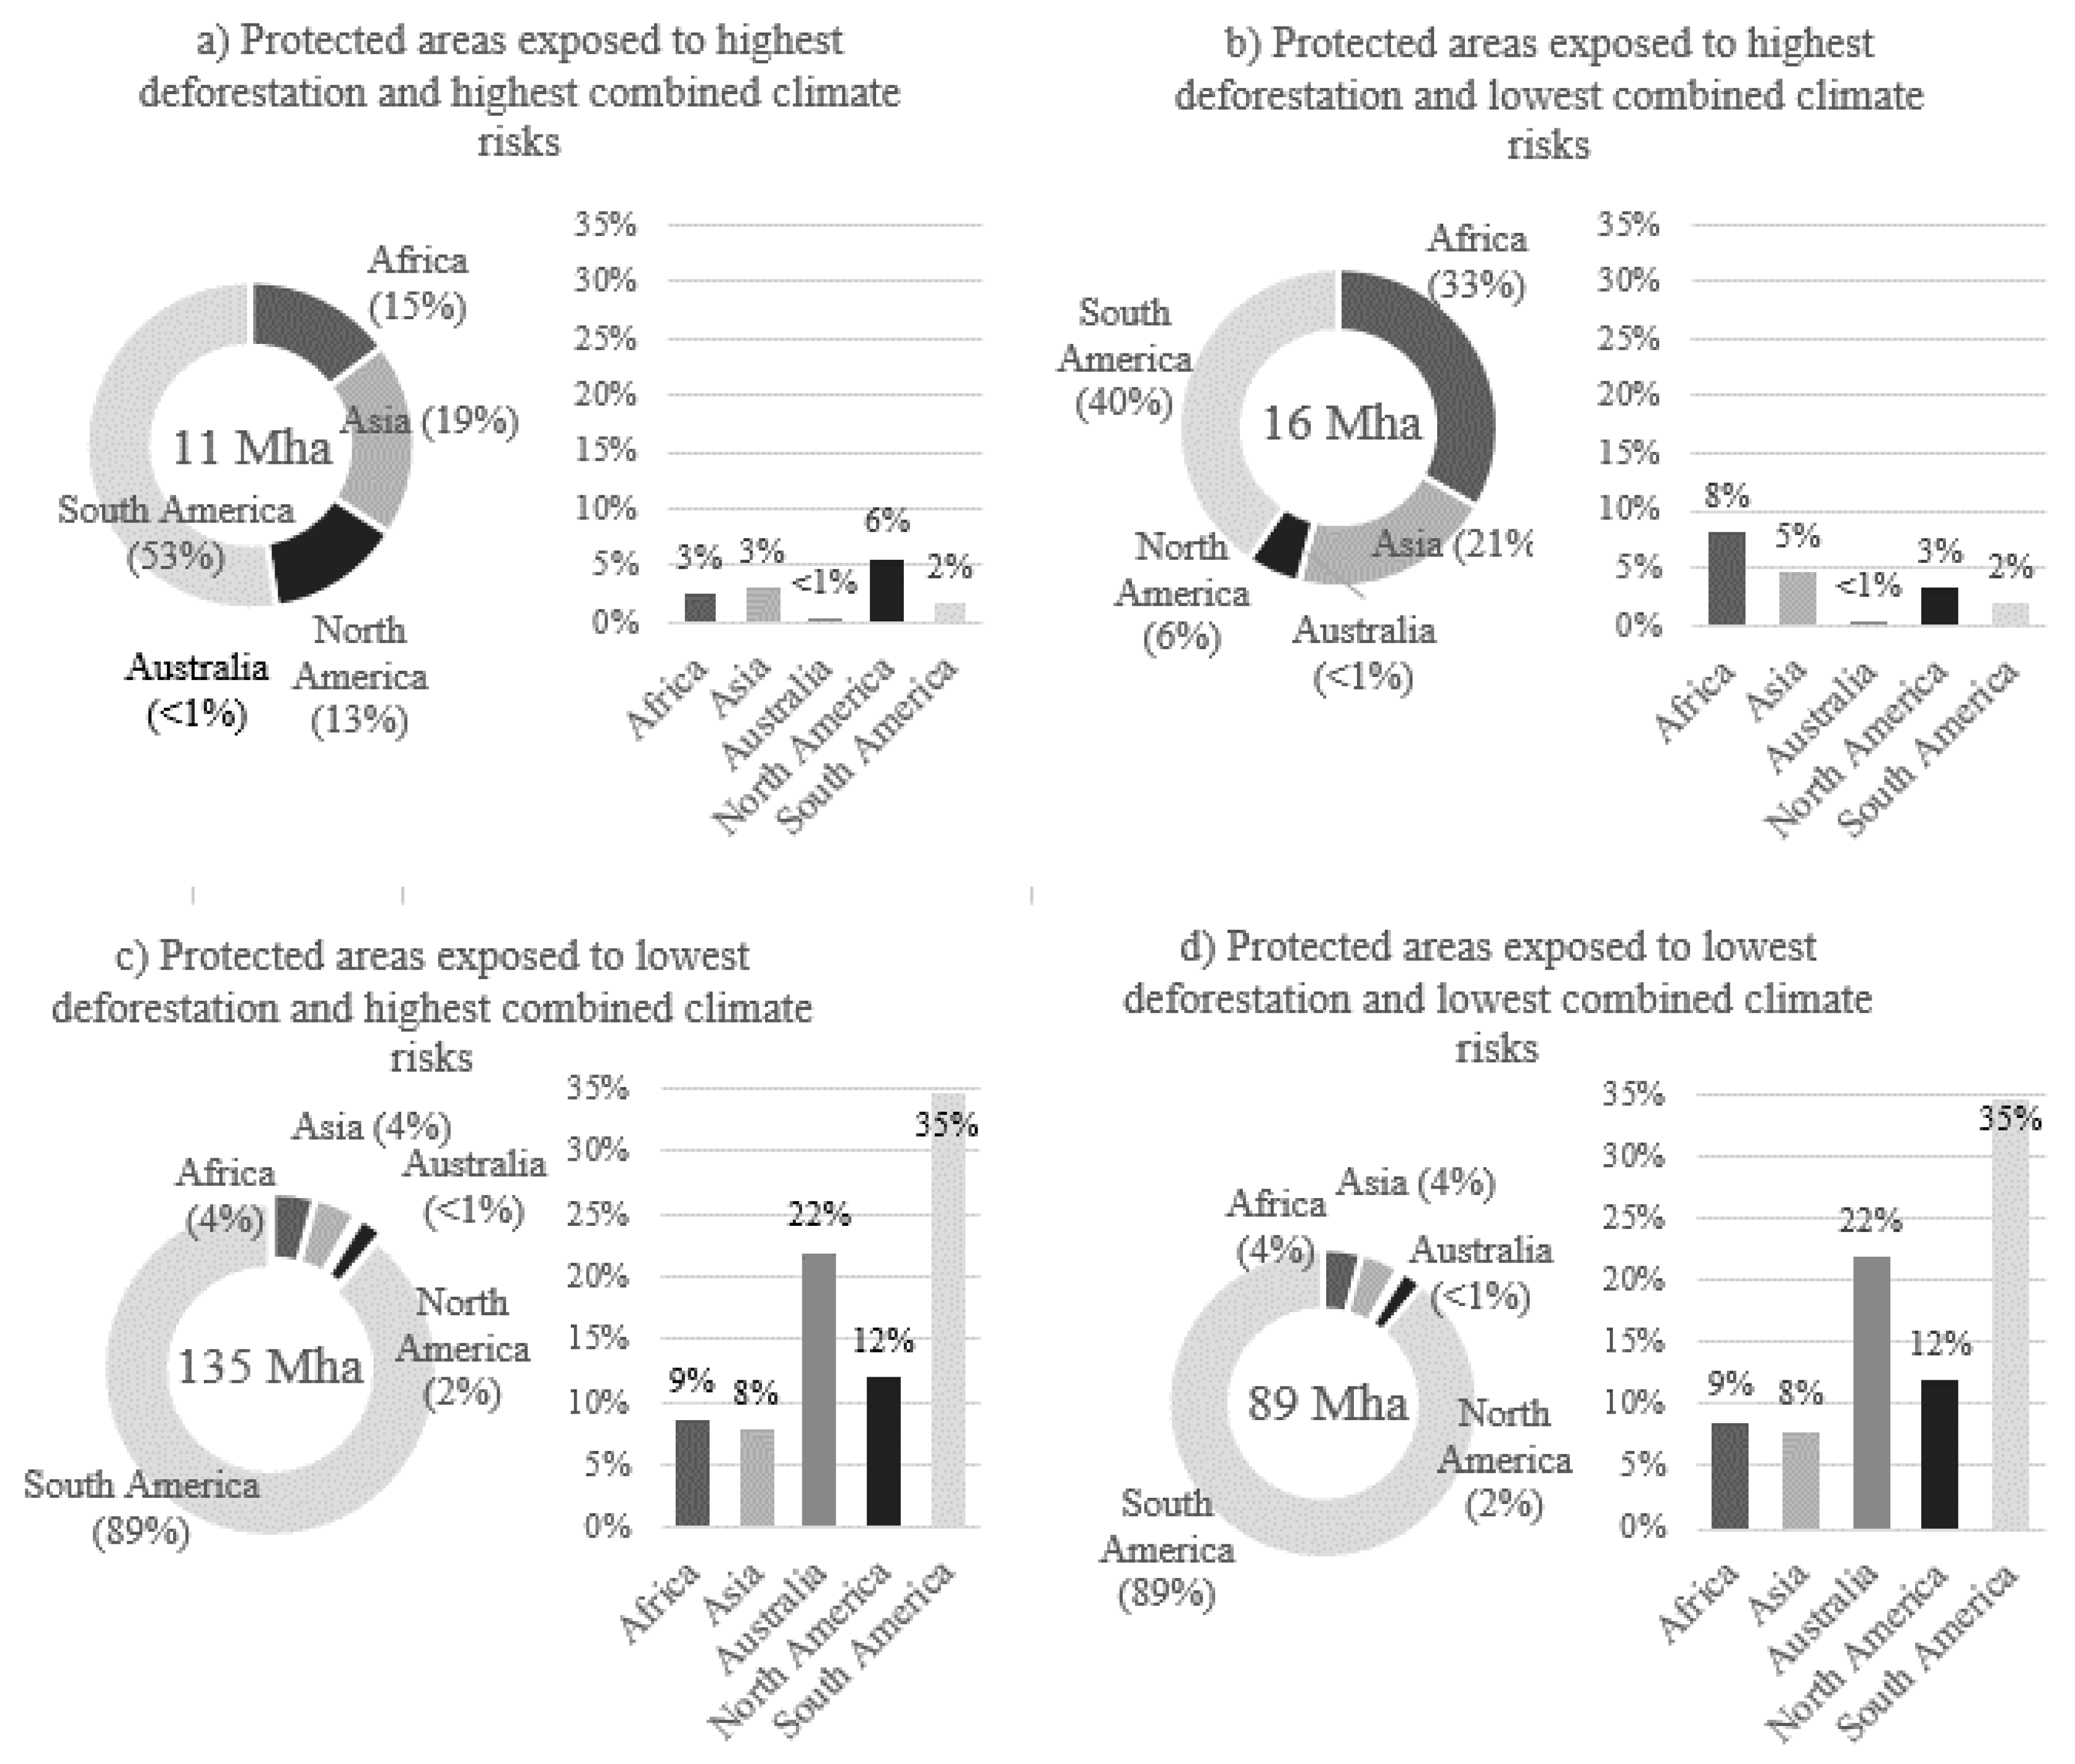
The intersection of PAs with the highest deforestation and highest combined climate risks revealed 11 Mha (2%) of the global tropical PAs with extreme exposure to the dual threats, and half of this area was in South America (Figure 3a). The continent with the largest proportion of area affected was North America (6%). These PAs should be immediately targeted for conservation investments. Although traditional policies and mechanisms to reduce habitat loss may be effective, the additional climate change risks to these PAs may require newly designed policy mechanisms and practices adapted to unique climate stressors [5].
Sixteen Mha of global humid tropical PA was exposed to highest deforestation and lowest combined climate risks. Forty percent of this area was in South America, but Africa accounted for another 33% of the total area. (Figure 3b). These areas should be targeted for investments in traditional landscape interventions to reduce deforestation and should be considered high priority sites for lower-risk investments to upscale and interconnect ecosystems to promote species movement to these potential climate refugia.
The area of global humid tropical PAs exposed to the lowest deforestation and highest combined climate risks totaled 135 Mha (26%); an overwhelming 35% of this area was located in South America (Figure 3c). Australia also reflected a high proportion of area in PAs with the lowest deforestation and highest combined climate risk (22%). These PAs should be targeted for further ecosystem assessment for climate change sensitivity. With decreased deforestation pressures, these PAs may be prioritized for increasing the size or the connectivity of PAs to allow for migration of species sensitive to climate change [47].
The area of global humid tropical forested PAs exposed to the combination of lowest deforestation and lowest combined climate risk totaled 89 Mha (17%) and was mostly located in South America (60%); however, it was proportionally highest in Africa (34%) and Asia (17%) (Figure 3d). These areas may serve as low risk investments where management may be less costly and the areas may provide climate refuge.
3.3. Caveats
In this study, we did not indicate which PAs were at risk to biological diversity loss, rather we compared the relative exposure of risk using climate metrics that represented “threats and opportunities for biodiversity” under climate change [39]. The 25th and 75th percentiles indicated the extremes of highest and lowest risks to PAs in the global set of humid tropical forested PAs. We also did not assess the risk to biological diversity, as an individual species’ risk to climate change is determined by its exposure, sensitivity and adaptive capacity based on historical information and some species may be able to persist in a broader range of climate conditions than previously known [79]. We did highlight areas exposed to the greatest threats of deforestation and climate change that require urgent attention and we also indicated areas buffered from these combined threats, which may persist as biological refuges into the future.
4. Conclusions
This study focused on the impacts of climate change and forest change on PAs within the humid tropical forest biome to inform PA investments. The effects of deforestation on biological diversity in the humid tropics and elsewhere are widely documented and these threats can be managed by identifying effective conservation and sustainable land management approaches.
Implementing policies to address climate change is less straightforward given the uncertainties associated with efforts to mitigate future climate change and reduce deforestation loss; projections of how species and ecosystems will adapt (or fail to adapt) to novel climates, and vulnerability of ecosystems to disappearing climates. Therefore, it is essential when addressing climate change impacts on biodiversity to address the immediate threat of habitat loss and improve and preserve ecosystem resilience. For PAs at risk to both threats, a suite of investments should be implemented in the landscape from improved management, upsizing and interconnecting PAs, habitat restoration, socio-economic investments, capacity building, and adopting new technologies for improved monitoring.
The advantage of a biome-wide study is to both shift the focus of protected area management from within a country’s boundary to the transboundary threats, and to guide international policies and investments to consider the dual threats of both of climate change and land cover change. The scale of this study can inform global investors where and how to maximize investments for biodiversity conservation, climate mitigation, and preserving climate resilient ecosystems. Finer-scale analyses based on regional and national-scale projections of deforestation are recommended to inform investments for individual PAs. Considering the combined risks of PAs to both climate change and habitat loss can be vital to for national-level spatial priority setting.
Author Contributions
For research articles with several authors, a short paragraph specifying their individual contributions must be provided. The following statements should be used “Conceptualization, K.T., J.H. and D.H.; Methodology, K.T., J.H., M.G.-R., D.H. and J.W.W.; Software, K.T. and J.W.W.; Validation, K.T., H.T., J.W.W. and M.G.-R.; Formal Analysis, K.T., J.W.W. and H.T.; Investigation, K.T. and J.W.W.; Resources, K.T.; Data Curation, K.T. and H.T.; Writing-Original Draft Preparation, K.T.; Writing-Review & Editing, K.T., J.H., H.T., M.G.-R., D.H. and J.W.W.; Visualization, K.T., H.T. and M.G.-R.; Supervision, K.T.; Project Administration, K.T.; Funding Acquisition, K.T.”, please turn to the CRediT taxonomy for the term explanation. Authorship must be limited to those who have contributed substantially to the work reported.
Funding
This research was made possible with a Walton Family Foundation grant and a gift from Betty and Gordon Moore.
Acknowledgments
The authors would like to thank Kellee Koenig and Cameron Walkup for their help preparing the manuscript.
Conflicts of Interest
The authors declare no conflict of interest.
References
- Rodrigues, A.S.L.; Andelman, S.J.; Bakarr, M.I.; Boitani, L.; Brooks, T.M.; Cowling, R.M.; Fishpool, L.D.C.; da Fonseca, G.A.B.; Gaston, K.J.; Hoffmann, M.; et al. Effectiveness of the global protected area network in representing species diversity. Nature 2004, 428, 9–12. [Google Scholar] [CrossRef] [PubMed]
- UNEP-WCMC; IUCN. Protected Planet Report 2016; UNEP-WCMC: Cambridge, UK; IUCN: Gland, Switzerland, 2016; Available online: https://wdpa.s3.amazonaws.com/Protected_Planet_Reports/2445 Global Protected Planet 2016_WEB.pdf (accessed on July 30 2016).
- Dudley, N.; Stolton, S.; Belokurov, A.; Krueger, L.; Lopoukhine, N.; MacKinnon, K.; Sandwith, T.; Sekhran, N. Natural Solutions: Protected Areas Helping People Cope with Climate Change; IUCNWCPA, TNC, UNDP, WCS, The World Bank and WWF: Gland, Switzerland; Washington, DC, USA; New York, NY, USA, 2010; Available online: https://www.iucn.org/downloads/natural_solutions.pdf (accessed on 31 September 2017).
- Hurlbert, A.H.; Jetz, W. Species richness, hotspots, and the scale dependence of range maps in ecology and conservation. Proc. Natl. Acad. Sci. USA 2007, 104, 13384–13389. [Google Scholar] [CrossRef] [PubMed] [Green Version]
- Dawson, T.P.; Jackson, S.; House, J.I.; Prentice, I.C.; Mace, G.M. Beyond Predictions: Biodiversity Conservation in a Changing Climate. Science 2011, 332, 53–58. [Google Scholar] [CrossRef] [PubMed]
- Bruner, A.G.; Gullison, R.E.; Rice, R.E.; da Fonseca, G.A. Effectiveness of parks in protecting tropical biodiversity. Science 2001, 291, 125–128. [Google Scholar] [CrossRef] [PubMed]
- Lele, S.; Wilshusen, P.; Brockington, D.; Seidler, R.; Bawa, K. Beyond exclusion: Alternative approaches to biodiversity conservation in the developing tropics. Curr. Opin. Environ. Sustain. 2010, 2, 94–100. [Google Scholar] [CrossRef]
- Laurance, W.F.; Useche, D.C.; Rendeiro, J.; Kalka, M.; Bradshaw, C.J.A.; Sloan, S.P.; Laurance, S.G.; Campbell, M.; Abernethy, K.; Alvarez, P.; et al. Averting biodiversity collapse in tropical forest protected areas. Nature 2012, 489, 290–293. [Google Scholar] [CrossRef] [PubMed]
- Pringle, R.M. Upgrading protected areas to conserve wild biodiversity. Nature 2017, 546, 91–99. [Google Scholar] [CrossRef] [PubMed]
- Geldman, J.; Barnes, M.; Coad, L.; Craigie, I.D.; Hockings, M.; Burgess, N.D. Effectiveness of terrestrial protected areas in reducing habitat loss and population declines. Biol. Conserv. 2013, 161, 230–238. [Google Scholar] [CrossRef]
- Walther, G.-R.; Post, E.; Convey, P.; Menzel, A.; Parmesan, C.; Beebee, T.J.C.; Fromentin, J.-M.; Hoegh-Guldberg, O.; Bairlein, F. Ecological responses to recent climate change. Nature 2002, 416, 389–395. [Google Scholar] [CrossRef] [PubMed]
- Parmesan, C.; Yohe, G. A globally coherent fingerprint of climate change impacts across natural systems. Nature 2003, 421, 37–42. [Google Scholar] [CrossRef] [PubMed]
- Root, T.L.; Price, J.T.; Hall, K.R.; Schneider, S.H. Fingerprints of global warming on wild animals and plants. Nature 2003, 421, 57–60. [Google Scholar] [CrossRef] [PubMed]
- Thomas, C.D.; Cameron, A.; Green, R.E.; Bakkenes, M.; Beaumont, L.J.; Collingham, Y.C.; Erasmus, B.F.N.; de Siqueira, M.F.; Grainger, A.; Hannah, L.; et al. Extinction risk from climate change. Nature 2004, 427, 145–148. [Google Scholar] [CrossRef] [PubMed] [Green Version]
- Segurado, P.; Araújo, M.B. An evaluation of methods for modelling species distributions. J. Biogeogr. 2004, 31, 1555–1568. [Google Scholar] [CrossRef]
- Loarie, S.R.; Duffy, P.B.; Hamilton, H.; Asner, G.P.; Field, C.B.; Ackerly, D.D. The velocity of climate change. Nature 2009, 462, 1052–1055. [Google Scholar] [CrossRef] [PubMed]
- Davies, T.J.; Purvis, A.; Gittleman, J.L. Quaternary climate change and the geographic ranges of mammals. Am. Nat. 2009, 174, 297–307. [Google Scholar] [CrossRef] [PubMed]
- Corvalen, C.; Hales, S.; McMichael, A.J.; Bulter, C. Ecosystems and Human Well-Being, Health Synthesis; Wolrd Health Organization: Geneva, Switzerland, 2005. [Google Scholar]
- Urban, M.C. Accelerating extinction risk from climate change. Science 2015, 348, 571–573. [Google Scholar] [CrossRef] [PubMed] [Green Version]
- Pimm, S.L.; Raven, P. Extinction by numbers. Nature 2000, 403, 843–845. [Google Scholar] [CrossRef] [PubMed]
- Keenan, R.J.; Reams, G.A.; Achard, F.; De Freitas, J.V.; Grainger, A.; Lindquist, E. Forest Ecology and Management Dynamics of global forest area: Results from the FAO Global Forest Resources Assessment 2015. For. Ecol. Manag. 2015, 352, 9–20. [Google Scholar] [CrossRef]
- Spracklen, B.D.; Kalamandeen, M.; Galbraith, D.; Gloor, E.; Spracklen, D.V. A Global Analysis of Deforestation in Moist Tropical Forest Protected Areas. PLoS ONE 2015, 342, e0143886. [Google Scholar] [CrossRef] [PubMed]
- Keppel, G.; Van Niel, K.P.; Wardell-johnson, G.W.; Yates, C.J.; Byrne, M.; Mucina, L.; Schut, A.G.T.; Hopper, S.D.; Franklin, S.E. Refugia: Identifying and understanding safe havens for biodiversity under climate change. Glob. Ecol. Biogeogr. 2012, 21, 393–404. [Google Scholar] [CrossRef]
- Alagador, D.; Cerdeira, J.O. Climate change, species range shifts and dispersal corridors: An evaluation of spatial conservation models. Methods Ecol. Evolut. 2016, 7, 853–866. [Google Scholar] [CrossRef]
- Hole, D.G.; Willis, S.; Pain, D.J.; Fishpool, L.D.; Butchart, S.H.M.; Collingham, Y.C.; Rahbek, C.; Huntley, B. Projected impacts of climate change on a continent-wide protected area network. Ecol. Lett. 2009, 12, 420–431. [Google Scholar] [CrossRef] [PubMed]
- Nuñez, T.A.; Lawler, J.J.; Mcrae, B.H.; Pierce, J.D.; Krosby, M.; Kavanagh, D.M.; Singleton, P.H.; Tewksbury, J.J. Connectivity Planning to Address Climate Change. Conserv. Biol. 2013, 27, 407–416. [Google Scholar]
- Pacifici, A.M.; Foden, W.B.; Visconti, P.; Watson, J.E.M.; Butchart, S.H.M.; Kovacs, K.M.; Scheffers, B.R.; Hole, D.G.; Martin, T.G.; Akçakaya, H.R.; et al. Assessing species vulnerability to climate change. Nat. Clim. Chang. 2015, 5, 215–225. [Google Scholar] [CrossRef] [Green Version]
- Hansen, A.J.; DeFries, R. Ecological mechanisms linking protected areas to surrounding lands. Ecol. Appl. 2007, 17, 974–988. [Google Scholar] [CrossRef] [PubMed]
- Harper, G.J.; Steininger, M.K.; Tucker, C.J.; Juhn, D.; Hawkins, F. Fifty years of deforestation and forest fragmentation in Madagascar. Environ. Conserv. 2007, 34, 325–333. [Google Scholar] [CrossRef]
- Hansen, M.C.; Potapov, P.V.; Moore, R.; Hancher, M.; Turubanova, S.A.; Tyukavina, A.; Thau, D.; Stehman, S.V.; Goetz, S.J.; Loveland, T.R.; et al. High-resolution global maps of 21st-century forest cover change. Science 2013, 342, 850–853. [Google Scholar] [CrossRef] [PubMed]
- Burgess, N.D.; Malugu, I.; Sumbi, P.; Kashindye, A.; Kijazi, A.; Tabor, K.; Mbilinyi, B.; Kashaigili, J.; Maxwell Wright, T.; Gereau, R.E.; et al. Two decades of change in state, pressure and conservation responses in the coastal forest biodiversity hotspot of Tanzania. ORYX 2017, 51, 77–86. [Google Scholar] [CrossRef]
- Tabor, K.; Burgess, N.D.; Mbilinyi, B.P.; Kashaigili, J.J.; Steininger, M.K. Forest and woodland cover and change in coastal Tanzania and Kenya. J. East Afr. Nat. Hist. 2010, 99, 19–45. [Google Scholar] [CrossRef]
- Eastman, J.R.; Solórzano, L.A.; van Fossen, M. Transition Potential Modeling for Land-Cover Change; GIS, Spatial Analysis, and Modeling; Maguire, J.D., Batty, M., Goodchild, M., Eds.; ESRI Press: Redlands, CA, USA, 2005; pp. 357–385. [Google Scholar]
- Hijmans, R.J.; Graham, C.H. The ability of climate envelope models to predict the effect of climate change on species distributions. Glob. Chang. Biol. 2006, 12, 2272–2281. [Google Scholar] [CrossRef]
- Foden, W.B.; Butchart, S.H.M.; Stuart, S.N.; Vié, J.-C.; Akçakaya, H.R.; Angulo, A.; DeVantier, L.M.; Gutsche, A.; Turak, E.; Cao, L.; et al. Identifying the World’s Most Climate Change Vulnerable Species: A Systematic Trait-Based Assessment of all Birds, Amphibians and Corals. PLoS ONE 2013, 8, e65427. [Google Scholar] [CrossRef] [PubMed]
- Araujo, M.B.; Cabeza, M.; Thuiller, W.; Hannah, L.; Williams, P.H. Would climate change drive species out of reserves? An assessment of existing reserve-selection methods. Glob. Chang. Biol. 2004, 10, 1618–1626. [Google Scholar] [CrossRef]
- Hannah, L.; Midgley, G.; Hughes, G.; Bomhard, B. The View from the Cape: Extinction Risk, Protected Areas, and Climate Change. Bioscience 2005, 55, 231–242. [Google Scholar] [CrossRef]
- Hewson, J.; Ashkenazi, E.; Andelman, S.; Steininger, M. Projected impacts of climate change on protected areas. Biodiversity 2008, 9, 100–105. [Google Scholar] [CrossRef]
- Garcia, R.A.; Cabeza, M.; Rahbek, C.; Araújo, M.B. Change and Their Implications for Biodiversity Multiple Dimensions of Climate. Science 2014, 344, 1247579. [Google Scholar] [CrossRef] [PubMed]
- Williams, J.W.; Jackson, S.T.; Kutzbach, J.E. Projected distributions of novel and disappearing climates by 2100 AD. Proc. Natl. Acad. Sci. USA 2007, 104, 5738–5742. [Google Scholar] [CrossRef] [PubMed] [Green Version]
- Ordonez, A.; Williams, J.W.; Svenning, J. Mapping climatic mechanisms likely to favour the emergence of novel communities. Nat. Clim. Chang. 2016, 6, 1104–1109. [Google Scholar] [CrossRef]
- Radeloff, V.C.; Williams, J.W.; Bateman, B.L.; Burke, K.D.; Carter, S.K.; Childress, E.S.; Cromwell, K.J.; Gratton, C.; Hasley, A.O.; Kraemer, B.M.; et al. The rise of novelty in ecosystems. Ecol. Appl. 2015, 25, 2051–2068. [Google Scholar] [CrossRef] [PubMed]
- Jetz, W.; Wilcove, D.S.; Dobson, A.P. Projected Impacts of Climate and Land-Use Change on the Global Diversity of Birds. PLoS Biol. 2007, 5, e157. [Google Scholar] [CrossRef] [PubMed]
- Hansen, A.; Neilson, R.; Dale, V.; Flather, C.; Iverson, L.; Currie, D.J.; Shafer, S.; Cook, R.; Bartlein, P.J. Global change in forests: Responses of species, communities, and biomes. Bioscience 2001, 51, 765–779. [Google Scholar] [CrossRef]
- Dale, V.H. The Relationship between Land-Use Change and Climate Change. Ecol. Appl. 1997, 7, 753–769. [Google Scholar] [CrossRef]
- Asner, G.P.; Loarie, S.R.; Heyder, U. Combined effects of climate and land-use change on the future of humid tropical forests. Conserv. Lett. 2010, 3, 395–403. [Google Scholar] [CrossRef] [Green Version]
- Lawler, J.J.; Ruesch, A.S.; Olden, J.D.; McRae, B.H. Projected climate-driven faunal movement routes. Ecol. Lett. 2013, 16, 1014–1022. [Google Scholar] [CrossRef] [PubMed]
- M.E.A. Current State & trends assessment. In Millennium Ecosystem Assessment; Island Press: Washington, DC, USA, 2005. [Google Scholar]
- Fischlin, A.; Midgley, G.F.; Price, J.T.; Leemans, R.; Gopal, B.; Turley, C.; Rounsevell, M.; Dube, P.; Tarazona, J.; Velichko, A. Ecosystems, their properties, goods, and services. In Climate Change 2007: Impacts, Adaptation and Vulnerability Contribution of Working Group II to the Fourth Assessment Report of the Intergovernmental Panel on Climate Change; Parry, M., Canziani, O., Palutikof, J., van der Linden, P., Hanson, C., Eds.; Cambridge University Press: Cambridge, UK, 2007; pp. 211–272. [Google Scholar]
- Hoffmann, M.; Hilton-taylor, C.; Angulo, A.; Böhm, M.; Brooks, T.M.; Butchart, S.H.M.; Carpenter, K.E.; Chanson, J.; Collen, B.; Cox, N.A.; et al. The Impact of Conservation on the Status of the World’s Vertebrates. Science 2010, 330, 1503–1509. [Google Scholar] [CrossRef] [PubMed]
- IUCN; UNEP-WCMC. The World Database on Protected Areas (WDPA). Available online: www.protectedplanet.net (accessed on 31 July 2017).
- Olson, D.M.; Dinerstein, E.; Wikramanayake, E.D.; Burgess, N.D.; Powell, G.V.N.; Underwood, E.C.; D’amico, J.O.; Itoua, I.; Strand, H.E.; Morrison, J.C.; et al. Terrestrial Ecoregions of the World: A New Map of Life on Earth. Bioscience 2001, 51, 933–938. [Google Scholar] [CrossRef]
- Hewson, J.; Crema, S.; González-Roglich, M.; Tabor, K.; Harvey, C. Projecting global and continental forest loss: New high-resolution datasets of deforestation risk. Environ. Res. Lett. submitted.
- FAO. FRA 2015 Terms and Definitions; Forest Resources Assessment Working Paper 180; FAO: Rome, Italy, 2015. [Google Scholar]
- NGA. Vector Map Level 0 (Digital Chart of the World); National Geospatial-Intelligence Agency: Springfield, VA, USA, 2000.
- Arino, O.; Ramos Perez, J.J.; Kalogirou, V.; Bontemps, S.; Defourny, P.; Van Bogaert, E. Global Land Cover Map for 2009 (GlobCover 2009). PANGAEA: European Space Agency (ESA) & Université catholique de Louvain (UCL): 2012. Available online: https://doi.org/10.1594/PANGAEA.787668 (accessed on 27 July 2018).
- USGS; NGA. Global Multi-Resolution Terrain Elevation Data 2010 (GMTED2010); U.S. Geological Survey: Reston, VA, USA, 2011.
- Avitabile, V.; Herold, M.; Heuvelink, G.B.M.; Lewis, S.L.; Phillips, O.L.; Asner, G.P.; Armston, J.; Ashton, P.S.; Banin, L.; Bayol, N.; et al. An integrated pan-tropical biomass map using multiple reference datasets. Glob. Chang. Biol. 2016, 22, 1406–1420. [Google Scholar] [CrossRef] [PubMed] [Green Version]
- WCS; CIESIN. Last of the Wild Project, Version 2; Global Hum; NASA SEDAC: Palisades, NY, USA, 2005.
- Zabel, F.; Putzenlechner, B.; Mauser, W. Global agricultural land resources—A high resolution suitability evaluation and its perspectives until 2100 under climate change conditions. PLoS ONE 2014, 9, e107522. [Google Scholar] [CrossRef] [PubMed]
- Siebert, S.; Henrich, V.; Frenken, K.; Burke, J. Global Map of Irrigation Areas Version 5; Rheinische Friedrich-Wilhelms-University: Bonn, Germany; Food and Agriculture Organization of the United Nations: Rome, Italy, 2013. [Google Scholar]
- Naidoo, R.T.I. Global-scale mapping of economic benefits from agricultural lands: Implications for conservation priorities. Biol. Conserv. 2007, 140, 40–49. [Google Scholar] [CrossRef]
- Hijmans, R.J.; Cameron, S.E.; Parra, J.L.; Jones, P.G.; Jarvis, A. Very high resolution interpolated climate surfaces for global land areas. Int. J. Climatol. 2005, 1978, 1965–1978. [Google Scholar] [CrossRef]
- Tabor, K.; Williams, J.W. Globally downscaled climate projections for assessing the conservation impacts of climate change. Ecol Appl. 2010, 20, 554–565. [Google Scholar] [CrossRef] [PubMed]
- Moss, R.H.; Edmonds, J.A.; Hibbard, K.A.; Manning, M.R.; Rose, S.K.; Van Vuuren, D.P.; Carter, T.R.; Emori, S.; Kainuma, M.; Kram, T.; et al. The next generation of scenarios for climate change research and assessment. Nature 2010, 463, 747–756. [Google Scholar] [CrossRef] [PubMed]
- Mahony, C.R.; Cannon, A.J.; Wang, T.; Aitken, S.N. A closer look at novel climates: New methods and insights at continental to landscape scales. Glob. Chang. Biol. 2017, 23, 3934–3955. [Google Scholar] [CrossRef] [PubMed]
- Nepstad, D.; McGrath, D.; Stickler, C.; Alencar, A.; Azevedo, A.; Swette, B.; Bezerra, T.; DiGiano, M.; Shimada, J.; da Motta, R.S.; et al. Slowing Amazon deforestation through public policy and interventions in beef and soy supply chains. Science 2014, 344, 1118–1123. [Google Scholar] [CrossRef] [PubMed]
- Austin, K.; González-Roglich, M.; Schaffer-Smith, D.; Schwantes, A.; Swenson, J. Trends in size of tropical deforestation events signal increasing dominance of industrial-scale drivers. Environ. Res. Lett. 2017, 12, 054009. [Google Scholar] [CrossRef] [Green Version]
- Bruner, A.G.; Gullison, R.E.; Balmford, A. Financial Costs and Shortfalls of Managing and Expanding Protected-Area Systems in Developing Countries. Bioscience 2004, 54, 1119–1126. [Google Scholar] [CrossRef]
- Jones, K.R.; Venter, O.; Fuller, R.A.; Allan, J.R.; Maxwell, S.L.; Negret, P.J.; Watson, J.E.M. One-third of global protected land is under intense human pressure. Science 2018, 360, 788–791. [Google Scholar] [CrossRef] [PubMed]
- Angelsen, A.; Brown, S.; Loisel, C.; Peskett, L.; Streck, C.; Zarin, D. Reducing Emissions from Deforestation and Forest Degradation (REDD): An Options Assessment Report. 2009. Available online: http://www.redd-oar.org/links/REDD-OAR_en.pdf (accessed on 27 July 2018).
- Schaafsma, M.; Morse-Jones, S.; Posen, P.; Swetnam, R.D.; Balmford, A.; Bateman, I.J.; Burgess, N.D.; Chamshama, S.A.O.; Fisher, B.; Freeman, T.; et al. The importance of local forest benefits: Economic valuation of Non-Timber Forest Products in the Eastern Arc Mountains in Tanzania. Glob. Environ. Chang. Policy Dimens. 2014, 24, 295–305. [Google Scholar] [CrossRef] [Green Version]
- Johnstone, J.F.; Allen, C.D.; Franklin, J.F.; Frelich, L.E.; Harvey, B.J.; Higuera, P.E.; Mack, M.C.; Meentemeyer, P.K.; Metz, M.R.; Perry, G.L.W.; et al. Changing disturbance regimes, ecological memory, and forest resilience. Front Ecol Environ. 2016, 14, 369–378. [Google Scholar] [CrossRef]
- Pratihast, A.K.; DeVries, B.; Avitabile, V.; de Bruin, S.; Herold, M.; Bergsma, A. Design and Implementation of an Interactive Web-Based Near Real-Time Forest Monitoring System. PLoS ONE 2016, 11, e0150935. [Google Scholar] [CrossRef] [PubMed]
- Davies, D.; Murphy, K.; Michael, K.; Becker-Reshef, I.; Justice, C.; Boller, R.; Braun, S.A.; Schmaltz, J.E.; Wong, M.M.; Pasch, A.N.; et al. The use of NASA LANCE imagery and data for near real-time applications. In Time-Sensitive Remote Sensing; Springer: New York, NY, USA, 2015; pp. 165–182. [Google Scholar]
- Petrica, L. An evaluation of low-power microphone array sound source localization for deforestation detection. Appl. Acoust. 2016, 1, 162–169. [Google Scholar] [CrossRef]
- Musinsky, J.; Tabor, K.; Cano, C.A.; Ledezma, J.C.; Mendoza, E.; Rasolohery, A.; Sajudin, E.R. Conservation impacts of a near real-time forest monitoring and alert system for the tropics. Remote Sens. Ecol. Conserv. 2018, 1–8. [Google Scholar] [CrossRef]
- Mora, C.; Frazier, A.G.; Longman, R.J.; Dacks, R.S.; Walton, M.M.; Tong, E.J.; Sanchez, J.J.; Kaiser, L.R.; Stender, Y.O.; Anderson, J.M.; et al. The projected timing of climate departure from recent variability. Nature 2013, 502, 183–187. [Google Scholar] [CrossRef] [PubMed]
- Wiens, J.A.; Seavy, N.E.; Jongsomjit, D. Protected areas in climate space: What will the future bring? Biol. Conserv. 2011, 144, 2119–2125. [Google Scholar] [CrossRef]
- Asner, G.P.; Tupayachi, R. Accelerated losses of protected forests from gold mining in the Peruvian Amazon. Environ. Res. Lett. 2017, 12, 094004. [Google Scholar] [CrossRef]
- Beaudrot, L.; Ahumada, J.A.; Brien, T.O.; Alvarez-loayza, P.; Boekee, K.; Campos-arceiz, A.; Eichberg, D.; Espinosa, S.; Fegraus, E.; Fletcher, C.; et al. Standardized Assessment of Biodiversity Trends in Tropical Forest Protected Areas: The End is not in Sight. PLoS Biol. 2016, 14, e1002357. [Google Scholar] [CrossRef] [PubMed]
Figure 1.
Global tropical forest risk combinations. This map shows the combined deforestation and climate risks for all tropical forests with >10% forest cover in 2014. The data are displayed as deforestation risk (red channel), disappearing climate risk (green channel), and novel climate risk (blue channel), for (a) sub-Saharan Africa, (b) Madagascar, (c) Southeast Asia, (d) Asia-Pacific and Australia, (e) North America, and (f) South America. Combinations of the gradient of values for all three risks revealed spatially distinct patterns. Yellow indicates a combination of high deforestation, high disappearing, and low novel climate risks; purple indicates a combination of high deforestation, high novel climate, and low disappearing climate risks; and cyan is a combination of low deforestation and high combined climate risks. Areas at high risk for both deforestation and climate change are shown in white and areas with both low deforestation and climate change risks appear dark grey. The global locator map depicts the humid tropical forest biome in dark gray.

Figure 2.
Distribution of PA risks. These two radar graphs show the area of PAs exposed to the highest and lowest deforestation, disappearing climate, and novel climate risks. The figure shows (a) the total area of PAs in Mha exposed to the highest and lowest risks by continent and (b) the percent area of PAs per continent and humid tropics biome exposed to the highest and lowest risks.
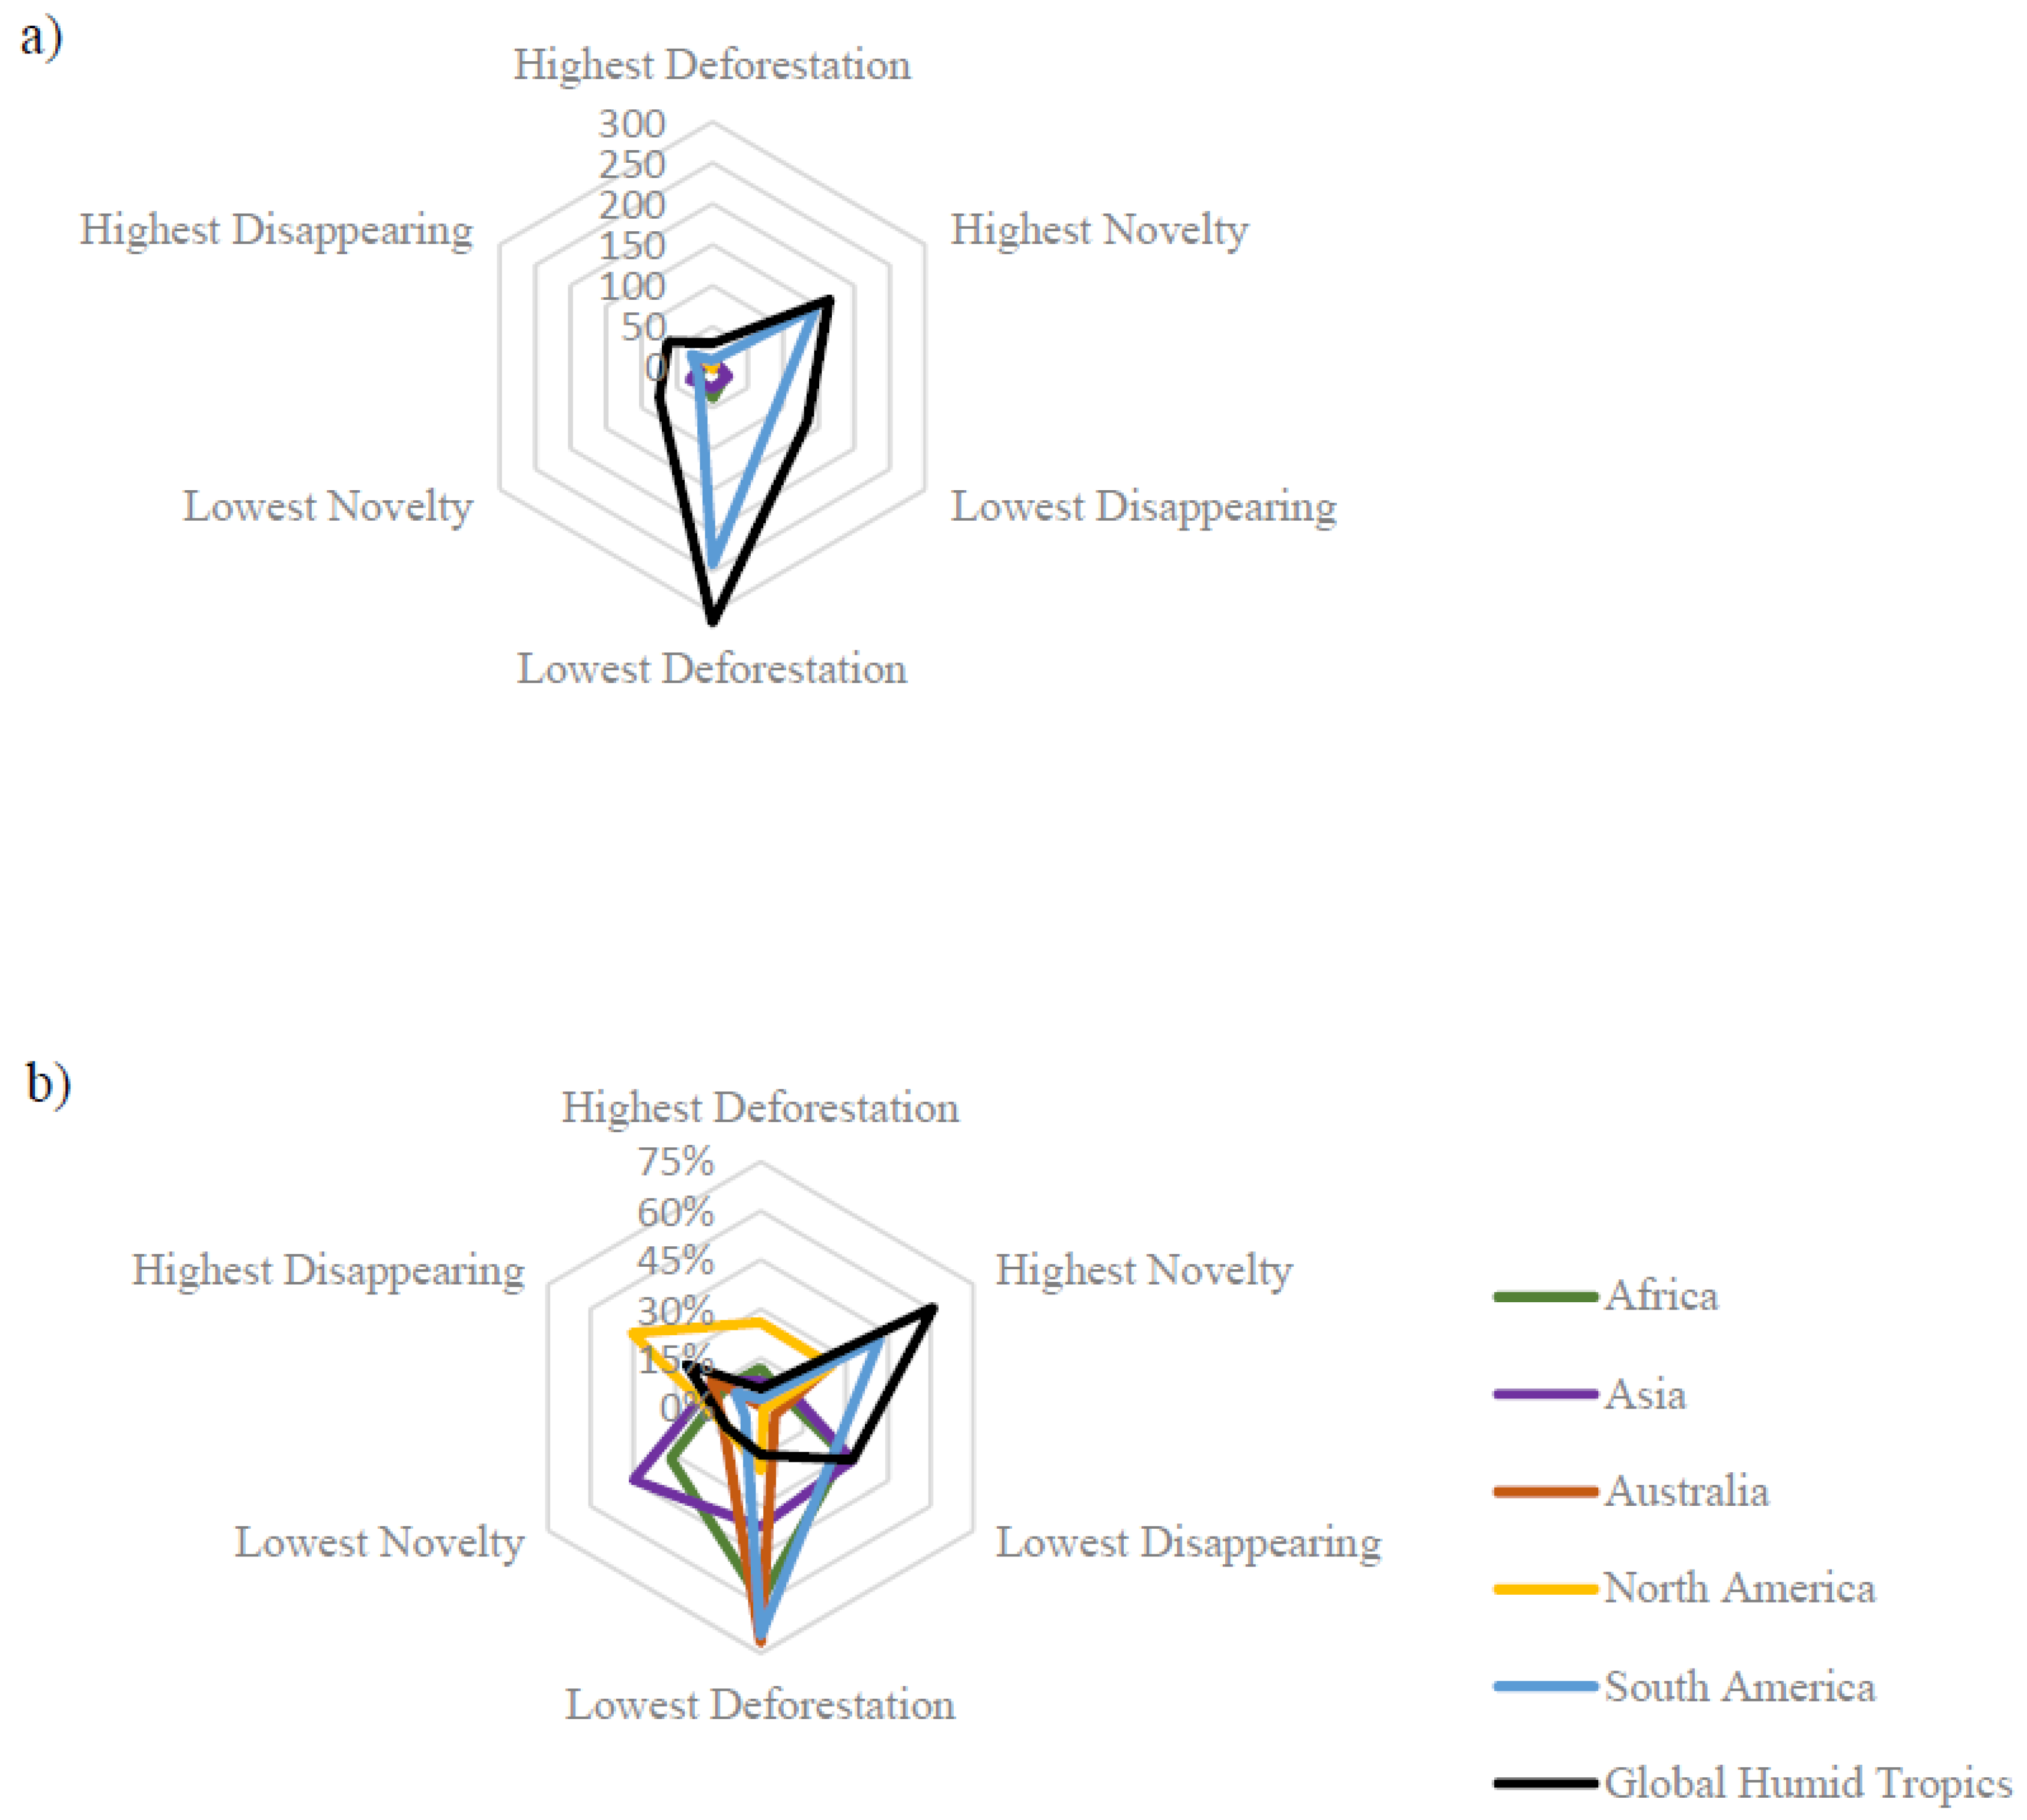
Figure 3.
PAs exposed to combined risks by continent. This quadrant of figures shows the distribution of deforestation and combined climate risks by continent for: (a) highest deforestation and highest combined climate risks; (b) highest deforestation and lowest combined climate risks; (c) lowest deforestation and highest combined climate risks; and (d) lowest deforestation and lowest combined climate risks. Combined climate risks included either novel or disappearing risk. The number in the center of the pie charts indicates the total area affected of global humid tropical forest PAs. The number next to each continent name in the pie chart indicates the combined deforestation and climate risk as a percent of the total area of global humid tropical PAs affected. The bar charts show the proportion of area of PAs per continent in each risk category.


Table 1.
Driver variables used to generate potential deforestation risk.
| Variable | Source |
|---|---|
| Distance to railroads | Vmap0 [55] |
| Distance to roads | Vmap0 [55] |
| Distance to trails | Vmap0 [55] |
| Distance to urban areas | [56] |
| Elevation | Global Multi-resolution Terrain Elevation Data [57] |
| Slope | Derived from Elevation |
| Above Ground Biomass | GeoCarbon [58] |
| Human Influence Index | [59] |
| Crop suitability | GLUES [60] |
| Irrigation area | FAO [61] |
| Global Opportunity Cost | [62] |
| Annual Precipitation | Bioclim [63] |
| Annual Mean temperature | Bioclim [63] |
| Protected Areas | [51] |
| Ecoregion Biomes | [52] |
Table 2.
Thresholds for humid tropical biome protected areas (Pas) with highest and lowest climate and deforestation risks.
Table 2.
Thresholds for humid tropical biome protected areas (Pas) with highest and lowest climate and deforestation risks.
| Risk Category | Threshold | Area (Mha) | Percent of Total Area of PAs |
|---|---|---|---|
| Highest Deforestation Risk | >0.41 | 29.0 | 6% |
| Lowest Deforestation Risk | <0.07 | 312.5 | 61% |
| Highest Disappearing Climate Risk | >2.00 | 62.3 | 12% |
| Lowest Disappearing Climate Risk | <1.10 | 133.7 | 26% |
| Highest Novel Climate Risk | >2.41 | 165.3 | 32% |
| Lowest Novel Climate Risk | <1.18 | 74.9 | 15% |
Table 3.
Distribution of PAs across the humid tropical forest biome.
| Continent | Number of PAs | Total Area (Mha) | Percent of PA’s | Percent by Area |
|---|---|---|---|---|
| Africa | 1444 | 64.6 | 19% | 13% |
| Asia | 2079 | 70.8 | 27% | 14% |
| Australia | 370 | 4.4 | 5% | 1% |
| North America | 1290 | 26.2 | 17% | 5% |
| South America | 2489 | 347.0 | 32% | 68% |
| Total | 7672 | 513.0 | 100% | 100% |
© 2018 by the authors. Licensee MDPI, Basel, Switzerland. This article is an open access article distributed under the terms and conditions of the Creative Commons Attribution (CC BY) license (http://creativecommons.org/licenses/by/4.0/).
Share and Cite
MDPI and ACS Style
Tabor, K.; Hewson, J.; Tien, H.; González-Roglich, M.; Hole, D.; Williams, J.W. Tropical Protected Areas Under Increasing Threats from Climate Change and Deforestation. Land 2018, 7, 90. https://doi.org/10.3390/land7030090
AMA Style
Tabor K, Hewson J, Tien H, González-Roglich M, Hole D, Williams JW. Tropical Protected Areas Under Increasing Threats from Climate Change and Deforestation. Land. 2018; 7(3):90. https://doi.org/10.3390/land7030090
Chicago/Turabian StyleTabor, Karyn, Jennifer Hewson, Hsin Tien, Mariano González-Roglich, David Hole, and John W. Williams. 2018. "Tropical Protected Areas Under Increasing Threats from Climate Change and Deforestation" Land 7, no. 3: 90. https://doi.org/10.3390/land7030090
Note that from the first issue of 2016, this journal uses article numbers instead of page numbers. See further details here.