1. Introduction
Agriculture and forests are essential to preserve biodiversity and develop the economy in rural areas. They supply essential goods for human survival and well-being and hence need to be well managed [
1]. Thus, information on the spatial distribution of land-use at a detailed level is crucial for models and applications on agro-forestry production that require a spatial representation [
2,
3]. For instance, in the European Union, agricultural statistics try to report information at the regional and sub-regional level. However, the Agricultural Census, which is the main territorial statistical operation in European Union, is carried out every 10 years and between this period, there is no available information at the municipality or parish levels. This lack of information is a worldwide problem since an updated knowledge of land-use contributes to ensure a judicious spatial planning that considers characteristics of interest [
4,
5,
6,
7,
8,
9].
Every 3 years the LUCAS survey (Land-Use/Cover Area frame Statistical survey) is carried out. Taking photographs, this survey collects land cover/land-use, agro-environmental, and soil data by field observation of referenced points [
10]. Information is also available monthly via satellite imagery from LANDSAT and more recently SENTINEL 2. LANDSAT and SENTINEL 2 are multispectral satellites with high spatial resolution developed by the National Aeronautics and Space Administration (NASA) and by the European Space Agency (ESA), respectively. All these sources can be used to update and predict the land-use at a detailed level where the information is incomplete. Thus, this paper is addressed to the development of a framework that is able to use several sources of information including satellite imagery to disaggregate agricultural data.
The traditional land-use models are generally based on econometrics tools and typically aim to assess the relationship between land use choices and a set of independent variables [
11]. The land use literature already explicitly considers the spatial dependence, but only a few studies benefit from spatial econometric tools [
12,
13,
14]. Recently, the proposed land use models tend to ignore spatial dependency since it raises some problems associated with econometric estimation, namely, hypothesis testing and prediction [
15,
16].
However, there is an increased demand for data disaggregation tools [
17,
18,
19,
20]. Several models have been developed, using different techniques to directly disaggregate data from statistical sources. A cross-entropy approach to disaggregate data at the pixel level, using previous estimates from land cover maps and suitability maps was developed [
5,
6]. An approach that uses a multinomial logistic regression model, taking advantage of the LUCAS survey and an entropy approach to disaggregate data from regional statistics has been presented [
13]. The posterior density of the previous estimated was maximized to achieve consistency with administrative statistics, using information from the sampling points utilized to estimate the land-use choices [
4]. In Europe, the Capri-Spat (Common Agricultural Policy Regional Impact) approach for disaggregating agricultural data from statistics, which uses the Highest Posterior Density estimator, was compared with the Dynamic Conversion of Land Use and its Effects model [
21]). In Portugal, Reference [
22] presented an approach which combines a previous estimate of an iterative algorithm and the HJ-Biplot methods. In this study, a general approach is also proposed, which uses supervised classifications as previous estimates in a cross-entropy model.
Remote sensing and satellite imagery offer new perspectives for analyzing land use, namely by performing supervised classifications in which sample areas (“training fields”) are used to identify the spectral signatures of the various land uses automatically [
23]. In the last 20 years, supervised classifications of satellite imagery have developed considerably [
24,
25,
26,
27] and several case studies can be found worldwide. Two agricultural land cover classifications using mono-temporal and multi-temporal Landsat scenes have been presented [
28]. A land use map of the Galaudu watershed was produced in Nepal [
29]. Satellite data and data from the Israeli Geographic Information System were used to create a land use map for the northern Negev [
30]. Maximum likelihood supervised classification and post-classification change detection techniques were applied to Landsat images to map the land cover changes in the north-west coast of Egypt [
31].
Over the last years, the agricultural data disaggregation approaches used several techniques: logistic regressions, expert knowledge, homogeneous units, Bayesian methods, entropy, and highest posterior density. These approaches allow taking advantage of the existing information (including biophysical information, land use maps, and the LUCAS survey), but not of the data presented on satellite imagery that are available periodically using automatic cartography techniques, such as supervised classifications.
Therefore, this study proposes a methodological approach for disaggregating agricultural data using supervised classifications and an entropy approach. This is the first study that provides an approachable method to take full advantage of the LUCAS survey, supervised classification techniques, biophysical data, experts’ knowledge, and historical data for disaggregating data at the detailed pixel level from incomplete information. No other study has proposed the use of supervised classification techniques for data disaggregation or the use of the LUCAS survey and expert knowledge to carry out supervised classifications. Moreover, techniques for improving these estimates using entropy have not been considered. The proposed approach allows providing more up-to-date and reliable data due to the good periodicity of the available satellite imagery.
Thus, this study integrates a complete set of biophysical information, compares different classification algorithms and tests the proposed approach for the Algarve region and one pilot municipality, in southern Portugal. Two different supervised classification algorithms are used in order to show the reliability of the approach. The aim is to include in the entropy model used in the disaggregation process for additional information through various restrictions.
The remainder of the paper is presented as follows: in section two, the methodological approach is presented; in section three, the data and model application scenarios are explained; sections four is dedicated to the results and analyses. Finally, section five presents the concluding remarks.
2. Methodological Approach
Recent research shows a variety of studies that use supervised classification techniques to produce thematic maps of land use [
23,
25,
28,
32]. The supervised classification method is an established classification from a training dataset, which contains the predictor variables measured in each sampling unit and assigns prior classes to the sampling units and, therefore, presents several advantages over unsupervised ones [
26]. A comparison between different classification methods and their performance can found in References [
27,
28,
29,
30].
The methodological approach proposed combines several techniques, such as the classified supervisions of satellite images, cluster analysis, mapping, and cross-entropy minimization, and considers several sources of information. Several studies use entropy to estimate data when ordinary methods are not applicable since it overcomes some problems that hamper traditional econometric methods [
6,
33,
34,
35,
36]. A generalized maximum entropy model to estimate multi-output production functions was adopted by References [
37,
38]. The maximum entropy can be used to estimate farm-level multi-input/multi-output production functions [
39]. A dynamic approach for disaggregating agricultural data was presented by Reference [
17]. The results of farm management models were disaggregated to the level required by natural science models [
40]. Cross-entropy was also used to present the spatiotemporal dynamics of a maize cropping system in Northeast China [
3]. In Portugal, several entropy models were also developed to disaggregate data [
18,
19,
40,
41,
42,
43].
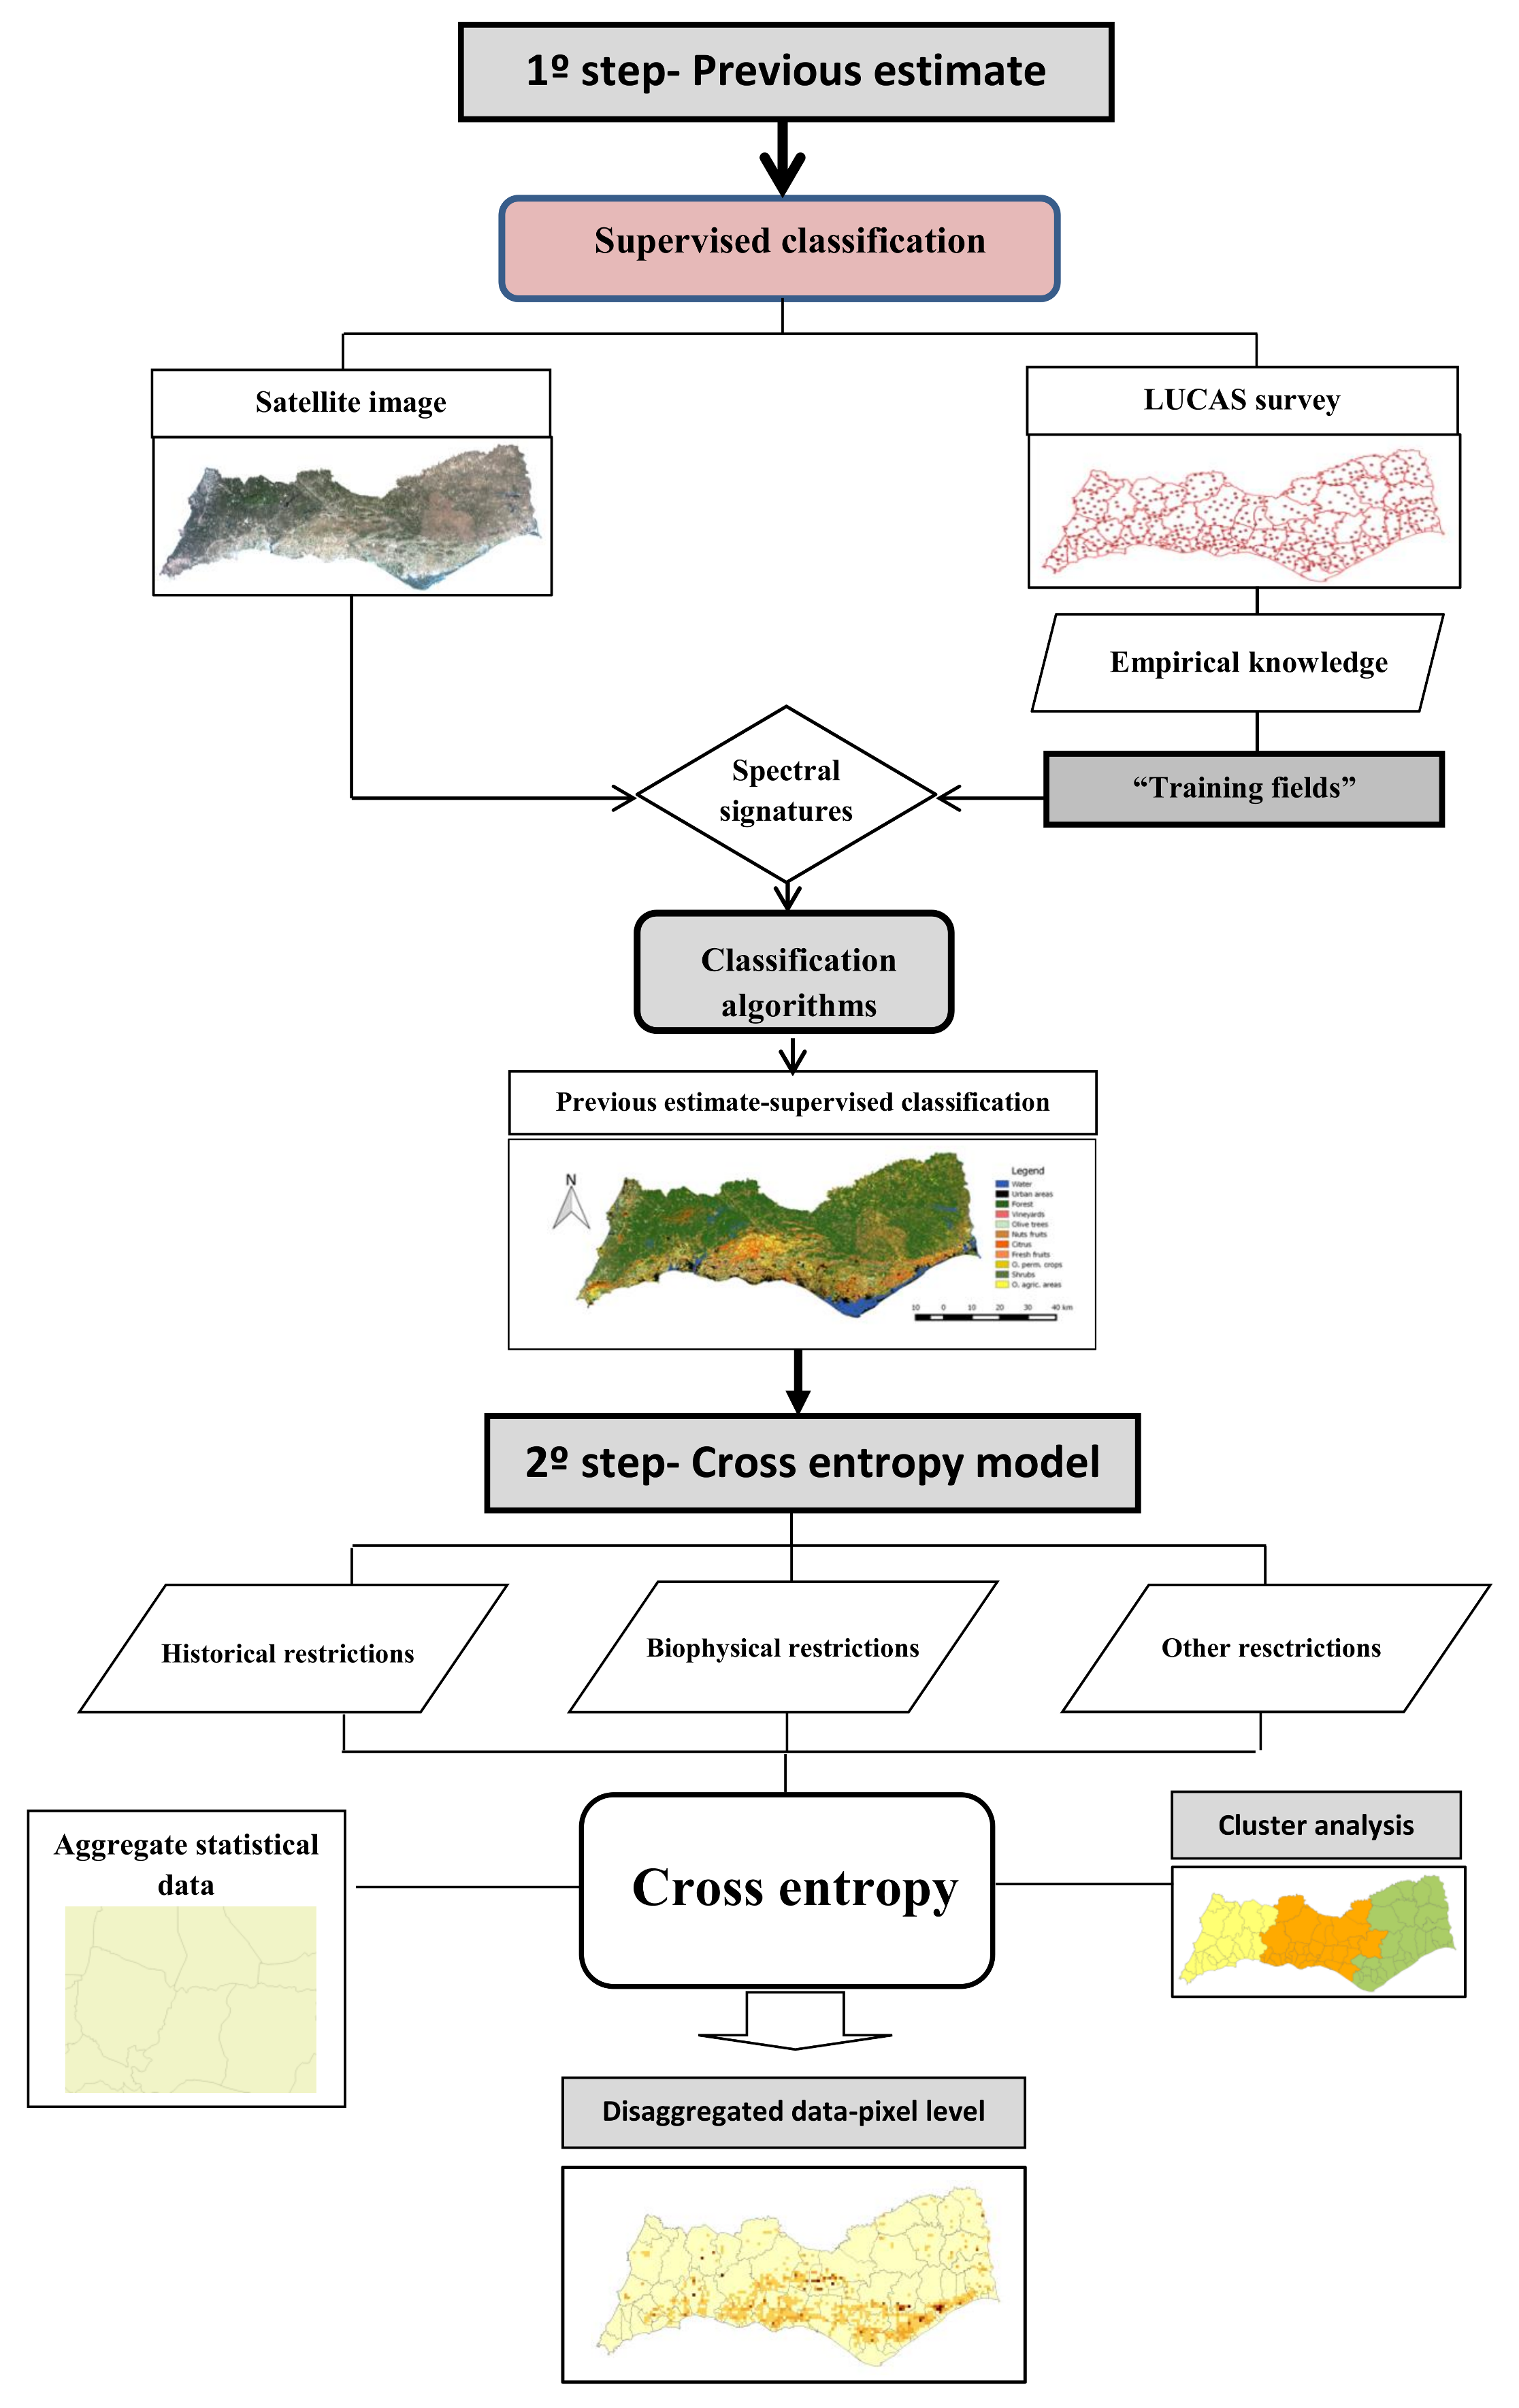
The proposed methodological approach comprises two main steps, as shown in
Figure 1. In the first one, prior information is previously estimated from a supervised classification of satellite imagery, the Lucas Survey, and experts’ knowledge from the Ministry of Agriculture. In the second one, a cross-entropy model is applied to disaggregate the data from an aggregate level (for instance national or regional) to a detailed level (local or pixel level) with respect to the prior of information estimated. This procedure allows for a guaranteed consistency among the different sources of information and with the aggregate.
The supervised classification of satellite images is carried out to identify the distribution of land-use. This process comprises of the following steps: (i) collecting all the available information and selecting carefully the satellite imagery to be processed; (ii) defining the “training fields” using the LUCAS survey samples as references and empirical knowledge; (iii) defining the spectral signatures; (iv) implementing the supervised classification algorithms. As in other previous studies [
4,
8], full advantage was taken from the LUCAS Survey. It allows for using a set of samples that can work as “training fields” or sample areas in a “supervised classification” of the satellite images. To calculate the prior estimate, the Minimum Distance algorithm and the Maximum Likelihood algorithm algorithms were used and their results compared.
The Minimum Distance algorithm calculates the Euclidean distance (
x,
y) between the spectral signatures of the image pixels and the training spectral signatures, according to the following equation:
where
x is the spectral signature vector of an image pixel;
y is the spectral signature vector of a training area; and
n is the number of image bands. Therefore, the distance is calculated for every pixel in the image, assigning the class of the spectral signature that is closer, according to the following discriminant function:
where
Ck is the land cover class
k;
yk is the spectral signature of class
k; and
yj is the spectral signature of class
j.
The Maximum Likelihood algorithm calculates the probability distribution for the classes related to Bayes’ theorem, estimating if a pixel belongs to a land cover class. The discriminant function is calculated for every pixel as follows:
where
p(
Ck) is the probability that the correct class is
;
is the determinant of the covariance matrix of the data in class
; and
is the inverse of the covariance matrix.
Since the prior of information has been estimated, it can be used in the disaggregation process to guide a cross-entropy model. This procedure is very useful because it allows incorporating additional information in the disaggregation process, such as biophysical restrictions, historic restrictions, and so forth. In addition, a unique optimal solution is obtained to the disaggregation process and the consistency among different sources of information is guaranteed.
Thus, inspired by the studies of References [
8,
41], the following generalized cross-entropy model was developed
where,
is the probability of land-use
k to be estimated in area
i;
is the matrix of probabilities of each land-use
k in area
i resulting from prior estimates;
STi is the area weight of each disaggregated unit
i;
STATk are the regional statistics for land-use
k;
is the land use available for land-use
k in disaggregated unit
i;
are the minimum historical limits and
are the maximum historical limits for each land-use by disaggregated unit
i; and
refers to a parameterized error term [
36].
Equation (4) is the objective function, which minimizes the joint cross-entropy of the estimated probability distribution (), the previous estimate (), and the error distribution (). Equation (5) guarantees that and have the characteristics of a probability distribution. Equation (6) ensures that the disaggregated shares are compatible with the aggregate at the regional level. Equation (7) ensures that biophysical limits (restrictions of soils, climate, and slope) are respected. Equation (8) relates to the historical limits that must be respected for land use. These limits represent the maximum and minimum areas that a given land-use has achieved in the past. So, using this information, we can bound the model variables to more likelihood values concerning crop areas.
After having calculated the shares, it only remains to redistribute the regional data by using the following equation:
where is the estimated area for land use
k in unit
i and
SA is the area of unit
i.
An important phase of our approach is the validation of the entropy model in order to test the coherency of the disaggregation process. To carry out this validation process, deviation measures and general statistical measures were used. As deviation measures, the Prescription Absolute Deviation (PAD) and the Weighted Prescription Absolute Deviation (WPAD) were considered. The PAD indicator measures the deviation between estimations and statistical data:
The
WPADi indicator allows assessing the real deviation at the statistical unit
c level and at the aggregate level and is obtained by the following:
Finally, at the aggregate level, WPAD is calculated as follows:
Regarding the general statistical measures, the correlation coefficient of Pearson
R, the determination coefficient
R2, and the modeling efficiency (EF) were used to compare
and
. The
R coefficient is a measure of association among two variables while
R2 refers to how the variance of the dependent variable is explained by the independent variables and is used to measure the adjustment of a regression line. Thus, when
R2 is equal to 1, the estimated data are completely explained by the variance of real data. EF is a normalized measure to evaluate the model performance [
6]. An EF indicator equal to 1 shows a total efficiency of the model, since there are complete information gains, while an indicator equal to 0 means the opposite. In cases where deviations between real and estimated data are high, this indicator may present negative values. These indicators were calculated as follows:
where
is the observed value;
is the model result, and
is the average of the
values.
3. Data and Application Scenarios
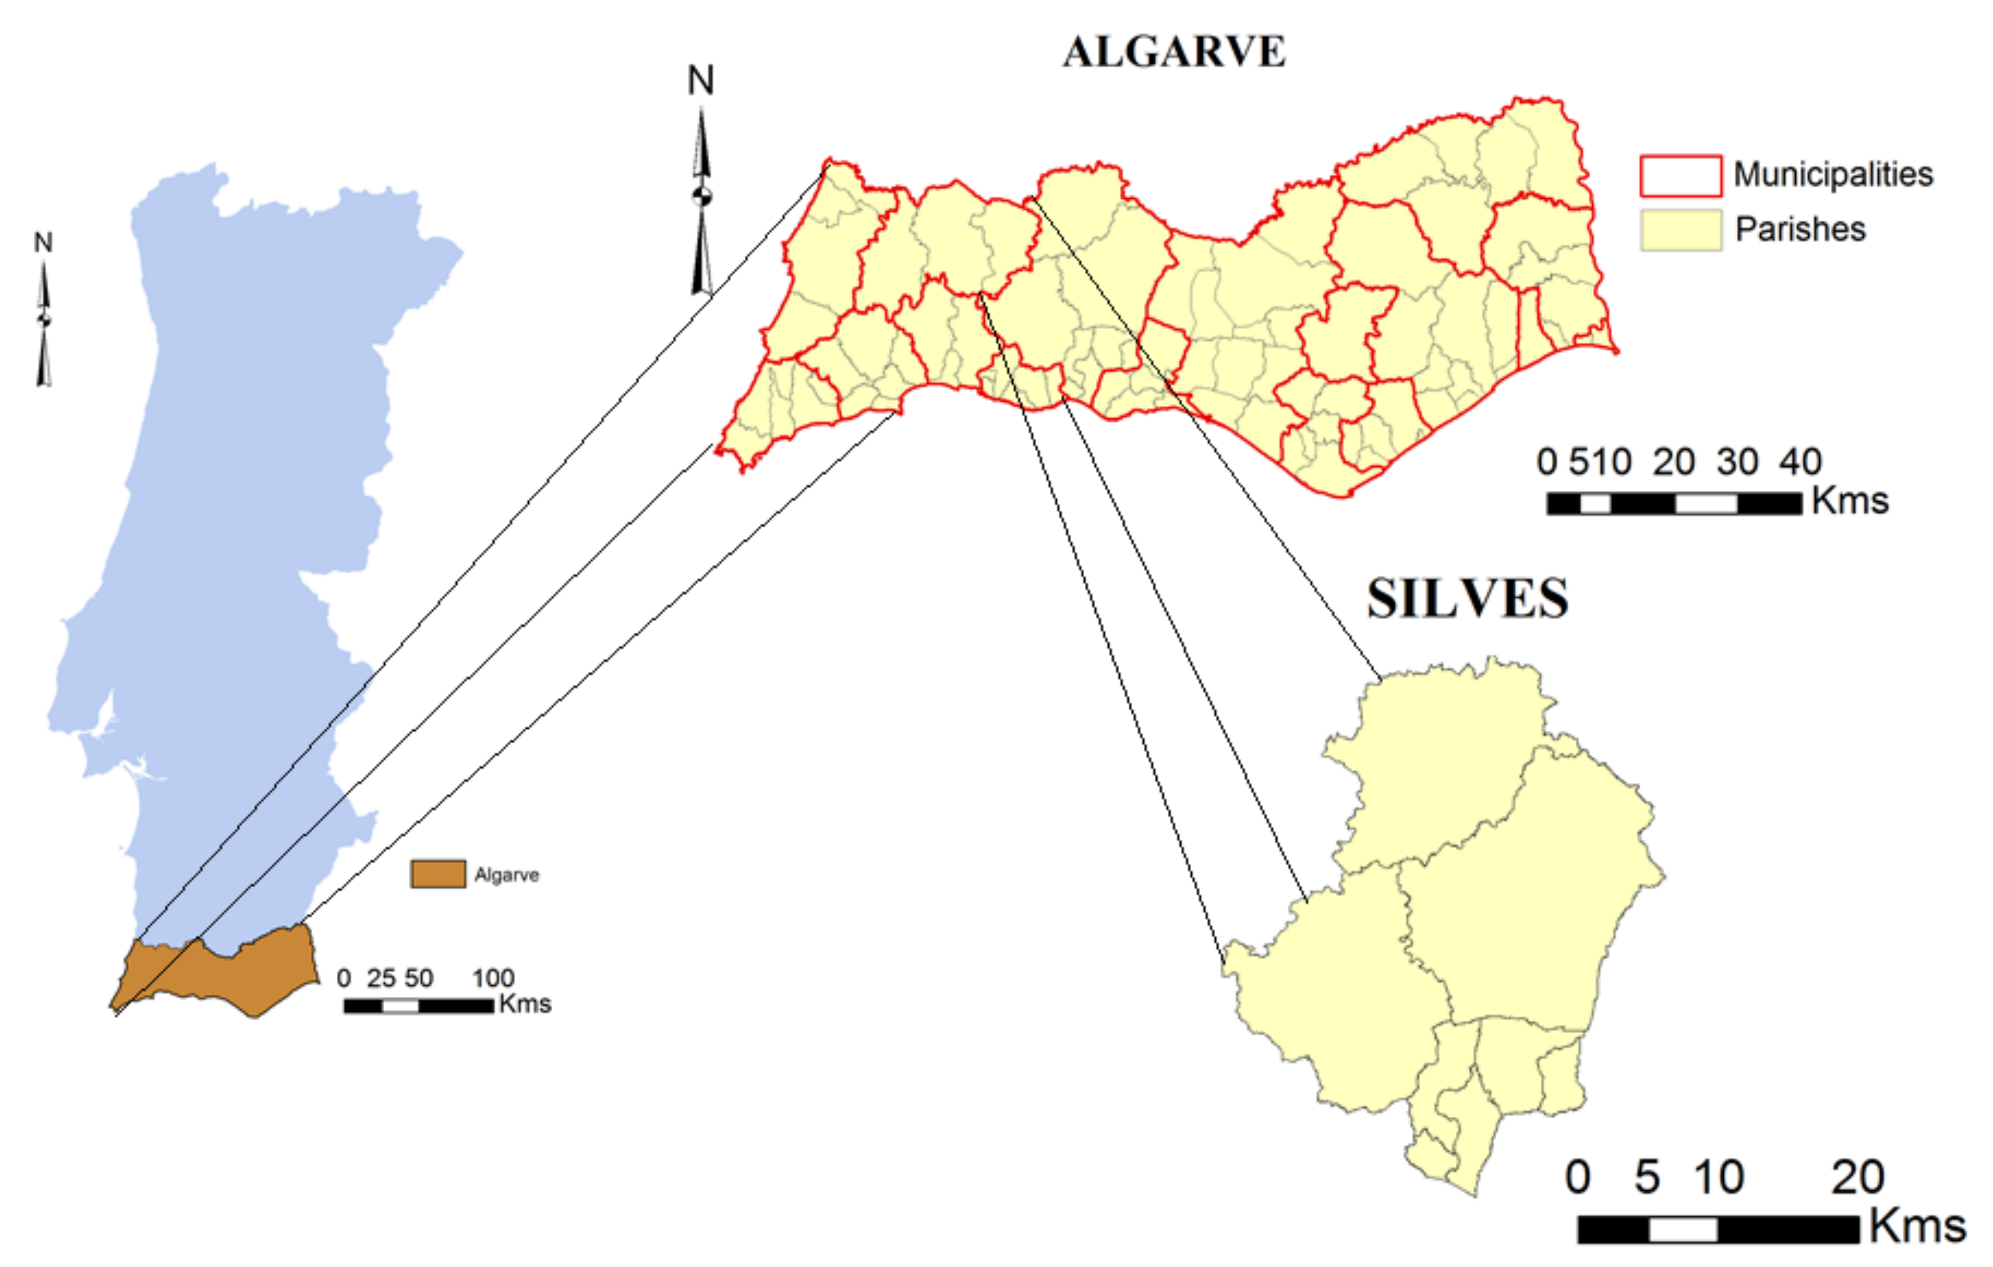
The Algarve region in the south of Portugal was selected to implement the proposed approach in order to disaggregate the data to a kilometric grid. (
Figure 2). This region was selected to implement this study due to recent dynamics regarding permanent crops, namely, regarding irrigated ones (such as citrus) and the necessity of policy evaluation. Algarve is a region with an area of 4996.8 km
2 and, in 2010, was composed of 16 municipalities and 84 parishes, which was reduced to 67 a few years later. The Mediterranean climate predominates and there are several biophysical contrasts between the coastal and inland areas with less fertile areas and higher slopes.
There are municipalities where permanent crops are predominant and citrus areas are relevant. This is the case of Silves, which was chosen as the pilot municipality to disaggregate the data to a more detailed 25-hectare grid. This municipality covers an area of about 680.1 km2 and, in 2009, was divided into 8 parishes which were later reduced to 6. It extends from the inland Algarve to the coast and in 2009, the agrarian census represented more than 17% of the permanent crop area and about 41% of the citrus area in the region.
In the Algarve region and Silves municipality, the predominant land-use is permanent crops, which were disaggregated as follows: fresh fruits, citrus, nuts, olive trees, vineyards, and other permanent crops.
The “training fields” (that is, the sample areas for defining the spectral signatures) for the supervised classification were defined using the 2012 LUCAS survey and the knowledge of experts from the Ministry of Agriculture, having been considered from a total of 191 sample areas in the whole Algarve region. For defining the training fields to implement the supervised classifications, the LUCAS survey may be a source of information, but if these observations are limited in number, the empirical knowledge of the area by technicians may be inserted. In Portugal, this empirical knowledge was easily obtained in the different regions to define the training fields and to carry out the supervised classifications. This approach has, therefore, the potential to be implemented in other areas if there is information on the satellite imagery. Regarding the satellite imagery, the LANDSAT 5 and 8 images with 30-m resolution were used in the supervised classification process. The LANDSAT 5 image used to disaggregate the 2009 data is from 4 July 2009 while the LANSAT 8 image used for Silves is from 29 June 2013. Both images used were obtained from the NASA system by using the Earth Explorer:
http://earthexplorer.usgs.gov.
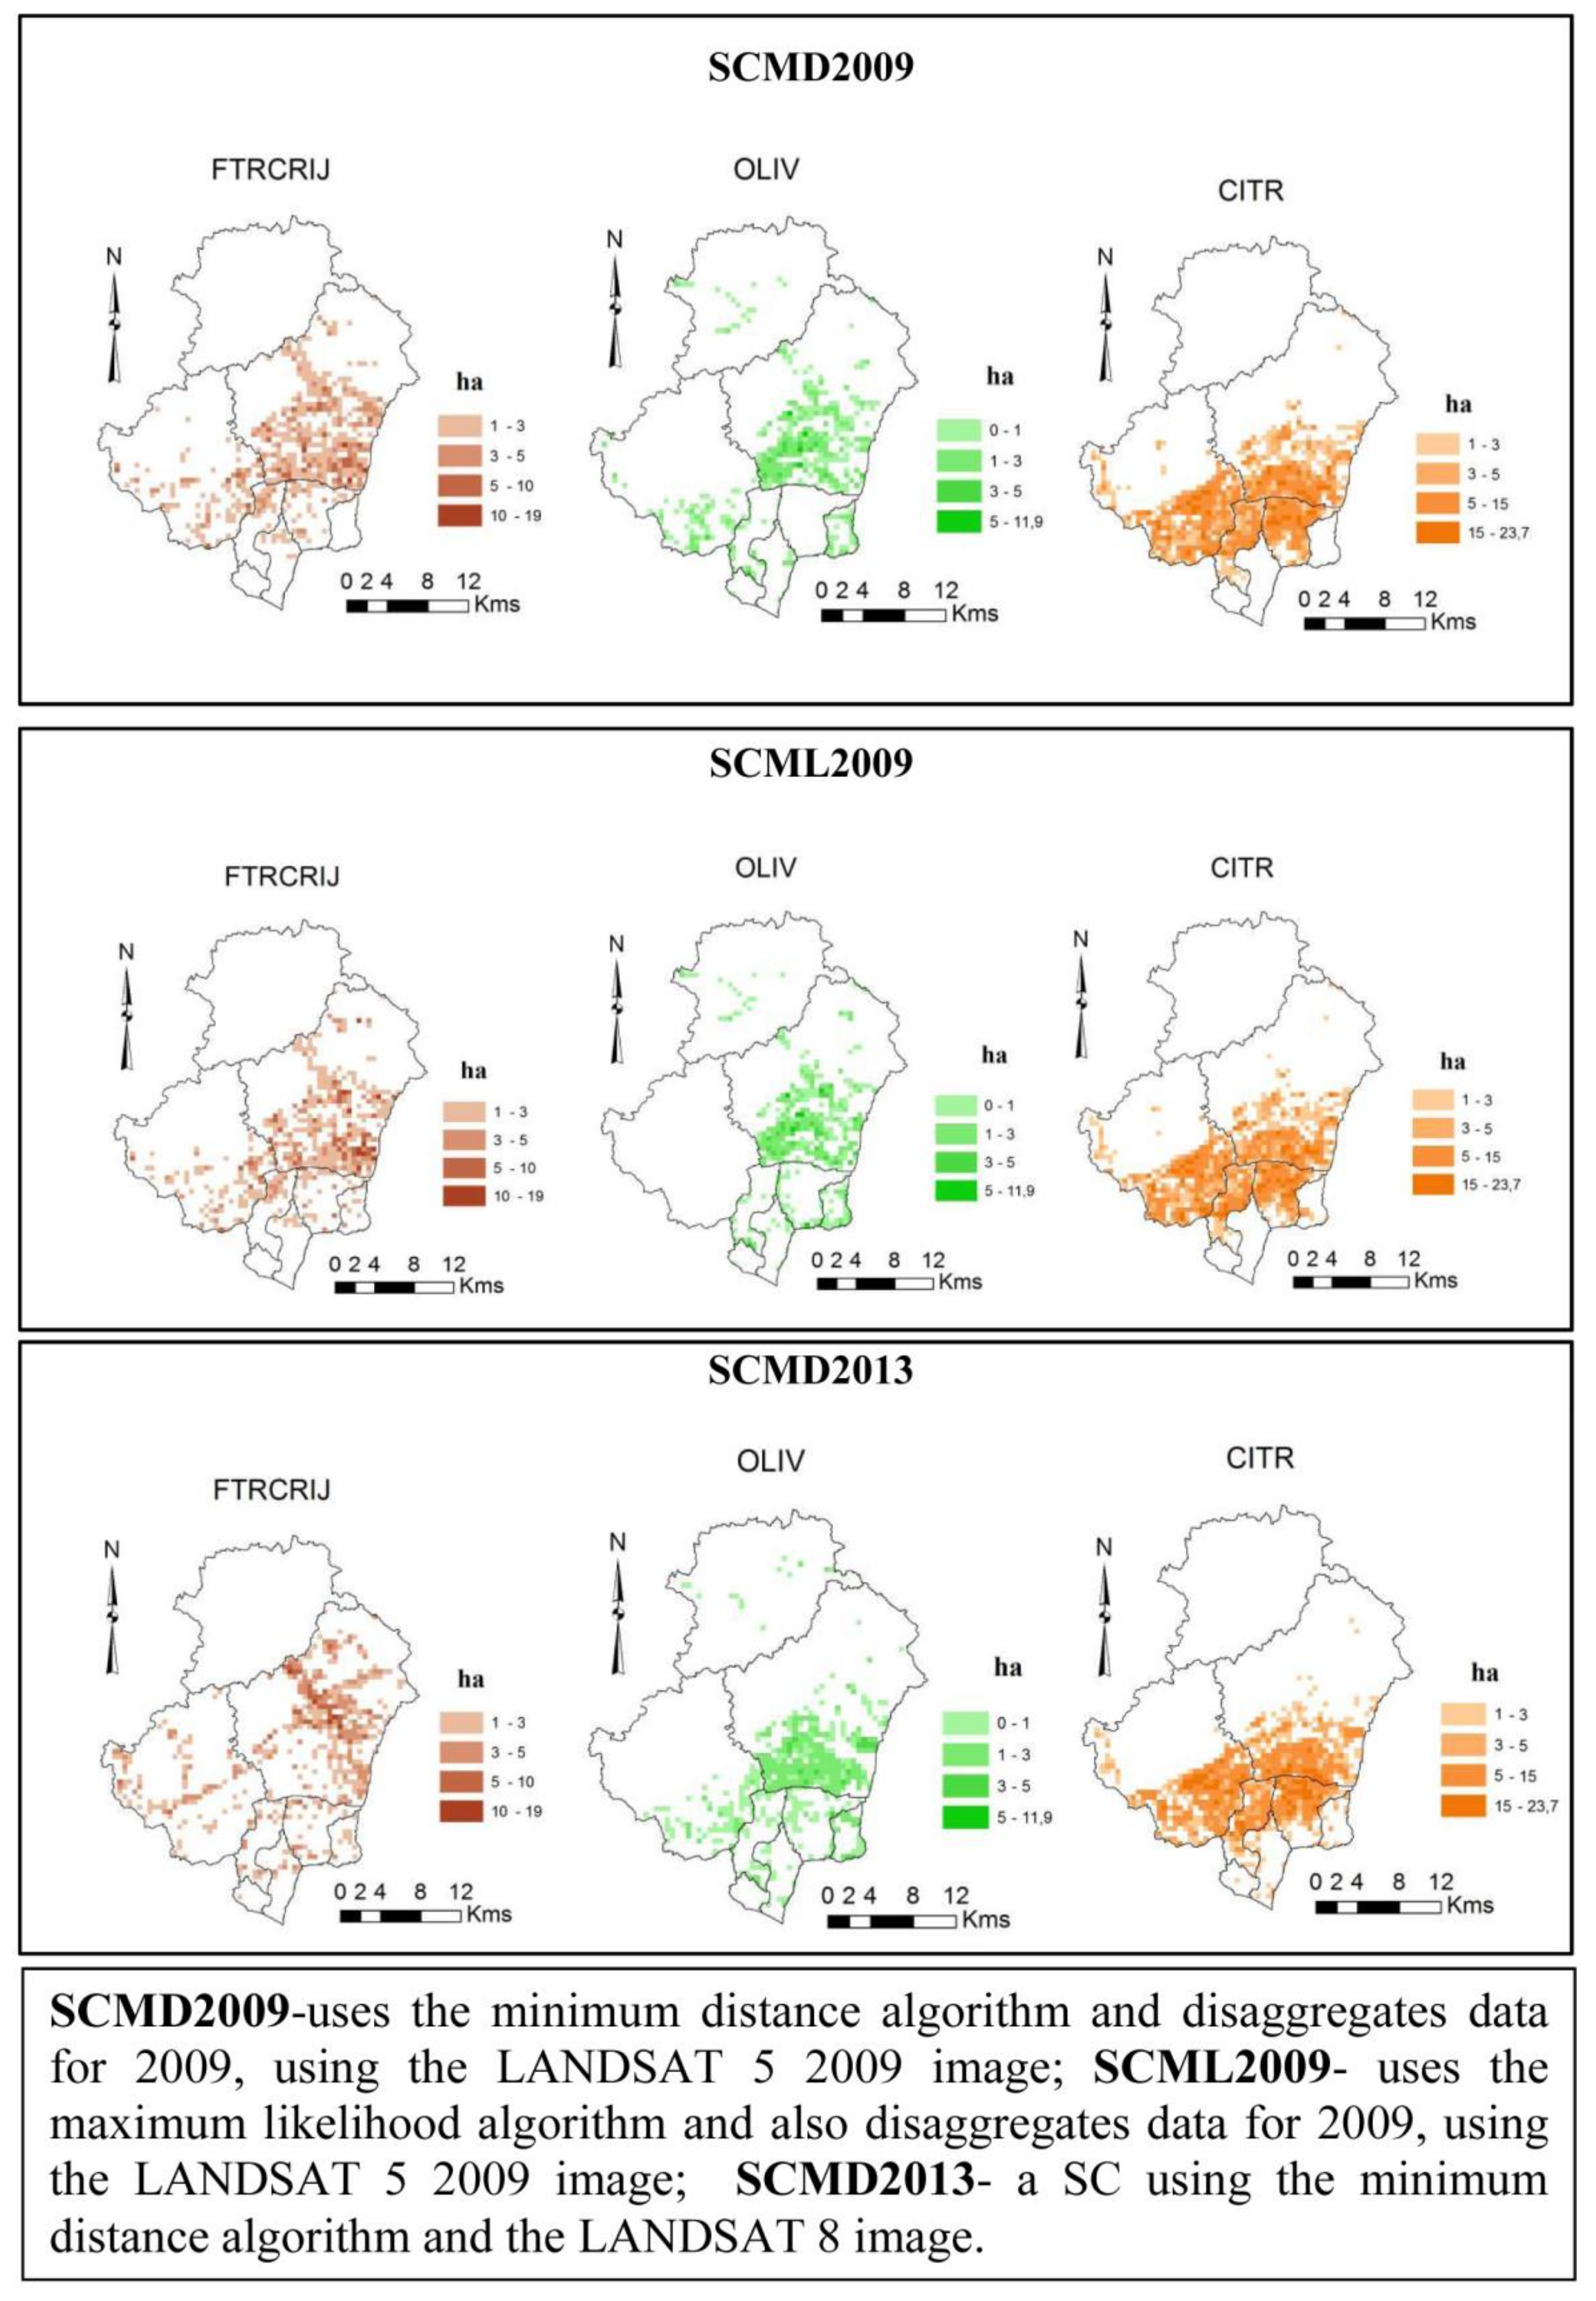
For the Algarve region, two simulations of the entropy model using the LANDSAT 5 2009 image were developed. One (SCMD2009) considers for the supervised classification (SC) the minimum distance algorithm (MD) and another (SCML2009) uses the maximum likelihood algorithm (ML). In the case of the Silves municipality, both simulations were also considered, but they were tested in the entropy model with historical restrictions of land use (SCMD2009 and SCML2009) and without historical restrictions (simulations SCMD2009WR and SCML2009WR). Besides these four simulations, an SC using the minimum distance algorithm and the LANDSAT 8- 2013 image was tested considering the entropy model with and without historical restrictions (simulations SCMD2013 and SCMD2013WR). The historical restrictions include general incomplete limits indicated by experts (that may not be available to all region) and limits regarding crops evolution.
Most approaches developed in recent years were applied at a scale comparable to a 1 × 1 km grid [
4]. Thus, the entropy model was used to disaggregate variables to the pixel level using a kilometric grid, which allowed obtaining a total of 6832 disaggregated units for the Algarve region. In the case of the Silves municipality, the data were disaggregated considering a 25-hectare grid with a total of 3148 disaggregated units.
For the error definition in the entropy model, the three-sigma rule was used [
8,
18,
19,
22]. The error vectors considered were
v = {−0.5, 0, 0.5} and
v = {−1, 0, 1} in the Algarve region and
v = {−0.5, 0, 0.5} in the Silves municipality.
Technical implementation of the approach used QGIS and the Semi-Automatic Classification Plugin (SCP) [
23], and the entropy models were implemented using the General Algebraic Modelling System (GAMS).
4. Results and Analysis
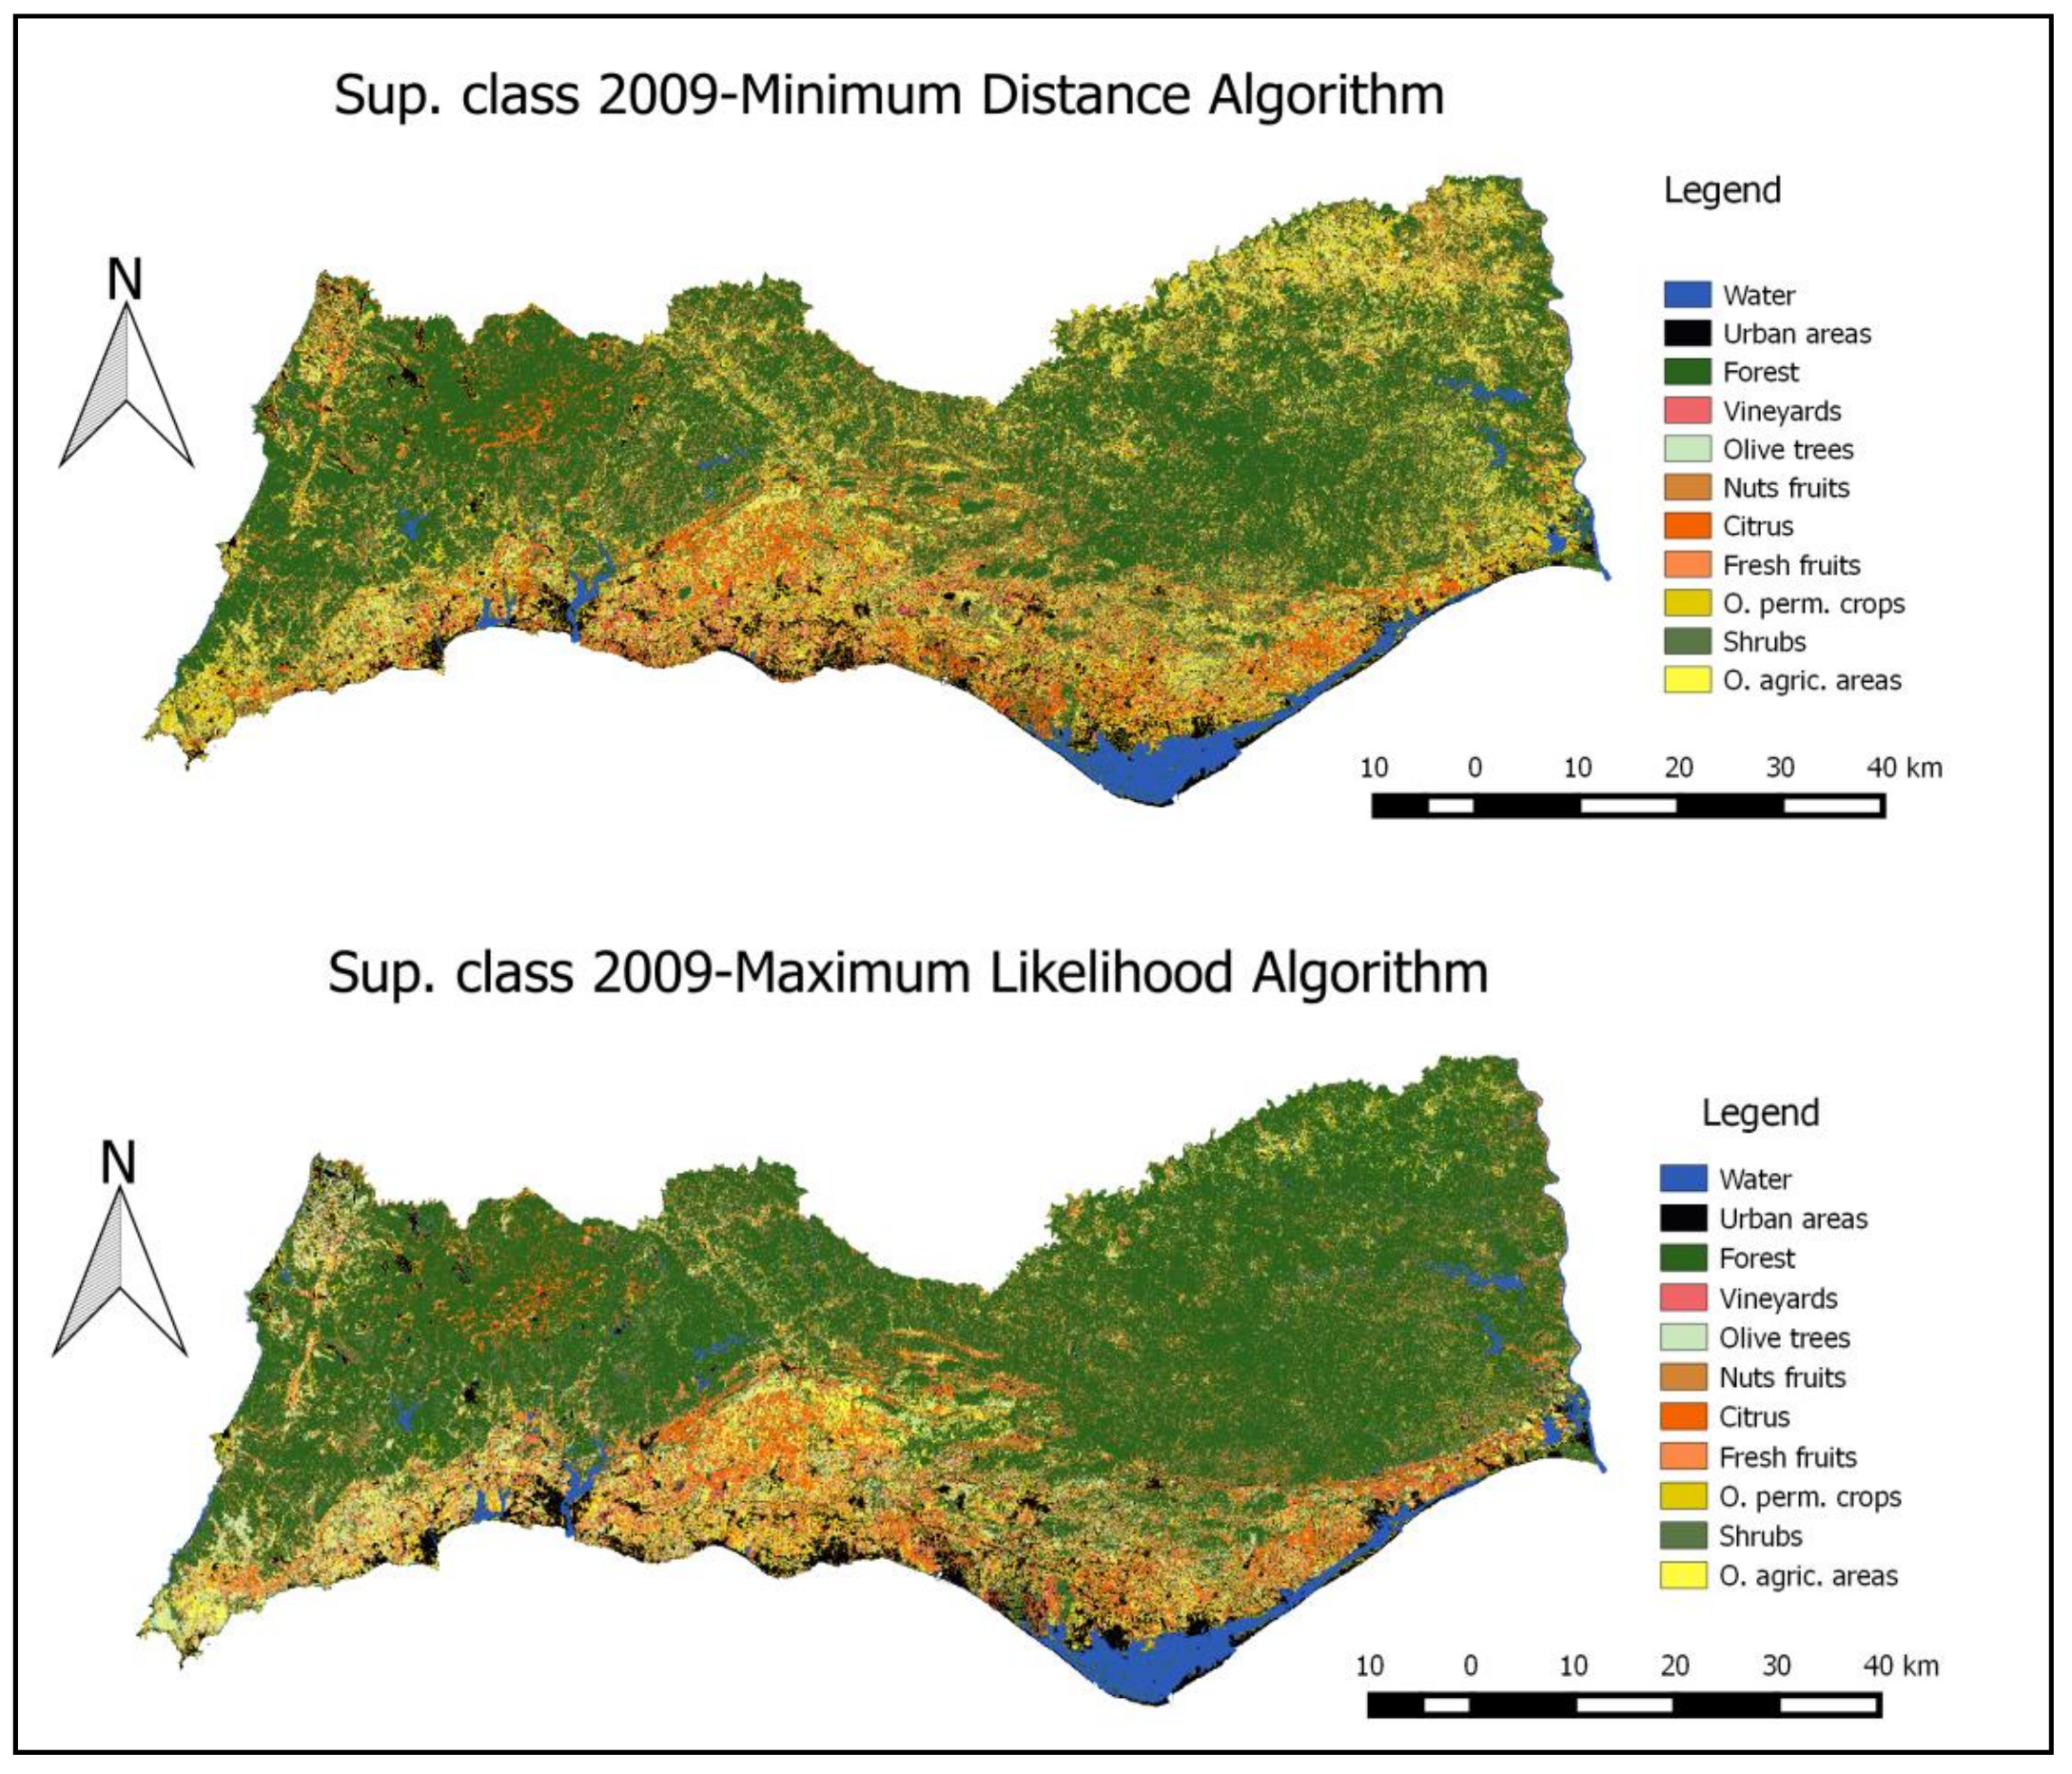
In a first step, a prior estimate of land-use was calculated using the supervised classification.
Figure 3 presents examples of the results for 2009 using the LANDSAT 5 image in the Algarve region and the minimum distance algorithm and the maximum likelihood algorithm. Despite the differences between the two classification algorithms presented, some contrasts in the Region can be observed, namely, between the more forested areas in inland Algarve and the coastal areas with different uses. We also concluded that the minimum distance algorithm tends to identify agricultural areas in inland Algarve, which are identified as forestry areas with the maximum likelihood algorithm. However, according to the knowledge of experts from the Ministry of Agriculture in those areas, the Maximum Likelihood Algorithm tends to provide results more coherent with the observed reality.
These results are presented at a 30 m × 30 m pixel level and are aggregated in a grid at a kilometric level. Examples of some “pixel” level estimates using the kilometric grid are presented in
Table 1.
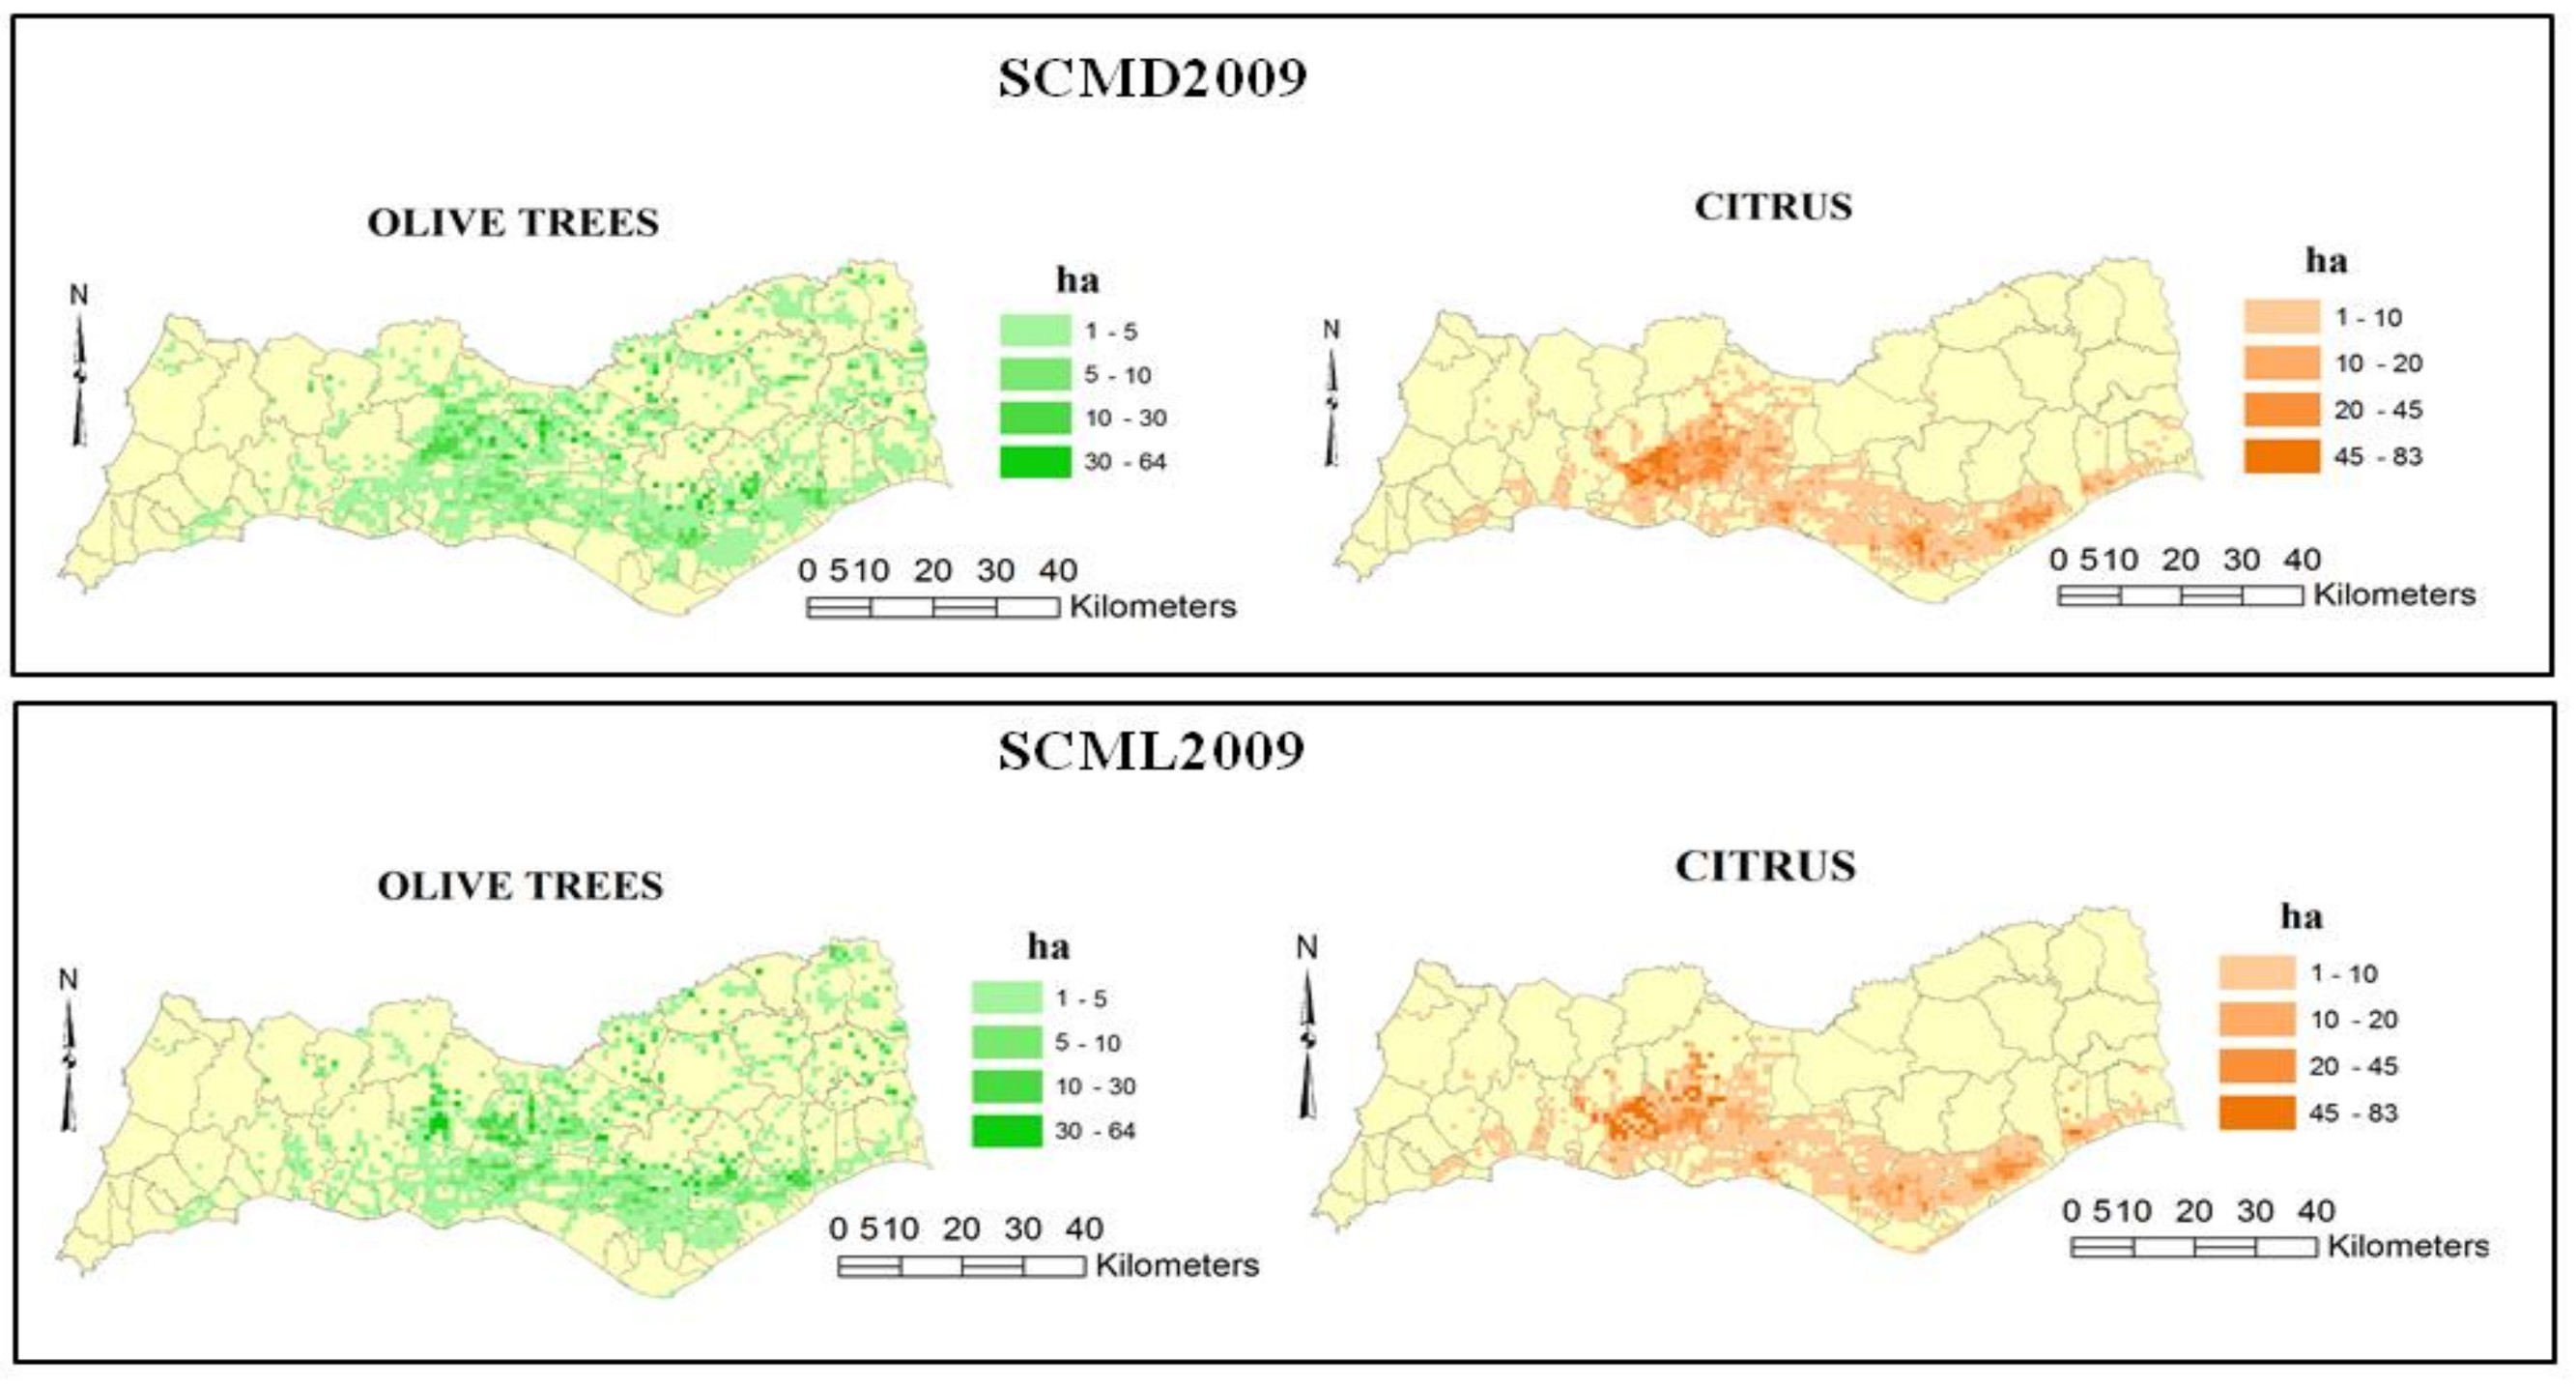
In the second step of our approach, the data disaggregation process was carried out by applying the cross-entropy model in the Algarve region and Silves municipality.
Figure 4 presents examples of results per disaggregated unit according to the algorithms tested for the Algarve region. They allow us to identify some of the major contrasts in the regional distribution of permanent crops. Several differences in allocation according to the classification algorithm used are also seen. The use of different algorithms allows providing the decision maker with different approaches which result in different spatial patterns that will be validated and analyzed.
For the Silves municipality,
Figure 5 presents examples of the results for several distinct simulations using a finer grid (25 hectares). These different simulations are relevant to test the methodological approach at a more detailed pixel level. Spatially, the results let us identify some of the major contrasts in land use distribution, providing a more detailed “picture”, with differences according to the simulations considered. For instance, the areas with the highest concentration of citrus are located in the parishes of S. B. Messines, Algoz, and Silves, while in the inner areas, they do not exist due to the unsuitable biophysical conditions. This is consistent with the knowledge held in this area.
The results of the cross-entropy model were validated using the deviation indicators mentioned before. The average and median PAD indicators are presented in
Table 2 per crop type for the Algarve region and the Silves municipality. In general, the average and median PAD values are high, which may mean a weak consistency between the model results and observed statistical data. In the Algarve region, the lowest median values are obtained for olive trees and for other permanent crops. At the aggregate level, the WPAD indicator is 42.8% in simulation SCMD2009 and 41.1% in simulation SCML2009 (
Table 3).
For the Silves municipality, the PAD values are better than in the Algarve region and can be compared with those of previous studies [
18,
19,
41,
42]. In terms of results per crop, other permanent crops tend to present the lowest median values, but several crops have high median values, often reaching more than 50%. In aggregate terms, the lowest WPAD (20.86%) is recorded in simulation SCMD2013 (see
Table 3). This result may be explained due to the more precise set of bands in the LANDSAT 8 image than in the LANDSAT 8 image. For 2009, SCMD2009 is the simulation that presents the best results (25.6%). Only the simulations without historical restrictions (SCMD2009WR, SCML2009WR, and SCMD2013WR) present WPAD values higher than 30%.
Despite the PAD results tending to present some high values, we must highlight that they are summary results and there are territorial units with heterogeneous areas. Therefore, if we analyze the individual results of the parishes of Algoz, Silves, Alcantarilha, and S. B. Messines, which have the most relevant area of permanent crops (about 92%), we find that the PAD values are low in several relevant crops and hence a WPADi lower than 30% can be observed in all simulations. The errors in other crops are of little importance and parishes with little relevance for the total area. Thus, the above values hide very satisfactory WPAD results.
The correlation coefficient (
R) and the determination coefficient (
R2) are presented in
Table 4.
In the Algarve region, all the R2 indicators are above 0.5, except for fresh fruits, which present R2 values of 43% in simulation SCMD2009 and of 41.4% in simulation SCML2009. In some crops, such as olive trees and citrus, the R2 values are always higher than 0.7.
In Silves, the results are considerably better than those presented in previous studies since they are higher than 0.5 for most crops in all simulations and, in several cases, are higher than 0.8 or even 0.9. In the case of citrus, the most relevant permanent crop in the Silves municipality, the results are always above 0.9.
A similar validation process was implemented in Brazil in Reference [
5] considering all the country’s municipalities (more than 4000) and correlation coefficients between 0.4 and 0.65 were obtained. Other authors (from Reference [
6]) validated their model using 4 crops and obtained for one crop an
R2 of 0.8 while the others presented values of
R2 between 0.40 and 0.45.
Finally, the results were tested using the Efficiency Indicator (EF), as shown in
Table 5 for the Algarve region and Silves municipality.
In the case of the Algarve region, the EF is always higher than 0.45, except for fresh fruits. Citrus and olive trees tend to reveal results always above 0.7. Both algorithms (minimum distance algorithm–SCMD2009 and maximum likelihood algorithm–SCML2009) reveal similar results regarding the EF.
For the Silves municipality, vineyard land-use present negative EF values and therefore, a null disaggregation efficiency of results in these cases. Despite using a good number of training fields, the best EF in vineyards is 0.541. Previous studies were also less successful in estimating vineyard areas due to the low number of training fields [
22]. However, this study presented a detailed number of training fields and revealed low EF values in several cases. This may be due to the classes used in the supervised classification process, which requires a better revision of the macro-classes considered. Fresh fruits also tend to present EF values lower than 0.3in most simulation. The reason for this is the fact that fresh fruits include a diversity of crops and it will also require a better revision of the macro-classes considered.
On the other hand, citrus always presents an EF above 0.9. All the other crops present EF values above 0.5 in most simulations. These results are not much different from those of previous studies [
6], which obtained EF values between 0.23 and 0.71, and only one crop presented a value higher than 0.71.
The proposed approach allows disaggregating agricultural data at a detailed level, being relevant for agricultural economics analysis. As with other crop mapping studies, the quality of maps depends on the quality of data sources [
7]. From an economic point of view, knowing land uses will allow for the identification of total yields and the economic output of agricultural areas. This model is also well suited when the data variation is great, such as the case of Mediterranean regions where crop acreage, farm economics, and production technologies have a high variability. The model’s results can also be aggregated (up-scaled) into different spatial units, such as agro-ecological zones, providing another framework for analysis [
6]. The model results allow for the revealing of contrasts related to different farms’ strategies and different biophysical conditions and it provides information on the location of crops in the territory but does not differentiate them according to the productive system.
Therefore, the proposed model offers an effective way to disaggregate data at a detailed level, but further research is necessary to improve previous estimates and integrate the different layers of information. Also, changing the crop patterns over time is important as crop patterns change over space [
7] and there must be efforts to estimate land-use continuously over time [
17,
18,
19]. One line of research will be to test other classification algorithms. This research focused on two known ones to provide a detailed experience of the feasibility of these approaches because they are very known and used widely. Nevertheless, it may be tested further using other classification algorithms, such as the random forest algorithm.


 ,
, 


