Article

Land Cover Change in Northern Botswana: The Influence of Climate, Fire, and Elephants on Semi-Arid Savanna Woodlands

1
Department of Fish and Wildlife Conservation, Virginia Polytechnic Institute and State University, 1981 Kraft Drive (0321), Blacksburg, VA 24061, USA
2
CARACAL: Centre for Conservation of African Resources: Animals, Communities, and Land Use, Kasane, Botswana
*
Author to whom correspondence should be addressed.
Submission received: 28 July 2017 / Revised: 18 October 2017 / Accepted: 20 October 2017 / Published: 25 October 2017
(This article belongs to the Special Issue Arid Land Systems: Sciences and Societies)

Abstract

:
Complex couplings and feedback among climate, fire, and herbivory drive short- and long-term patterns of land cover change (LCC) in savanna ecosystems. However, understanding of spatial and temporal LCC patterns in these environments is limited, particularly for semi-arid regions transitional between arid and more mesic climates. Here, we use post-classification analysis of Landsat TM (1990), ETM+ (2003), and OLI (2013) satellite imagery to classify and assess net and gross LCC for the Chobe District, a 21,000 km2 area encompassing urban, peri-urban, rural, communally-managed (Chobe Enclave), and protected land (Chobe National Park, CNP, and six protected forest reserves). We then evaluate spatiotemporal patterns of LCC in relation to precipitation, fire detections (MCD14M, 2001–2013) from the Moderate Resolution Imaging Spectroradiometer (MODIS), and dry season elephant (Loxodonta africana) aerial survey data (2003, 2006, 2012, 2013). Woodland cover declined over the study period by 1514 km2 (16.2% of initial class total), accompanied by expansion of shrubland (1305 km2, 15.7%) and grassland (265 km2, 20.3%). Net LCC differed importantly in protected areas, with higher woodland losses observed in forest reserves compared to the CNP. Loss of woodland was also higher in communally-managed land for the study period, despite gains from 2003–2013. Gross (class) changes were characterized by extensive exchange between woodland and shrubland during both time steps, and a large expansion of shrubland into grassland and bare ground from 2003–2013. MODIS active fire detections were highly variable from year to year and among the different protected areas, ranging from 1.8 fires*year−1/km2 in the Chobe Forest Reserve to 7.1 fires*year−1/km2 in the Kasane Forest Reserve Extension. Clustering and timing of dry season fires suggests that ignitions were predominately from anthropogenic sources. Annual fire count was significantly related to total annual rainfall (p = 0.009, adj. R2 = 0.50), with a 41% increase in average fire occurrence in years when rainfall exceeded long-term mean annual precipitation (MAP). Loss of woodland was significantly associated with fire in locations experiencing 15 or more ignitions during the period 2001–2013 (p = 0.024). Although elephant-mediated damage is often cited as a major cause of woodland degradation in northern Botswana, we observed little evidence of unsustainable pressure on woodlands from growing elephant populations. Our data indicate broad-scale LCC processes in semi-arid savannas in Southern Africa are strongly coupled to environmental and anthropogenic forcings. Increased seasonal variability is likely to have important effects on the distribution of savanna plant communities due to climate-fire feedbacks. Long-term monitoring of LCC in these ecosystems is essential to improving land use planning and management strategies that protect biodiversity, as well as traditional cultures and livelihoods under future climate change scenarios for Southern Africa.

Graphical Abstract

1. Introduction

Dryland ecosystems [1,2] occupy 41% of the global land surface and support nearly one third of the world’s population, concentrated primarily in countries that share a significant portion of the global poverty burden [3,4,5,6]. Across Southern Africa, an estimated 150 million rural and urban residents support their livelihoods through extracting natural resources from semi-arid savannas [7], including firewood, food, fresh water, traditional medicine, thatching grass, reeds, poles, and other materials for building and crafts [8,9,10]. Scarcity of surface water and high rainfall variability make these systems particularly vulnerable to land degradation resulting in the potential loss of ecosystem services [11], with rural and impoverished communities being disproportionately impacted [12,13].
Savannas are defined by the coexistence of shade-intolerant and fire tolerant C4 grasses with tree cover maintained below climate-defined equilibrium values [14,15,16]. Proposed mechanisms for tree-grass coexistence in savannas fall broadly into two classes that emphasize either the role of niche partitioning and competition for resources [17,18,19] or demographic bottlenecks in tree recruitment mediated by disturbance [20,21,22]. Tree-grass ratios in savannas range from areas where grasses are dominant, to woodland savanna where tree cover may approach a closed-canopy state [17,23]. Water and nutrient limitations, together with individual and interactive effects of disturbance at different life-history stages appear central to tree persistence in savannas [15,22,24,25]. While rainfall and edaphic conditions tend to be the most important factors limiting maximum tree cover in arid savannas where mean annual precipitation (MAP) is less than 400 mm, in savannas where MAP exceeds 650 ± 134 mm, disturbance dynamics exert a greater influence on vegetation structure [21]. In these semi-arid and mesic savannas, the role of fire and herbivory becomes increasingly important for maintaining the coexistence of trees and grasses through positive feedback that prevents woodlands from attaining a closed canopy state [14,24].
The semi-arid savanna of northern Botswana provides an important example of a vegetation ecotone situated along a transitional zone between the arid (<400 mm MAP) Kalahari landscape to the south and the more mesic (>1000 mm MAP) Zambezian Baikiaea Woodland ecoregion to the north [26,27]. Unlike the Kalahari, northern Botswana possesses extensive woodlands composed primarily of Zambezi teak (Baikiaea plurijuga) and Mopane (Colophospermum mopane), commonly in association with Pterocarpus angolensis, and Terminalia sericea. These woodlands provide essential habitat for a wide range of taxa, along with important ecosystem services, including regulating decomposition processes and nutrient cycling, and improving water quality by limiting runoff of precipitation, soil, and contaminants [28,29,30,31].
Local land managers and communities frequently encounter varying and competing perceptions of land degradation, compounded by a lack of knowledge about the drivers and direction of LCC [32]. In Southern Africa, land degradation is frequently associated with changes in vegetation structure, particularly the loss of mature trees and encroachment of low-growing shrub species into savannas [33,34,35,36,37]. While expansion of cropland, livestock grazing, and urbanizing land use are frequently cited as driving LCC in sub-Saharan Africa [38,39,40], in northern Botswana wildlife and fire disturbance, together with human encroachment and climate change, are identified as the primary threats to woodland resources [41].
Remote sensing studies of LCC in northern Botswana have typically focused on relatively short time spans (<10 years), providing limited information about regional change dynamics and emergent management needs [42,43,44,45,46,47,48,49,50]. Global-scale LCC monitoring efforts such as the Global Land Cover Network’s Africover project and the European Space Agency’s Globcover mapping project are currently unavailable for much of Southern Africa or, where available, lack the necessary spatial resolution to detect important changes in land cover, information critical to resource management. Here, we use Landsat Thematic Mapper (TM), Enhanced Thematic Mapper Plus (ETM+), and Operational Land Imager (OLI) satellite images to classify multi-decadal (1990–2013) LCC and assess broad-scale changes in a semi-arid savanna across varying land uses and management. We evaluate LCC in relation to potential drivers including fire, climate, and growing elephant (Loxodonta africana) populations, and provide recommendations for future change monitoring and management needs in semi-arid savannas in Southern Africa.

2. Materials and Methods

2.1. Study Area

The Chobe District of northeastern Botswana (Figure 1) is a semi-arid dryland supporting a diverse assemblage of wildlife species and habitats of global conservation significance, including the largest elephant population in Africa [51,52]. The region has an aridity index between 0.20 and 0.50, calculated as the ratio between mean annual precipitation (MAP) and mean potential evapotranspiration [53], and is characterized by highly variable rainfall, with nearly the entire annual rainfall budget concentrated during the November—March wet season, followed by a general absence of precipitation from April-October. Wetter and drier periods frequently occur on the order of 5–10 years, with drought conditions associated with the strength of the prevailing El Niño-Southern Oscillation [54]. The Chobe River and its surrounding wetlands provide the only permanent source of surface water for the Chobe District. As a transboundary watershed, the Chobe River Basin is considered a core component of the Kavango-Zambezi (KAZA) Transfrontier Conservation Area, shared by Angola, Botswana, Namibia, Zambia, and Zimbabwe.

2.2. Land Use and Management

Land tenure in the Chobe District consists primarily of state land (national parks, forest reserves, and wildlife management areas), and tribal land (communal areas and commercial agriculture). Communal lands are typically utilized for subsistence livestock grazing and agriculture at a lower intensity than other areas in Botswana due to high wildlife conflict and barriers to cattle movement and production associated with endemic livestock diseases such as the virus that causes Foot-and-Mouth disease (Aphthae epizooticae). Protected areas account for approximately 58% of the District’s total land area, of which, the Chobe National Park (CNP) occupies 11,700 km2 (see Figure 1). Six protected forest reserves and extensions are located in the study site: Kazuma, Maikaelelo, Sibuyu, Chobe, Kasane Forest Reserve, and the Kasane Forest Reserve Extension, occupying a combined land area of approximately 4100 km2. The town of Kasane is the regional government seat (est. 2011 population 9008) and, together with Kazungula (est. pop. 4133), are the largest urban settlements in the District [55]. The communally-managed Chobe Enclave (1690 km2, Figure 1), located along the District’s northern border with Namibia, is surrounded on all sides by protected areas. The Chobe River floodplain occupies a large portion of the Enclave, with forested areas confined to higher elevations. Human population density is generally low in the Enclave’s five main villages, with a combined population of 7500 [55], approximately 30% of whom work outside of the Enclave [8]. Crop and livestock production and wage employment are the primary economic activities, with a majority of households relying on extraction of natural resources for subsistence purposes [10].

2.3. Data Sources

Landsat satellite images of the Chobe District were obtained from the U.S. Geological Survey with a spatial resolution of 30 m for visible, shortwave infrared (SWIR), and near infrared (NIR) bands, for the years 1990 (Landsat 5 Thematic Mapper; TM), 2003 (Landsat 7 Enhanced Thematic Mapper Plus; ETM+), and 2013 (Landsat 8 Operational Land Imager; OLI) (Figure 2). A decadal revisit period was chosen in order to focus on broad-scale LCC in the study area during a period of rapid growth of both elephant [52] and human [55] populations in the District. This time period also includes the implementation of Botswana’s National Conservation Strategy (1990), which outlines fundamental ecosystem conservation goals for the country [56]. Timing of green-up and leaf-fall is highly variable in northern Botswana, so we limited our classifications to cloud-free images acquired from 8–28 April during each year of the analysis to minimize seasonal effects on land cover classifications (Table S1). Monthly active fire detections from the Moderate Resolution Imaging Spectroradiometer (MODIS; MCD14ML Collection 5.1) available for the period 1 January 2001–31 December 2013 were used to evaluate fire dynamics in the Chobe District. The MODIS sensor detects fires burning in 1 km pixels using a contextual algorithm to apply thresholds to observed mid-infrared and thermal infrared brightness temperature, and rejects false detections by comparing them to values from neighboring pixels [57]. Only fire pixels assigned high-confidence (>75%) were included in the analysis in order to exclude potential false detections [57,58,59].

Climate and Wildlife Aerial Survey Data

Daily precipitation records measured at the Kasane Meteorological Station were provided by the Botswana Department of Meteorological Services for the years 1922–2013 and were used to evaluate rainfall patterns during the study period. Dry season aerial wildlife survey data provided by the Botswana Department of Wildlife and National Parks (DWNP) for 2003, 2006, 2012, and 2013 were used to examine spatial associations between elephants and land cover. Surveys were flown in late August following a stratified systematic transect sampling design and were analyzed using Jolly’s method for sampling units of unequal size [60]. Elephant biomass is represented as Large Stock Units (LSU)/km2, where one LSU is equal to the metabolic equivalent of a 454 kg cow [52,61]. Land cover values in the 2003 and 2013 classification maps were extracted within aerial survey units from the corresponding year to determine elephant presence in the different land cover classes.

2.4. Satellite Imagery Pre-Processing

Landsat images were standardized onto a common geographic and radiometric scale, and projected to Universal Transverse Mercator (UTM) WGS 84 Zone 34 South prior to classification and analysis. Landsat TM and ETM+ images were processed to surface reflectance using the Ecosystem Disturbance Adaptive Processing System (LEDAPS), while Landsat OLI surface reflectance was calculated using the USGS L8SR algorithm. Multi-spectral data often possess a high degree of correlation among adjacent spectral bands, particularly in semi-arid savanna systems where environmental and ecological variability create a mosaic landscape of diverse plant community assemblages [62]. In this study, we used principal components analysis (PCA) to transform the original multi-band Landsat images to reduce redundancy in spectral data in preparation for land cover classification and change detection. The first three principal components contained >98% of the original information in the multi-spectral datasets for 1990, 2003, and 2013, and were used for all classifications.

2.5. Land Cover Classification

We initially classified land cover using an unsupervised Interactive Self-Organizing Clustering (ISO Cluster) approach in ESRI ArcMap 10.2 (Environmental Systems Research Institute, Redlands, CA, USA). Image pixels were grouped into 45 spectral clusters using a sampling interval of 25 cells and a minimum class size of 150 cells, with a 3 × 3 majority filter applied to reduce noise and outliers. Spectral clusters from the unsupervised classification were then assigned to one of six general land cover classes (Table 1) using a supervised classification approach based on characteristics defined by the Food and Agriculture Organization (FAO) of the United Nations 2010 Forest Resources Assessment (FRA) [63]. Final class assignments were based on examination of current and historical aerial orthophotography and expert knowledge of the study area and local conditions. Any obvious localized misclassifications were corrected prior to merging polygons of the same grid value in preparation for post-classification change analysis.

2.6. Classification Accuracy Assessment

We assessed classification accuracy for 2013 land cover assignments using standard confusion matrix cross-tabulation methods [64]. A total of 928 reference sites were selected using a random point generator and existing cover was validated using a combination of field-based ground-truthing conducted in July 2015 and high-resolution orthophotography from 2013. As we were unable to assess classification accuracy for 1990 and 2003 directly due to a lack of suitable reference data, the 2013 training site data were used to calculate proportional error for each class by dividing the number of misclassified cells by land cover contingency table row totals for each time step. Proportional errors for each cover class were then multiplied by the nominal class areas, and summed along each column to derive an adjustment representing upper (omission) and lower (commission) classification uncertainty intervals. We calculated overall classification accuracy with binomial 95% confidence intervals for net LCC using the “caret” package in R by dividing the total number of correctly identified reference points by the total number of sample units in the matrix [64]. Individual class accuracies were computed in a similar manner and include measures of: sensitivity (producer accuracy), specificity (true negatives), detection rate and detection prevalence, and positive predictive (user accuracy) and negative predictive values [65]. Quantity disagreement and allocation disagreement between the 2013 land cover classification and reference data were calculated following methods described by Pontius Jr and Millones [66], along with omission and commission error for each class. Quantity disagreement derives from a proportional difference between the number of cells of a particular land class in two maps, while allocation is the additional disagreement resulting from a less than optimal match in the spatial allocation of the categories [67]. We also include an unweighted Cohen’s Kappa statistic describing agreement of categorical data relative to what would be expected by chance, with values of 1 indicating perfect alignment.

2.7. Change Detection

Net and gross LCC were estimated for the Chobe District and communally-managed Chobe Enclave, and for seven protected areas: Chobe National Park, Sibuyu, Maikaelelo, Kazuma, Chobe, Kasane Forest Reserve (FR), and the Kasane Forest Reserve Extension (FRE) using change detection analysis in ENVI version 4.8 (Exelis Visual Information Solutions, Boulder, CO, USA) and in ArcMap v.10.2. Images were coregistered (UTM zone 34S, Datum WGS-84) prior to analysis and for each pixel in the initial state classification the land cover class in the final state image was recorded.

2.8. Statistical Analysis

All statistical analysis was conducted in the R open source integrated programming environment [68] unless otherwise noted. A two sample t-test of equal variances was used to test the hypothesis that mean fire occurrence was significantly different in alternating (even and odd) years, and ordinary least squares (OLS) regression was used to analyze the association between total annual rainfall and fire count. We evaluated the influence of elephants on woodland loss by quantifying the total number of pixels within aerial survey blocks from 2003, 2006, and 2012 that changed from woodland to grassland, shrubland, or bare/impervious from 2003–2013. Woodland loss values were normalized by survey block area (km2) and elephant data for the three years were grouped into low (<10), medium (10.1–20), and high (>20) elephant biomass (LSU/km2) for analysis. We assessed the relationship between woodland loss and fire in a similar manner by calculating the total number of woodland loss pixels within a 1 km radius buffer around MODIS active fire detections. Fire counts were grouped into low (≤5), medium (6–14), and high (≥15) classes for analysis.
We initially fit OLS regressions and tested for the presence of spatial autocorrelation in model residuals using a Global Moran’s I statistic. Significant spatial autocorrelation was present in OLS model residuals comparing woodland loss and fire count (0.014, p < 0.0001) and woodland loss and elephant biomass (0.273, p < 0.0001). As result, we fit generalized least squares (GLS) regressions to these data in the R package “nmle” [69] using five autocorrelation structures: exponential, Gaussian, spherical, linear, and rational quadratic. The GLS methodology has been extensively applied to analyze and account for the influence of spatial correlation in a wide range of ecological data [70]. Akaike Information Criterion (AIC) estimation was used to select the best performing model based on lowest delta AIC. A square root transformation was applied to the woodland loss data to satisfy assumptions of normality and verified using normal qqplots.
In addition, we conducted an optimized hot spot analysis of fire clusters using Getis-Ord Gi* in ArcGIS (v. 10.3) following integration and event collection of fires occurring within a 10 km-radius neighborhood. Getis-Ord Gi* identifies statistically significant spatial clusters of high values (hot spots) or low values (cold spots) based on z-scores and p-values for each feature. Fires in the neighboring countries of Namibia, Zambia, and Zimbabwe were included in the hot spot analysis to assess potential fire spread into the Chobe District across international borders.

3. Results

3.1. Land Cover Classification Accuracy

Spectral clusters from the unsupervised classification were assigned to one of the six general land cover classes according to the definitions in Table 1. Overall disagreement between 2013 land cover classifications and the training data was 13%, the majority of which was due to differences in class allocation (Figure 3a). Omission error was higher than commission error for grassland and bare/impervious cover, indicating a tendency to underestimate these classes across the study area domain (Figure 3b). A full accounting of contingency table results for land cover classification accuracy compared to reference data and a summary of accuracy assessment statistics are included in Tables S2 and S3, respectively. Overall classification accuracy was 0.867 (95% CI 0.843, 0.888) with a Kappa coefficient of 0.832, indicating generally low misclassification error, with the highest confusion arising between woodland and shrubland.

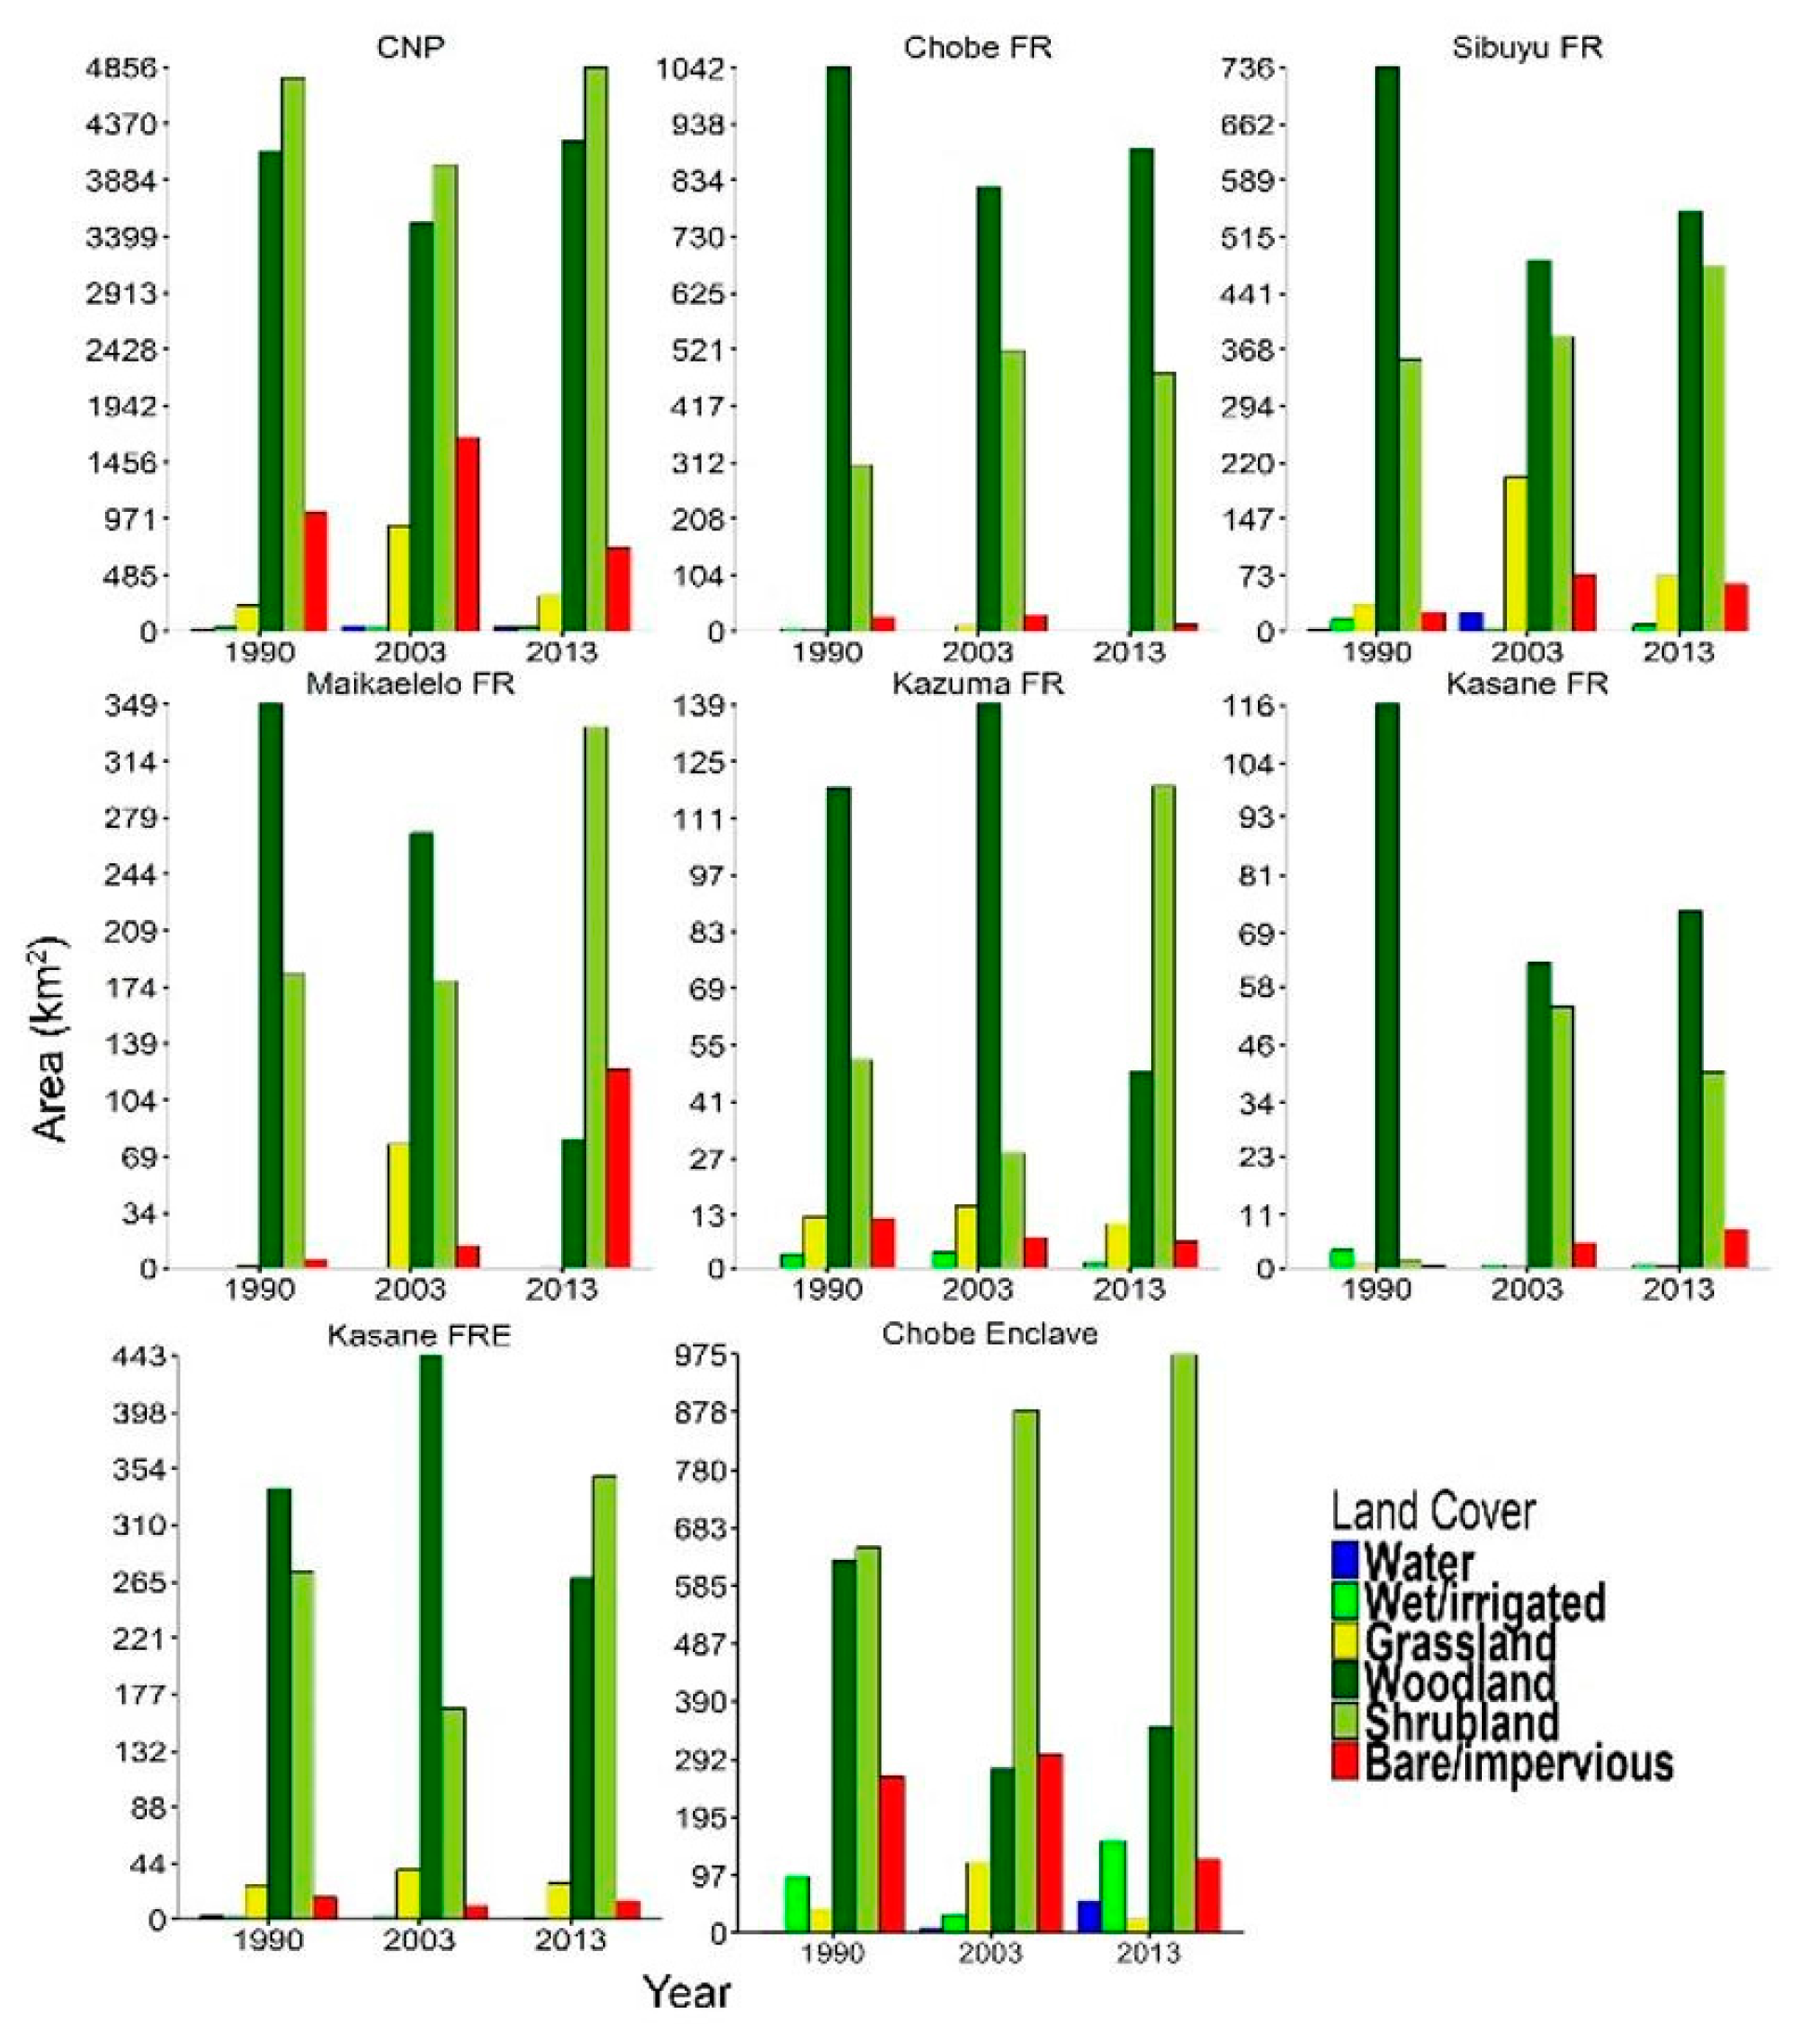
3.2. Summary of Net LCC

3.2.1. Chobe District

The dynamic nature of LCC in northern Botswana is illustrated in thematic land cover maps for 1990, 2003, and 2013 (Figure 4). Net LCC during the study period is summarized in Figure 5 and was characterized by loss of woodland (1514 km2, 16%) and expansion of shrubland (1304 km2, 16%). Locations of woodland gains and losses from 1990–2013 are shown in Figure 6. Woodland losses during the first time step were followed by a small net gain from 2003–2013 (143 km2, 2%), although overlap of uncertainty intervals for woodland indicate this gain may be attributable to errors in classification. Shrubland losses from 1990–2003 were followed by a large net gain of 2189 km2 (29.4%) from 2003–2013, with shrubland becoming the dominant land cover in the Chobe District by 2013. Grassland gained 265 km2 (20%) over the study period, despite a net loss of 1321 km2 (45%) from 2003–2013, with the largest changes observed in the southwestern corner of the District around the Savuti Marsh, and in Mokororo Pan located to the south of Kasane FRE. Bare/impervious gains during the first time step were followed by a loss of 1023 km2 (40%) from 2003–2013, with large reductions in bare ground around Savuti Marsh and in the Chobe Enclave. Water and wet/irrigated vegetation cover varied considerably, with the majority of change associated with seasonal flooding of the Chobe River and irrigation of commercial agricultural fields in southeastern portion of the District around the village of Pandamatenga.

3.2.2. Protected Areas and Communal Lands in the Chobe Enclave

Net LCC in protected areas and the Chobe Enclave are summarized in Figure 7. Woodland declined in five of the six protected forest reserves from 1990–2003, with net losses averaging 31%. While only three protected areas lost woodland from 2003–2013, average declines were 58%, driven by high losses in Maikaelelo (190 km2, 70%) and Kazuma (91 km2, 65%) FRs. In the CNP, woodland losses from 1990–2003 (618 km2, 15%) were followed by a gain of 703 km2 (20%) from 2003–2013. Shrubland expanded in all of the protected areas over the study period, with the smallest gains observed in the CNP and the largest gains in Kasane and Kazuma FR. Grassland also increased over the study period in a majority of the protected areas, with all but Kasane FR gaining grassland from 1990–2003 and losing grassland from 2003–2013. Kasane and Maikaelelo FR experienced the greatest increases in bare/impervious cover over the study period. Changes in water and wet/irrigated vegetation in the Sibuyu FR were related to seasonal flooding of nearby ephemeral pans along with flood irrigation in the agricultural fields bordering the reserve to the north.
Land cover in the communally-managed Chobe Enclave changed from nearly equal representation of woodland and shrubland in 1990, to being shrubland-dominated in 2013. A large woodland loss from 1990–2003 (351 km2, 56%) was followed by a gain of 71 km2 (26%) from 2003–2013. In contrast, both grassland and bare/impervious cover expanded from 1990–2003, but subsequently declined from 2003–2013. Changes in water and wet/irrigated vegetation in the Enclave were primarily due to fluctuations in seasonal flooding of the Chobe River and associated wetlands.

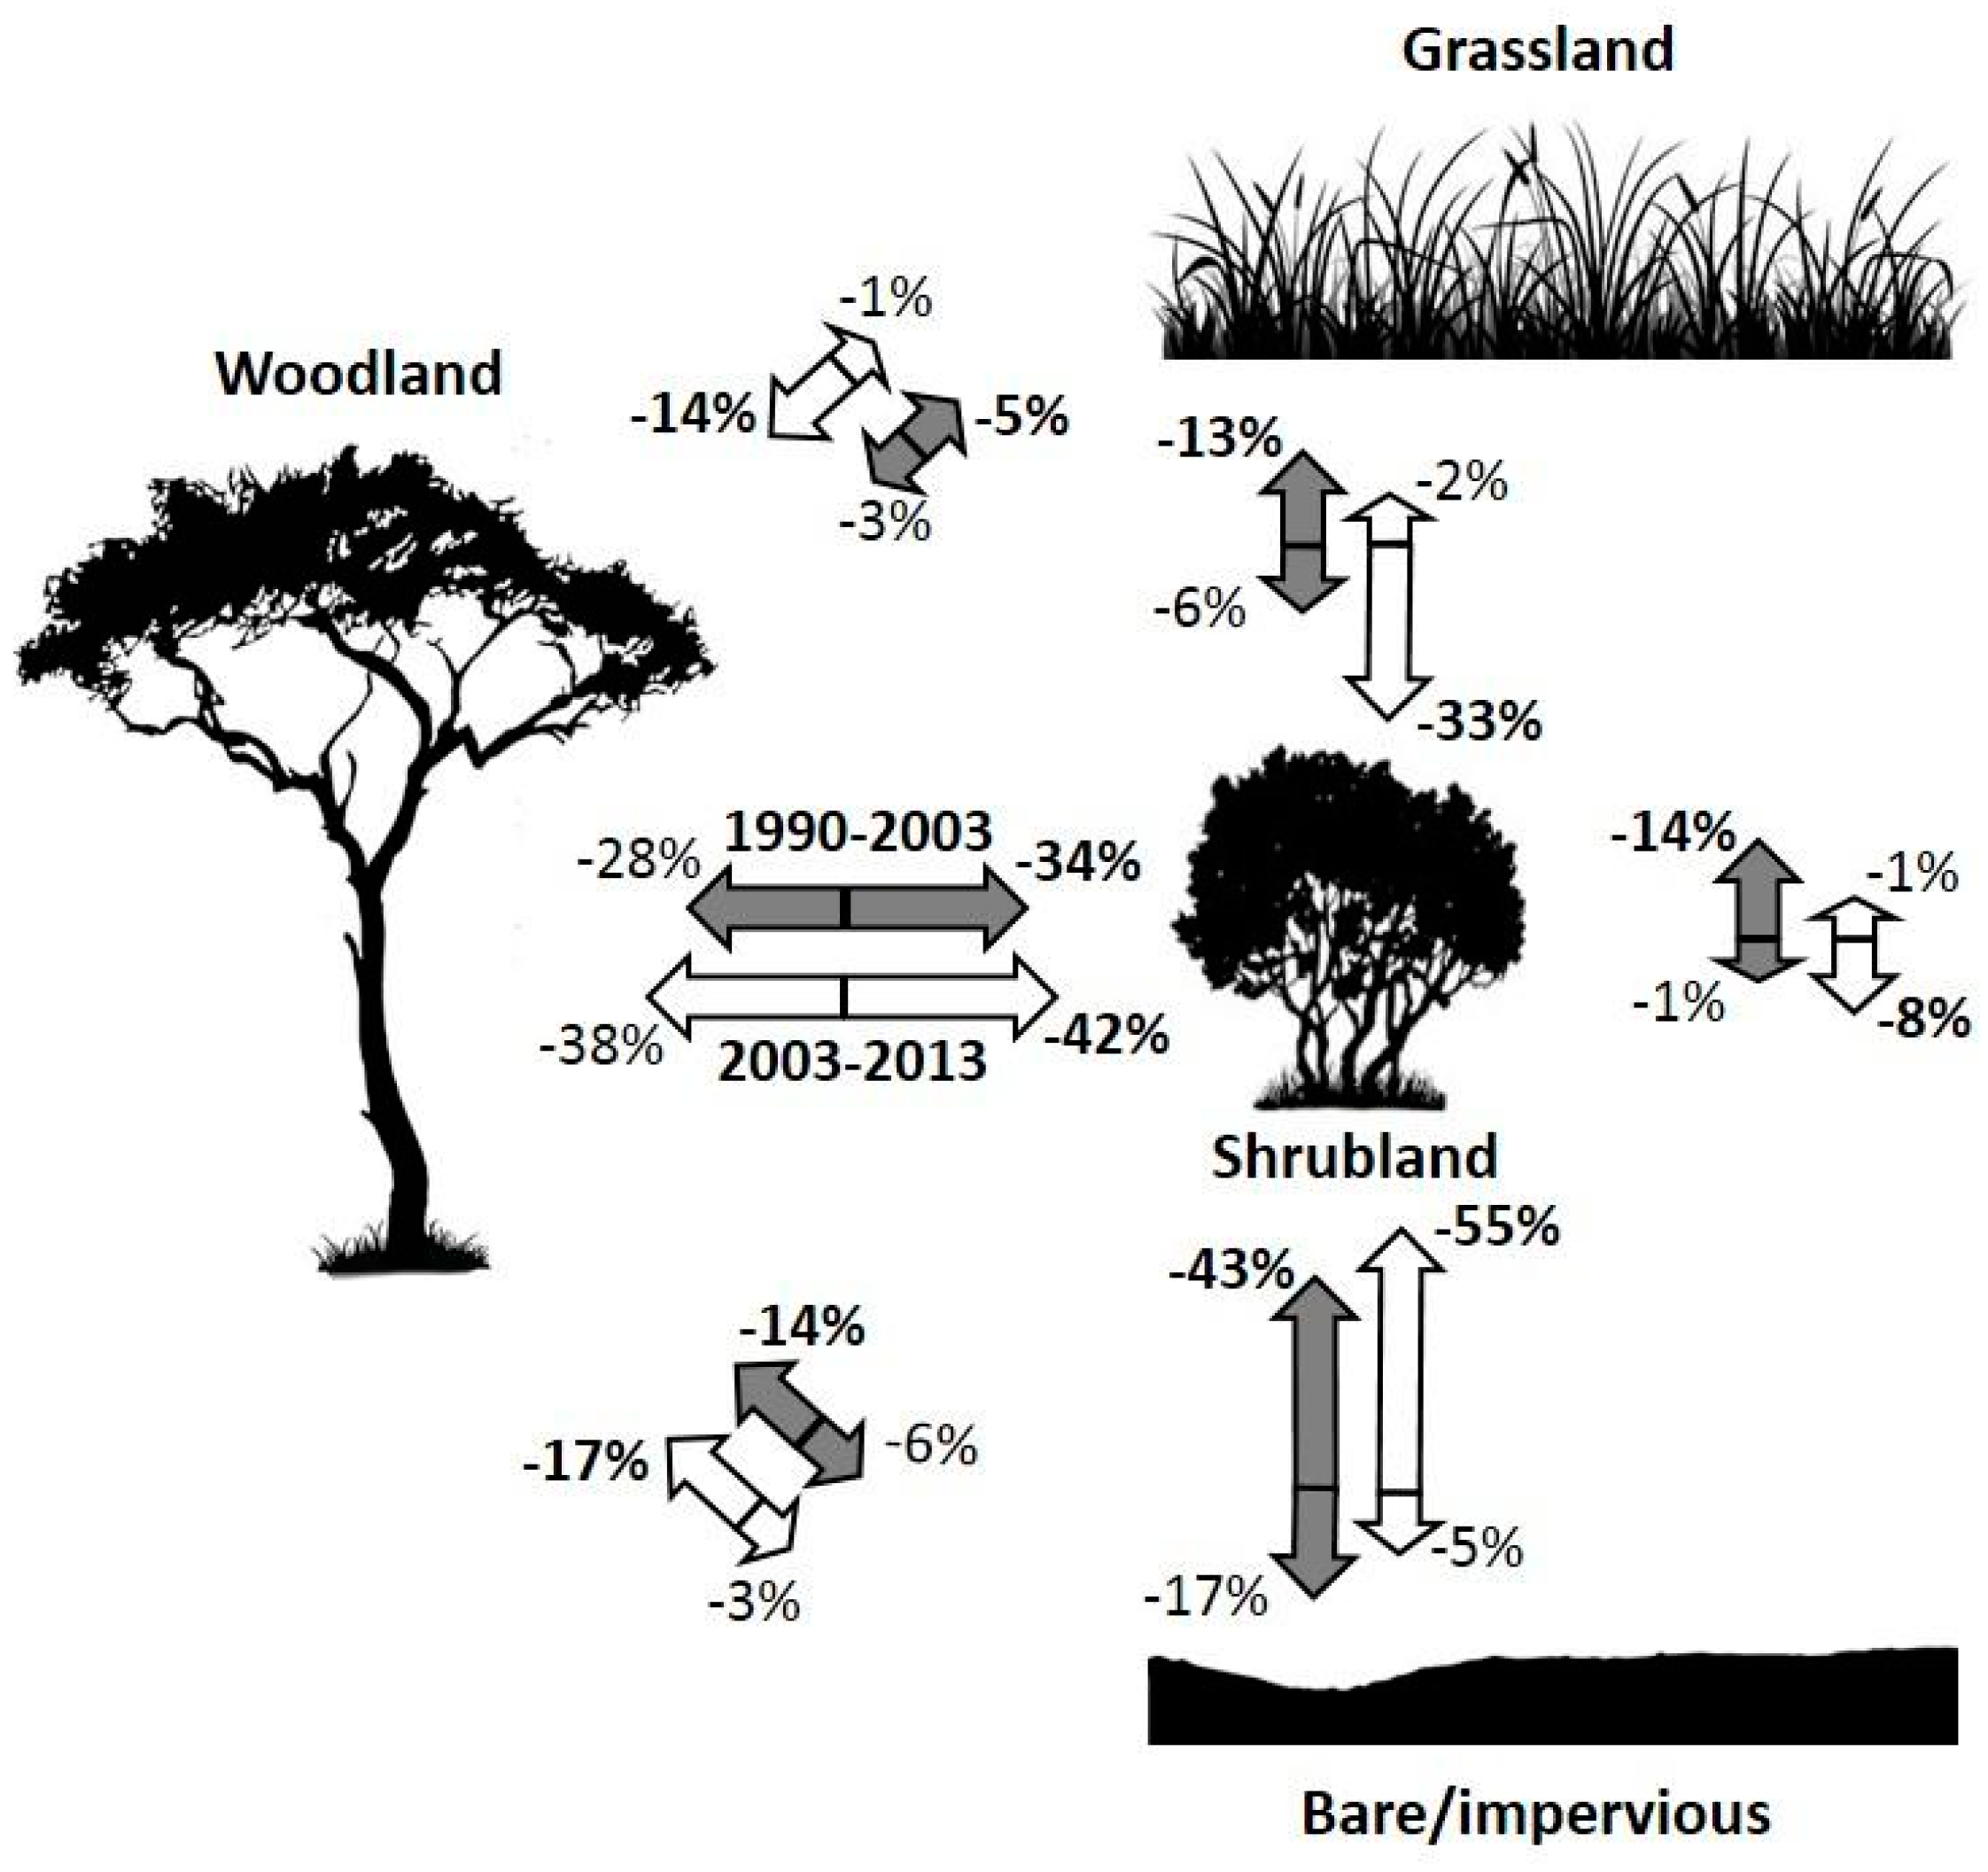
3.3. Summary of Gross LCC
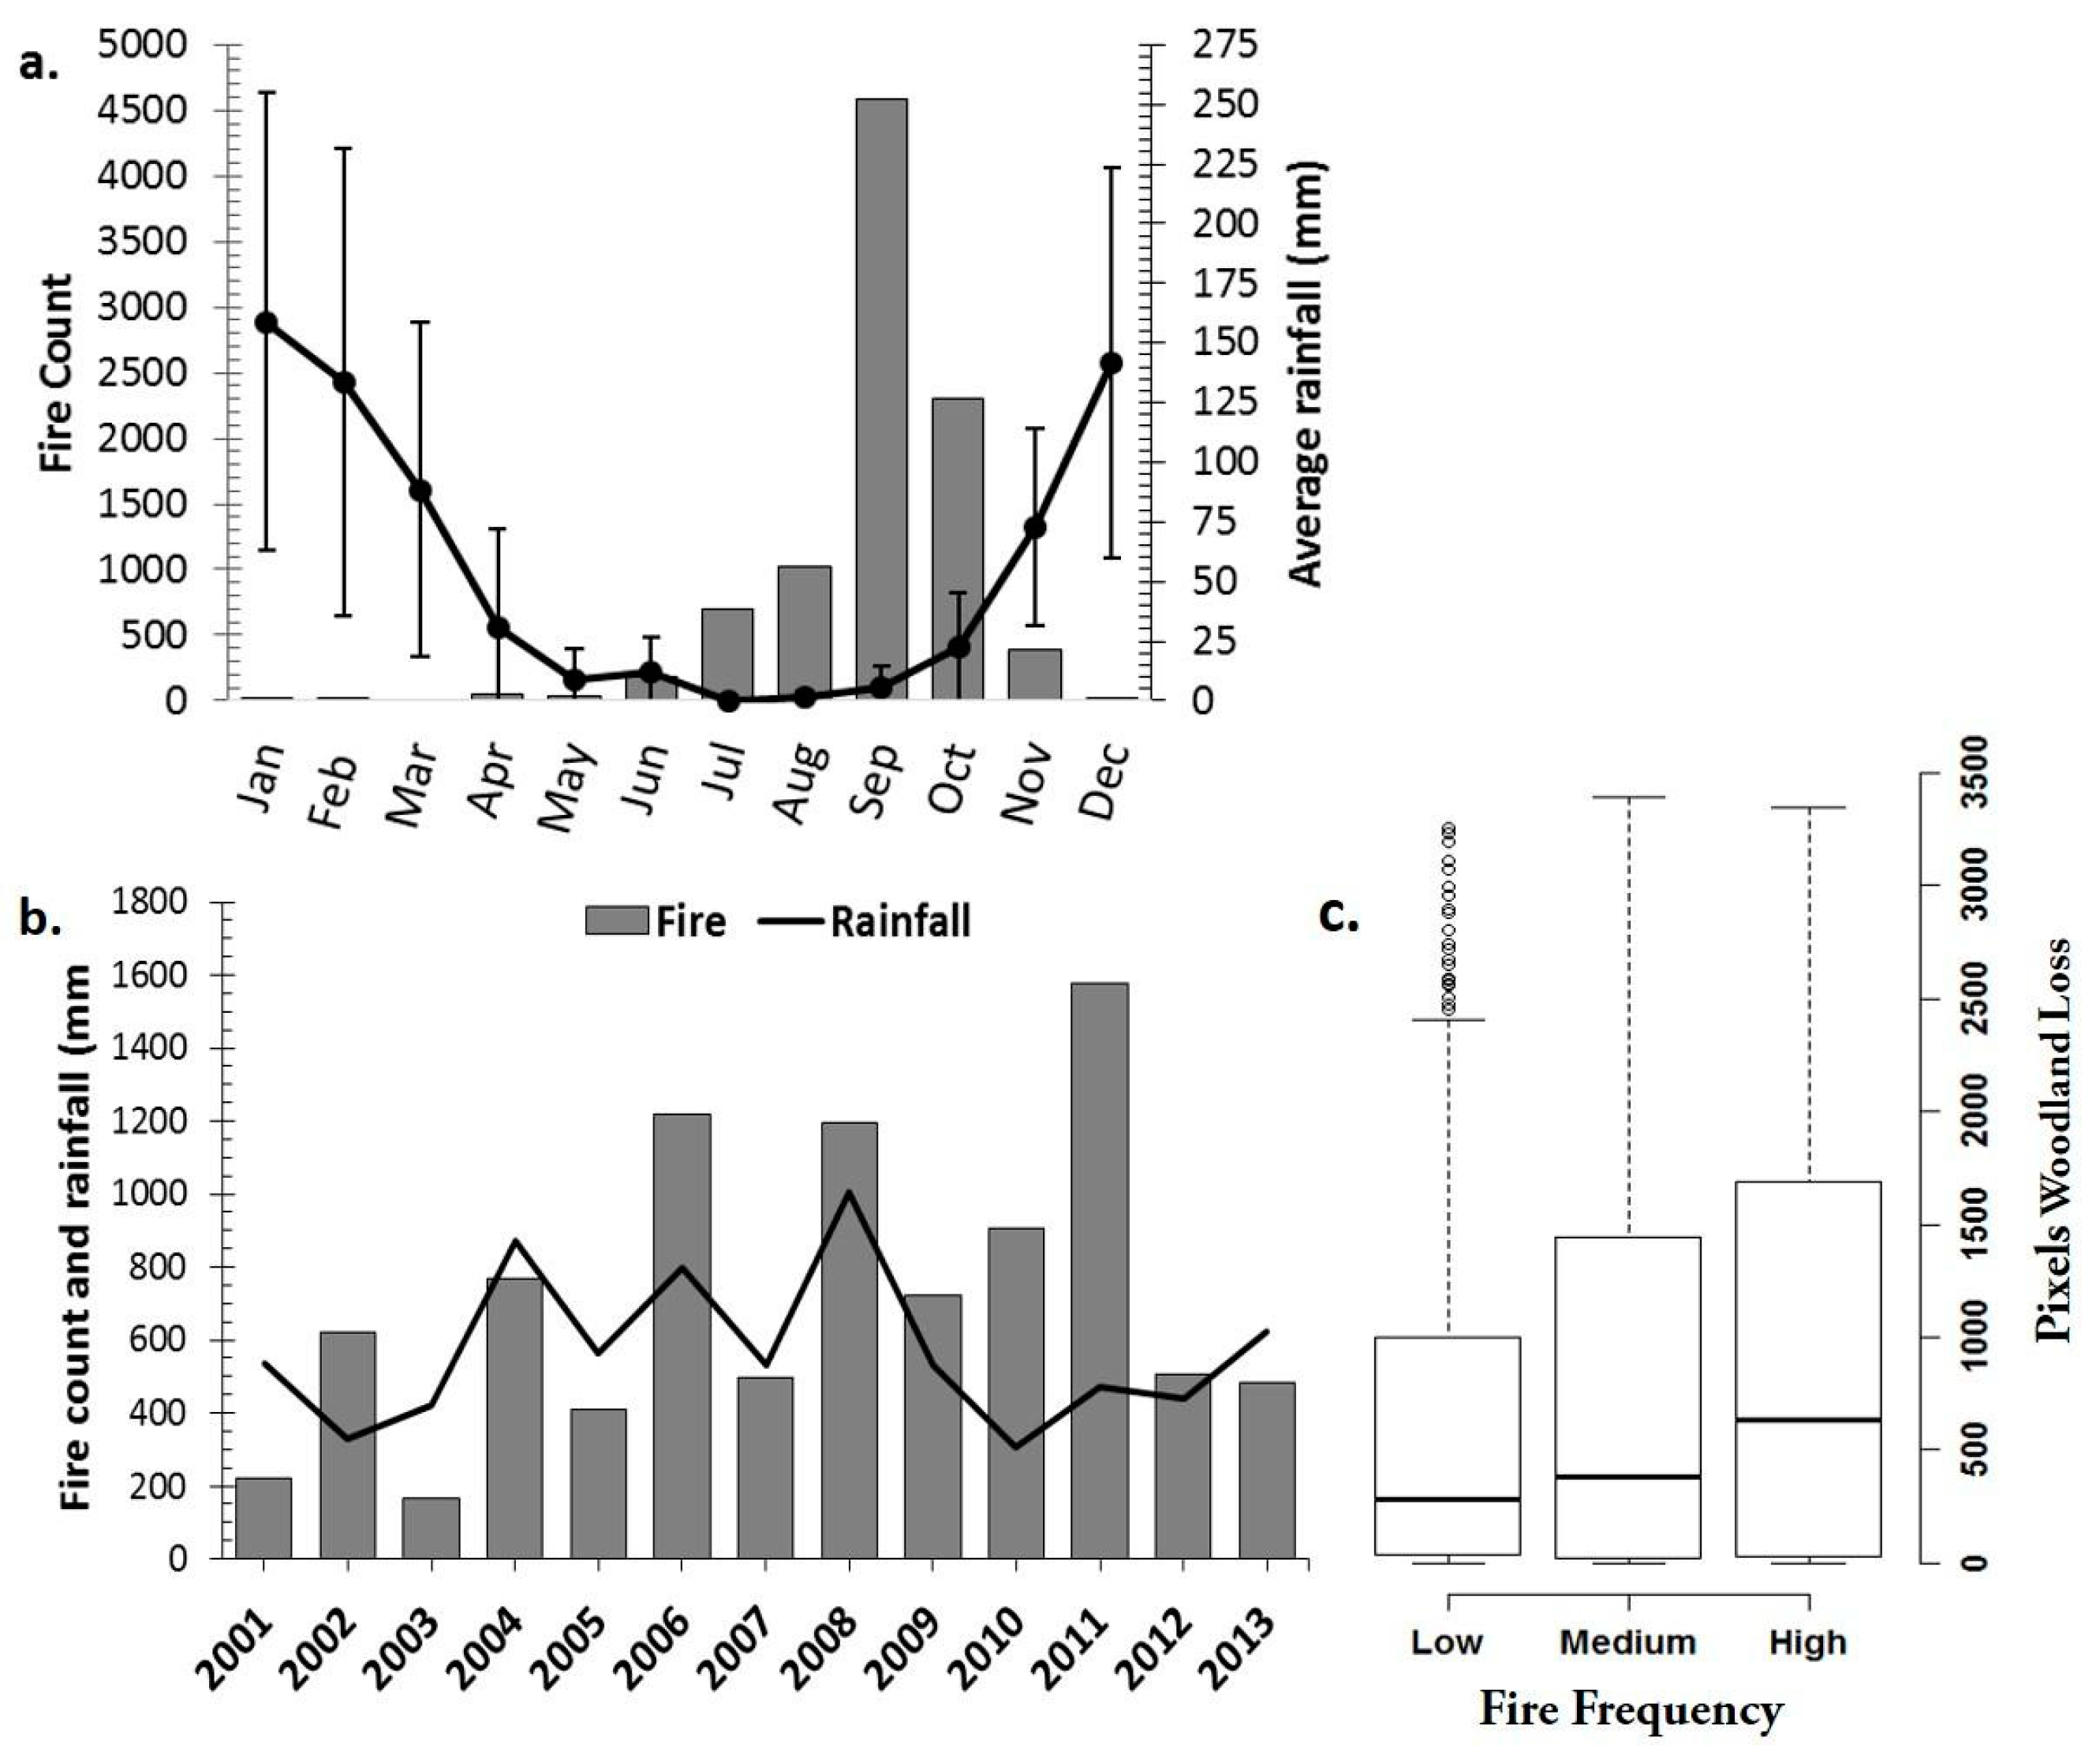
Estimates of gross change among the different cover classes highlight the complex and dynamic nature of LCC across the Chobe District (Table S4). The magnitude and direction of gross percent change among woodland, shrubland, grassland, and bare/impervious cover from 1990–2003 and 2003–2013 are summarized in Figure 8. Over the study period, woodland lost 4317 km2 to shrubland, while gaining an estimated 2788 km2 from shrubland in return (Table S4). Extensive woodland regeneration occurred in areas of bare ground, with 237 km2 (15%) of bare/impervious changing woodland from 1990–2003 and 423 km2 (17%) changing to woodland from 2003–2013. Grassland gains from 1990–2003 were driven predominately by the loss of shrubland (1088 km2, 13%) and bare/impervious (229 km2, 14%) cover, while shrubland encroachment drove grassland losses from 2003–2013. Grassland also lost 395 km2 (14%) to woodland from 2003–2013. Shrubland gains intensively targeted bare ground, with around half of all bare/impervious losses attributable to expansion of shrubland during both time steps. Bare/impervious gains from 1990–2003, on the other hand, were predominately driven by loss of shrubland. Although not shown in Figure 8, the majority of change from water was to wet/irrigated vegetation, while wet/irrigated vegetation predominately changed to grassland Table S4).

3.4. Rainfall

Analysis of precipitation records showed long-term (1922–2013) mean annual precipitation (MAP) in Kasane was 632 mm ± 181 mm with total annual rainfall ranging from 301–1205 mm. For the study period, MAP was 562 mm ± 177 mm. While not statistically significant, MAP differed importantly between the two time steps and boxplots of rainfall for the different time steps show the larger interquartile range from 2003–2013 (Figure 9). Between 1990 and 2003, total annual rainfall only exceeded the long-term MAP in 1991, compared to four years of above average rainfall from 2003–2013 (Figure 9).

3.5. Spatiotemporal Analysis of Fire, Rainfall, and Woodland Loss

Fire was almost entirely a dry season phenomenon in the Chobe District with activity peaking during the period August-October (Figure 10a) when more than 85% of fires in the study area were detected. In contrast, only 11 fires were detected during the wet season from December-March. The timing and location of fires prior to the arrival of convective storms typically associated with lightning production, suggests the majority of fire ignitions were anthropogenic in origin. While the CNP had the most ignitions of any protected area, it had comparatively few fires per year by total land area (Table 2), while Kasane FRE and Kazuma FR had the highest fire incidence.
Fire counts were highly variable from year to year, with more active fires recorded in years with higher rainfall (Figure 10b). OLS regression comparing annual fire count and total annual rainfall over the period 2001–2013 was not significant at the alpha 0.05 level; however, regression residual versus leverage plots indicated 2010 and 2011 as potentially influential outliers, and the fitted regression model excluding these two years was significant (F(1,9) = 10.9, 95% CI (0.388, 2.08), p = 0.009) with an adjusted R2 = 0.50, compared to an adjusted R2 = 0.04 for the full model. High fire and low fire years tended to alternate biennially, with a significantly greater number of fires in even years (excluding 2010 and 2011) (df = 9, t = 2.78, p = 0.02). Higher total annual precipitation was associated with a 41% increase in mean fire occurrence in years when rainfall totals exceeded the long-term MAP of 632 mm.
Comparing the spatial distributions of woodland loss and fire data shows woodland loss increased from low to high fire groups (Figure 10c). However, gls regression results show woodland loss was significantly related to fire (p = 0.024) only in locations experiencing more than 15 fires during the observation period (Table 3).

3.6. Geospatial Analysis of Fire Hot Spots

Fire density was high in unprotected land between the Kazuma and Maikaelelo FRs with significant fire hot spots clustered temporally and spatially in areas where harvest of thatch materials is permitted from September to October (Figure 11). Another large cluster of fire hot spots was centered near the agricultural fields of Pandamatenga and were associated with clearing of agricultural land. Fire density was also high in several protected areas (Kazuma, Maikaelelo, and Kasane FRE), but was generally low in the central and southern CNP and Chobe FR, with numerous fire cold spots indicating significantly fewer fires than predicted compared to neighboring land. Fire hot spots along the Botswana side of the Chobe River were predominately confined to within ~5 km of the river course and decreased in number towards the interior of the Enclave. In contrast, significant fire hot spots on the Namibian side of the river extended into the Bamunu and other communal land conservancies surrounding Mudumu National Park in Namibia, but declined abruptly along the western border of Salambala Conservancy, as well as in neighboring portions of the Enclave.

3.7. Spatial Analysis of Woodland Loss in Relation to Elephant Biomass in Aerial Survey Units

Associations between elephants in dry season aerial survey units and 2003 and 2013 land cover are shown in Figure 12a. Survey units with elephants totaled 5077 km2 in 2003 and 5452 km2 in 2013. Elephants were predominantly associated with woodland and shrubland in both 2003 and 2013 (Figure 12a), however, we found no significant difference in woodland loss among survey blocks with low, medium, or high elephant biomass (Table 3), despite evidence of elevated woodland loss in survey blocks with high elephant biomass (Figure 12b).

4. Discussion

4.1. Chobe District Net and Gross LCC

Spatial distributions of tree, shrub, and grass communities varied considerably in the climatically unpredictable, semi-arid savanna of northern Botswana, influenced by interdependent environmental and anthropogenic forcings over decadal time periods. Rapid land cover transitions within savanna biomes can be driven by complex nonlinear feedbacks between biophysical and human systems at local, regional, and even global scales [14,71]. For example, recent evidence suggests increasing levels of atmospheric CO2 may play a significant role in the expansion of woody plants in savannas by favoring regrowth following injury from fire or browsing [72,73] and inducing plant water-saving [74]. Changes in fire frequency due to increasing rainfall variability related to global climate warming, as well as human activity, may greatly impact the distribution of trees and grasses in Southern African savannas [54,75].
Our analysis found net LCC in the Chobe District from 1990–2013 was characterized by a decrease in woodland cover accompanied by expansion of shrubland. The observed woodland decline of 16% (1514 km2) was in line with United Nation’s FAO estimates that Botswana lost approximately 20% of its forested area from 1990–2015 [76]. Woodland declined at a faster rate across the District from 1990–2003 compared to 2003–2013, driven primarily by losses to shrubland (Figure 8). Shrubland underwent extensive expansion during the second time step, with the majority of gains occurring in bare/impervious and grassland (Figure 8). In contrast, grassland gained across the District during the first time step when conditions were drier, but subsequently lost 1321 km2 (942 km2, 33% to shrubland) from 2003–2013 (Figure 8, Table S4). Bare/impervious cover also varied considerably over the different years of the analysis. Large bare/impervious gains from 1990–2003 in the southwest of the study area around the Savuti marsh were followed by a large decrease from 2003–2013, likely associated with changes in water flow into the Savuti channel and surrounding wetlands, which only began receiving water again in 2010 after an extended dry period [77]. Bare/impervious gains around the towns of Kasane and Kazungula in the northeast of the District, on the other hand, were associated with urban expansion and infrastructure development driven by a 32% increase in population between 2001 and 2011 [55]. Net changes in open water and wet/irrigated vegetation were relatively small compared to total District land area, but were highly variable and primarily related to seasonal flooding of the Chobe River and associated wetlands.
Gross (class) changes at the landscape level were dominated by exchange between woodland and shrubland (Figure 8, Table S4), further illustrating the nonlinear nature of LCC in the study area. Exchange occurs when a pair of pixels is classified as category “A” in the first map and as category “B” in the second map, and vice-versa [67]. Woodland losses to shrubland were higher during both time steps, although the rate of exchange among the two classes increased by approximately 10% from 2003–2013 when conditions were wetter. Such high rates of exchange between shrubland and woodland over decadal time periods may be a common feature of transitional savannas situated between arid and more mesic climate zones. In semi-arid savanna, woody vegetation growing on nutrient-poor soils maintains a large fraction of biomass below ground [78,79]. C. mopane in particular, which is widespread in the south of the Chobe District, may coppice or persist in low shrub form under unfavorable drought conditions or following disturbance, quickly returning to a taller, more closed-canopy state once conditions improve [79]. Observations of woody vegetation growing on Kalahari sand in the study area have noted large areas of shrub savanna have developed into woodland since the 1990s [42,48]. Despite a net loss from 1990–2003, our results indicate woodlands in the Chobe District may undergo expansion even during prevailing drought conditions in locations where fire disturbance remains low to moderate. Woodland gains in bare/impervious cover provide additional evidence of the rate of successful establishment of tree seedlings following fire or other significant disturbance, with 15% of bare ground becoming woodland on average during each 10-year time step (Figure 8).

4.2. LCC in Protected Areas

Woodland losses were generally higher in the protected forest reserves (FRs) compared to the Chobe District and Chobe National Park (CNP), where woodland grew by 20% (702 km2) from 1990–2013, possibly reflecting differences in natural resource management strategies. For example, while the CNP is considered a “no access” area in regards to natural resource extraction, limited subsistence and commercial harvesting of forest resources is allowed in FRs through a government permit system. Similar results were observed for protected areas in East Africa, where only national parks increased their forest area between 2001 and 2009, while forest reserves, nature reserves, and game parks were all more likely to lose forest cover [80]. Wilcock et al. [81], in contrast, found that deforestation in Tanzania shifted to net increases in forest cover once legal protection had been established. However, all the protected areas examined in their study were established more than 50 years prior to the final time step of the analysis (2000), allowing more time for forests to recover.
With the exception of Kasane FR and the CNP, which were created in the late 1960s, the protected areas in the Chobe District were all established after 1980. De-gazetting of protected land during the late 1990s for residential and commercial expansion likely contributed to woodland losses in Kasane and Kazuma FRs. High woodland losses observed in several FRs from 1990–2003 may also be related to commercial logging, which began in the 1930s and greatly reduced the areal coverage of mature trees, particularly Bloodwood (Pterocarpus angolensis) and Zambezi teak (Baikiaea plurijuga) [42,82]. Growing concerns about economic sustainability, along with a lack of concessionaire adherence to contractual agreements, led the government to suspend commercial timber harvesting operations in the forest reserves in 1994 [63,83]. Woodland area also declined in the communally-managed Chobe Enclave over the period 1990–2003, but grew from 2003–2013. A Community-Based Natural Resources Management (CBNRM) framework was implemented in the Enclave beginning in the mid-90s, and has increasingly focused on preserving forests due to their significance to rural livelihoods [84].

4.3. Drivers of Land Cover Change

4.3.1. Rainfall and Fire

Short-term climate variability at inter-annual time-scales, together with strong climate-plant couplings and non-linearities inherent in the system can greatly influence savanna plant community structure and composition, and its response to external forcings [24,85,86,87,88]. Total annual rainfall had a significant positive influence on fire occurrence in the Chobe District from 2001–2013. High fire and low fire years tended to alternate biennially in the Chobe District, a pattern found to contribute to significantly higher mean fuel loads in long-term burn experiments conducted in well-wooded savanna in South Africa [89]. Greater plant biomass in high rainfall years can facilitate dry season fire spread when moisture content of vegetation is lowest [89] and we observed a 41% increase in fires during years when total rainfall exceeded the long-term MAP of 632 mm (Figure 10b). Loss of woodland was significantly higher in locations experiencing 15 or more fires from 2001–2013, but did not differ significantly among areas that burned less frequently, suggesting that a threshold exists below which woodlands may be able recover from fire disturbance in the region. Unprotected land between the Maikaelelo and Kazuma FRs burned at a significantly greater frequency than surrounding land, with many fires coinciding temporally with dry season harvesting of thatch materials permitted only from September to October. Increased plant biomass during high rainfall years improves the condition of thatch, but may also contribute to fire spread due to accidental ignitions from escaped campfires used by grass cutters. Similarly, fire hot spots in communal land along the Chobe River in the communally-managed Enclave appeared to be influenced by the large concentration of fires across the border in Namibia’s Caprivi Strip where people frequently burn reeds and floodplain vegetation to clear land for livestock. Moderate climate change scenarios for the Chobe District and the greater KAZA region predict annual rainfall to decrease by more than 100 mm by the year 2080, while interannual rainfall variability is predicted to significantly increase [90,91]. Given the dynamic feedback between rainfall and fire, climate change impacts on woodlands and the ecosystem services they provide to local communities are likely to be complex.

4.3.2. Woodland Change and Elephants

Over-browsing by elephants is frequently cited as one of the most important drivers of woodland degradation in the Chobe District [92], particularly within the riparian corridor of the Chobe River where elephant and other water-dependent wildlife congregate at high densities during the dry season [45,46,47,49]. Ben-Shahar [48] found that while the proportion of woody plants utilized by elephants increased with proximity to the Chobe River, browsing damage was extremely patchy with some sites little used by elephants and patches varying in size by plant species diversity. Our analysis showed that elephants were predominately associated with woodland and shrubland in dry season aerial survey units (Figure 12a). However, we did not detect any significant differences in woodland loss in aerial survey units with higher versus lower elephant biomass for the years 2003, 2006, and 2012. These results suggest that elephant populations are not contributing significantly to the loss of interior woodlands, despite average annual increases in the regional elephant population of between 5.5% and 7% since the 1960s [93,94].

4.4. Fire Management Implications

The vast majority of fires in the Chobe District occurred late in the winter dry season (Figure 10a) prior to the arrival of convective storms typically associated with lightning production, which suggests the majority of fire ignitions were from anthropogenic sources. Experimental studies have shown that frequent fires in the late dry season can lead to large reductions in the amount of woody vegetation cover compared to those occurring in wet season [95]. Frequent dry season fires are also associated with an increase in multi-stemmed coppicing contributing to the dominance of trees of lower stature [89]. High grass yield in high rainfall years can lead to intense fires as grasses become desiccated during the dry season, which may in turn impose a strong demographic bottleneck on tree establishment and recruitment by increasing mortality of seedlings and saplings [96]. In addition to identifying the primary anthropogenic causes of fire, careful implementation of controlled fuel load reduction fires or thinning in areas identified as significant fire hot spots may present a useful tool in the management of the Chobe District’s forest resources. In high rainfall years, shifting a proportion of fires to the late summer wet season or earlier in the dry season could be another means to reduce the frequency and intensity of dry season fires and limit fire spread in managed forest reserves [89,97]. Natural resource managers will need to carefully consider the impacts of fire season, frequency, and intensity, in their fire policy development, as these factors can significantly influence vegetation cover at a range of growth stages, in addition to affecting other aspects of biodiversity [89,95]. Understanding of the complex spatial interactions between fire, vegetation dynamics, human and wildlife activities, and climate drivers in dryland savanna will be essential to developing greater predictive capacity and improving adaptive fire management strategies.

4.5. Limitations

In this study, we used a hybrid unsupervised ISO Cluster supervised maximum likelihood approach to classify land cover based on contextual knowledge [98]. Our use of PCA helped reduce spectral overlap and redundancy of image data, which has been shown to improve model discrimination between vegetation and bare ground in savannas [99]. While the overall accuracy of our classification was 86.7% (95% CI 0.843, 0.888) with a Kappa coefficient of 0.832, it is important to note that any land cover classification will contain error, and this is particularly true for semi-arid savanna systems where environmental variability creates a mosaic landscape of diverse plant community assemblages [62]. Our classification targeted broad scale LCC patterns at decadal time scales; hence, we may have failed to detect patterns occurring at a smaller scales, such as shifts in woodland community structure or functional diversity. To overcome these limitations, very high resolution satellite data may be used to extend and improve the existing analysis [100], particularly within the narrow riparian zone of the Chobe River. Use of spectral unmixing methods in combination with hyperspectral data has the potential to improve classification accuracy in structurally complex landscapes [101]. We did not examine potential interactions between elephants and fire, variations in fire intensity, or specific anthropogenic forcings on woodland loss, and future research may focus on integrating multi-disciplinary approaches, such as analysis of stakeholder interviews and additional field observations [102] to provide further information on potential drivers and impacts of LCC in northern Botswana.

5. Conclusions

We classified multi-decadal changes in land cover in the semi-arid Chobe District in northeastern Botswana using post-classification analysis of Landsat datasets from 1990, 2003, and 2013. We observed a long-term trend of decreasing woodland cover and increasing shrubland. However, LCC was not strictly linear in nature, with substantial spatiotemporal variation in land cover trajectories across the study area. Grassland and bare/impervious cover, in particular, increased from 1990–2003 but declined substantially during the subsequent time step. MODIS active fire detections varied greatly year to year and among the different protected areas, with the forest reserves and communally-managed lands tending to burn more frequently than the Chobe National Park. Fire frequency increased in years of high rainfall, particularly when annual rainfall exceeded the long-term MAP of 632 mm. However, loss of woodland was significantly associated with fire only in locations experiencing 15 or more ignitions during the period 2001–2013. Although elephants are often cited as a major cause of woodland degradation in northern Botswana, we did not detect significantly higher woodland losses in areas of high elephant biomass estimated from aerial surveys.
Changes in fire frequency as a result of increased climate variability across the Southern African region may have profound effects on the distribution of woodlands in savanna systems. The Chobe District’s transitional location between more arid and mesic climate zones makes it an important model system for the study of the role of disturbance in mediating tree-grass dynamics. Our analysis contributes to improving understanding of long-term land cover changes and savanna ecosystem dynamics, in particular, fire effects on woodland cover stability. The wealth of ecosystem services provided by semi-arid savannas in Southern Africa, coupled with their vast land area, further increases the importance of satellite remote-sensing for monitoring disturbance and change in both naturally-functioning and human-impacted ecosystems. Given the dynamic nature of LCC in the region, land managers should take a long-term approach to understanding change dynamics, in order to correctly identify and isolate emergent threats to vital natural resources and rural livelihoods.

Supplementary Materials

The following are available online at www.mdpi.com/2073-445X/6/4/73/s1, Tables S1–S4.

Acknowledgments

We would like to thank the Government of Botswana’s Department of Wildlife and National Parks and Department of Meteorological Services for providing wildlife aerial survey and rainfall data used in this research. We further acknowledge Stephanie Joos-Vandewalle for her assistance in the field. Funding for this work was provided by the Forest Conservation Botswana (grant agreement number FCB00028) and the National Science Foundation Dynamics of Coupled Natural and Human Systems (Award #1518486).

Author Contributions

J.T.F., K.A.A., and M.E.V. conceived and designed the study. J.T.F. analyzed the data. J.T.F., K.A.A., and M.E.V. wrote the paper.

Conflicts of Interest

The authors declare no conflict of interest.

References

  1. Smith, R. Global Forest Resources Assessment 2000 Main Report; Food and Agriculture Organization: Rome, Italy, 2001. [Google Scholar]
  2. Unccd, Z.N.L.D. United Nations Convention to Combat Desertification. Available online: http://www2.unccd.int/ (accessed on 4 April 2014).
  3. Safriel, U.; Adeel, Z. Dryland Systems.‖ in Ecosystems and Human Well-Being: Current State and Trends; Hassan, R., Scholes, R., Ash, N., Eds.; Island Press: Washington, DC, USA, 2005; Volume 1, pp. 623–662. [Google Scholar]
  4. Safriel, U.; Adeel, Z. Development paths of drylands: Thresholds and sustainability. Sustain. Sci. 2008, 3, 117–123. [Google Scholar] [CrossRef]
  5. Huber-Sannwald, E.; Palacios, M.R.; Moreno, J.T.A.; Braasch, M.; Peña, R.M.M.; de Alba Verduzco, J.G.; Santos, K.M. Navigating challenges and opportunities of land degradation and sustainable livelihood development in dryland social-ecological systems: A case study from Mexico. Philos. Trans. R. Soc. B Biol. Sci. 2012, 367, 3158–3177. [Google Scholar] [CrossRef] [PubMed]
  6. Scholes, R.; Walker, B. Nylsvley: The Study of an African Savanna; Cambridge University Press: Cambridge, UK, 1993. [Google Scholar]
  7. Ryan, C.M.; Pritchard, R.; McNicol, I.; Owen, M.; Fisher, J.A.; Lehmann, C. Ecosystem services from Southern African woodlands and their future under global change. Philos. Trans. R. Soc. B 2016, 371, 20150312. [Google Scholar] [CrossRef] [PubMed]
  8. Joos-Vandewalle, S. The Effects of Urbanisation on Non-Timber Forest Product Dependencies: A Case Study of Three Settlements in the Chobe District of Northern Botswana; University of Cape Town: Cape Town, South Africa, 2015. [Google Scholar]
  9. Schuyt, K.D. Economic consequences of wetland degradation for local populations in Africa. Ecol. Econ. 2005, 53, 177–190. [Google Scholar] [CrossRef]
  10. Jones, B.T. Chobe enclave. In IUCN/SNV CBNRM Support Programme; Printing and Publishing Company: Botswana, Gabarone, 2002. [Google Scholar]
  11. Scholes, R. Syndromes of dryland degradation in Southern Africa. Afr. J. Range Forage Sci. 2009, 26, 113–125. [Google Scholar] [CrossRef]
  12. Dregne, H.; Kassas, M.; Rozanov, B. A new assessment of the world status of desertification. Desertification Control Bull. 1991, 20, 6–18. [Google Scholar]
  13. Wily, L.; Mbaya, S. Land, People, and Forests in Eastern and Southern Africa at the Beginning of the 21st Century: The Impact of Land Relations on the Role of Communities in Forest Future; No. 7; IUCN: Gland, Switzerland, 2001. [Google Scholar]
  14. Staver, A.C.; Archibald, S.; Levin, S. Tree cover in sub-saharan Africa: Rainfall and fire constrain forest and savanna as alternative stable states. Ecology 2011, 92, 1063–1072. [Google Scholar] [CrossRef] [PubMed]
  15. Sankaran, M.; Ratnam, J.; Hanan, N.P. Tree-grass coexistence in savannas revisited-insights from an examination of assumptions and mechanisms invoked in existing models. Ecol. Lett. 2004, 7, 480–490. [Google Scholar] [CrossRef]
  16. Ratnam, J.; Bond, W.J.; Fensham, R.J.; Hoffmann, W.A.; Archibald, S.; Lehmann, C.E.; Anderson, M.T.; Higgins, S.I.; Sankaran, M. When is a ‘forest’ a savanna, and why does it matter? Glob. Ecol. Biogeogr. 2011, 20, 653–660. [Google Scholar] [CrossRef]
  17. Walker, B.H.; Ludwig, D.; Holling, C.S.; Peterman, R.M. Stability of semi-arid savanna grazing systems. J. Ecol. 1981, 69, 473–498. [Google Scholar] [CrossRef]
  18. Walter, W.G.; Bottman, R.P. Microbiological and chemical studies of an open and closed watershed. J. Environ. Health 1967, 30, 157–163. [Google Scholar]
  19. Casper, B.B.; Jackson, R.B. Plant competition underground. Annu. Rev. Ecol. Syst. 1997, 28, 545–570. [Google Scholar] [CrossRef]
  20. Beckage, B.; Platt, W.J.; Gross, L.J. Vegetation, fire, and feedbacks: A disturbance-mediated model of savannas. Am. Nat. 2009, 174, 805–818. [Google Scholar] [PubMed]
  21. Sankaran, M.; Hanan, N.P.; Scholes, R.J.; Ratnam, J.; Augustine, D.J.; Cade, B.S.; Gignoux, J.; Higgins, S.I.; Le Roux, X.; Ludwig, F. Determinants of woody cover in African savannas. Nature 2005, 438, 846–849. [Google Scholar] [CrossRef] [PubMed]
  22. Higgins, S.I.; Bond, W.J.; Trollope, W.S. Fire, resprouting and variability: A recipe for grass-tree coexistence in savanna. J. Ecol. 2000, 88, 213–229. [Google Scholar] [CrossRef]
  23. Scholes, R.; Archer, S. Tree-grass interactions in savannas. Annu. Rev. Ecol. Syst. 1997, 28, 517–544. [Google Scholar] [CrossRef]
  24. Bond, W.; Midgley, G.; Woodward, F.; Hoffman, M.; Cowling, R. What controls South African vegetation—Climate or fire? S. Afr. J. Bot. 2003, 69, 79–91. [Google Scholar] [CrossRef]
  25. Baudena, M.; Dekker, S.C.; van Bodegom, P.M.; Cuesta, B.; Higgins, S.I.; Lehsten, V.; Reick, C.H.; Rietkerk, M.; Scheiter, S.; Yin, Z. Forests, savannas, and grasslands: Bridging the knowledge gap between ecology and dynamic global vegetation models. Biogeosciences 2015, 12, 1833–1848. [Google Scholar] [CrossRef]
  26. Scholes, R.; Dowty, P.; Caylor, K.; Parsons, D.A.B.; Frost, P.G.H.; Shugart, H. Trends in savanna structure and composition along an aridity gradient in the Kalahari. J. Veg. Sci. 2002, 13, 419–428. [Google Scholar] [CrossRef]
  27. Vetter, S. Zambezian Baikiaea Woodlands (at0726). Terrestrial Ecoregions Profiles. World Wildlife Fund. Available online: http://www.worldwildlife.org/wildworld/profiles/terrestrial/at/at0726_full.html (accessed on 4 April 2014).
  28. Lowrance, R.; Altier, L.S.; Newbold, J.D.; Schnabel, R.R.; Groffman, P.M.; Denver, J.M.; Correll, D.L.; Gilliam, J.W.; Robinson, J.L.; Brinsfield, R.B. Water quality functions of riparian forest buffers in chesapeake bay watersheds. Environ. Manag. 1997, 21, 687–712. [Google Scholar] [CrossRef]
  29. Anderson, H.W.; Hoover, M.D.; Reinhart, K.G. Forests and Water: Effects of Forest Management on Floods, Sedimentation, and Water Supply; USDA Forest Service: Berkely, CA, USA, 1976. [Google Scholar]
  30. Swift, M.J.; Heal, O.W.; Anderson, J.M. Decomposition in Terrestrial Ecosystems; University of California Press: Oakland, CA, USA, 1979; Volume 5. [Google Scholar]
  31. McCulley, R.L.; Archer, S.; Boutton, T.; Hons, F.; Zuberer, D. Soil respiration and nutrient cycling in wooded communities developing in grassland. Ecology 2004, 85, 2804–2817. [Google Scholar] [CrossRef]
  32. Bunting, E.; Steele, J.; Keys, E.; Muyengwa, S.; Child, B.; Southworth, J. Local perception of risk to livelihoods in the semi-arid landscape of Southern Africa. Land 2013, 2, 225–251. [Google Scholar] [CrossRef]
  33. Cui, X.; Gibbes, C.; Southworth, J.; Waylen, P. Using remote sensing to quantify vegetation change and ecological resilience in a semi-arid system. Land 2013, 2, 108–130. [Google Scholar] [CrossRef]
  34. Southworth, J.; Rigg, L.; Gibbes, C.; Waylen, P.; Zhu, L.; McCarragher, S.; Cassidy, L. Integrating dendrochronology, climate and satellite remote sensing to better understand savanna landscape dynamics in the Okavango delta, Botswana. Land 2013, 2, 637–655. [Google Scholar] [CrossRef]
  35. Herrero, H.V.; Southworth, J.; Bunting, E. Utilizing multiple lines of evidence to determine landscape degradation within protected area landscapes: A case study of Chobe national park, Botswana from 1982 to 2011. Remote Sens. 2016, 8, 623. [Google Scholar] [CrossRef]
  36. Vogel, M.; Strohbach, M. Monitoring of savanna degradation in Namibia using Landsat TM/ETM+ data. In Proceedings of the 2009 IEEE International Geoscience and Remote Sensing Symposium, Cape Town, South Africa, 12–17 July 2009; pp. III-931–III-934. [Google Scholar]
  37. Lehmann, C.E.; Archibald, S.A.; Hoffmann, W.A.; Bond, W.J. Deciphering the distribution of the savanna biome. New Phytol. 2011, 191, 197–209. [Google Scholar] [CrossRef] [PubMed]
  38. Wessels, K.; Prince, S.; Frost, P.; Van Zyl, D. Assessing the effects of human-induced land degradation in the former homelands of northern South Africa with a 1 km AVHRR NDVI time-series. Remote Sens. Environ. 2004, 91, 47–67. [Google Scholar] [CrossRef]
  39. Brink, A.B.; Eva, H.D. Monitoring 25 years of land cover change dynamics in Africa: A sample based remote sensing approach. Appl. Geogr. 2009, 29, 501–512. [Google Scholar] [CrossRef]
  40. Aleman, J.C.; Blarquez, O.; Staver, C.A. Land-use change outweighs projected effects of changing rainfall on tree cover in sub-saharan Africa. Glob. Chang. Biol. 2016, 22, 3013–3025. [Google Scholar] [CrossRef] [PubMed]
  41. Ministry of Environment Wildlife & Tourism. Forest Policy, Ministry of Environment, Wildlife, and Tourism; Botswana Government Printer: Gabarone, Botswana, 2011.
  42. Skarpe, C.; du Toit, J.; Moe, S.R. Elephants and Savanna Woodland Ecosystems: A Study from Chobe National Park, Botswana; John Wiley & Sons: Hoboken, NJ, USA, 2014. [Google Scholar]
  43. Simpson, C.D. A detailed vegetation study on the Chobe River in north-east Botswana. Kirkia 1975, 10, 185–227. [Google Scholar]
  44. Child, G. An Ecological Survey of Northeastern Botswana; Food and Agricultural Organization of the United Nations: Rome, Italy, 1968. [Google Scholar]
  45. Moe, S.R.; Rutina, L.P.; Hytteborn, H.; du Toit, J.T. What controls woodland regeneration after elephants have killed the big trees? J. Appl. Ecol. 2009, 46, 223–230. [Google Scholar] [CrossRef]
  46. Rutina, L.P.; Moe, S.R. Elephant (loxodonta africana) disturbance to riparian woodland: Effects on tree-species richness, diversity and functional redundancy. Ecosystems 2014, 17, 1384–1396. [Google Scholar] [CrossRef]
  47. Teren, G.; Owen-Smith, N. Elephants and riparian woodland changes in the Linyanti Region, Northern Botswana. Pachyderm 2010, 47, 18–25. [Google Scholar]
  48. Ben-Shahar, R. Patterns of elephant damage to vegetation in Northern Botswana. Biol. Conserv. 1993, 65, 249–256. [Google Scholar] [CrossRef]
  49. Mosugelo, D.K.; Moe, S.R.; Ringrose, S.; Nellemann, C. Vegetation changes during a 36-year period in northern Chobe National Park, Botswana. Afr. J. Ecol. 2002, 40, 232–240. [Google Scholar] [CrossRef]
  50. Fullman, T.J.; Bunting, E.L. Analyzing vegetation change in an elephant-impacted landscape using the moving standard deviation index. Land 2014, 3, 74–104. [Google Scholar] [CrossRef]
  51. Blanc, J.J. African Elephant Status Report 2007: An Update from the African Elephant Database; No. 33; IUCN: Gland, Switzerland, 2007. [Google Scholar]
  52. DWNP. Aerial Census of Wildlife and Some Domestic Animals in Botswana; Department of Wildlife and National Parks. Monitoring Unit, Research Division: Gaborone, Botswana, 2014. [Google Scholar]
  53. Secretariat of the convention on biological diversity. The Convention on Biological Diversity. In Global Biodiversity Outlook, 1st ed.; Secretariat of the Convention on Biological Diversity: Montreal, QC, Canada, 2001; pp. 119–136. [Google Scholar]
  54. Pricope, N.G.; Binford, M.W. A spatio-temporal analysis of fire recurrence and extent for semi-arid savanna ecosystems in Southern Africa using moderate-resolution satellite imagery. J. Environ. Manag. 2012, 100, 72–85. [Google Scholar] [CrossRef] [PubMed]
  55. Republic of Botswana. Population and Housing Census, 2011; Statistics Botswana: Gaborone, Botswana, 2011.
  56. Republic of Botswana. Botswana, National Conservation Strategy: National Policy on Natural Resources Conservation and Development; Gaborone Government Printer: Gaborone, Botswana, 1990.
  57. Giglio, L.; Kendall, J.; Mack, R. A multi-year active fire dataset for the tropics derived from the TRMM VIRS. Int. J. Remote Sens. 2003, 24, 4505–4525. [Google Scholar] [CrossRef]
  58. Justice, C.; Giglio, L.; Korontzi, S.; Owens, J.; Morisette, J.; Roy, D.; Descloitres, J.; Alleaume, S.; Petitcolin, F.; Kaufman, Y. The MODIS fire products. Remote Sens. Environ. 2002, 83, 244–262. [Google Scholar] [CrossRef]
  59. Giglio, L.; Descloitres, J.; Justice, C.O.; Kaufman, Y.J. An enhanced contextual fire detection algorithm for MODIS. Remote Sens. Environ. 2003, 87, 273–282. [Google Scholar] [CrossRef]
  60. Jolly, G. Sampling methods for aerial censuses of wildlife populations. East Afr. Agric. For. J. 1969, 34, 46–49. [Google Scholar]
  61. Boshoff, A.; Kerley, G.; Cowling, R. Estimated spatial requirements of the medium-to large-sized mammals, according to broad habitat units, in the Cape Floristic Region, South Africa. Afr. J. Range Forage Sci. 2002, 19, 29–44. [Google Scholar] [CrossRef]
  62. Kiage, L.; Liu, K.B.; Walker, N.; Lam, N.; Huh, O. Recent land-cover/use change associated with land degradation in the Lake Baringo catchment, Kenya, East Africa: Evidence from Landsat TM and ETM+. Int. J. Remote Sens. 2007, 28, 4285–4309. [Google Scholar] [CrossRef]
  63. Food and Agriculture Organization (FAO). Global Forest Resources Assessment 2010: Main Report; Food and Agriculture Organization of the United Nations: Rome, Italy, 2010. [Google Scholar]
  64. Congalton, R.G.; Green, K. Assessing the Accuracy of Remotely Sensed Data: Principles and Practices; CRC Press: Boca Raton, FL, USA, 2008. [Google Scholar]
  65. Kuhn, M. The Caret Package. R Foundation for Statistical Computing: Vienna, Austria. Available online: https://cran.r-project.org/package=caret (accessed on 21 September 2012).
  66. Pontius, R.G., Jr.; Millones, M. Death to kappa: Birth of quantity disagreement and allocation disagreement for accuracy assessment. Int. J. Remote Sens. 2011, 32, 4407–4429. [Google Scholar] [CrossRef]
  67. Pontius, R.G., Jr.; Santacruz, A. Quantity, exchange, and shift components of difference in a square contingency table. Int. J. Remote Sens. 2014, 35, 7543–7554. [Google Scholar] [CrossRef]
  68. Team, R.C. R: A Language and Environment for Statistical Computing [Internet]; R Foundation for Statistical Computing: Vienna, Austria, 2014. [Google Scholar]
  69. Pinheiro, J.; Bates, D.; DebRoy, S.; Sarkar, D.; R Core Team. NLME: Linear and Nonlinear Mixed Effects Models, R Package Version 3.1-117; 2014. Available online: http://CRAN.R-project.org/package=nlme (accessed on 20 September 2014).
  70. Griffis, V.; Stedinger, J. The use of GLS regression in regional hydrologic analyses. J. Hydrol. 2007, 344, 82–95. [Google Scholar] [CrossRef]
  71. Mayer, A.L.; Khalyani, A.H. Grass trumps trees with fire. Science 2011, 334, 188–189. [Google Scholar] [CrossRef] [PubMed]
  72. Bond, W.J.; Midgley, G.F. A proposed CO2-controlled mechanism of woody plant invasion in grasslands and savannas. Glob. Chang. Biol. 2000, 6, 865–869. [Google Scholar] [CrossRef]
  73. Bond, W.J.; Midgley, G.F. Carbon dioxide and the uneasy interactions of trees and savannah grasses. Philos. Trans. R. Soc. Lond. B Biol. Sci. 2012, 367, 601–612. [Google Scholar] [CrossRef] [PubMed]
  74. Lu, X.; Wang, L.; McCabe, M.F. Elevated co2 as a driver of global dryland greening. Sci. Rep. 2016, 6. [Google Scholar] [CrossRef] [PubMed] [Green Version]
  75. Milly, P.C.; Dunne, K.A.; Vecchia, A.V. Global pattern of trends in streamflow and water availability in a changing climate. Nature 2005, 438, 347–350. [Google Scholar] [CrossRef] [PubMed]
  76. Food and Agricultural Organization (FAO). Global Forest Resources Assessments 2015; FAO Forestry Paper No. 1; The Food and Agricultural Organization of the United Nations (FAO): Rome, Italy, 2015. [Google Scholar]
  77. Darkoh, M.B.; Mbaiwa, J.E. Okavango Delta-A Kalahari Oasis under environmental threats. J. Biodivers. Endanger. Species 2014, 2. [Google Scholar] [CrossRef]
  78. Guy, P. Changes in the biomass and productivity of woodlands in the Sengwa Wildlife Research Area, Zimbabwe. J. Appl. Ecol. 1981, 18, 507–519. [Google Scholar] [CrossRef]
  79. Cowling, R.M.; Richardson, D.M.; Pierce, S.M. Vegetation of Southern Africa; Cambridge University Press: Cambridge, UK, 2004. [Google Scholar]
  80. Pfeifer, M.; Burgess, N.D.; Swetnam, R.D.; Platts, P.J.; Willcock, S.; Marchant, R. Protected areas: Mixed success in conserving East Africa’s evergreen forests. PLoS ONE 2012, 7, e39337. [Google Scholar] [CrossRef] [PubMed]
  81. Willcock, S.; Phillips, O.L.; Platts, P.J.; Swetnam, R.D.; Balmford, A.; Burgess, N.D.; Ahrends, A.; Bayliss, J.; Doggart, N.; Doody, K. Land cover change and carbon emissions over 100 years in an African biodiversity hotspot. Glob. Chang. Biol. 2016, 22, 2787–2800. [Google Scholar] [CrossRef] [PubMed] [Green Version]
  82. Lepetu, J.; Alavalapati, J.; Nair, P. Forest dependency and its implication for protected areas management: A case study from kasane forest reserve, Botswana. Int. J. Environ. Res. 2010, 3, 525–536. [Google Scholar]
  83. Kgathi, D.; Sekhwela, M. Sustainability of the commercial exploitation and management of the chore forest reserves in Botswana. S. Afr. Geogr. J. 2003, 85, 26–34. [Google Scholar] [CrossRef]
  84. Thakadu, O. Success factors in community based natural resources management in Northern Botswana: Lessons from practice. Nat. Resour. Forum 2005, 29, 199–212. [Google Scholar] [CrossRef]
  85. Archibald, S.; Bond, W.; Stock, W.; Fairbanks, D. Shaping the landscape: Fire-grazer interactions in an African savanna. Ecol. Appl. 2005, 15, 96–109. [Google Scholar] [CrossRef]
  86. Staver, A.C.; Levin, S.A. Integrating theoretical climate and fire effects on savanna and forest systems. Am. Nat. 2012, 180, 211–224. [Google Scholar] [CrossRef] [PubMed]
  87. Vanacker, V.; Linderman, M.; Lupo, F.; Flasse, S.; Lambin, E. Impact of short-term rainfall fluctuation on interannual land cover change in sub-saharan Africa. Glob. Ecol. Biogeogr. 2005, 14, 123–135. [Google Scholar] [CrossRef]
  88. Zeng, N.; Neelin, J.D. The role of vegetation-climate interaction and interannual variability in shaping the African savanna. J. Clim. 2000, 13, 2665–2670. [Google Scholar] [CrossRef]
  89. Govender, N.; Trollope, W.S.; Van Wilgen, B.W. The effect of fire season, fire frequency, rainfall and management on fire intensity in savanna vegetation in South Africa. J. Appl. Ecol. 2006, 43, 748–758. [Google Scholar] [CrossRef]
  90. Rogelj, J.; Meinshausen, M.; Knutti, R. Global warming under old and new scenarios using IPCC climate sensitivity range estimates. Nat. Clim. Chang. 2012, 2, 248. [Google Scholar] [CrossRef]
  91. Intergovernmental Panel on Climate Change. Climate Change 2014—Impacts, Adaptation and Vulnerability: Regional Aspects; Cambridge University Press: Cambridge, UK, 2014. [Google Scholar]
  92. Nichols, C.; Vandewalle, M.; Alexander, K. Emerging threats to dryland forest resources: Elephants and fire are only part of the story. For. Int. J. For. Res. 2017, 90, 473–484. [Google Scholar] [CrossRef]
  93. Calef, G.W. Maximum rate of increase in the African elephant. Afr. J. Ecol. 1988, 26, 323–327. [Google Scholar] [CrossRef]
  94. Vandewalle, M. Historic and Recent Trends in the Size and Distribution of Northern Botswana’s Elephant Population. In Effects of Fire, Elephants and Other Herbivores on the Chobe Riverfront Ecosystem Proceedings of a Conference Organised by the Botswana-Norway Institutional Cooperation and Capacity Building Project (BONIC); Government Printer: Gaborone, Botswana, 2003. [Google Scholar]
  95. Smit, I.P.; Asner, G.P.; Govender, N.; Kennedy-Bowdoin, T.; Knapp, D.E.; Jacobson, J. Effects of fire on woody vegetation structure in African savanna. Ecol. Appl. 2010, 20, 1865–1875. [Google Scholar] [CrossRef] [PubMed]
  96. Favier, C.; Aleman, J.; Bremond, L.; Dubois, M.A.; Freycon, V.; Yangakola, J.M. Abrupt shifts in african savanna tree cover along a climatic gradient. Glob. Ecol. Biogeogr. 2012, 21, 787–797. [Google Scholar] [CrossRef]
  97. Booysen, P.D.V.; Tainton, N.M. Ecological Effects of Fire in South African Ecosystems; Springer Science & Business Media: Berlin, Germany, 2012; Volume 48. [Google Scholar]
  98. Phiri, D.; Morgenroth, J. Developments in Landsat land cover classification methods: A review. Remote Sens. 2017, 9, 967. [Google Scholar] [CrossRef]
  99. Almeida, T.; Filho, D.S. Principal Component Analysis applied to feature-oriented band ratios of hyperspectral data: A tool for vegetation studies. Int. J. Remote Sens. 2004, 25, 5005–5023. [Google Scholar] [CrossRef]
  100. Dons, K.; Smith-Hall, C.; Meilby, H.; Fensholt, R. Operationalizing measurement of forest degradation: Identification and quantification of charcoal production in tropical dry forests using very high resolution satellite imagery. Int. J. Appl. Earth Obs. Geoinf. 2015, 39, 18–27. [Google Scholar] [CrossRef]
  101. Meyer, T.; Okin, G. Evaluation of spectral unmixing techniques using modis in a structurally complex savanna environment for retrieval of green vegetation, nonphotosynthetic vegetation, and soil fractional cover. Remote Sens. Environ. 2015, 161, 122–130. [Google Scholar] [CrossRef]
  102. Kiruki, H.M.; Zanden, E.H.; Malek, Ž.; Verburg, P.H. Land cover change and woodland degradation in a charcoal producing semi-arid area in kenya. Land Degrad. Dev. 2017, 28, 472–481. [Google Scholar] [CrossRef]
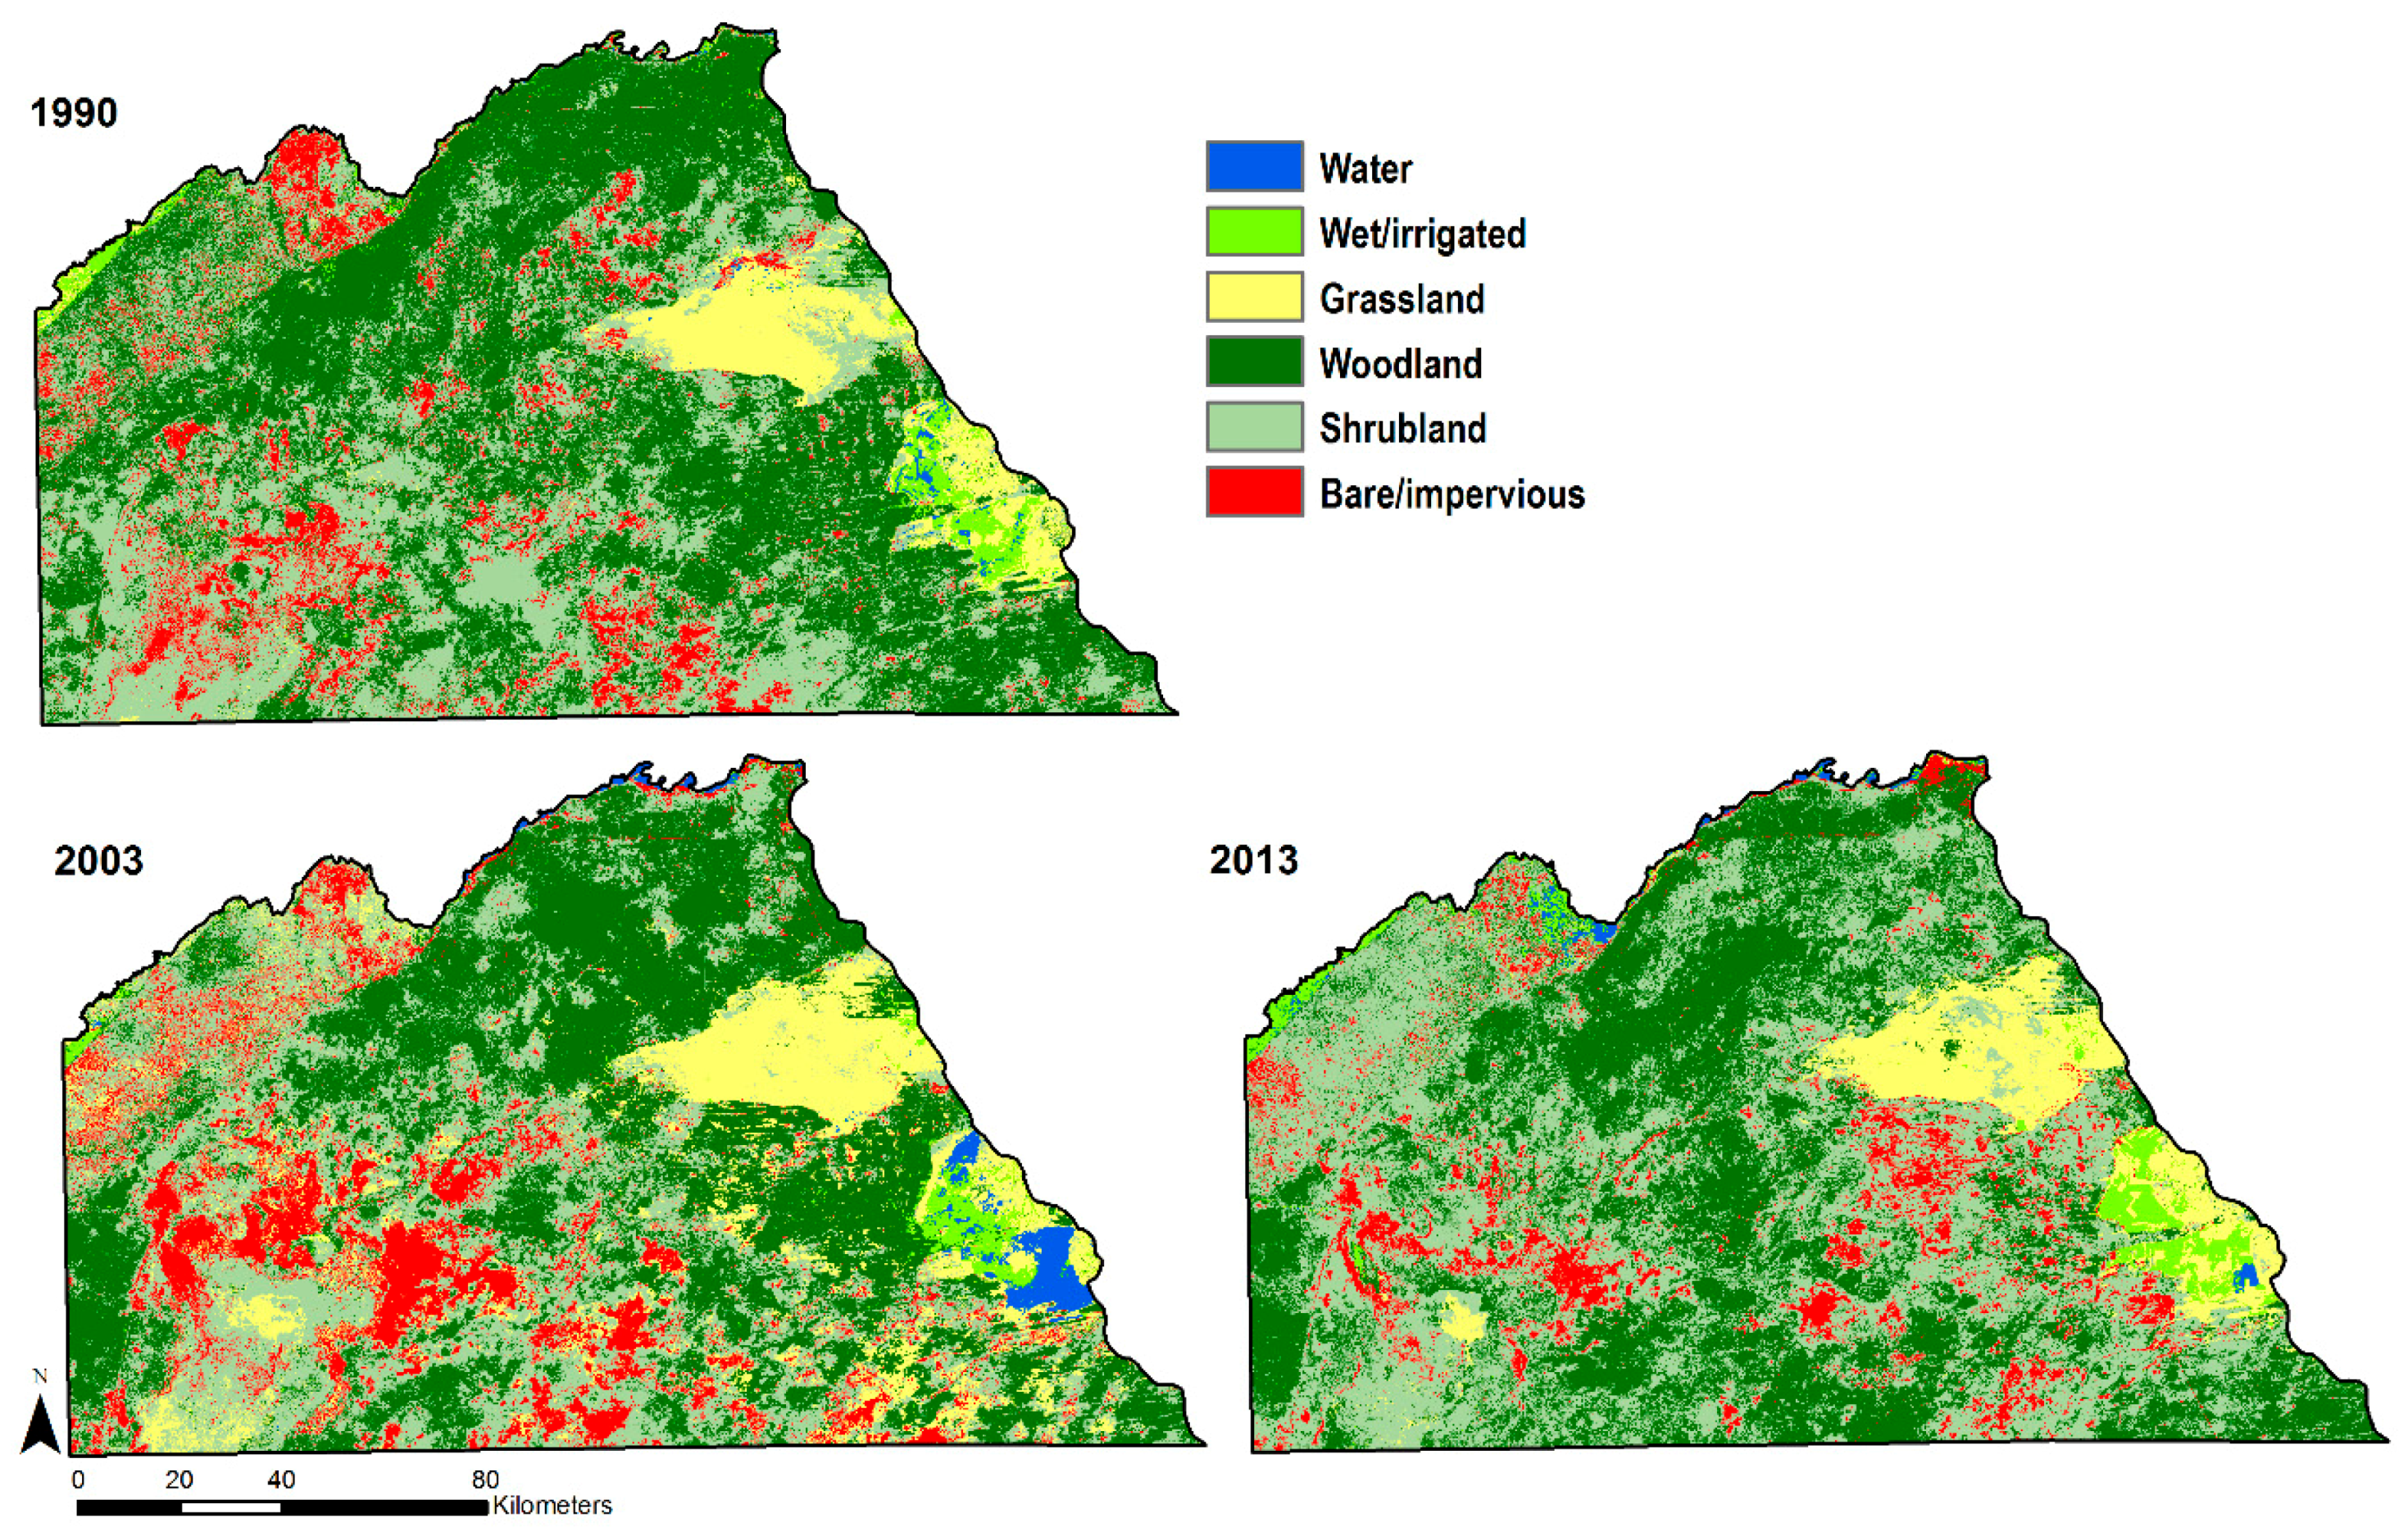
Figure 1. Landsat-based (2013 OLI) map of the Chobe District study area displayed using a natural color (4,3,2) band combination.
Land 06 00073 g001
Figure 2. Landsat mosaic images of the study area taken 8–28 April in each year and displayed using a false color 7,4,2 band combination. Healthy vegetation appears green with darker hues indicating forested areas. Water is black to dark blue and pink and magenta indicate bare ground, while sand, soil, and sparsely-vegetated areas appear in lighter shades of pink and tan.
Land 06 00073 g002aLand 06 00073 g002b
Figure 3. (a) Summary of overall disagreement between 2013 land cover classification and reference data, separated into the components of quantity and allocation. (b) Summary of agreement, omission disagreement, and commission disagreement between 2013 land cover classification and reference data by cover class as a percent of the study area domain.
Land 06 00073 g003
Figure 4. Land cover classification maps of Chobe District for 1990, 2003, and 2013.
Land 06 00073 g004
Figure 5. Estimated net area (km2) for Chobe District land cover in 1990, 2003, and 2013. Bars show estimated error calculated using field and training site data. Estimated errors for consecutive time steps were less than net change for all classes except wet/irrigated in all three years, and woodland in 2003 and 2013.
Land 06 00073 g005
Figure 6. Maps of woodland change from 1990–2003 and 2003–2013. Woodland losses are shown in red and gains in green. White indicates areas of no change or land cover other than woodland.
Land 06 00073 g006
Figure 7. Land cover (km2) in the Chobe National Park and six protected forest reserves, the Chobe Enclave for 1990, 2003, and 2013.
Land 06 00073 g007
Figure 8. Dynamics of gross change among woodland, shrubland, grassland, and bare/impervious land cover in the Chobe District for 1990–2003 (gray arrows) and 2003–2013 (white arrows), represented as percent losses. Arrows indicate the direction of class losses, with arrow length scaled by change magnitude and largest transitions shown in bold. For example, from 1990–2003 34% of all woodland losses were to shrubland, while 28% of all shrubland losses were to woodland.
Land 06 00073 g008
Figure 9. Total annual rainfall (mm) for the study period with long term (1922–2013) mean annual precipitation (MAP) and MAP for each time step with standard deviations shown, along with boxplots of total annual rainfall for the different time steps.
Land 06 00073 g009
Figure 10. (a) MODIS fire detections for the Chobe District from 2001–2013 by month (n = 9288, s = 1376) with long-term (1922–2013) average total monthly rainfall (mm) with standard deviations (b) total annual rainfall (mm) and active fires in the Chobe District from 2001–2013. (c) boxplots of woodland loss and fire frequency grouped by low (≤5), medium (6–14), and high (≥15) classes.
Land 06 00073 g010
Figure 11. MODIS active fires (2001–2013, n = 33,631) for Chobe District and neighboring countries, showing kernel density (fires/10 km2) overlaid with Getis-Ord Gi* hot and cold spot confidence level bins. The red line marks the spatial extent of MODIS fire data used in the analysis.
Land 06 00073 g011
Figure 12. (a) Area (km2) and percent land cover in 2003 and 2013 aerial survey units with elephants (b) boxplots of elephant biomass (LSU/km2) in aerial survey blocks from 2003, 2006, and 2012 grouped into low (<10), medium (10.1–20), and high (>20) classes vs. woodland loss from 2003–2013.
Land 06 00073 g012
Table 1. Land-cover classifications based on 2010 FAO Forest Resources Assessment designations.
ClassDescription
WaterPerennial and seasonally-flooded river channels, water-filled pans, reservoirs, and watering holes
Wet/irrigated vegetationPermanent and seasonally-inundated wetland, floodplain, and riparian vegetation; irrigated agricultural land, and water-saturated vegetation surrounding ephemeral water pans.
GrasslandLand cover dominated by grasses with <10% tree and shrub cover.
WoodlandLand with tree cover ranging from open (>10%) tree savanna intermixed with a grass or shrub understory, to closed-canopy (>40% cover) dry deciduous forest.
ShrublandLand cover dominated by mixed, short woody vegetation (usually <3 m tall) ranging from open shrub savanna (>10% cover) with a discontinuous understory cover of annual grasses, herbs, and occasional tall trees, to thickets (>50%) with little or no grass cover.
Bare/imperviousNatural sandy and bare soils; rock outcrops; and impervious surfaces including dirt and tar roads, parking lots, and rooftops.
Table 2. Summary of fire frequency for the Chobe District, Enclave, and protected areas. Mean detection confidence levels for each location are included, along with an area-weighted annual fire index (AFI), calculated by dividing average annual fire frequency by total land area (fires*year−1/km2), representing a straightforward way of comparing fire incidence in analysis units of varying size.
LocationArea (km2)Mean Detection ConfidenceTotal FiresAverage Annual FiresAFI
Chobe District21,1539192887143.4
Chobe Enclave1677891128875.2
Protected Area
Chobe NP10,1689228352182.1
Chobe FR138289326251.8
Sibuyu FR116992726564.8
Kasane FRE66090613477.1
Maikaelelo FR53891310244.4
Kazuma FR19491151126.0
Kasane FR123923332.1
Table 3. Generalized least squares regression results.
VariableWoodland Loss
Intercept10.77 **19.94 **
df 8461257
Medium elephant biomass 0.002-
High elephant biomass0.008-
Medium fire -1.58
High fire -5.31
Variogram FormRational quadraticExponential
Range 0.0020.03
Nugget<0.010.66
Residual standard error6.4917.07
Significance of variable coefficients: p ≤ 0.001 **, p ≤ 0.05.

