The Influence of Geology on Landscape Typology in Jordan: Theoretical Understanding and Planning Implications
by

Taleb Odeh
1,*, 
Natalia Boulad
2,
Omar Abed
2,
Anas Abu Yahya
2,
Nour Khries
2 and
Nizar Abu-Jaber
3 1
Arid Lands Academy, The Hashemite University, P.O. Box 330127, Zarqa 13133, Jordan
2
The Royal Society for the Conservation of Nature (RSCN), P.O. Box 1215, Jubeiha 11941, Jordan
3
Center for the Study of Natural and Cultural Heritage, German Jordanian University, P.O. Box 35247, Amman 11180, Jordan
*
Author to whom correspondence should be addressed.
Land 2017, 6(3), 51; https://doi.org/10.3390/land6030051
Submission received: 20 April 2017
/
Revised: 24 July 2017
/
Accepted: 26 July 2017
/
Published: 31 July 2017
(This article belongs to the Special Issue Landscapes in the Eastern Mediterranean between the Future and the Past)
Abstract
:Landscape Character Assessment (LCA) has been introduced into Jordan through the MEDSCAPES project. The purpose of this project was to streamline landscape studies and integrate them into the land use planning practices in Jordan. Two areas within the Mediterranean and arid climatic zones of the country were chosen as test areas for the methodology. These were the Yarmouk River drainage basin in the northwest of the country and the Mujib River area in the west of Jordan within the Dead Sea basin. Landscape Character Mapping resulted in 22 and 64 Land Description Units (LDUs) for the Yarmouk and Mujib areas, respectively, which were then classified into 14 landscape types. The factors which control the spatial distributions of these units are geology, land cover, landform, and settlements. However, the study suggests that the underlying geology, which influences topography, impacts indirectly on soil types, climate zones, and human activities, and hence has a predominant influence on the character of these units. Specifically, the transition between the Dead Sea Rift Valley and the adjacent highlands create variations in the topographical relief, climate, water availability, and human settlements. Implementation of LCA in Jordan has done much to highlight geological hazards, such as sinkholes, as constraints to development in certain areas. Here, we described how the LCA process could be implemented in Jordan and how this can help in improving land use management practices in the country.
1. Introduction
Over the last 100 years, population growth and urbanization in Jordan has tremendously changed the land cover of central and north-west Jordan, where there are water resources. The rest of Jordan is mostly desert areas with limited population and Human activity [1]. Population growth and similar, albeit more modest, spatial growth has occurred in the other major cities of the country as well [2]. Poor planning practices during rapid growth periods, which were often triggered by migrations from wars in surrounding countries, have led to a myriad of social and environmental problems [1,2]. These include the common problems of urban sprawl and the loss of agricultural land [3]. More recent legislation and practices rely on long-term master plans for the major cities, which has placed more discipline into the growth patterns [4]. On the other hand, problems of poorly regulated growth are also seen in smaller towns and in rural areas as well, and are perhaps even more pronounced there [1,3].
There are a number of other reasons for the poor land use planning practices in Jordan. These include political pressure imposed by local people and a desire to maintain social cohesion at any cost [4,5]. The cost is high, however, in extending services to far flung scattered houses and building the infrastructure to serve them. Partially for this reason, municipalities in Jordan are generally poorly funded and ill equipped to provide basic services to their residents [3,4,5].
Of course, there are environmental costs as well [1]. These include groundwater depletion and contamination due to the lack of sewage networks, the changing of surface water drainage patterns, the fragmentation of often sensitive ecosystems, and increased soil loss and the deterioration of agricultural lands [1,6].
As part of the effort to remedy this situation, the Ministry of Municipal and Rural Affairs (MoMRA) in Jordan has begun to develop local master plans for many of the 99 municipalities of Jordan [5]. This has coincided with the funding of the MEDSCAPES (Mediterranean Landscapes) project ENPI-CBCMED (European Neighbourhood and Partnership Instrument Cross Border Component Mediterranean) program of the European Union. The purpose of this project was to introduce an integrative landscape character assessment (LCA) framework for enhanced and sustainable territorial planning and decision-making in the Eastern Mediterranean area [7,8]. The MEDSCAPES project had a number of components that are relevant to this introduction. Within it, LCA has been adapted for local conditions and implemented in two test areas (Figure 1). Finally, major stakeholders, particularly MoMRA, have been involved in the entire project and have signed a Memorandum of Understanding to use LCA as part of the base map set that is used for land use planning throughout Jordan.
The first objective of the research is to demonstrate the first application of landscape character assessment in Jordan that was carried out as part of the MEDSCAPES project. The second objective is to evaluate how the underline geological structures control the spatial distribution of the landscape units.
2. Background information
The two case studies selected have a mix of natural and cultural landscape characteristics. They are as follows:
2.1. The Yarmouk River Basin
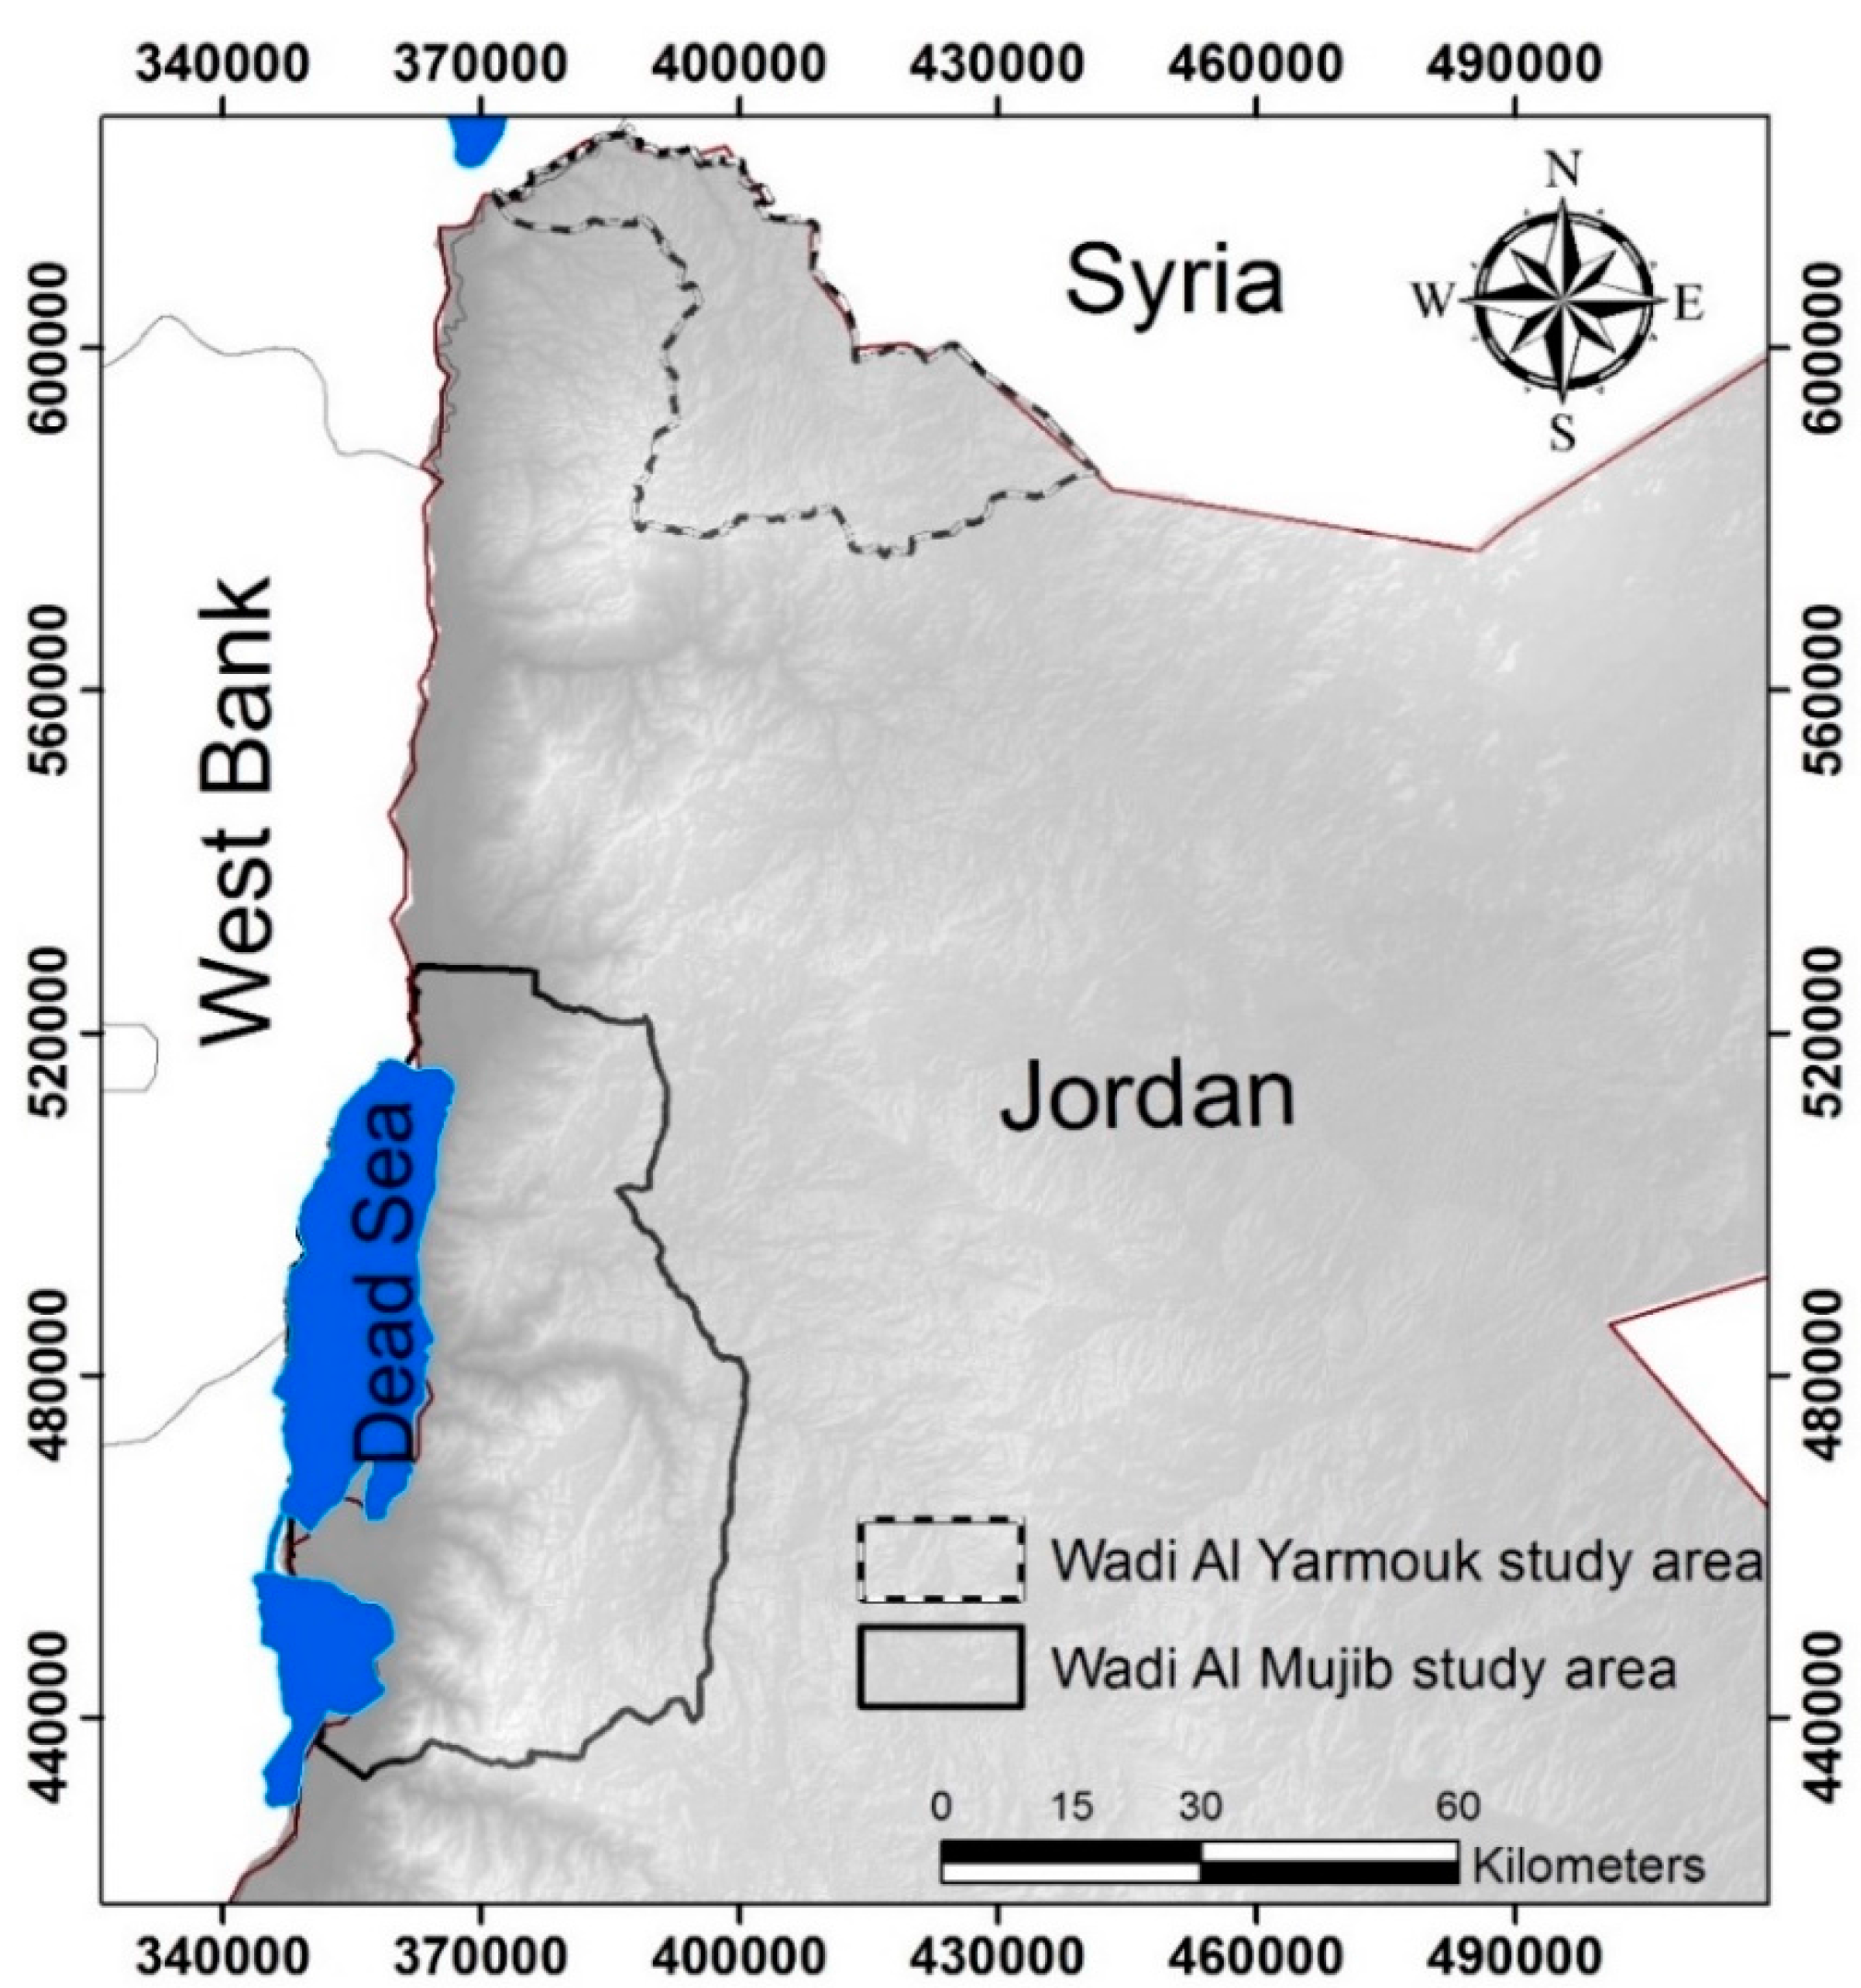
This basin is situated in the northwestern corner of the country and covers an area of about 1160 km2. It has the forth and tenth largest cities of Jordan; Irbid (population 307,480) and Ramtha (population 74,901). The headwaters of the basin fall in the Ajloun highlands south of Irbid, but the Yarmouk River itself begins permanent flow at Wadi Shallaleh near the Syrian border. The topographic relief in the area is high, ranging from 1200 m above sea level (masl) in the Ajloun Highlands to about −16 (mbsl) at the confluence between the Yarmouk and Jordan Rivers. The geology is dominated by Upper Cretaceous limestone with sinkholes mixed with marl in the lower formations (the Naur and Wadi Shuib formations) and chert in the upper formations (The Amman and Um Rijam Formations). The limestone forms a dome structure with the apex in the area of Ajloun, with the various formations dipping away from this apex in all directions. Towards the east, the Dead Sea Rift Valley is the dominant structural feature, with down rifting leading to rapidly lower elevations in that direction. Towards the north, a peneplain is found at the Yarmouk River showing distinct entrenched meanders along much of the river course. Finally, early in the rifting and uplift process, volcanism led to basalt flows along much of the northern part of this study area [9].
Rainfall falls in the winter, with annual precipitation rates ranging from 580 mm/year in Ras Munif in Ajloun to 390 mm/year in the northern Jordan Valley at Baqoura [10]. The minimum annual temperature ranges from 5–10 °C and mean annual maxima range from 20–30 °C. Soil is dominated by Terra rosa and Rendzina soils [3]. It has significant agricultural activities, ranging from rain-fed olive groves, orchards, and vineyards in the higher elevation to field crops (wheat and rain-fed vegetables in the Irbid area), to irrigated vegetables, citrus, and bananas in the vicinity of the Yarmouk River and the northern Jordan Valley [4]. The area is rich in scenic, historical, and cultural values, including remains of uninterrupted occupation since the Neolithic Period [11].
2.2. Wadi Mujib River Basin
It is situated in Middle West of Jordan with an area of about 3800 km2. Unlike the Yarmouk study area, Wadi Mujib is not strictly a river drainage system, but a national park stretching from the Mujib River to Sweimeh on the northern shore of the Dead Sea [12]. It extends from the shore of the Dead Sea to the highlands overlooking it. The area has two major cities: Madaba (84,600 inhabitants) and Al Karak (21,678 inhabitants) [5]. The area is important from both an economic as well as an environmental perspective. In addition to the Dead Sea shore, the area has the Ma’in and Zara hot springs as well as beautiful vistas, including a panoramic view of the Dead Sea where a visitor center and small museum known as the Dead Sea Panorama Complex has been built. The area is undergoing rapid development, with large investments in tourism being made on the Dead Sea shore [8]. The Wadi Mujib river basin has very cold winters with temperatures that might go down up to −10 °C in the mountainous area, and very hot, dry summers with temperatures that may exceed 40 °C at the Dead Sea shore area. The average amount of rainfall varies from 400 mm/year in the mountainous area to 100 mm/year at the Dead Sea shore line area [11,13].
Geologically, rock formations in Jordan are mostly sedimentary, belonging to the Paleozoic, Mesozoic, and Cenozoic ages during the phases of Paleotethys and Tethys transgressions and regressions [9,14]. In the studied areas sedimentary rocks are mainly Upper Cretaceous limestone, sandstone, and marl [9], covered in some areas by basaltic rocks that were formed during the Cenozoic. The fault systems in the study area have three main trends: (1) NW-SE which is parallel to the Red Sea and was created as a result of the Sea floor spreading; (2) a WNW-ESE fault system, which is perpendicular to the Dead Sea regional transform fault; and (3) a NNW-SSE fault system following the trend of the Dead Sea Transform DSR fault which is the most prominent fault system in the studied areas [9].
Topographically, landforms could be defined as natural physical features of the earth's surface that were generated as a result of the underlying geological structures and the climatic nature of the area, controlling the erosion of the different rock units [15]. Accordingly, Jordan has high relief topography because of movement along the DSR fault in addition to the nature of the rock units in the area [9]. The two cases studies therefore have high relief topography (Figure 2).
3. Methodology
Geographic Information Systems (GIS) are computer-based systems for geo-referenced data. They are used for management (storage and retrieval), manipulation and analysis, and the display of geo-data [16]. Landscape Character Assessment (LCA) is a range of techniques used to classify, describe, and understand the evolution and physical and cultural characteristics of a landscape [17]. All the requested data to carry out a landscape character assessment must be geo-referenced in order to understand the spatial distribution of the various spatial characters [18]. Presenting the geo-data in the form of a vector has major advantages, such as having the original resolution without generalization and allowing efficient encoding of topology [19,20]. Therefore, we were trying to generate and have most of the geo-data that was requested in form of vectors (Shapfile by ArcGIS 10.2 software). The two cases studied have relatively large areas, about 4960 km2, and complicated topographies. Moreover, there is a shortage in the high resolution of the land surface data. Therefore, a simplified LCA was done using GIS in order to generate LDUs [7,20].
Digital layers representing topography, geology, soil, land cover, and settlement patterns were used for creating LDUs at 1:250,000 scale. Contour lines at 50 m intervals were derived using ArcGIS software with Spatial Analyst extension (ESRI, 2013) from a digital elevation model available from the Advanced Spaceborne Thermal Emission and Reflection Radiometer (ASTER) at a 30 m spatial resolution. The contour lines were reclassified into elevation ranges to make the visual interpretation of landform easier. A slope raster was derived from the 50 m contour lines to provide more understanding about the steepness of the terrain by using Spatial Analyst extension. The slope raster was reclassified into percent slope ranges showing flat, undulating, and rolling slopes of land.
Digital geologic map layers were obtained from the Natural Resources Authority at 1:50,000 scale. The geologic map layers' attributes were too detailed for level 1 mapping; therefore, they were reclassified into larger rock units. Soil map layers at a scale of 1:250,000 were obtained from the national soil map and land use project implemented by the Ministry of Agriculture in 1994. Land cover data for the study area were obtained from the national land cover map of Jordan available at a scale of 1:250,000. Settlement Pattern data layers were created by manual digitizing of scanned topographic maps at a scale of 1:50,000. The settlement data layers available from topographic maps were updated by digitizing Google Earth imagery.
The mapping of LDUs was carried out by overlaying in GIS for the above-described layers and followed the MEDSCAPES LCA protocol [20]. This approach could be summarized in 4 steps as follows:
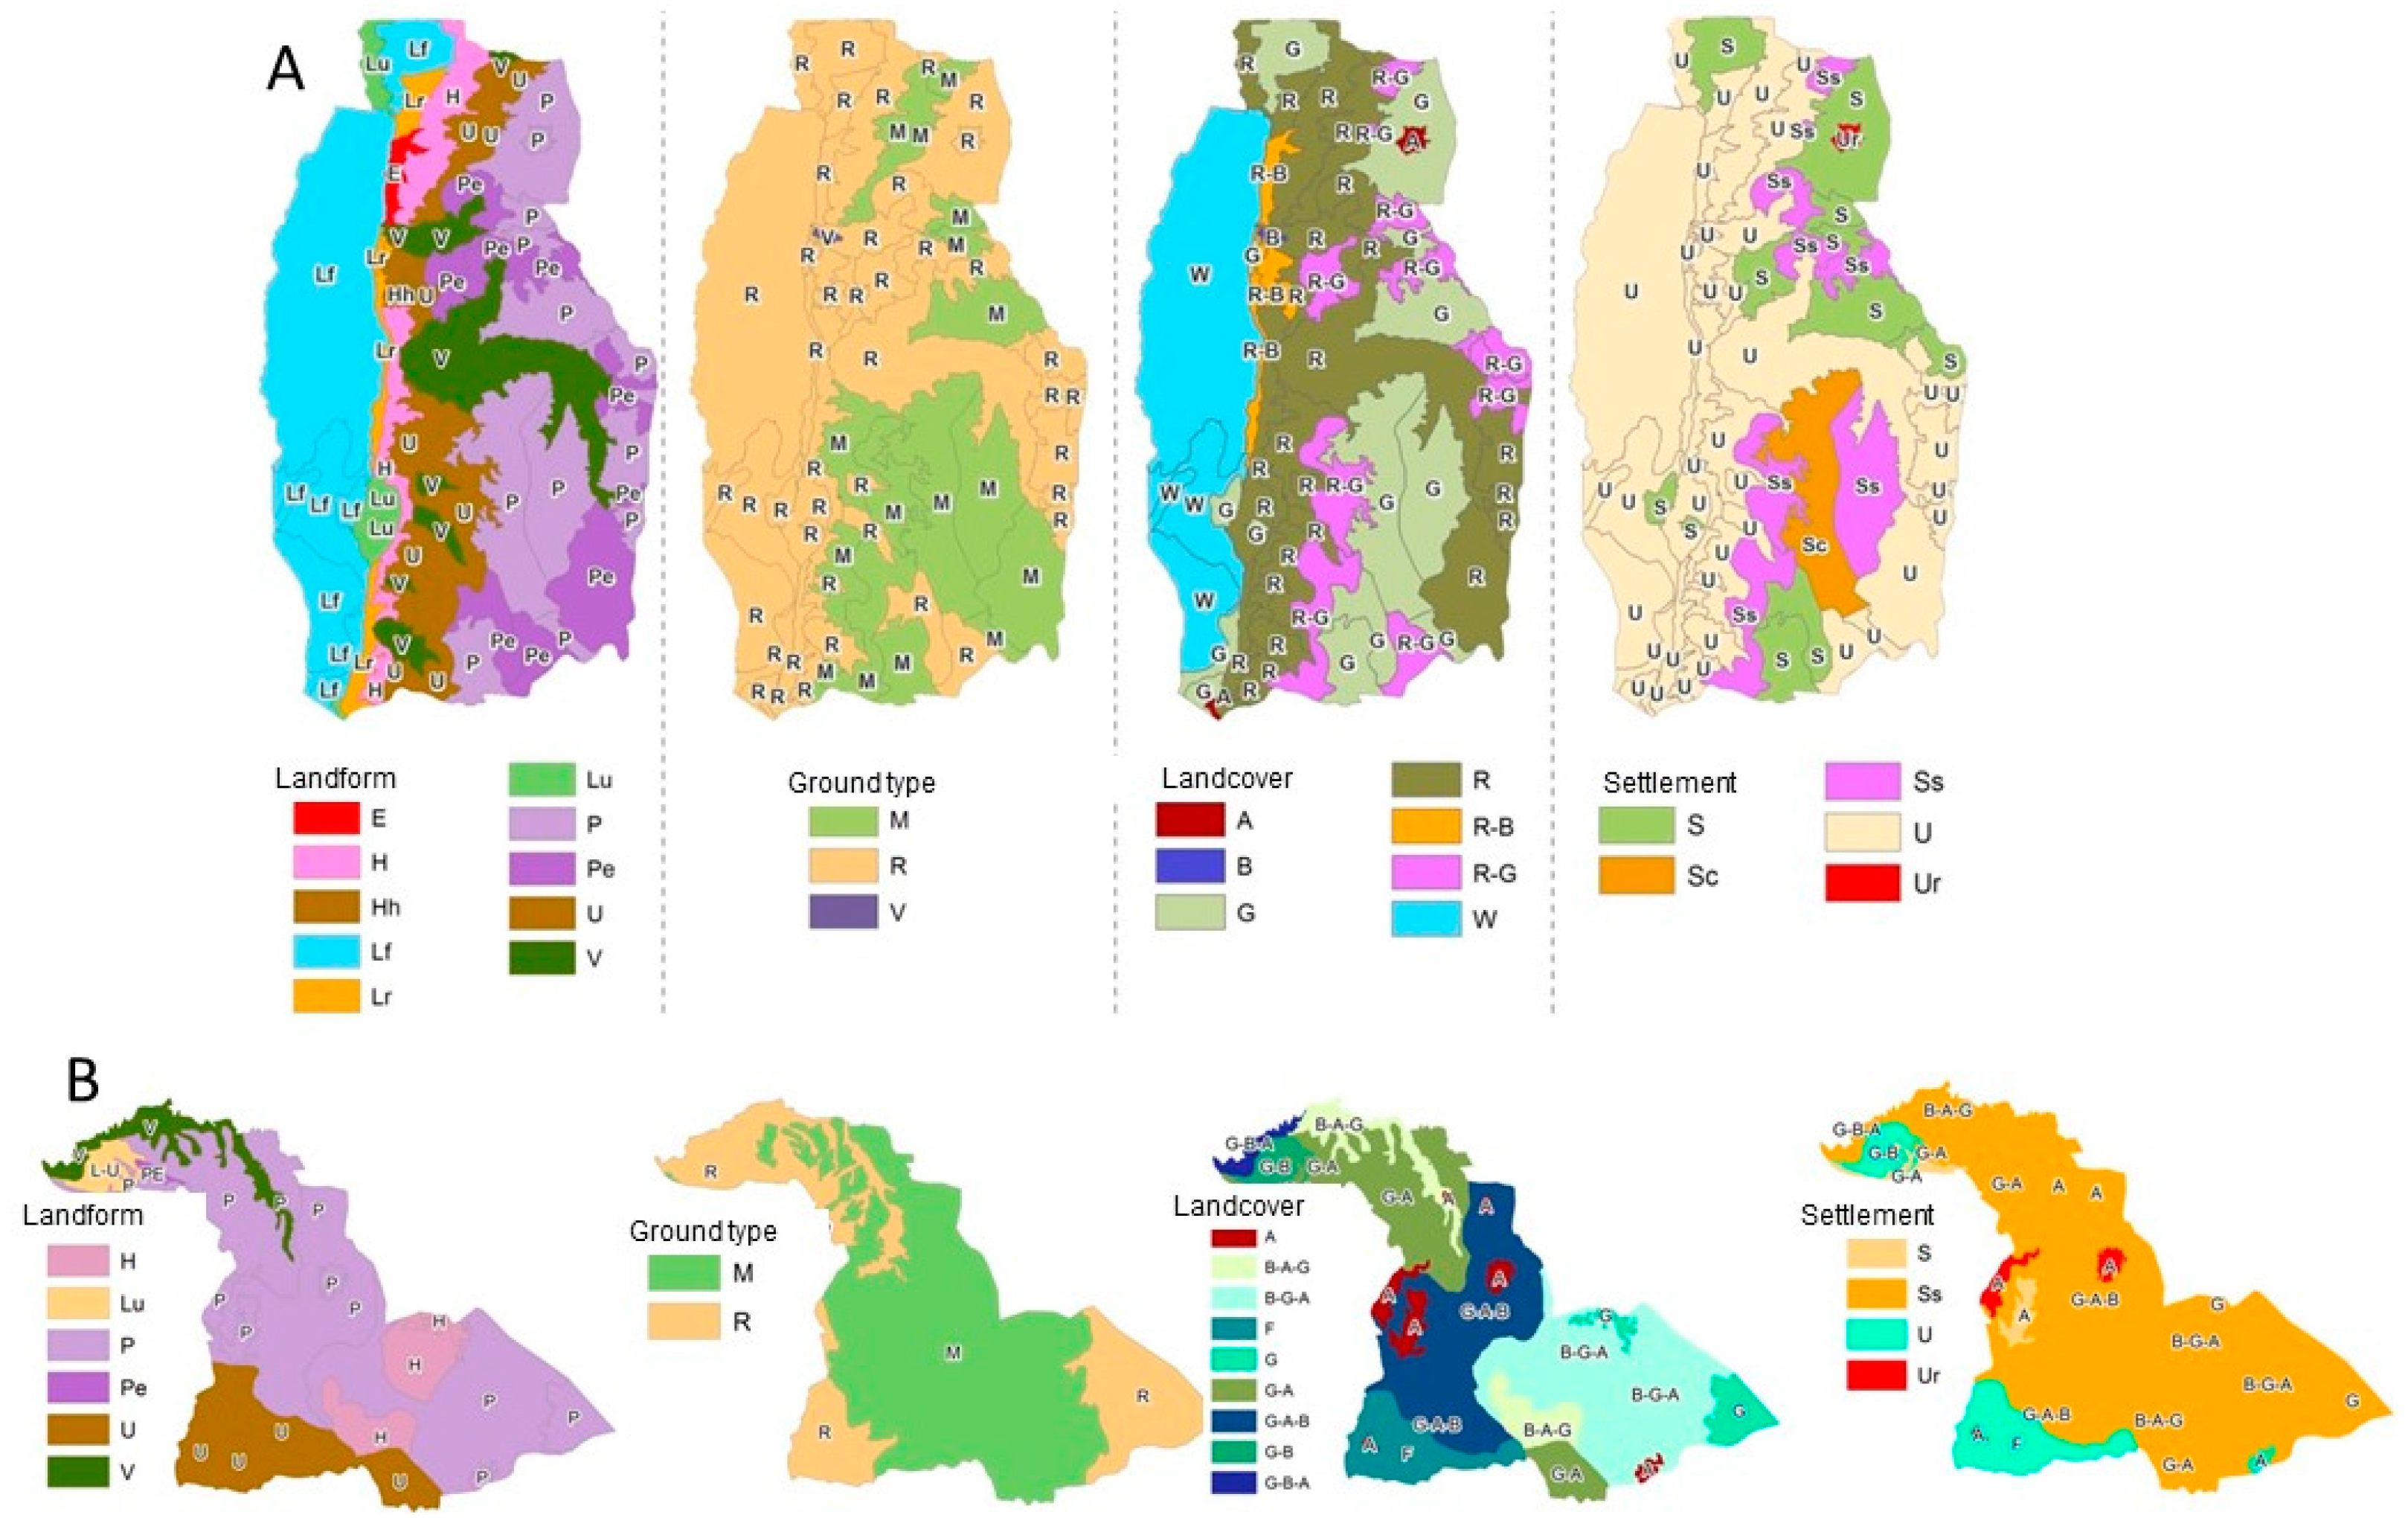
Step 1: Topographic analysis: the study area was divided into landform polygons representing similar physiography. Contour lines of Digital Elevation Model (DEM), of 30 m resolution, were used to identify similar landform units. A two digit code representing the landform was assigned to each polygon. Table 1 shows the landform types identified by the MEDSCAPES protocol, their description, and the number of units found of each class within the tested area.
Step 2: Ground type analysis: the landform polygons were subdivided according to the ground type. A code representing the ground type was assigned to each polygon in the attribute. The soil and geology layers were used to analyze ground type, and to decide whether the landform unit should be subdivided. Table 2 shows the ground types description and codes and the number of units found in each type.
Step 3: Land cover analysis: polygons resulting from the ground type analysis were again subdivided if land cover changed within each polygon. A code representing land cover was assigned to each polygon even if the units were not subdivided. Table 3 shows the land cover codes, the description, and the number of units found in each class.
Step 4: Settlement analysis: polygons resulting from land cover analysis were subdivided if the settlement pattern varied within each polygon. A field representing the settlement pattern was created, and the settlement pattern code was assigned to each polygon even if the polygon had a uniform settlement pattern and was not subdivided. Table 4 shows the settlement pattern codes, the description, and the number of units found in each class.
The two tested cases studies were divided accordingly into LDUs based on these four steps (Figure 3). However, the generated polygons that have an area less than the 5 km2 were dissolved into the largest ones. This was in order to have a considerable area of homogeneous land description units. These units were attributed by the mentioned land surface geo-data. Afterword, the shape file of homogeneous landscape character was converted to a special geo-data format that is called Keyhole Markup Language (KML) format, which is compatible with Google Earth Google Earth and has a great capacity to calibrate and validate the landscape character units (because of its ability to zoom and observe the units from different directions, and to recognize the urbanized area and determine the land use [21]). Field work campaigns of two weeks were done in order to validate desk-top mapping. GPS equipment of 5 m accuracy was used to determine field sites and field work sheets were filled to describe each LDU in order to have a detailed description for each unit. This detailed description includes topography, land cover, soil, and geological units. The modifications and then corrections of LDUs were done with the help of Google Earth (Figure 4) and field work, saved in KML format and then imported into the ArcGIS 10.2, and re-edited where necessary.
4. Results and Discussion
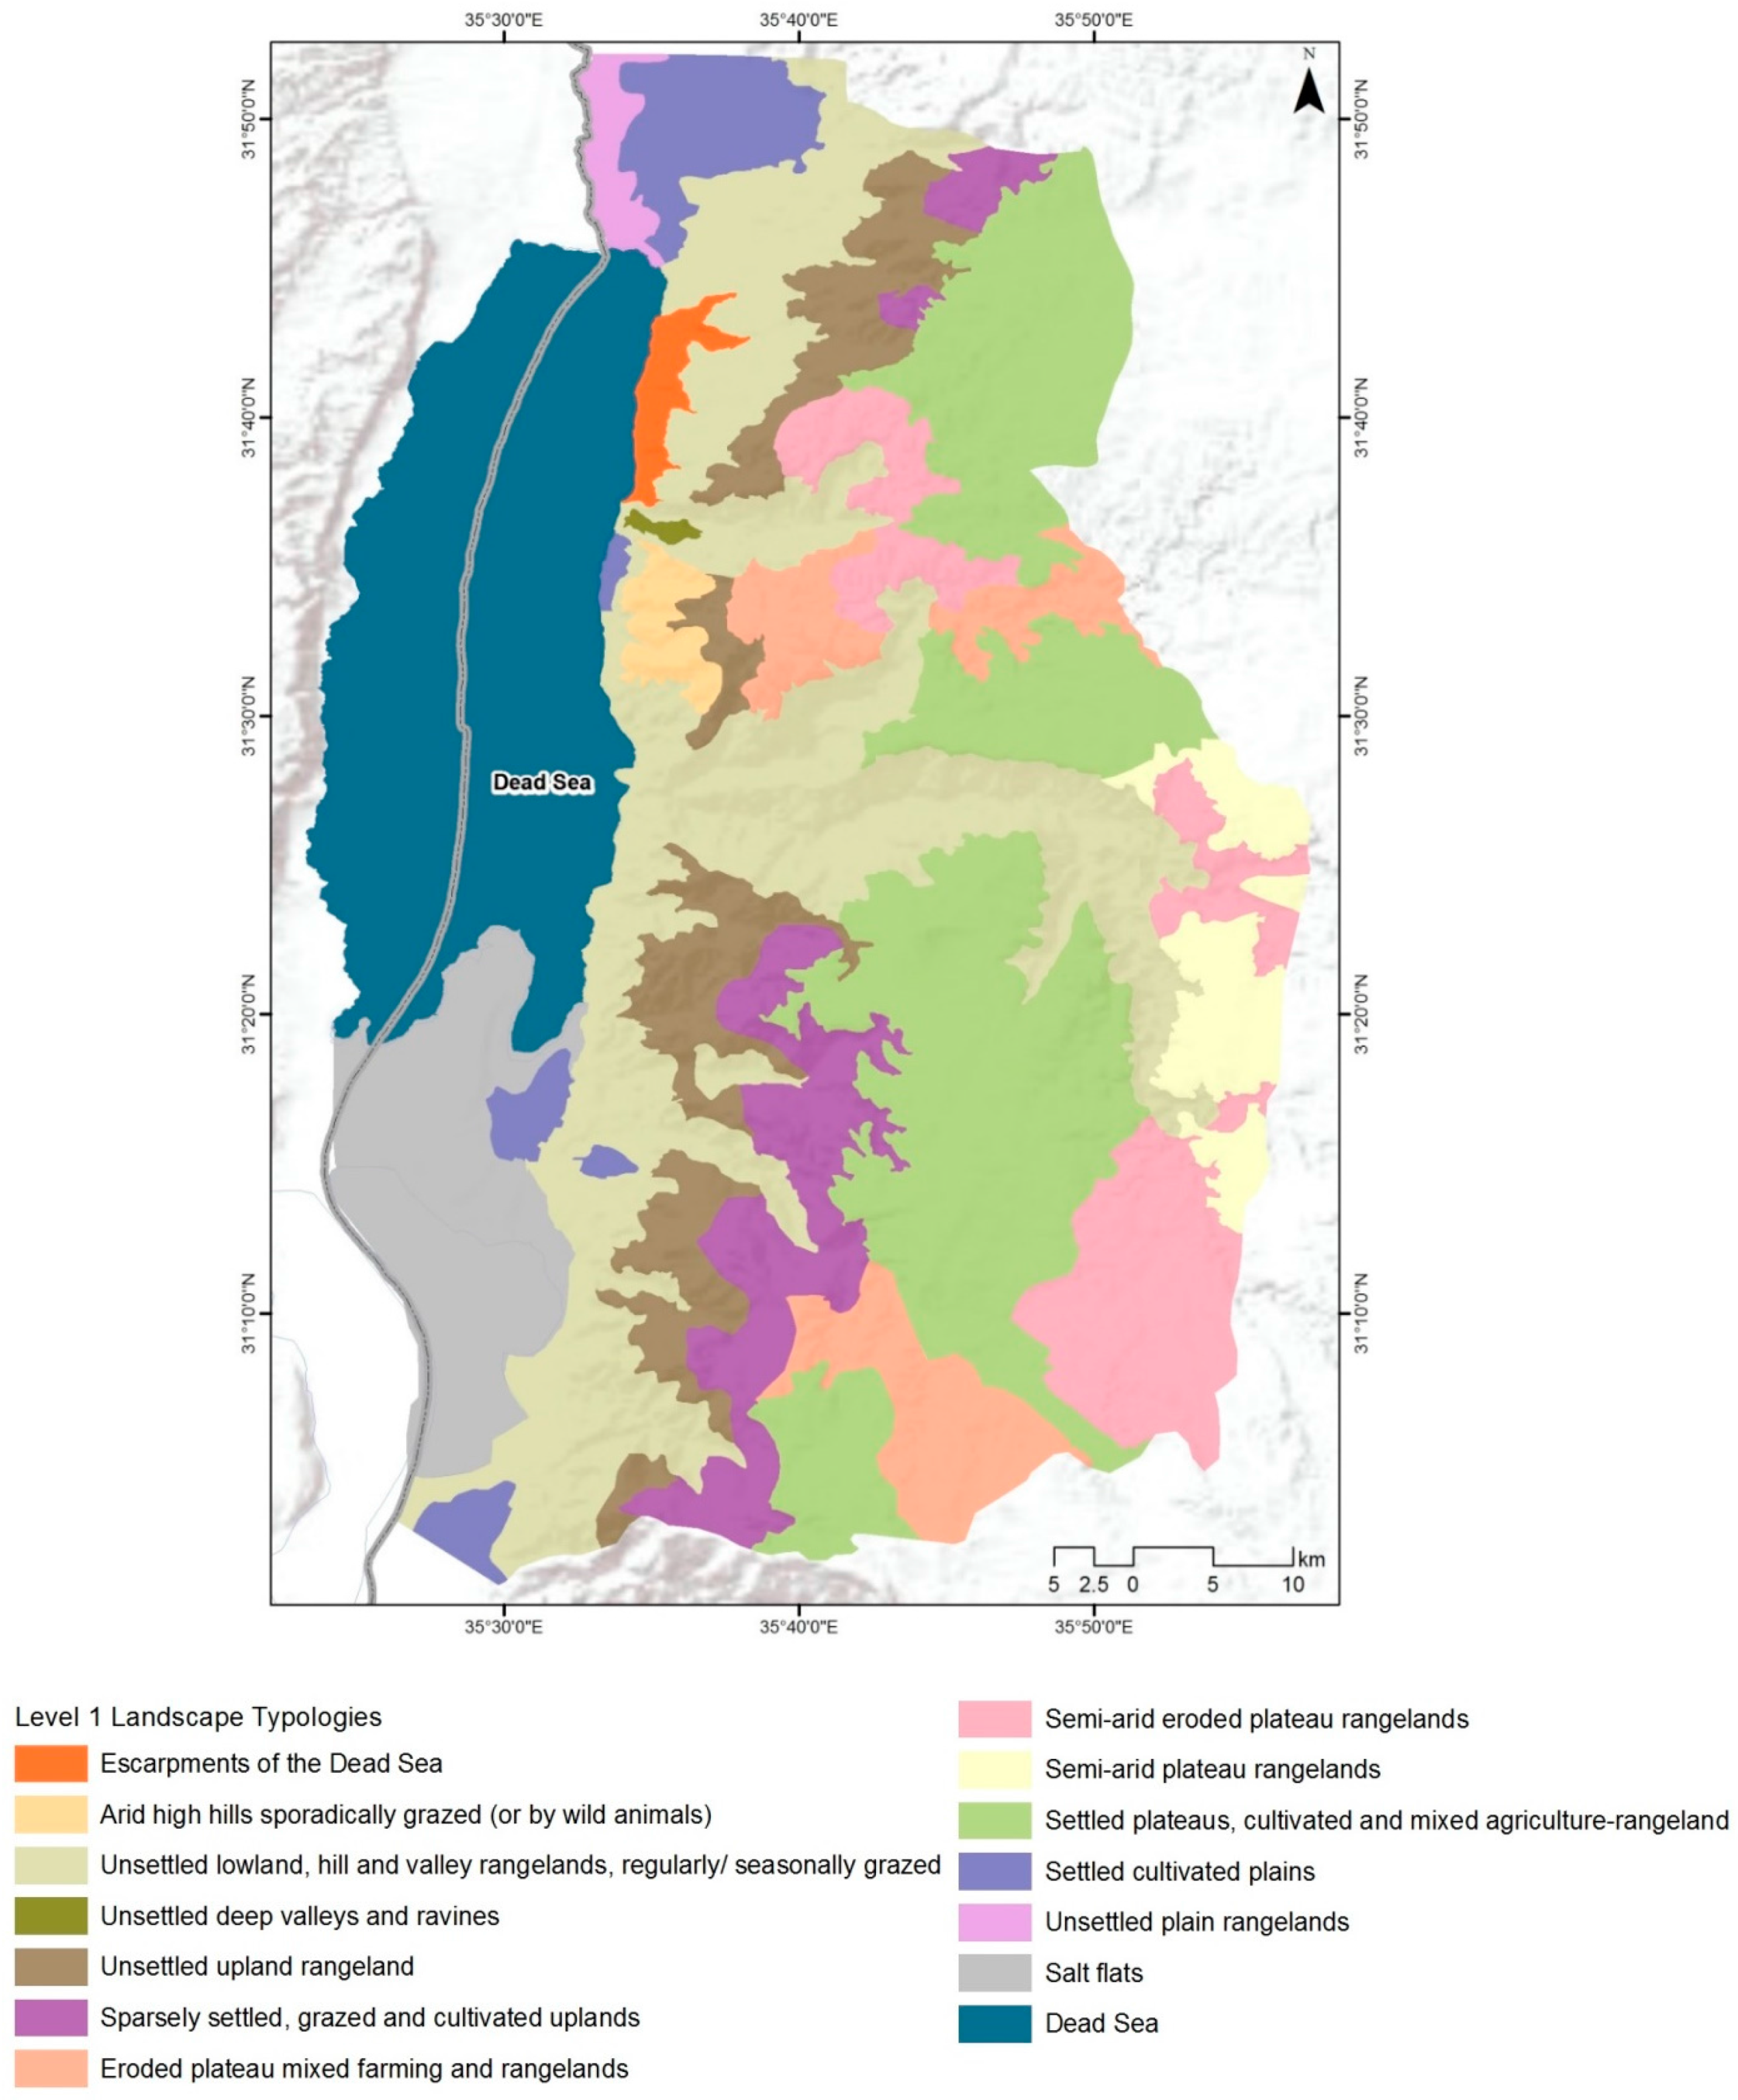
The study area of the Yarmouk River Basin was divided to 22 LDUs. Theses LDUs have an average area of about 63 Km2, with a minimum area of c.5 Km2 and a maximum area of c.372 Km2. However, since the study is a comparative one, these LDUs were categorized in typological order, according to the maximum differences between the LDUs, to reduce the LDUs number and ease the comparison. Accordingly, the number of the LDUs in the Yarmouk study area become 14 typological units that are presented in Figure 5. However, the LDUs of the Wadi Mujib study area were 66. Theses LDUs have an average area of about 68 Km2 with a minimum area of c.5 Km2 and a maximum of c.634 Km2. They were categorized to 14 typological too and are presented in Figure 6.
In the Yarmouk River basin, the landscape can be broadly classified into three distinct regions: the southern and eastern highlands (forested uplands, settled uplands, rangelands and cultivated hills, and cultivated uplands and arid hills); the central plateau (rangelands and cultivated plateau, settled plateau, eroded plateau, and settled and cultivated plateau); and the valley area itself (cultivated valley floor and river terraces, and valley rangelands). LDUs follow the geology of the drainage basin, with the Middle Cretaceous limestones exposed in the centre of the dome of the Ajloun area in the south, becoming younger at the margins of the dome. Thus, the northern part of the drainage basin shows progressively younger exposures in the centre of the drainage basin (the Wadi Sir Formation) and in the north (the Amman Silicified Limestone Unit, the Um Rijam Formation, and the Eocene basalt flows) [9]. In the Mujib area, the landscape units can also be broadly divided into the upland plateau areas (settled plateaus, cultivated and mixed agriculture rangeland, arid high hills, eroded plateau, mixed farming and rangelands, semi-arid plateau rangelands, unsettled upland rangeland, semi-arid eroded plateau rangelands), the landscapes seen on descent into the Dead Sea (unsettled lowland, sparsely settled grazed and cultivated uplands, hill and valley rangelands, eroded plateau, mixed farming and rangelands), and the rift valley floor area.
There are several factors that control the type, area, and distributions of the landscape units such as climatic conditions, land cover, land use, soil types, and outcropped rocks units [18,22]. All of these factors are controlled by topography, especially when there is a high relief topography such as in the two case studies that we studied. For instance, the elevations in the topographical units control the climatic parameter of temperature degrees and the rainfall yearly quantity [23]. Plant cover types and distribution are affected by rainfall regimes and temperature [24,25]. Furthermore, landforms that are generated by topography are one the main factors that control the soil texture types, as well as the occurrence of outcropping rocks [18,26].
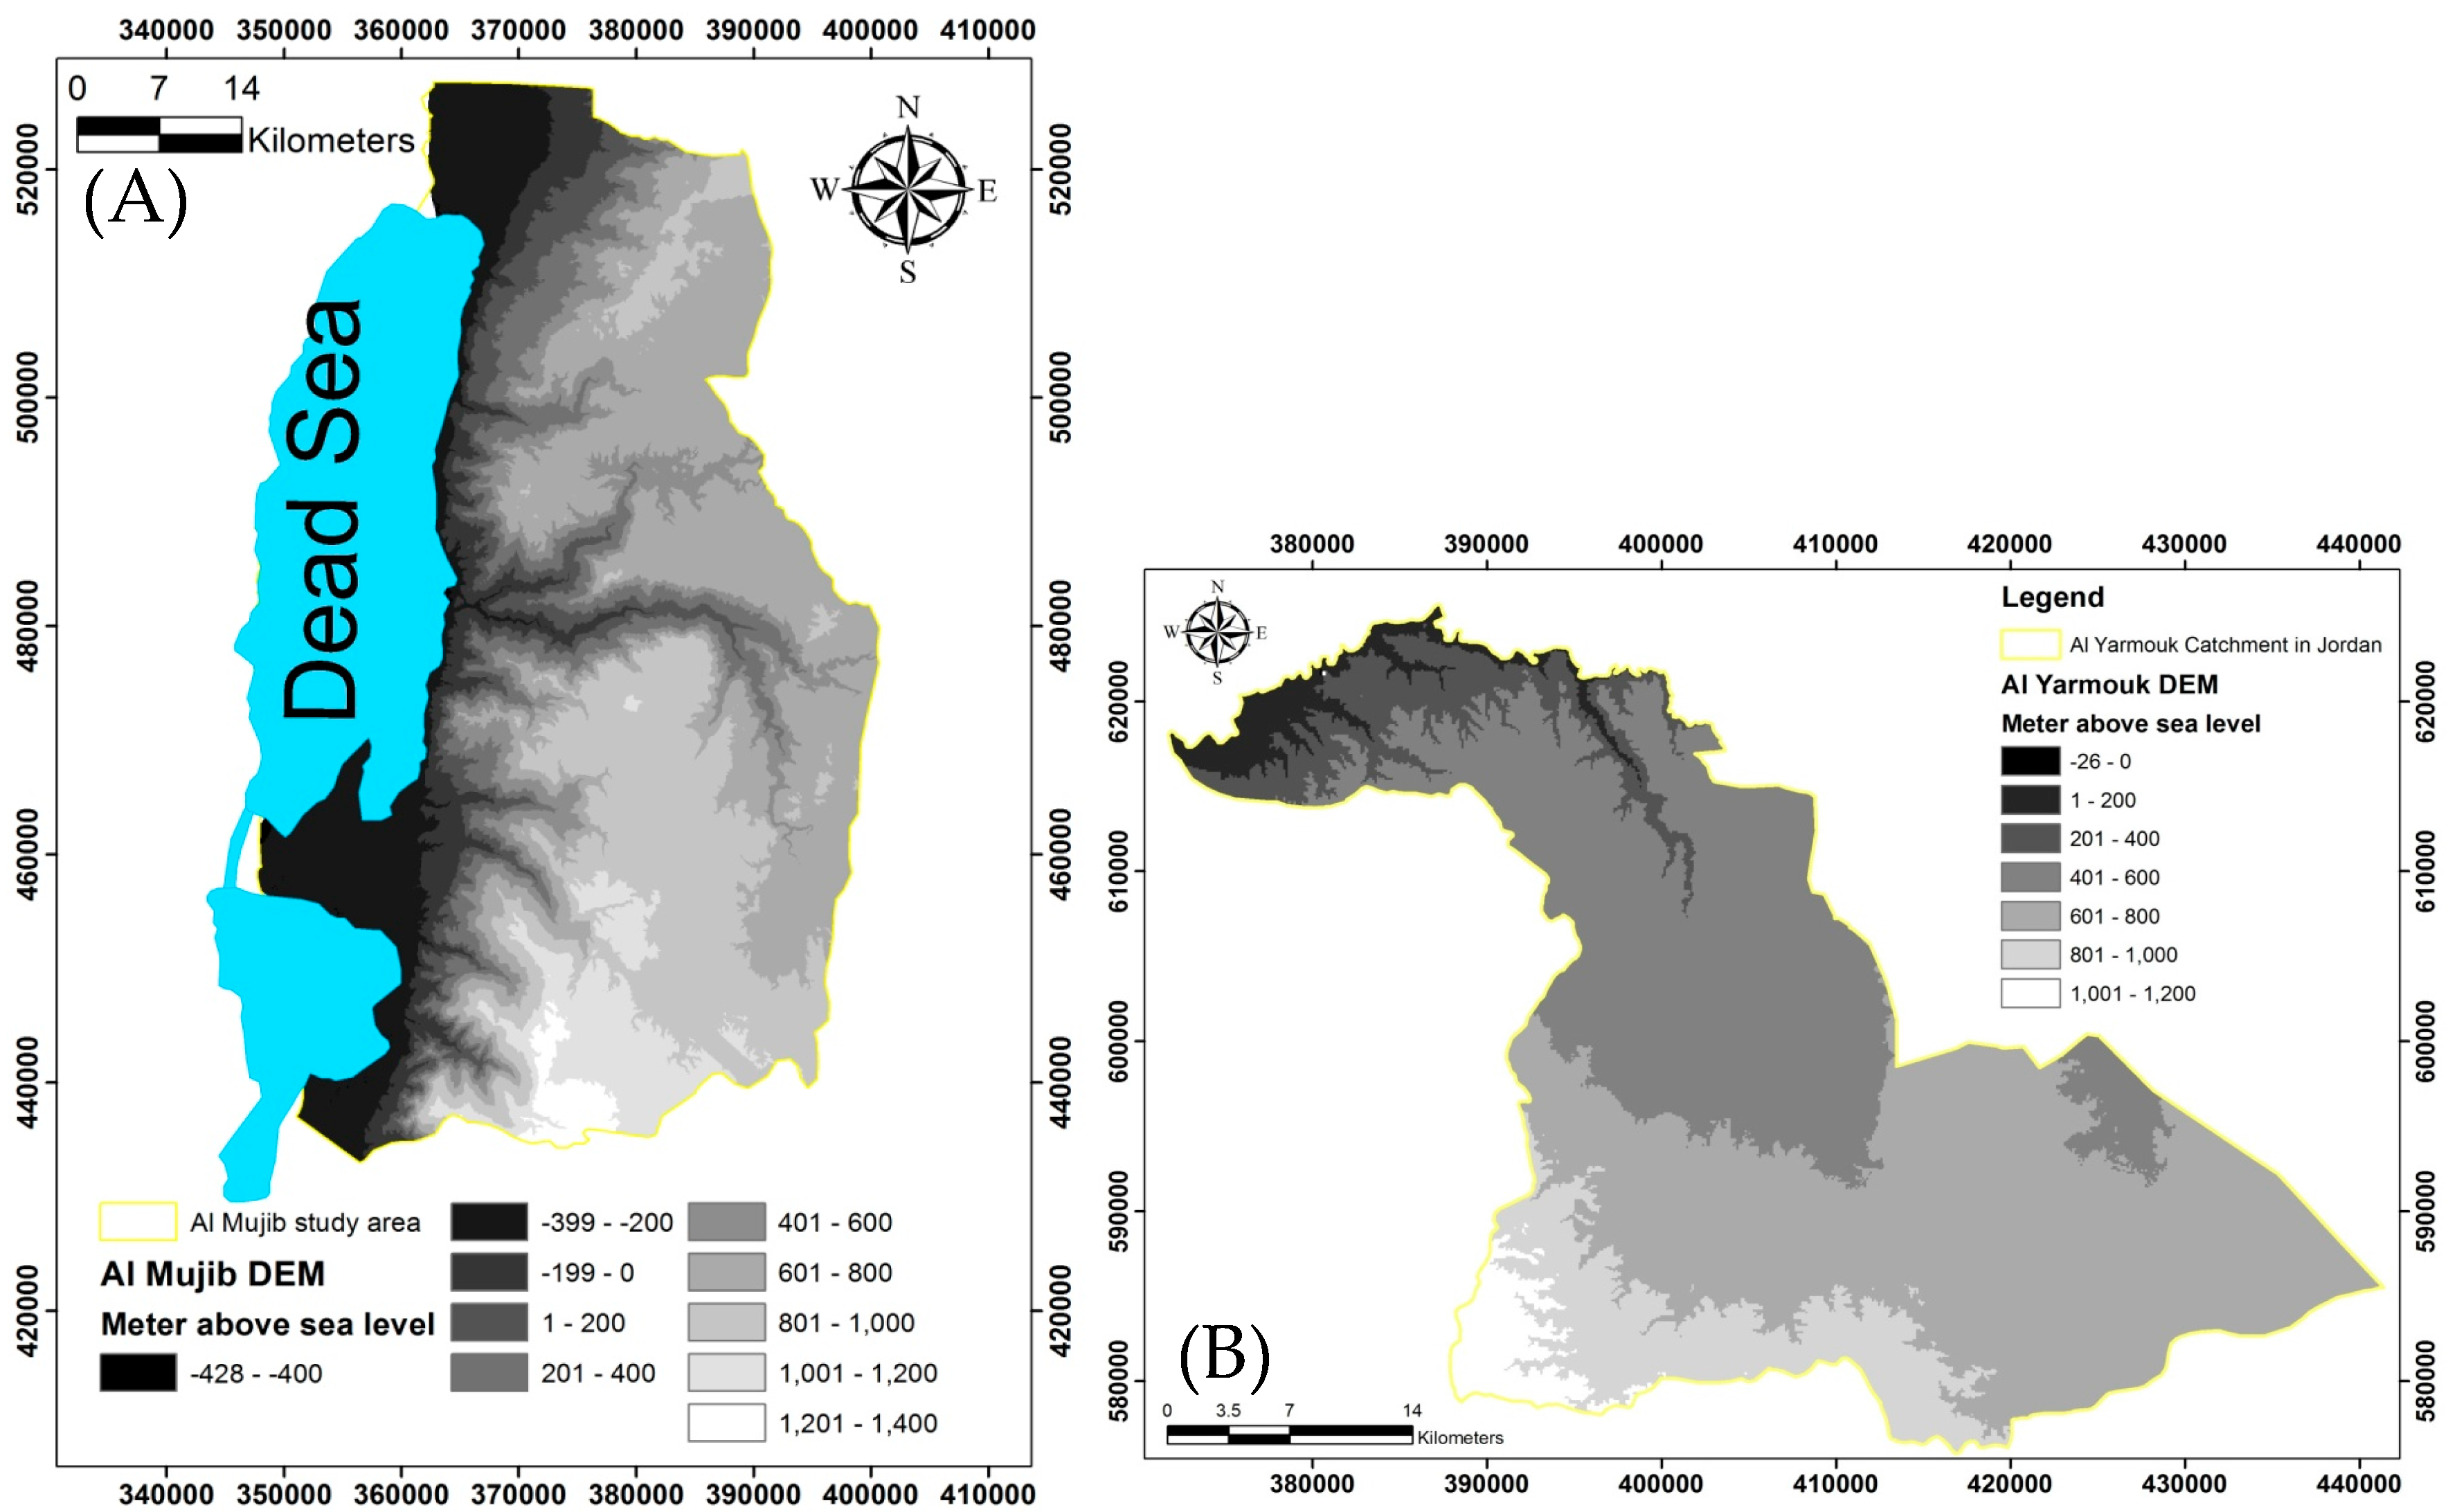
The Wadi Mujib study area is located within a regional tectonic area that has conservative plate movement through the Dead Sea Rift [9]. These tectonic movements created different local faults within the Mujib study area. These faults are the main reasons for the high relief topography of the Wadi Al Mujib study area. The elevations of the Wadi Mujib study area vary from 420 m below sea level to about 1400 m above sea level [9,12,27]. The effect of the Dead Sea transform fault in the Yarmouk study area is less than the Al Mujib study area because it extends farther away from it [28]. Therefore, the Yarmouk area has lower relief topography than the Wadi Mujib study area. The elevation of the Yarmouk area varies from 26 below the sea level to 1200 m above the sea level.
Faults as an underline structure are one reason that generates the topographical units of any landscape [28]. However, the local faults (strike slip faults, mainly) of the Wadi Mujib study area bonded the plateau landform in several sites such as Wadi Mujib and Wadi Zerka Ma’in [12]. However, erosion occurs through these faults during the winter by overland flow and flash floods [11,24]. Hence, the largest landscape typological unit in the Wadi Mujib study area is the eroded plateau. However, comparable to the Wadi Al Yarmouk study area, this landscape typological unit is limited since the Wadi Yarmouk study area has fewer faults as a result of not being within the Dead Sea transform fault [27].
The largest landscape typological unit in the Yarmouk study area is the rangeland and the cultivated plateau. The plateau was originally a flat topographical unit [28]. However, the flat area has a horizontal slope, and this would reduce soil erosion; hence, this unit has a considerable thickness of soil of about 6 m, more than the other landscape typological units, and is enriched by agricultural cultivation and rangeland use [18].
The Yarmouk study area is nearer to the Mediterranean Sea, and therefore this study area is more affected by the Mediterranean climatic conditions than the Wadi Mujib study area, which is characterized by arid and semi-arid climatic conditions, mostly [11,13]. Therefore, the Wadi Yarmouk study area receives rainfall quantity more than the Wadi Mujib study area [27]. However, the uplands in the Yarmouk study area has ecosystems in the form of forested upland, which is common for upland in the Mediterranean climatic zone, while the upland and the Plateau area in the Wadi Mujib study area are mostly range lands, which common for arid and semi-arid regions [23].
The water resources are mainly in the form of groundwater in both of the cases studies [13,27]. However, the groundwater level in the Wadi Yarmouk study area is higher than the groundwater level of the Wadi Mujib study area because of the higher groundwater recharge availability during the winter season [29]. The suitable Mediterranean climatic conditions, and water resource availability have caused the Wadi Yarmouk study area to become settled and urbanized more than the Wadi Mujib study area.
In the Wadi Mujib study area, the rapid decrease of the Dead Sea level (1 m per year) during the last 50 years generated the Dead Sea escarpment typological unit that has sinkholes as a result of that decrease, while the mining of potash generated the salt flat typological unit. These two typological landscape units are associated with the Dead Sea [30].
Spatial planning in these and other areas of Jordan has tended to ignore or underestimate the importance of geological hazards. This may be understandable, given that geologists are typically not involved in the planning process. However, the adoption LCA as a planning tool is an important opportunity to avert some of the problems that have occurred in the past. In looking at the LCA maps produced for the Yarmouk and Mujib areas, the various lowland designations are within or near the bottom of the Dead Sea Rift system or one of the tributaries. The valley floor sediments in these areas tend to be unconsolidated alluvium, which suggests that these areas, while suitable for agriculture, could be problematic for building due to problems such as salinity, difficult foundation design, and seismic amplification. In some areas, particularly near the margins, flooding may be an issue as well. Therefore, the designations of valley rangelands, cultivated valley floors, and river terraces are rangelands that need to be marked for these issues in the Yarmouk area. Similarly, the salt flats, the settled cultivated plains, and unsettled lowlands in the Mujib area should be watched for the same issues. In addition, the salt flats have serious problems with subsidence associated with the fall of the Dead Sea water level [31].
Hills, high hills, and uplands pose different issues. In particular, relief in these areas results in issues such as soil loss. The arid hills and the forested uplands of the Yarmouk area fall within this physiographic area. The forested uplands here are a major recharge area for the groundwater through the entire basin [29], because of the high levels of rainfall there. The arid high hills of the Mujib and Yarmouk areas also fall within this category, and tend to be over-grazed due to the lack of interest in agriculture or soil conservation in these areas.
The plateau and eroded plateau areas are also important recharge areas [32], occurring mainly in the Yarmouk basin. Thus, planning should take into consideration groundwater resource maintenance. Moreover, in areas where the bedrock is limestone such the Yarmouk basin, karstification can be an issue. Although karst provides for the availability of good aquifers, these are susceptible to pollution because contaminants move easily within them. Moreover, sinkholes, a typical karst feature, may present an obstacle for land-use planning. For example, in the city of Karak, an entire new neighbourhood known as Marj has grown to the east of the city. This neighbourhood suffers from unstable foundations and many buildings have had to be abandoned because they have been deemed unsafe. In addition, these tend to be areas where there are thick soils that are used for dryland agriculture. On the other hand, these areas tend to host major cities in the two areas (Irbid and Ramtha in Yarouk and Madaba in Mujib). Thus, urban expansion has led to the loss of prime agricultural land and the loss of recharge zones in both areas, creating the settled plateau areas in the Yarmouk and Mujib basins.
5. Conclusion and Recommendations
Landscape types demonstrate the strong influence of the topography, which is generated mainly by the underlying geological structures. This control is reflected in the spatial distributions of landforms, climatic zones, water resources, and plant cover. An optimized spatial plan must have a landscape character assessment and a landscape units map in order to investigate the optimized sites for water, environmental, and industrial projects. Moreover, landscape types play a crucial role in increasing understanding of the distributions, and therefore in supporting biodiversity. And should be also taken into consideration when planning for nature conservation.
In Jordan, we found that the Wadi Mujib study area must have more projects that carry out a sustainable water resources management, while in the Wadi Yarmouk study area we found that it must be a land policy that stops the occupation of the agricultural land by the urbanized area.
Based on the application of LCA, the following can be recommended for improved spatial planning in the two tested areas:
5.1. In the Wadi Mujib study area:
(1) There must be a land policy that restricts any further development in the landscape type of the Dead Sea escarpment, since it is a unit of sinkholes where constructions run a subsidence risk.
(2) There must be a strategy that encourages artificial groundwater recharge and water harvesting on the eroded plateau unit to improve the water resources and agricultural activities there.
5.2. In the Wadi Yarmouk study area:
(1) There must be a land policy that controls urban expansion from extending onto the settled plateau landscape unit and the cultivated and rangelands plateau unit. Otherwise, the area of the agricultural activity would decrease considerably. However, this would also decrease the groundwater recharge, since the runoff would be increased.
(2) The forested upland unit must be considered as a conservation area and protected from any construction or industrial activity. This unit is rarely found in Jordan and includes different ecosystems.
The study demonstrated, in both cases, that groundwater protection, slope stability, sinkhole avoidance, flood control, and the protection of agricultural land would highly benefit from the insight generated by the LDUs and the LCA process and, in particular, the role of geology. Further research must be carried out in order to evaluate the planning improvement sections in Jordan precisely, and to evaluate other possible factors in addition to geology.
Acknowledgments
This study was part of the MEDSCAPES project funded by the ENPI-CBCMED programme. We are thankful to the former director of Environmental Study Centre of Terra Cypria Mr. Nicholas Symons for his help to do this research. We thank two anonymous reviewers whose comments and suggestions helped to improve the manuscript.
Author Contributions
All authors contributed and approved final manuscript before submission.
Conflicts of Interest
The authors declare no conflict of interest.
References
- Abu-Jaber, N. Jordan and the Environmental Challenge (الاردن و التحدي البيئي); Dar Al Shorouk publishers, Amman, with support from the Ministry of Culture: Amman, Jordan, 2010; p. 216. (In Arabic) [Google Scholar]
- Potter, R.B.; Darmame, K.; Barham, N.; Nortcliff, S. “Ever-growing Amman”, Jordan: Urban expansion, social polarisation and contemporary urban planning issues. Habitat Int. 2009, 33, 81–92. [Google Scholar] [CrossRef]
- Al-Eisawi, D. Vegetation of Jordan; UNESCO- Regional Office for Science and Technology for the Arab States: Cairo, Egypt, 1996. [Google Scholar]
- Beauregard, R.A.; Marpillero-Colomina, A. More than a master plan: Amman 2025. Cities 2011, 28, 62–69. [Google Scholar] [CrossRef]
- Department of Statistics. Statistical Yearbook; Government publication: Amman, Jordan, 2014; Chapter 5; p. 200.
- Tarabieh, S. Sustainable Spatial Planning Constraints in Al-me’raad Watershed, Jordan. Unpublished M.Sc. Thesis, German Jordanian University, Amman, Jordan, 2015. [Google Scholar]
- Abu-Jaber, N.; Abunnasr, Y.; Yahya, A.A.; Boulad, N.; Christou, O.; Dimitropoulos, G.; Gkoltsiou, K.; Khreis, N.; Manolaki, P.; Michael, K.; et al. Travelling in the eastern Mediterranean with landscape character assessment. In Proceedings of the Third International Conference on Remote Sensing and Geoinformation of the Environment, Paphos, Cyprus, 16–19 March 2015. [Google Scholar]
- Perdew, L. Understanding Jordan Today; Mitchell Lane Publishers, Inc.: Newark, DE, USA, 2014; pp. 17–18. [Google Scholar]
- Bender, F. Geology of Jordan. Contribution of the Regional Geology of the Earth; Borntraeger: Berlin, Germany, 1974; p. 196. [Google Scholar]
- Moshrik, H.R.; Abu-Allaban, M.; Al-Shayeb, A. Climate change in Jordan: A comprehensive examination approach. Am. J. Environ. Sci. 2009, 5, 58–68. [Google Scholar]
- Odeh, T.; Rödiger, T.; Geyer, S.; Schirmer, M. Hydrological modelling of a heterogeneous catchment using an integrated approach of remote sensing, a geographic information system and hydrologic response units: The case study of Wadi Zerka Ma’in catchment area, north east of the Dead Sea. Environ. Earth Sci. 2014, 73, 3309–3326. [Google Scholar] [CrossRef]
- Odeh, T.; Gloaguen, R.; Schirmer, M.; Geyer, S.; Rödiger, T.; Siebert, C. Investigation of catchment areas migrations through a sinstral and dextral strike slip faults: The case study of Zerka Ma’in and Al Hasa catchment areas, East of the Dead Sea in Jordan. In Proceedings of the 4 ASME/WSEAS International conference on geology and Seismology (GES’10), Cambridge, UK, 23–25 February 2010; pp. 120–126. [Google Scholar]
- Salameh, E.; Bannayan, H. Water Resources of Jordan—Present Status and Future Potentials; Friedrich Ebert Stiftung: Amman, Jordan, 1993. [Google Scholar]
- Abu-Jaber, N.S.; Kimberley, M.M.; Cavaroc, V.V. Mesozoic-Palaeogene basin development within the Eastern Mediterranean borderland. J. Petrol. Geol. 1989, 4, 419–436. [Google Scholar] [CrossRef]
- Dunne, T. Evaluation of Erosion Conditions and Trends; FAO Conservation Guide: Rome, Italy, 1977; pp. 53–83. [Google Scholar]
- Kam, T. Integrating GIS and remote sensing techniques for urban land-cover and landuse analysis. Geocarto Int. 1995, 10, 39–49. [Google Scholar]
- Swanwick, C.; Land Use Consultants 2002. Landscape Character Assessment: Guidance for England and Scotland; The Countryside Agency/Edinburgh; Scottish Natural Heritage: Cheltenham, UK, 2002. [Google Scholar]
- Zube, E.; Sell, J.; Taylor, J. Landscape perception: Research, application and theory. Landsc. Plan. 1982, 9, 1–33. [Google Scholar] [CrossRef]
- Chou, Y. Exploring Spatial Analysis in GIS; Onword Press: New York, NY, USA, 1997; p. 500. [Google Scholar]
- Brabyn, K. Solutions for characterizing natural landscapes using Geographical Information Systems. J. Environ. Manag. 2005, 76, 23–34. [Google Scholar] [CrossRef] [PubMed]
- Dodsworth, E.; Nicholson, A. Academic Uses of Google Earth and Google Maps in a Library Setting. Inf. Technol. Libr. 2012, 31, 32–36. [Google Scholar] [CrossRef]
- Giles, R.; Trani, M. Key elements of landscape pattern measures. Environ. Manag. 1999, 23, 477–481. [Google Scholar]
- Kepner, W.; Watts, C.; Edmonds, C. A landscape approach for detecting and evaluating change in a semi-arid environment. Environ. Monit. Assess. 2002, 64, 179–195. [Google Scholar] [CrossRef]
- Gustafson, E. Quantifying landscape spatial pattern: What is the state-of-the-art? Ecosystems 1998, 1, 143–156. [Google Scholar] [CrossRef]
- Ferguson, B. Landscape hydrology. J. Environ. Syst. 1991, 21, 193–206. [Google Scholar] [CrossRef]
- Lausch, A.; Herzog, F. Applicability of landscape metrics for the monitoring of landscape change: Issues of scale, resolution and interpretability. Ecol. Indic. 2002, 2, 3–15. [Google Scholar] [CrossRef]
- Horowitz, A. The Jordan Rift Valley; Ballkema: Rotterdam, The Netherlands, 2001; p. 730. [Google Scholar]
- Keller, E.A.; Pinter, N. Active Tectonics: Earthquakes and Landscape; Prentice-Hall: Upper Saddle River, NJ, USA, 2002; p. 362. [Google Scholar]
- Abu-Jaber, N.; Kharabsheh, A. Ground water origin and movement in the upper Yarmouk Basin, Northern Jordan. Environ. Geol. 2008, 54, 1355–1365. [Google Scholar] [CrossRef]
- Niemi, T.; Ben-Avraham, Z. The Dead Sea: The Lake and Its Setting Monographs on Geology 442 and Geophysics Press 36; Oxford University: New York, NY, USA, 1997; pp. 326–336. [Google Scholar]
- Closson, D.; Karaki, N.A.; Klinger, Y.; Hussein, M.J. Subsidence and sinkhole hazard assessment in the southern Dead Sea area, Jordan. Pure Appl. Geophys. 2005, 162, 221–248. [Google Scholar] [CrossRef]
- Al Qudah, K.; Abu-Jaber, N.; Jaradat, R.; Awawdeh, M. Artificial rainfall tests, soil moisture profiles and geoelectrical investigations for the estimation of recharge rates in a semi-arid area (Jordanian Yarmouk River Basin). Environ. Earth Sci. 2015, 73, 6677–6689. [Google Scholar] [CrossRef]
Figure 1.
Location of the studied areas. The Wadi Yarmouk study area in the north-west of Jordan which has historical sites, a large area of agricultural activities, and an urbanized area. The Wadi Mujib study area in the Middle West of Jordan which has tourism investments and a beach at the Dead Sea. The names of Yarmouk and Mujib are written with letters (Al) in some references.

Figure 2.
The high relief topography of the studied areas. (A) is the Mujib study area where the topography of the study area is effected mainly by the faults of the Dead Sea transform fault (a regional fault). (B) is the Yarmouk study area where the topography has effected mainly rock erosion, especially the sinkholes of limestone rocks.

Figure 3.
Land characterization based on landform, ground type, land cover, and settlement pattern. (A) is for the Wadi Mujib case study and (B) is for the Wadi Yarmouk case study. The meanings of letters are defined in the tables.
Figure 3.
Land characterization based on landform, ground type, land cover, and settlement pattern. (A) is for the Wadi Mujib case study and (B) is for the Wadi Yarmouk case study. The meanings of letters are defined in the tables.

Figure 4.
Google Earth image for the Yarmouk study area. The yellow line represents the border of LDUs and the green balloons represent the field work sites where we did the calibration for LDUs. The same method was used to calibrate the LDUs of the Wadi Mujib study area.
Figure 4.
Google Earth image for the Yarmouk study area. The yellow line represents the border of LDUs and the green balloons represent the field work sites where we did the calibration for LDUs. The same method was used to calibrate the LDUs of the Wadi Mujib study area.
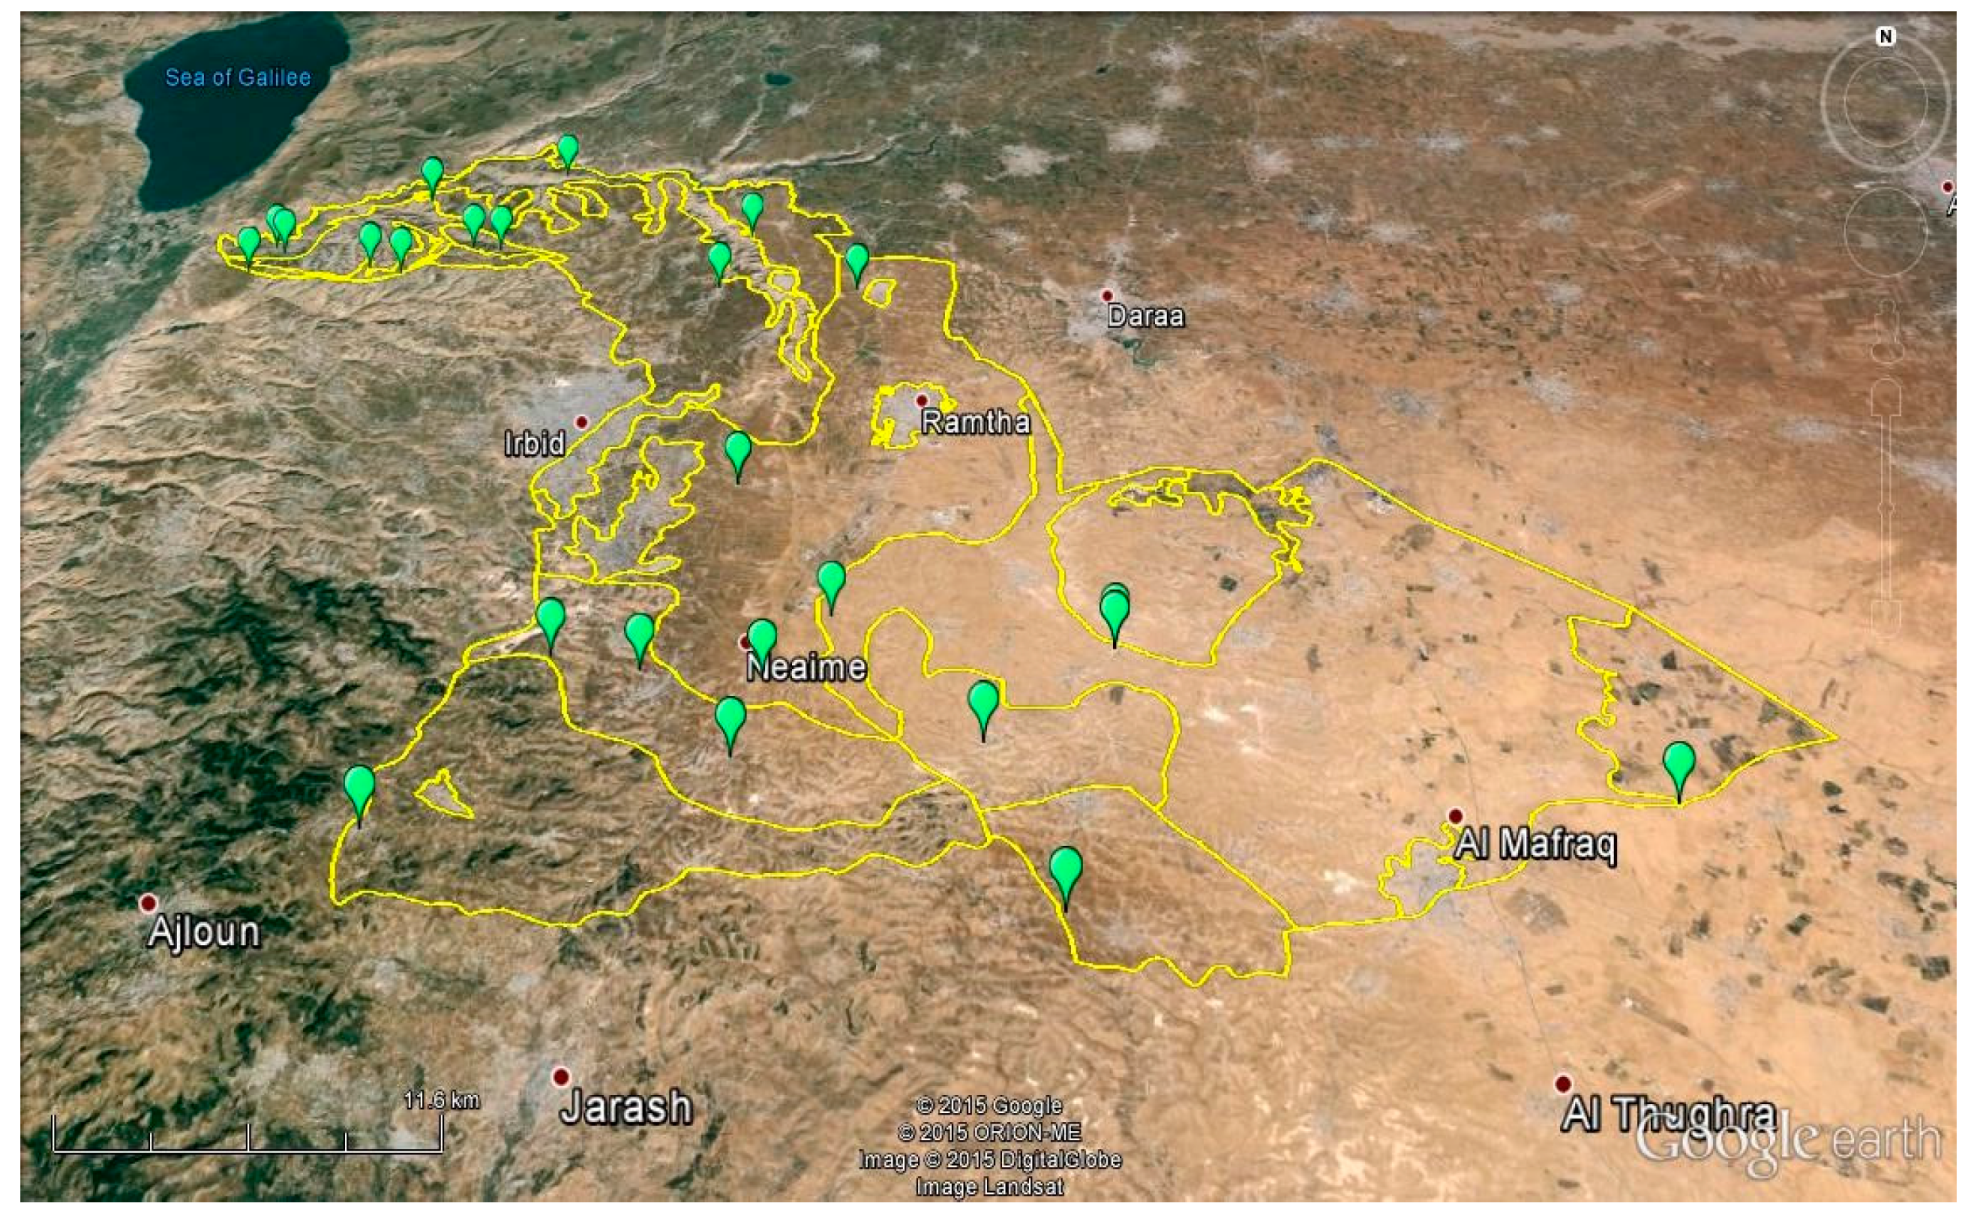
Figure 5.
The 14 Typological units in the study area of Wadi Yarmouk. The numbers of units are increased in the north-west direction as a result of the topographical control.
Figure 5.
The 14 Typological units in the study area of Wadi Yarmouk. The numbers of units are increased in the north-west direction as a result of the topographical control.
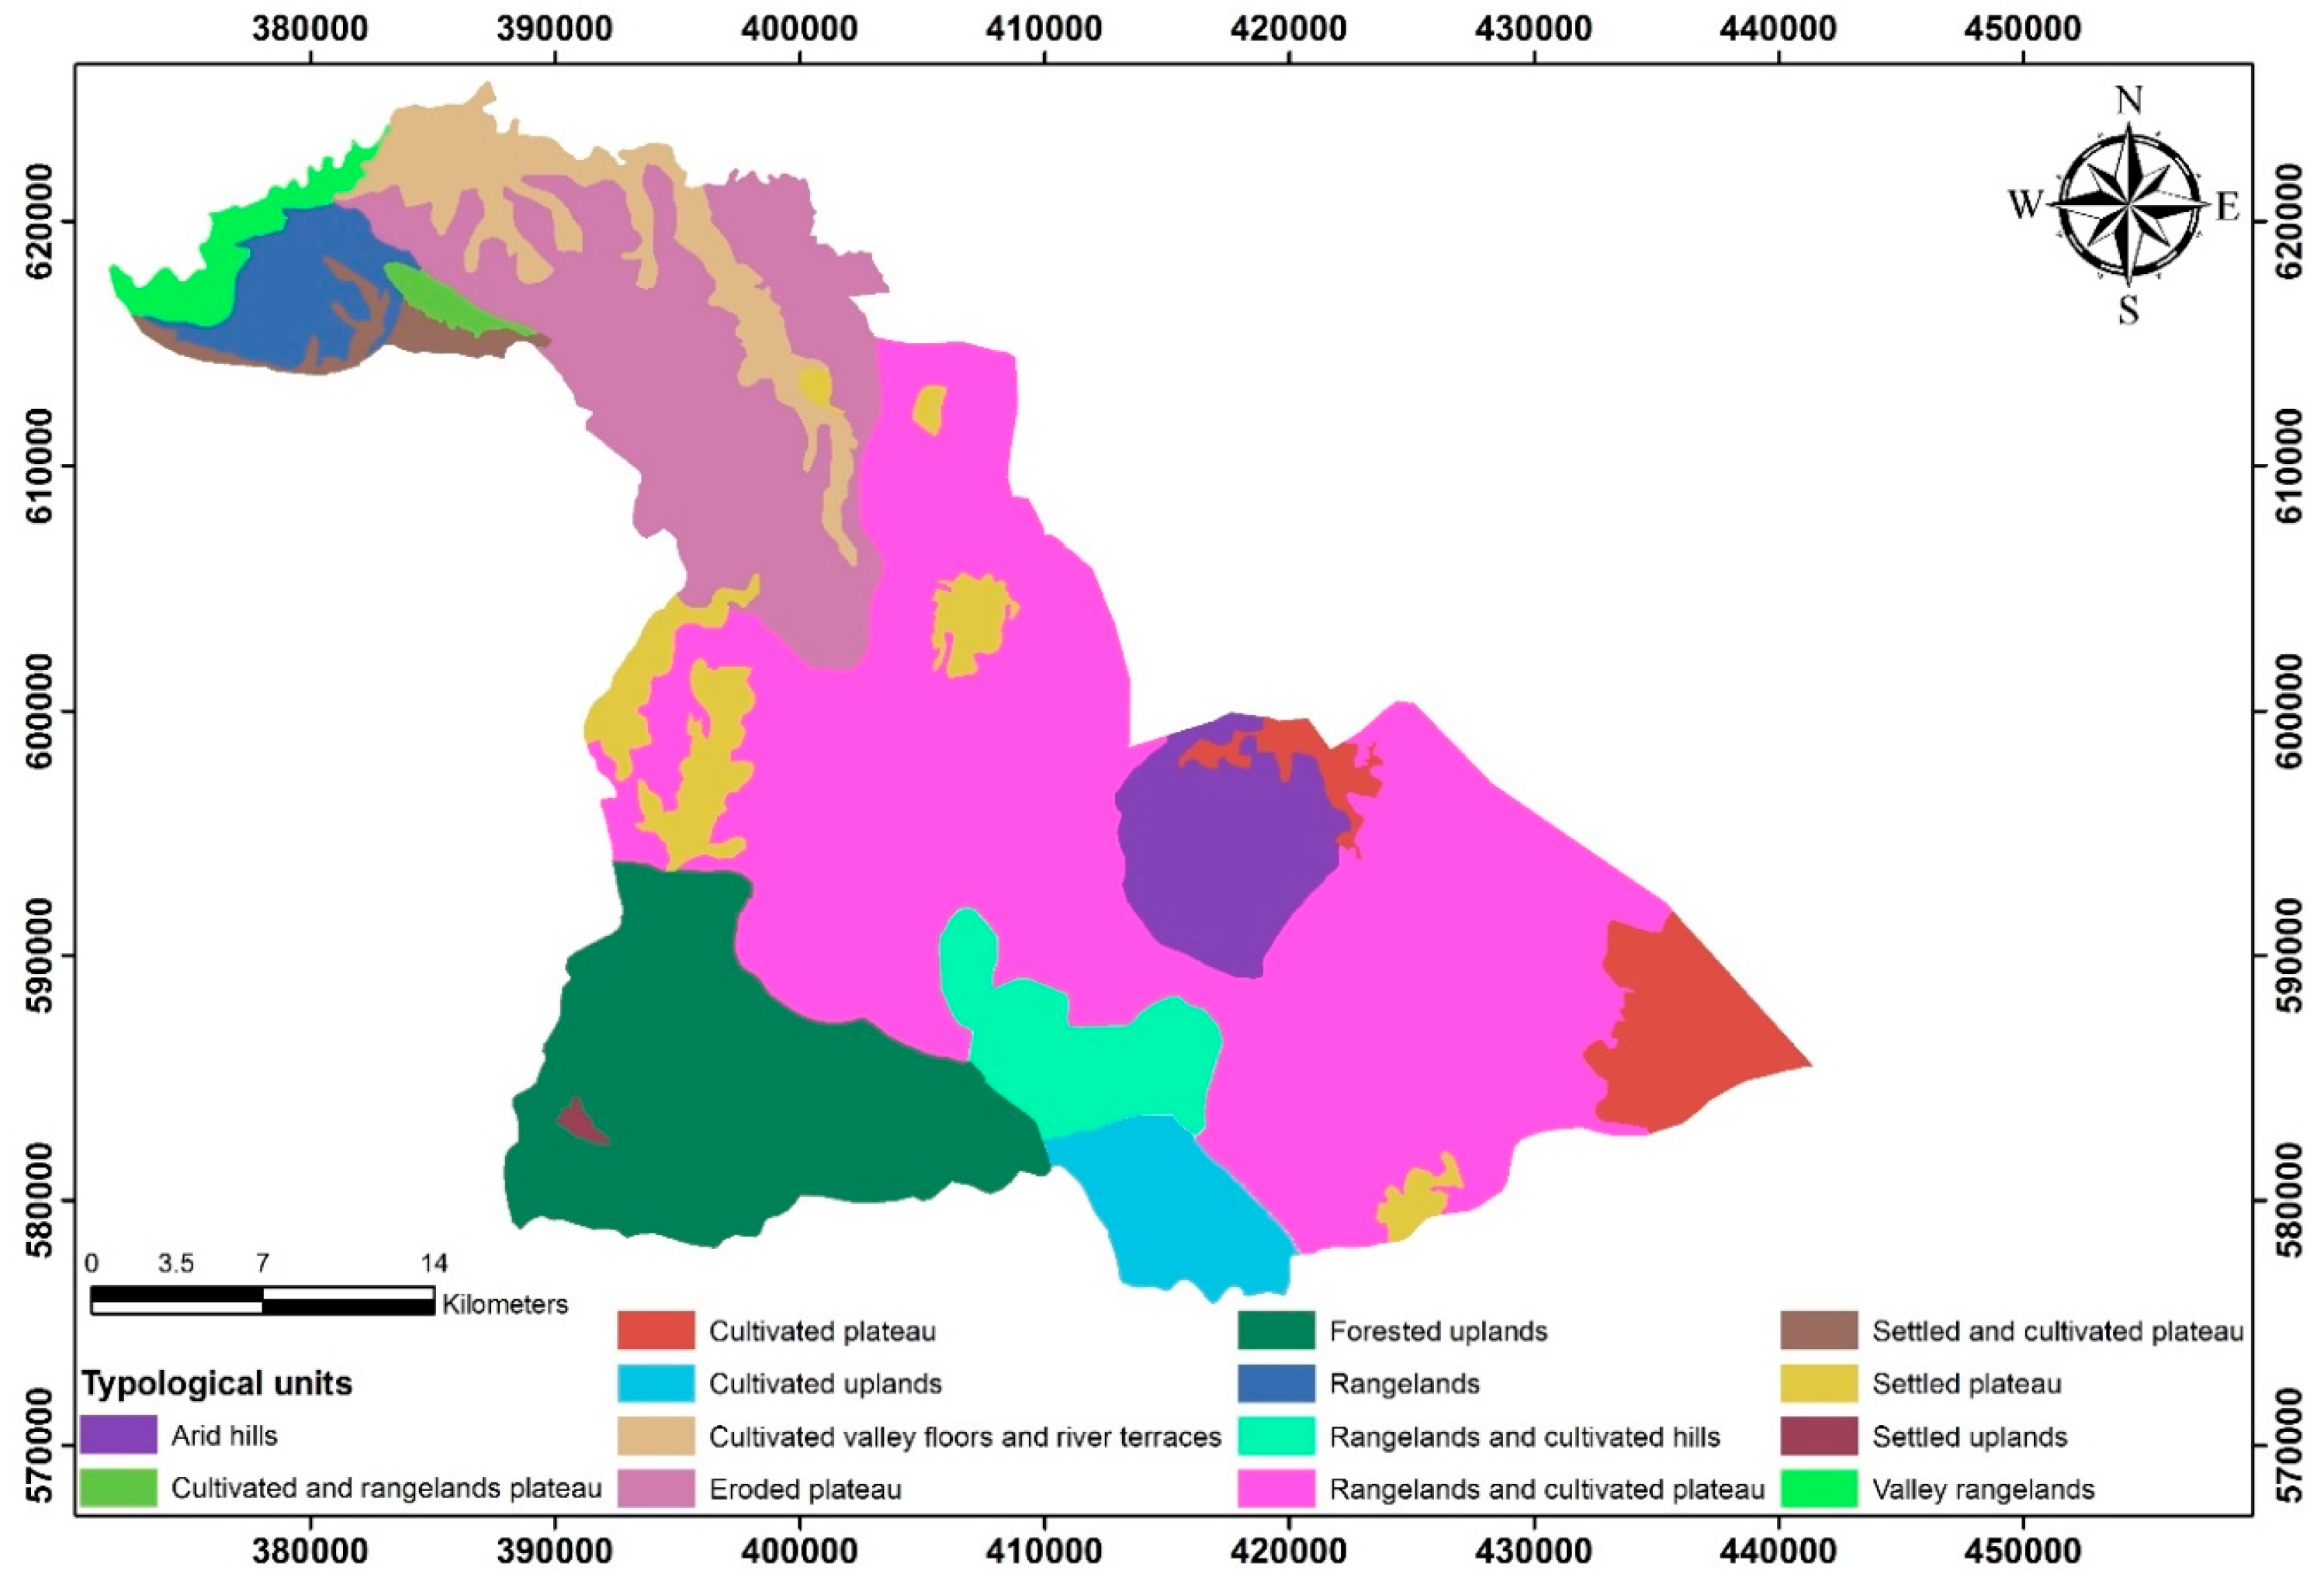
Figure 6.
The 14 Typological units in the study area of Wadi Mujib. The numbers of units are well distributed in all the directions in this study area.
Figure 6.
The 14 Typological units in the study area of Wadi Mujib. The numbers of units are well distributed in all the directions in this study area.

Table 1.
Landforms, descriptions, and the code of each class.
| Landform | Description | Code |
|---|---|---|
| Lowlands | Areas of land generally lying less than 200 m above the drainage base-level. These can be further characterized as flat (<2% slope or 1:50), undulating to gently undulating (2–10%, 1:50–1:10), or rolling to strongly rolling(10–50%, 1:10–1:2) | Lf |
| Lu | ||
| Lr | ||
| Hills | Somewhat elevated tracts of land (around 200–600 m above) but also usually rolling slopes (10–50%) | H |
| High Hills | Somewhat elevated tracts of land (around 400–900 m above base-level) * but also steeply rolling to precipitous (>50%) | Hh |
| Uplands | Elevated and often extensive tracts of land with variable relief. Generally between 600–1000 m above base level | U |
| Mountainous area | Elevated tracts of land. Generally >1000 m and typically showing peaks, ridges, and steep or precipitous slopes | M |
| Plateau | The essential criteria for plateaus are low relative relief (extensive area of flat) and some altitude (e.g., over 200 m) | P |
| Eroded Plateau | Extensive areas of elevated land, undulating to rolling, often with dendritic drainage patterns | Pe |
| Valleys | An elongated hollow between hills or ridges. A stretch of a land watered by a river (at least seasonally) and enclosed or flanked by its erosion slopes | V |
| Escarpment | Extensive area at any altitude with average slope angles >50%. Often includes cliffs and rock outcrops | E |
Note: * Each landform class description has a symbol of two letters in the geo-data base for labeling in the map.
Table 2.
Ground type and the code of each class.
| Soil Class | Code |
|---|---|
| Mixed Soils | M |
| Shallow Soils over chalk and limestone | R |
| Volcanic | V |
Table 3.
Land cover, description, and the code of each class.
| Class | Description | Code |
|---|---|---|
| Artificial surfaces | Urban; industrial, commercial and transport units; mine, dump and construction sites; artificial non-agricultural vegetated areas. | A |
| Agriculture | Arable land, permanent crops, horticultural crops, , enclosed pastures, mixed agriculture. | G |
| Forest | Natural forests; Artificial forest (plantations). | F |
| Scrub | Includes maquis, garrigue and other mixed scrub. Typically sclerophyl shrub species attaining 1m+ in height. | S |
| Rangelands and rough grazing | Dwarf scrub, hedgehog scrub, phrygana often mixed with annual grasses and herbs , typically grazed by free-ranging goats and/or sheep. Vegetation usually <0.5 m in height., of aromatic, xerophytic and drought-adapted shrub species. | R |
| Bare land | Land with exposed bedrock, boulders, rocks, gravel etc with virtually no vegetation nor any specific clear use. | B |
| Wetlands& Water Bodies | Inland wetlands like marshes and peat bogs; coastal wetlands like salt marshes, salines and intertidal flats. Inland waters like water courses and water bodies; and marine waters like estuaries, and coastal lagoons. | W |
| Mixture of rangeland and bareland | Mixed landcover of rangeland and bare lands. | R-B |
| Mixture of rangeland and agriculture | Mixed landcover of rangeland and agriculture lands. | R-G |
Table 4.
Settlement pattern, description, and the code of each class.
| Class | Description | Code |
|---|---|---|
| Unsettled | Areas with no settlements | U |
| Sparsely Settled | The typical distance between neighboring settlements is 5 km or more | Ss |
| Settled | The typical distance between neighboring settlements is less than 5 km | S |
| Urban | Cities, and other large built up areas greater than 10 km2 in extent | Ur |
© 2017 by the authors. Licensee MDPI, Basel, Switzerland. This article is an open access article distributed under the terms and conditions of the Creative Commons Attribution (CC BY) license (http://creativecommons.org/licenses/by/4.0/).
Share and Cite
MDPI and ACS Style
Odeh, T.; Boulad, N.; Abed, O.; Abu Yahya, A.; Khries, N.; Abu-Jaber, N. The Influence of Geology on Landscape Typology in Jordan: Theoretical Understanding and Planning Implications. Land 2017, 6, 51. https://doi.org/10.3390/land6030051
AMA Style
Odeh T, Boulad N, Abed O, Abu Yahya A, Khries N, Abu-Jaber N. The Influence of Geology on Landscape Typology in Jordan: Theoretical Understanding and Planning Implications. Land. 2017; 6(3):51. https://doi.org/10.3390/land6030051
Chicago/Turabian StyleOdeh, Taleb, Natalia Boulad, Omar Abed, Anas Abu Yahya, Nour Khries, and Nizar Abu-Jaber. 2017. "The Influence of Geology on Landscape Typology in Jordan: Theoretical Understanding and Planning Implications" Land 6, no. 3: 51. https://doi.org/10.3390/land6030051
Note that from the first issue of 2016, this journal uses article numbers instead of page numbers. See further details here.