1. Introduction
Land cover change impacts ecosystem function across the globe [
1], and disturbance is a major driver of land cover change, which creates heterogeneous landscapes [
2]. Large, infrequent disturbances, such as wildfires, are an essential component in many ecosystems, but have the potential to produce unexpected changes [
3], especially when coupled with other impacts, such as a changing climate [
4]. Wildfires burn with varying degrees of severity, which affects vegetation succession [
5], land management efforts [
6] and the potential for increased erosion and flooding [
7]. In California, wildfire is a common driver of land cover change [
8], and in the Big Sur region of the central California coast, the majority of area burned is the result of large infrequent fires controlled primarily by extreme weather [
9]. These wildfires are of particular concern, because they can significantly alter vegetation in watersheds that transport sediment and nutrients to the adjacent nearshore oceanic environment [
10]. In addition, these large coastal wildfire events have been shown to negatively impact marine coastal ecosystems and protected marine mammals [
11,
12,
13]; these negative impacts are hypothesized to result from increases in the export of toxins, sediment and pollutants following land cover change [
14,
15,
16,
17].
Land cover data are vital in the detection of ecological change over time; these data are widely used in ecological applications. To accurately assess impacts to the nearshore environment, land cover data must accurately reflect any change caused by recent disturbance. The Multi-Resolution Land Characteristics Consortium (MLCR) National Land Cover Dataset (NLCD) is a commonly used land cover dataset [
18,
19,
20,
21]; however, at the time of this study, the most recent version of the NLCD was produced in 2006 (the 2011 NLCD was released in April 2014). Therefore, it did not reflect the impact of land cover changes that occurred between 2006 and 2011, such as two large 2008 wildfires that burned in the Big Sur region of the central California coast.
Detection of change in land cover requires multi-temporal assessments of land cover data. It has been common practice to analyze the difference between two scene dates to document change. However, time series approaches are increasingly common [
22,
23]. The Landsat multispectral data acquisition program, including Landsat Thematic Mapper (TM), Enhanced Thematic Mapper (ETM+) and Operational Land Imager (OLI), provides free, relatively high-resolution remotely sensed data from 1984 to the present that are widely used to study land cover change and disturbance at both regional and global scales.
One way to utilize a Landsat or other spectral data time series to understand change is to classify multispectral imagery, and a variety of classification methods have been developed [
24]. A classification tree [
25] uses recursive partitioning based on a variety of splitting rules to divide a dataset into categorical classes. Decision tree classifiers are simple, computationally efficient and transparent [
26]. In addition, decision tree methods do not require statistical assumptions regarding distributions, are able to process large nonparametric datasets and use both continuous and categorical data [
27].
A challenge in creating multi-temporal scene classification is the collection of high-quality field data for training and validation. Although it is possible to collect field data coinciding with current or future Landsat acquisitions, it is impossible to conduct field sampling to collect data for land cover classification of previous years and incredibly difficult and cost-prohibitive to collect field data over large areas. In such cases, it is possible to use other sources of information to create reference data, such as higher resolution aerial photographs [
24,
28,
29]. Unfortunately, aerial photographs coinciding with satellite data acquisitions are not always common, and therefore, it becomes necessary to extrapolate the reference data over time [
30].
Numerous studies have used decision tree, maximum likelihood, Fourier analysis and other methods to classify land cover for historic periods, either to detect change or assess trends [
30,
31]. Global scale land cover classifications have primarily utilized lower resolution data from the Advanced Very High Resolution Radiometer (AVHRR) or the Moderate-resolution Imaging Spectroradiometer (MODIS) in a time series, such that the phenological pattern contributes to the land cover classification [
30], but data at that scale are not appropriate when incorporating the high-resolution effects of wildfire [
32]. Higher resolution Landsat data are more difficult to develop annual classifications from, as cloud impacts and sensor failures can limit scene availability [
33]. Our challenge in this study was to classify land cover over multiple sequential years (as required for the model that the land cover classifications would be utilize as inputs for) at a spatial resolution that would capture wildfire effects (
i.e., Landsat), in complex terrain with diverse land cover that transitions rapidly between three primary life form strata (
i.e., forest, shrub and grass). Furthermore, we needed to understand both overall accuracy and spatial accuracy, as the subsequent modelling effort produced spatially-explicit outputs that would have differing levels of error based on spatial accuracy. Our goal, therefore, was to develop a method for classifying a time series of Landsat data using a decision tree classifier developed with a single year of field observations. The success of the classification was then assessed using both the standard error matrix and a local representation of the error. Our objectives were to: (1) create a parsimonious decision tree that accurately classified historic remotely sensed data; and (2) produce maps of land cover from 2005 to 2012 for the Big Sur region that would incorporate the effects of the 2008 wildfires. The produced land cover dataset would subsequently be used in a later study to model nonpoint source pollutant transport from the Big Sur coastal watersheds to the nearshore environment [
34].
4. Discussion
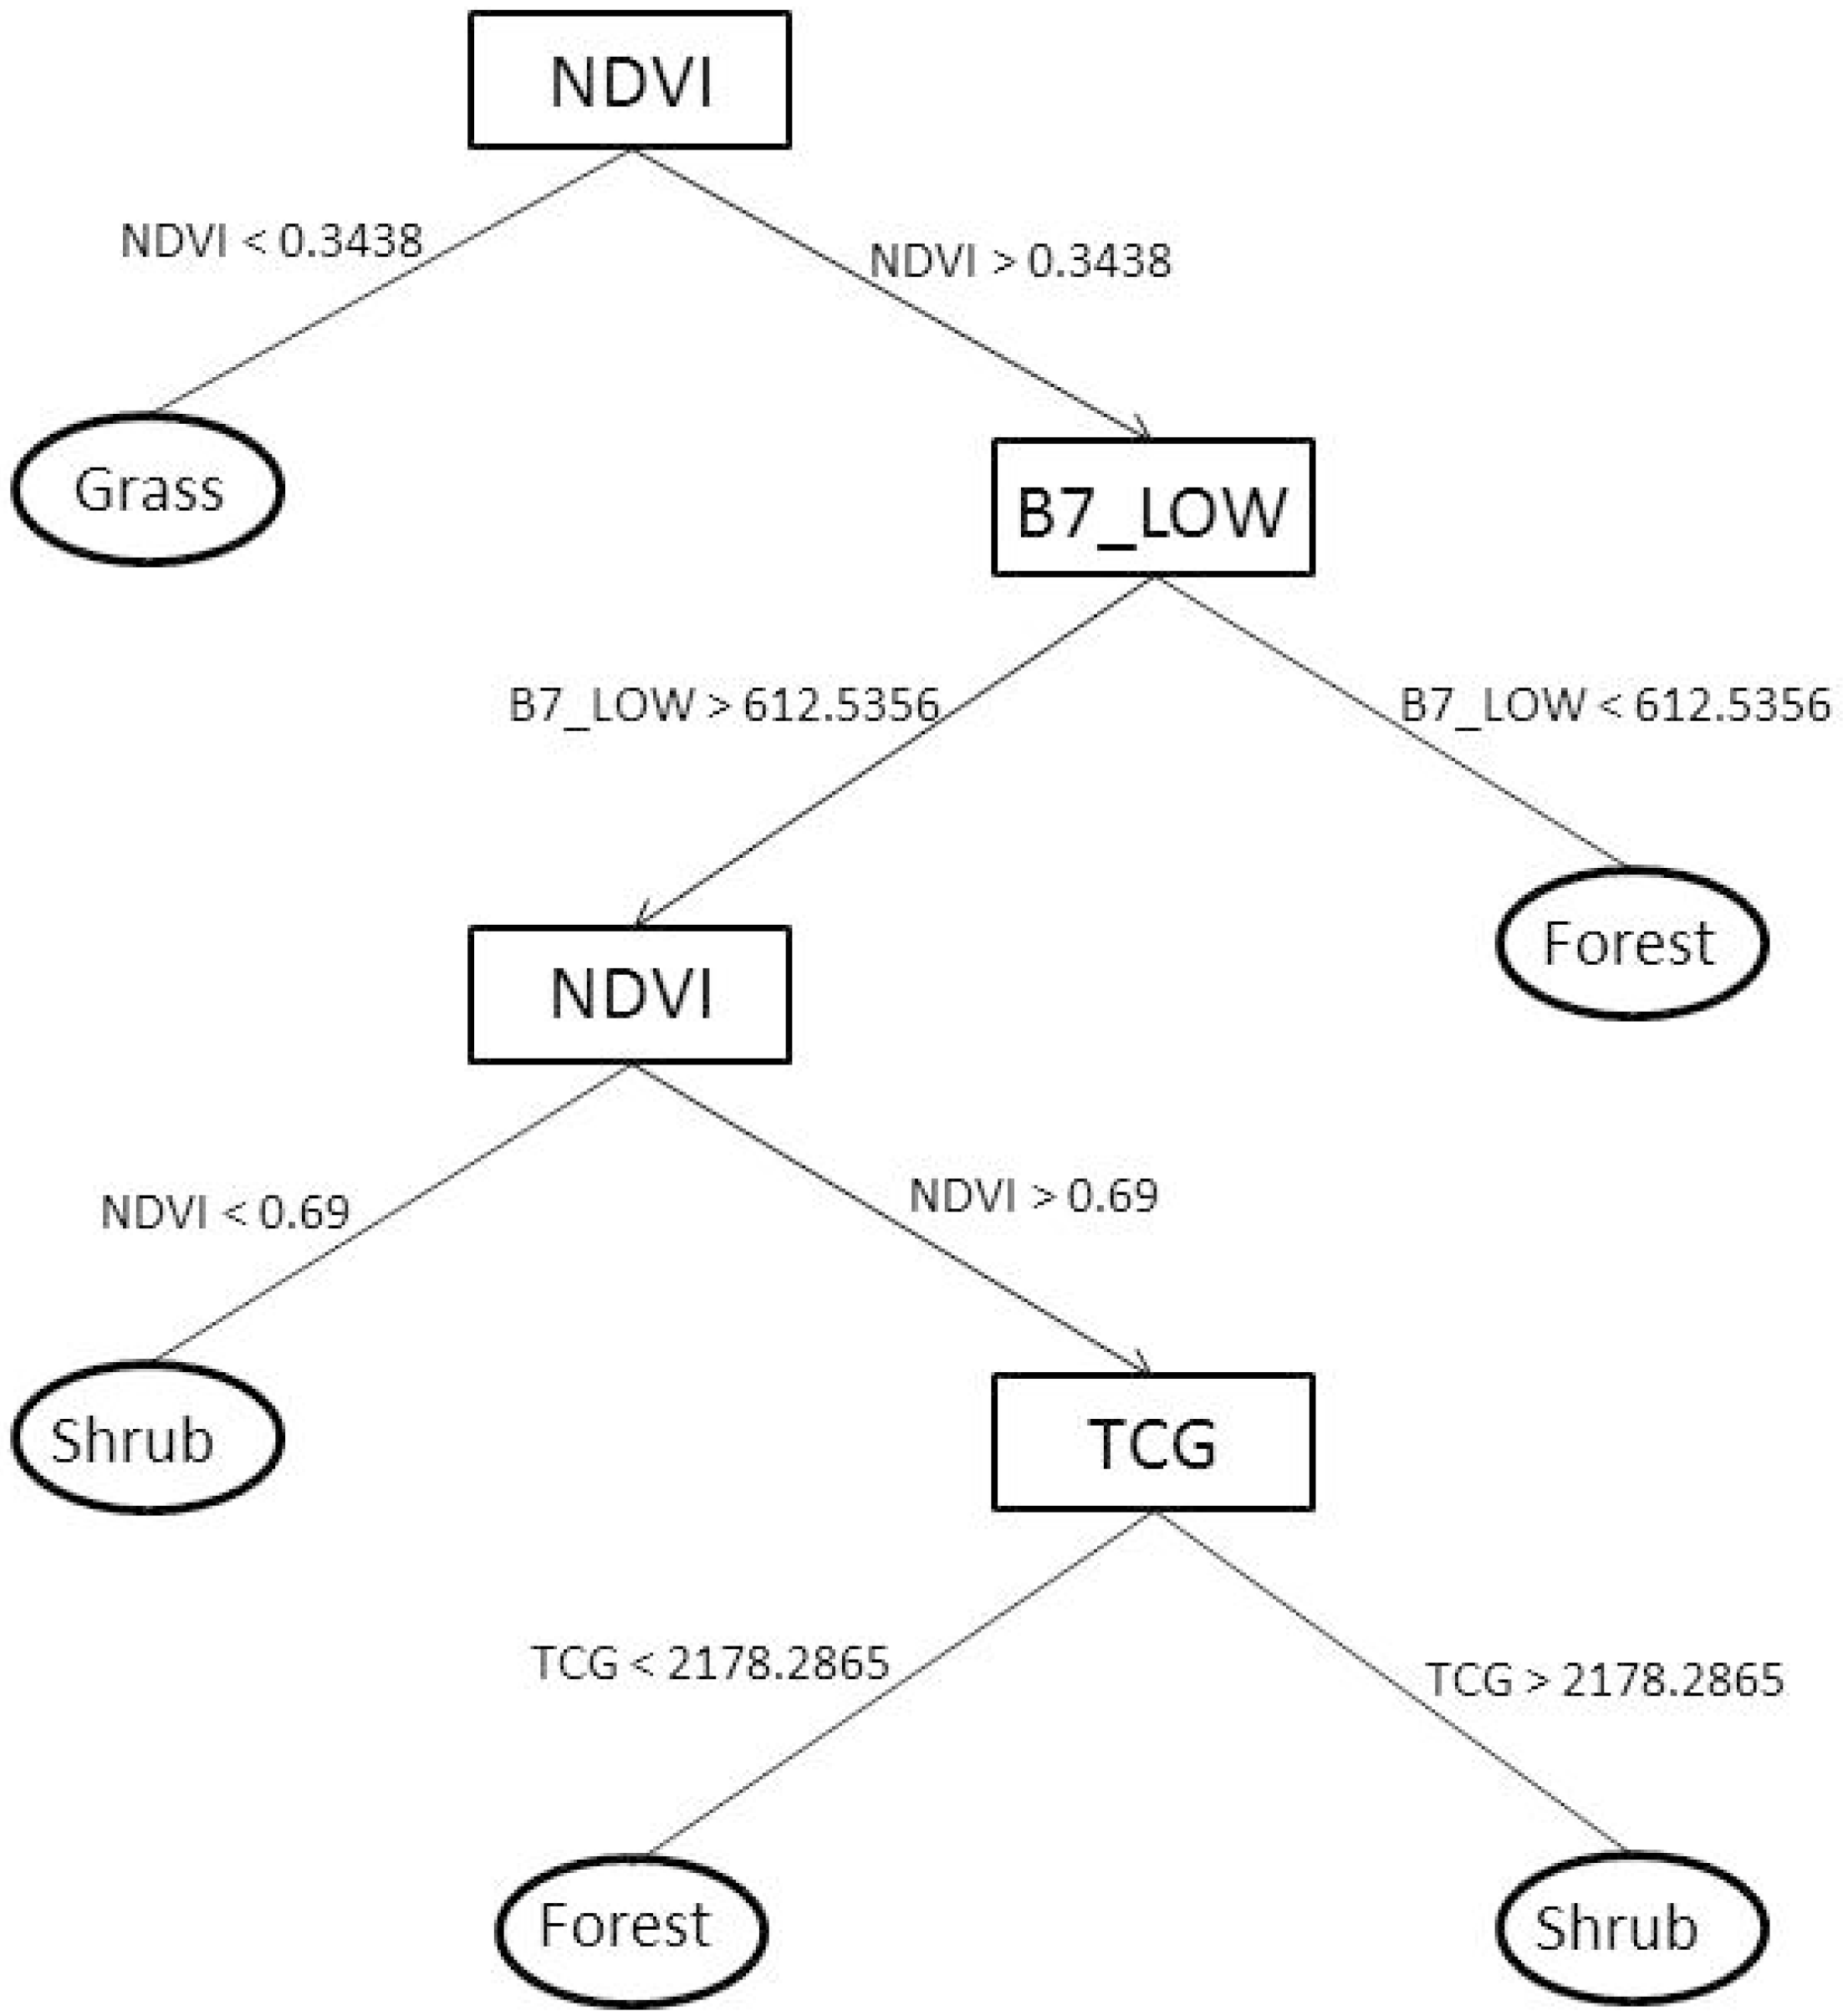
The decision tree relied mainly on variables sensitive to vegetation characteristics. We were surprised that elevation was not chosen as a variable to distinguish between forest and shrub, because forests are found primarily along ridge tops at the highest elevations (pine forests) or along the bottom of river valleys at the lowest elevations (redwood forests), but the spectral signal was chosen as a more discriminating determinant. This is potentially because the three classes were well-distributed spatially across all topographic variables, due to the strong moisture gradient from north to south [
9,
55]. NDVI, sensitive to plant greenness and biomass, was used at the first node to identify grass that at the time was senesced, producing significantly lower NDVI values than shrub or forest cover. The use of tasseled cap greenness, representing vegetation greenness and NDVI, were used to identify forest from shrub based on spectral differences in vegetation and differences in biomass. The incorporation of spatial dependence by using a mean filter of Band 7 (sensitive to vegetation moisture) effectively split forest from shrub. Overall accuracy of the 2012 base classification was 90 percent with a kappa of 0.84, where 85 percent is suggested to be a baseline for overall accuracy [
56], and a kappa value of greater than 0.80 indicates high agreement between a classified map and reference data [
49]. However, once the 2012 decision tree was applied to the seven years of Landsat data, the overall accuracies fell, ranging from 75 to 83 percent, with kappa values ranging from 0.56 to 0.71. Low kappa values were a result of confusion among the classes, especially between forest and shrub.
Because of its spectral dissimilarity from other classes, particularly during the mid-to-late summer when it has senesced, grass produced the highest accuracies. Some inaccuracies in grass can be attributed to a few small areas, where pasture land remains green from irrigation and the presence of nonnative species that retain their greenness late into the summer, and is classified as shrub. Shrub and forest classes consistently produced the lowest accuracies. Much of the vegetation in the study area is evergreen (both forest and shrub), and shrub cover in areas can be visually difficult to differentiate from forest; thus, the highest confusion was between these classes. In particular, patches of the evergreen coast live oak forest grow extensively in grasslands and savannas [
9] and can be difficult to differentiate from and are often classified as shrub.
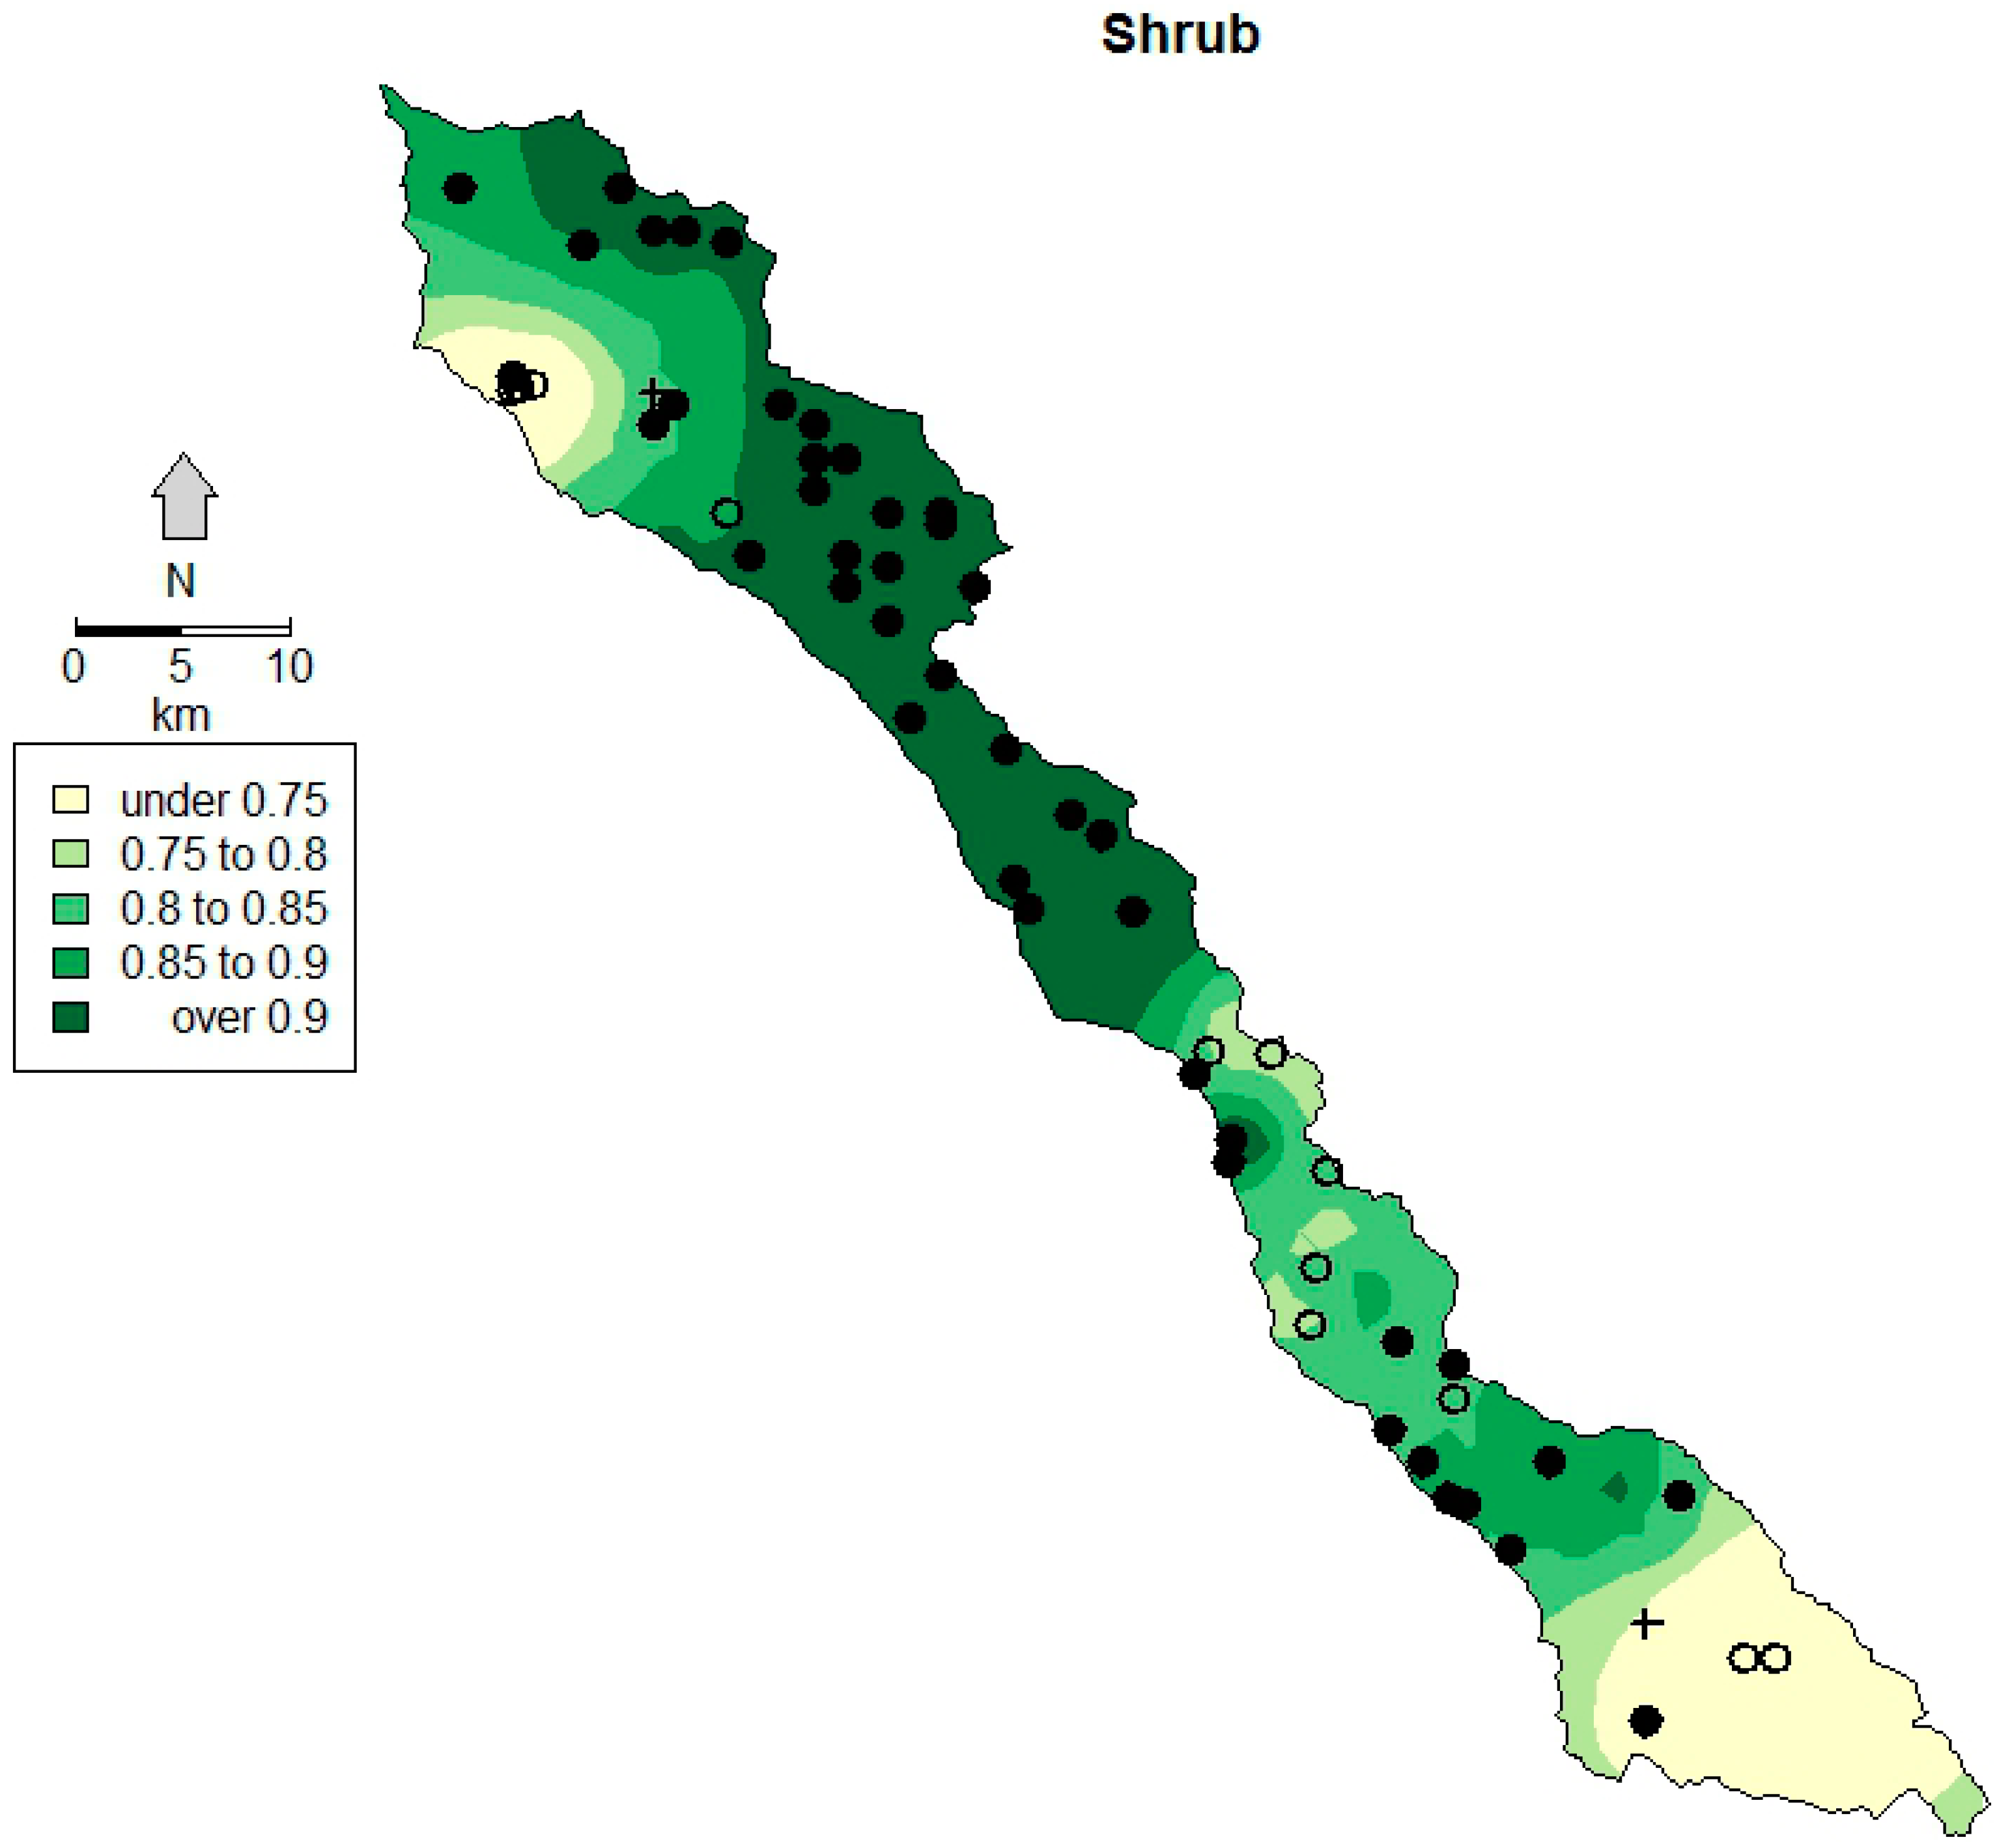
In land cover classification with relatively high accuracy, it may not be necessary to spatially map local accuracy. However, when a land cover classification results in low accuracy or has problematic classes of poor accuracy, a spatial representation could be beneficial. Information from the maps of accuracy can be used to understand the causes of its variation [
57]. The global measure of the 2012 overall classification accuracies was high; however, the shrub cover class contained relatively high errors of both commission and omission.
Figure 4 illustrates spatial patterns of predicted accuracy, including a lower probability of accuracy in the northern and southern portions of the study area and a higher probability of accuracy in the central portion. For both portions, but especially in the south, a lack of training data likely hindered accuracy. The southern area also reflects the driest portion of the study and a transition to a greater proportion of more drought-tolerant shrub species [
9]. The northern site, by contrast, is a site where the coastal marine layer pools and intrudes inland, as is visible on the numerous Landsat scenes we reviewed, and this may increase vegetation vigor (altering the spectral signal) and induce misclassification. This type of spatially explicit accuracy is useful, as it can inform the appropriate choice of land cover data for an application [
58] or where specific portions or regions of a land cover map are not appropriate to be used for subsequent analysis or land management planning [
57]. For large, difficult-to-access study sites, this can indicate local problem areas in the classification method and highlight regions of the study area where additional data are needed [
59].
The base 2012 year classification exhibited high accuracy; however, the accuracy was not as high for the preceding years. While it is possible that this reduced accuracy is partially attributed to either overfitting the tree to the 2012 field data, this is unlikely given the simplicity of the tree that we utilized. There is greater potential that inaccuracy in the earlier years stems from spectral differences resulting from interannual variability in vegetation phenology and soil moisture. Though phenology is relatively static during the months of remotely sensed data acquisition for this region (
i.e., vegetation is mostly dormant by early July), interannual climate variability can easily produce differences in vegetation vigor and cover between years. For example, the study area received only 50 percent of normal precipitation in 2007 (based on a 30-year climatological average) [
60], and the drought stress likely reduced the vigor of the shrubs, making shrubland reflectance more similar to a forest spectral signature. Similarly, the timing of moisture can affect grass classification accuracies, as late spring precipitation or even strong marine layers (which occur in the summer on the central California coast when there is high pressure in California’s Central Valley) can induce temporary green-up in annual grasses, leading to misclassification as shrubs.
It is also unsurprising that the accuracies were lower for the years prior to 2012, because we excluded the portion of the study area with the highest classification accuracy (the burned areas) from the accuracy assessment. We were using primarily persistent sites to validate prior to 2012, and the area within the wildfire perimeters was considered disturbed (and not persistent). Therefore, while the classification accuracy for 2012 included field data collected in the fire perimeters for the validation, the accuracies for the prior years did not include validation within the burned areas, and our spatial GWR of accuracy indicated that the highest accuracy occurred in the burned areas in 2012.
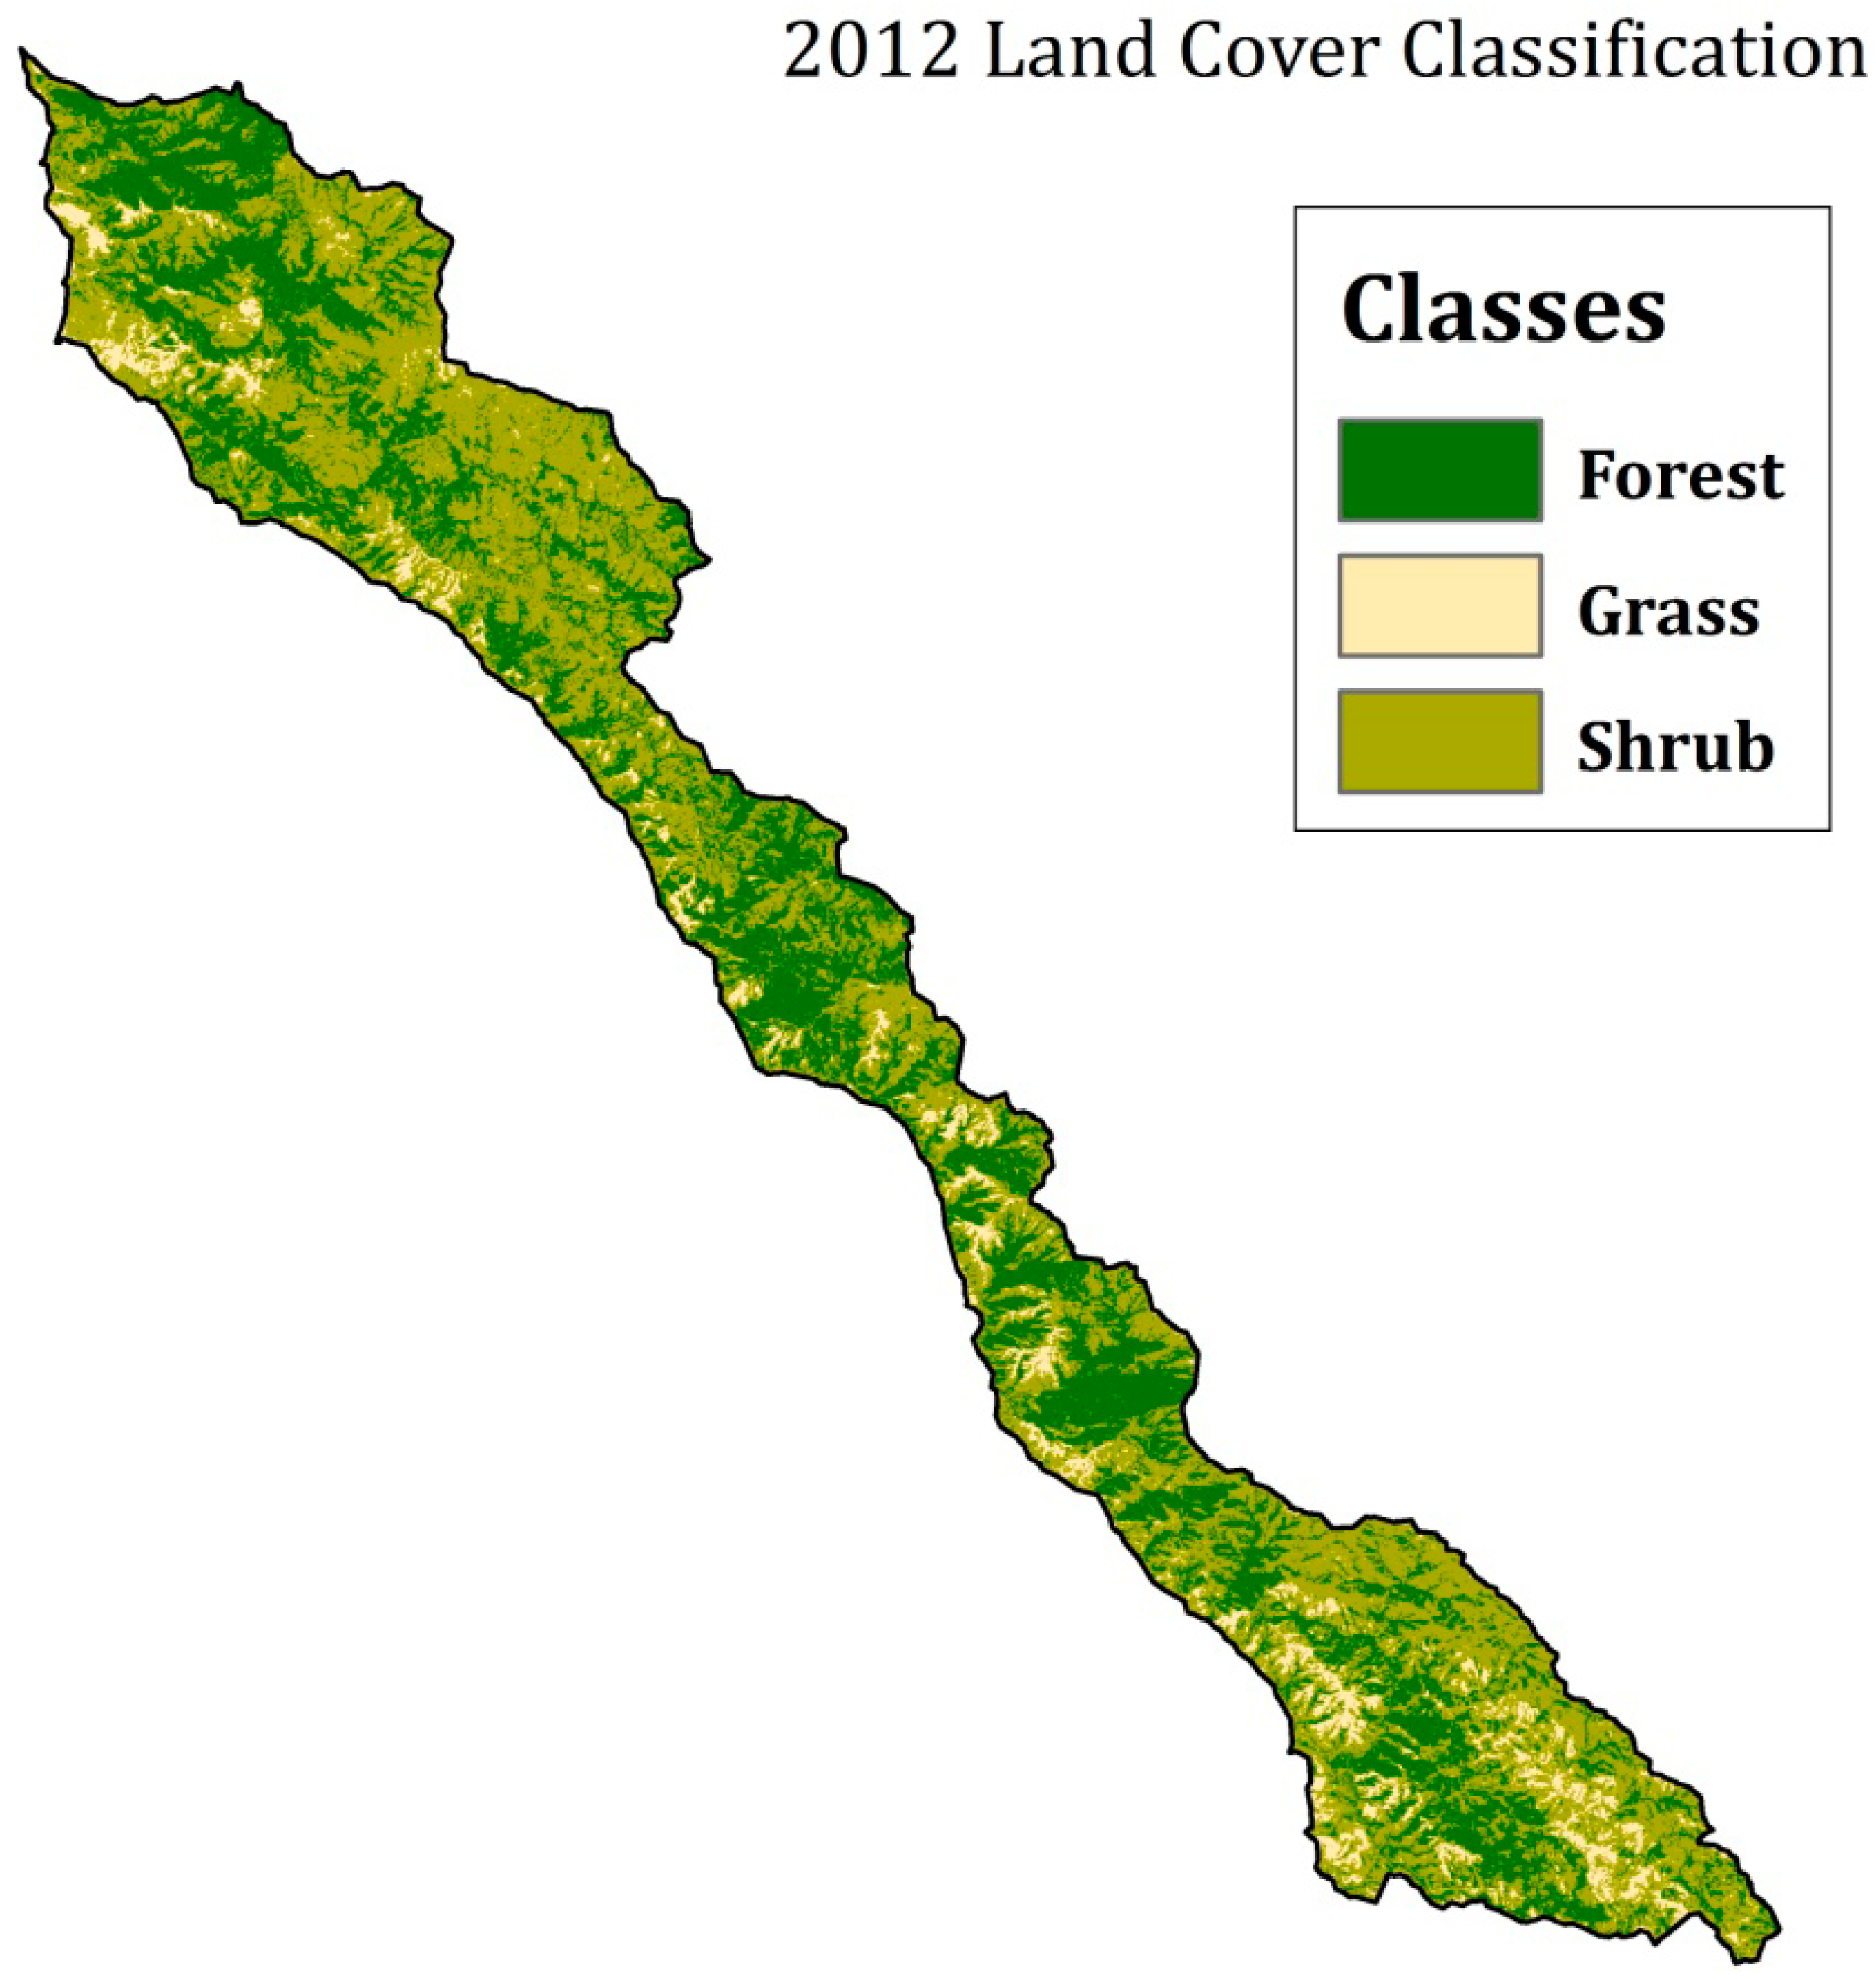
Though the classifications of seven historic Landsat scenes were less accurate compared to the 2012 base classification, overall, the classification produced land cover maps of moderate to high accuracy, and we assume that the true accuracy is actually higher based on our exclusion of validation sites from the burned areas due to the lack of persistence. We are confident that using these land cover maps will be sufficient in determining the effects of the 2008 wildfire on land cover and to the nearshore ecosystem.


