Article

Comparing Path Dependence and Spatial Targeting of Land Use in Implementing Climate Change Responses

1
James Hutton Institute, Aberdeen, Scotland AB15 8QH, UK
2
School of Biological Science, University of Aberdeen, 23 St. Machar Drive, Aberdeen AB24 3UU, UK
*
Author to whom correspondence should be addressed.
Land 2014, 3(3), 850-873; https://doi.org/10.3390/land3030850
Submission received: 8 May 2014 / Revised: 14 June 2014 / Accepted: 15 July 2014 / Published: 23 July 2014
(This article belongs to the Special Issue Land Use Change Feedbacks with Climate)

Abstract

:
Land use patterns are the consequence of dynamic processes that often include important legacy issues. Evaluation of past trends can be used to investigate the role of path dependence in influencing future land use through a reference “business as usual” (BAU) scenario. These issues are explored with regard to objectives for woodland expansion in Scotland as a major pillar of climate change policy. Land use changes based upon recent trends and future transient scenarios to 2050 are used to assess viability of targets for reducing greenhouse gas emissions using analysis based on net emission change factors. The BAU scenario is compared with alternative future scenarios incorporating policy targets and stronger spatial targeting of land use change. Analysis highlights recent trends in new woodland planting on lower quality agricultural land due to socioeconomic and cultural factors. This land is mainly in the wetter uplands and often on carbon-rich soils. Woodland planting following this path dependence can therefore result in net carbon emissions for many years into the future due to soil disturbance during establishment. In contrast, alternative scenarios with more lowland woodland planting have net sequestration potential, with greatest benefits when carbon-rich soils are excluded from afforestation. Spatial targeting can also enhance other co-benefits such as habitat networks and climate change adaptation.

1. Introduction

Land represents a finite resource that can supply multiple functions and services but which is also typically subject to competing demands. Patterns of land use are therefore a dynamic consequence of the complex place-based interaction of various cross-scale factors that differ in terms of their relative influence [1]. At the local level, land managers may have different priorities when compared to policymakers, and they may therefore respond in different ways, individually or collectively, to changing circumstances [2,3]. Key influences on land managers’ decision making include local socio-cultural factors and personal attitudes to risk, in addition to biophysical factors, available land resources, and access to markets [4]. These local bottom-up factors influence responses to top-down incentives and regulations that may be set at national or regional level. Important differences may also occur between public-owned and private-owned land due to variations in how regulations are combined with the other influences. As a consequence the response of land use to different types of change may be diverse and its variability acts to preclude simple interpretation of land use transitions as following fixed patterns or as deterministic processes [5].

1.1. Land Use and Climate Change Policy

An increasingly important policy requirement is for land use to contribute to planned reductions in greenhouse gas emissions (GHGs) as a component of national targets set within international agreements for the mitigation of climate change [6]. Land use is therefore recognized as a distinct sector (Land Use, Land Use Change and Forestry: LULUCF) within national GHG inventories that are obligated by the UN Framework Convention on Climate Change (UNFCCC) to submit annual progress reports based upon comparable methodologies and good practice guidance [7]. The LULUCF sector is a particularly distinctive component of the emissions inventory because in addition to GHG emissions it can also include sequestration of carbon through new biomass or soil organic matter that may offset emissions. Both emissions and sequestration require accurate and reliable information on land use change in order to better measure progress, particularly regarding the effectiveness of policy interventions [8].
Due to other competing demands on land use, there are challenges in integrating targets for GHG emissions reduction with other policy priorities, such as those to maintain food security, energy security or rural development. Effective policy implementation therefore requires that incentives and regulations are consistently aligned with land managers’ motivations and their viable response options [9]. This requires support for local communities, including farmers and other land managers, to introduce low-carbon initiatives based upon local knowledge and local buy-in [10]. These challenges are further highlighted because of the concurrent need for land managers to adapt to ongoing climate change now and into the future, whilst also adjusting their activities due to fluctuations in socioeconomic drivers such as markets and commodity prices. This has highlighted a need both for climate change policy to better link mitigation (emissions reduction) and adaptation measures, whilst also mainstreaming them into the wider policy framework to provide coherent and integrated strategies on the ground [11]. Previously, this integration has been hindered by the use of different and separate approaches: climate change mitigation has predominantly adopted a top-down framework with a narrow technical focus based on emissions reduction; by contrast, the importance of local context in climate change adaptation has encouraged a stronger bottom-up emphasis supported by transdisciplinary analysis that includes short-term trade-offs as well as long-term change [12,13].
For land use, the need for climate change mitigation has led to an increased global emphasis on afforestation because of its carbon sequestration benefits. However, policy initiatives to promote woodland expansion to meet this goal have been sometimes identified as having “carbon blinkers” in that they have been developed in isolation of other important factors that could influence the success of the schemes [14]. Within the broader suite of mitigation measures, an important distinction exists between measures that are technically feasible and those that are feasible and also likely to be actually implemented by land managers. Local context will influence technical feasibility of measures through biophysical factors whilst local socioeconomic factors will have a strong influence on actual uptake and implementation, including factors such as property rights, attitudes to risk, social networks, access to knowledge, and opportunity costs (loss of existing benefits) [15].
Improved understanding of these interactions can be gained by analysis of recent patterns of land use change linked to complementary information that can facilitate description and interpretation of land manager behaviors. As the socioeconomic and biophysical context for land management will continue to change, this information can then provide a reference for contextualizing potential future pathways including the efficacy of current policy implementation and any further additional interventions that may be required to meet future objectives. The inherent uncertainty of future drivers of change in combination with the non-deterministic nature of land use transitions imply that such analysis is more tractable using a scenario-based approach to identify possible change rather than following a prediction-based approach [16]. For decision makers this can also help identify those factors which are beyond their control and which may influence future outcomes in combination with the more controllable factors.

1.2. Path Dependence

The legacy of the past is a key influence on land use patterns, particularly in countries with a long history of land use change which can act to reinforce embedded attitudes. Legacy effects are encapsulated in the general concept of path dependence which identifies how a self-reinforcing “lock-in” based upon existing technology or social norms can exert a strong influence on future outcomes so that they evolve as a consequence of past history [17,18]. For land use systems, this would suggest that, at least in the next decades, path dependence could have an important role in deciding whether policy objectives are met or not. For example, technological path dependence in agricultural systems has been used to investigate the implications of likely climate change adaptation responses on crop yields in south-east USA [19]. However, the role of wider economic, cultural, social and institutional path dependency factors and their implications for land use and climate change policy remain underexplored. Path dependence has been postulated as one of six Ps that together define major socioeconomic influences that shape land use decisions [20] and which are particularly exemplified through differences in adaptive responses between agriculture and forestry [21,22]. These differences act in tandem with the usual longer-term planning horizons in forestry compared to agriculture due to longer production cycles for tree products compared to crops and livestock. However, as path dependence acts in combination with other major influences then the relationship between recent land use trends and path dependence can be complex, particularly as the spatial configuration of landscape elements and land use can also embed path dependence factors [23].
The present study has investigated the role of path dependence using the case study example of woodland expansion in Scotland. This has involved identifying and interpreting recent trends for the planting of new woodland with regard to the type of land it has replaced. This concept of path dependence is used to formulate a “Business As Usual” (BAU) scenario as a forward-based projection of these trends. The BAU scenario can then provide a reference for comparison with alternative scenarios in which the future pathway is shaped by factors in a different way than from the past. Analysis of current and potential future land use change provides the context for considering interactions with climate change, notably through the policy imperative to reduce GHG emissions, but also through adaptive land use responses to a warming climate. Previous research in the UK [24] has explored future GHG emissions scenarios to 2050 based upon the CSORT carbon accounting model and fixed rates of land use change, including a BAU projection. The present study extends this analysis by further considering the spatial context for the scenarios, including constraints from path dependence, and the interaction of land manager behavior with policy objectives.

2. Case Study Background

Woodland expansion in Scotland is a key pillar of policy objectives to tackle both climate change and to deliver sustainable multifunctional landscapes. Declines in woodland planting in recent decades (Figure 1) and the resultant maturation of woodland stocks mean that carbon sequestered from forestry will be reduced unless the trend is reversed. The national Land Use Strategy identified an aspiration to expand woodland cover from its present extent of 17% to 25% by 2050 [25], which has been translated into a shorter-term objective of creating 10,000 ha∙yr−1 of new woodland. In terms of climate change mitigation, it has been estimated that maintaining the 10,000 ha∙yr−1 target from 2015 to 2027 could provide a maximum abatement potential of 687 Kt∙CO2e by 2027 [26]. This could provide an important contribution towards policy objectives for an 80% reduction in overall GHG emissions by 2050 (compared to a 1990 baseline), which is also associated with annual targets and a 42% emissions reduction by 2020 (including an expected 21% reduction from agriculture based upon a 1990 baseline) [27].
Policy objectives for woodland expansion in Scotland also recognize constraints on the location for new woodland. These mean that, in addition to inherent biophysical limitations, areas of deep peat soils should be excluded because of the risks of disruption to large stocks of soil carbon, and major tree planting initiatives should not occur on prime agricultural land because it is prioritized for food production [25]. As a consequence of these constraints, woodland expansion has in effect to compete for land of intermediate agricultural quality with other policy priorities, a zone that has been termed “the squeezed middle” [20], with tree planting advised only when there are no serious adverse impacts on local agriculture [28].
Prime agricultural land is defined as the top three classes within the national Land Capability for Agriculture (LCA) system (class 1, 2 and 31: Table 1). This classification is widely used by planners, land managers and policymakers because it summarizes the main biophysical constraints on land use (climate, soils and topography) into seven classes and sub-classes that characterize the wide variability of land quality [29,30]. Mapping of LCA classes is defined at locations by the biophysical parameter that imposes the greatest constraint. Land in the lower quality classes either has unproductive soils or an unfavorable climate (usually short growing season or wetness problems) or locally may have topographic restrictions on cultivation (steep slopes). The “squeezed middle” has been defined as LCA classes 3.2 to 6.1 inclusive [20]. Since the original mapping of LCA classes, more recent work has extended analysis of land quality into the future using climate change scenarios. This research has shown a likely improvement in land capability for many areas of Scotland, due to increased frequency of warmer drier summers, with a consequent expansion of prime agricultural land unless constrained by water availability [30,31].
Table 1. Land Capability for Agriculture (LCA) classes for Scotland and associated land use potential.
ClassCategoryClimate LimitationsMaximum Land Use Potential (Higher Classes Can Also be Used as for Lower Classes)
Class 1PrimeNone or very minorVery wide range of crops with consistently high yields
Class 2PrimeMinorWide range of crops, except those harvested in winter
Class 31PrimeModerateModerate range of crops, with good yields for some (cereals and grass) and moderate yields for others (potatoes, field beans, other vegetables)
Class 32Non-PrimeModerateModerate range of crops, with average production, but potentially high yields of barley, oats and grass
Class 41Non-PrimeModerately-severeNarrow of crops, especially grass due to high yields but harvesting may be restricted due to wetness factors
Class 42Non-PrimeModerately-severeNarrow range of crops, especially grass due to high yields but harvesting may be severely restricted due to wetness factors
Class 51Non-PrimeSevereImproved grassland (mechanical intervention possible) low soil wetness restrictions
Class 52Non-PrimeSevereImproved grassland (mechanical intervention possible): medium soil wetness restrictions
Class 53Non-PrimeSevereImproved grassland (mechanical intervention possible): severe soil wetness restrictions
Class 61Non-PrimeVery SevereRough grazing pasture only—good grazing quality
Class 62Non-PrimeVery SevereRough grazing pasture only—medium grazing quality
Class 63Non-PrimeVery SevereRough grazing pasture only—poor grazing quality
Class 7Non-PrimeExtremely SevereVery limited agricultural value
Most of the land in Scotland is privately owned, and therefore it is expected that a significant proportion of woodland expansion will occur on private as well as publicly owned land, as has occurred with recent woodland planting (Figure 1, [32]). Land tenure can therefore be an important influence on land use, particularly as sizeable proportions of the land are rented by tenant farmers with both short-term and long-term lease arrangements. The predominant policy tools for establishing new woodland are grants and advice but previous research has suggested a cultural divide between farming and forestry which can precondition attitudes of land managers towards new woodland creation [21]. It may therefore be expected that this has created a path dependency regarding favored areas for new woodland, and that this will continue to be a major influence into the future unless there are major changes.
Figure 1. Recent woodland planting rates in Scotland [32] together with future projections based upon a “Business as Usual” trend and a 10,000 ha∙yr−1 policy target.
Land 03 00850 g001

3. Data and Methods

A key requirement for decision making on land use change is national-scale summary information on spatial and temporal variations in land use and its implications for policy implementation. Hence, the methodology has been developed to facilitate rapid strategic assessment of current change and its contextualization against different pathways of future change, rather than to provide detailed mechanistic modeling of this change. Strategic approaches therefore allow multiple combinations of scenario and management options to be explored for iterative policy analysis, including the relative influence and sensitivity of different decision factors [33]. Linking recent land use trends with future scenarios that are based upon differing assumptions and priorities is also consistent with good practice for scenario development and allows decision makers to anchor potential future changes against current policies and practices [34,35].

3.1. Soils and Land Capability Data

The Soil Survey of Scotland have produced soil series maps at 1:250,000 scale for the whole country complemented by more detailed mapping for the main agricultural areas in the lowlands [36]. These two data sources have been used to produce a composite soils dataset combining 1:50,000 mapping for the lowlands with 1:250,000 mapping elsewhere. A baseline map of LCA classes was also available based upon the same composite soils series dataset (in combination with climate and topographic data) [36]. In addition, the study had access to a future LCA projection for the 2050s based upon a medium climate change scenario from the HadRM3 climate model, which also included areas of drought risk that could modify the definition of prime agricultural land (q16 scenario of [31]).

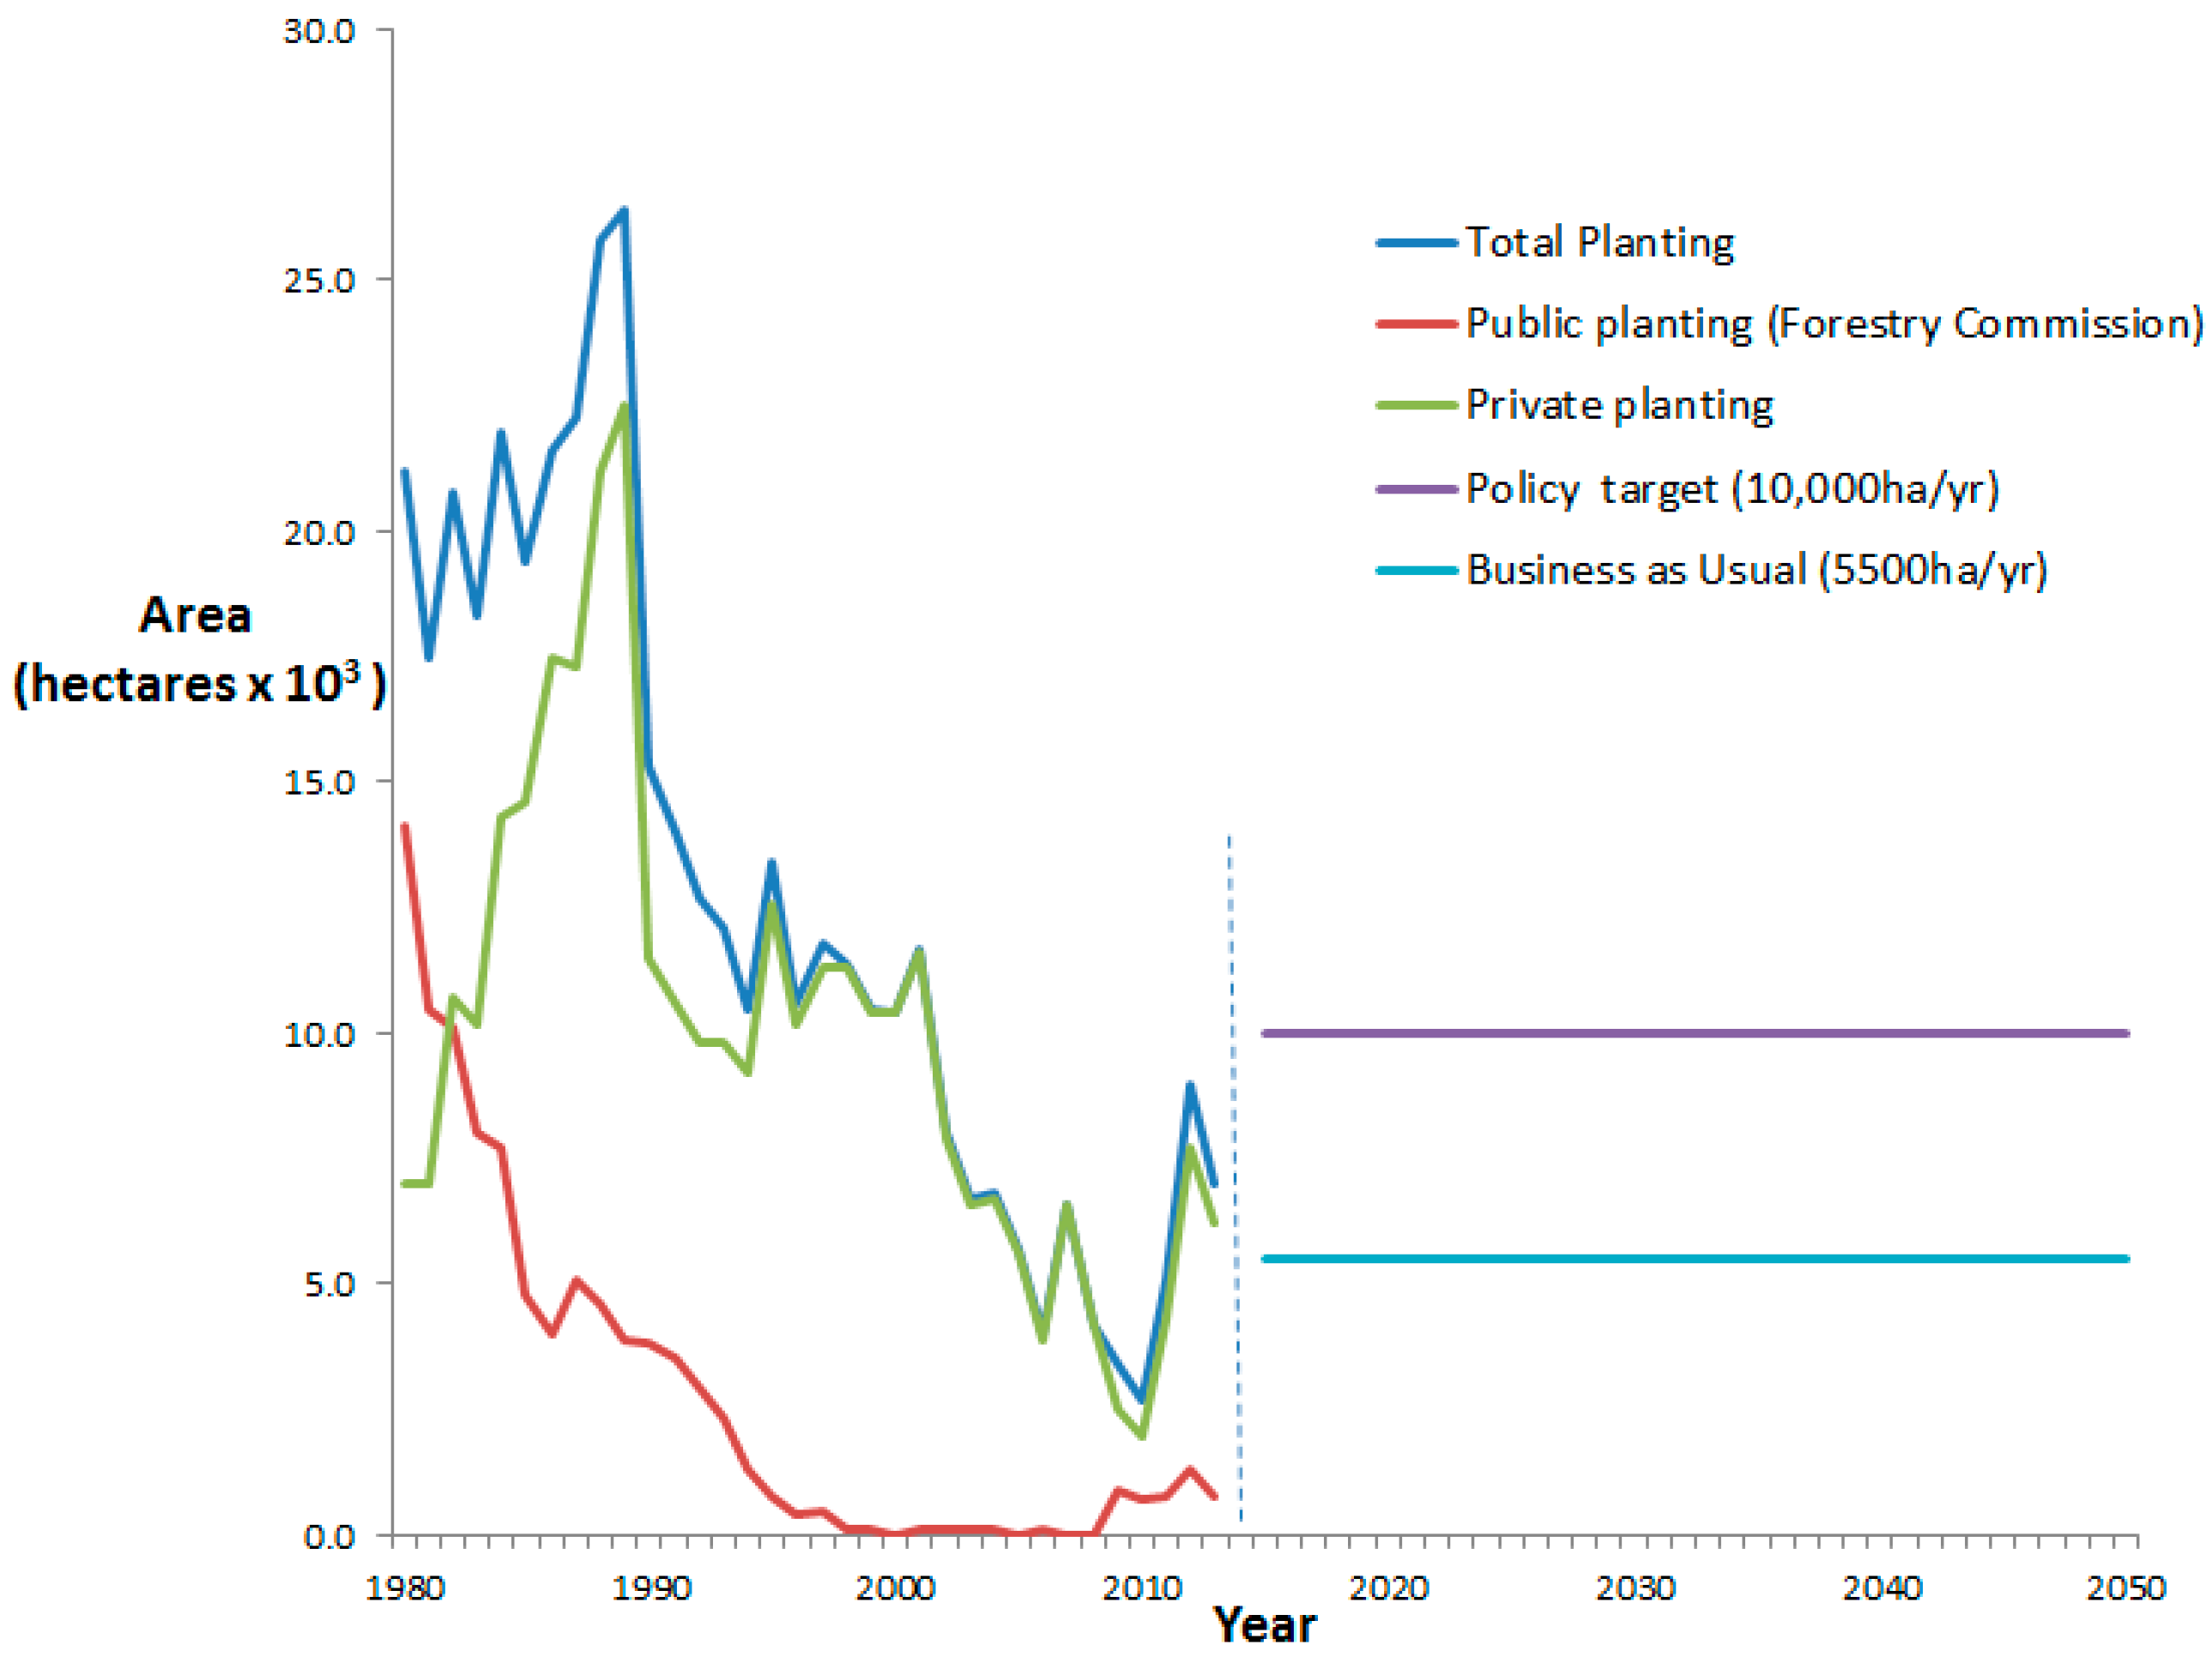
3.2. Recent Land Use Trends

Path dependence issues were investigated through analysis of the recent trend in new woodland planting referenced against the proportion of LCA classes in which it occurred and the previous land use types it has replaced. The most recent spatial data on woodland stocks in Scotland are available through the National Forest Inventory (NFI) [32] which has been sourced from remote sensing imagery complemented by more recent information on areas defined for woodland grants that provide areas of “assumed woodland” (i.e., these do not yet show evidence of woodland in remotely-sensed imagery). Hence, areas of new woodland (i.e., trees < 15 years old) were identified from NFI based upon a combination of areas defined as “assumed woodland” with those mapped as either “young trees” or “ground prepared for planting”. Areas of recent afforestation represented by the new woodland data were then analyzed against LCA class mapping using a GIS overlay procedure to synthesize the current trend. The NFI data also contains areas defined as “felled trees” indicative of harvesting operations, but as there is no further indication of whether these areas are to be restocked they were not considered in the analysis.
Current land use patterns in Scotland were interpreted from the UK Land Cover Map 2007 (LCM2007) [37] to provide a baseline for the future scenarios. The data were aggregated into a series of representative summary classes for the analysis (woodland, arable, improved grassland, semi-natural, settlements, and water).

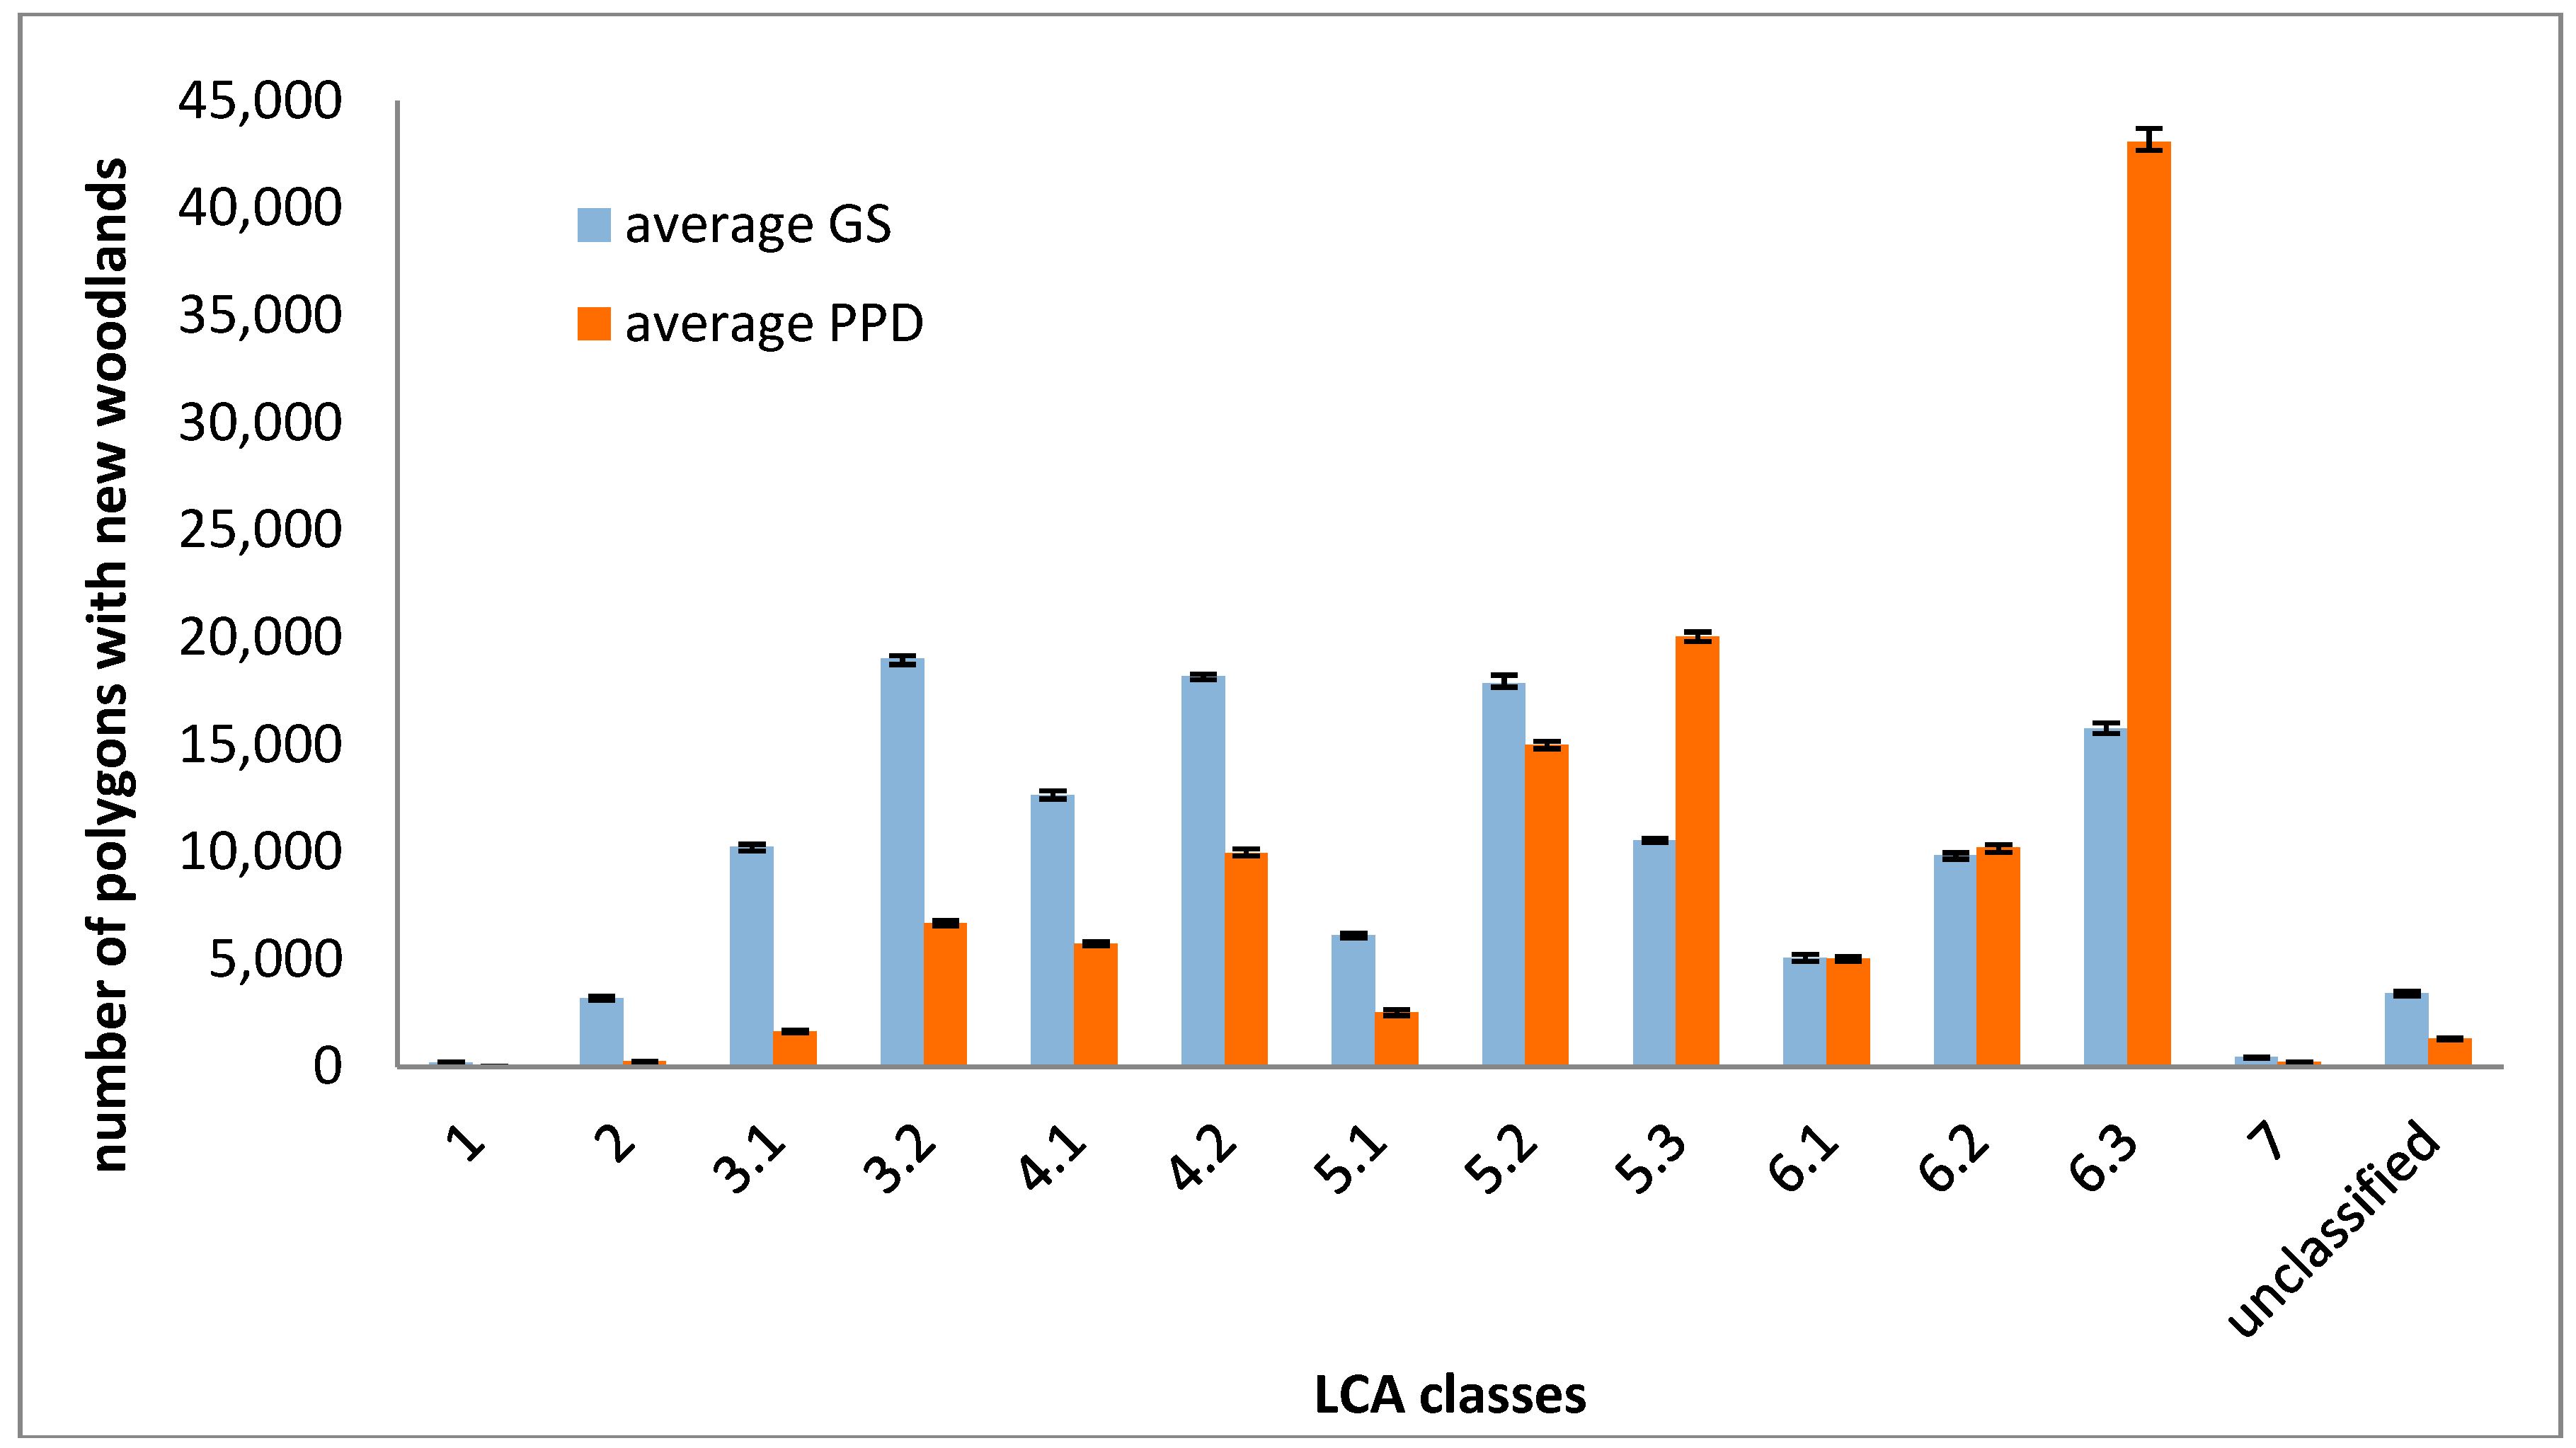
3.3. Future Scenarios

Future scenarios were used to explore different spatial and temporal pathways for woodland expansion from 2015 based either upon current trends or the Scottish Government target rate for new woodland of 10,000 ha∙yr−1. Areas of Scotland identified as having unsuitable biophysical conditions for new woodland due to unfavorable soils (lithosols, alpine soils, and bare rock) were masked through classification of the soil series map data [35]. In addition, the current policy constraint that new woodland planting was excluded from areas of deep peat (with a surface organic layer > 50 cm) was also enforced through a mask from soil series data.
The scenario generation process was facilitated by the use of the parcel-based LandSFACTS scenario toolkit to produce spatially-explicit scenario simulations (realizations) based upon a common set of rules and constraints for each scenario [38]. The stochastic simulation routine of LandSFACTS was chosen because it allows multiple solutions to a set of constraints and therefore avoids the problems in justifying complex land use allocation and transition phenomena based upon a single deterministic procedure [5,16]. Scenario simulations were generated in a transient mode thereby producing results for intermediate time-steps (2020, 2030, 2040) as well as a final 2050 land use change map. To achieve this, changing woodland proportions were used to apply a given woodland expansion rate for Scotland in conjunction with other spatial constraints assumed for new woodland in each scenario (e.g., land capability classes for BAU and PPD scenarios) and excluding masked areas (e.g., peat, prime agricultural land). Potential allocation of land use units to new woodland was controlled by transition matrices identifying possible land use changes and excluding those that are not possible (e.g., water; urban, existing woodland). The above specifications define a solution space for future possible changes for any given scenario. LandSFACTS was then run iteratively to find multiple realized simulations that meet the spatial constraints for woodland expansion in each scenario, with the median simulation identified based upon the proportion of cultivated/uncultivated land converted to new woodland. For the present study, a reference scenario and two other contrasting scenarios were created as follows:
(i)
Business as Usual (BAU)
This scenario was constructed based upon a forward projection of the path dependency for recent trends in woodland planting using the relationship between new woodland and LCA class mapping derived from Section 3.2. In recent years, the rate of woodland planting has been variable (Figure 1) with possible signs that the declining rate has been halted, therefore an average figure for the last 10 years (2004–2013) of 5500 ha∙yr−1 was used.
(ii)
Policy with Path Dependent behavior (PPD)
For this scenario, the simulations were constrained to generate the target woodland rate defined by policy (10,000 ha∙yr−1) based upon the same distribution of new woodland in LCA classes as occurred in the analysis of recent trends for the BAU scenario.
(iii)
Global Sustainability (GS)
The GS scenario was derived from a series of future land use change scenarios created for Scotland based upon interpretation of the IPCC Special Report on Emission Scenarios (SRES) framework [16]. It therefore provides a scenario broadly equivalent to IPCC SRES B1 with a storyline emphasizing governance for environmental sustainability through proactive land-use zoning and spatial planning including both climate change adaptation and mitigation responses. Hence, new woodland for this scenario is allocated at 10,000 ha∙yr−1 but excludes land classified as prime agricultural land (LCA class 1, 2, 31) as defined for 2050 but not excluding areas of drought risk [31] as irrigation water availability would be limited by strong regulation. This exclusion is in addition to those for biophysically unsuitable areas and deep peat soils.

3.4. Net GHG emissions from Land Use Change

The 2006 IPCC Revised Guidelines for National Greenhouse Gas Inventories provide guidance on compiling estimates of emissions and removals of greenhouse gases [39]. The types of methods available for agricultural and LULUCF GHG emissions quantification are default emission factors (Tier 1), hybrid approaches using process or empirical models to develop region-specific empirical equations with emission factors (Tier 2), or more detailed process-based models, and sampling and measurement to provide sub-regional estimates (Tier 3) [40]. These methods differ in their complexity, data requirements, aggregation level and uncertainty with higher tiers improving the accuracy of the inventory but also increasing the complexity and the resources required to compile it [39].
The present study has adopted a Tier 2 approach using representative country-defined emission factors derived from Morison et al. [41] to estimate the total GHG balance of a forest management cycle. Net stock carbon changes from GHG emissions and sequestration are an aggregation of changes in the living biomass (above and below ground), dead organic matter (dead wood and litter) and soil carbon pools. Morison et al. [41] compared net carbon changes of different management regimes for typical conifer (Sitka spruce) and broadleaved (oak) stands to derive emissions factors using the CSORT model. In 2011, Sitka spruce represented 58% of all conifers in Scottish forests and oak 10% of all broadleaves [36]. Loss of biomass from existing vegetation was excluded from the calculations as these were assumed to be relatively small compared to the changes in tree biomass at stand level.
Therefore, we distinguish changes in carbon stocks for two types of afforestation based upon default conversion from grassland-based land cover types (semi-natural habitats and improved grassland):
  • Upland-type afforestation exemplified by Yield Class 12 m3∙ha−1∙yr−1 (YC12) Sitka spruce on peaty gley soils (Table 2). These peaty gley soils are widespread in the uncultivated Scottish uplands and have acid and poorly drained characteristics with relatively high carbon stocks. Reported values for carbon fluxes and GHG emissions from afforestation of organic and organo-mineral soils vary widely and appear to show considerable spatial and temporal heterogeneity associated with a range of factors including the level of disturbance from drainage and ground preparation [42,43,44,45]. Using the indicative values provided by Morison et al. [41] allows large-scale generalization for interpretation in a policy context.
  • Lowland-type afforestation on grassland exemplified by Yield Class 4 m3∙ha−1∙yr−1 (YC4) oak on brown earth soils (Table 3). Brown earth soils are well drained soils with high levels of natural fertility and they mainly occur in the warmer and drier lowlands of eastern Scotland where they are often cultivated as arable land or improved grassland. As lowland afforestation can also include conversion from arable land then the rates for grassland conversion from Morison et al. [41] were also modified (Table 4) based on the meta-analysis of net LULUCF soil emissions of Dawson and Smith [46] by adding a default increment to represent additional sequestration potential on arable soils after establishment (2.2 t∙CO2∙ha−1∙yr−1).
Table 2. Carbon stock change factors data (in t∙CO2e∙ha−1∙yr−1) on YC12 Sitka spruce stands with (i) minimum intervention; and (ii) 35 year rotation with standard thinning and felling due to a land use change from grassland to forestry.
TypeEstablishment (0–5 years)Initial (5–25 years)Full Vigor (25–60 years)Full Source
Min intervention−23.0−0.59.5 ([41]: Table 5.12b)
35 yr rotation managed with standard thinning and felling−23.0−0.213.7*([41]: Table 5.13b)
* Only extends to year 35 as trees are then harvested. Positive values indicate sequestration, negative values indicate emission.
The data also provide modification of each afforestation type based upon different management options: (i) minimum intervention which involves managing the woodland as a carbon reserve; or (ii) through management for timber production including thinning and harvesting based upon a fixed rotation cycle. Management for timber production (option ii) also includes net emissions from forest operations through the cycle according to standard guidance [47] including emissions during harvesting and the substitution effect of wood over non-renewable resources in fuel (e.g., in heating systems) and construction; this does not occur with minimum intervention.
Assessment of net GHG emissions was therefore achieved by using the age profile of new trees planted each year from 2015 to 2050 based upon either recent planting rates (BAU) or a woodland planting rate of 10,000 ha−1∙yr−1. This planting rate was assigned to either upland afforestation (Sitka spruce) or lowland afforestation (oak) consistent with the proportions of cultivated/uncultivated land in the land use change scenarios.
Table 3. Carbon stock change factors data (in t∙CO2e∙ha−1∙yr−1) on YC4 oak stands with (i) minimum intervention; and (ii) 80 year rotation with standard thinning and felling due to a land use change from grassland to forestry.
TypeEstablishment (0–5 years)Initial (5–35 years)Full Vigour (35–60 years)Full Source
Min intervention8.13.34.9([41]: Table A8.3b)
80 yr rotation managed with standard thinning and felling8.83.96.3([41]: Table 8.4b)
Positive values indicate sequestration, negative values indicate emission.
Table 4. Carbon stock change factors data (in t∙CO2e∙ha−1∙yr−1) on YC4 oak stands with (i) minimum intervention; and (ii) 80 year rotation with standard thinning and felling due to a land use change from arable to forestry.
TypeEstablishment (0–5 years)Initial (5–35 years)Full Vigour (25–60 years)Full Source
Min intervention8.15.56.1Table 3 modified using [46]
80 yr rotation managed with standard thinning and felling8.86.18.5Table 3 modified using [46]
Positive values indicate sequestration, negative values indicate emission.

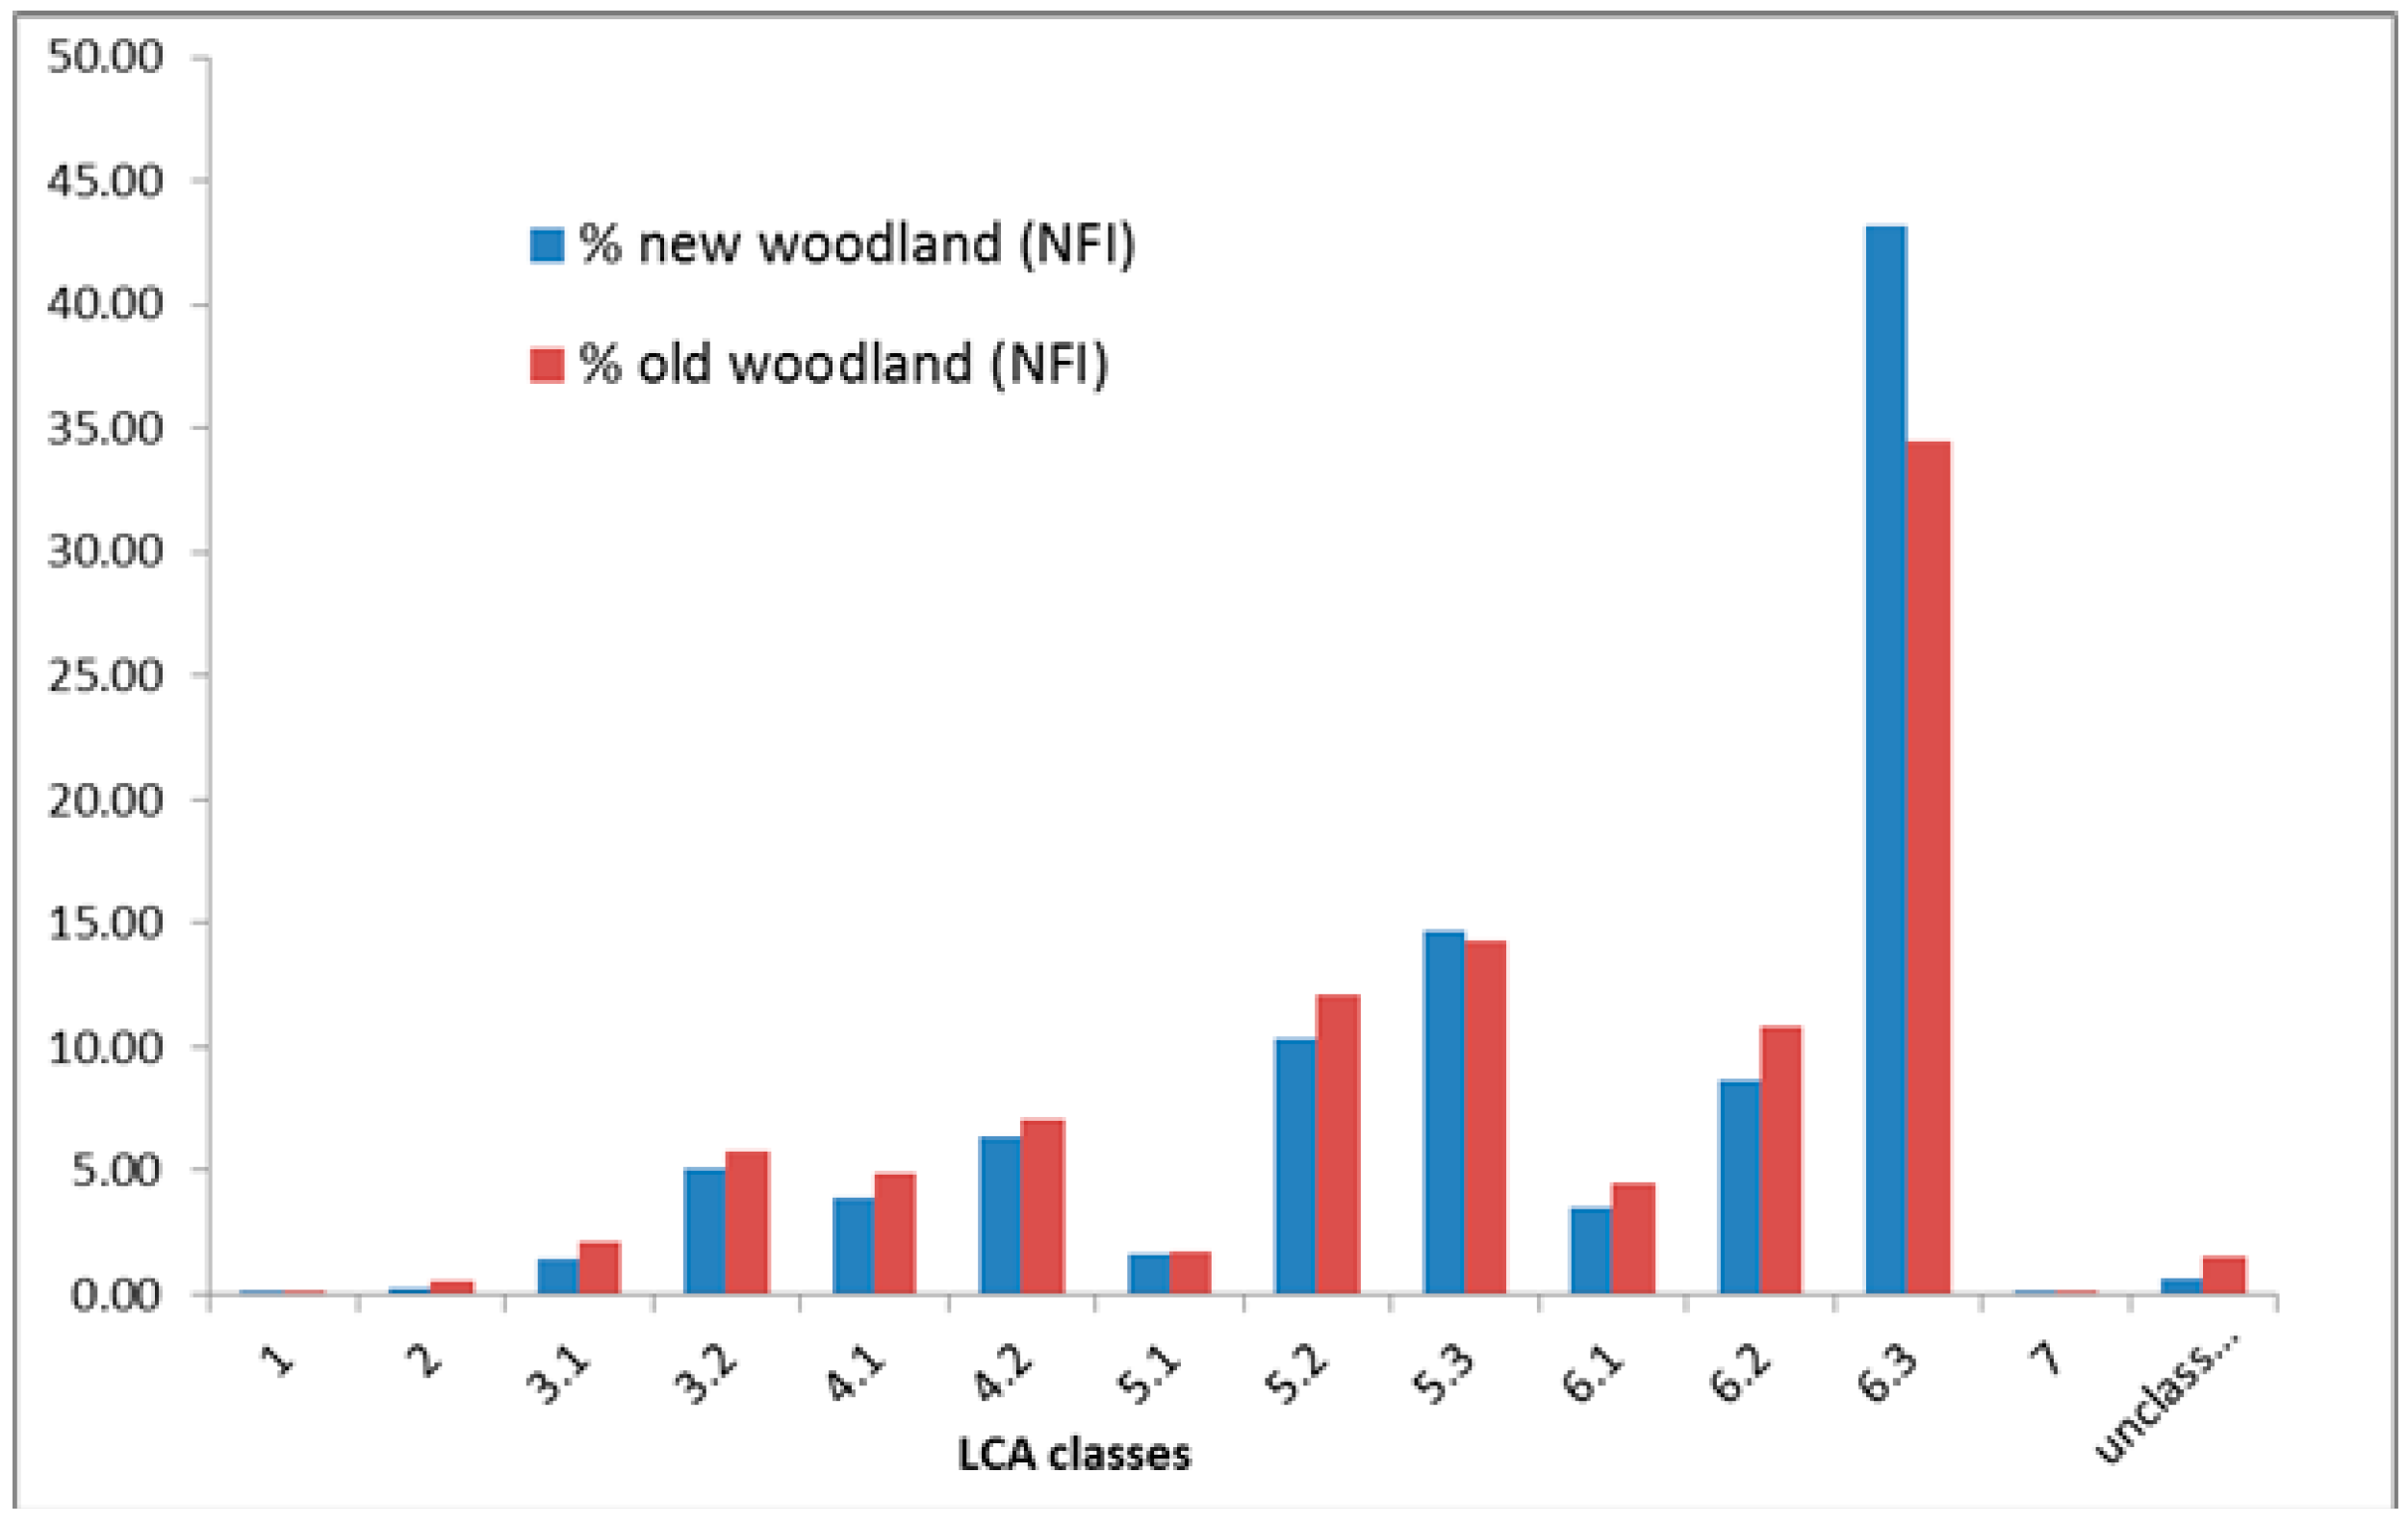
3.5. Habitat Patches

To evaluate other co-benefits from woodland expansion, the distribution of new woodland habitat patches was assessed based upon LCA classes to identify the role of new woodland in adding to habitat diversity through time. Fragstats software [48] was used to undertake analysis at 100 m resolution using 10 replicates for each land use change scenario to evaluate possible spatial differences based upon the time series for 2015–2050 represented by the transient scenarios.

4. Results

4.1. Current Land Use Trends

The average planting rate of new woodland from the NFI for 2004–2013 has been 5500 ha∙yr−1 (Figure 1). Analysis of the location of new planting showed that it has been distributed across the proportion of LCA classes shown in Figure 2 in comparison to existing woodlands. The general pattern is the same for existing and new woodland, suggesting the presence of the same influencing factors and the continued role of path dependence in their persistence. This shows an increasing proportion of new and existing woodland for the lower quality LCA classes with the highest proportion in class 6 (class 7 is generally unsuitable). Combined with this, there is also a discernible trend in the intra-class divisions (LCA classes 3/4/5/6) with an increasing proportion of new and existing woodland occurring in the lower quality subclass divisions. The trend in the subclasses is particularly well-represented by class 6 where subclass 63 has by far the highest proportion of new and existing woodland (43% of new woodland). Therefore in addition to the general pattern of more new and existing woodland on poorer quality land, the results when interpreted against the LCA subclasses suggest that more new and existing woodland has been planted on the wetter land and that with the poorest grazing quality, notably classes 53 and 63.
In terms of previous land uses, ca.75% of the new woodland has occurred on uncultivated land and ca. 25% on cultivated land, but the results from the LCA analysis suggest that even on the uncultivated land it is the poorer quality land that has been planted. With regard to the “squeezed middle” [27], these results indicate that more than 50% of new woodland has actually been “squeezed” out of this zone onto the poorest quality agricultural land. In addition, although the general pattern of new and existing woodland is similar (Figure 2), it also evident that there has been an increase in the proportions of new woodland on the poorer quality land (notably for class 63).
These results did not show major differences when new woodland was compared for the public forestry estate (land owned by the Forestry Commission) against other types of land ownership (mainly private sector with a small amount of land owned by NGOs and conservation agencies).
Figure 2. Proportion of new and existing woodland planted in each land capability class or subclass.
Land 03 00850 g002

4.2. Future Scenarios

The path dependency followed by the BAU scenario means that a large majority of the new woodland is planted in the uplands. A very similar pattern of change is inherited by the PPD scenario despite the increased planting rate to meet policy objectives because this scenario also inherits path dependent behavior (Figure 3). As a consequence, in both the BAU and PPD scenarios the dominant land use change is from uncultivated semi-natural land into woodland. By contrast, the GS scenario produces a greater proportion of lowland planting and as a result the new woodland replaces more cultivated land (improved grassland and arable). There is actually only a small proportion of new woodland simulated to occur in the same location (16%) in the example (median) simulations showing that they tend to produce divergent spatial patterns (Figure 3). The proportion of cultivated/uncultivated land converted to new woodland in the GS scenario depends on individual scenario realizations but the resulting median value is close to 50/50 compared to 25/75 as the ratio for the BAU and PPD scenarios. In terms of the species mix, as this was based upon the same ratios, this means that in terms of the two representative afforestation types (Section 3.4) then the oak/spruce species mix was considered as 25/75 for the BAU/PPD scenarios and 50/50 for the GS scenario. With regard to the cultivated land, the proportion of arable land converted to woodland in the GS scenario also varies depending on the scenario realization but the median value is close to 20%.
Figure 3. Areas of new woodland in example (median) simulations for PPD scenario and GS scenario.
Land 03 00850 g003

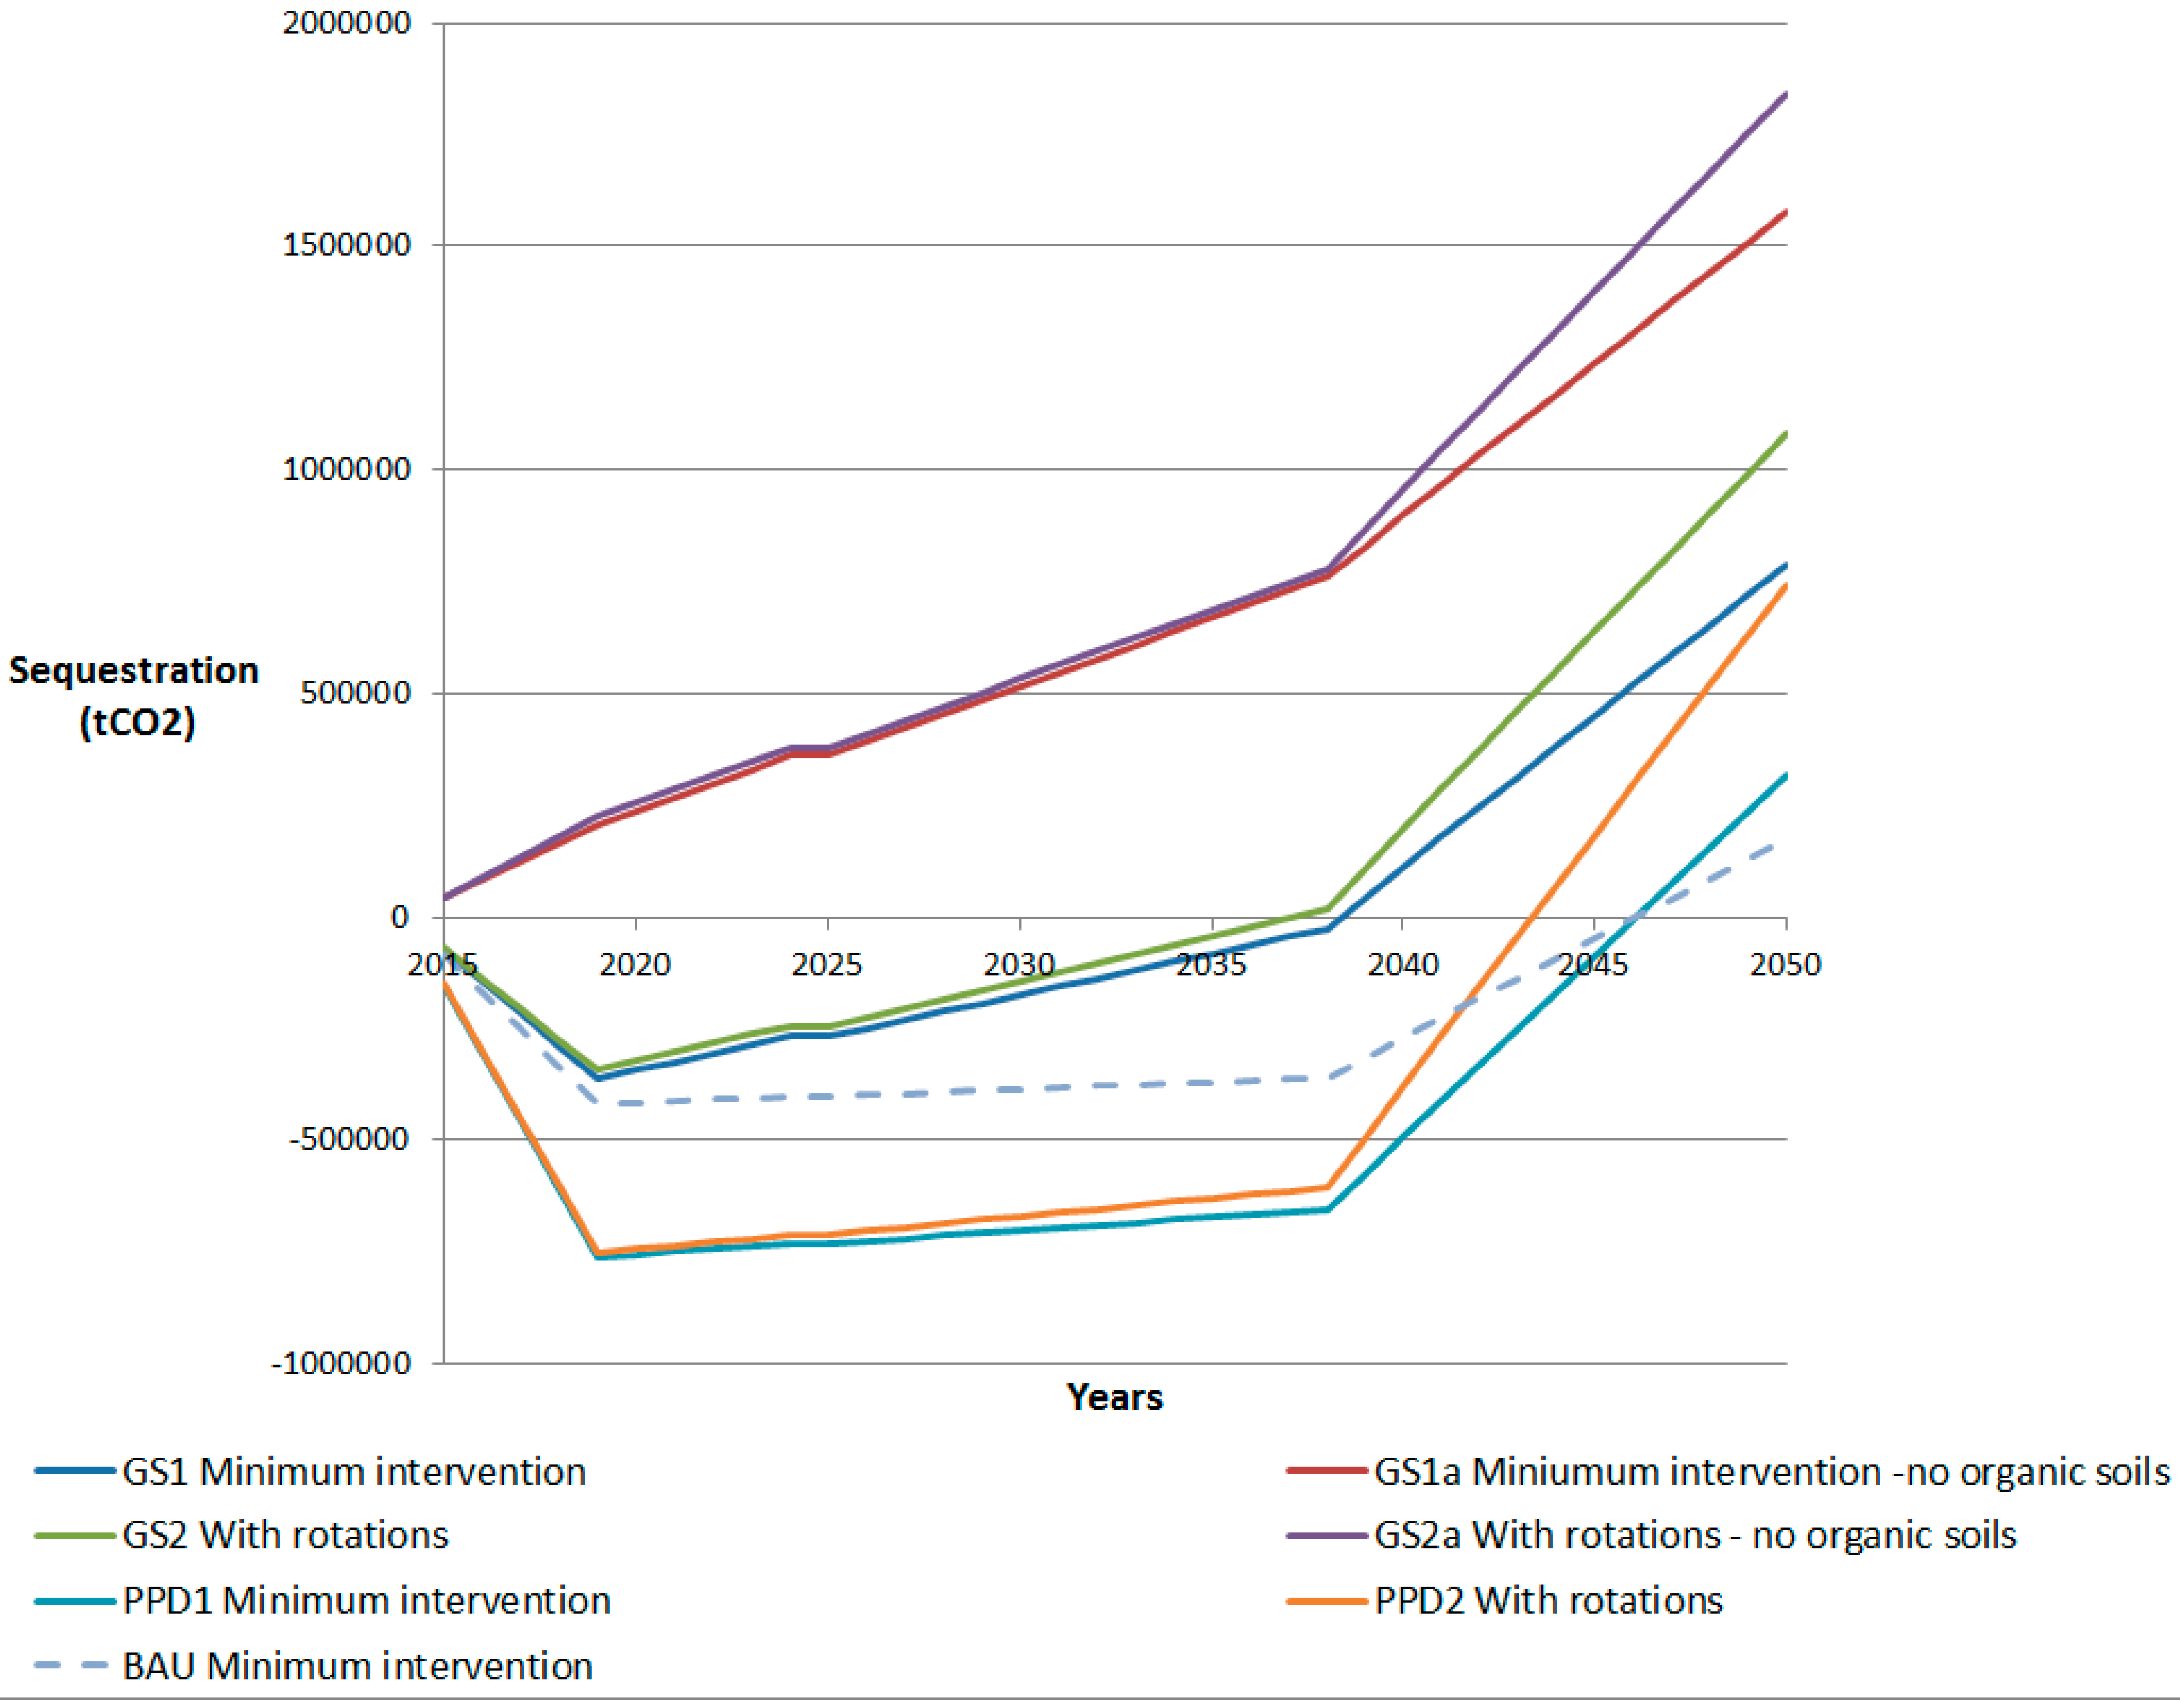
4.3. Net GHG Emissions from Land Use Change

Figure 4 shows the carbon dioxide (CO2) sequestration for seven afforestation scenario variants (BAU, PPD1, PPD2, GS1, GS2, GS1a, GS2b) until 2050. The BAU and PPD scenarios result in 75% afforestation in the uncultivated uplands (exemplified by Sitka spruce on peaty gley soils) and 25% afforestation in the lowlands (exemplified by oak on brown earth soils). The upland planting on wet soils that dominates the BAU and PPD scenarios is assumed to require ground preparation and drainage, which is associated with soil disturbance and significant carbon losses during establishment. As a consequence for afforestation in these scenarios, positive net carbon sequestration would only happen after some decades (i.e., post-2040). The PPD scenarios actually produce greater emissions than BAU in this intervening period because of the additional planting and assumed disturbance on upland soils. Compared to PPD1, PPD2 has an advantage because the felled and woody biomass would be used as direct or indirect substitution for non-renewable fossil fuels. This results in higher net carbon sequestration values in later decades as an offset to initial emissions and therefore a greater net sequestration benefit which is achieved a few years earlier in PPD2 compared to PPD1. Although not shown on Figure 4, similar benefits would occur with a rotation-based variant of BAU rather than minimum intervention.
Figure 4. Sequestration pathways for each scenario.
Land 03 00850 g004
The GS scenarios produce on average 50% upland afforestation and 50% lowland afforestation using the same species/soils exemplars. As the lowland type soils have considerably less C stocks than for the uplands, and hence it is assumed that carbon emissions are minimal during establishment, the changing proportions of afforestation types lead to a greater sequestration benefit in these scenarios. However, as the representative oak yield class (YC4) is three times lower than Sitka spruce yield class (YC12), a positive net carbon sequestration would only happen by around year 2037 (during the initial phase), although still earlier than in BAU and PPD scenarios. The difference between GS1 and GS2 results again from the wood substitution effect, as mentioned above for PPD1 and PPD2. It can be noted that by 2050, GS1 and PPD2 have similar net carbon sequestration which shows the advantages of fast-growing Sitka spruce in providing an extra substitution benefit at this stage.
Two further scenarios were created as variants GS1a and GS2a based on the above but also with a constraint that the 50% Sitka spruce planting would only occur on mineral soils. Most mineral soils occur in the lowlands of Scotland but they also occur in parts of the uplands therefore this represents a plausible scenario. These variants are assumed to incur no loss of soil carbon during the establishment phase in combination with planting trees of a higher yield class (Sitka spruce YC12) which results in a net positive carbon sequestration starting at the establishment phase. Net sequestration benefits in these variants are therefore realized from 2015 through to 2050. Once again, the advantage of GS2a in relation to GS1a is due to the substitution of intensive GHG emission fuels by harvested and felled woody biomass.
The total net sequestration benefit of the scenarios is summarized in Table 5. It should be noticed that by the year (2050) when total GHG emissions in Scotland are expected to reduce 80% in relation to 1990 levels, the total net carbon sequestration provided by new woodland in the BAU and PPD scenarios is still negative. By contrast the GS scenarios provide positive sequestration values with much greater benefits achieved in the variants (GS1a and GS2a) where carbon-rich soils are completely excluded from new planting schemes.
Table 5. Total net sequestration values by 2050 for each scenario variant.
Scenario VariantTotal Net Sequestration by 2050 (Mt CO2e)
BAU Minimum intervention−9.47
PPD1 Minimum intervention−17.21
PPD2 With rotations−13.58
GS1 Minimum intervention0.32
GS1a Minimum intervention—mineral soils only24.40
GS2 With rotations3.12
GS2a With rotations—mineral soils only26.62

4.4. Habitat Patches

Analysis of the distribution of new woodland patches per LCA class for scenarios based upon a planting rate of 10,000 ha∙yr−1 is presented in Figure 5. This indicates that the GS scenario produces a more even distribution of woodland patches across LCA classes compared to the PPD scenario (which is conditioned by the areal distribution in Figure 4). This would suggest that new woodland in the GS scenario, both broadleaf and coniferous, would add to habitat diversity across a range of environmental conditions, both lowland and upland, in combination with both cultivated and non-cultivated farmland. The distribution of new woodland across a range of LCA classes in the GS scenario is therefore rather dissimilar to recent trends in new woodland and already existing woodland (Figure 5). With further spatial targeting it could therefore potentially enhance woodland habitat networks, particularly in the cultivated lowlands.
Figure 5. Mean numbers of new woodland patches in the 10,000 ha∙yr−1 scenarios for LCA classes (error bars show maximum and minimum of realizations).
Land 03 00850 g005

5. Discussion

5.1. Interpretation of Recent Trends

The predominance for new woodland to occur mainly in the uplands of Scotland, on poorer quality agricultural land, and at a relatively low annual planting rate, despite the availability of forestry grants, indicates a reluctance to convert productive farmland into woodland. A range of socio-economic factors can explain this pattern. Firstly, a significant proportion of the land is occupied by tenant farmers who traditionally have had only limited rights to create or use woodland [49], many of whom have shorter term tenancy agreements [50] which also acts against an interest in tree planting. Agricultural land in Scotland also receives subsidy payments through the EU Common Agricultural Policy (CAP) and even though recent amendments have been made to woodland grants so that CAP payments are not necessarily lost, land managers are well aware that CAP programs can change, particularly in response to other drivers such as world food prices [51]. The preference for agricultural land rather than woodland can therefore be considered as a type of loss aversion in which the risk of losses influences behavior more greatly than potential gains [52]. In this case the potential loss would be to forego the regular income provided through CAP and agricultural production for the potential longer-term gains from woodland production. The longer time scale would be seen as particularly risky by some land managers, notably tenant farmers [53]. In addition, uptake of woodland grants is often hindered by factors such as the amount offered, fit with owners’ objectives, amount of paperwork, and availability of advice [21]. A further key factor is the importance of cultural issues: farmers typically identify themselves as food producers meaning that they prioritize land for food production, especially if it is a family farm, and maintaining the land in good condition is important for farm succession issues [54,55].
As a consequence, new woodland has been marginalized to less productive land which has important implications for climate change mitigation practices because they have to fit with the land made available by landholders rather than follow a notional technical optimum; similar findings are reported for Australia [56]. This is particularly important for Scotland because our analysis suggests that much new woodland is established on LCA class 63 and 53 which are on wetter soils. These would typically be organo-mineral soils such as peaty gleys or peaty podsols, as policy guidelines imply the use of deep peat is proscribed. Planting on wetter soils implies that drainage schemes have been extensively utilized to enable plantations to become established: this would be required to artificially introduce faster-growing non-native tree species into a wet environment to which they have not been adapted, either as part of the ground preparation or as separate open ditches. Although aggressive drainage ditching to prepare wet soils for forestry is uncommon now because it is not considered as good practice, even less intrusive drainage will tend to cause disturbance and encourage soil respiration through lowering of the water table, therefore causing at least temporary loss of carbon emissions [45,57].

5.2. Implications of Future Scenarios

Following the path dependency through both the BAU and PPD scenarios means that a large majority of new woodland would continue to be planted on wet upland soils. Nijnik et al. [58] have suggested that planting of fast growing trees such as Sitka spruce on low quality agricultural land is a cost-effective mechanism to sequester carbon. However, the same authors also recognize that emissions lost by soil disturbance are a critical factor. The present study highlights that if a large proportion of new planting occurs on wet upland carbon-rich soils, which would require some form of drainage, then this loss of emissions displaces the benefits from sequestration for decades until the early-planted trees reach full vigor and start to produce a net benefit. This has important implications for policy ambitions to meet GHG emissions reduction targets by set time periods. The length of the period before a net sequestration benefit is gained will strongly depend on the amount of carbon lost in the initial disturbance. The present study used an indicative value for loss of soil carbon from Morison et al. [41], which may be potentially reduced with less intrusive drainage, but the range of values reported in the literature suggests further research is required on this topic [44,45]. The benefits gained from forest harvesting and substitution of wood against other products only become apparent towards the end of first rotation cycle (35 years for Sitka spruce), therefore they can enhance the sequestration benefit but only help to meet emissions targets in later decades towards 2050.
The GS scenario shows the potential benefits gained from increased woodland planting in the lowlands when integrated with cultivated farmland. This scenario would be more successful in addressing GHG emissions targets, and indeed the rationale behind the scenario (IPCC B1) is that binding international agreements and strong governance are the drivers for land use planning and incentives [16]. However, a shift towards this scenario storyline currently seems rather distant in Scotland due to the legacy of socioeconomic and cultural factors that act to discourage new farm woodland as a major climate mitigation option without further significant policy intervention (Section 4.1). These issues are particularly exemplified by the scenario variants that reduced loss of soil carbon by planting only on mineral soils which emerged as the most important single factor from the scenario analysis. However such mineral soils will tend to be better quality (higher LCA class) land that has higher agricultural value, although some of this will be constrained by other biophysical factors that reduce land capability, notably climate and topography.
The GS scenario also highlights the potential advantages of an integrated proactive approach to climate change mitigation and adaptation. A changing climate provides new opportunities for woodland with some evidence that net primary productivity and tree growth may have already been enhanced (at least as a secondary variable) by raised CO2 levels which will become further elevated in the future [59]. However, future risks may also be increasingly manifest through drought risk which can particularly affect some species (e.g., Sitka spruce [60]). The mix of trees planted and the associated yield class are therefore key factors that are likely to be further modified in the future, identifying the need for further work to incorporate these as dynamic variables into the scenario analysis. For example a shift from YC12 to YC18 Sitka spruce or YC4 to YC8 oak could provide significantly enhanced sequestration benefits, depending on available land and associated soil types.
Important trade-offs and synergies therefore exist between forestry and agriculture which the GS scenario would seek to address to reduce GHG emissions. These include the management of drought-risk arable land when irrigation levels are unsustainable, indicating the need for alternative land use or management practices. A related issue is that continued potential improvements in LCA classes in Scotland due to climate change provides the potential scope for expansion or intensification of arable land [30] with consequent increases in GHG emissions. A broadbrush assessment of land-based carbon offsetting can be made using default emission factors for grassland to arable conversion (−3.7 to −6.2 t∙CO2∙ha−1∙yr−1 [46] with typical fertilizer application of −1 t∙CO2∙ha−1∙yr−1) and grassland to forestry conversion (0.37 t∙CO2∙ha−1∙yr−1 [46]) in addition to the sequestration value of woodland biomass for YC12 Sitka spruce (10 t∙CO2∙ha−1∙yr−1) or YC4 oak (4.1 t∙CO2∙ha−1∙yr−1) [61]. This would suggest that only ca. 0.5 ha of YC12 Sitka spruce would be required to offset 1 ha of new arable compared to ca. 1.0 ha of YC4 oak if arable expansion was to be made carbon neutral. However, the potential for offsetting would again be enhanced by higher yield classes although these would tend to be associated with the better quality soils and climatic conditions that favor agricultural production.
A further key issue is that woodland expansion potentially involves a range of multiple benefits in addition to carbon sequestration and that this relationship will change into the future too [16]. Land owners in Scotland who favor new woodland have objectives broadly similar to those for existing woodland, most notably conservation and landscape amenity, but also provision of sporting opportunities, or shelter [49,62,63]. This is consistent with general findings elsewhere that the majority of landowners do not interpret the benefits from forests in a narrow economic development context [64]. Incentives for carbon sequestration therefore need to be considered alongside these other benefits. The present study has explored woodland habitat connectivity as a key indicator of conservation and amenity value and shown that there is variation between scenarios in terms of enhanced connectivity from woodland expansion through time. This emphasizes the added value that may be gained from spatial targeting of incentives to maximize habitat connectivity (and other benefits) whilst also maximizing carbon sequestration, therefore addressing previous concerns regarding “carbon blinkers” [14]. It is also likely that the local benefits from forestry products, notably wood fuel, could be also enhanced, which may be especially useful in future in a volatile energy market [51].

5.3. Further Work

The methodology was designed to allow rapid iterative exploration of scenarios and management options to help ascertain key influences on effective and timely climate change responses. The variables that can be currently modified include land availability, species mix, yield class, management regime, and soil type. These variables interact therefore constraining or targeting one variable will then affects the others. Further work can explore the effect of variable combinations on GHG emissions and other co-benefits whilst also validating through the LandSFACTS toolkit whether enough land is actually available to realize this option. In addition, the prospect of exploring the influence of other external drivers through climate change and socioeconomic scenarios, such as through their influence on land capability, can allow the robustness of management options to be explored against future uncertainties. These management options may also include a range of other alternatives such as the development of a strong bioenergy sector based upon short forestry rotation cycles and fuel substitution.
Further work can also explore the sensitivity of the results to differences in the emission/sequestration factors adopted from Morison et al. [41], such as to include greater variety for different woodland types and soils. In this respect, the methodology is compatible with more detailed but resource-intensive analyses conducted using process-based models, such as the use of the ECOSSE model for afforestation of organic soils [65]. This may also include the impact of drought risk on yield class and sequestration rates for different woodland types. Emission/sequestration factors may also be dynamically modified to be consistent with climate change scenarios.
An important link exists between this research agenda and the development of efficient and effective incentives to encourage uptake of integrated climate change responses that are aligned with other co-benefits. In this context, there is currently a challenge reconciling the requirements of GHG emissions inventories and targets for international reporting with the need for a more flexible, responsive tool for policy analysis [66]. Hence, setting targets for woodland expansion as a key pillar of targets for GHG emissions reduction may be ineffective if the woodland targets are met by planting mainly on carbon-rich soils, or potential synergies with agriculture through bioenergy or agroforestry are neglected. A more systemic approach would therefore embed the advantages of spatial targeting and also aim to bridge the arbitrary distinction between current inventory structures and reporting requirements for the LULUCF and Agriculture sectors [67]. This may also incorporate key uncertainties with regard to the net carbon balance for woodland planting on different soils through a probabilistic decision-support tool [68]. Beyond this, further questions may be asked about the rationale of national GHG emissions targets if they are met by a change in land use that causes increased imports of agricultural products and hence transfer of GHG emissions to other countries and to international transport.

6. Conclusions

Current trends in woodland expansion for Scotland and their extrapolation into the future through path dependence imply that a large majority of new woodland will be in the wetter uplands. This reflects land managers’ prioritization of farmland over woodland on land that is of at least moderate agricultural quality. These priorities are partly shaped by economics, but are also as a legacy of embedded socio-cultural factors. Following this path dependence into the future with representative scenarios and indicative emission factors suggests that it may be several decades before new woodland provides net sequestration benefits, and possibly not in overall terms by 2050. This is because of the emissions from disturbance of carbon-rich soils in the uplands. These results suggest that the current policy in Scotland of increasing woodland planting to 10,000 ha∙yr−1 to meet climate policy goals may not be effective by itself without addressing other land use policy issues. These include the legacy effects of land tenure and the role of incentives or subsidies in both agriculture and forestry in influencing land manager behavior.
By contrast, variants of an alternative scenario (GS) show greater sequestration benefits by encouraging more lowland woodland planting that is on mineral soils without thick organic horizons. This demonstrates the advantages that could accrue through improved spatial targeting of woodland expansion. The greatest sequestration benefit was in variants where carbon-rich soils are completely excluded from new planting. The potential of spatial targeting could also be realized through other co-benefits (e.g., climate change adaptation; habitat networks). Timber harvesting and wood substitution effects from new woodland can become increasingly important after 2035.
The methodology outlined here facilitated rapid sensitivity testing of emission factors linked to multiple influencing factors which can complement more detailed process-based models. Economic and socio-cultural factors imply the future pathway will follow current trends rather than alternative possibilities such as in the GS scenarios, unless there are major shifts in these factors. A clear requirement also exists for improved knowledge of emissions factors linked to land use change and climate change, especially for soil carbon. This requisite knowledge could facilitate a more explicit targeting strategy to incentivize emissions reduction. A key step in this process, which may help to break path dependence, would be to link this knowledge with a monetary value for carbon storage that reflected its wider social value in regulating climate change. Decisions on managing the land for net sequestration benefit rather than emissions could then be passed to land managers to be integrated with other management decisions based upon local opportunities, thereby reducing transaction costs (cf. [69]). As a consequence, planting woodland on carbon-rich soils with net emissions would be discouraged and further co-benefits (e.g., local woodfuel) positively encouraged. Woodland expansion and climate change mitigation could then be linked to wider goals of adaptive land use systems for long term sustainability, facilitated by further transdisciplinary research to integrate policy goals with multiple societal benefits (e.g., [70]).

Acknowledgments

This research was funded by the Scottish Government Strategic Research Programme as a component of the Land Use theme.

Author Contributions

Iain Browndeveloped the original methodology and analytical framework. Marie Castellazzi analyzed land use trends and produced the scenarios. Diana Feliciano provided analysis of GHG emissions and interpretation of land manager motivations. All authors contributed to the writing of the paper.

Conflicts of Interest

The authors declare no conflict of interest.

References

  1. Lambin, E.F.; Turner, B.L.; Geist, H.J.; Agbola, S.B.; Angelsen, A.; Bruce, J.W. The causes of land-use and land-cover change: Moving beyond the myths. Glob. Environ. Chang. 2001, 11, 261–269. [Google Scholar] [CrossRef]
  2. Wilson, G.A. From productivism to post-productivism and back again? Exploring the unchanged natural and mental landscapes of European agriculture. Trans. Inst. Br. Geogr. 2001, 26, 77–102. [Google Scholar] [CrossRef]
  3. Bohnet, I. Assessing retrospective and prospective landscape change through the development of social profiles of landholders: A tool for improving land use planning and policy formulation. Landsc. Urban Plan. 2008, 88, 1–11. [Google Scholar] [CrossRef]
  4. Bürgi, M.; Hersperger, A.M.; Schneeberger, N. Driving forces of landscape change—Current and new directions. Landsc. Ecol. 2004, 19, 857–868. [Google Scholar] [CrossRef]
  5. Lambin, E.F.; Meyfroidt, P. Land use transitions: Socio-ecological feedback versus socio-economic change. Land Use Policy 2011, 27, 108–118. [Google Scholar]
  6. Read, D.J.; Freer-Smith, P.H.; Morison, J.I.L.; Hanley, N.; West, C.C.; Snowdon, P. Combating Climate Change—A role for UK Forests. An Assessment of the Potential of UK’s Trees and Woodlands to Mitigate and Adapt to Climate Change; The Stationery Office: Edinburgh, UK, 2009; p. 222. [Google Scholar]
  7. Misselbrook, T.H.; Cape, J.N.; Cardenas, L.M.; Chadwick, D.R.; Dragostis, U.; Hobbs, P.J.; Nemitz, E.; Reis, S.; Skiba, U.; Sutton, M.A. Key unknowns in estimating atmospheric emissions from UK land management. Atmos. Environ. 2010, 45, 1067–1074. [Google Scholar] [CrossRef]
  8. Feliciano, D.; Slee, B.; Hunter, C.; Smith, P. Estimating the contribution of rural land-uses to greenhouse gas emissions: A case study of North East Scotland. Environ. Sci. Policy 2013, 25, 36–49. [Google Scholar]
  9. Röder, M.; Thornley, P.; Campbell, G.; Bows-Larkin, A. Emissions associated with meeting the future global wheat demand: A case study of UK production under climate change constraints. Environ. Sci. Policy 2014, 39, 13–24. [Google Scholar] [CrossRef]
  10. The Royal Society of Edinburgh (RSE). Facing Up to Climate Change: Breaking the Barriers to a Low-Carbon Scotland; RSE: Edinburgh, UK, 2011. [Google Scholar]
  11. Swart, R.J.; Raes, F. Making integration of adaptation and mitigation work: Mainstreaming into sustainable development policies? Clim. Policy 2007, 7, 288–303. [Google Scholar]
  12. Goklany, I. Integrated strategies to reduce vulnerablity and advance adaptation, mitigation, and sustainable development. Mitig. Adapt. Strateg. Glob. Chang. 2007, 12, 755–786. [Google Scholar] [CrossRef]
  13. Biesbroek, R.; Swart, R. The mitigation-adaptation dichotomy and the role of spatial planning. Habitat Int. 2009, 33, 230–237. [Google Scholar] [CrossRef]
  14. Wynne-Jones, S. Carbon blinkers and policy blindness: The difficulties of “Growing our woodland in Wales”. Land Use Policy 2013, 32, 250–260. [Google Scholar]
  15. Feliciano, D.; Hunter, C.; Slee, B.; Smith, P. Selecting land-based mitigation practices to reduce GHG emissions from the rural land use sector: A case study of North East Scotland. J. Environ. Manag. 2013, 120, 93–104. [Google Scholar] [CrossRef]
  16. Brown, I.; Castellazzi, M. Scenario analysis for regional decision-making on sustainable multifunctional land uses. Reg. Environ. Chang. 2014, 14, 1357–1371. [Google Scholar] [CrossRef]
  17. Nelson, R.R.; Winter, S.G. An Evolutionary Theory of Economic Change; Harvard University Press: Cambridge, MA, USA, 1982. [Google Scholar]
  18. Martin, R.; Sunley, P. Path dependence and regional economic evolution. J. Econ. Geogr. 2006, 6, 395–437. [Google Scholar] [CrossRef]
  19. Chhetri, N.B.; Easterling, W.E.; Terando, A.; Mearns, L. Modeling path dependence in agricultural adaptation to climate variability and change. Ann. Assoc. Am. Geogr. 2010, 100, 894–907. [Google Scholar] [CrossRef]
  20. Slee, B.; Brown, I.; Donnelly, D.; Gordon, I.; Matthews, K.; Towers, W. The squeezed middle: Evaluating options for intermediate quality land in Scotland. Land Use Policy 2014, in press. [Google Scholar]
  21. Angus, A.; Burgess, P.J.; Morris, J.; Lingard, J. Agriculture and land use: Demand for and supply of agricultural commodities, characteristics of the farming and food industries, and implications for land use in the UK. Land Use Policy 2009, 26, S230–S242. [Google Scholar] [CrossRef]
  22. Lawrence, A.; Dandy, N. Private landowners’ approaches to planting and managing forests in the UK: What’s the evidence? Land Use Policy 2014, 36, 351–360. [Google Scholar]
  23. Pan, D.; Domon, G.; de Blois, S.; Bouchard, A. Temporal (1958–1993) and spatial patterns of land use changes in Haut-Saint- Laurent (Quebec, Canada) and their relation to landscape physical attributes. Landsc. Ecol. 1999, 14, 35–52. [Google Scholar] [CrossRef]
  24. Malcolm, H.; Moxley, J.; Buys, G.; Hallsworth, S.; Thomson, A. Projections to 2050 of Emissions and Removals from the LULUCF Sector in Scotland, England, Wales and Northern Ireland; Report for the Department of Energy and Climate Change (DECC): London, UK, 2014.
  25. Scottish Government. Getting the Best from Our Land: A Land Use Strategy for Scotland; APS Group Scotland: Edinburgh, UK, 2010.
  26. Scottish Government. Low Carbon Scotland: Meeting the Emissions Reduction Targets 2011–2022; The Report on Proposals and Policies; Scottish Government: Edinburgh, UK, 2011.
  27. Scottish Government. Climate Change Delivery Plan: Meeting Scotland’s Statutory Targets; Scottish Government: Edinburgh, UK, 2009.
  28. Woodland Expansion Advisory Group. Report to the Scottish Government. 2012. Available online: http://scotland.forestry.gov.uk/images/corporate/pdf/WEAGFinalReport.pdf (accessed on 1 May 2014). [Google Scholar]
  29. Bibby, J.S.; Douglas, H.A.; Thomasson, A.J.; Robertson, J.S. Land Capability Classification for Agriculture; Macaulay Land-use Research Institute: Aberdeen, UK, 1982. [Google Scholar]
  30. Brown, I.; Towers, W.; Rivington, M.; Black, H.I.J. Influence of climate change on agricultural land-use potential: Adapting and updating the land capability system for Scotland. Clim. Res. 2008, 37, 43–57. [Google Scholar] [CrossRef]
  31. Brown, I.; Poggio, L.; Gimona, A.; Castellazzi, M.S. Climate change, drought risk and land capability for agriculture: Implications for land-use policy in Scotland. Reg. Environ. Chang. 2011, 11, 503–518. [Google Scholar]
  32. National Forest Inventory (NFI) 2012. Available online: http://www.forestry.gov.uk/inventory (accessed on 5 May 2014).
  33. Pohl, C. From science to policy through transdisciplinary research. Environ. Sci. Policy 2008, 11, 46–53. [Google Scholar] [CrossRef]
  34. Godet, M. Scenarios and Strategic Management; Butterworth: London, UK, 1987. [Google Scholar]
  35. Houet, T.; Loveland, T.R.; Hubert-Moy, L.; Gaucherel, C.; Napton, D.; Barnes, C.A.; Sayler, K. Exploring subtle land use and land cover changes: A framework for future landscape studies. Landsc. Ecol. 2010, 25, 249–266. [Google Scholar] [CrossRef] [Green Version]
  36. Scotland’s Soils: Soil Maps and Data. Available online: http://www.soils-scotland.gov.uk/data/ (accessed on 7 May 2014).
  37. Morton, D.; Rowland, C.; Wood, C.; Meek, L.; Marston, C.; Smith, G.; Wadsworth, R.; Simpson, I.C. Final Report for LCM2007—The New UK Land Cover Map. Report of CEH Project Number: C03259. 2011. Available online: http://www.ceh.ac.uk/documents/lcm2007finalreport.pdf (accessed on 22 July 2014).
  38. Castellazzi, M.S.; Matthews, J.; Angevin, F.; Sausse, C.; Wood, G.A.; Burgess, P.J.; Brown, I.; Conrad, K.F.; Perry, J.N. Simulation scenarios of spatio-temporal arrangement of crops at the landscape scale. Environ. Model. Softw. 2010, 25, 1881–1889. [Google Scholar] [CrossRef]
  39. Intergovernmental Panel on Climate Change (IPCC). Available online: http://www.ipcc-nggip.iges.or.jp/public/2006gl/index.html (accessed on 2 May 2014).
  40. Hillier, J.; Walter, C.; Malin, D.; Garcia-Suarez, T.; Canals, L.; Smith, P. A farm-focused calculator for emissions from crop and livestock production. Environ. Model. Softw. 2011, 26, 1070–1078. [Google Scholar] [CrossRef]
  41. Morison, J.I.L.; Matthews, R.; Miller, G.; Perks, M.; Randle, T.; Vanguelova, E.; White, M.; Yamulki, S. Understanding the Carbon and Greenhouse Gas Balance of Forests in Britain; Forestry Commission Research Report 18; 2012; p. 149. Available online: http://www.forestry.gov.uk/pdf/FCRP018.pdf/$FILE/FCRP018.pdf (accessed on 21 July 2014).
  42. Minkkinen, K.; Laine, J. Long-term effect of forest drainage on the peat carbon stores of pine mires in Finland. Can. J. For. Res. 1998, 28, 1267–1275. [Google Scholar]
  43. Hargreaves, K.J.; Milne, R.; Cannell, M.G.R. Carbon balance of afforested peatland in Scotland. Forestry 2003, 76, 299–317. [Google Scholar] [CrossRef]
  44. Reynolds, B. Implications of changing from grazed or semi-natural vegetation to forestry for carbon stores and fluxes in upland organo-mineral soils in the UK. Hydrol. Earth Syst. Sci. 2007, 11, 61–76. [Google Scholar] [CrossRef]
  45. Morison, J.; Vanguelova, E.I.; Broadmeadow, S.; Perks, M.; Yamulki, S.; Randle, T. Understanding the GHG Implications of Forestry on Peat Soils in Scotland; The Research Agency of Forestry Commission: London, UK, 2010. Available online: http://www.forestry.gov.uk/forestry_peat_GHG./FCS_forestry_peat_GHG_final_Oct13_2010.pdf (accessed on 6 May 2014).
  46. Dawson, J.J.C.; Smith, P. Carbon losses from soil and its consequences for land-use management. Sci. Total Environ. 2007, 382, 165–190. [Google Scholar] [CrossRef] [PubMed]
  47. Edwards, P.N.; Christie, J.M. Yield Models for Forest Management; Forestry Commission Booklet: London, UK, 1981.
  48. McGarigal, K.; Cushman, S.A.; Neel, M.C.; Ene, E. FRAGSTATS: Spatial Pattern Analysis Program for Categorical Maps. Available online: www.umass.edu/landeco/research/fragstats/fragstats.html (accessed on 5 May 2014).
  49. Crabtree, B.; Chalmers, N.; Eiser, D. Voluntary incentive schemes for farm forestry: Uptake, policy effectiveness and employment impacts. Forestry 2001, 74, 455–465. [Google Scholar] [CrossRef]
  50. Munton, R. Rural land ownership in the United Kingdom: Changing patterns and future possibilities for land use. Land Use Policy 2009, 26, S54–S61. [Google Scholar] [CrossRef]
  51. Slee, B.; Feliciano, D.; Nijnik, M.; Pajot, G. The scope of the land-based sector to mitigate climate change in North-East Scotland: Opportunities and challenges with particular reference to the role of forests. Int. J. Environ. Sustain. Dev. 2012, 11, 274–292. [Google Scholar] [CrossRef]
  52. Kahneman, D.; Tversky, A. Choices, values, and frames. Am. Psychol. 1984, 39, 341–350. [Google Scholar] [CrossRef]
  53. Ilbery, B.; Maye, D.; Watts, D.; Holloway, L. Property matters: Agricultural restructuring and changing landlord–tenant relationships in England. Geoforum 2010, 41, 423–434. [Google Scholar] [CrossRef]
  54. Burton, R. See through the “good farmer’s” eyes: Towards developing an understanding of the social symbolic value of productivist behaviour. Sociol. Rural. 2004, 44, 195. [Google Scholar]
  55. Burton, R.J.F.; Kuczera, C.; Schwarz, G. Exploring farmers’ cultural resistance to voluntary agri-environmental schemes. Sociol. Rural. 2008, 48, 16–37. [Google Scholar]
  56. Schirmer, J.; Bull, L. Assessing the likelihood of widespread landholder adoption of afforestation and reforestation projects. Glob. Environ. Chang. 2014, 24, 306–320. [Google Scholar]
  57. Laiho, R. Decomposition in peatlands: Reconciling seemingly contrasting results on the impacts of lowered water levels. Soil Biol. Biochem. 2006, 38, 2011–2024. [Google Scholar] [CrossRef]
  58. Nijnik, M.; Pajot, G.; Moffat, A.; Slee, B. An economic analysis of the establishment of forest plantations in the United Kingdom to mitigate climatic change. For. Policy Econ. 2013, 26, 34–42. [Google Scholar]
  59. Kahle, H.-P. Causes and Consequences of Recent Forest Growth Trends in Europe; European Forest Institute: Joensuu, Finland, 2008. Available online: http://www.efi.int/portal/virtual_library/publications/research_”reports/21/ (accessed on 6 May 2014).
  60. Green, S.; Hendry, S.J.; Redfern, D.B. Drought damage to pole-stage Sitka spruce and other conifers in North-East Scotland. Scott. For. 2008, 62, 10–18. [Google Scholar]
  61. Glynn, M.; Richardson, W.; Anable, J.; Quick, T.; Rowcroft, P.; Smith, S. Independent Panel on Forestry Woodland Owner Survey; Final Report to the Independent Panel on Forestry; URS Corporation: London, UK, 2012. [Google Scholar]
  62. Broadmeadow, M.; Matthews, R. Forests, Carbon and Climate Change: The UK Contribution. Information Note 48; Forestry Commission: Edinburgh, UK, 2003.
  63. Lozada-Vasquez, L.M. Co-Operation and Co-Ordination for Landscape Scale Conservation. Ph.D. Thesis, University of Birmingham, West Midlands, UK, 2012. [Google Scholar]
  64. Elands, B.H.M.; Praestholm, S. Landowners’ perspectives on the rural future and the role of forests across Europe. J. Rural. Stud. 2008, 24, 72–85. [Google Scholar]
  65. Ellison, D.; Lundblad, M.; Petersson, H. Carbon accounting and the climate politics of forestry. Environ. Sci. Policy 2011, 14, 1062–1078. [Google Scholar] [CrossRef]
  66. Smith, J.; Gottschalk, P.; Bellarby, J.; Chapman, S.; Lilly, A.; Towers, W.; Bell, J.; Coleman, K.; Nayak, D.; Richards, M.; et al. Estimating changes in Scottish soil carbon stocks using ECOSSE. II: Application. Clim. Res. 2010, 45, 193–205. [Google Scholar] [CrossRef]
  67. Bell, M.; Cloy, J.M.; Rees, R.M. The true extent of agriculture’s contribution to national greenhouse gas emissions. Environ. Sci. Policy 2014, 39, 1–12. [Google Scholar] [CrossRef]
  68. Worrall, F.; Bell, M.J.; Bhogal, A. Assessing the probability of carbon and greenhouse gas benefit from the management of peat soils. Sci. Total Environ. 2010, 13, 2657–2666. [Google Scholar] [CrossRef]
  69. Van Kooten, G.C.; Shaikh, S.L.; Suchanek, P. Mitigating climate change by planting trees: The transaction costs trap. Land Econ. 2002, 78, 559–572. [Google Scholar] [CrossRef]
  70. Turner, B.L., II; Janetos, A.C.; Verburg, P.H.; Murray, A.T. Land system architecture: Using land systems to adapt and mitigate global environmental change. Glob. Environ. Chang. 2013, 23, 395–397. [Google Scholar] [CrossRef]

