The Effects of Land-Use Change from Grassland to Miscanthus x giganteus on Soil N2O Emissions

Abstract
:1. Introduction
2. Materials and Methods
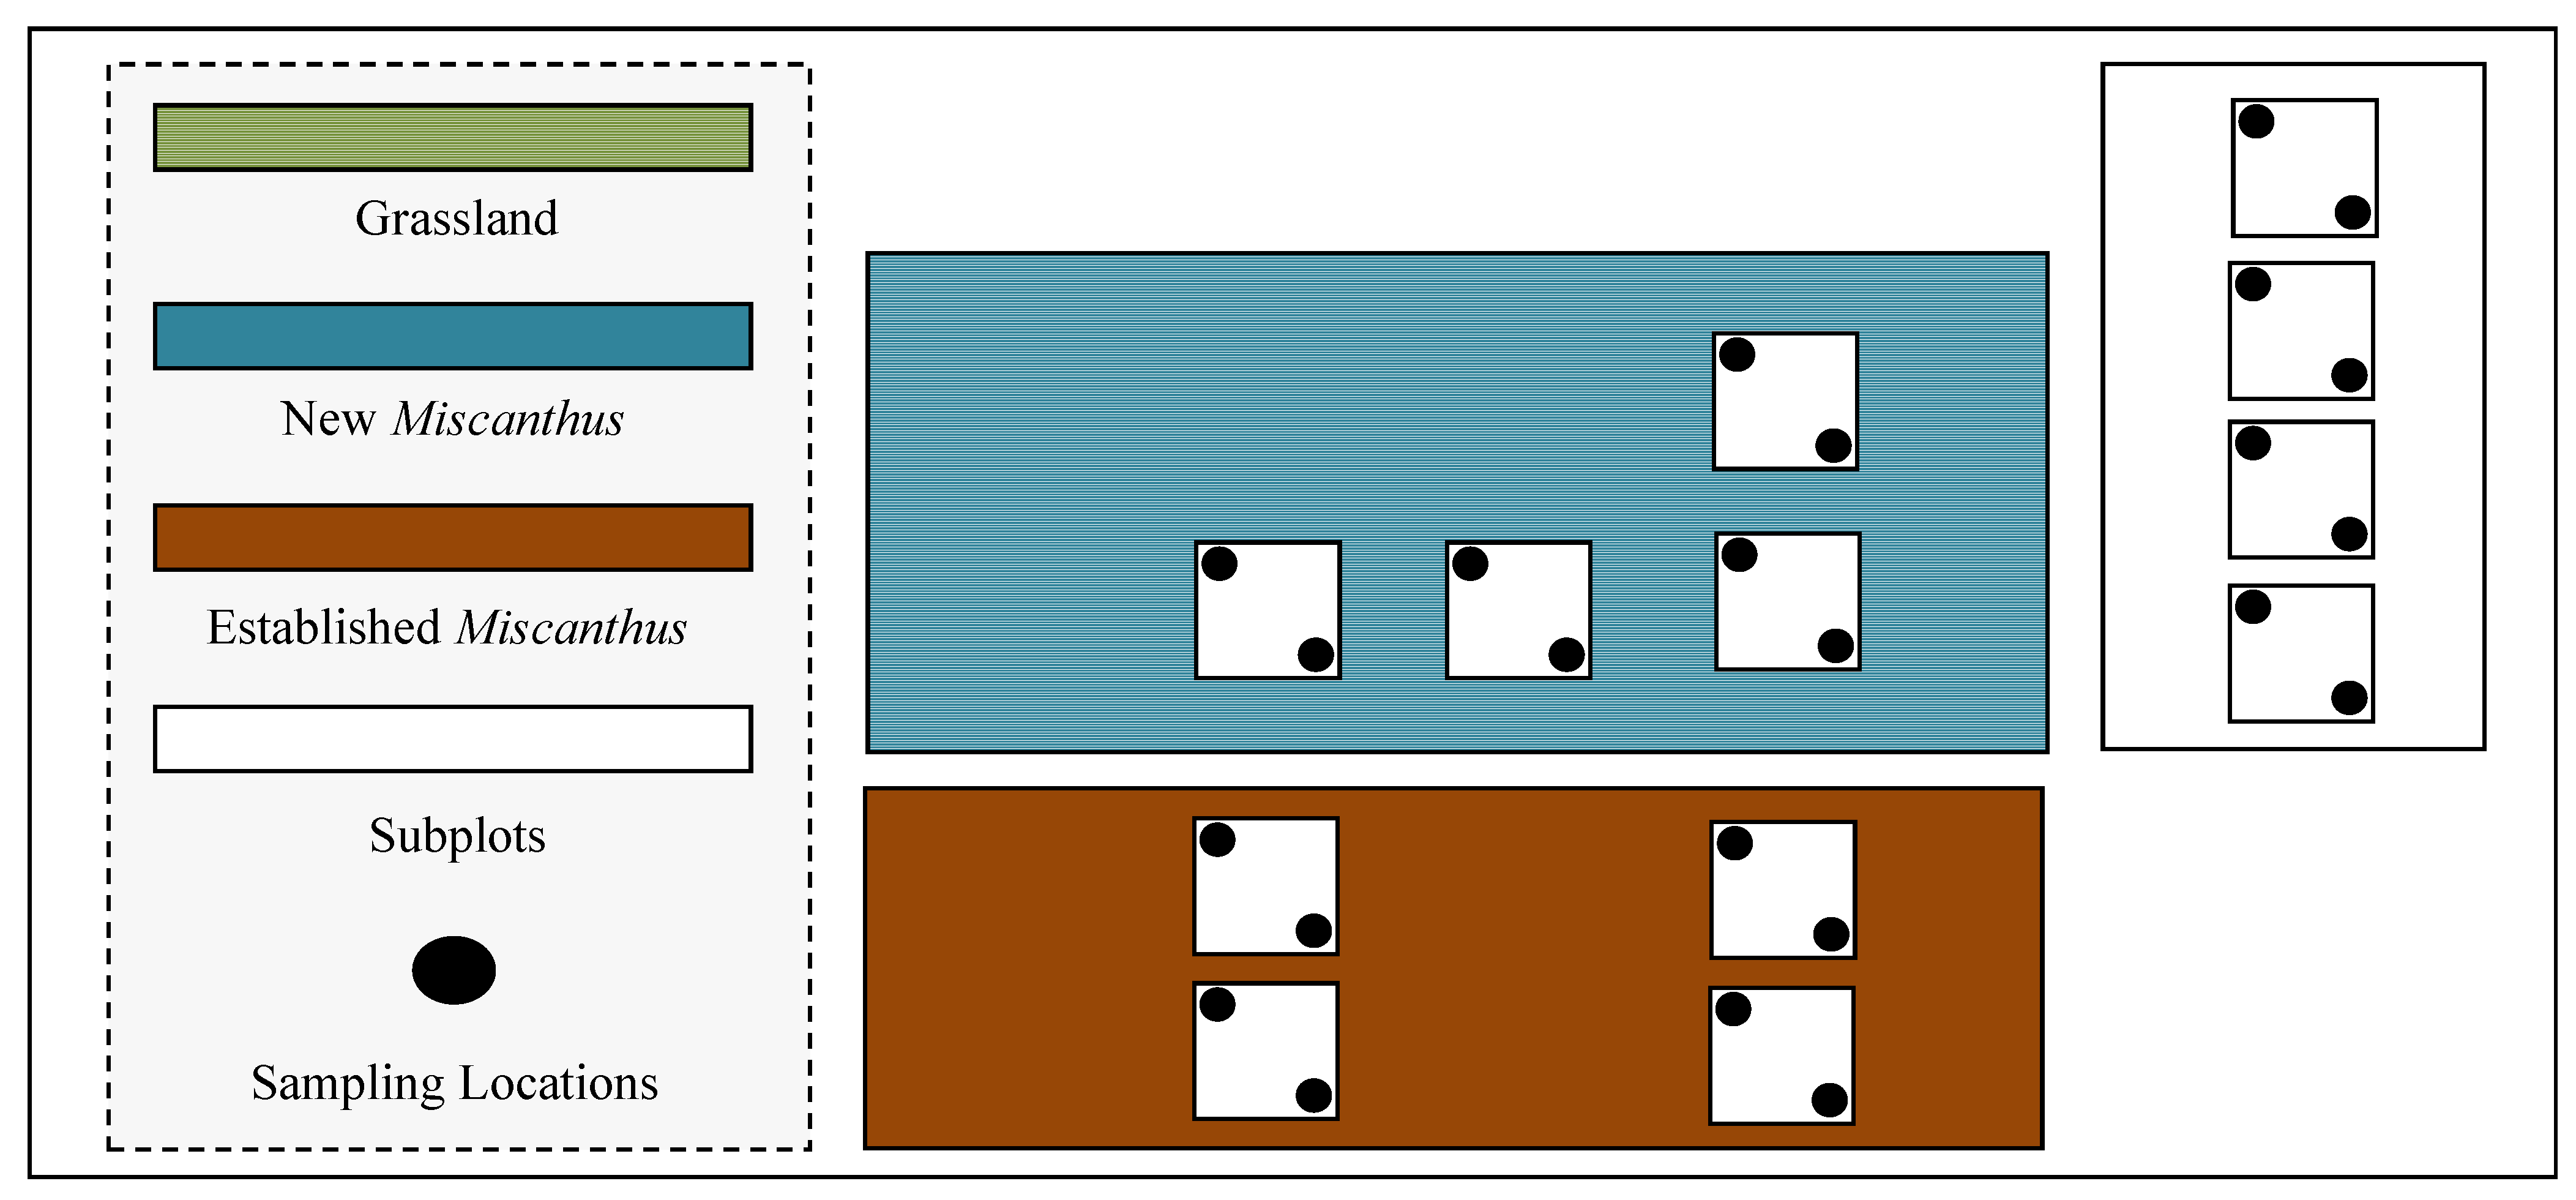
2.1. Site Description

2.2. N2O Emissions
2.3. Ancillary Measurements
2.4. Statistical Analysis
3. Results
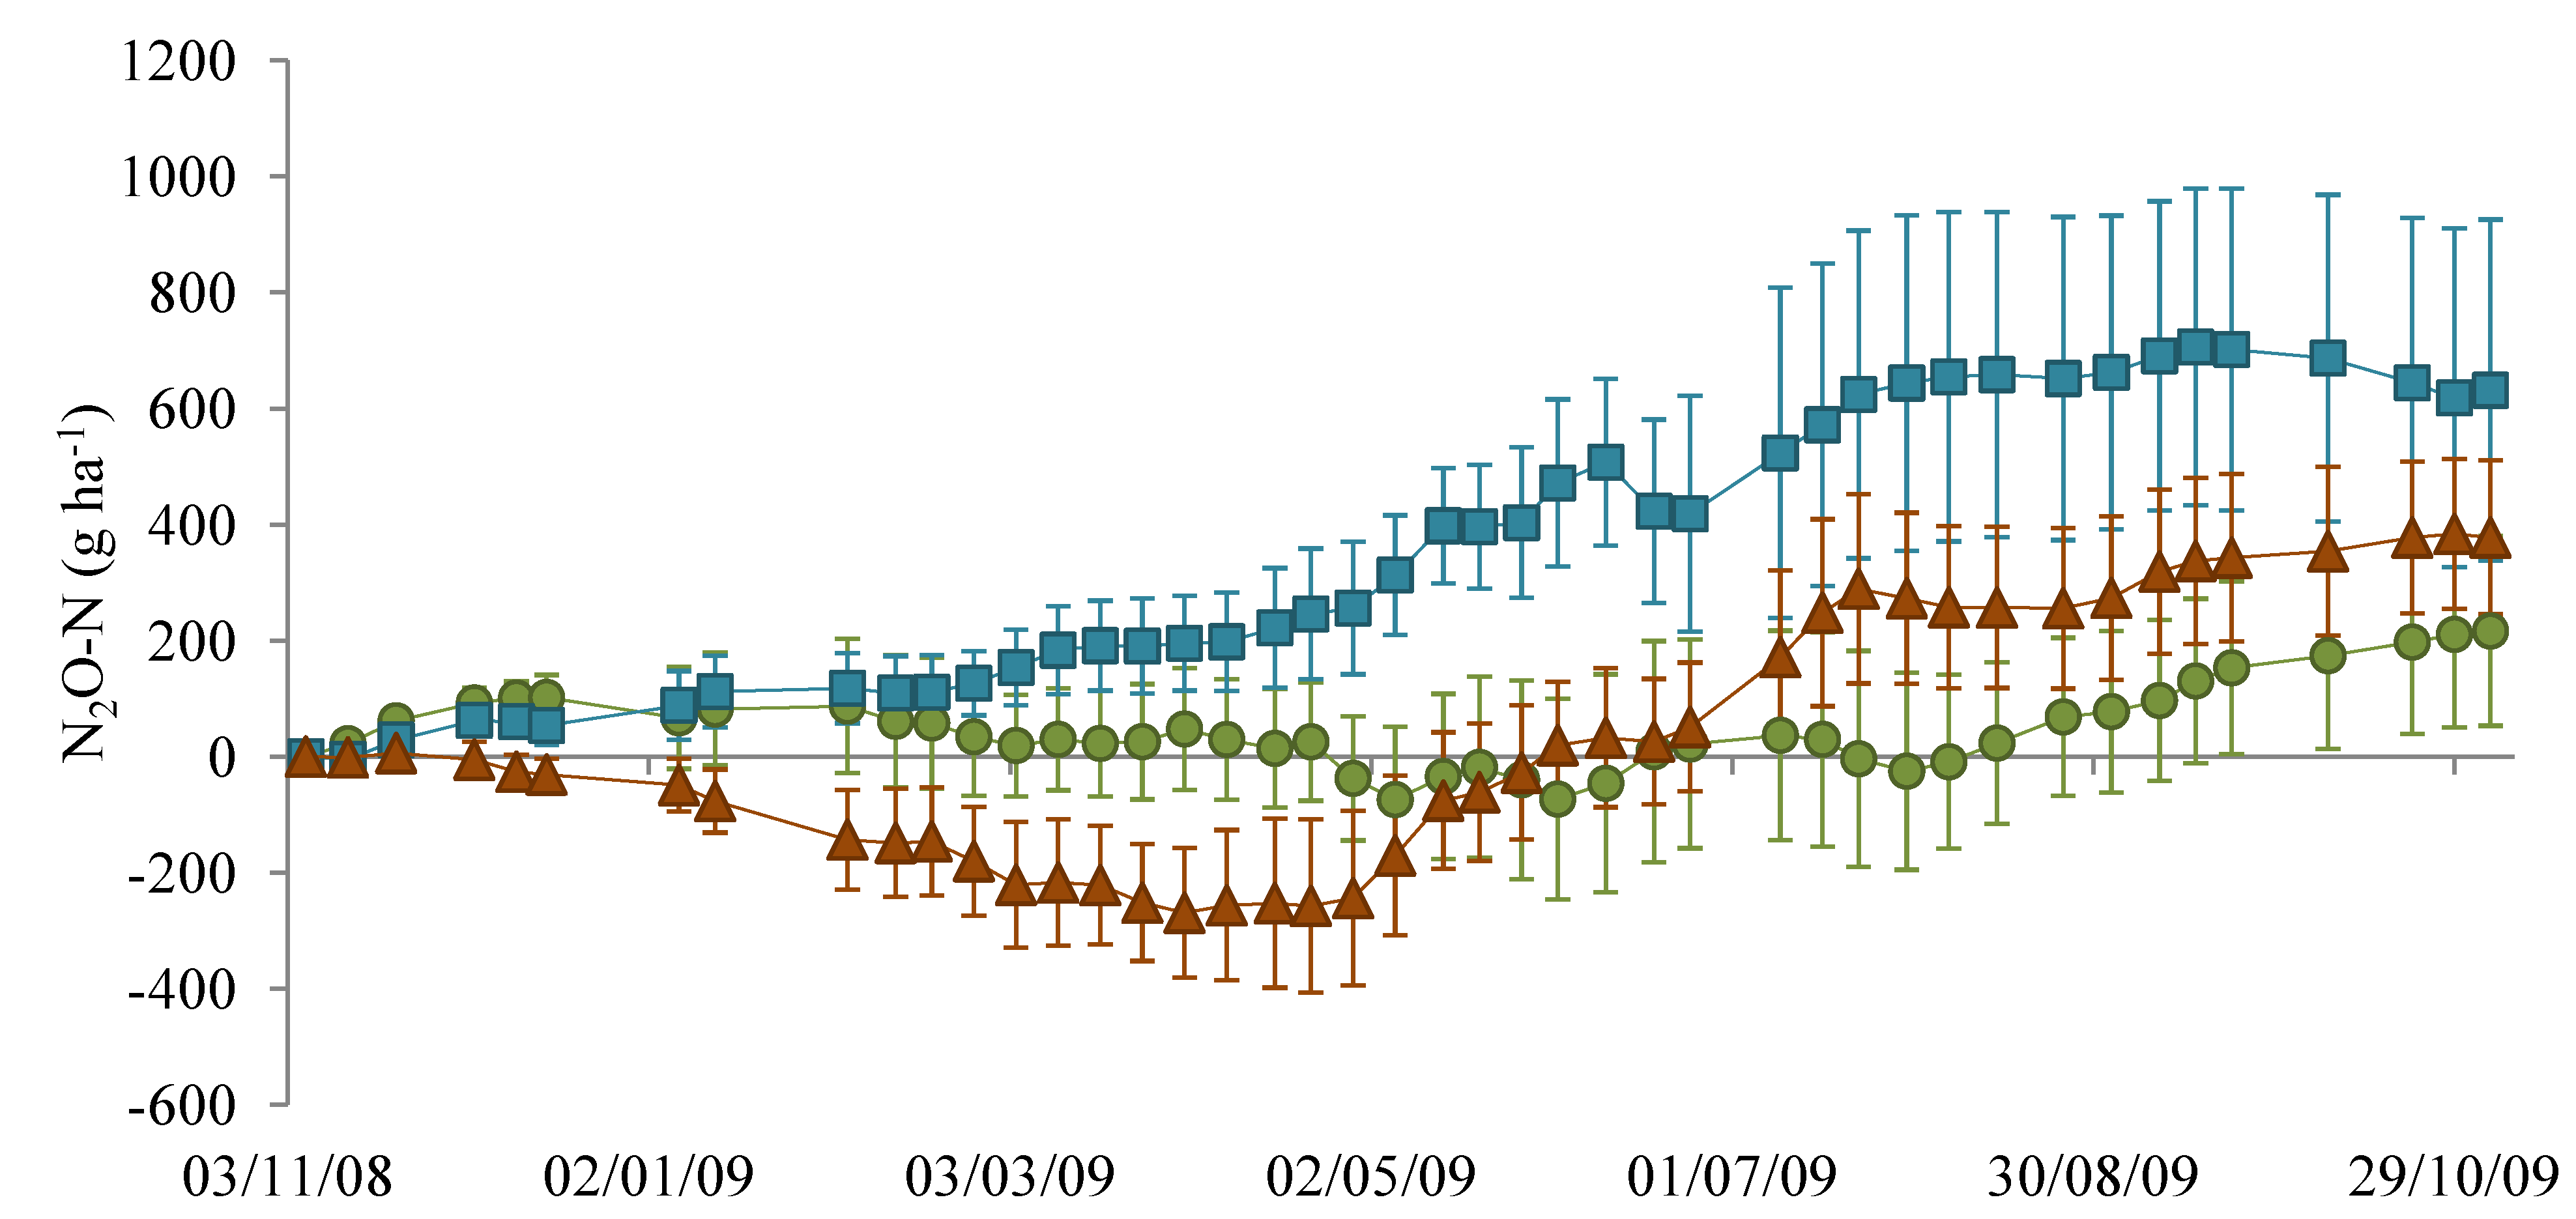
3.1. Nitrous Oxide Flux
 ), NM (
  ) and EM (
  ). Lines indicate the dates 22 April 2009 and 22 July 2009.
), NM ( ) and EM ( ). Lines indicate the dates 22 April 2009 and 22 July 2009.
). Lines indicate the dates 22 April 2009 and 22 July 2009.
), NM ( ) and EM ( ). Lines indicate the dates 22 April 2009 and 22 July 2009.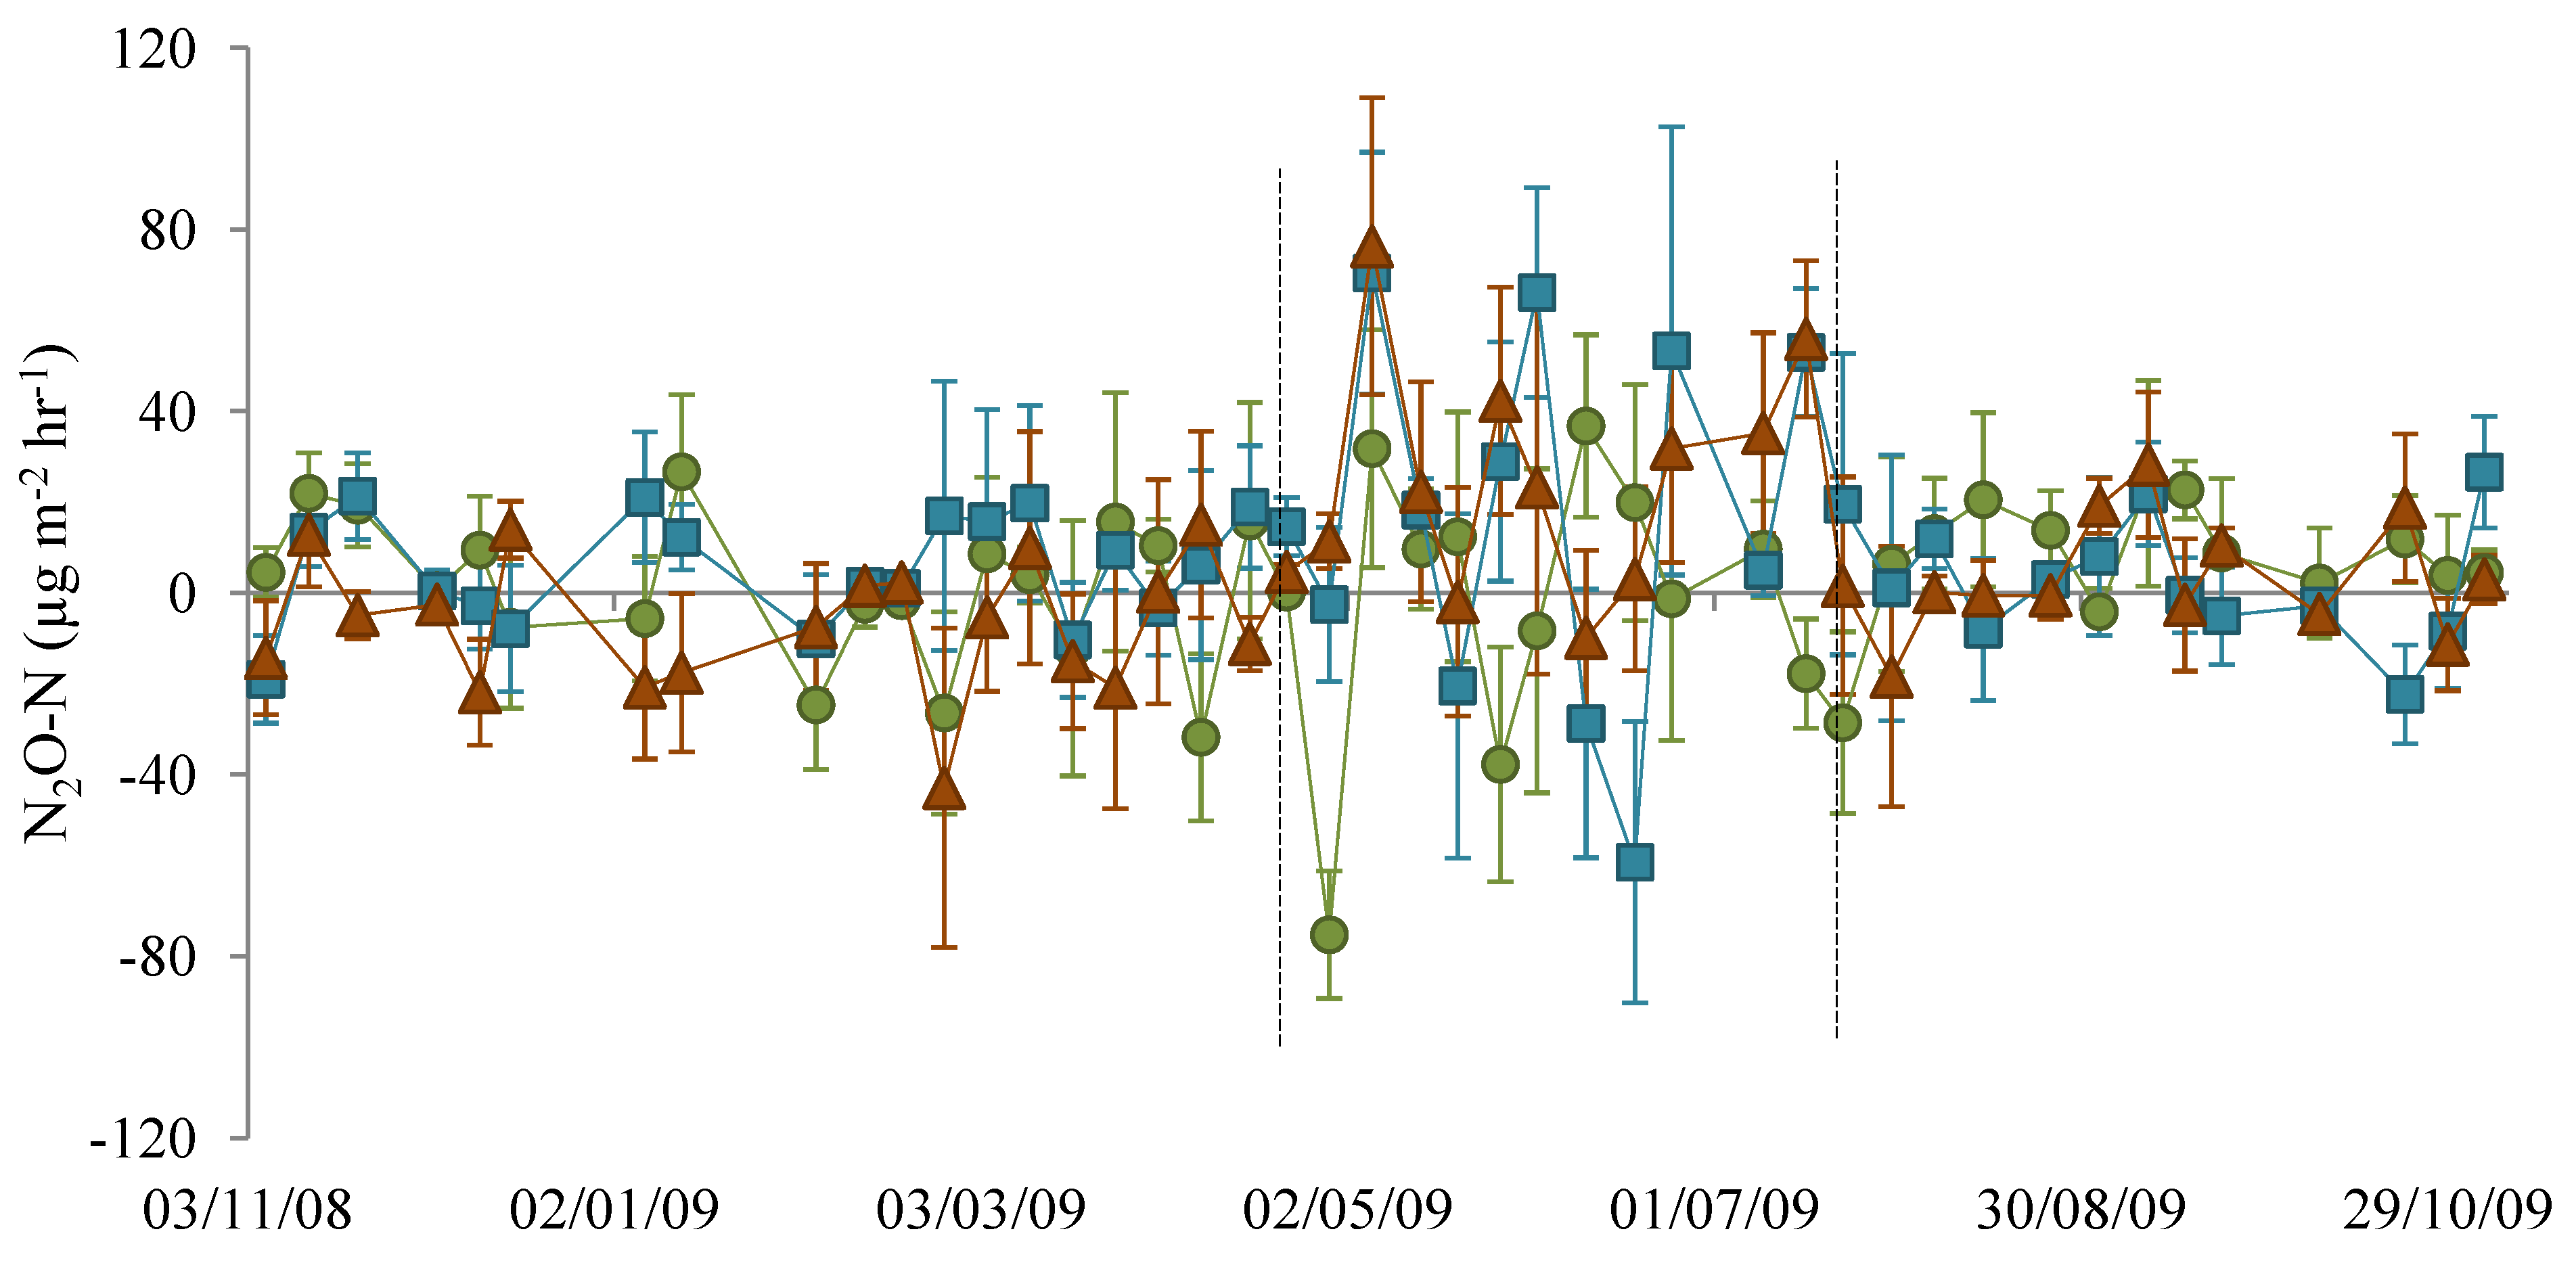 ), NM ( ) and EM ( ).
), NM ( ) and EM ( ).
), NM ( ) and EM ( ).
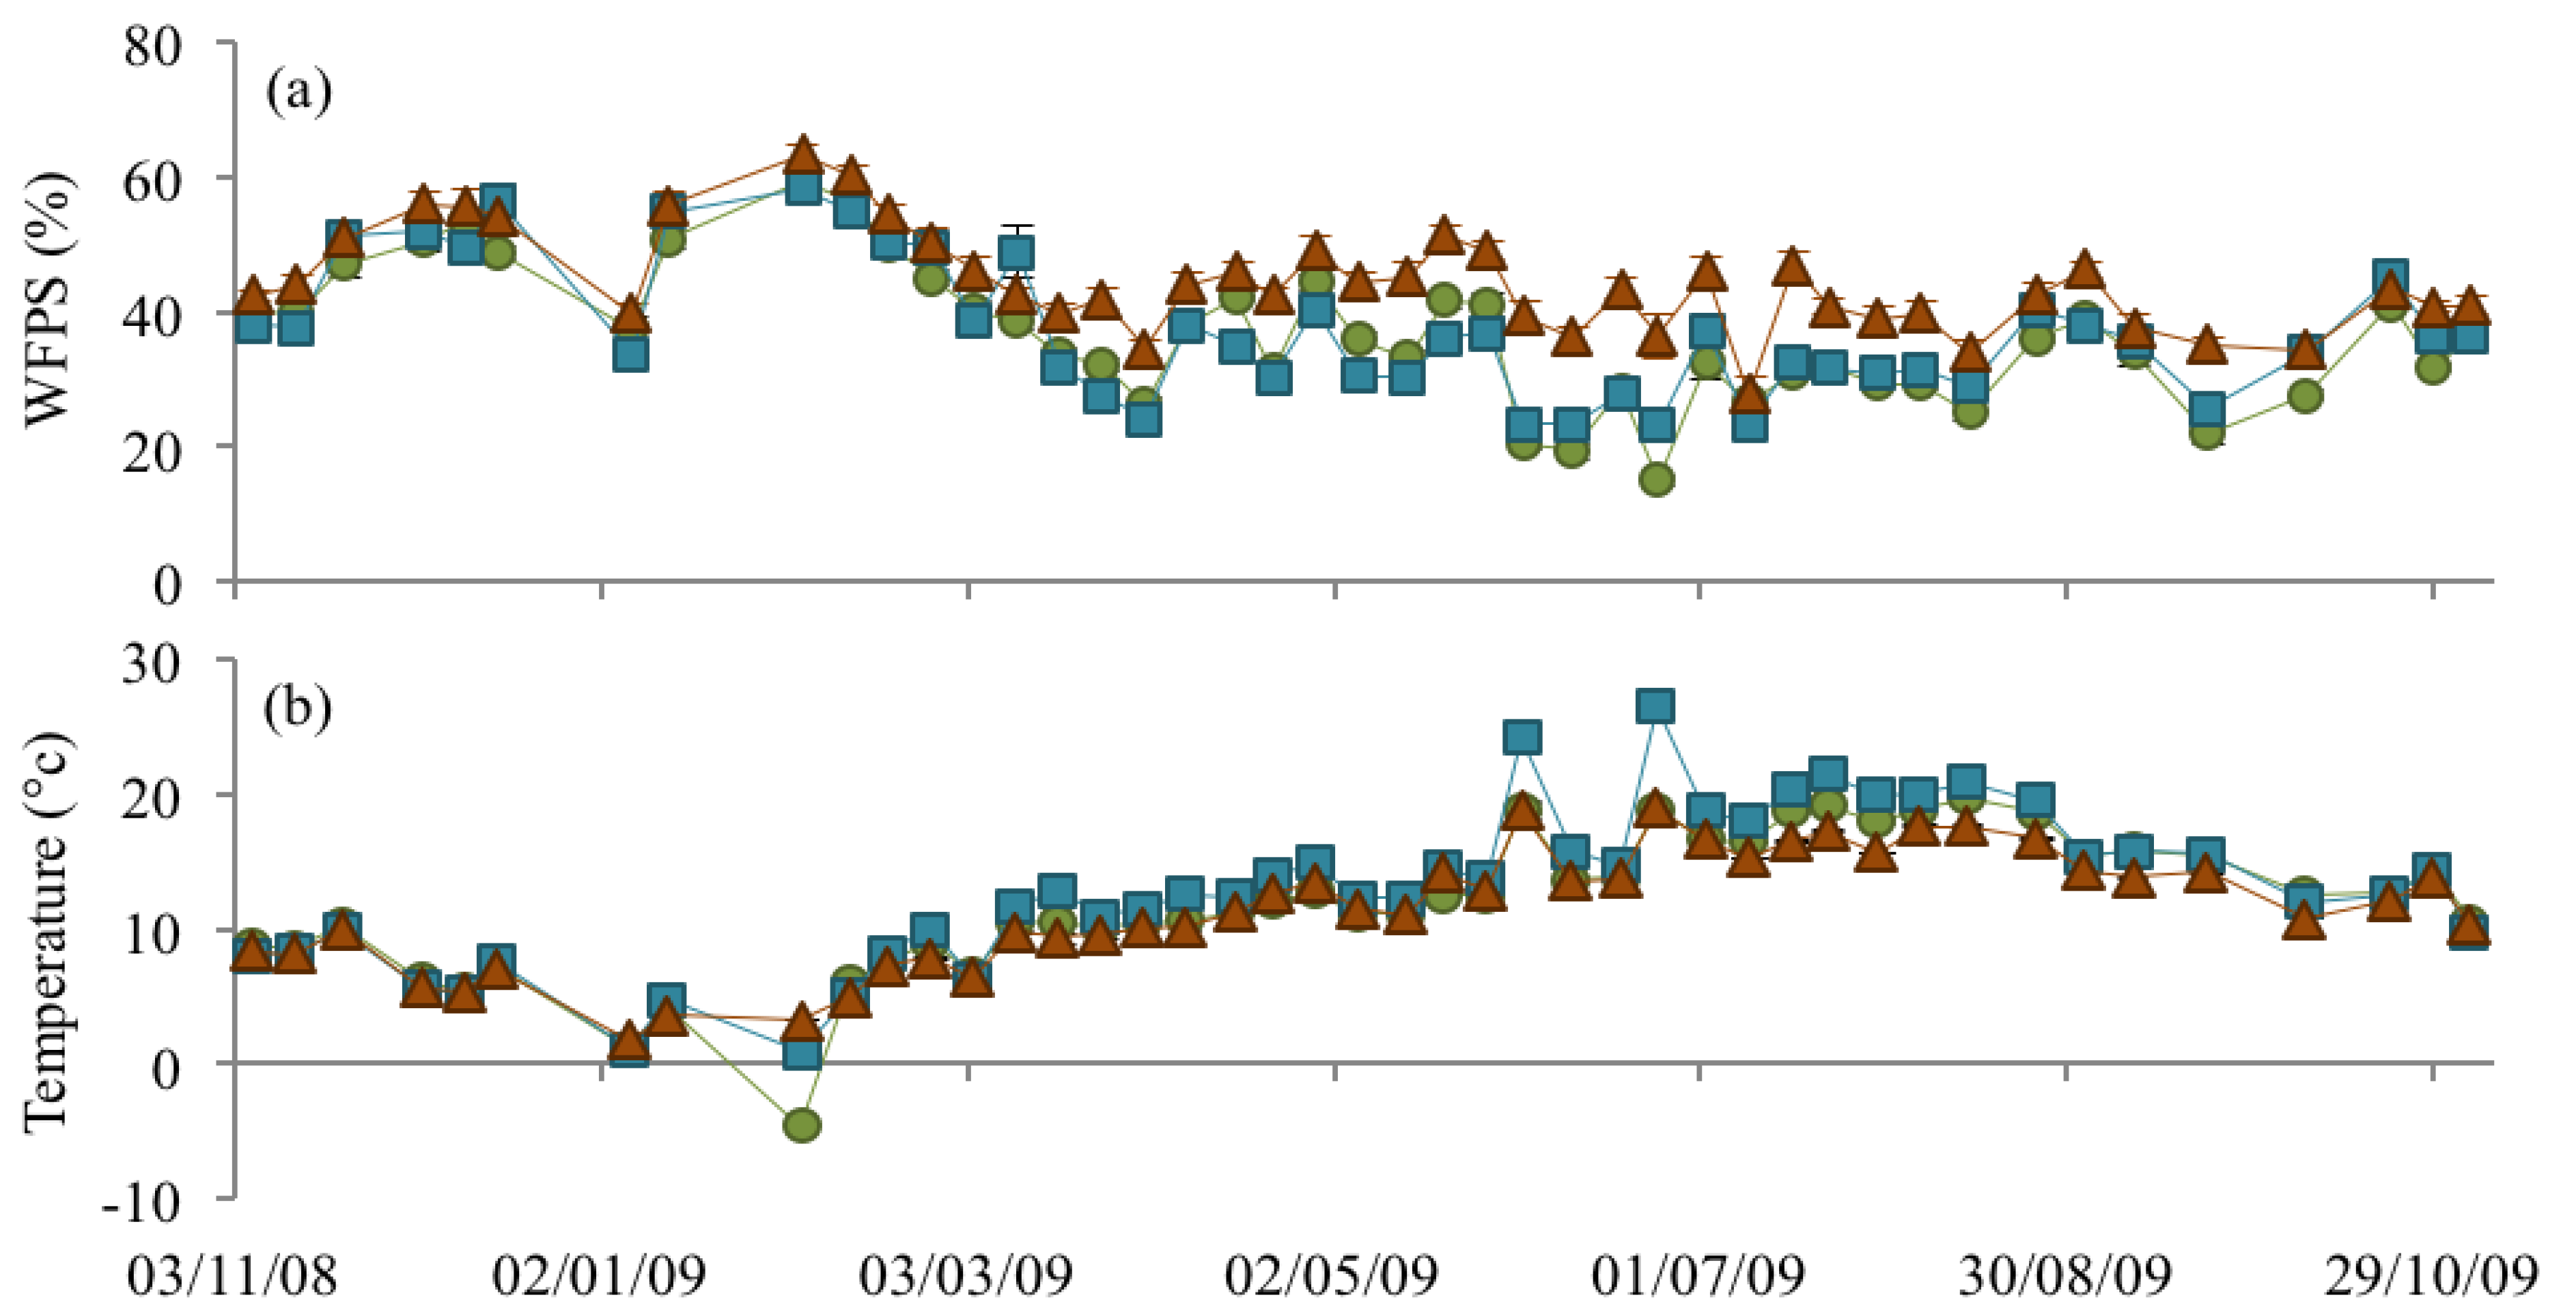
3.2. Soil Bulk Density, WFPS, and Soil Temperature
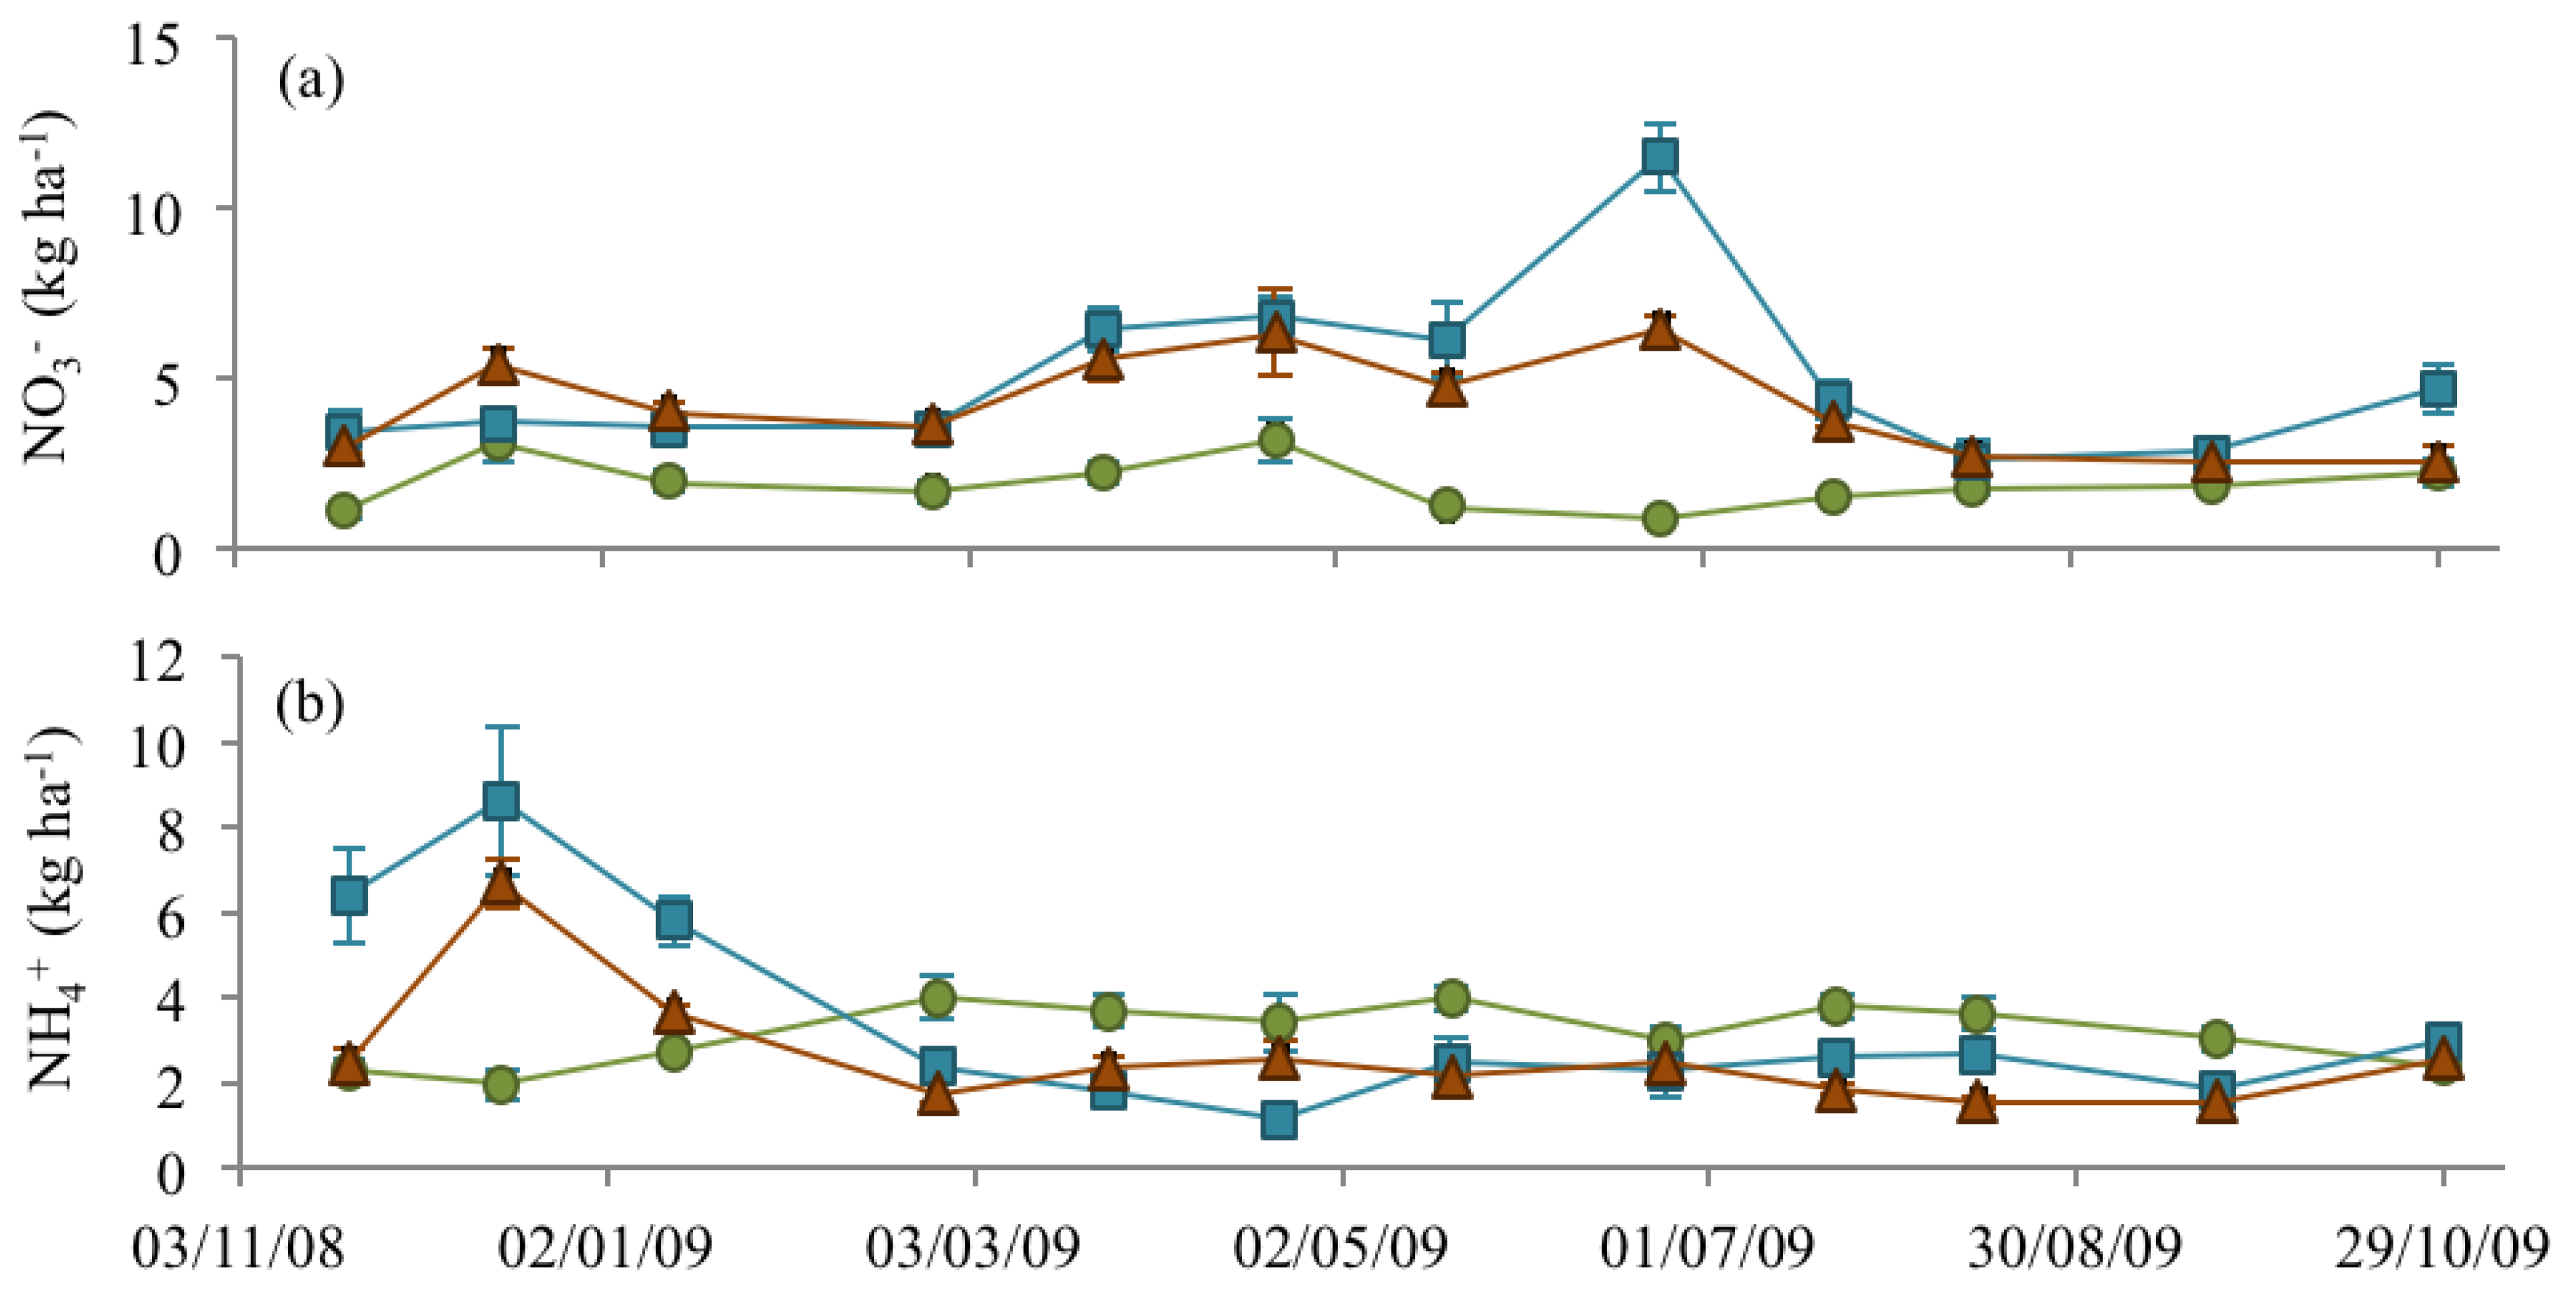
3.3. Soil Nitrate and Ammonium
), NM ( ) and EM ( ).
), NM ( ) and EM ( ). ), NM ( ) and EM ( ).
), NM ( ) and EM ( ).
), NM ( ) and EM ( ).
4. Discussion
5. Conclusions
Acknowledgments
Conflicts of Interest
References
- Denman, K.L.; Brasseur, G.; Chidthaisong, A.; Ciais, P.; Cox, P.M.; Dickinson, R.E.; Hauglustaine, D.; Heinze, C.; Holland, E.; Jacob, D.; et al. Couplings between Changes in the Climate System and Biogeochemistry. In Climate Change 2007: The Physical Science Basis. Contribution of Working Group I to the Fourth Assessment Report of the Intergovernmental Panel on Climate Change; Solomon, S., Qin, D., Manning, M., Chen, Z., Marquis, M., Averty, K.B., Tignor, M., Miller, H.L., Eds.; Cambridge University Press: Cambridge, UK, 2007. [Google Scholar]
- Environmental Protection Agency (EPA), Ireland’s Greenhouse Gas Emissions in 2009; EPA: Wexford, Ireland, 2010.
- Intergovernmental Panel on Climate Chnage (IPCC), Climate Change 2007: Mitigation. Contribution of Working Group III to the Fourth Assessment Report of the Intergovernmental Panel on Climate Change; Cambridge University Press: Cambridge, UK, 2007.
- Duffy, P.; Hyde, B.; Hanley, E.; Core, C.; O’Brien, P.; Cotter, E.; Black, K. Ireland National Inventory Report 2011, Greenhouse Gas Emissions 1990–2009 Reported to the United Nations Framework Convention on Climate Change; Environmental Protection Agency: Wexford, Ireland, 2011. [Google Scholar]
- Department of Agriculture, Fisheries and Food, Fact Sheet on Irish Agriculture; Goverment of Ireland: Dublin, Ireland, 2009.
- Smith, P.; Powlson, D.S.; Smith, J.U. Meeting Europe’s climate change commitments: Quantitative estimates of the potential for carbon mitigation by agriculture. Glob. Chang. Biol. 2000, 6, 525–539. [Google Scholar] [CrossRef]
- Department of the Agriculture, Fisheries and Food, Food Harvest 2020: A Vision for Irish Agri-Food and Fisheries; Government of Ireland: Dublin, Ireland, 2010.
- Styles, D.; Jones, M.B. Miscanthus and willow heat production—An effective land-use strategy for greenhouse gas emission avoidance in Ireland? Energy Policy 2008, 36, 97–107. [Google Scholar] [CrossRef]
- Price, L.; Bullard, M.; Lyons, H.; Anthony, S.; Nixon, P. Identifying the yield potential of Miscanthus x giganteus: An assessment of the spatial and temporal variability of M. x giganteus biomass productivity across England and Wales. Biomass Bioenergy 2004, 26, 3–13. [Google Scholar] [CrossRef]
- Lewandowski, I.; Kicherer, A.; Vonier, P. CO2-balance for the cultivation and combustion of Miscanthus. Biomass Bioenergy 1995, 8, 81–90. [Google Scholar] [CrossRef]
- Crutzen, P.J.; Mosier, A.R.; Smith, K.A.; Winiwarter, W. N2O release from agro-biofuel production negates global warming reduction by replacing fossil fuels. Atmos. Chem. Phys. 2008, 8, 389–395. [Google Scholar] [CrossRef]
- Clifton-Brown, J.C.; Stampfl, P.F.; Jones, M.B. Miscanthus biomass production for energy in Europe and its potential contribution to decreasing fossil fuel carbon emissions. Glob. Chang. Biol. 2004, 10, 509–518. [Google Scholar] [CrossRef]
- Clifton-Brown, J.C.; Breuer, J.; Jones, M.B. Carbon mitigation by the energy crop, Miscanthus. Glob. Chang. Biol. 2007, 13, 2296–2307. [Google Scholar] [CrossRef]
- Beale, C.V.; Long, S.P. Seasonal dynamics of nutrient accumulation and partitioning in the perennial C4 grasses Miscanthus x giganteus and Spartina cynosuroides. Biomass Bioenergy 1997, 12, 419–428. [Google Scholar] [CrossRef]
- Christian, D.G.; Poulton, P.R.; Riche, A.B.; Yates, N.E. The recovery of 15N-labelled fertilizer applied to Miscanthus x giganteus. Biomass Bioenergy 1997, 12, 21–24. [Google Scholar] [CrossRef]
- Camill, P.; McKone, M.J.; Sturges, S.T.; Severud, W.J.; Ellis, E.; Limmer, J.; Martin, C.B.; Navratil, R.T.; Purdie, A.J.; Sandel, B.S.; et al. Community and ecosystem level changes in a species rich tallgrass prairie restoration. Ecol. Appl. 2004, 14, 1680–1694. [Google Scholar] [CrossRef]
- Craine, J.M.; Wedin, D.A.; Chapin, F.S.; Reich, P.B. Relationship between the structure of root systems and resource use for 11 North American grassland plants. Plant Ecol. 2003, 165, 85–100. [Google Scholar] [CrossRef]
- Zavaleta, E.S.; Hulvey, K.B. Realistic variation in species composition affects grassland production, resource use and invasion resistance. Plant Ecol. 2007, 188, 39–51. [Google Scholar]
- Carney, K.; Matson, P. Plant communities, soil microorganisms, and soil carbon cycling: Does altering the world belowground matter to ecosystem functioning? Ecosystems 2005, 8, 928–940. [Google Scholar] [CrossRef]
- Nikièma, P.; Rothstein, D.E.; Miller, R.O. Initial greenhouse gas emissions and nitrogen leaching losses associated with converting pastureland to short-rotation woody bioenergy crops in northern Michigan, USA. Biomass Bioenergy 2012, 39, 413–426. [Google Scholar] [CrossRef]
- Palmer, M.M.; Forrester, J.A.; Rothstein, D.E.; Mladenoff, D.J. Conversion of open lands to short-rotation woody biomass crops: Site variability affects nitrogen cycling and N2O fluxes in the US Northern Lake States. GCB Bioenergy 2013. [Google Scholar] [CrossRef]
- Dondini, M.; van Groenigen, K.-J.; del Galdo, I.; Jones, M.B. Carbon sequestration under Miscanthus: A study of 13C distribution in soil aggregates. GCB Bioenergy 2009, 1, 321–330. [Google Scholar] [CrossRef]
- Alves, B.J.R.; Smith, K.A.; Flores, R.A.; Cardoso, A.S.; Oliveira, W.R.D.; Jantalia, C.P.; Urquiaga, S.; Boddey, R.M. Selection of the most suitable sampling time for static chambers for the estimation of daily mean N2O flux from soils. Soil Biol. Biochem. 2012, 46, 129–135. [Google Scholar] [CrossRef]
- Hutchinson, G.L.; Livingston, G.P. Use of Chamber Systems to Measure Trace Gas Fluxes. In Agricultural Ecosystem Effects on Trace Gases and Global Climate Change; Harper, L.A., Ed.; American Society of Agronomy: Madison, WI, USA, 1993; pp. 63–78. [Google Scholar]
- Dobbie, K.E.; Smith, K.A. Nitrous oxide emission factors for agricultural soils in Great Britain: The impact of soil water-filled pore space and other controlling variables. Glob. Chang. Biol. 2003, 9, 204–218. [Google Scholar] [CrossRef]
- Elliott, E.T.; Heil, J.W.; Kelly, E.F.; Monger, H.C. Water Filled Pore Space (WFP). In Standard Soil Methods for Long-Term Ecological Research; Robertson, G.P., Kellogg, W.K., Coleman, D.C., Bledsoe, C.S., Sollins, P., Eds.; Oxford University Press: Oxford, UK, 1999; p. 77. [Google Scholar]
- Compton, J.E.; Boone, R.D. Long term impacts of agriculture on soil carbon and nitrogen in New England forests. Ecol. Soc. Am. 2000, 81, 2314–2330. [Google Scholar]
- Abdalla, M.; Jones, M.; Yeluripati, J.; Smith, P.; Burke, J.; Williams, M. Testing DayCent and DNDC model simulations of N2O fluxes and assessing the impacts of climate change on the gas flux and biomass production from a humid pasture. Atmos. Environ. 2010, 44, 2961–2970. [Google Scholar] [CrossRef]
- Jones, S.K.; Rees, R.M.; Skiba, U.M.; Ball, B.C. Influence of organic and mineral N fertiliser on N2O fluxes from a temperate grassland. Agric. Ecosyst. Environ. 2007, 121, 74–83. [Google Scholar] [CrossRef]
- Drewer, J.; Finch, J.W.; Lloyd, C.R.; Baggs, E.M.; Skiba, U. How do soil emissions of N2O, CH4 and CO2 from perennial bioenergy crops differ from arable annual crops? GCB Bioenergy 2012, 4, 408–419. [Google Scholar] [CrossRef] [Green Version]
- Hellebrand, H.J.; Kern, J.; Scholz, V. Long-term studies on greenhouse gas fluxes during cultivation of energy crops on sandy soils. Atmos. Environ. 2003, 37, 1635–1644. [Google Scholar] [CrossRef]
- Jin, T.; Shimizu, M.; Marutani, S.; Desyatkin, A.R.; Iizuka, N.; Hata, H.; Hatano, R. Effect of chemical fertilizer and manure application on N2O emission from reed canary grassland in Hokkaido, Japan. Soil Sci. Plant Nutr. 2010, 56, 53–65. [Google Scholar] [CrossRef]
- Gauder, M.; Butterbach-Bahl, K.; Graeff-Hönninger, S.; Claupein, W.; Wiegel, R. Soil-derived trace gas fluxes from different energy crops—Results from a field experiment in Southwest Germany. GCB Bioenergy 2012, 4, 289–301. [Google Scholar] [CrossRef]
- Ryden, J.C. Denitrification loss from a grassland soil in the field receiving different rates of nitrogen as ammonium nitrate. J. Soil Sci. 1983, 34, 355–365. [Google Scholar] [CrossRef]
- Clayton, H.; McTaggart, I.P.; Parker, J.; Swan, L.; Smith, K.A. Nitrous oxide emissions from fertilised grassland: A 2-year study of the effects of N fertiliser form and environmental conditions. Biol. Fertil. Soils 1997, 25, 252–260. [Google Scholar] [CrossRef]
- Glatzel, S.; Stahr, K. Methane and nitrous oxide exchange in differently fertilised grassland in southern Germany. Plant Soil 2001, 231, 21–35. [Google Scholar] [CrossRef]
- Bremner, J. Sources of nitrous oxide in soils. Nutr. Cycl. Agroecosyst. 1997, 49, 7–16. [Google Scholar] [CrossRef]
- Hutchinson, G.L.; Davidson, E.A. Processes for Production and Consumption of Gaseous Nitrogen Oxides in Soil. In Agricultural Ecosystem Effects on Trace Gases and Global Climate Change; Harper, L.A., Mosier, A.R., Duxbury, J.M., Rolston, D.E., Eds.; American Society of Agronomy: Madison, WI, USA, 1992. [Google Scholar]
- Chapuis-Lardy, L.; Wrage, N.; Metay, A.; Chotte, J.-L.; Bernoux, M. Soils, a sink for N2O? A review. Glob. Chang. Biol. 2007, 13, 1–17. [Google Scholar] [CrossRef]
- Beaumont, H.J.E.; Hommes, N.G.; Sayavedra-Soto, L.A.; Arp, D.J.; Arciero, D.M.; Hooper, A.B.; Westerhoff, H.V.; van Spanning, R.J.M. Nitrite reductase of nitrosomonas europaea is not essential for production of gaseous nitrogen oxides and confers tolerance to nitrite. J. Bacteriol. 2002, 184, 2557–2560. [Google Scholar] [CrossRef]
- Schmidt, I.; van Spanning, R.J.M.; Jetten, M.S.M. Denitrification and ammonia oxidation by Nitrosomonas europaea wild-type, and NirK- and NorB-deficient mutants. Microbiology 2004, 150, 4107–4114. [Google Scholar] [CrossRef]
- Du, R.; Lu, D.; Wang, G. Diurnal, seasonal, and inter-annual variations of N2O fluxes from native semi-arid grassland soils of inner Mongolia. Soil Biol. Biochem. 2006, 38, 3474–3482. [Google Scholar] [CrossRef]
- MacDonald, J.D.; Rochette, P.; Chantigny, M.H.; Angers, D.A.; Royer, I.; Gasser, M.-O. Ploughing a poorly drained grassland reduced N2O emissions compared to chemical fallow. Soil Tillage Res. 2011, 111, 123–132. [Google Scholar] [CrossRef]
- Velthof, G.; Hoving, I.; Dolfing, J.; Smit, A.; Kuikman, P.; Oenema, O. Method and timing of grassland renovation affects herbage yield, nitrate leaching, and nitrous oxide emission in intensively managed grasslands. Nutr. Cycl. Agroecosyst. 2010, 86, 401–412. [Google Scholar] [CrossRef]
- Davies, M.; Smith, K.; Vinten, A. The mineralisation and fate of nitrogen following ploughing of grass and grass-clover swards. Biol. Fertil. Soils 2001, 33, 423–434. [Google Scholar] [CrossRef]
- Denmead, O.T.; Shaw, R.H. Availability of soil water to plants as affected by soil moisture content and meteorological conditions. Agron. J. 1962, 54, 385–390. [Google Scholar] [CrossRef]
- Cooper, P.J.M.; Keatinge, J.D.H.; Hughes, G. Crop evapotranspiration—A technique for calculation of its components by field measurements. Field Crops Res. 1983, 7, 299–312. [Google Scholar] [CrossRef]
- Long, S.P. C4 photosynthesis at low temperatures. Plant Cell Environ. 1983, 6, 345–363. [Google Scholar]
- Letey, J. Relationship between Soil Physical Properties and Crop Production. In Advances in Soil Science; Stewart, B.A., Ed.; Springer-Verlag: New York, NY, USA, 1985; Volume 1, pp. 277–294. [Google Scholar]
- Foereid, B.; de Neergaard, A.; Høgh-Jensen, H. Turnover of organic matter in a Miscanthus field: Effect of time in Miscanthus cultivation and inorganic nitrogen supply. Soil Biol. Biochem. 2004, 36, 1075–1085. [Google Scholar] [CrossRef]
- Epstein, H.E.; Burke, I.C.; Mosier, A.R. Plant effects on spatial and temporal patterns of nitrogen cycling in shortgrass steppe. Ecosystems 1998, 1, 374–385. [Google Scholar] [CrossRef]
- Mahaney, W.; Smemo, K.; Gross, K. Impacts of C4 grass introductions on soil carbon and nitrogen cycling in C3-dominated successional systems. Oecologia 2008, 157, 295–305. [Google Scholar] [CrossRef]
- Evans, R.D.; Rimer, R.; Sperry, L.; Belnap, J. Exotic plant invasion alters nitrogen dynamics in an arid grassland. Ecol. Appl. 2001, 11, 1301–1310. [Google Scholar] [CrossRef]
- Holme, I.B. Growth characteristics and nutrient depletion of Miscanthus x ogiformis Honda “Giganteus” suspension cultures. Plant Cell Tissue Organ Cult. 1998, 53, 143–151. [Google Scholar] [CrossRef]
- Cadoux, S.; Riche, A.B.; Yates, N.E.; Machet, J.-M. Nutrient requirements of Miscanthus x giganteus: Conclusions from a review of published studies. Biomass Bioenergy 2012, 38, 14–22. [Google Scholar] [CrossRef]
- Danalatos, N.G.; Archontoulis, S.V.; Mitsios, I. Potential growth and biomass productivity of Miscanthus x giganteus as affected by plant density and N-fertilization in central Greece. Biomass Bioenergy 2007, 31, 145–152. [Google Scholar] [CrossRef]
- Jorgensen, R.N.; Jorgensen, B.J.; Nielsen, N.E.; Maag, M.; Lind, A.-M. N2O emission from energy crop fields of Miscanthus “Giganteus” and winter rye. Atmos. Environ. 1997, 31, 2899–2904. [Google Scholar] [CrossRef]
© 2013 by the authors; licensee MDPI, Basel, Switzerland. This article is an open access article distributed under the terms and conditions of the Creative Commons Attribution license (http://creativecommons.org/licenses/by/3.0/).
Share and Cite
Roth, B.; Jones, M.; Burke, J.; Williams, M. The Effects of Land-Use Change from Grassland to Miscanthus x giganteus on Soil N2O Emissions. Land 2013, 2, 437-451. https://doi.org/10.3390/land2030437
Roth B, Jones M, Burke J, Williams M. The Effects of Land-Use Change from Grassland to Miscanthus x giganteus on Soil N2O Emissions. Land. 2013; 2(3):437-451. https://doi.org/10.3390/land2030437
Chicago/Turabian StyleRoth, Brendan, Michael Jones, James Burke, and Michael Williams. 2013. "The Effects of Land-Use Change from Grassland to Miscanthus x giganteus on Soil N2O Emissions" Land 2, no. 3: 437-451. https://doi.org/10.3390/land2030437