1. Introduction
Land change is considered a major contributor of global environmental change. Estimates indicate that human land change has impacted ~40% of the earth’s ice-free terrestrial surface, mostly due to the conversion of natural ecosystems (e.g., forests, savannas, and grasslands) to croplands and pasture [
1]. The impacts of land changes over ecosystems are greater across the tropics where land conversion for agriculture mostly occurs over intact forested lands [
2]. Central to land-change research is to identify the different land change trajectories (
i.e., deforestation and reforestation) and to understand how to balance land conversion to meet human needs while preserving natural ecosystems.
Land change is the result of the interaction of multiple social, economic, and environmental factors occurring at multiple and hierarchical spatial scales (e.g., local, regional, global) [
3]. Human population change, rural to urban migration, consumption patterns, presence and effectiveness of social institutions, and land-use policies are all examples of local factors that can influence patterns of land change [
4,
5]. Examples of regional or global factors include the increasing global demand for agricultural products, shifts in regional economies, indirect effects of tourism, and globalization of markets [
5]. In addition, climate change and variability (e.g., droughts, tropical storms) are often important factors influencing land change [
6].
From a regional perspective, certain geographic areas are more vulnerable to the combined effects of global climate, socio-political, and economic factors affecting land change [
3,
7]. This is evident in small island developing states (SIDS), which share challenges of susceptibility to natural disasters, limited natural and economic resources, comparatively larger influence of international forces (e.g., trade, food dependence, export demands, migration flows, remittances), high population densities, vulnerability to the invasion of exotic species, and fragile environments [
8]. For example, four of the ten countries with the highest deforestation rates between 1990 and 2000 (3% or more per year) were island states (Haiti, St. Lucia, Federated States of Micronesia, and Comoros); these deforestation rates were associated with agricultural expansion (for local and international markets), and infrastructure development (e.g., roads, ports, housing and tourism) [
9,
10]. Conversely, reforestation in islands can result from changes in the international demand for agricultural products and other commodities [
9]. For instance, a decline in deforestation rates in the Caribbean Lesser Antilles between 1990 and 2000 has been related to the decline in the banana industry when the islands lost their preferential access to the European banana market [
10]. In addition, extreme climate events can also have enormous impacts on land change, and can amplify the pressures arising from high demands on an island’s scarce resources. For example, in Samoa, most native forest has been lost or degraded for timber production from plantations; however, plantations are much more vulnerable to cyclones and in the 1990s, over 90% of the island’s plantations were lost in tropical storms Ofa and Val [
9]. These examples illustrate the importance of analyzing land change in the context of natural and human factors at local and global scales.
Although the Greater Antilles are one of the most globalized regions of the world [
11], one of the most vulnerable to climate fluctuations [
12], and an important biodiversity hotspot [
13], land change analyses of this region have been limited to individual countries or sub-countries areas and conducted in different time periods, making it difficult to compare among countries [
14]. Because of its strategic geographical position, the region has been strongly shaped by the historic, cultural, and economic influence of global political powers (e.g., Spain, France, UK, USSR, USA), as well as by the cyclical exposure to climatic events (e.g., droughts and tropical storms). Since the early European colonization during the 16th century, the region has long been cultivated to supply the international demand for food commodities, especially bananas and sugar [
11]. Most land change studies in the region have focused on Puerto Rico [
15,
16,
17], while neglecting the other Greater Antilles countries. For example, in the Dominican Republic and Jamaica, studies have been limited to processes of deforestation and forest recovery at the sub-national level [
18,
19]. In Haiti, a few land change studies have documented deforestation at the watershed and country scale [
20,
21]. Remarkably, in Cuba, the largest island, land change information mainly relies on global-scale mapping efforts of poor local scale quality (e.g., GLF 2000) and government statistics.
A simultaneous assessment of current patterns and drivers of land change in the Greater Antilles provides the opportunity to understand how globalization, climate variability, and socio-economic conditions are affecting land change in this region; and more generally, how different local socioeconomic contexts interact with global factors to determine land use trends in tropical islands. This study aims to fill this gap by assessing the trends of land change between 2001 and 2010 in the five countries of the Greater Antilles (i.e., Cuba, Dominican Republic, Haiti, Jamaica, and Puerto Rico). We used MODIS MOD13Q1 imagery and a decision tree approach for image classification, and relied upon analyses of peer-reviewed articles to examine local, regional, and international factors associated with past and present patterns of land change. The major objectives were to: (i) analyse patterns of land change in the Greater Antilles during the last decade (2001–2010); (ii) identify hotspots of land change; and (iii) discuss the historical and contemporary factors associated with these changes.
Study Site
Physical Environment and Land-Use History
The study area includes the five countries of the Greater Antilles: Cuba, Dominican Republic, Haiti, Jamaica, and Puerto Rico, which cover ~207,435 km
2. In 2010, the total regional population was estimated at 37.7 million (
Table 1) and the average population density was 182 people/km
2 [
22]. Vegetation type is highly variable between and within islands. Moist forests predominate in Puerto Rico, Hispaniola (Haiti and Dominican Republic), and Jamaica. Dry forests are largely confined to Cuba, though smaller pockets can be found in southern Puerto Rico, Jamaica, and Hispaniola. Conifer forests are found only in western Cuba, Dominican Republic, and southern Haiti [
23]. Cuba is the only island with substantial wetlands and desert/xeric shrub biomes. Mangroves fringe all of the islands.
Table 1.
Description of the principal demographic and socio-economic features of the Greater Antilles countries. Data are from [
24].
Table 1.
Description of the principal demographic and socio-economic features of the Greater Antilles countries. Data are from [24].
| | Pop in 2010 (× 103) | Pop Density in 2010 (People per km2) | % Urban Pop in 2010 | Urban Pop Growth Rate (2010–2015) | Rural Pop Growth Rate (2010–2015) | GDP per Capita (2010) a | % GDP in Agriculture (2010) | HDI b (2011) | # of Municipalities |
|---|
| Cuba | 11,258 | 106 | 75.2% | −0.08% | 0.04% | 5,397 | 4.99 | 0.776 | 169 |
| Dominican Republic | 9,927 | 205 | 69.1% | 2.03% | −0.70% | 5,195 | 6.22 | 0.689 | 31c |
| Haiti | 9,993 | 363 | 52.0% | 3.68% | −1.68% | 664 | NA | 0.454 | 567 |
| Jamaica | 2,741 | 250 | 52.0% | 0.51% | 0.18% | 5,163 | 6.29 | 0.727 | 14 |
| Puerto Rico | 3,749 | 420 | 98.8% | 0.06% | −9.60% | 25,863 | 0.57 | 0.867 | 78 |
Historically, agriculture in the Greater Antilles has been dominated by sugarcane, coffee plantations, and pastures for cattle production. Other land uses include the farming of tobacco, bananas, cocoa, yams, and citrus, as well as mining operations (e.g., nickel and cobalt in Cuba, gold and nickel in the Dominican Republic, and bauxite in Jamaica). Today, tourism, service sectors, manufacturing, and foreign aid (Haiti) are fuelling much of the region’s economic growth.
Political and Socio-Economic Background
The socio-political characteristics of the Greater Antilles vary greatly among countries given their histories of colonization and associations with foreign powers. The Greater Antilles were disputed territories of several European countries and the United States during a series of occupations and political interventions going back 500 years. Cuba, Puerto Rico, and the Dominican Republic were predominantly occupied by Spain, while Jamaica and Haiti by the United Kingdom and France, respectively. These countries obtained total independence during the 19th and 20th century, except for Puerto Rico that remains an unincorporated territory of the United States since 1898 (when transferred from Spain under the terms of the Treaty of Paris after the Spanish American War). Today, Puerto Rico is a Commonwealth of the United States. Cuba has a socialist political system lead by the Communist Party since the Cuban Revolution in 1959, formerly aided by an economic alliance with USSR until its dissolution in 1991. Predominantly under the influence of Britain for ~300 years, Jamaica continues to have ties with United Kingdom as a Commonwealth nation, but trade, financial, and cultural relations with the United States are now predominant. The Dominican Republic, in turn is a democratic republic established after years of political turmoil during the military regimes that controlled the country between the 1930s and 1960s. In Haiti, political violence and government instability has occurred throughout its history, prompting the intervention of international organizations for political resolution and economic aid principally by US, Canada, and the European Union. The differences in political and socio-economic histories in these countries are reflected in their wide range of contemporary social and economic conditions (e.g., large difference in GDP per capita) (
Table 1). Haiti is the poorest nation of the Greatest Antilles and the western hemisphere, according to the HDI poverty measures (
Table 1); while Puerto Rico has one of the largest per capita GDP in Latin America.
3. Results
Between 2001 and 2010, 51 (5.9%) of the municipalities in the Greater Antilles significantly gained woody vegetation, while only 20 (2.3%) significantly lost woody vegetation (
Figure 1(a);
Table S1;
p ≤ 0.05). Although the majority of municipalities (n = 788, 91.8%) did not show a significant change in woody vegetation, the net decadal change in woody vegetation cover for municipalities with significant change (
Table 3), as well as for all municipalities (
i.e., non-significant change in addition to significant change) (
Table 4) was positive. Overall, the area in woody vegetation increased by 801 km
2 (
Table 3). Nearly all (99.8%) of this increase occurred in Cuba (+799 km
2), but there were also small increases in woody vegetation in Puerto Rico (+19 km
2) and Dominican Republic (+4 km
2). These increases were only partially offset by losses of woody vegetation in Haiti (−21 km
2).
Figure 1.
Gain (blue dots) and loss (orange dots) in: (a) woody vegetation; (b) agriculture/herbaceous; (c) mixed-woody/plantations, from 2001 to 2010 in km2. Only municipalities with a significant (p ≤ 0.05) 10-year trend and more than 5 km2 of change are highlighted.
Figure 1.
Gain (blue dots) and loss (orange dots) in: (a) woody vegetation; (b) agriculture/herbaceous; (c) mixed-woody/plantations, from 2001 to 2010 in km2. Only municipalities with a significant (p ≤ 0.05) 10-year trend and more than 5 km2 of change are highlighted.
Table 3.
Net changes in land-use and land-cover from 2001 to 2010, (in km2, and % of land in each country) only for municipalities that underwent significant change (p ≤ 0.05).
Table 3.
Net changes in land-use and land-cover from 2001 to 2010, (in km2, and % of land in each country) only for municipalities that underwent significant change (p ≤ 0.05).
| | Woody Vegetation | Agriculture/Herbaceous | Mixed-Woody/Plantations |
|---|
| (km2) | % | (km2) | % | (km2) | % |
|---|
| Cuba | +799 | 0.73 | −753 | 0.69 | +327 | 0.30 |
| Dominican Republic | +4 | 0.00 | −301 | 0.62 | +707 | 1.46 |
| Haiti | −21 | 0.08 | −317 | 1.14 | +368 | 1.33 |
| Jamaica | 0 | 0.00 | −8 | 0.07 | +60 | 0.55 |
| Puerto Rico | +19 | 0.21 | −119 | 1.31 | +26 | 0.29 |
| Total | +801 | | −1,498 | | +1,488 | |
Table 4.
Percentage of the countries (% land) in the different land classes in 2001 and 2010. These percentages include all municipalities within a country (i.e., non-significant change in addition to significant change).
Table 4.
Percentage of the countries (% land) in the different land classes in 2001 and 2010. These percentages include all municipalities within a country (i.e., non-significant change in addition to significant change).
| | % Woody Vegetation | % Agriculture/Herbaceous | % Mixed-Woody/Plantations |
|---|
| 2001 | 2010 | 2001 | 2010 | 2001 | 2010 |
|---|
| Cuba | 22 | 24 | 49 | 43 | 25 | 28 |
| Dominican Republic | 31 | 31 | 30 | 27 | 35 | 39 |
| Haiti | 7 | 8 | 57 | 53 | 28 | 32 |
| Jamaica | 46 | 43 | 15 | 17 | 37 | 38 |
| Puerto Rico | 30 | 31 | 23 | 19 | 38 | 40 |
| Total | 12 | 13 | 26 | 23 | 14 | 15 |
During this period, 50 (5.8%) municipalities in the Greater Antilles significantly lost agriculture/herbaceous vegetation, while only 13 (1.5%) significantly gained agriculture/ herbaceous vegetation (
Figure 1(b);
Table S1). Concurrently, 52 (6.1%) municipalities gained mixed-woody/plantations, while 16 (1.9%) experienced a decrease in this class (
Figure 1(c)). Overall, the Greater Antilles lost approximately 1,498 km
2 from the agriculture/herbaceous vegetation class (
Table 3). Most of this loss occurred in Cuba (−753 km
2), followed by Haiti (−317 km
2), the Dominican Republic (−301 km
2), Puerto Rico (−119 km
2) and Jamaica (−8 km
2). In contrast, all countries experienced increases in areas classified as mixed-woody/plantations (
Figure 1(c);
Table 3). Most of this gain occurred in the Dominican Republic (+707 km
2), followed by Haiti (+368 km
2), Cuba (+327 km
2), Jamaica (+60 km
2), and Puerto Rico (+26 km
2).
Patterns of Land Change by Country
Cuba
Between 2001 and 2010, 29 municipalities experienced significant woody vegetation change in Cuba: 22 had an increase and 7 had a decrease in this class. Woody vegetation gain was largely concentrated in the west-central and southeast municipalities (e.g., west-central: Los Arabos, Santo Domingo, Jagüey Grande, Cárdenas, and Limonar; southeast: Bayamo, Sagua de Tánamo, Manuel Tames, and Colombia), whereas woody vegetation loss was concentrated in municipalities in western Cuba (e.g., La Palma, San Cristóbal, Los Palacios) (
Figure 1(a);
Table S1).
Cuba also experienced significant changes in the agriculture/herbaceous vegetation and mixed-woody/ plantations class (
Figure 1(b,c)). Seven municipalities lost agriculture/herbaceous vegetation, mainly in the same municipalities that gained woody vegetation in the west (e.g., Los Arabos, Santo Domingo, and Cifuentes) and southeast region of the island (e.g., Manuel Tames and Jiguaní). No municipality had a significant increase in agriculture/herbaceous class. Between 2001 and 2010, five municipalities gained mixed-woody/plantations, while three lost mixed-woody/plantations. Changes in mixed-woody/plantations vegetation concentrated in the southeast and west regions of the country (e.g., Isla de la Juventud, Cifuentes, and Caimanera).
Puerto Rico
From 2001 to 2010, nine municipalities in Puerto Rico experienced an increase in woody vegetation, while three lost woody vegetation. Municipalities that experienced the greatest increase in woody vegetation are concentrated in the central and southern mountains (Gurabo, Caguas, Cayey, Coamo), and along the northern coast (Toa Alta and Manatí). Woody vegetation loss was confined to three adjacent municipalities in the west (Mayagüez, Añasco, and Las Marías) (
Figure 1(a);
Table S1).
Puerto Rico also experienced a significant trend in the mixed-woody/plantations class: three municipalities had an increase, while four municipalities had a decrease in this class. The municipalities that increased in mixed-woody/plantations were located in the west overlapping with areas of significant woody vegetation loss (Mayagüez and Las Marías), and in the northern coast (Barceloneta) (
Figure 1(c)). Losses for agriculture/herbaceous vegetation were the most widespread and encompassed the greatest number of municipalities: 13 lost agriculture/herbaceous vegetation, while no municipality gained (
Figure 1(b)). Agriculture/herbaceous vegetation losses were generally confined to the northern Atlantic coast and the southern Caribbean coast. The highest losses of agriculture/herbaceous vegetation (Manatí, Toa Alta and Juana Díaz) were also the areas that gained the highest area in woody vegetation (
Table S1).
Dominican Republic
From 2001 and 2010, four municipalities experienced a significant trend of woody vegetation change: two gained and two lost woody vegetation. Loss of woody vegetation was confined to the southwest (Bahoruco) and southeast (San Pedro de Macorís). The two municipalities with woody vegetation loss were adjacent and located on the north-eastern coast (e.g., Samaná and María Trinidad Sánchez) (
Figure 1(a);
Table S1).
In the agriculture/herbaceous class, there were six municipalities that experienced significant changes: two gained agriculture/herbaceous, while four lost agriculture/herbaceous (
Figure 1(b)). Losses of agriculture/herbaceous vegetation were concentrated in the southern and western half of the country (e.g., San Pedro de Macorís, San Juan, and Pedernales). The Dominican Republic had the municipality with the highest gain of agriculture/herbaceous vegetation (María Trinidad Sánchez; ~110 km
2) in all of the Greater Antilles (mostly rice cultivation) [
33]. This same municipality also had the highest loss for woody vegetation.
Four municipalities experienced a positive trend in the mixed-woody/plantations vegetation, while no municipality experienced a negative trend in this class. Gains in areas of mixed-woody/plantations were more dispersed compared to other classes (
Figure 1(c)). The largest gains occurred in the north-central (Santiago), the southwest (Independencia,) and the eastern regions of the country (Hato Mayor).
Haiti
From 2001 to 2010, 26 municipalities in Haiti experienced a significant trend of woody vegetation change: 18 experienced increases and eight experienced decreases in this class. In contrast with the other countries, the Haitian municipalities that had significant gain in woody vegetation were as widely dispersed as municipalities that had significant losses in woody vegetation (
Figure 1(a)). The greatest areas of woody vegetation gain were detected in the northeast (Fonds Blanc) and the southwest (Fond Tortue), while the greatest areas of woody vegetation loss were notably in the westernmost area of the island (municipalities of Dejean and Duchity), the northeast (Rivière de Barre, Borneau, and Mayance), and along the border with the Dominican Republic (municipality of Fonds-Ferrettes) to the southeast (
Figure 1(a);
Table S1).
During this period, 48 municipalities had a significant trend in mixed-woody/plantations: 39 experienced an increase, while nine experienced a decrease. The largest gains in areas of mixed-woody/plantations concentrated in the southeast (e.g., Boucan Guillaume, Pichon, and Mapou) (
Figure 1(c)). Losses of agriculture/herbaceous vegetation were much more dispersed, but largely took place along the Plaine de l’Artibonite (the most important agricultural valley in the country), or in the same areas of increasing mixed-woody/plantations (with Boucan Guillaume showing >50 km
2 losses) (
Figure 1(b,c)). In total there were 36 municipalities that experienced a significant change in the agriculture/herbaceous class: 11 gained and 25 lost area.
Jamaica
Between 2001 and 2010, no municipality in Jamaica experienced a significant trend in the woody class (
Table 3). Only one municipality had a significant increase in mixed-woody/plantations (St. Catherine), and one municipality had a significant decrease in agriculture/herbaceous vegetation (Kingston). The significant changes in land cover occurred in the southern part of Jamaica (
Figure 1(b,c)).
4. Discussion
Our study assessed trends in land change in the Greater Antilles based on the municipalities that underwent significant change (p < 0.05) between 2001 and 2010. There were significant increases in the mixed-woody/plantations class, and decreases in the agricultural/herbaceous vegetation class throughout the region. Reforestation (gain of woody vegetation (i.e., trees and shrubs) through natural regeneration, encroachment, or direct human intervention) is at an advanced stage in Cuba, Puerto Rico, and the Dominican Republic, as revealed by a significant increase in the woody vegetation class; however, deforestation (loss of woody vegetation through conversion, selective logging, and degradation) continued to be a significant trend of land-cover change in Haiti, whereas in Jamaica the area under woody vegetation remained stable. Overall, trends of land change in the countries of the Greater Antilles are closely associated with their historical and socio-economic context, strongly influenced by the relationship with global factors, and shaped by local environmental characteristics and planning decisions. Land change has also been largely influenced by the countries’ vulnerability to the impacts of climatic events in the region (e.g., tropical storms, droughts).
4.1. Land Change in Cuba
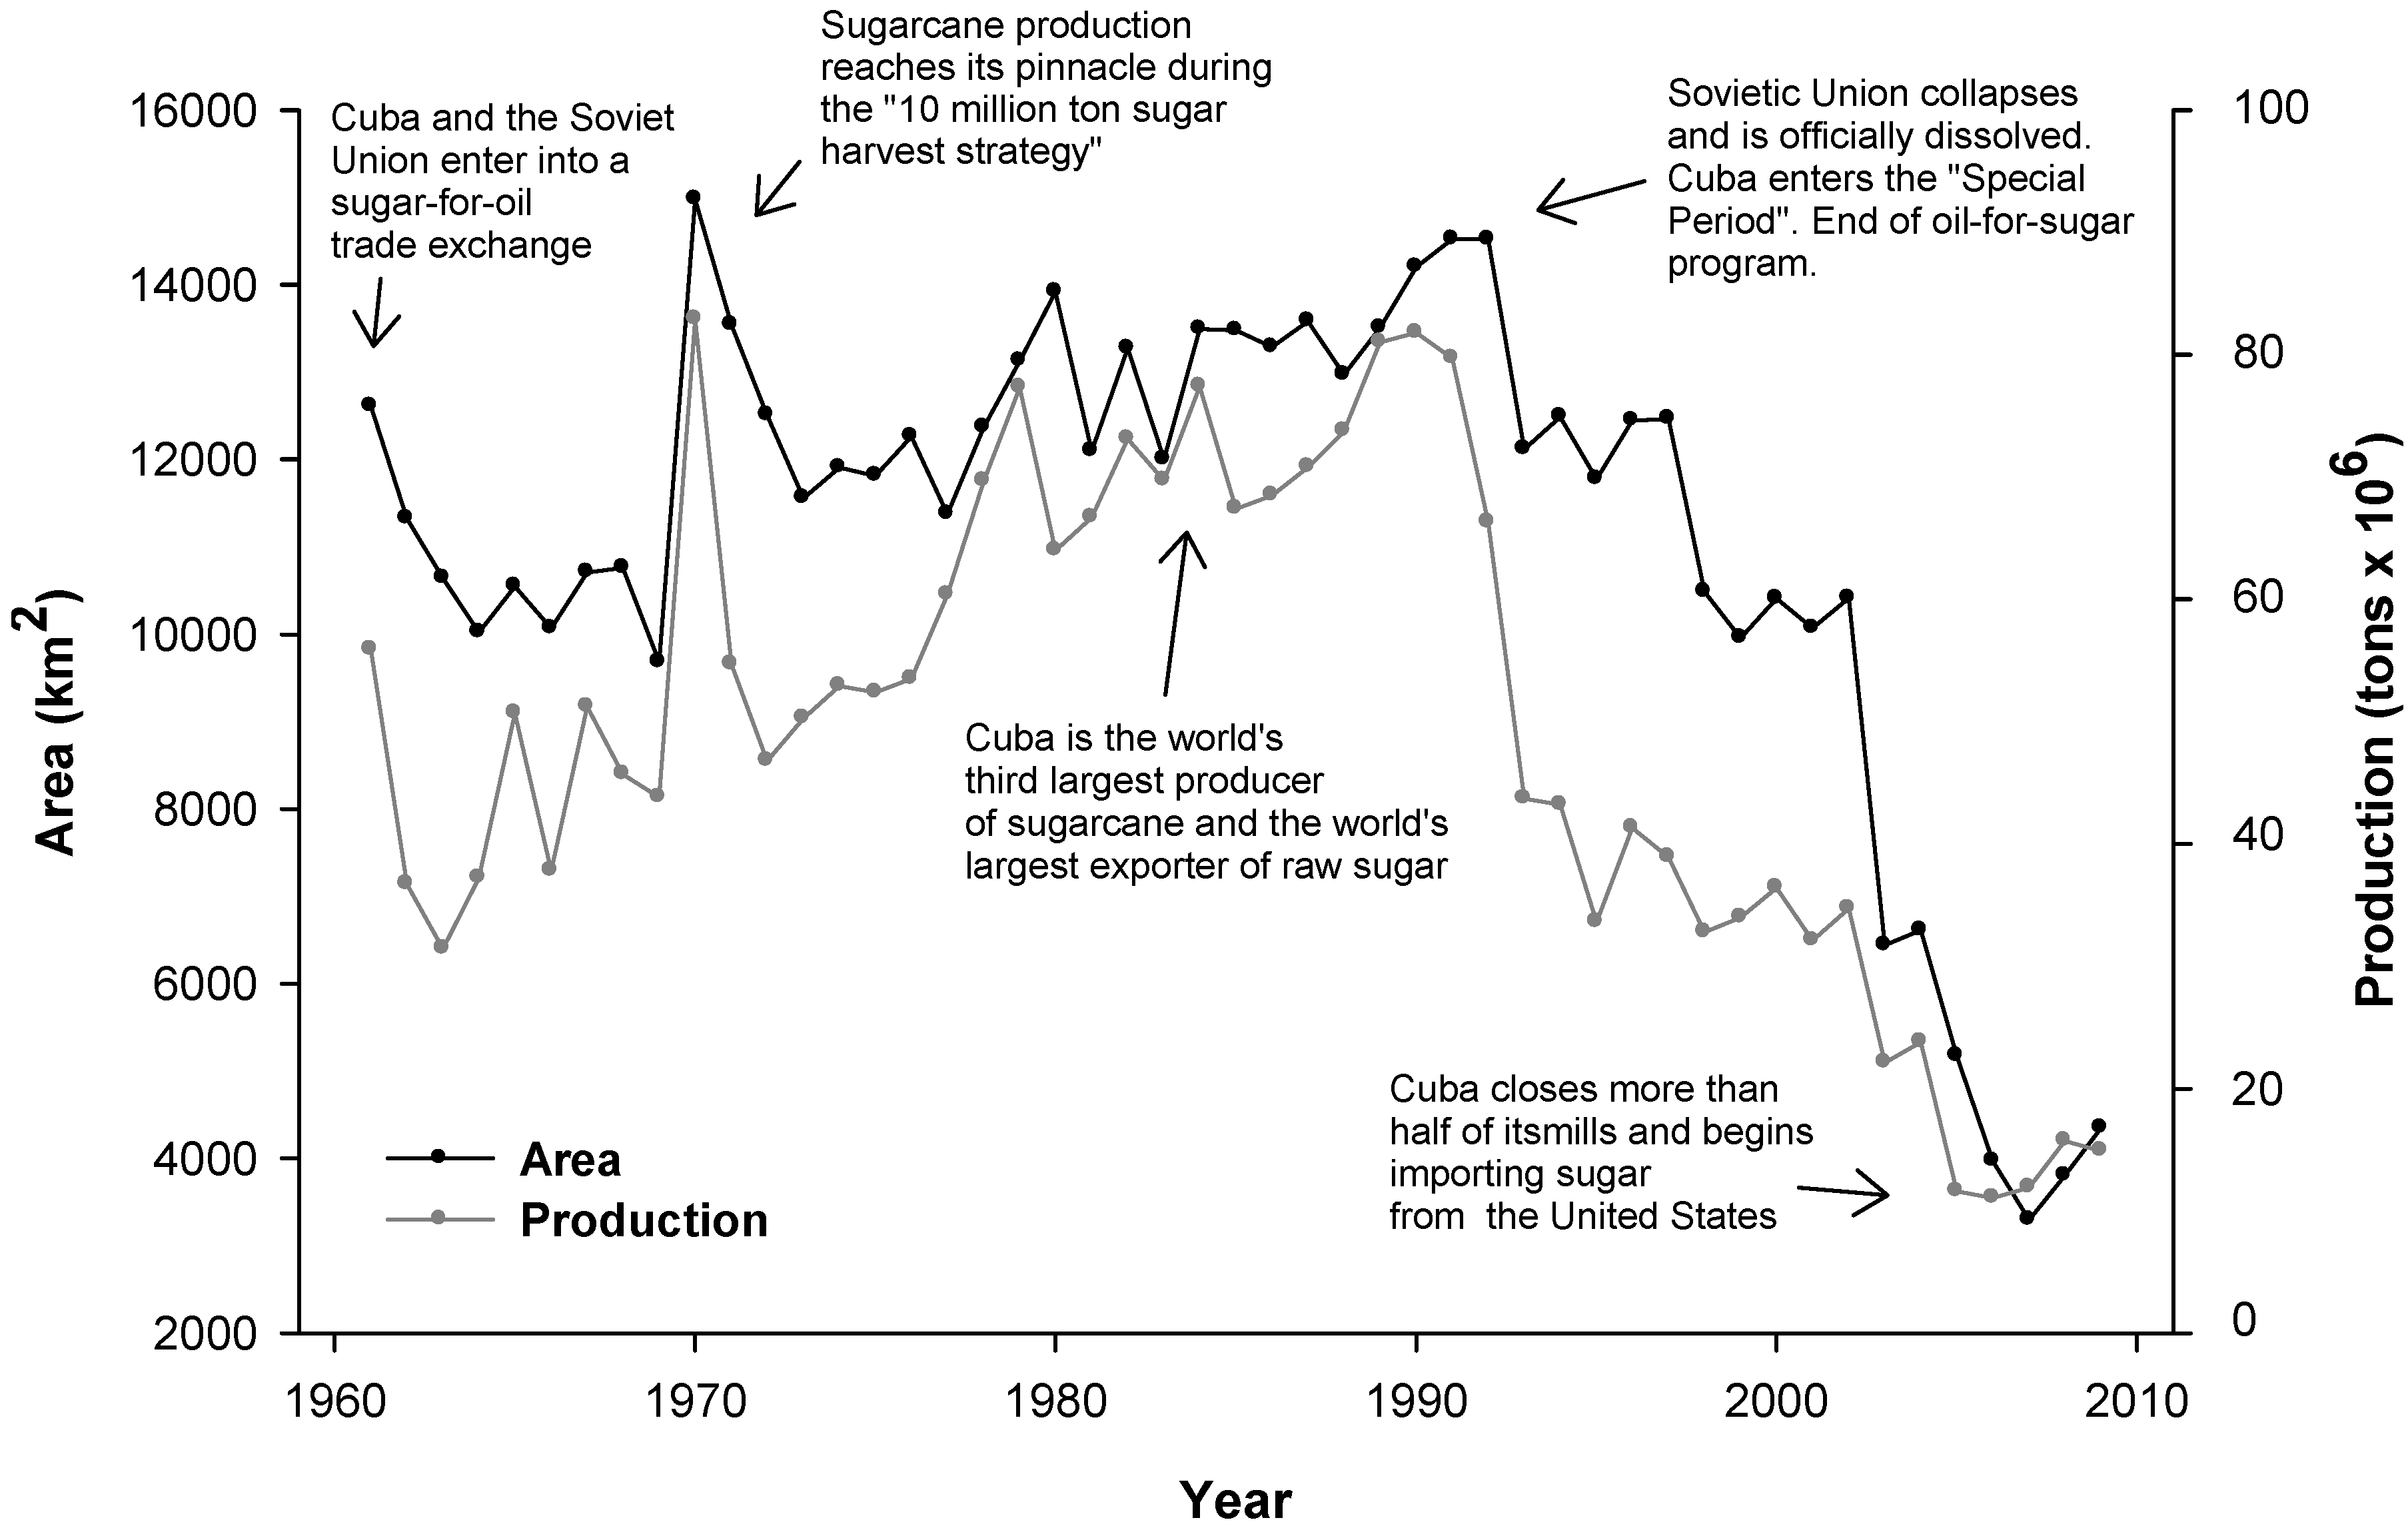
The decline and recovery of Cuba’s woody vegetation is closely linked to the rise and decline of the sugarcane industry; which in turn reflects the fall of the Soviet Union (
Figure 2). Previous to the socialist revolution in 1959, Cuba was one of the world’s largest producers of sugar largely under the control of US investors [
34]. After 1959, the production of sugar cane increased further, to supply the demand of the Soviet Union, the principal and almost exclusive consumer of Cuba’s sugar cane (
Figure 2). Between 1970s and 1980s, sugarcane maintained high production levels and represented ~75% of Cuba’s exports and ~20% of the island’s economy [
35,
36]. Sugar production reached the highest levels in 1970 (during the
‘10 million ton sugar harvest strategy’), and between 1984 and 1992 (during the ‘
Green Revolution’) (
Figure 2), when previously forested lands were converted to sugarcane for export to the Soviet Union (and its Eastern European allies) [
37]. But in December of 1991, the Soviet Union was officially dissolved, an event that initiated the ‘Special Period’ in Cuba and the end of the ‘sugar-for-oil’ exchange that had subsidized the sugarcane industry for decades (
Figure 2). Without chemical inputs and fossil fuels subsides, machinery, and oil, and 85% of its market suddenly gone, food and fuel supplies began to dwindle [
37,
38]. Cuba attempted to diversify its agricultural production by growing fruits and vegetables on former sugarcane fields, but many of the former sugarcane fields reverted back to shrublands.
Figure 2.
Change in sugarcane production (in tons) in Cuba from 1961 to 2009. Data used to construct this figure was obtained from FAOSTATS [
33].
Figure 2.
Change in sugarcane production (in tons) in Cuba from 1961 to 2009. Data used to construct this figure was obtained from FAOSTATS [
33].
As a result of the decline in demand, underinvestment, and natural disasters (e.g., Hurricanes Michelle in 2001 and Charlie in 2004), sugar production in the 2000s continued to decline (
Figure 2). From 1990 to 2000, area harvested declined by 27%. From 2000 to 2008, it declined by another 58%, and in 2002, more than half of Cuba’s sugar mills were shut down. In total, Cuba has lost approximately 10,000 km
2 or 70% of its sugarcane since the collapse of the Soviet Union. The area of other crops has also declined (
Table 5), but there has been an increase in urban agriculture [
37]. These losses in agricultural are reflected in our analyses where the agriculture/herbaceous class decreased by ~753 km
2, and the woody vegetation and mixed-woody/plantations classes increased by ~799 km
2, and ~356 km
2respectively (
Table 3). Municipalities that experienced significant decreases in agriculture in the central (Los Arabos, Santo Domingo and Cifuentes) and western region (Jiguani) also experienced significant increases in the woody vegetation class suggesting woody regrowth in abandoned agricultural lands.
Table 5.
Net change in crop area harvested (2001 to 2008/09) in km
2 and number of head of cattle (2001 to 2008). Data used to construct this figure was obtained from FAOSTATS [
33].
Table 5.
Net change in crop area harvested (2001 to 2008/09) in km2 and number of head of cattle (2001 to 2008). Data used to construct this figure was obtained from FAOSTATS [33].
| | All Cropland | Sugarcane | Coffee | Bananas | Cocoa Beans | Maize | Rice | Cattle |
|---|
| Cuba | −6,816 | −6,268 | −312 | −64 | −4 | +10 | −28 | −217,100 |
| Dominican Republic | −557 | −420 | −60 | −143 | +274 | −89 | −79 | 121,349 |
| Haiti | +270 | +17 | +135 | +10 | +74 | +90 | +18 | 15,000 |
| Jamaica | −26 | −52 | +5 | +20 | +2 | −2 | 0 | −215,000 |
| Puerto Rico | −96 | −6 | −81 | −9 | 0 | 0 | 0 | −16,350 |
| Total | −7,224 | −6,729 | −313 | −186 | +346 | +9 | −89 | −312,101 |
Our analysis also detected decreases in woody vegetation in western and eastern Cuba between 2001 and 2010 (
Figure 1(a)). The west region has frequent forest fires (e.g., 118 forest fires in 2009; mostly due to lighting), which can dramatically reduce woody vegetation cover (e.g., 3,829 ha lost in 2006; 1,014 in 2009) [
39]. In addition, Palacios and San Cristóbal, two municipalities in western Cuba where we detected woody vegetation loss, are areas of active sugar cane cultivation. It is possible that some of the woody loss is due to sugar cane expansion in the last few years [
40] (Figure 2). In eastern Cuba, significant losses in woody vegetation (
Figure 1(a)) were associated with the expansion of the nickel and cobalt open-pit mine in the municipality of Moa [
41].
The species of woody vegetation that have returned to the abandoned sugarcane fields are mostly non-native shrubs, predominantly consisting of El Marabú (
Dichrostachys cinerea), an African fast-growing legume introduced to the Caribbean in the 1800s [
42]. Ever since the ‘Special Period’ (1990s) (
Figure 2), the Marabú has grown in abandoned pasture lands [
37] and former sugarcane fields, and now covers an estimated 20,000 km
2 [
43]. This species is difficult to control and often requires the heavy use of herbicides; however, it is a source of fuelwood for local populations and by being a nitrogen fixing species may contribute to long term restoration of these lands [
37].
Patterns of post-soviet land use change in Cuba, share characteristics with regions in Eastern Europe were millions of hectares of agricultural lands were abandoned after the collapse of the Soviet Union [
44]. While woody recovery usually occurs on marginal lands (e.g., remote places, steep and poor soils) [
45], case studies in post-socialist countries showed a distinctive patterns of reforestation after agricultural abandonment [
44,
46]. For example, in the regions of Ivano-Frankivska, Lvivska, and Zakarpatska in Western Ukraine, agricultural abandonment after the independence from the Soviet Union occurred regardless of land value, quality of soils for agriculture, or crop productivity [
44,
46]. Similarly, in Cuba, prime agricultural land was abandoned, permitting the recovery or encroachment of woody vegetation. In both cases, these lands were owned by the state, which is a very different land tenure system in comparison with other regions in Latin America, thus providing a different example of woody recovery.
The clustered spatial distribution of woody encroachment in diverse types of habitats with particular conservation value (e.g., dry forests and moist forests ecoregions) coupled with stable human population growth (11.1 million in 2000 and 11.3 million in 2010 [
22]), provides a unique opportunity for conservation of reforesting sites in Cuba (e.g., design conservation corridors, expansion of protected areas). Conversely, in a scenario where the economy of Cuba opens to foreign investments, forested and shrublands could revert to intensive agriculture for export markets (e.g., sugarcane for the production of bioethanol).
4.2. Land Change in Puerto Rico
Puerto Rico is the most studied case of natural vegetation recovery in the Caribbean [
17,
47,
48], and possibly the best-documented example of woody recovery in Latin America [
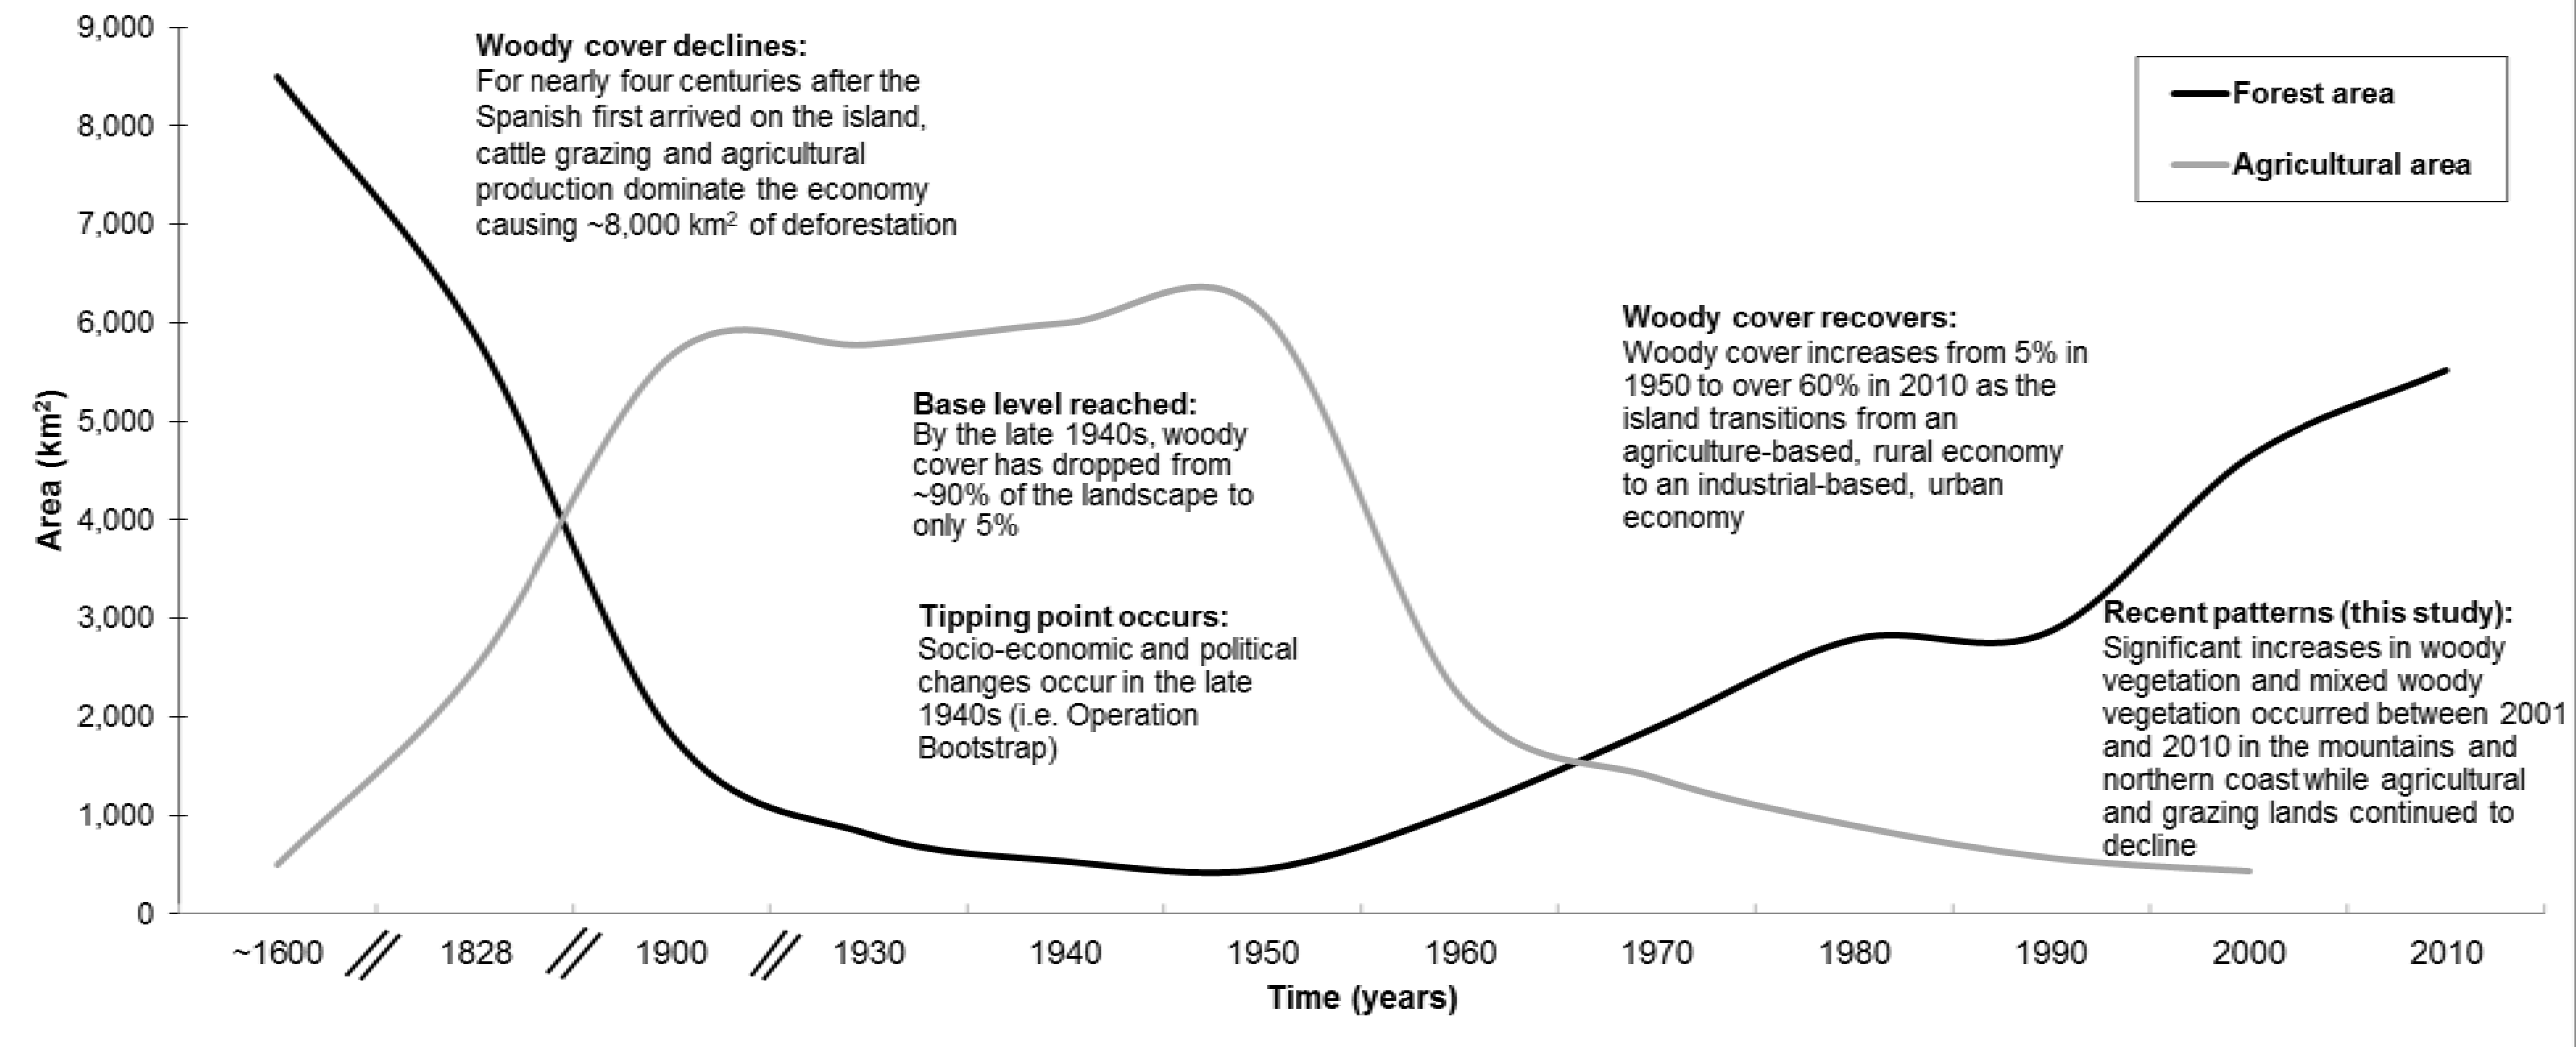
47]. Historically, the island’s economy depended mainly on agriculture and cattle grazing, which resulted in extensive clearing of the island’s woody cover [
15] (
Figure 3). Consequently, by the 1940s, remnant woody vegetation covered only 5%–6% of the island [
49]. In 1948, the U.S. government initiated ‘Operation Bootstrap’, an attempt to industrialize the island by attracting private industries through tax exemptions, lack of import duties in US markets, and coupled with local relatively cheap labour [
50]. The island has transitioned from an agriculture-based rural economy (e.g., sugarcane, coffee, and pineapple) to an industrial-based (e.g., light manufacturing, technology) and service-based urban economy [
15]. As a result, agricultural lands in Puerto Rico decreased from 85% in 1940 to 37% in 1980 [
51]; by 1980, agriculture accounted for only ~5% of the GNP, whereas manufacturing accounted for ~50% [
52]. The abandonment of marginal agricultural lands [
17], coupled by the decline in rural population caused by outmigration to urban areas [
15] permitted the recovery of the woody cover especially in the mountainous interior [
17]. Woody recovery continued in the following decades, and by the early 2000s, woody cover in Puerto Rico extended over 50%–57% of the island [
53].
Figure 3.
Change in woody and agricultural area (in km
2) in Puerto Rico from ~1600 to 2010. Data used to construct this figure was obtained from [
33,
54].
Figure 3.
Change in woody and agricultural area (in km
2) in Puerto Rico from ~1600 to 2010. Data used to construct this figure was obtained from [
33,
54].
The recovery of woody vegetation in Puerto Rico has mainly consisted of early successional species that are successful exotic invaders or widespread pioneers in tropical regions. The establishment of a woody cover composed by exotic tree species have facilitated the regeneration of native tree species, and have served as habitat for native organisms. These ‘new forests’ of Puerto Rico provide numerous ecosystem services (e.g., renewal of soil fertility, water purification), but are characterized by fewer endemic species and fewer large trees than old-growth native forests.
Our study shows that from 2001 to 2010, the general trend of woody recovery has been maintained; a trend also documented by FAO [
55]. Woody vegetation regrowth continues to occur in municipalities in the mountainous interior [
17], but now also extents along the northern Atlantic coast (
Figure 1(a)). The regrowth of woody vegetation and increases in the mixed-woody/plantations class observed in municipalities along the northern coast was associated with a decrease in the agriculture/herbaceous class. The increases in the woody vegetation and mixed-woody/plantations classes suggest that abandoned areas of agriculture/herbaceous vegetation are undergoing a gradual secondary succession through natural processes. In the mountainous interior (e.g. municipalities of Cayey and Gurabo), increases in woody vegetation were associated with decreases in mixed-woody class, suggesting the recovery of woody vegetation. Part of the increase in the mixed-woody/plantations class could be attributed to an increase in tree plantations, but data from FAOSTATS [
33] indicates an overall decrease in plantations in Puerto Rico, with coffee as the crop that lost the most area in the last decade.
Our study also detected decreases in woody vegetation in municipalities in the western region of Puerto Rico. This region is undergoing urban expansion, particularly around the main city of Mayagüez. In addition, loss of woody vegetation was associated with an increase in the mixed-woody/plantations class in the western municipalities of Añasco and Las Marías, indicating the fragmentation of woody vegetation stands. The loss of agricultural lands was the dominant land change in Puerto Rico (−119 km
2) encompassing municipalities all around the island (
Figure 1(b)).
From 2000 to 2010, the total population of Puerto Rico declined by ~80,000 or 2% [
56], and the urban population continues to exceed rural population growth. Although urbanization contributed to woody regrowth in the past [
15], recent patterns of urban expansion are the major driver of deforestation and forest fragmentation in the island [
57]. In the early 2000s, developed land in Puerto Rico covered approximately 950 km
2, equivalent to ~11% of the island; 60% of this urban cover was located along the coastal plains [
58]. In a scenario of further economic stagnation and sustained population decline, woody cover will likely continue to expand as areas that are presently classified as mixed woody transition into the woody vegetation class.
4.3. Land Change in Haiti
Haiti was the only country of the six islands in the Greater Antilles that experienced net woody vegetation loss (−21 km
2), but we also detected a large increase in the mixed-woody/plantations class (+368 km
2) (
Table 3). Two factors could be contributing to the observed increase of the mixed-woody/ plantations class. First, according to FAOSTATS [
33], between 2001 and 2010 the area in coffee and cocoa plantations increased by 404 km
2 and 139 km
2 respectively. Second, the increase in mixed-woody cover could represent an early sign of vegetation regrowth stimulated by two years (
i.e., 2007, 2010) of unusually high precipitation [
59]. Some of the areas undergoing an increase in the mixed-woody class are within the dry forest ecoregion in the northeast, and slight increases in precipitation can stimulate the growth of many xeric species (e.g., cactus,
Leucaena spp.,
Bursera simaruba,
Prosopis glandulosa) [
60]. In this region, we also detected an increase in woody vegetation suggesting an extensive area of regrowth. These results coincide with recent studies of land change in other regions in Latin America, which have found strong correlation between higher precipitation and increases in woody cover in arid zones [
27,
61].
We also detected a large decrease in the agriculture/herbaceous vegetation class (−301 km2 from 2001 to 2010); contradicting FAO data, which estimates an increase in crop area harvested (+270 km2). This discrepancy may be due to the conversion of herbaceous vegetation (e.g., pastures) to agriculture, a land-use transition that would not be detected in our data. A limitation of our methodology is the relatively low accuracy values for individual classes that are spectrally similar (e.g., agriculture and herbaceous). Yet, our methodology has the advantage of using 10 years of data and only including changes that had a significant trend over the 10 years of analysis. In addition, the discrepancy between our findings and FAO’s could be partially attributed to inaccuracies in the agricultural statistics provided to FAO, given the weak institutional conditions of government organizations in Haiti.
Most studies of deforestation in Haiti identify the growing population, agriculture, and the demand for fuelwood as major driving factors of deforestation [
62]. Historically, Haiti underwent rapid woody loss as agricultural lands (e.g., sugarcane, cotton, and coffee) expanded during the periods of occupation by the French (1697–1791) and the Americans (1915–1934). As a result, woody cover decreased from ~80% in the 1500s to ~21% in the early 1940s [
63]. In the following decades, deforestation continued mainly because of a rapid increase in population, and the increased pressure to cut woody vegetation for fuelwood and subsistence agriculture. By 1954, total woody cover was estimated at 8%–9%, and by 1978, it dropped to an estimated 6.7%. Deforestation accelerated during the embargo imposed by the United Nations from 1991 to 1994 when kerosene and petroleum imports were affected by the economic blockade, resulting in further clearing of remaining woody stands for fuelwood (mostly for cooking) [
64]. As a result, total woody cover was reduced to approximately 1% [
65] to 3% [
66], by the early 2000s, but we estimated the woody class (>80% cover) to be ~7% in 2001 (
Table 4).
Remaining woody cover in Haiti could be threatened [
67] given rapid population growth (from 6.1 million in 1989 to 10 million in 2010) [
22], agricultural expansion, and increased pressure on forest resources after the 7.0 magnitude earthquake that struck on Jan. 2010. Dependence of fuelwood continues to be a major contributor to deforestation as approximately 94% of the population uses wood or charcoal for cooking [
68]. Further deforestation will likely continue to amplify the impact of earthquakes, hurricanes, erosion, landslides, and other natural phenomena on Haiti’s population. However, our remotely-sensed data also detected a significant increase of mixed-woody/plantations cover, suggesting an increase in vegetation cover between 2001 and 2010. These findings highlight the importance of analyzing reforestation and deforestation processes simultaneously, and in the case of Haiti emphasize the need for a more recent and finer-scale study of woody regrowth.
4.4. Land Change in the Dominican Republic
Between 2001 and 2010, the Dominican Republic experienced a relatively stable woody vegetation trend, in which woody gain slightly exceeded woody loss (+4 km
2), and there was an increase in the mixed-woody/plantations class (+707 km
2). The large increase in the mixed-woody/plantations class may be the combination of two processes: (1) plantations such as plantains, bananas and mango have nearly doubled their production during the decade [
33]; and (2) mixed-woody cover may also result from gradually abandonment of marginal grazing lands accompanied by early stages of woody vegetation succession [
69]. The regeneration of woody vegetation after the abandonment of grazing lands could be a continuation of the trend observed in previous years. For example, during the 1980s and 1990s, deforestation was significant in the lowland karst region of Los Haitises [
70], but many of these areas have been abandoned and are in the process of secondary succession [
71]. Between 1984 and 2002, the 13 municipalities in the north-western region had a net increase in woody cover, mainly due to pasture abandonment, accompanied by the country’s rapid economic growth, and rural-urban migration [
18]. During the past decade, urban population growth continued to exceed rural population growth, likely favouring the abandonment of marginal grazing lands.
Our analysis detected woody vegetation loss in the north-eastern coastal municipalities of María Trinidad and Samaná. Decreases in woody cover in these municipalities can be attributed to the expansion of tourism and urban settlements along the coast [
72]. These municipalities also experienced a significant increase in agricultural lands possibly to supply the demand of urban population and tourism. In contrast, we detected significant losses in the agriculture/herbaceous class in three municipalities (Pedernales, San Pedro de Macorís, San Juan) in the south and central region of the island, possibly related to the general trend of decrease in crop areas between 2001 and 2009 as documented by FAO (
Table 5), and an overall decline of grazing lands in the mountainous interior (Coordillera Septentrional) [
18].
Exotic species has played an important role in the regeneration of woody cover in the Dominican Republic. Woody cover composition after the abandonment of pasturelands has been dominated by exotic tree species comprising a large proportion of the woody basal area (~20%), and constituting the main species in the understory of secondary forests.
4.5. Land Change in Jamaica
No municipality in Jamaica had a significant trend in woody vegetation between 2001 and 2010. This tendency of negligible woody vegetation change was also observed in earlier decades. Between 1954 and 1985, woody cover was ~29% in both years, and between 1989 and 1998 there was only a loss of 30 km
2 of woody cover [
73]. This loss of woody cover in the late nineties was associated with the expansion of bauxite mining over forests and agricultural lands [
74]. At the same time, reforestation occurred in various regions of Jamaica given natural regeneration after the abandonment of coffee and food crops (e.g., yam, onions) [
75,
76].
Agricultural production has declined in Jamaica since the 1990s due to combined impact of extreme weather events and national financial problems [
77]. For instance, in 1997 the island experienced a 17-month drought that caused US $4.7 m in damages to the agriculture sector [
78]. During 2002–2008, Jamaica had the greatest damage to the agriculture sector caused by the passage of several consecutives hurricanes and storms (Hurricanes Charley and Ivan in 2004, Tropical Storm Wilma, and Hurricanes Dennis and Emily in 2005, and Hurricane Dean and Tropical Storm Noel in 2007), two events of drought (2007 and 2008), and associated bush fires. Consequently, total active farmland in Jamaica decreased by 25.8% (~700 km
2) between 1996 and 2007 [
79]. Our results tend to support this trend, given that we found a slight decrease of the agriculture/herbaceous class. The loss of agricultural/herbaceous land was concentrated around the capital city of Kingston, and can be attributed to climatic events, but also to urban expansion. In addition, our analysis of land cover change showed a significant increase in the mixed-woody/plantations class in the St. Catherine municipality. The increase in mixed-woody/plantations class could be partially attributed to the increases in woody vegetation on abandoned farmland; a pattern recently documented in several case studies in Jamaica [
73,
74].
5. Conclusions
Global factors interacting with local socioeconomic conditions have shaped land change dynamics in the Greater Antilles Region. Between 2001 and 2010, land change in the Greater Antilles was dominated by woody vegetation regrowth and agricultural abandonment. The Greater Antilles underwent a net woody vegetation gain of 801 km2 and mixed-woody/plantations increase of 1,482 km2, while agriculture/herbaceous vegetation declined by 1,498 km2.
Given their socioeconomic particularities, Cuba and Haiti represent the most dynamic and unpredictable situations. Nearly all of the gain in woody vegetation can be attributed to the decline of sugarcane cultivation and the expansion of an invasive shrub on abandoned fields in Cuba. Haiti continued to lose woody vegetation, mainly for fuelwood consumption and agricultural expansion [
33]; however, early succession of vegetation was detected in several regions of the island. Given the uncertain future relationships with global market economy and socioeconomic pathways that will define demographic and economic conditions, both Cuba and Haiti emerge as important regions for focusing land use monitoring given that these countries will define the balance of land cover types for the whole region.
Woody vegetation also increased slightly in Puerto Rico and Dominican Republic following a more typical Latin American pattern of woody recovery in which land abandonment occurs on marginal agricultural lands, associated with socioeconomic development and population urbanization [
5]. Jamaica could be following a similar transition as suggested by a pattern of early woody succession on abandoned agricultural lands. These three countries appear to be reaching relatively stable land configurations with urban development concentrated in the lowlands and regenerating forests in the mountains.
While the regional gains in woody cover and declines in cash crop production can be viewed as beneficial to the environment, the loss of local agriculture poses great challenges for the Greater Antilles region. Between 1990 and 2009 the region’s population increased by 27% [
22], while agricultural area declined by 33% and production by 70% [
33]. The decline in food production, suggests that the countries of the Greater Antilles will become more dependent on food imports, thereby becoming more vulnerable to global fluctuations in food prices, as well as causing indirect impacts on the environment in areas of the world where the imported food is produced [
80].
Overall, the more stable socioeconomic systems of Puerto Rico, Jamaica, and the Dominican Republic are associated with a relatively stable land configuration. In contrast, land change dynamics in Cuba and Haiti will depend on how these countries become integrated into the global economy. These dynamics will greatly influence the balance between opportunities and threats for the Greater Antilles environment in the coming decades.


