

Farmland Rental Market, Outsourcing Services Market and Agricultural Green Productivity: Implications for Multiple Forms of Large-Scale Management
1
College of Agriculture, Northeast Agricultural University, Harbin 150030, China
2
Development Research Center of Modern Agriculture, Northeast Agricultural University, Harbin 150030, China
3
College of Economics and Management, Northeast Agricultural University, Harbin 150030, China
*
Author to whom correspondence should be addressed.
Land 2024, 13(5), 676; https://doi.org/10.3390/land13050676
Submission received: 17 April 2024
/
Revised: 11 May 2024
/
Accepted: 11 May 2024
/
Published: 13 May 2024
(This article belongs to the Special Issue Land Use Policy and Food Security)
Abstract
:Large-scale management is the key to realizing long-term agricultural growth in smallholder countries. Land-scale management and service-scale management are two forms of agricultural large-scale management. The former is committed to changing the small-scale management pattern, but the latter tends to maintain it. There has been a lack of discussion and controversy about the relationship between the two. From the perspective of market maturity, this paper explores whether the two are complementary or mutually exclusive and how their complementary or mutually exclusive relationship affects agricultural green productivity. The results show the following: Land-scale management and service-scale management are complementary, not superficially contradictory. The benign interaction between the two has a consistent improvement effect on green productivity in both the short and long term, which has spatial spillovers appearing in the long term. The reasons are as follows: The farmland rental market can reverse the inhibitory effect of the current low-maturity outsourcing services market on green productivity. The outsourcing services market can delay the arrival of the inflection point beyond which expansion of farmland rental transactions reduces green productivity, and amplify the positive effect of farmland rental on it. Although the degree of benign interaction between the two forms of large-scale management has gradually increased in recent years, it is still low overall. Agricultural large-scale management in China is still in the stage driven by land-scale management. Smallholder countries such as China need not worry prematurely about which large-scale management path to take, and they should treat both forms of large-scale management with an equal perspective to accelerate the high-level interaction between them.
1. Introduction
To realize SDGs 1 and 2, rural areas are the focal point, with agriculture being the priority industry. Improving agricultural economic performance and achieving sustainable agricultural development are key to eradicating poverty and hunger. However, there is an incompatibility between agricultural economic growth and environmental sustainability in this process. Agricultural green total factor productivity (TFP) is considered to be an accurate indicator for measuring the balance between agricultural economic performance and ecology [1]. Improving agricultural green TFP is the key to breaking the incompatibility between agricultural economic growth and environmental sustainability [2]. According to the World Population Prospects 2019, per capita farmland in China is approximately 0.097 ha, less than 48% of the world average. Countries with a population of over 100 million and a per capita farmland smaller than China include Japan, Pakistan, Indonesia, Bangladesh, the Philippines and Egypt. It is more difficult to increase agricultural green TFP in the long term in the above smallholder countries because of the high fixed costs of importing modern factors into traditional production on small-scale farmland [3,4]. Therefore, large-scale management has become one of the important means to increase agricultural green TFP in smallholder countries [5]. The essence of agricultural large-scale management is to enable farmers to obtain scale economies [6]. There are two ways to achieve scale economies in large-scale management. One is to rely on the farmland rental market to expand farm size to obtain internal scale economies. The other is to rely on the outsourcing services market to purchase services to obtain external scale economies [7,8]. That is, “land-scale management” and “service-scale management”.
Two major theoretical schools on agricultural large-scale management have gradually formed. The land-scale management theory advocates changing the pattern of small-scale farming through the transfer and concentration of farmland [9]. However, there is controversy as to whether or not expanding the farm size through the farmland rental market can increase farm productivity [10,11,12]. Land-scale management has been faced with the challenge of not being the root cause of scale economies, having high transaction costs, etc. [13]. The service-scale management theory advocates improving the productivity of small-scale farmers, enhancing their green production capacity [14,15,16], pushing them to participate in division of labor economy, through the large-scale supply of services [17] rather than through the expansion of farm size [18]. In China, agricultural outsourcing services are expected to be a new pathway to modernize agriculture in the context of smallholder-dominated agriculture. However, this process also runs the risk of increasing losses in agricultural production and small-scale family producers being cannibalized by capitalism [19,20].
Land-scale management is committed to changing the small-scale management pattern, but service-scale management tends to maintain it by increasing the productivity of small-scale farmers. The two forms of large-scale management have emerged in a seemingly contradictory, substitutive and competitive relationship. However, at the micro level there is evidence that outsourcing services can induce farmers to transfer land to achieve land-scale management [21] and reshape the supply and demand structure of the farmland rental market [22,23]. Whether the relationship between land-scale management and service-scale management is competitive or mutually reinforcing is the first question to be answered in this paper. From the perspective of market rather than individual behavior, this paper establishes a system of indicators to measure the maturity of the farmland rental market and outsourcing services market. It constructs a coupling coordination index and analyses its evolution to measure whether or not the two can interact in a benign way and the degree of benign interaction. The aim of large-scale management is to reduce the cost of introducing modern factors into traditional production and to achieve a green and sustainable increase in agricultural productivity. Therefore, by examining how the farmland rental market and outsourcing services market change each other’s relationship with agricultural green TFP, this paper goes further to answer the second question of how the complementary or mutually exclusive relationship between land-scale and service-scale management affects agricultural green TFP. Addressing the above issues can serve as a reference for policy choices in promoting large-scale management in smallholder countries such as China. It will also be useful for developing countries in eradicating poverty and hunger to realize the Sustainable Development Goals.
The contributions of this study are as follows: (1) From the perspective of market maturity rather than micro-individual behavior, this paper clarifies the possibility and theoretical mechanism of the benign interaction between land-scale and service-scale management. Relatively more convincing conclusions can be provided. (2) It innovatively provides a set of indicators constructed from two aspects of “quantity” and “quality” for measuring the maturity of the farmland rental market or outsourcing services market. (3) Different from the current research split to explore the impact of different forms of large-scale management on agricultural green TFP, this paper examines the impacts and mechanism of the interaction between land-scale and service-scale management on agricultural green TFP. It provides enlightenment into how governments in smallholder countries, such as China, view the relationship between land-scale and service-scale management and how to coordinate different forms of large-scale management to improve agricultural green productivity.
2. Theoretical Framework
2.1. Mechanisms of Benign Interaction between Farmland Rental Market and Outsourcing Services Market
This paper argues whether and how the farmland rental market and outsourcing services market interact benignly, from the perspective of how they can increase each other’s market maturity.
2.1.1. Mechanism of Outsourcing Services Market on Farmland Rental Market
Draw on and improve the analytical approach of Zhang et al. [24]. The dynamic transactions of the farmland rental market under the intervention of the outsourcing services market are illustrated in Figure 1. S is the farmland supply curve, where small-scale farmers are the suppliers. D is the farmland demand curve, where large-scale households such as family farms and cooperatives are the demanders. In the agricultural outsourcing services market, the service suppliers are organizations or individuals with advanced machinery and technology, including large producers, professional service teams, cooperatives and service enterprises. Service suppliers and demanders can sign formal or informal contracts. The outsourcing services market helps to alleviate the constraints of labor, capital and farm size in the production process and increase returns [25]. Therefore, the intervention of the outsourcing services market promotes land renting-in households to continue transferring in farmland, the demand curve D shifts to the right to D`, and inhibits the willingness of land renting-out households to transfer out farmland, the supply curve S shifts to the left to S`. The volume of farmland transactions at equilibrium in the farmland rental market is D0 and D1 before and after the intervention of outsourcing services market, respectively. Large-scale farmers on the demand side of farmland have an advantage over small-scale farmers on the supply side of farmland in terms of services purchase price and access to scale economies, due to their larger and relatively contiguous areas of farmland. Therefore, outsourcing services have a greater facilitating effect on demand-side transferring in farmland than an inhibiting effect on supply-side transferring out farmland through the factor constraint relief effect [26]. The shifting distance of the demand curve (TD) is greater than the shifting distance of the supply curve (TS), TD > TS. After the increase in demand for farmland and the decrease in supply, the land rent will increase further to reach a new equilibrium. Therefore, the position of D1 with respect to D0 depends not only on TD and TS but also on the relative price elasticity of supply and demand for farmland (es, ed).
When es = ed, as shown in Figure 1a, D1 > D0, outsourcing services increase the volume of farmland transactions.
When es > ed, as shown in Figure 1b, D1 > D0, outsourcing services likewise increase the volume of farmland transactions.
When es < ed, the impact of outsourcing services on the volume of farmland transactions is uncertain. If the difference in the factor constraint relief effects of outsourcing services on small and large-scale farmers is greater than the difference in land rent increase effects (TD-TS > ed-es), the volume of farmland transactions increases after the intervention of the outsourcing services market, as in Figure 1c, otherwise the volume of transactions decreases, as in Figure 1d.
In summary, outsourcing services affect the farmland rental market through the effects of factor constraint relief and land rent escalation. In most cases, the intervention of the outsourcing services market can increase the volume of transactions in the farmland rental market and increase the amount of farmland transferred to already highly productive large-scale farmers. The exception to this is when the price elasticity of farmland supply is smaller than that of farmland demand, and when the difference in factor constraint relief effects of outsourcing services on small and large-scale farmers is greater than the difference in land rent increase effects.
2.1.2. Mechanism of Farmland Rental Market on Outsourcing Services Market
Agricultural production tasks can be divided into production decisions, procurement of farm materials, ploughing, planting, prevention, harvesting, selling, processing, etc. In contrast to individuals performing all tasks independently, the vertical division of labor in agricultural production refers to the specialization of individual farmers in one or more of the above tasks based on their own comparative advantage. Agricultural production outsourcing is the process in which farmers outsource production links in which they do not have comparative advantage to service suppliers with comparative advantage. In general, farmers tend to outsource the in-production stages such as ploughing, planting, prevention and harvesting. When the service providers in the market are more capable, farmers can also outsource the sales or processing links. The Smith–Young Theorem suggests that the division of labor depends on market size, which in turn depends on the division of labor. The market capacity determined by farmers’ demand for the services of any production link is a prerequisite and result in vertical division of labor in agricultural production. With transaction costs being introduced into economics by Coase [27] and becoming an important tool for economic analysis, XiaoKai Yang (Aus) developed the Smith–Young Theorem and introduced transaction costs into the division of labor model. Since then, the theory circle noted the transaction costs implied by the division of labor and its constraints on the division of labor. In the outsourcing services market, expanding the transaction radius brings about an expansion of transaction costs. Economies arising from the division of labor will be dissipated when excessive service transaction costs lead to higher service costs for the service providers shared by farmers, reduce market capacity and prevent the entry of new service providers and the growth of service type. The transaction costs of the service providers in providing outsourcing services consist of three components: negotiation costs (C0), moving costs of service providers between farmers (Cm) and moving costs of service providers between plots within individual farmers (Ce). Negotiation costs include information the costs, search costs, bargaining costs, etc., incurred to facilitate transactions. Cm include the efficiency loss of agricultural machinery moving among farmers and the transport costs of service personnel to distribute agricultural materials and coordinate their work among farmers, etc. Ce include the costs of formulating different production schemes for different fertility plots and efficiency loss of agricultural machinery moving between plots, etc. The expression is shown in Equation (1). N represents the number of farmers served by the service provider. Si represents the amount of service purchased by the i-th farmer. K is the maximum amount of service provided by the service provider. F is the sum of distances between outsourced farmers, fi is the sum of distances between plots owned by the i-th farmer, c0 is the unit negotiation cost for the service provider toward each outsourcing farmer, cm is the unit distance moving cost of the service provider between outsourcing farmers and ce is the unit distance moving cost of the service provider between plots.
The more farmers served and the more land parcels owned by the farmers served, the higher the service transaction costs. Increasing the operating area of farmers, consolidating farmland and reducing farmland fragmentation through the farmland rental market are effective solution paths to reach the maximum service volume of the service provider at the smallest possible transaction cost. Therefore, an increase in the maturity of the farmland rental market can expand the market capacity of outsourcing services by reducing service transaction costs, lowering the services costs apportioned to farmers, etc. This can facilitate the entry of new service providers, increase the variety of services and vertically extend the service chain. Combined with the above analysis, the following hypothesis is proposed:
H1.
The farmland rental market and agricultural outsourcing services market can interact benignly. The two forms of large-scale operation based on these two markets, land-scale management and service-scale management, are not competing or substituting for each other, but complementing each other and developing together.
2.2. Influence Mechanisms of Benign Interaction between Farmland Rental Market and Outsourcing Services Market on Agricultural Green TFP
Different from the research on the mechanism of a single factor on another factor, this paper addresses the influence mechanism of the relationship between two factors on a single factor. It explores the influence mechanism of the benign interaction between the farmland rental market and outsourcing services market on agricultural green TFP, from the perspective of how the two markets change each other’s relationship with agricultural green TFP:
The marginal output of farmland among farmers is different [28]. The farmland rental market can ease farmland mismatches and improve farmland productivity through the reconfiguration of farmland among farmers [29]. Furthermore, a mature farmland rental market can increase green agricultural production by reducing the cost of using green technologies [30,31], reduce fertilizer use by increasing farmers’ sensitivity to fertilizer prices [32] and stimulate long-term investment in green production by stabilizing farmland management rights [33,34]. However, when the farm size is expanded to a certain extent, there is a mismatch among labor, capital, technology and land due to the imperfections of the agricultural factor markets in developing countries such as China [35,36]. The irrational allocation of factors reduces the acquisition of scale economies and violates the original purpose of the existence of the farmland rental market, which instead reduces productivity [37,38]. Therefore, the relationship between the transaction volume of farmland rental (farmland rental market scale) and agricultural green TFP shows an inverted U-shape. However, the outsourcing services market can alleviate the constraints and mismatches of non-land elements due to the expansion of farmland rental market scale. It can then stimulate and amplify the positive impacts of the farmland rental market on agricultural green TFP and delay the arrival of an inflection point where the expansion of farmland rental market scale reduces agricultural productivity.
Theoretically, the existence and maturity of the outsourcing services market can lead to internal and external scale economies for service providers and demanders, respectively. This can reduce the cost of using green technologies in agriculture and the overall cost of production [39]. The outsourcing services market can also reduce chemical inputs through technology direct introduction, spillover, and demonstration [40,41] and improve overall agricultural productivity by contributing to a grain-oriented cropping structure [42]. However, when the agricultural outsourcing services market is at a low maturity stage, the types of services are dominated by in-production machinery services, and service quality measurement standards are dominated by crop yield improvement. Agricultural outsourcing services popularize the use of machinery and increase the use of chemicals purely to improve yields [43]. Furthermore, agricultural outsourcing service is a principal-agent phenomenon that faces moral hazard problems. With high transaction costs and service providers being responsible only for the service content and crop yield, there is a lack of incentive for the application of green technologies in the outsourcing services market. The lack of diversified demand also prevents the expansion of high-end outsourcing services market capacity. Therefore, a low-maturity agricultural outsourcing services market even has a negative impact on agricultural green TFP. However, increased maturity of the farmland rental market expands the scale and contiguity degree of farmland of outsourcing services demanders. This can significantly reduce the transaction costs of service providers, improve their work attitude [44] and increase their incentives for green production [45]. When the large-scale farmers generated by the farmland rental market act as outsourcing service demanders, their diversified demands force the emergence of higher-end services that are more conducive to improving agricultural green productivity. Therefore, the farmland rental market can reverse the negative impact of the low-maturity outsourcing services market on agricultural green TFP and stimulate the potential for service-scale management to exert positive effects. In conclusion, the benign interaction between the farmland rental market and outsourcing services market can keep stimulating each other’s potential in improving agricultural production performance and ensuring agricultural sustainability.
Hypothesis 2 is proposed by combining the above analyses:
H2.
The benign interaction between land-scale management and service-scale management can improve agricultural green TFP, through the following mechanism.
H2a.
The low-maturity outsourcing services market has a negative impact on agricultural green TFP. Increased maturity of the farmland rental market can reverse this negative impact.
H2b.
Farmland rental market scale and agricultural green TFP have an inverted U-shaped relationship. The agricultural outsourcing services market can delay the arrival of the inverted U-curve inflection point and amplify the positive impact of the farmland rental market on agricultural green TFP.
Unlike farmland, services are naturally spatially mobile. The outsourcing services market contains a large amount of knowledge and technological capital, which can bring about spatial knowledge spillovers and affect the agricultural productivity of neighboring regions. This spatial knowledge spillover of the outsourcing services market can be strengthened and optimized by the increased maturity of the farmland rental market. For example, from the market perspective, the increased maturity of the farmland rental market can lead to the extension of the outsourcing service chain, both backwards and forwards, leading to an increase in high value-added services (e.g., sales services, processing services, etc., which bring higher returns to service demanders). The spatial mobility of the service market is then strengthened, with a higher probability of positive impacts on the agricultural productivity of neighboring regions. In terms of large-scale management, the benign interaction between land-scale management and service-scale management can lead to a variety of advanced management forms that can enhance the demonstration and learning effect within and outside the region. Therefore, the benign interaction between the farmland rental market and outsourcing services market not only generates spatial spillover effects on the agricultural green TFP of geographically neighboring regions with similar production climates, cropping structures and resource endowments but also generates spatial spillover effects on agricultural green TFP in economically neighboring regions with similar industrial structure, similar operation models of talent market and capital market, and small “potential difference” in agricultural technology. Combined with the above analyses, Hypothesis 3 is proposed:
H3.
The increased maturity of the farmland rental market can strengthen and optimize knowledge spillovers from the outsourcing services market. Benign interaction between the farmland rental market and outsourcing services market has a positive spatial spillover effect on agricultural green TFP in geographically and economically neighboring regions.
Based on the above analysis, a theoretical analysis framework is constructed as follows (shown in Figure 2).
3. Methodology
3.1. Evaluation Model of Benign Interaction between the Two Markets
Coupling, from physics, refers to the phenomenon of interaction between different systems [46]. Coordination refers to the benign interaction between different systems [47,48]. This section uses the coupling coordination model to comprehensively measure the level of interaction between the two markets and the degree of benign interaction therein [49].
- (1)
- Indicator construction and evaluation of market maturity
Market maturity indicates the level of market development. Scale expansion is the “quantitative change” in market development. The improvement of quality and efficiency is the “qualitative change” of market development. To improve the level of market development, it is necessary to take the “quantitative change” of expanding scale and increasing growth rate as a prerequisite and the “qualitative change” of improving development quality, efficiency and governance capacity as the final point. Therefore, this study evaluates the maturity of the two markets by constructing an indicator system from both quantitative (market scale) and qualitative (market quality) aspects. The indicators and weights are shown in Table 1. In the choice of indicators, the transaction volume (I1) of the farmland rental market and farmland per laborer (I2) can characterize the development of farmland rental market scale. Promoting the transfer of farmland to cooperatives and enterprises (I3), which avoids inefficient circulation among small farmers, and increasing the proportion of farmland rented with a transfer contract (I4), which regulates the farmland rental process, are reflections of the improvement of farmland rental market quality. The output value (I5) and added value of agricultural support services (I6) represent the development and expansion speed of the agricultural outsourcing services market scale. The development of agricultural outsourcing services market quality can be measured using four indicators: proportion of service organizations with more invested machinery assets (I7), proportion of output value (I8) and added value of agricultural support services (I9) and proportion of agricultural pre- and post-production service personnel (I10). The reasons are as follows: I7 represents the service quality. I8 and I9 represent the status of the outsourcing services industry. The more prominent the industry status, the higher the efficiency of the services market driving agricultural development, so the higher the development of the services market’s quality will be. I10 represents the length of the service chain. Service chain extension is an important feature of improved services market quality.
This paper uses the subjective and objective combination of the AHP-entropy weight method to calculate the composite weight. Based on U = α·W′ + (1 − α)·W. W′ is the weight calculated using the highly subjective analytic hierarchy process method (AHP). W is the weight calculated using the highly objective entropy weight method. U is the composite weight. Considering the actual importance of each indicator and experts’ advice, α is taken as 0.6. After calculating the composite weights of each indicator, this paper adopts the technique for order preference by similarity to an ideal solution (TOPSIS) to evaluate the maturity of the farmland rental market and outsourcing services market, respectively.
- (2)
- Construction of coupling coordination model
After evaluating the maturity of the two markets separately, the coupling coordination model is constructed to measure the degree of benign interaction between the two markets. Since the coupling degree calculated by the traditional coupling model is not an average distribution function between [0, 1], but is concentrated at the 1 end, this paper uses the improved coupling coordination model proposed by Wang et al. [50]:
U1 represents the farmland rental market. U2 represents the outsourcing services market. Equation (2) is the improved coupling model. C is the degree of coupling. T is the coordination index of the two markets. CDD denotes the degree of coupling coordination of the two markets. Generally, α = 0.5, which indicates that the two subsystems are equally important. Classification of the coupling coordination evaluation levels is shown in Table 2 [51].
3.2. Model for Effects and Mechanisms of Benign Interaction between the Two Markets on Agricultural Green TFP
Based on clarifying the specific effects of benign interaction between the farmland rental market and agricultural outsourcing services market on agricultural green TFP, this study empirically demonstrates the mechanisms therein.
- (1)
- Influence effects model
Construct the following two-way fixed effects model:
In Equation (5), i stands for province and t stands for year. CDD is the coupling coordination degree between the farmland rental market and outsourcing services market measured in the previous section. CON is the control variables, including the proportion of affected area (DIS) to control the natural conditions, the total power of agricultural machinery per unit area (ATL) to control the technological conditions, proportion of government expenditure on agriculture (GOE) to control the policy conditions, proportion of agricultural added value (AVA) to control the conditions of industrial and economic development, the planting structure (PSTR), pesticide use per unit area (PES), and fertilizer use per unit area (FER) to control the production conditions. εit denotes the stochastic disturbance term. μi denotes province fixed effect. νt denotes year fixed effect. α1 represents the specific impact of benign interaction between the two markets on agricultural green TFP.
AGTFP stands for agricultural green TFP. Based on the construction of the SBM model considering undesirable outputs, this paper uses the Global Malmquist–Luenberger (GML) index to examine the dynamic changes in efficiency. It converts the sequential AGTFP measured by the SBM-GML method into a cumulative growth index with 2009 as 1. In terms of inputs and outputs, inputs include the number of people employed in the primary sector, the total sown area of crops, the total power of agricultural machinery, the amount of fertilizer used and the amount of water used in agriculture. Outputs include desirable and undesirable outputs, the former being characterized by the gross output value of generalized agriculture, and the latter being characterized by agricultural carbon emissions [52]. The formula for estimating agricultural carbon emissions is as follows:
E represents the total amount of agricultural carbon emissions. Ei represents the amount of carbon emissions from carbon sources. Ti represents the amount of carbon sources. δi represents the carbon emission coefficient of carbon sources. According to the research of Oak Ridge National Laboratory, College of Biology and Technology of China Agricultural University, Institute of Agricultural Resources and Production Environment of Nanjing Agricultural University, IPCC, the carbon emission coefficient of fertilizer is 0.896 kg·kg−1, that of pesticide is 4.934 kg·kg−1, that of agricultural film is 5.18 kg·kg−1, that of diesel fuel is 0.5927 kg·kg−1, that of ploughing is 312.6 kg·km−2 and that of agricultural irrigation is 20.476 kg·hm−2 [53].
- (2)
- Influence mechanism model
This study explores the influence mechanism of benign interactions between the farmland rental market and outsourcing services market on agricultural green TFP, from the perspective of how the two markets change each other’s relationship with agricultural green TFP. Firstly, the follow two-way fixed effects model is constructed to examine the average impact of the farmland rental market and outsourcing services market on agricultural green TFP, respectively:
LRM and OSM are the maturity of the farmland rental market and outsourcing services market measured in the previous section, respectively. κ1(κ2) represents the average influence of changes in maturity of the outsourcing services market (farmland rental market) on agricultural green TFP, controlling for a constant level of farmland rental market (outsourcing services market) maturity.
After clarifying the average effect of each of the two markets on agricultural green TFP, the following threshold model is constructed to verify how the farmland rental market and outsourcing services market change each other’s relationship with agricultural green TFP [54]:
I(·) is an indicator function that takes the value of 1 for the fulfilment of the condition in parentheses and 0 for the opposite. θ and σ are specific threshold values. Equation (8) is used to examine whether the increased maturity of the farmland rental market reverses the negative impact of the low maturity outsourcing services market on agricultural green TFP. Equation (9) is used to examine whether the increased maturity of the outsourcing services market amplifies the positive impact of the farmland rental market on agricultural green TFP.
To further examine whether the outsourcing services market can delay the arrival of the inflection point beyond which the expansion of farmland rental market scale reduces agricultural green TFP, the following model is constructed:
LRMS stands for farmland rental market scale. Equation (10) constructs the quadratic term of farmland rental market scale to verify whether there is an inverted U-shaped relationship between farmland rental market scale and agricultural green TFP. Equation (11) adds the interaction terms of OSM with the primary and secondary terms of LRMS, respectively, to verify whether the inverted U-shaped relationship between farmland rental market scale and agricultural green TFP changes or how the inverted U-shaped inflection point changes, under the influence of the outsourcing services market.
3.3. Spatial Spillover Model
To examine the spatial spillovers effect of benign interactions between the two markets on agricultural green TFP, this paper constructs the Spatial Durbin Model (SDM), which is more generally applicable:
Equation (12) is the static SDM. In order to further examine the long-term and short-term differences in the direct and spatial effects of benign interactions between the two markets on agricultural green TFP, this paper constructs the following dynamic SDM:
W is the spatial weight matrix. Based on the theoretical analysis, this paper adopts the economic–geographical composite weight matrix. ρ and ρ’ are the spatial autoregressive coefficients reflecting the impact of AGTFP in this region on AGTFP in neighboring regions. In Equation (13), AGTFPit-1 is the first-order time lag of AGTFP. WAGTFPit-1 is the first-order time and spatial lag of AGTFP. η denotes the one-period lag coefficient, reflecting the impact of the previous AGTFP on the current AGTFP. χ is the spatio-temporal lag term coefficient, reflecting the impact of the previous local AGTFP on the current AGTFP of the neighboring region.
In order to retain the economic meaning of the threshold and inflection point values, and the comparability between the coefficients, this paper does not take the logarithm of the variables involved in the mechanism model. It only takes the logarithm of the variables involved in the effect model and the spatial model.
This paper uses the balanced panel data of 30 provinces in China (excluding Hong Kong, Macao, Taiwan and Tibet Autonomous Region) from 2008 to 2021. The original data were sourced from China Rural Business Management Statistics Annual Report, China Tertiary Industry Statistics Yearbook, China Rural Statistics Yearbook, China Agriculture Yearbook, and National Bureau of Statistics of China in the relevant years. Missing data were filled in by interpolation.
4. Estimation and Results Analysis
4.1. Results Analysis of Interaction between Farmland Rental Market and Outsourcing Services Market
- (1)
- Maturity of farmland rental market
The time-series changes in the maturity of the farmland rental market and its subsystems are shown in Figure 3. The scores of overall market maturity, market scale development and market quality development steadily increase from 0.2417, 0.2115 and 0.2637 in 2009 to 0.4367, 0.3604 and 0.5163 in 2021, respectively. The market quality development score has been higher than the scale development score during 2009–2021. The maturity of the farmland rental market has been increasing year by year, and it has passed the stage of market scale expansion including increasing the rate of transfer and the volume of land transactions. It is now at the stage of market quality improvement that includes increasing the rate of land transfer-in of high-capacity subjects, regulating the transaction behavior and lengthening the term of contract.
- (2)
- Maturity of agricultural outsourcing services market
The time-series changes in the maturity of the outsourcing services market and its subsystems are shown in Figure 4. The overall maturity, scale development and quality development of the outsourcing services market likewise increased steadily from 2009 to 2021. Except for 2009 and 2010, the market scale development score was higher than the market quality development score in the remaining years. Unlike the farmland rental market, which is at the stage of market-quality development, China’s outsourcing services market is at the primary stage of expanding market scale. It has not yet entered the stage of market-quality development, such as the development of high-value-added back-end agricultural services and the prominence of agricultural services industry status. The reason for this is that, in China, the market-based outsourcing services market started later than the market-based farmland rental market. Moreover, the development of agricultural outsourcing services markets as an alternative path to large-scale management in the context of small-scale farming has only gained importance in recent years.
- (3)
- Coupling coordination degree between the two markets
Figure 5 shows the time-series change in the coupling coordination degree and relative development degree between the farmland rental market and outsourcing services market. The coupling coordination index between the farmland rental market and outsourcing services market has shown a growth trend from 2009 to 2021. It is now in the stage of bare coordination after experiencing the stage of mild disorder and near disorder, respectively. This growth trend indicates that farmland rental market and outsourcing services market can interact benignly. The two forms of agricultural large-scale management, land-scale and service-scale management formed from the two markets are not competing and substituting for each other, but rather they are complementary to each other. Hypothesis 1 is verified. The relative development degree of the two markets is greater than 1, that is, the maturity of the farmland rental market has been greater than that of the outsourcing services market from 2009 to 2021. This suggests that China is currently at the stage of relying on farmland rental to drive the realization of large-scale management in agriculture. Although the two markets can interact benignly, the degree of this benign interaction is low. From the perspective of factor composition, the reason lies in the imperfection of the outsourcing services market. Furthermore, the imperfection of the service market comes more from its low quality of market development.
Figure 6 shows the time-series changes in the coupling coordination degree between the two markets in different regions. China is divided into eastern, central and western regions according to economic development and geographic location. From 2009 to 2021, the degree of benign interaction between the two markets gradually decreases from the eastern regions to the central and western regions. Low, medium and high agricultural dependency regions are classified according to the share of agricultural output. The degree of benign interaction between the two markets gradually decreases from low agricultural dependency regions to medium and high agricultural dependency regions. According to the average value of farmland rental market maturity and outsourcing services market maturity, the mode of agricultural large-scale management development can be classified into four types: synchronized development, land-scale management lagging, service-scale management lagging and synchronized lagging. Combined with the degree of coupling coordination of the two markets, the development stage of agricultural large-scale management in each region is shown in Table 3. Low agricultural dependency regions rely on the synchronized development of farmland transfer and services outsourcing to promote large-scale management. In contrast, the two forms of large-scale management are in a low-level cycle in the central regions and the high agricultural dependence regions.
4.2. Benign Interaction between the Two Markets Improves Green Productivity: Effects and Mechanisms
4.2.1. Improved Effect Analysis
The impact results of the coupling coordination between the farmland rental market and outsourcing services market on agricultural green TFP using STATA 17 are shown in Table 4. In the benchmark regression, after controlling for provincial and time effects, the coupling coordination between the farmland rental market and outsourcing services market has a significant positive impact on agricultural green TFP at the 1% level. This means that a 1% increase in the coupling coordination between the two markets will lead to an average increase of 0.67% in agricultural green TFP. Considering some possible endogeneity issues in the benchmark regression, the coupling coordination between the two markets lagged by one period is used as an instrumental variable, and a robust test is conducted using instrumental variable 2-stage least squares estimation (IV-2SLS). The significance of the results remains unchanged after considering endogeneity. Therefore, benign interaction between land-scale management and service-scale management can significantly increase agricultural green TFP.
In terms of control variates, the negative effect of natural disasters on agricultural green TFP is not significant, indicating that the impact of natural disasters on Chinese agriculture is gradually weakening. Agricultural mechanization increases agricultural productivity while at the same time substantially increasing carbon emissions. Agricultural mechanization has a non-significant negative impact on agricultural green TFP, suggesting that the desired and non-desired outputs resulting from the advancement of agricultural mechanization in China are offsetting each other. The average effects of agricultural financial expenditure, fertilizer and pesticide application on agricultural green TFP are significantly negative, respectively. This indicates that increasing inputs of all three currently has a greater negative impact on the agricultural environment than a positive impact on agricultural productivity. The higher the dependence of economic development on the primary sector, the higher the agricultural green TFP. Compared with cash crops, food crops have a higher level of mechanization, which increases the overall productivity of agriculture while also increasing the overall carbon emissions of agriculture. Cash crops refer to non-food crops such as cotton, peanuts, sugarcane, vegetables, etc. For example, in 2021 the comprehensive mechanization rates of food crops such as wheat, rice and corn in China were 97.29%, 85.59% and 90.00%, respectively. The comprehensive mechanization rates of cash crops such as oilseed rape, peanuts and sugar cane were 61.92%, 65.65% and 60%, respectively. The results show that the grain-oriented cropping structure reduces green TFP, indicating that the grain-oriented cropping structure increases overall agricultural carbon emissions to a greater extent than it increases overall agricultural productivity.
4.2.2. Improved Mechanism Analysis
This section explores the improved mechanism of benign interactions between the farmland rental market and outsourcing services market on agricultural green TFP from the perspective of how the two markets change each other’s relationship with agricultural green TFP. The aim is to clarify the reasons why the interaction between land-scale management and service-scale management can increase agricultural green TFP.
Farmland Rental Market Optimizes the Relationship between Outsourcing Services Market and Agricultural Green TFP
Putting both the farmland rental market and outsourcing services market into the two-way fixed effects model of the impact on agricultural green TFP, the results are shown in Table 5. When controlling for constant farmland rental market maturity, the average effect of the outsourcing services market on agricultural green TFP is significantly negative. This is due to the low maturity of China’s outsourcing services market. Undesired outputs from focusing on the form of in-production services and using yield as a measure standard of service quality are greater than desired outputs from high-value-added services and services that alleviate technological constraints. Using the threshold model, this paper discusses the different effect results of the outsourcing services market on agricultural green TFP when the farmland rental market is at different maturity levels. According to the threshold effect test in Table 6, the influence of the outsourcing services market on agricultural green TFP has a threshold feature of the farmland rental market. Table 7 shows that when the farmland rental market is at a low level of maturity (≤0.2198), the outsourcing services market maintains a negative impact on agricultural green TFP. The positive impact of the outsourcing services market on agricultural green TFP only become apparent when the farmland rental market maturity crosses the first threshold (0.2198 < LRM ≤ 0.3536). The positive impact effect is further increased when the farmland rental market maturity crosses the second threshold (>0.3536). Therefore, the increasing maturity of the farmland rental market can reverse the negative impact of the low-maturity outsourcing services market on agricultural green TFP and gradually stimulate the potential of the outsourcing services market to improve agricultural green TFP.
Outsourcing Services Market Optimizes the Relationship between Farmland Rental Market and Agricultural Green TFP
- (1)
- Delay the arrival of the inflection point beyond which the expansion of farmland rental market scale reduces agricultural green TFP. Expanding market scale is an important precondition for market maturity growth. Table 8 shows the relationship between farmland rental market scale and agricultural green TFP. In model (1), the first-order coefficient of farmland rental market scale is significantly positive and the square term coefficient of it is significantly negative. The slope of the curve is positive (5.000) at the left endpoint of the value range of farmland rental market scale and negative (−4.2431) at the right endpoint. The inflection point of the curve (0.4457) is within the value range of farmland rental market scale (0.0605, 0.7726). The above satisfies the three conditions of the inverted “U” relationship proposed by Haans et al. [55]. Therefore, there is an inverted U-shaped relationship between farmland rental market scale and agricultural green TFP. When the transactions volume of the farmland rental market is low, agricultural green TFP can increase with the expansion of farmland transactions volume, and when the transactions volume crosses the inflection point, agricultural green TFP will be reduced. The interaction term of farmland rental market scale × outsourcing services market is introduced in model (2). Although farmland rental market scale and agricultural green TFP still show an inverted U-shaped relationship, it can be seen that the inflection point of the inverted U-shaped curve is shifted to the right by calculating β1*β4 − β2*β3(>0). This shows that the increase in maturity of the outsourcing services market can delay the arrival of the inflection point where the expansion of the farmland rental market transaction volume reduces agricultural green TFP.
- (2)
- Amplify the positive effects of the farmland rental market on agricultural green TFP. The threshold model is also used to explore the different effects of the farmland rental market on agricultural green TFP when the outsourcing services market is at different maturity levels. The tests and results of threshold model in Table 9 and Table 10 show that when outsourcing services market maturity is at a low level (≤0.1136) and crosses the first threshold (0.1136 < OSM ≤ 0.1898) and the second threshold (>0.1898), the degree of positive impact of the farmland rental market on agricultural green TFP increases from 2.5209 to 3.7356 and 4.5940, respectively. When controlling for constant outsourcing services market maturity, the average impact of the farmland rental market on agricultural green TFP is 1.3599 (Table 6). When the outsourcing services market maturity gradually increases, the improvement of agricultural green TFP by the farmland rental market is not only higher than 1.3599 but also gradually improved. Therefore, the existence and increasing maturity of the outsourcing services market amplifies the positive impact of the farmland rental market on agricultural green TFP, which prompts land-scale management to continuously release the potential of improving agricultural green productivity.
In summary, the farmland rental market and outsourcing services market optimize each other’s relationship with agricultural green TFP, which is the essence of the benign interaction between land-scale management and service-scale management to improve agricultural green productivity. At this point, Hypothesis 2 is fully validated.
4.3. Results Analysis of Spatial Spillover
Table 11 shows the model selection test. The Global Moran’s Index for all years is non-zero and significantly positive between [−1, 1], indicating that there is a significant spatial positive correlation of agricultural green TFP in China from 2009 to 2021. The LM test, LR test, Wald test, and Hausman test are conducted sequentially to determine the valid form of the spatial model. All four tests passed the 5% significance level test, meaning that the fixed-effects Spatial Durbin Model (SDM) is more appropriate for this study and does not degenerate into a Spatial Error Model (SEM) or Spatial Lagged Model (SLR). Table 12 shows the estimation results of the SDM. The estimation results of static and dynamic SDM show that, after considering indirect spatial spillovers, the direct effect coefficients and spatial effect coefficients of the coupling coordination between the farmland rental market and outsourcing services market are both significantly positive. This means that an increase in the degree of benign interaction between the farmland rental market and outsourcing services market can improve agricultural green TFP, not only in the region but also in the geographically and economically proximate provinces. Hypothesis 3 is verified. The time and spatial lag terms of the explained variables of the dynamic SDM are significant, indicating that the dynamic model setup is reasonable. The dynamic spatial effect decomposition is shown in Table 13. Long-term and short-term effects are in high consistency, and the coefficient of the total effect in the long term is larger than that in the short term. This indicates that the benign interaction between the farmland rental market and outsourcing services market has a more profound long-term effect on agricultural green TFP. Although the spatial spillover of benign interactions between the farmland rental market and outsourcing services market on agricultural green TFP is not obvious in the short term, it is significant in the long term, showing that the knowledge spillover of the outsourcing services market, which is strengthened and optimized by the farmland rental market, cannot be revealed in the short term.
5. Conclusions
Large-scale management is the key to the long-term improvement of agricultural green productivity in smallholder countries. It is also one of the paths to eradicating poverty in rural areas and ensuring national food security. However, there has been a lack of in-depth discussion and controversy about the relationship between the two agricultural large-scale management forms of land-scale management and service-scale management. From the perspective of market maturity, this study tries to answer the question whether land-scale management and service-scale management are mutually substituted or benignly interacted by evaluating the maturity of China’s farmland rental market and outsourcing services market, constructing the coupling coordination index between the two and analyzing its spatio-temporal evolution trend. Through examining how the farmland rental market and the outsourcing services market change each other’s relationship with agricultural green TFP, this study tries to answer the question of how complementary or mutually exclusive relationships between land-scale management and service-scale management affect agricultural green productivity. The following conclusions are drawn:
First, through scientific calculation, China’s farmland rental market has passed the stage of market-scale expansion and entered the stage of market-quality development in recent years. However, the agricultural outsourcing services market is in the primary stage of market-scale expansion and has not yet entered the stage of market-quality development, such as the development of high value-added back-end agricultural services and the prominence of the agricultural services industry. Therefore, at present, agricultural large-scale management in China is still in the stage driven by land-scale management.
Second, the outsourcing service markets can increase farmland rental market maturity in most cases through the effects of factor constraint relief and land rent escalation. The farmland rental market can increase outsourcing services market maturity by reducing service transaction costs and increasing market capacity. Therefore, land-scale management and service-scale management are not substitutes for each other, but rather are complementary and positively interacting with each other. Although the degree of benign interaction between the two has risen from mild disorder to bare coordination, it is still low overall from 2009 to 2021.
Third, China’s low-maturity outsourcing services market has an inhibitory effect on agricultural green productivity, but the farmland rental market can reverse this negative effect. The expansion of farmland rental market scale has an inverted U-shaped effect on agricultural green productivity, while the outsourcing services market can delay the arrival of the inflection point of this inverted U-shaped relationship and amplify the positive effect of the farmland rental market on agricultural green productivity. Through the above mechanism, the benign interaction between land-scale management and service-scale management has a consistent improvement effect on agricultural green productivity in both the short term and the long term. This improvement effect has spatial spillover that can be seen in the long run, because the knowledge spillover of the outsourcing services market, which is strengthened and optimized by the farmland rental market, cannot be revealed in the short term.
Fourth, the degree of benign interaction between land-scale management and service-scale management gradually decreases from eastern regions to the central and western regions, which also decrease from low agricultural dependency regions to medium and high agricultural dependency regions. It is worth noting that the two forms of large-scale management in the central regions and high agricultural dependency regions do not complement each other well, and the development of agricultural large-scale management in the two regions is still at the stage of simultaneous lagging of farmland rental and services outsourcing.
According to the conclusions of this paper, China and other smallholder countries need not worry prematurely about which large-scale management form should be taken for agricultural development. In formulating policies to promote agricultural large-scale management, land-scale management and service-scale management both should be treated with an equal perspective, without being overly biased one way. However, policy strategies to support each form of large-scale management should be targeted. For service-scale management, the policy orientation should be to promote the services outsourcing market to guide the service chain forward, backward, to high value-added, to high technology content and to cross-region extension based on ensuring the quantity and quality of in-production services. Therefore, for China, the government should retain the existing subsidies for agricultural socialization services and provide additional financial subsidies and favorable credit support to service providers who provide green production services, carry out smart agriculture, provide high value-added services, etc. For land-scale management, the policy orientation should be to promote the farmland rental market to integrate dispersed land and push forward the transfer of land to efficient entities based on ensuring the smooth flow of land factors. However, because of the high cost of integrating fragmented land, the government should provide appropriate subsidies to agricultural production organizations capable of integrating fragmented land. Through the above targeted policies, land-scale management and service-scale management can achieve a high level of circular interaction. In terms of regional differences, the two large-scale management forms in central regions and high agricultural dependency regions are in a low-level circular state; in particular, the poor advancement of agricultural large-scale management in the latter may have some impact on national food security. Therefore, compared with other regions in China, the governments in the above two regions have more responsibility and should have more urgency to further improve the development scale and quality of the farmland rental market and agricultural outsourcing services market. Subsidies and policies on large-scale management and the construction of new agricultural management subjects, should be appropriately tilted in favor of central and high agricultural dependency regions. The proportion of matching funds from the central government for agricultural construction projects in the above two regions should also be further increased.
Author Contributions
H.Z., conceptualization, formal analysis, funding acquisition, methodology, writing—original draft, software; X.G., conceptualization, resources, supervision, project administration, writing—review and editing. All authors have read and agreed to the published version of the manuscript.
Funding
This research was supported by the National Social Science Foundation of China (Grant No. 23CJY051).
Data Availability Statement
Data were derived from public domain resources.
Acknowledgments
We greatly appreciate the editors and anonymous reviewers for their valuable time, constructive suggestions and insightful comments.
Conflicts of Interest
The authors declare no conflicts of interest.
References
- Lu, X.H.; Jiang, X.; Gong, M.Q. How land transfer marketization influence on green total factor productivity from the approach of industrial structure? Evidence from China. Land Use Policy 2020, 95, 104610. [Google Scholar] [CrossRef]
- Alem, H. The role of green total factor productivity to farm-level performance: Evidence from Norwegian dairy farms. Agric. Food Econ. 2023, 11, 2. [Google Scholar] [CrossRef]
- Foster, A.D.; Rosenzweig, M.R. Microeconomics of Technology Adoption. Annu. Rev. Econ. 2010, 2, 395–424. [Google Scholar] [CrossRef] [PubMed]
- Foster, A.D.; Rosenzweig, M.R. Are there too many farms in the world? Labormarket transaction costs, machine capacities and optimal farm size. J. Polit. Econ. 2022, 130, 636–680. [Google Scholar] [CrossRef]
- Ren, C.C.; Liu, S.; van Grinsven, H.; Reis, S.; Jin, S.Q.; Liu, H.B.; Gu, B.J. The impact of farm size on agricultural sustainability. J. Clean. Prod. 2019, 220, 357–367. [Google Scholar] [CrossRef]
- De Roest, K.; Ferrari, P.; Knickel, K. Specialisation and economies of scale or diversification and economies of scope? Assessing different agricultural development pathways. J. Rural. Stud. 2018, 59, 222–231. [Google Scholar] [CrossRef]
- Young, A.A. Increasing returns and economic progress. Econ. J. 1928, 38, 527–542. [Google Scholar] [CrossRef]
- Fei, R.L.; Lin, Z.Y.; Chunga, J. How land transfer affects agricultural land use efficiency: Evidence from China’s agricultural sector. Land Use Policy 2021, 103, 105300. [Google Scholar] [CrossRef]
- Wang, J.Y.; Chen, K.Z.; Das Gupta, S.; Huang, Z.H. Is small still beautiful? A comparative study of rice farm size and productivity in China and India. China Agric. Econ. Rev. 2015, 7, 484–509. [Google Scholar] [CrossRef]
- Manjunatha, A.V.; Anik, A.R.; Speelman, S.; Nuppenau, E.A. Impact of land fragmentation, farm size, land ownership and crop diversity on profit and efficiency of irrigated farms in India. Land Use Policy 2013, 31, 397–405. [Google Scholar] [CrossRef]
- Ricciardi, V.; Mehrabi, Z.; Wittman, H.; James, D.; Ramankutty, N. Higher yields and more biodiversity on smaller farms. Nat. Sustain. 2021, 4, 651–657. [Google Scholar] [CrossRef]
- Aragón, F.M.; Restuccia, D.; Rud, J.P. Are small farms really more productive than large farms? Food Policy 2022, 106, 102168. [Google Scholar] [CrossRef]
- Kerr, P. Adam Smith’s theory of growth and technological change revisited. Contrib. Political Econ. 1993, 12, 1–27. [Google Scholar] [CrossRef]
- Igata, M.; Hendriksen, A.; Heijman, W.J.M. Agricultural outsourcing: A comparison between the Netherlands and Japan. APSTRACT Appl. Stud. Agribus. Commer. 2008, 2, 29–34. [Google Scholar] [CrossRef]
- Deng, X.; Xu, D.D.; Zeng, M.; Qi, Y.B. Does outsourcing affect agricultural productivity of farmer households? Evidence from China. China Agric. Econ. Rev. 2020, 12, 673–688. [Google Scholar] [CrossRef]
- Qing, C.; Zhou, W.F.; Song, J.H.; Deng, X.; Xu, D.D. Impact of outsourced machinery services on farmers’ green production behavior: Evidence from Chinese rice farmers. J. Environ. Manag. 2023, 327, 116843. [Google Scholar] [CrossRef] [PubMed]
- Zhang, X.B.; Yang, J.; Thomas, R. Mechanization outsourcing clusters and division of labor in Chinese agriculture. China Econ. Rev. 2017, 43, 184–195. [Google Scholar] [CrossRef]
- Picazo-Tadeo, A.J.; Reig-Martínez, E. Outsourcing and efficiency:: The case of Spanish citrus farming. Agron. Econ-Blackwell 2006, 35, 213–222. [Google Scholar] [CrossRef]
- Qu, X.; Kojima, D.; Nishihara, Y.; Wu, L.P.; Ando, M. Can harvest outsourcing services reduce field harvest losses of rice in China? J. Integr. Agric. 2021, 20, 1396–1406. [Google Scholar] [CrossRef]
- Chen, Y.Y.; Jiao, C.Q. How agricultural contracting services are reshaping small-scale household farming in China. J. Peasant. Stud. 2024, 51, 339–357. [Google Scholar] [CrossRef]
- Zhang, Y.J.; Zhang, J.; Liu, Y.; Zhu, P.X. Agricultural machinery service adoption and farmland transfer-in decision: Evidence from rural China. Front. Env. Sci.-Switz. 2023, 11, 1195877. [Google Scholar] [CrossRef]
- Qian, L.; Lu, H.; Gao, Q.; Lu, H.L. Household-owned farm machinery vs. outsourced machinery services: The impact of agricultural mechanization on the land leasing behavior of relatively large-scale farmers in China. Land Use Policy 2022, 115, 106008. [Google Scholar] [CrossRef]
- Xu, C.H.; Wang, Q.; Fahad, S.; Kagatsume, M.; Yu, J. Impact of Off-Farm Employment on Farmland Transfer: Insight on the Mediating Role of Agricultural Production Service Outsourcing. Agriculture 2022, 12, 1617. [Google Scholar] [CrossRef]
- Zhang, D.; Xu, Z.G.; Liu, J.C. Agricultural production services and land transfer: Whether service scale management postpones land scale management ananalysis from the perspectives of factor constraint mitigation effect and land rent rise effect. China Rural. Survey 2022, 2, 19–38. [Google Scholar]
- Yi, Q.; Chen, M.Y.; Sheng, Y.; Huang, J.K. Mechanization services, farm productivity and institutional innovation in China. China Agric. Econ. Rev. 2019, 11, 536–554. [Google Scholar] [CrossRef]
- Qiu, T.; Shi, X.; He, Q.; Luo, B. The paradox of developing agricultural mechanization services in China: Supporting or kicking out smallholder farmers? China Econ. Rev. 2021, 69, 101680. [Google Scholar] [CrossRef]
- Coase, R.H. The nature of the firm. Economica 1937, 4, 386–405. [Google Scholar] [CrossRef]
- Adamopoulos, T.; Brandt, L.; Leight, J.; Restuccia, D. Misallocation, Selection, and Productivity: A Quantitative Analysis With Panel Data From China. Econometrica 2022, 90, 1261–1282. [Google Scholar] [CrossRef]
- Hsieh, C.T.; Klenow, P.J. Misallocation and Manufacturing Tfp in China and India. Q. J. Econ. 2009, 124, 1403–1448. [Google Scholar] [CrossRef]
- Lu, H.; Xie, H.L. Impact of changes in labor resources and transfers of land use rights on agricultural non-point source pollution in Jiangsu Province, China. J. Environ. Manag. 2018, 207, 134–140. [Google Scholar] [CrossRef]
- Wu, Y.Y.; Xi, X.C.; Tang, X.; Luo, D.M.; Gu, B.J.; Lam, S.K.; Vitousek, P.M.; Chen, D.L. Policy distortions, farm size, and the overuse of agricultural chemicals in China. Proc. Natl. Acad. Sci. USA 2018, 115, 7010–7015. [Google Scholar] [CrossRef]
- Ju, X.T.; Gu, B.J.; Wu, Y.Y.; Galloway, J.N. Reducing China’s fertilizer use by increasing farm size. Glob. Environ. Chang.-Human. Policy Dimens. 2016, 41, 26–32. [Google Scholar] [CrossRef]
- Goldstein, M.; Udry, C. The Profits of Power: Land Rights and Agricultural Investment in Ghana. J. Polit. Econ. 2008, 116, 981–1022. [Google Scholar] [CrossRef]
- Cao, Y.M.; Bai, Y.L.; Zhang, L.X. The impact of farmland property rights security on the farmland investment in rural China. Land Use Policy 2020, 97, 104736. [Google Scholar] [CrossRef]
- Eswaran, M.; Kotwal, A. Access to capital and agrarian production organisation. Econ. J. 1986, 96, 482–498. [Google Scholar] [CrossRef]
- Binswanger, H.P.; Deininger, K.; Feder, G. Revolt and reform in agricultural land relations. Handb. Dev. Econ. 1995, 3, 2659–2772. [Google Scholar]
- Liu, Y.; Yan, B.J.; Wang, Y.; Zhou, Y.H. Will land transfer always increase technical efficiency in China?—A land cost perspective. Land Use Policy 2019, 82, 414–421. [Google Scholar] [CrossRef]
- Sheng, Y.; Ding, J.P.; Huang, J.K. The Relationship between Farm Size and Productivity in Agriculture: Evidence from Maize Production in Northern China. Am. J. Agron. Econ. 2019, 101, 790–806. [Google Scholar] [CrossRef]
- Li, R.N.; Yu, Y.L. Impacts of Green Production Behaviors on the Income Effect of Rice Farmers from the Perspective of Outsourcing Services: Evidence from the Rice Region in Northwest China. Agriculture 2022, 12, 1682. [Google Scholar] [CrossRef]
- Lu, H.; Duan, N.; Chen, Q.R. Impact of agricultural production outsourcing services on carbon emissions in China. Environ. Sci. Pollut. Res. 2023, 30, 35985–35995. [Google Scholar] [CrossRef]
- Yang, Y.F.; Yu, Y.L.; Li, R.N.; Jiang, D.B. Impact of pesticide outsourcing services on farmers’ low-carbon production behavior. Front. Environ. Sci. 2023, 11, 1226039. [Google Scholar] [CrossRef]
- Chai, Q.; Qin, A.Z.; Gan, Y.T.; Yu, A.Z. Higher yield and lower carbon emission by intercropping maize with rape, pea, and wheat in arid irrigation areas. Agron. Sustain. Dev. 2014, 34, 535–543. [Google Scholar] [CrossRef]
- Belton, B.; Win, M.T.; Zhang, X.B.; Filipski, M. The rapid rise of agricultural mechanization in Myanmar. Food Policy 2021, 101, 102095. [Google Scholar] [CrossRef]
- Qu, X.; Kojima, D.; Wu, L.P.; Ando, M. Do Farming Scale and Mechanization Affect Moral Hazard in Rice Harvest Outsourcing Service in China? Agriculture 2022, 12, 1205. [Google Scholar] [CrossRef]
- Chen, Y.J.; Lu, H.; Luo, J.W. How does agricultural production outsourcing services affect chemical fertilizer use under topographic constraints: A farm-level analysis of China. Environ. Sci. Pollut. Res. 2023, 30, 100861–100872. [Google Scholar] [CrossRef] [PubMed]
- Yang, C.; Zeng, W.; Yang, X. Coupling coordination evaluation and sustainable development pattern of geo-ecological environment and urbanization in Chongqing municipality, China. Sustain. Cities Soc. 2020, 61, 102271. [Google Scholar] [CrossRef]
- Wang, S.J.; Ma, H.T.; Zhao, Y.B. Exploring the relationship between urbanization and the eco-environment—A case study of Beijing-Tianjin-Hebei region. Ecol. Indic. 2014, 45, 171–183. [Google Scholar] [CrossRef]
- Fan, Y.P.; Fang, C.L.; Zhang, Q. Coupling coordinated development between social economy and ecological environment in Chinese provincial capital cities-assessment and policy implications. J. Clean. Prod. 2019, 229, 289–298. [Google Scholar] [CrossRef]
- Liu, N.N.; Liu, C.Z.; Xia, Y.F.; Da, B.W. Examining the coordination between urbanization and eco-environment using coupling and spatial analyses: A case study in China. Ecol. Indic. 2018, 93, 1163–1175. [Google Scholar] [CrossRef]
- Wang, S.J.; Kong, W.; Ren, L.; Zhi, D.D.; Dai, B.T. Research on misuses and modification of coupling coordination degree model in China. J. Nat. Resour. 2021, 36, 793–810. [Google Scholar] [CrossRef]
- Li, W.W.; Yi, P.T. Assessment of city sustainability-Coupling coordinated development among economy, society and environment. J. Clean. Prod. 2020, 256, 120453. [Google Scholar] [CrossRef]
- IPCC. Climate Change 2007: Mitigation of Contribution of Working Group III to the Fourth Assessment Report of the Intergovernmental Panel on Climate Change: Summary for Policymakers and Technical Summary; Cambridge University Press: Cambridge, UK, 2007. Available online: https://www.ipcc.ch/report/ar4/wg3/ (accessed on 2 November 2023).
- Liu, D.D.; Zhu, X.Y.; Wang, Y.F. China’s agricultural green total factor productivity based on carbon emission: An analysis of evolution trend and influencing factors. J. Clean. Prod. 2021, 278, 123692. [Google Scholar] [CrossRef]
- Hansen, B.E. Threshold effects in non-dynamic panels: Estimation, testing, and inference. J. Econom. 1999, 93, 345–368. [Google Scholar] [CrossRef]
- Haans, R.F.J.; Pieters, C.; He, Z.L. Thinking about u: Theorizing and testing u- and inverted u-shaped relationships in strategy research. Strateg. Manag. J. 2016, 37, 1177–1195. [Google Scholar] [CrossRef]
Figure 1.
Changes in farmland rental market transactions. (a) es = ed; (b) es > ed; (c) es < ed and TD-TS > ed-es; (d) es < ed and TD-TS < ed-es.
Figure 1.
Changes in farmland rental market transactions. (a) es = ed; (b) es > ed; (c) es < ed and TD-TS > ed-es; (d) es < ed and TD-TS < ed-es.
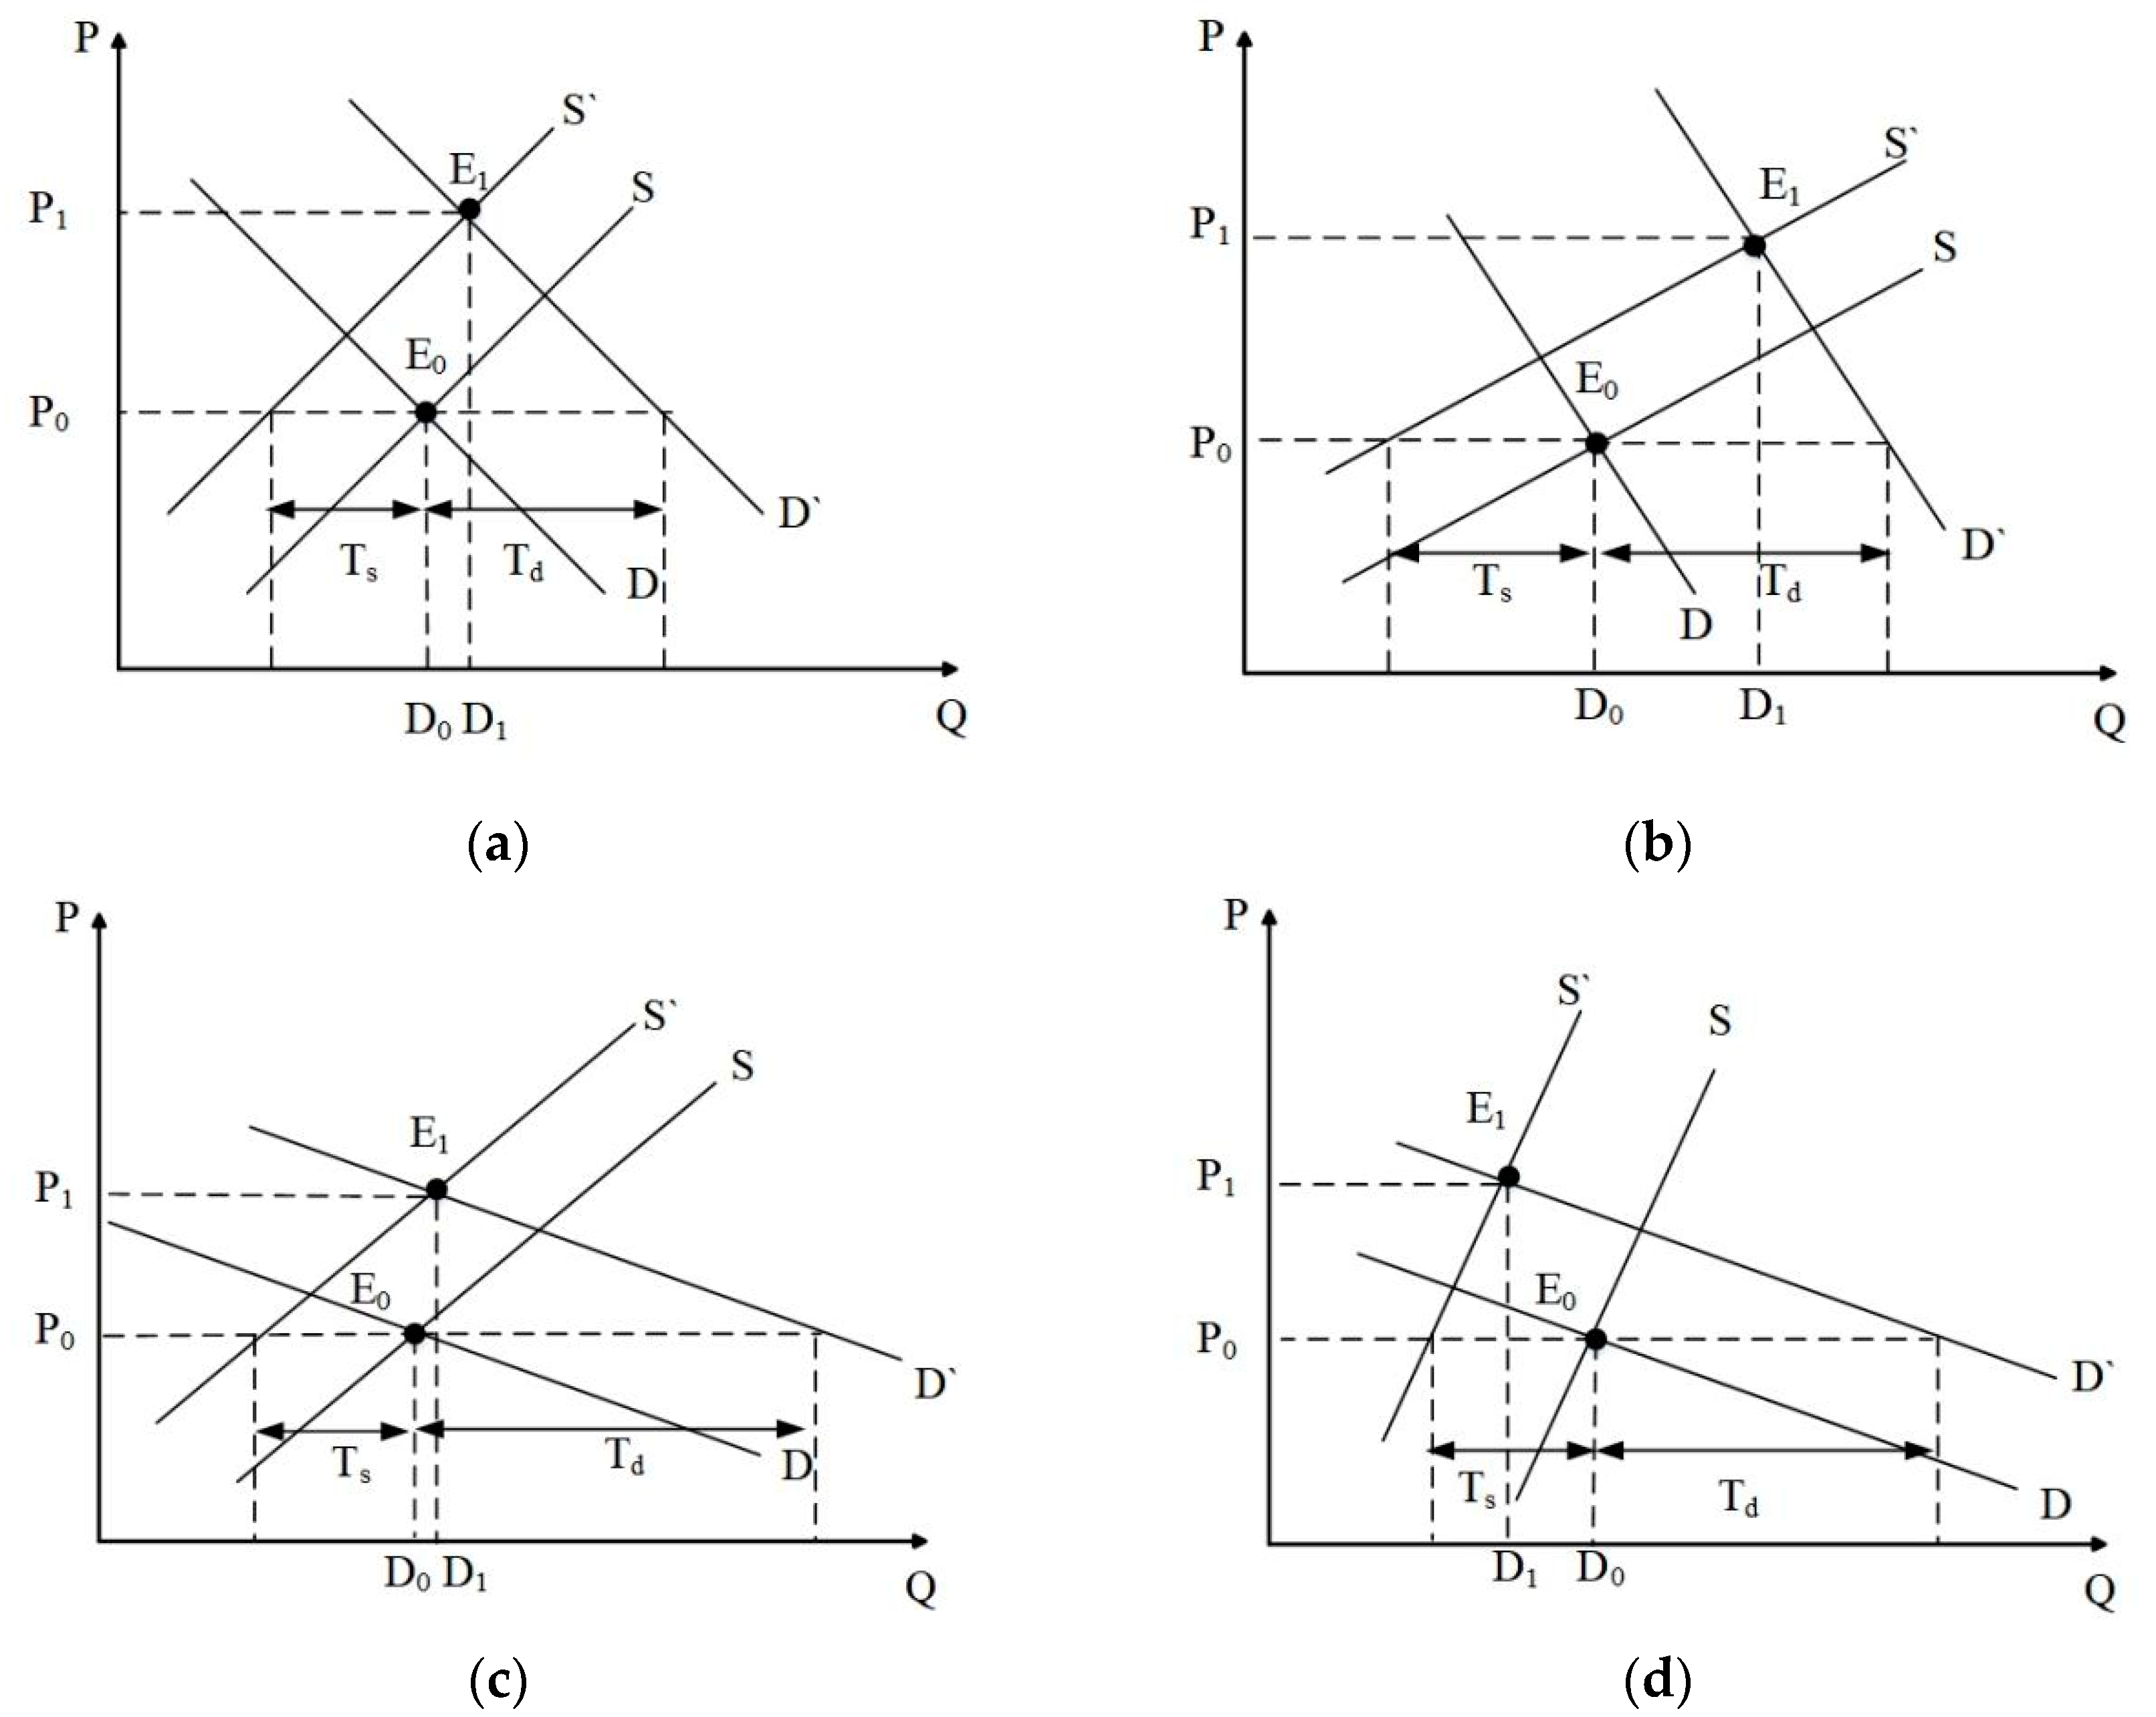
Figure 2.
Theoretical analysis framework.
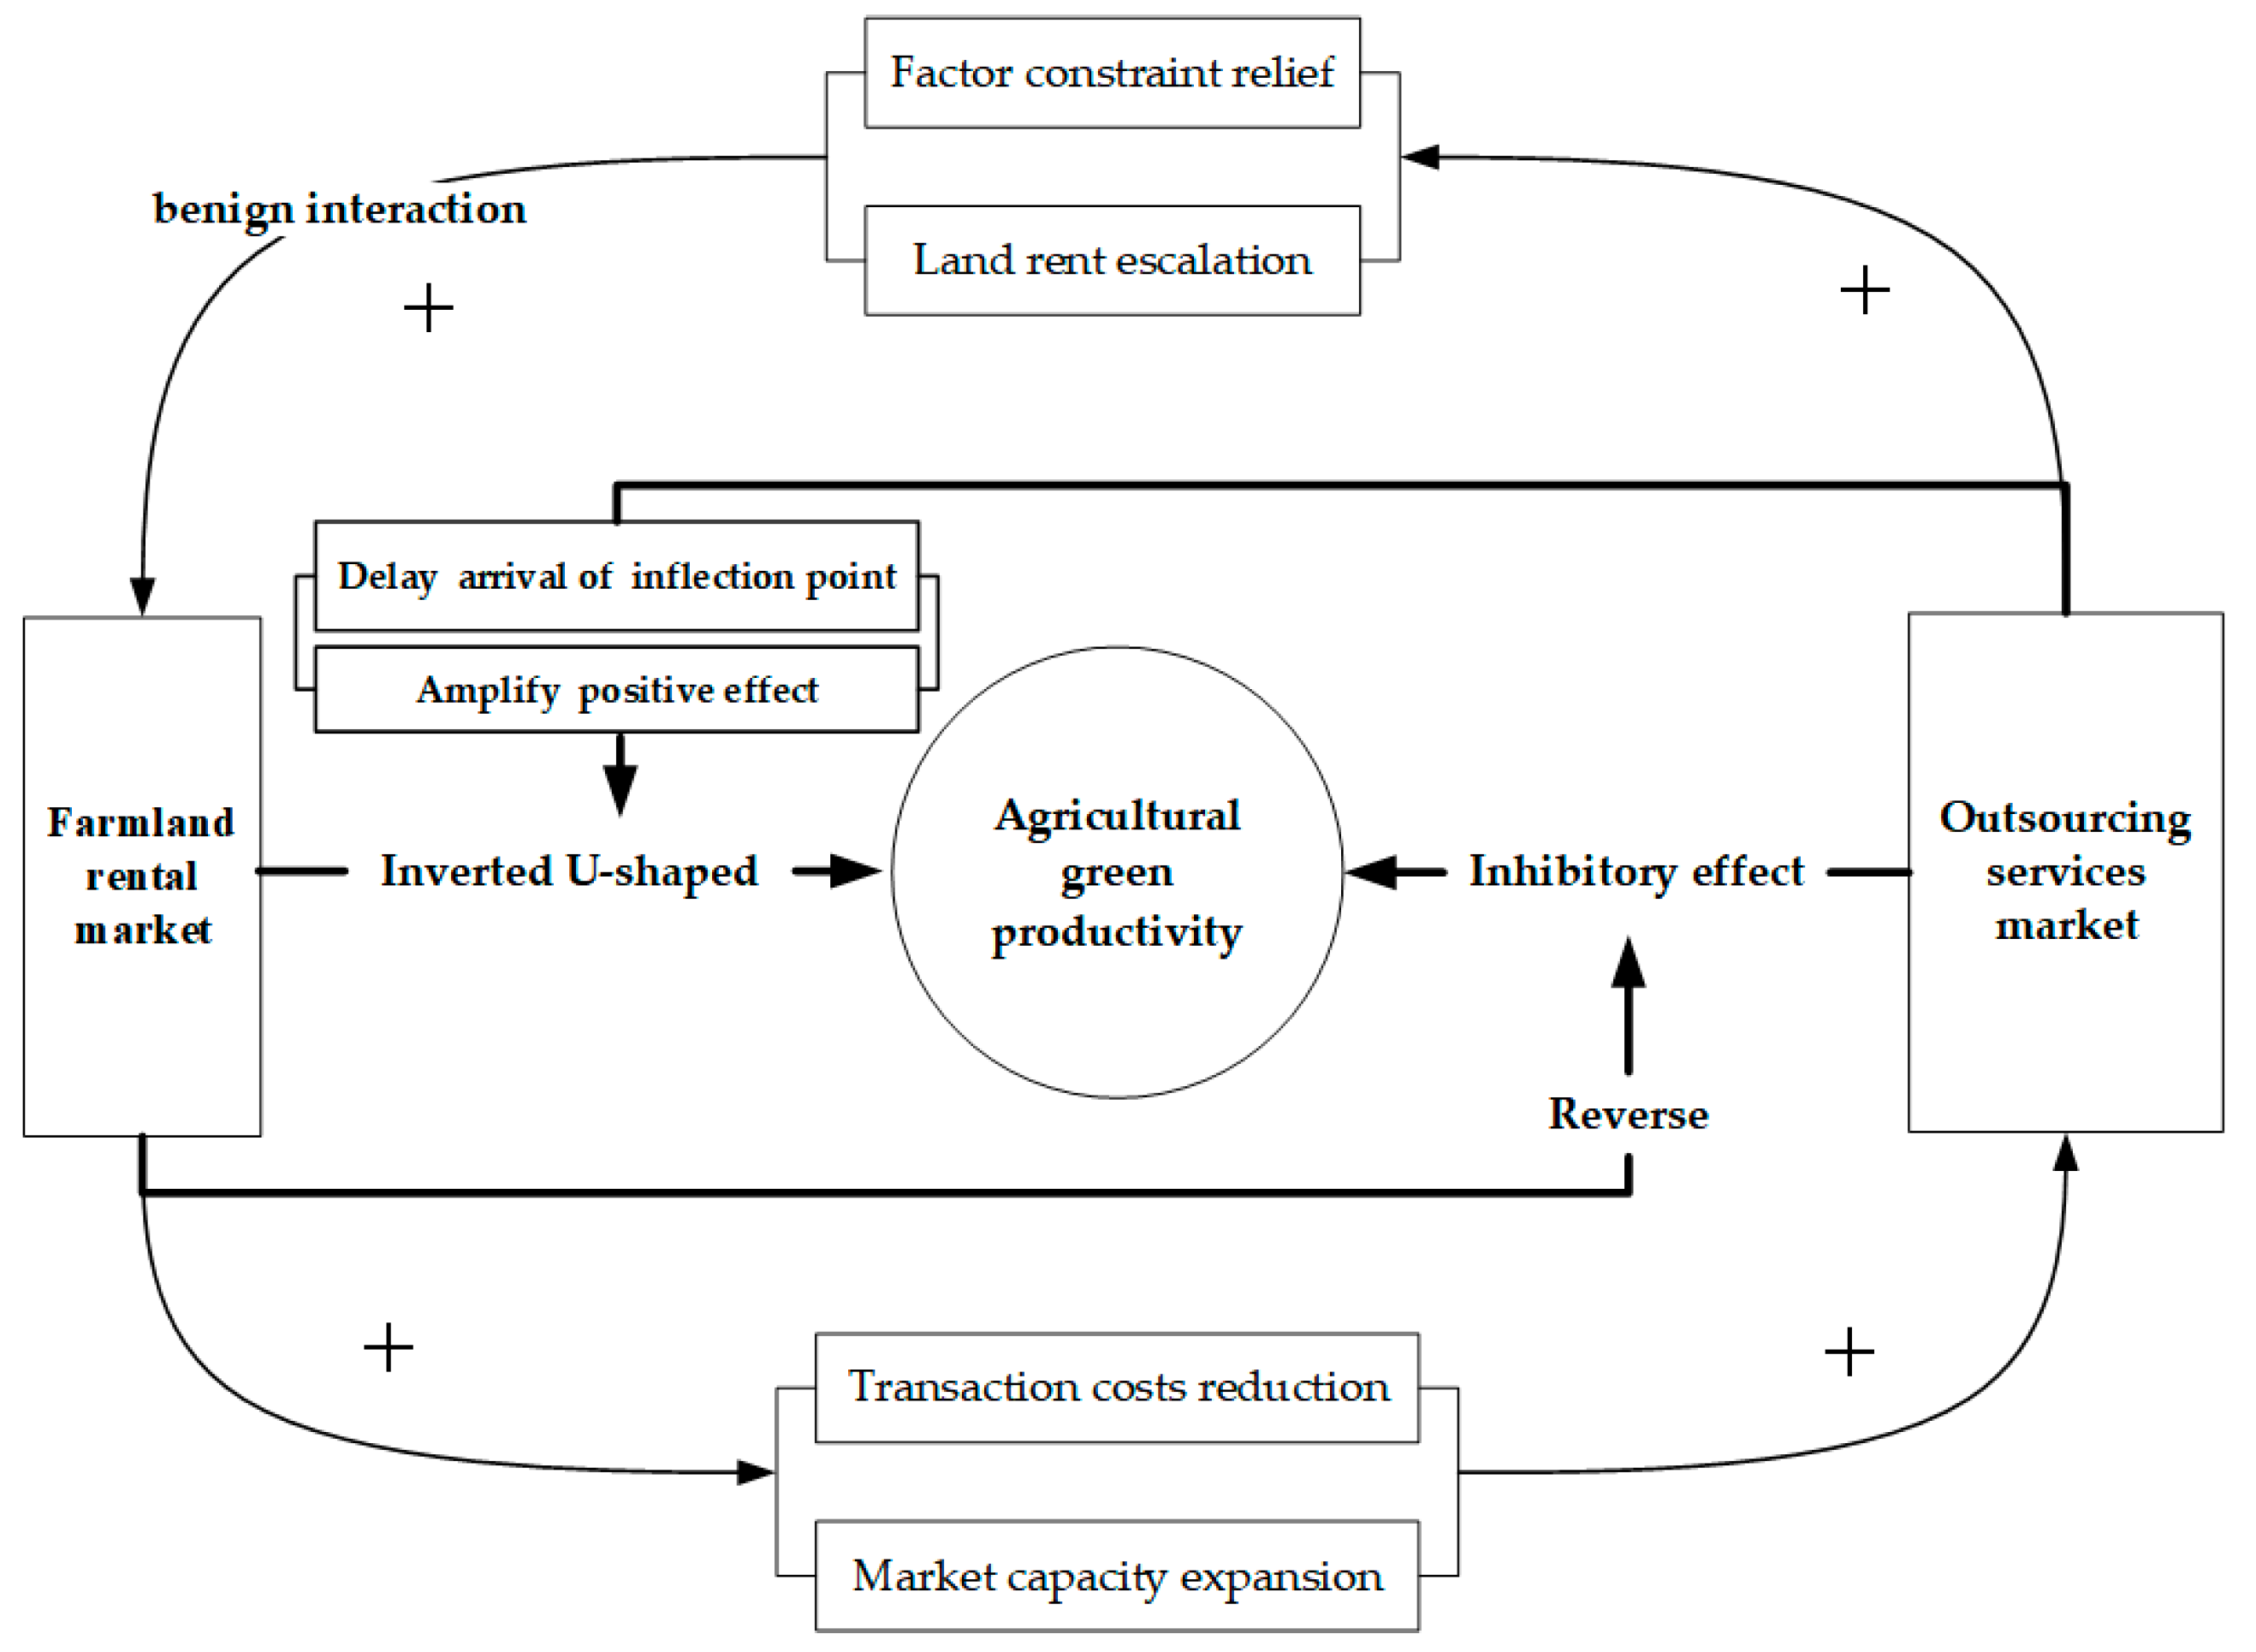
Figure 3.
Time-series changes in farmland rental market and its subsystems.
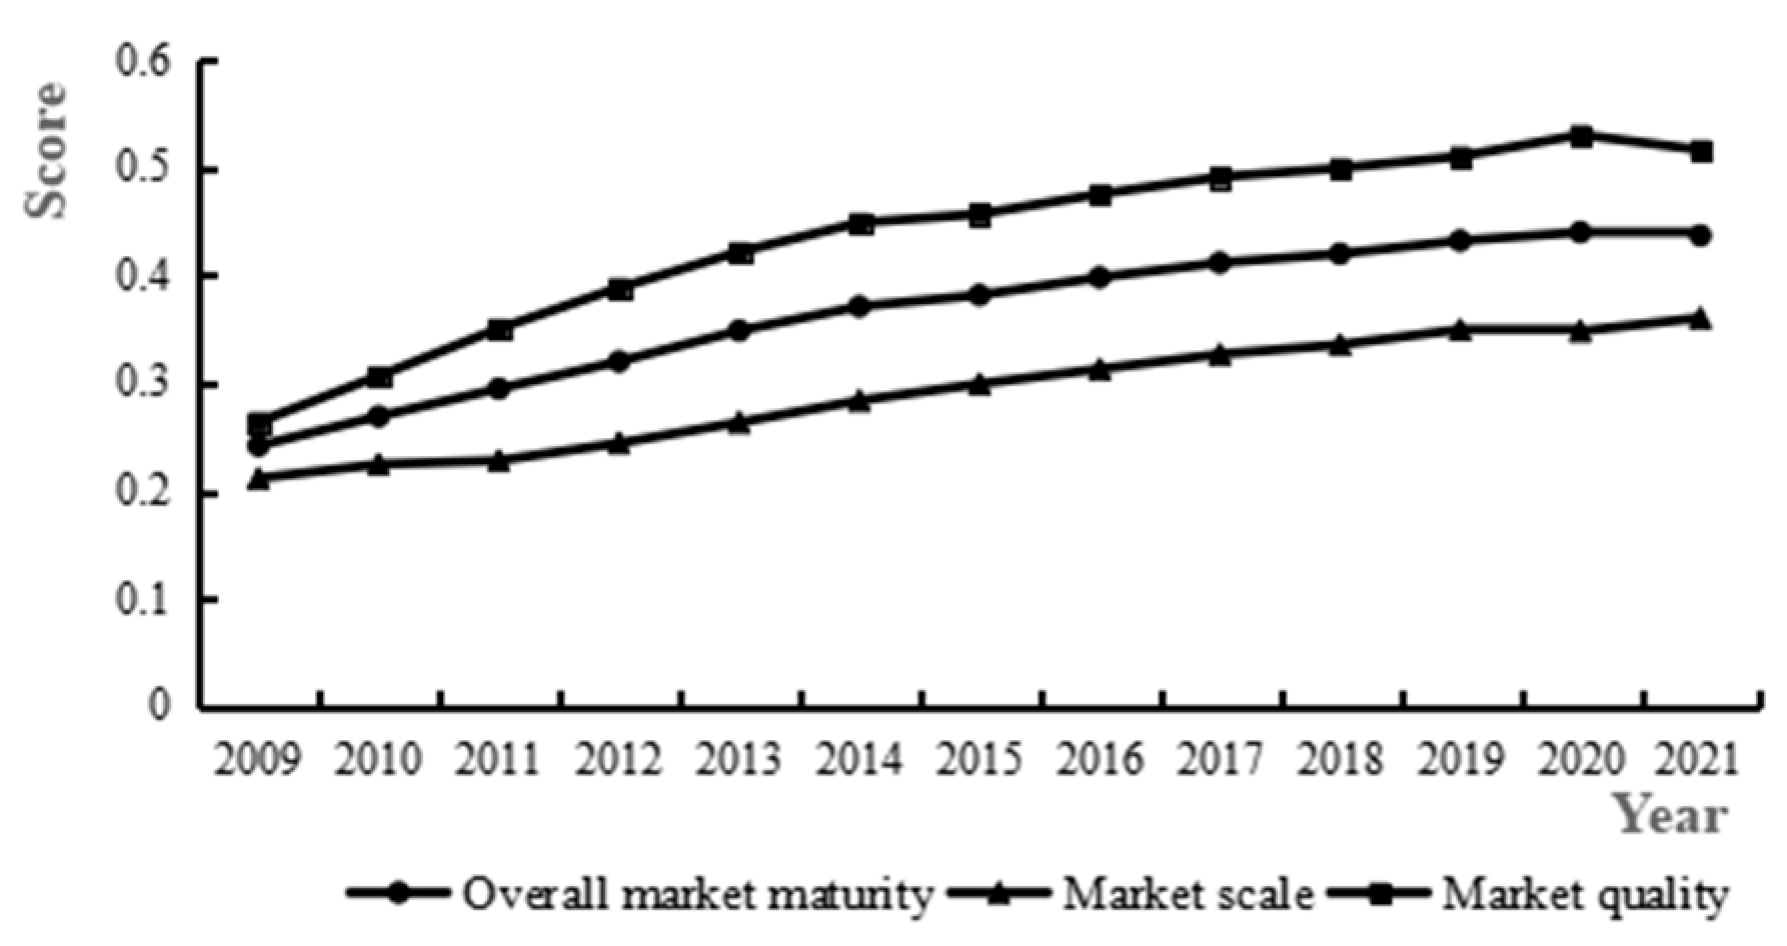
Figure 4.
Time-series changes in agricultural outsourcing services market and its subsystems.
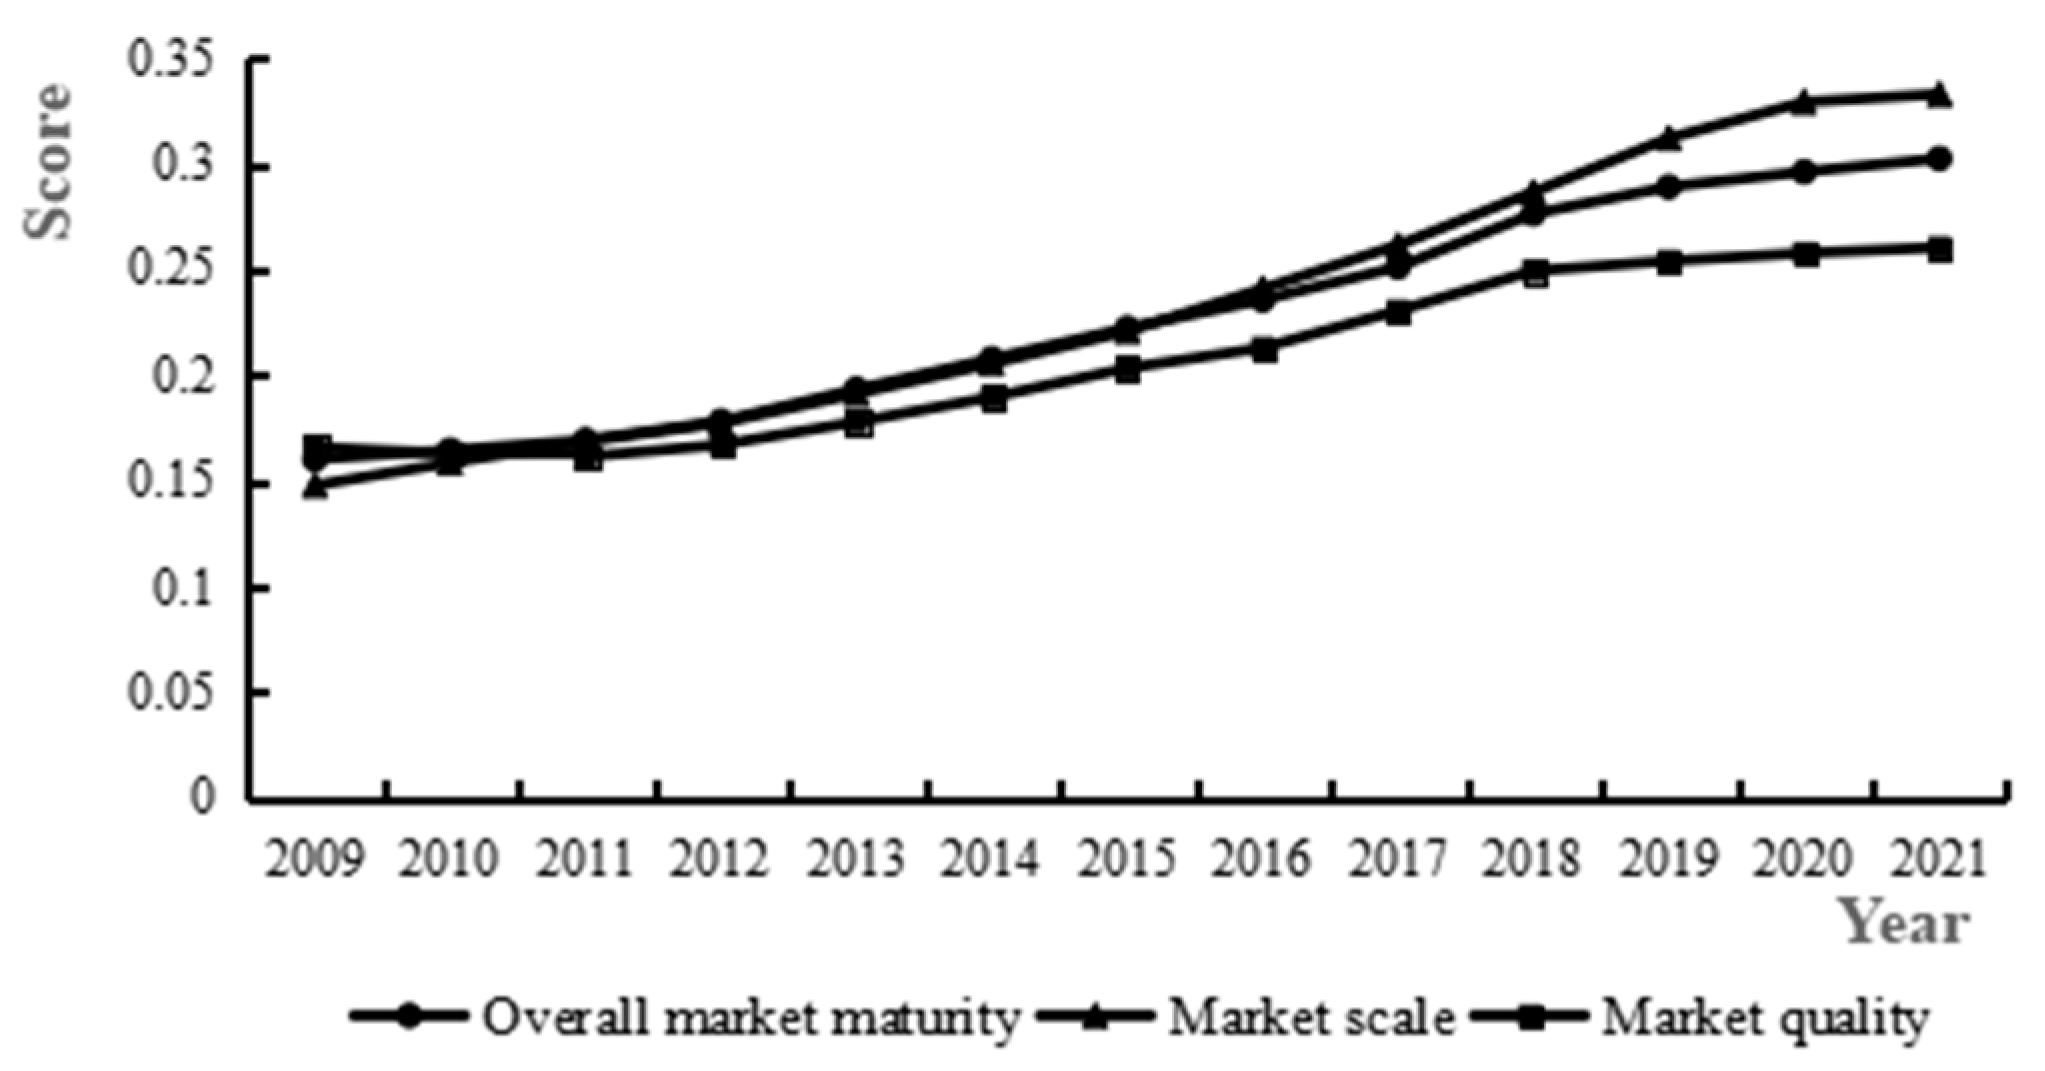
Figure 5.
Time-series change in the coupling coordination degree and relative development degree.
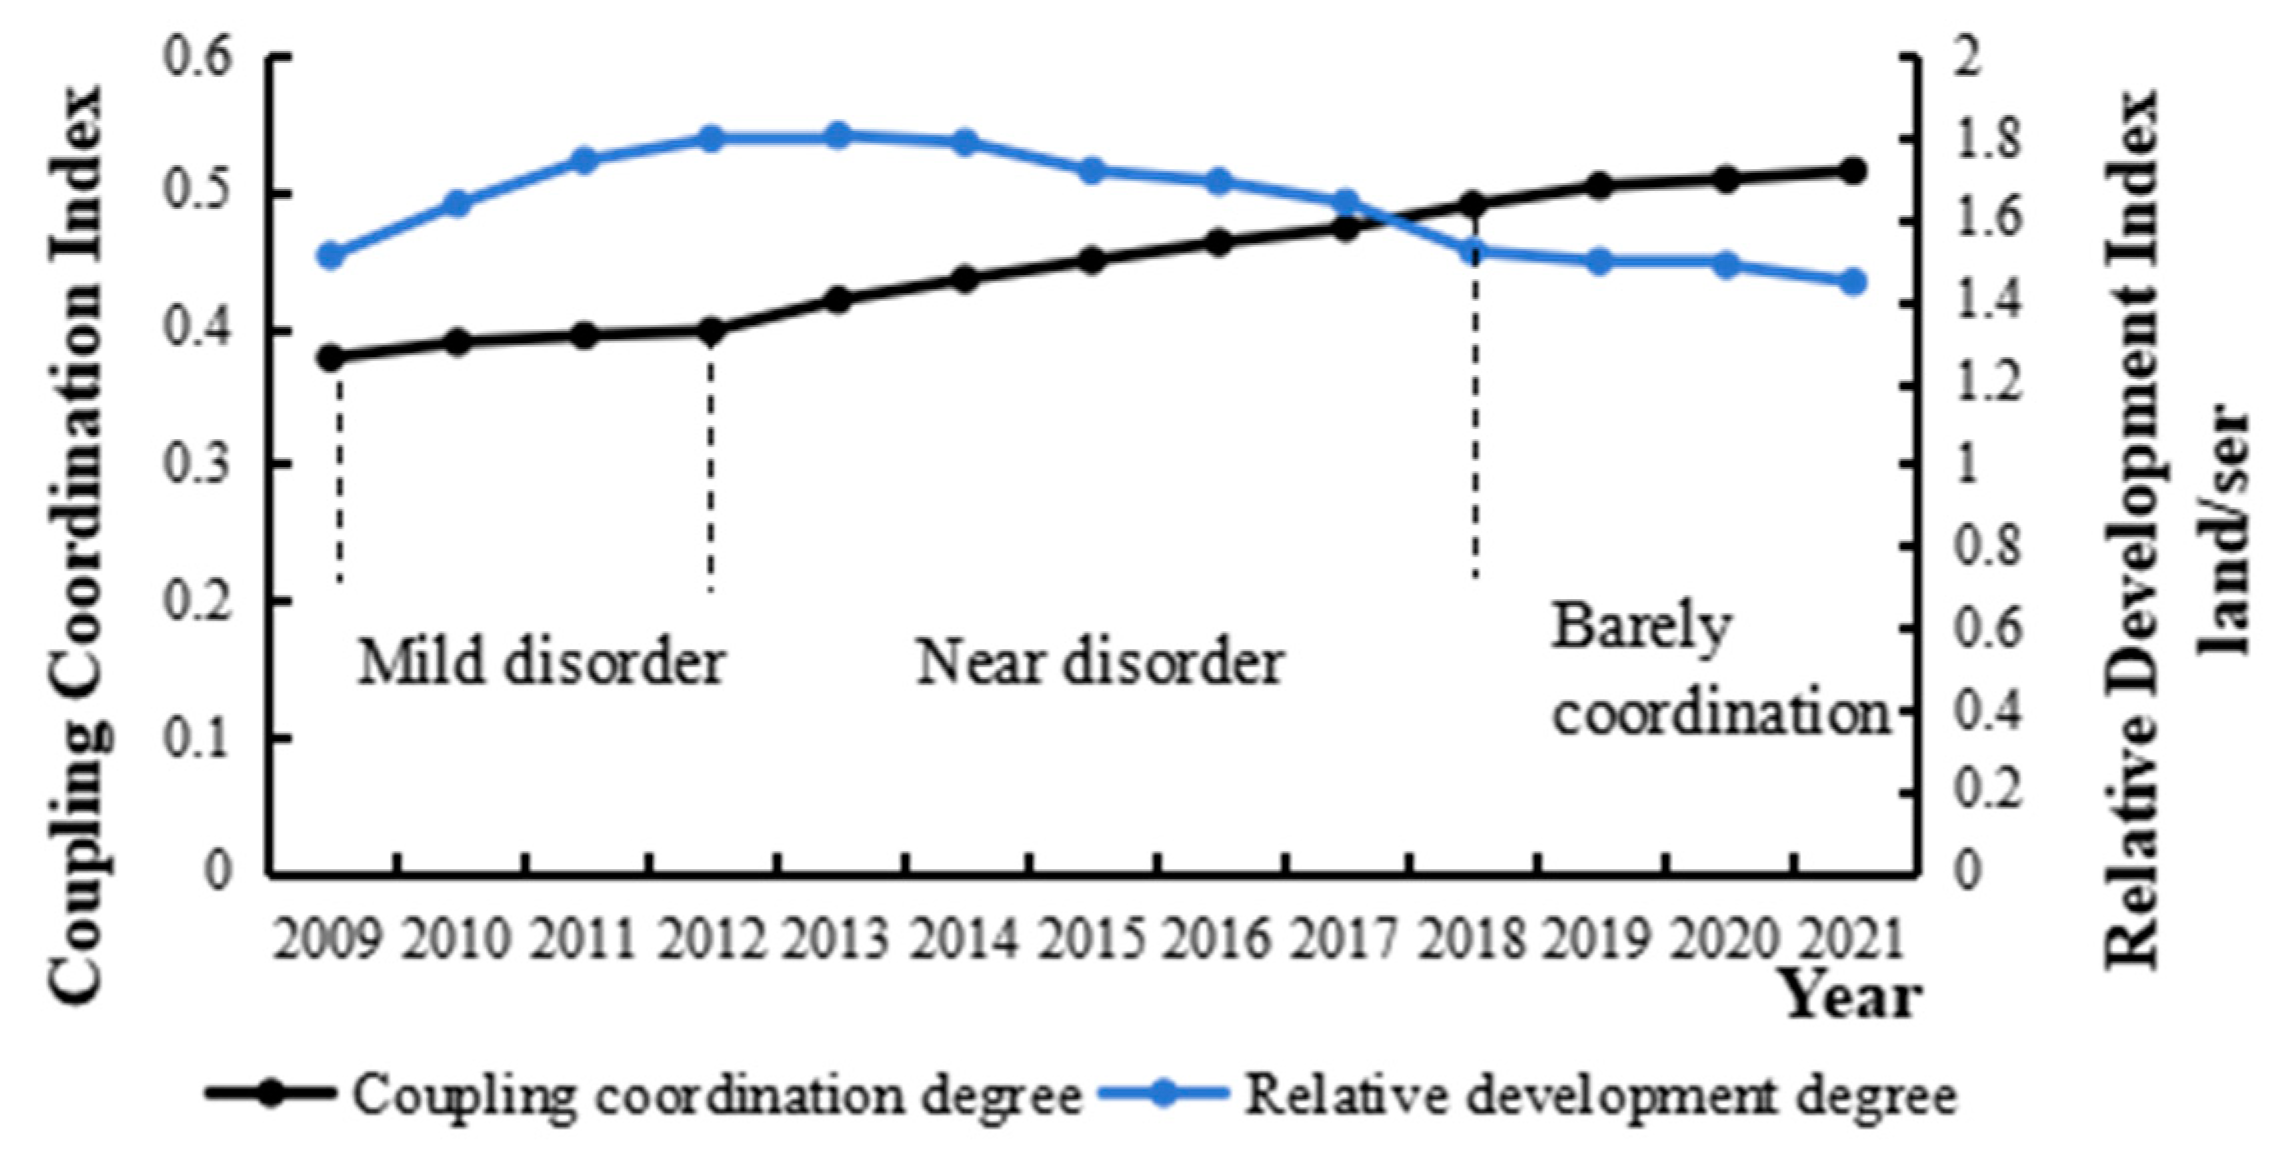
Figure 6.
Time-series changes in the coupling coordination degree in different regions. (a) Eastern, central and western regions; (b) High, medium and low agricultural dependency regions.
Figure 6.
Time-series changes in the coupling coordination degree in different regions. (a) Eastern, central and western regions; (b) High, medium and low agricultural dependency regions.


Table 1.
The indicators and weights.
| Subsystems | Primary Indicators | Weights | Secondary Indicators | Weights | ||||
|---|---|---|---|---|---|---|---|---|
| W′ | W | U | W′ | W | U | |||
| Farmland rental market | Market scale | 0.39 | 0.69 | 0.51 | Transaction volume I1 | 0.16 | 0.33 | 0.23 |
| Farmland per laborer I2 | 0.23 | 0.36 | 0.28 | |||||
| Market quality | 0.61 | 0.31 | 0.49 | Proportion of farmland transferring to cooperatives and enterprises in total transactions I3 | 0.44 | 0.17 | 0.33 | |
| Proportion of farmland rented with a transfer contract in total transactions I4 | 0.17 | 0.14 | 0.16 | |||||
| Agricultural outsourcing services market | Market scale | 0.46 | 0.23 | 0.37 | Output value of agricultural various support services per unit sowing area I5 | 0.22 | 0.12 | 0.18 |
| Added value of agricultural various support services per unit sowing area I6 | 0.24 | 0.11 | 0.19 | |||||
| Market quality | 0.54 | 0.77 | 0.63 | Proportion of service organizations with original value of machinery exceeding 500,000 yuan in total service organizations I7 | 0.16 | 0.12 | 0.14 | |
| Proportion of output value of agricultural various support services in total agricultural output I8 | 0.07 | 0.10 | 0.08 | |||||
| Proportion of added value of agricultural various support services in added value of agriculture I9 | 0.17 | 0.04 | 0.12 | |||||
| Proportion of agricultural pre- and post-production support services personnel in total agricultural support services personnel I10 | 0.14 | 0.51 | 0.29 | |||||
Table 2.
Classification of the coupling coordination evaluation levels.
| Index Ranges | Coupling Coordination Types | Index Ranges | Coupling Coordination Types |
|---|---|---|---|
| [0, 0.1) | Extreme disorder | [0.5, 0.6) | Bare coordination |
| [0.1, 0.2) | Severe disorder | [0.6, 0.7) | Elementary coordination |
| [0.2, 0.3) | Moderate disorder | [0.7, 0.8) | Intermediate coordination |
| [0.3, 0.4) | Mild disorder | [0.8, 0.9) | Good coordination |
| [0.4, 0.5) | Near disorder | [0.9, 1.0) | Quality coordination |
Table 3.
Stage of agricultural large-scale management in each region.
| Regions | Development Stage of Agricultural Large-Scale Management |
|---|---|
| Eastern | Bare coordination—land-scale management lagging |
| Central | Near disorder—synchronized lagging |
| Western | Near disorder—service-scale management lagging |
| High agricultural dependency | Near disorder—synchronized lagging |
| Medium agricultural dependency | Bare coordination—service-scale management lagging |
| Low agricultural dependency | Bare coordination—synchronized development |
Table 4.
Estimation results of improved effect.
| Variables | Benchmark Regression: Two-Way Fixed Effects Model | Robust Test: IV-2SLS |
|---|---|---|
| lnCCD | 0.6735 *** (5.63) | 0.8720 *** (3.17) |
| lnDIS | −0.0137 (−1.53) | −0.0159 (−1.37) |
| lnATL | −0.0166 (−0.39) | −0.0211 (−0.59) |
| lnGOE | −0.1240 ** (−2.17) | −0.1555 *** (−2.96) |
| lnAVA | 0.5489 *** (10.12) | 0.5878 *** (9.01) |
| lnPES | −0.1707 *** (−2.69) | −0.1939 *** (−3.24) |
| lnFER | −0.3739 *** (−3.71) | −0.4061 *** (−4.41) |
| lnPSTR | −0.6432 *** (−4.93) | −0.7136 *** (−5.15) |
| Year | Yes | Yes |
| Province | Yes | Yes |
| Hausman P | 0.0000 | — |
| Weak instrumental variables test: F-value | — | 86.6052 |
| Observation | 390 | 390 |
Notes: ***, ** indicate rejection of the null hypothesis at the 1%, 5% levels, respectively. Benchmark regression with t-values in parentheses, robust test with z-values in parentheses.
Table 5.
Estimation results of the impact of the two markets on agricultural green TFP, respectively.
Table 5.
Estimation results of the impact of the two markets on agricultural green TFP, respectively.
| Variables | Agricultural Green TFP |
|---|---|
| OSM | −1.0571 *** (−3.83) |
| LRM | 1.3599 *** (4.15) |
| DIS | −0.4880 *** (−3.69) |
| ATL | 0.0447 (0.31) |
| GOE | −1.4206 (1.36) |
| AVA | 10.1049 *** (8.93) |
| PES | 0.0002 (0.03) |
| FER | −0.0001 (−0.08) |
| PSTR | −0.6305 (−1.26) |
| Year | Yes |
| Province | Yes |
| Hausman P | 0.0000 |
Notes: *** indicates rejection of the null hypothesis at the 1% level. The t statistic is in brackets on the right side of the parameter.
Table 6.
Results of the threshold test: farmland market as the threshold variable.
| Threshold Variable | Number of Thresholds | F-Value | p-Value | Threshold Value | 95% Confidence Interval |
|---|---|---|---|---|---|
| Maturity of farmland rental market | Single Threshold | 45.67 | 0.0500 | 0.2198 ** | [0.2061, 0.2209] |
| Double Threshold | 34.35 | 0.0333 | 0.3536 ** | [0.3458, 0.3551] | |
| triple threshold | 23.83 | 0.5800 | — | — |
Notes: ** indicates rejection of the null hypothesis at the 5% level. Bootstrap sampling 300 times.
Table 7.
Threshold model estimation results.
| Variables | Agricultural Green TFP |
|---|---|
| OSM (LRM ≤ 0.2198) | −1.4358 ** (−2.29) |
| OSM (0.2198 < LRM ≤ 0.3536) | 0.9177 ** (1.99) |
| OSM (LRM > 0.3536) | 2.5779 *** (7.45) |
| DIS | −1.1973 *** (−5.92) |
| ATL | 0.3630 * (1.65) |
| GOE | 3.6446 ** (2.32) |
| AVA | 4.5469 *** (2.66) |
| PES | −0.0080 (−1.00) |
| FER | −0.0032 *** (−4.74) |
| PSTR | −3.3263 *** (−4.48) |
Notes: ***, **, and * indicate rejection of the null hypothesis at the 1%, 5%, and 10% levels, respectively. The t statistic is in brackets on the right side of the parameter.
Table 8.
Estimation results of inverted U-shaped curve.
| Variables | Agricultural Green TFP | |
|---|---|---|
| (1) | (2) | |
| LRMS | 5.7850 *** (7.95) | 7.0892 *** (5.33) |
| LRMS2 | −6.4895 *** (−7.54) | −4.7713 *** (−2.62) |
| LRMS*OSM | — | −8.8469 ** (−2.24) |
| LRMS2*OSM | — | 5.5822 ** (2.16) |
| Constant | −1.0578 ** (−2.05) | −1.5517 *** (−2.77) |
| Controls | YES | YES |
| Year | YES | YES |
| Province | YES | YES |
| R2 | 0.8617 | 0.8812 |
Notes: ***, ** indicate rejection of the null hypothesis at the 1%, 5% levels, respectively. The t statistic is in the brackets on the right side of the parameter.
Table 9.
Results of the threshold test: services market as the threshold variable.
| Threshold Variable | Number of Thresholds | F-Value | p-Value | Threshold Value | 95% Confidence Interval |
|---|---|---|---|---|---|
| Maturity of outsourcing services market | Single Threshold | 41.11 | 0.0233 | 0.1136 ** | [0.1083, 0.1147] |
| Double Threshold | 38.30 | 0.0133 | 0.1898 ** | [0.1858, 0.1904] | |
| Triple threshold | 14.64 | 0.7633 | — | — |
Notes: ** indicates rejection of the null hypothesis at the 5% level. Bootstrap sampling 300 times.
Table 10.
Estimation results of threshold model.
| Variables | Agricultural Green TFP |
|---|---|
| LRM (OSM ≤ 0.1136) | 2.5209 *** (6.84) |
| LRM (0.1136 < OSM ≤ 0.1898) | 3.7356 *** (12.27) |
| LRM (OSM > 0.1898) | 4.5940 *** (18.39) |
| DIS | −0.7008 *** (−4.29) |
| ATL | 0.3601 ** (2.09) |
| GOE | 3.5558 *** (2.71) |
| AVA | 8.3607 *** (6.05) |
| PES | −0.0092 (−1.47) |
| FER | −0.0024 *** (−4.66) |
| PSTR | −3.8640 *** (−6.72) |
Notes: ***, ** indicate rejection of the null hypothesis at the 1%, 5% levels, respectively. The t statistic is in the brackets on the right side of the parameter.
Table 11.
Test results related to spatial model selection.
| Test Type | Statistics | Results |
|---|---|---|
| Global Moran’s I | 0.614 *** (16.712) | Spatial model |
| LM_test for no spatial lag | 132.191 *** (0.00) | SDM |
| Robust LM_test for no spatial lag | 74.177 *** (0.00) | |
| LM_test for no spatial error | 65.760 *** (0.00) | |
| Robust LM_test for no spatial error | 7.747 *** (0.005) | |
| Wald_spatial_lag test | 19.67 ** (0.0117) | SDM |
| LR_spatial_lag test | 53.50 *** (0.0000) | SDM |
| Wald_spatial_error test | 19.37 ** (0.0130) | SDM |
| LR_spatial_error test | 55.25 *** (0.0000) | SDM |
| Hausman test | 31.05 ** (0.0197) | Fixed effect |
Notes: ***, ** indicate rejection of the null hypothesis at the 1%, 5% levels, respectively. Global Moran’s I with z values in parentheses, other coefficients with p values in parentheses.
Table 12.
Estimation results of static and dynamic SDM.
| Variables | Static SDM | Dynamic SDM |
|---|---|---|
| L.lnAGTFP | — | 0.1223 ** (2.40) |
| WL.lnAGTFP | — | 0.4566 *** (4.41) |
| lnCCD | 1.006 *** (8.73) | 0.8694 *** (6.87) |
| lnDIS | −0.0050 (−1.53) | −0.0042 (−1.26) |
| lnATL | −0.0053 (−0.13) | −0.0348 (−0.83) |
| lnGOE | −0.1875 *** (−3.34) | −0.1692 *** (−2.88) |
| lnAVA | 0.6350 *** (11.15) | 0.6177 *** (10.21) |
| lnPES | 0.1678 *** (2.75) | 0.1747 *** (2.72) |
| lnFER | −0.3114 *** (−3.28) | −0.3717 *** (−3.80) |
| lnPSTR | −0.5051 *** (−3.90) | −0.6140 *** (−4.45) |
| WlnCCD | 0.6516 *** (3.20) | 0.0832 (0.33) |
| WlnDIS | 0.0033 (0.38) | 0.0015 (0.17) |
| WlnATL | −0.0439 (−0.50) | −0.1137 (−1.27) |
| WlnGOE | −0.3014 ** (−2.45) | −0.1988 (−1.58) |
| WlnAVA | −0.1618 (−1.40) | −0.1579 (−1.28) |
| WlnPES | −0.4769 *** (−2.81) | −0.5611 *** (−3.18) |
| WlnFER | 0.3753 * (1.71) | 0.3568 (1.57) |
| WlnPSTR | 0.6052 ** (2.14) | 0.8299 *** (2.70) |
| sigma2_e | 0.0098 *** (13.71) | 0.0098 *** (14.48) |
| rho | 0.3825 *** (6.37) | 0.1458 * (1.77) |
| Observation | 390 | 390 |
Notes: ***, **, and * indicate rejection of the null hypothesis at the 1%, 5%, and 10% levels, respectively. L.lnAGTFP denotes lnAGTFP with a one-period lag. WL.lnAGTFP denotes the first-order time and space lag terms of lnAGTFP. z values in parentheses (the same below).
Table 13.
Decomposition of dynamic spatial effects.
| Short-Term Effect | Long-Term Effect | ||||
|---|---|---|---|---|---|
| Direct effect | Spatial effect | Total effect | Direct effect | Spatial effect | Total effect |
| 0.8733 *** (7.12) | 0.2455 (0.81) | 1.1189 *** (3.39) | 1.009 *** (6.59) | 1.4786 ** (2.44) | 2.4880 *** (2.79) |
Notes: ***, ** indicate rejection of the null hypothesis at the 1%, 5% levels, respectively.
Disclaimer/Publisher’s Note: The statements, opinions and data contained in all publications are solely those of the individual author(s) and contributor(s) and not of MDPI and/or the editor(s). MDPI and/or the editor(s) disclaim responsibility for any injury to people or property resulting from any ideas, methods, instructions or products referred to in the content. |
© 2024 by the authors. Licensee MDPI, Basel, Switzerland. This article is an open access article distributed under the terms and conditions of the Creative Commons Attribution (CC BY) license (https://creativecommons.org/licenses/by/4.0/).
Share and Cite
MDPI and ACS Style
Zhang, H.; Guo, X. Farmland Rental Market, Outsourcing Services Market and Agricultural Green Productivity: Implications for Multiple Forms of Large-Scale Management. Land 2024, 13, 676. https://doi.org/10.3390/land13050676
AMA Style
Zhang H, Guo X. Farmland Rental Market, Outsourcing Services Market and Agricultural Green Productivity: Implications for Multiple Forms of Large-Scale Management. Land. 2024; 13(5):676. https://doi.org/10.3390/land13050676
Chicago/Turabian StyleZhang, Heng, and Xiangyu Guo. 2024. "Farmland Rental Market, Outsourcing Services Market and Agricultural Green Productivity: Implications for Multiple Forms of Large-Scale Management" Land 13, no. 5: 676. https://doi.org/10.3390/land13050676
Note that from the first issue of 2016, this journal uses article numbers instead of page numbers. See further details here.